Embed Size (px)
Citation preview
1
Polina A. Timoshina,a,b Denis A. Alexandrov,b Valery V. Tuchina,b,d,
aSaratov State University, Russia bTomsk State University, Russia
cSaratov State Medical University, Russia dInstitute of Precision Mechanics and Control, Russian Academy of Sciences, Russia
e-mail: [email protected]
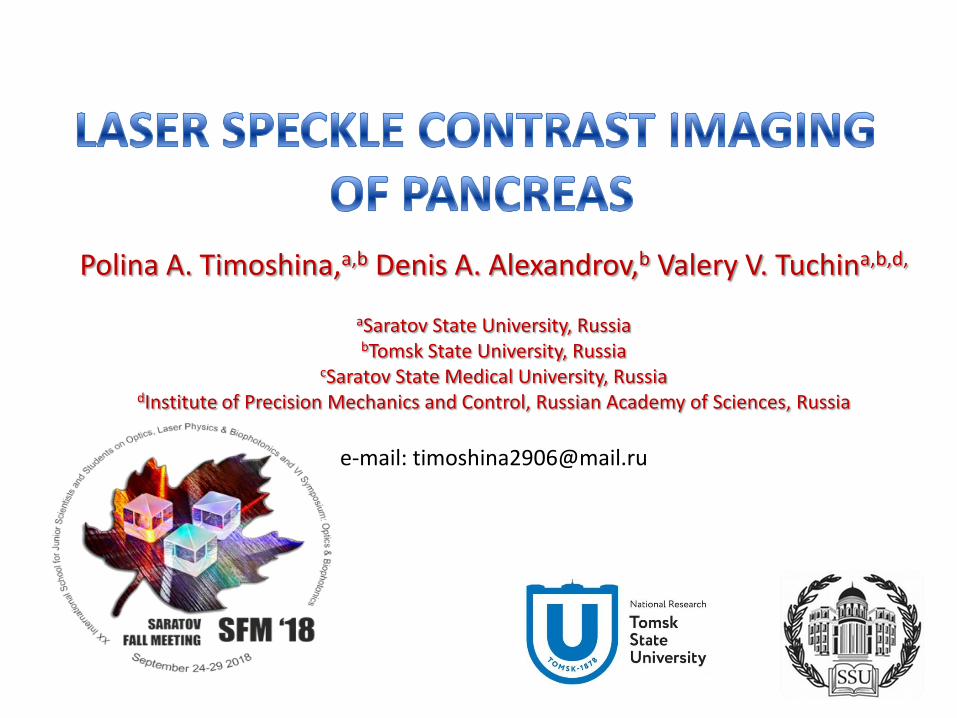
Statistics of the incidence of abdominal cavity
in the last 5 years
2
Acute pancreatitis
Gastrointestinal bleeding
Acute intestinal obstruction
Peptic ulcer
Mechanical jaundice
Acute appendicitis
Acute cholecystitis
Chronic gastritis
Hernia of anterior abdominal
wall
Ovarian cyst
3
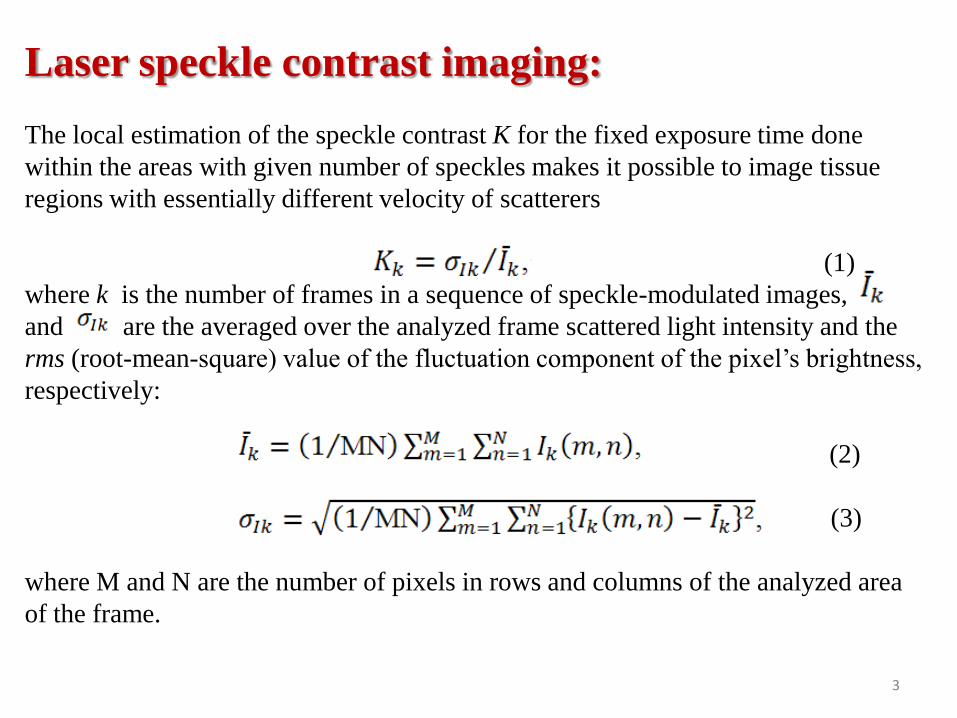
Laser speckle contrast imaging:
The local estimation of the speckle contrast K for the fixed exposure time done
within the areas with given number of speckles makes it possible to image tissue
regions with essentially different velocity of scatterers
(1)
where k is the number of frames in a sequence of speckle-modulated images,
and are the averaged over the analyzed frame scattered light intensity and the
rms (root-mean-square) value of the fluctuation component of the pixel’s brightness,
respectively:
(2)
(3)
where M and N are the number of pixels in rows and columns of the analyzed area
of the frame.
4
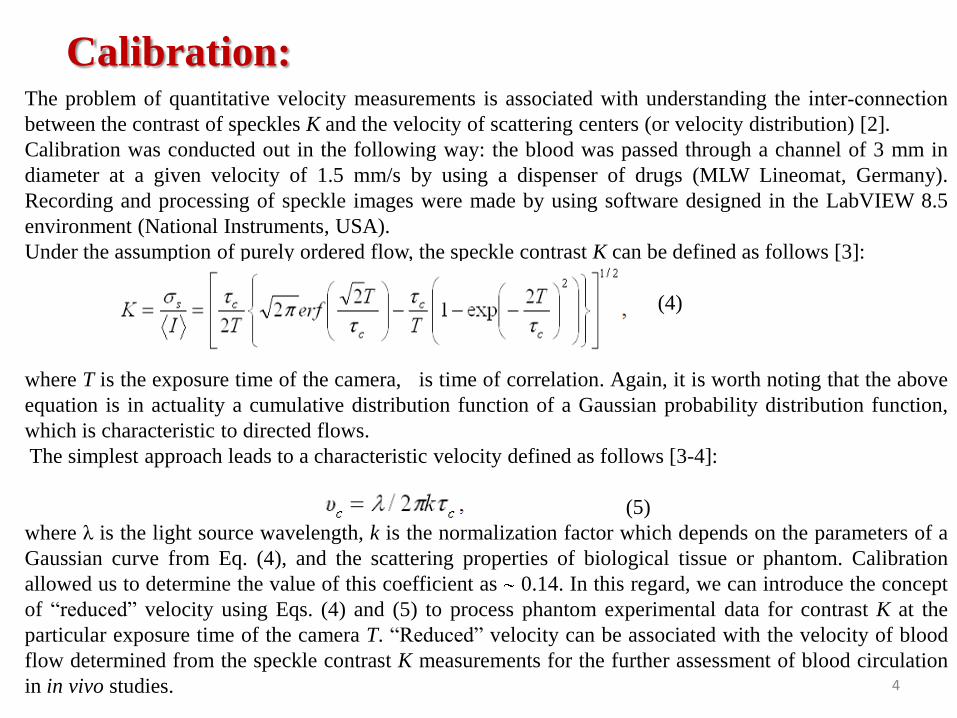
The problem of quantitative velocity measurements is associated with understanding the interconnection
between the contrast of speckles K and the velocity of scattering centers (or velocity distribution) [2].
Calibration was conducted out in the following way: the blood was passed through a channel of 3 mm in
diameter at a given velocity of 1.5 mm/s by using a dispenser of drugs (MLW Lineomat, Germany).
Recording and processing of speckle images were made by using software designed in the LabVIEW 8.5
environment (National Instruments, USA).
Under the assumption of purely ordered flow, the speckle contrast K can be defined as follows [3]:
(4)
where T is the exposure time of the camera, is time of correlation. Again, it is worth noting that the above
equation is in actuality a cumulative distribution function of a Gaussian probability distribution function,
which is characteristic to directed flows.
The simplest approach leads to a characteristic velocity defined as follows [3-4]:
(5)
where λ is the light source wavelength, k is the normalization factor which depends on the parameters of a
Gaussian curve from Eq. (4), and the scattering properties of biological tissue or phantom. Calibration
allowed us to determine the value of this coefficient as 0.14. In this regard, we can introduce the concept
of “reduced” velocity using Eqs. (4) and (5) to process phantom experimental data for contrast K at the
particular exposure time of the camera T. “Reduced” velocity can be associated with the velocity of blood
flow determined from the speckle contrast K measurements for the further assessment of blood circulation
in in vivo studies.
Calibration:
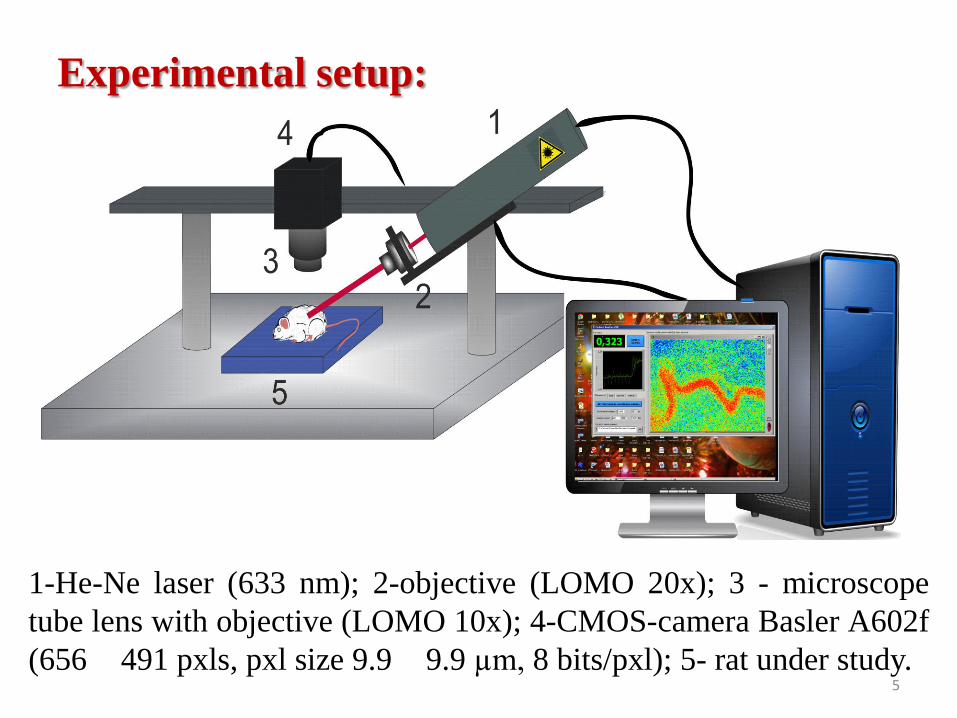
Experimental setup:
1-He-Ne laser (633 nm); 2-objective (LOMO 20x); 3 - microscope
tube lens with objective (LOMO 10x); 4-CMOS-camera Basler A602f
(656 491 pxls, pxl size 9.9 9.9 µm, 8 bits/pxl); 5- rat under study. 5
6
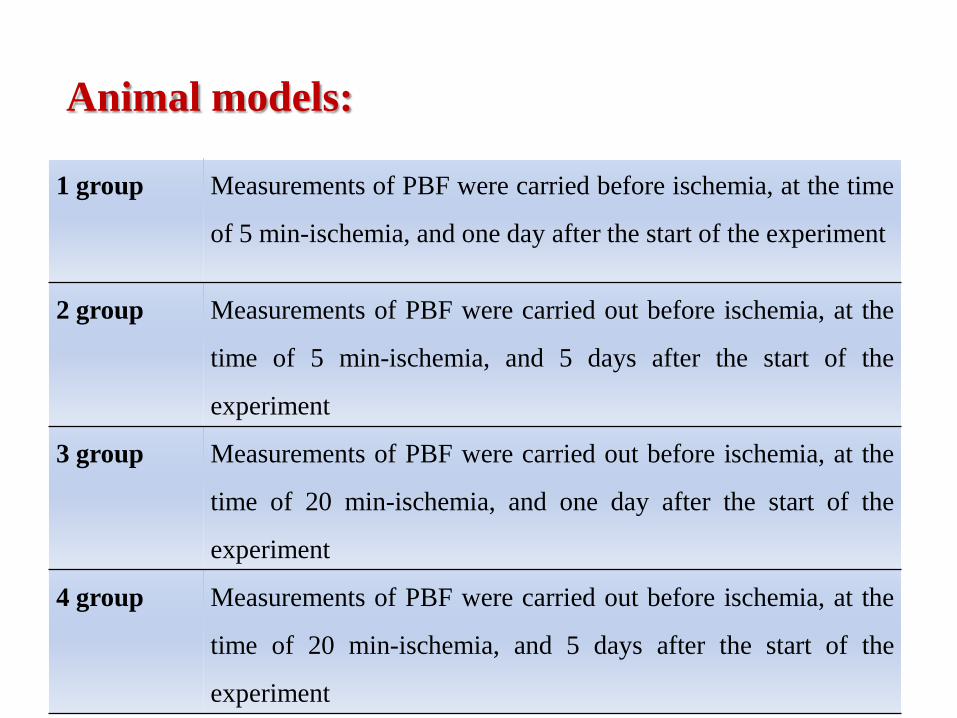
Animal models:
1 group Measurements of PBF were carried before ischemia, at the time
of 5 min-ischemia, and one day after the start of the experiment
2 group Measurements of PBF were carried out before ischemia, at the
time of 5 min-ischemia, and 5 days after the start of the
experiment
3 group Measurements of PBF were carried out before ischemia, at the
time of 20 min-ischemia, and one day after the start of the
experiment
4 group Measurements of PBF were carried out before ischemia, at the
time of 20 min-ischemia, and 5 days after the start of the
experiment
7
0.0
0.2
0.4
0.6
0.8
1.0
1.2
1.4
1.6
1.8
2.0
2.2
normal state
ischemia 5 min
reperfusion
after one day
<`>
, m
m/s
0.2
0.4
0.6
0.8
1.0
1.2
1.4
1.6
1.8
2.0
2.2
2.4
2.6
2.8
normal state
ischemia 5 min
reperfusion
after 5 days
<`>
, m
m/s
0.0
0.2
0.4
0.6
0.8
1.0
1.2
1.4
1.6
1.8
2.0
normal state
ischemia 20 min
reperfusion
after one days
<`>
, м
м/с
0.2
0.3
0.4
0.5
0.6
0.7
0.8
0.9
1.0 normal state
ischemia 20 min
reperfusion
after 5 days
<`>
, m
m/s
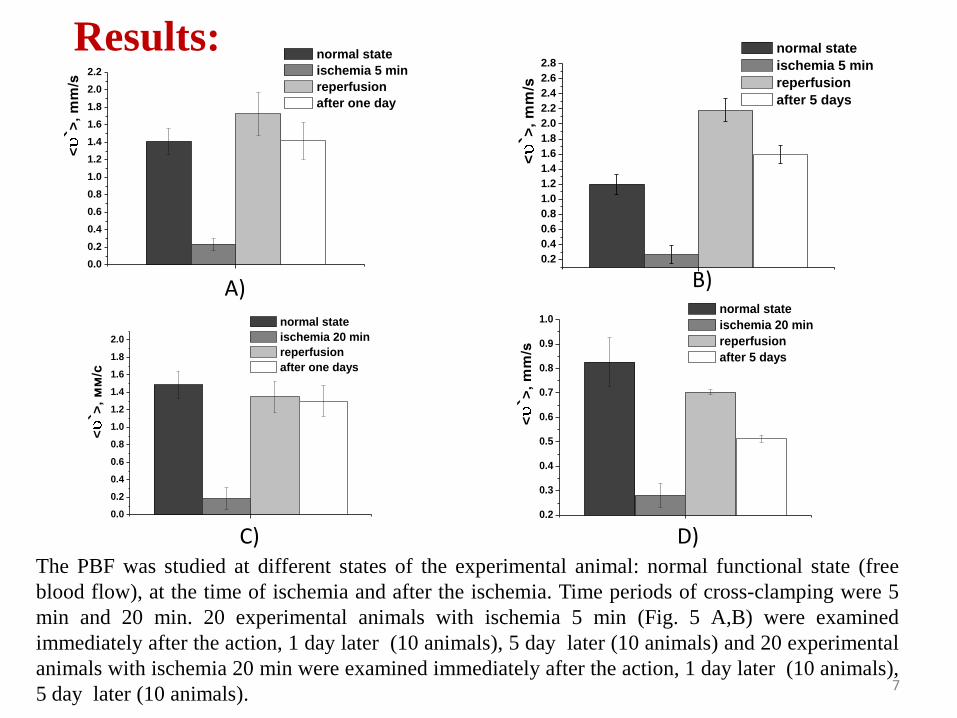
Results:
D) C)
B) A)
The PBF was studied at different states of the experimental animal: normal functional state (free
blood flow), at the time of ischemia and after the ischemia. Time periods of cross-clamping were 5
min and 20 min. 20 experimental animals with ischemia 5 min (Fig. 5 A,B) were examined
immediately after the action, 1 day later (10 animals), 5 day later (10 animals) and 20 experimental
animals with ischemia 20 min were examined immediately after the action, 1 day later (10 animals),
5 day later (10 animals).
8
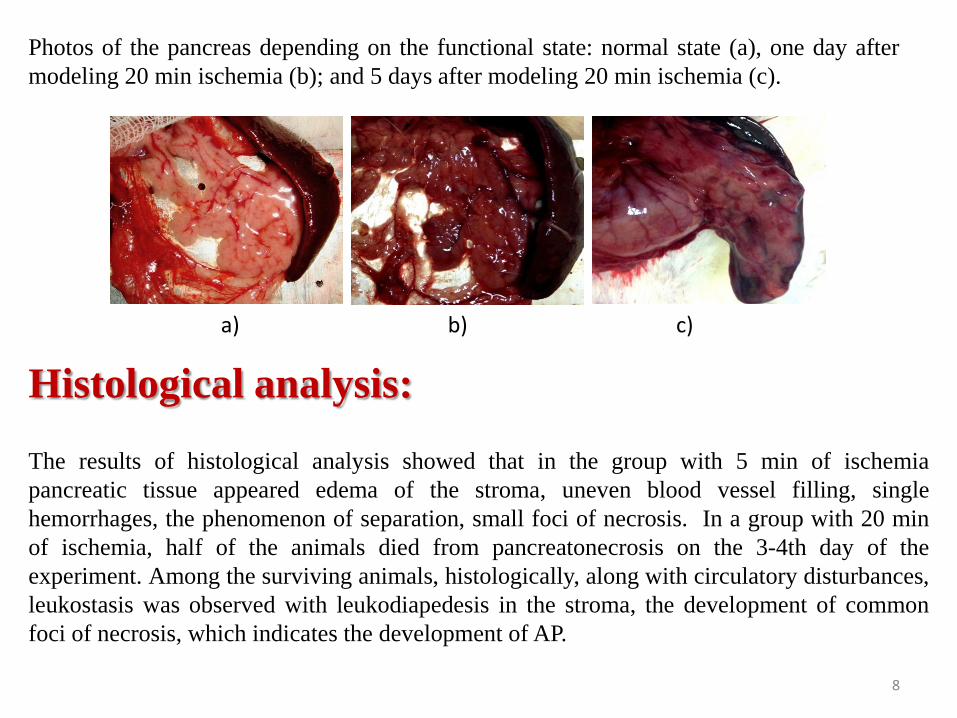
a) b) c)
Photos of the pancreas depending on the functional state: normal state (a), one day after
modeling 20 min ischemia (b); and 5 days after modeling 20 min ischemia (c).
Histological analysis: The results of histological analysis showed that in the group with 5 min of ischemia
pancreatic tissue appeared edema of the stroma, uneven blood vessel filling, single
hemorrhages, the phenomenon of separation, small foci of necrosis. In a group with 20 min
of ischemia, half of the animals died from pancreatonecrosis on the 3-4th day of the
experiment. Among the surviving animals, histologically, along with circulatory disturbances,
leukostasis was observed with leukodiapedesis in the stroma, the development of common
foci of necrosis, which indicates the development of AP.
9
Conclusion:
The results confirm that LSCI is an effective method for monitoring the
microhemodynamics of the pancreas. The method of laser speckle contrast
imaging allows to control the degree of reduction of blood flow in the vessels of
the pancreas when creating local ischemia by compression of the main vessels. In
our study was found that in the group of animals after 5 minutes of full ischemia
an increase of PBF velocity in 2-3 times, clinic of pancreatic necrosis is not
developing. After 20 minutes of full ischemia not there was a significant increase
in the rate of PBF, while in 5 days of the experiment appeared morphological and
clinical signs of pancreatic necrosis. The ability of the full-field speckle-
correlometry technique to measure blood flow velocity in a real time is prospective
feature to be used in transplantation technologies and in emergency surgery to
assess the state of internal organs by their microcirculation strength.
The research of calibration of speckle contrast imaging was supported by
the Russian Ministry of Education and Science, project #3.1586.2017/4.6 and
study of blood flow by speckle contrast imaging was supported by grant RFBR #
18-32-00587.

10


![Isospectral Alexandrov Spaces - uni-regensburg.de · The Laplacian on Alexandrov spaces was introduced in [13]: Assume that X is a compact Alexandrov space. The Sobolev space H1(X;R)](https://img.pdfslide.us/doc/110x75/60696cf786d965325d1f9f23/isospectral-alexandrov-spaces-uni-the-laplacian-on-alexandrov-spaces-was-introduced.jpg)


![[a.S Alexandrov] Theory of Superconductivity](https://img.pdfslide.us/doc/110x75/545a8082af7959755d8b5bc5/as-alexandrov-theory-of-superconductivity.jpg)