Embed Size (px)
Citation preview
Organisation for Economic Co-operation and Development
SDD/DOC(2018)7
Unclassified English - Or. English
6 November 2018
STATISTICS AND DATA DIRECTORATE
Policy use of well-being metrics: Describing countries’ experiences
SDD WORKING PAPER No. 94
Carrie Exton, OECD Statistics and Data Directorate, +33 (0)1 45 24 88 28,
[email protected] and Michal Shinwell, OECD Statistics and Data Directorate,
+33 (0)1 45 24 79 87, [email protected].
JT03438865
This document, as well as any data and map included herein, are without prejudice to the status of or sovereignty over any territory, to the
delimitation of international frontiers and boundaries and to the name of any territory, city or area.

2 │ SDD/DOC(2018)7
POLICY USE OF WELL-BEING METRICS: DESCRIBING COUNTRIES’ EXPERIENCES Unclassified
Policy use of well-being metrics: Describing countries’
experiences
Carrie Exton and Michal Shinwell,
OECD Statistics and Data Directorate1
1. The authors wish to thank Carlotta Balestra, David Marguerit, Joshua Monje-Jelfs, Katherine
Scrivens, and Elena Tosetto (OECD Statistics and Data Directorate) for preparing the case studies
presented in the Annex. The following are also gratefully acknowledged for their contributions to
the case studies in the Annex: Vincent Aussilloux, France Strategie, Prime Minister’s Office, France;
Nancy Hey, What Works for Well-being Centre, United Kingdom; Nannan Lundin, (former) Prime
Minister’s Office, Sweden; Frida Nannesson, Ministry of Finance, Sweden; Girol Karacaoglu,
Victoria University of Wellington, New Zealand; Tim Ng, Treasury, New Zealand; Renato Loiero,
Senate, Italy; Federico Giammusso, Department of the Treasury, Ministry of Economy and Finance,
Italy; Giuseppe de Michele, Economist, Ministry of Economy and Finance, Italy; Roberto Castillo
and Lorena Moreno, INEC – Instituto Nacional de Estadística y Censos, Ecuador. We also are
grateful to Marco Mira d’Ercole and Martine Durand (OECD Statistics and Data Directorate) and
Santiago Gonzalez and Piret Tõnurist (OECD Public Governance Directorate) for their comments
on a previous version of the document. An earlier adaptation of this paper was included as Chapter 8
of the Global Happiness Council’s Global Happiness Policy Report 2018, UN Sustainable
Development Solutions Network, New York.

SDD/DOC(2018)7 │ 3
POLICY USE OF WELL-BEING METRICS: DESCRIBING COUNTRIES’ EXPERIENCES Unclassified
OECD STATISTICS WORKING PAPER SERIES
The OECD Statistics Working Paper Series – managed by the OECD Statistics and Data
Directorate – is designed to make available in a timely fashion and to a wider readership
selected studies prepared by OECD staff or by outside consultants working on OECD
projects. The papers included are of a technical, methodological or statistical policy nature
and relate to statistical work relevant to the Organisation. The Working Papers are generally
available only in their original language – English or French – with a summary in the other.
OECD Working Papers should not be reported as representing the official views of the
OECD or of its member countries. The opinions expressed and arguments employed are
those of the authors.
Working Papers describe preliminary results or research in progress by the authors and are
published to stimulate discussion on a broad range of issues on which the OECD works.
Comments on Working Papers are welcomed, and may be sent to the Statistics and Data
Directorate, OECD, 2 rue André Pascal, 75775 Paris Cedex 16, France.
This document, as well as any statistical data and map included herein, are without
prejudice to the status of or sovereignty over any territory, to the delimitation of
international frontiers and boundaries and to the name of any territory, city or area.
The statistical data for Israel are supplied by and under the responsibility of the relevant
Israeli authorities. The use of such data by the OECD is without prejudice to the status of
the Golan Heights, East Jerusalem and Israeli settlements in the West Bank under the terms
of international law.
The release of this working paper has been authorised by Martine Durand, OECD Chief
Statistician and Director of the OECD Statistics and Data Directorate.
www.oecd.org/sdd/publicationsdocuments/workingpapers

4 │ SDD/DOC(2018)7
POLICY USE OF WELL-BEING METRICS: DESCRIBING COUNTRIES’ EXPERIENCES Unclassified
Abstract / Résumé
The last decade has seen major advances in the measurement of well-being in national
statistics – but what are governments doing to incorporate these metrics and frameworks
into policy decision making? This paper describes the progress made in many countries on
measuring well-being at a national level, and the mechanisms being developed to
mainstream both concepts and evidence on well-being into policy settings. In all cases,
countries are adopting a multidimensional approach to the measurement of well-being, and
several initiatives have been informed by extensive public consultation processes. For
seven countries, detailed case studies in the Annex describe the development and
implementation of policy mechanisms for integrating well-being evidence: Ecuador,
France, Italy, New Zealand, Scotland, Sweden, and the United Kingdom. The paper finds
that well-being evidence is applied at several different stages of the policy cycle, from
strategic analysis and prioritization to evaluations of policy interventions. In most cases
these initiatives are only a few years old, and institutional support will be vital for the
durability of these mechanisms over time and through different political cycles.
Keywords: Well-being metrics, measurement frameworks, policy use
JEL Classification: A13, H11, H83, I31.
********
La mesure du bien-être dans les statistiques nationales a beaucoup évolué ces dix dernières
années ; mais quelles mesures prennent les pouvoirs publics pour intégrer les cadres et les
indicateurs dans le processus de prise de décision ? Le présent rapport décrit les progrès
accomplis dans de nombreux pays dans le domaine de la mesure du bien-être au niveau
national, ainsi que les mécanismes qui sont actuellement mis en place pour intégrer dans
les cadres d’action les éléments à la fois conceptuels et tangibles sur le bien-être. Dans tous
les cas, les pays sont en train d’adopter une approche multidimensionnelle de la mesure du
bien-être, et plusieurs initiatives ont été prises sur la base de vastes processus de
consultation du public. Les sept études de cas qui figurent à l’Annexe (Écosse, Équateur,
France, Italie, Nouvelle-Zélande, Royaume-Uni et Suède) décrivent dans le détail la
conception et la mise en œuvre de mécanismes décisionnels pour prendre en compte les
données probantes sur le bien-être. Le rapport indique que les données sur le bien-être sont
appliquées à plusieurs étapes différentes du cycle d’élaboration des politiques, depuis
l’analyse stratégique et la détermination des priorités jusqu’à l’évaluation des interventions
des pouvoirs publics. Dans la plupart des cas, ces initiatives datent d’il y a seulement
quelques années, c’est pourquoi il sera essentiel d’apporter un soutien aux institutions afin
d’assurer la pérennité de ces mécanismes au fil du temps mais aussi à travers les différents
cycles politiques.
Mots clés : Mesures du bien-être, cadres d’évaluation, mise en pratique politique
Classification JEL : A13, H11, H83, I31.

SDD/DOC(2018)7 │ 5
POLICY USE OF WELL-BEING METRICS: DESCRIBING COUNTRIES’ EXPERIENCES Unclassified
Table of contents
Policy use of well-being metrics: Describing countries’ experiences ............................................... 2
1. Introduction ....................................................................................................................................... 6
2. Development of well-being metrics – Beyond GDP ........................................................................ 7
3. Using well-being metrics in policy settings .................................................................................... 16
4. Summary and conclusions .............................................................................................................. 23
Annex A. Seven case studies of well-being indicator and policy frameworks ................................ 26
References ............................................................................................................................................ 55
Tables
Table 2.1 Selected national well-being measurement initiatives and indicator sets .............................. 10 Table 3.1 Examples of mechanisms and frameworks for integrating well-being metrics into policy-
making, from selected countries .................................................................................................... 20
Table A.1. Buen Vivir dimensions and indicators at a glance ............................................................... 29 Table A.2. France’s New Wealth Indicators (Les nouveaux indicateurs de richesse) .......................... 32 Table A.3. BES indicators selected for the DEF report ......................................................................... 36 Table A.4. New Measures for Well-being (nya mått på välstånd) ........................................................ 50
Figures
Figure 2.1. The OECD conceptual framework of well-being ................................................................. 8 Figure 3.1 The Policy Cycle .................................................................................................................. 17
Figure A.1. The three core components of Buen Vivir .......................................................................... 27 Figure A.2. Stocks and flows in the Living Standard Framework ........................................................ 39 Figure A.3. The Four Capitals ............................................................................................................... 40 Figure A.4. The structure of the National Performance Framework ..................................................... 44
Boxes
Box 2.1. The OECD Better Life Initiative .............................................................................................. 7 Box 2.2. Public consultations within national measurement framework initiatives .............................. 13
Box A.1. National Outcomes in Scotland’s National Performance Framework ................................... 44
6 │ SDD/DOC(2018)7
POLICY USE OF WELL-BEING METRICS: DESCRIBING COUNTRIES’ EXPERIENCES Unclassified
1. Introduction
1. The debate on the relevance of GDP as a measure of people’s well-being is almost
as old as the measure itself; this is well illustrated by the famous quote by Robert Kennedy:
“[Gross National Product] measures everything in short, except that which makes life
worthwhile”. The limitations of GDP as a welfare measure were also recognised by its
architects, Simon Kuznets and Richard Stone (Lequiller and Blades, 2014). While GDP
growth is critical for achieving a number of important objectives, from eradicating extreme
poverty to securing adequate financing of social programmes and public investments, it
should always be recognised as a means to other ends rather than as a goal in itself.
2. In recognition of GDP’s inadequacy for capturing several critical dimensions of
people’s well-being, a strong movement has emerged to go “beyond GDP” and bring into
greater focus measures that can capture broader aspects of people’s living conditions and
of the quality of their lives. A significant body of research and statistical work has thus
been developed aiming to provide alternative or complementary metrics of human progress
(see e.g. Stiglitz et al., 2009 and OECD, 2011). Many countries’ national statistical offices
have also developed frameworks for measuring aspects of well-being, aimed at gaining a
better understanding of people’s lives at the individual, household and community level.
3. Nevertheless, measuring well-being is not an end in itself. For well-being indicators
to contribute to better lives, they must be used in shaping policy decisions taken by
government, and/or by other actors, such as civil society, business, and the general public.
Although more and more national governments have taken on the challenge of developing
well-being measures and frameworks, and these are often well-documented in reports and
websites, much less has been recorded about how, or even if, these indicators are actually
being used to inform their policy decision-making.
4. This paper describes the progress that has been made in several countries to both
measure well-being and apply those measures in national government policy settings.2 It
begins with a look into the national measurement initiatives associated with the beyond-
GDP movement, and the well-being frameworks that have been developed in different
countries. The next section examines the rationale for using well-being metrics to inform
policy, including how well-being frameworks can add value at different stages of the policy
cycle. Common themes and challenges observed in seven case studies (Ecuador, France,
Italy, New Zealand, Scotland, Sweden and the United Kingdom, detailed in the annex to
this paper) are then presented. Most of the case studies examined are relatively recent
initiatives, however, meaning that impacts are not always easily identified, and further
developments are needed. As such, there is currently no blueprint or “best practice” model
for successful implementation of well-being policy. The last section of this paper sets the
stage for future work, which will explore key questions and issues still to be addressed in
order to further advance the use of well-being measurement frameworks in policy making.
2. The issue of how well-being measures have been taken up at a local government level is discussed
in OECD (2014a), How’s Life in Your Region? Measuring Regional and Local Well-being for
Policy Making.

SDD/DOC(2018)7 │ 7
POLICY USE OF WELL-BEING METRICS: DESCRIBING COUNTRIES’ EXPERIENCES Unclassified
2. Development of well-being metrics – Beyond GDP
5. For many years, Gross Domestic Product (GDP) has been adopted as a central
yardstick by which to measure economic performance. And although it is widely
understood that GDP is a measure of economic production, rather than of people's well-
being, it is nonetheless used in several contexts as synonymous with societal progress. The
shortcomings of this are well known, yet often overlooked: GDP does not capture important
elements of living standards, such as leisure time, health, social connections or the quality
of working environment; it does not reflect inequalities, which are important for the
assessment of the well-being of any community of people; and it is blind to the effects that
changes in the scale of economic production may impose on the stock of resources that
sustain well-being over time, including natural resources.
6. The “Beyond-GDP” agenda, which calls for broader measures of societal progress,
has advanced significantly throughout the past few decades. Several noteworthy
international publications, initiatives and frameworks have been developed in recent years
(e.g. Stiglitz, Sen and Fitoussi, 2009; United Nations Department of Economic and Social
Affairs, 2015; Eurostat, 2017). The OECD has also been working to advance this agenda.
In 2011, it developed a framework on measuring well-being that both reflected and
supported the development of measurement frameworks on a national and international
level (Box 2.1). Meanwhile, the OECD’s Better Life Initiative includes regular reporting
and analysis of well-being data, as well as a variety of research and methodological
activities in support of both well-being measurement, and its application to various policy
issues (OECD, 2018).
Box 2.1. The OECD Better Life Initiative
In 2011, the OECD Statistics and Data Directorate developed a framework for measuring
well-being, shaped in consultation with member countries, and drawing upon the
recommendations of the Commission on the Measurement of Economic Performance
and Social Progress (Stiglitz, Sen and Fitoussi, 2009), as well as variety of other national
and international initiatives. This framework identifies 11 dimensions as being essential
to people's lives “here and now”, ranging from health status and education and skills, to
the quality of the local environment, personal security and subjective well-being, as well
as more material dimensions such as income and wealth, housing, etc. (see Figure 2.1).
In addition, four stocks of resources (natural, human, economic and social capital) are
highlighted as important for sustaining well-being outcomes over time.
The biennial OECD report How’s Life? presents a comprehensive set of internationally
comparable well-being indicators for OECD and partner countries. The November 2017
edition presents the latest evidence on both current well-being and resources for future
well-being, with a focus on changes since 2005. It features an in-depth examination of
well-being inequalities, describing “vertical inequalities” (i.e. the gaps between people
at the top and people at the bottom of the distribution), “horizontal inequalities” (i.e.
gaps between groups of people, including by gender, age and education level) and well-
being deprivations (i.e. the share of the population falling below a threshold value or

8 │ SDD/DOC(2018)7
POLICY USE OF WELL-BEING METRICS: DESCRIBING COUNTRIES’ EXPERIENCES Unclassified
standard of well-being). In addition, special thematic chapters examine migrants’ well-
being, and governance and well-being.
In parallel, the OECD created the “Better Life Index” (www.oecdbetterlifeindex.org) as
an accessible communication tool to engage non-technical audiences in the “Beyond
GDP” debate. The website enables visitors to explore a selection of the OECD’s well-
being indicators, and to build their own index of well-being, by rating the dimensions of
well-being that matter most to them.
Figure 2.1. The OECD conceptual framework of well-being
Source: OECD (2017a), How’s Life? 2017: Measuring Well-being, OECD Publishing, Paris,
https://doi.org/10.1787/how_life-2017-en.
7. Several national governments, in OECD countries and beyond, have also “breathed
life” into the measurement agenda by establishing frameworks and indicator sets which are
published and updated regularly. Table 2.1 provides details of selected examples of these
national-level measurement initiatives. Looking across them, some similarities can be
observed:
SDD/DOC(2018)7 │ 9
POLICY USE OF WELL-BEING METRICS: DESCRIBING COUNTRIES’ EXPERIENCES Unclassified
Most of these frameworks have been developed within the past decade, although
there are some frameworks that date as far back as 1974 (e.g. the Netherlands’ Life
Situation Index).
All of the frameworks have taken a multi-dimensional approach, typically
combining data about people’s economic circumstances and material living
conditions with indicators that consider a wide range of quality of life factors.
While the indicators underpinning these frameworks are often derived from
objective sources, household surveys are also an important data source, and most
initiatives also feature measures of subjective well-being (for example, considering
people’s satisfaction with life).
Consulting with wide audiences was part of the process for designing the overall
measurement approach. This has been done with varying levels of intensity, scale
and goals, and related either to the indicators or to the dimensions covered by the
framework. Box 2.2 describes some of the public consultations which were held as
part of the process of creating these frameworks.
8. By contrast, one notable difference in national initiatives concerns the lead agency
driving the work. In some countries, the frameworks were developed or initially
commissioned by either Centre-of-Government3 (e.g. the Prime Minister’s office in Israel,
Sweden and Finland; the Federal Chancellery in Germany), or other ministries such as the
Ministry of Finance and the Ministry of Planning (e.g. Italy, France, Ecuador), with the
clear intention to apply the resultant well-being metrics in policy settings. In other cases,
the initiative has been led by the National Statistical Office or similar agency (e.g. Austria,
the Netherlands), thereby distancing the measurement work from the ministries in which
policy decisions are taken.
3. “Centre of Government” (CoG) refers to the organisations and units that serve the chief executive
(president or prime minister, and the cabinet collectively) and perform certain cross cutting functions
(strategic management, policy co-ordination, monitoring and improving performance, managing the
politics of policies, and communications and accountability). The CoG includes a great variety of
units across countries, such as general secretariat, cabinet office, office/ministry of the presidency,
council of ministers office, etc. See OECD, 2017b.

10 │ SDD/DOC(2018)7
POLICY USE OF WELL-BEING METRICS: DESCRIBING COUNTRIES’ EXPERIENCES Unclassified
Table 2.1 Selected national well-being measurement initiatives and indicator sets
Country Measurement
initiative/ indicator set
Leading agency Short description and link for further information
Australia Measure of
Australia’s Progress (MAP)
Australian Bureau of Statistics (ABS)
The ABS has been publishing a report of 26 indicators in four dimensions (Society, Economy, Environment, Governance) measuring progress in Australia since 2002. The latest publication of the report was in 2013.
www.abs.gov.au/ausstats/[email protected]/mf/1370.0.
Austria How’s Austria Statistics Austria
Statistics Austria publishes an annual report, since 2012, on 30 key indicators categorized into three dimensions: material wealth, quality of life and environmental sustainability. An interactive tool allowing exploration of historical trends and comparison across indicators was also developed.
www.statistik.at/web_en/statistics/------/hows_austria/index.html
Belgium Complementary
indicators to GDP
Federal Planning Bureau, within the framework of the
National Accounts Institute
In 2014, a Law adopted stipulated that an annual report will be published by the National Accounts Institute (Institut des comptes nationaux) on Complementary Indicators to GDP, aimed at measuring people’s wellbeing and societal development at the federal level. The report has been published in 2016 and 2017, and details trends for 67 indicators grouped in 13 themes and covering three conceptual dimensions: current generation (here and now), future generation (later) and other countries (somewhere else).
www.indicators.be/en/t/BGD/Complementary_indicators_to_GDP
Ecuador Buen Vivir INEC (Ecuador Statistics Office)
In support of wider work on Buen Vivir (see Table 3.1, below), the Ecuador Statistics Office (INEC) compiled a set of indicators to monitor progress according to the Buen Vivir concept (see case study, in Appendix).
Finland Findicator Statistics Finland
and the Prime Minister's Office
Launched in 2009 by Finland’s Prime Minister's Office and Statistics Finland, the Findicator (Findikaattori) is an online compendium of over 100 indicators on social progress, with a specific category on Well-being indicators. The Well-being indicators include 23 indicators across eight dimensions.
www.findikaattori.fi/en/hyvinvointi
Germany
Gut Leben in
Deutschland
Federal
Chancellery
The German federal government has launched the “Wellbeing in Germany – what
matters to us” initiative as a commitment to the December 2013 coalition agreement,
which stated that “We wish to align our policies more closely with the values and
hopes of German citizens and we will therefore conduct a dialogue with them in
order to gain an understanding of their views on wellbeing issues…”. Following a
national consultation process and the findings of other national and international
research projects and discussions, 12 dimensions and 46 indicators were in order
to describe and measure the current status and trends in wellbeing in Germany. The
indicators will be updated on a regular basis.
www.gut-leben-in-deutschland.de/static/LB/en
Italy
Measures of
equitable and
sustainable well-
being
National Council
for the Economy
and Labour
(CNEL) and
National Institute of
Statistics (ISTAT)
The “Equitable and Sustainable Well-Being” (“Benessere Equo e Sostenibile” –
BES) project led to the creation of a well-being framework, following the
recommendation of a committee convened by the Italian Prime Minister, which is
monitored through a set of indicators and an annual report by ISTAT. A law approved
in 2016 stipulated that a narrower framework be developed for reporting to
parliament in the context of budgetary discussions (see Table 3.1, and case study
below).
www.cbs.gov.il/statistical/stat151_eng.pdf

SDD/DOC(2018)7 │ 11
POLICY USE OF WELL-BEING METRICS: DESCRIBING COUNTRIES’ EXPERIENCES Unclassified
Country Measurement
initiative/ indicator set
Leading agency Short description and link for further information
Israel
Well-being,
Sustainability and
National Resilience
Indicators
Central Bureau of
Statistics
In April 2015, the government adopted a resolution requesting the Central Bureau
of Statistics to publish a set of well-being, sustainability, and national resilience
indicators, following a two-year process of selecting indicators led by the Prime
Minister’s Office, together with the Ministry of Environmental Protection, on the basis
of a government resolution approved in December 2012. The 2015 resolution
approved indicators in the following domains: quality of employment; personal
security; health; housing and infrastructure; education; higher education and skills;
personal and social well-being; environment; civic engagement and governance;
and material standard of living. In addition, the resolution required the development
of two additional domains: information technology; and leisure, culture, and
community. For each domain 8 indicators were selected.
https://beta.cbs.gov.il/en/mediarelease/Pages/2016/Israeli-Indicators-Of-Well-Being-Sustainability-And-Resilience-2013-2014.aspx
Japan
Commission on
Measuring Well-
Being
Commissioned by
government, ad
hoc
In 2010, a Commission on Measuring Well-Being was established by the national
government's Cabinet Office, with the participation of experts. Its stated aim was to
promote research and studies on new growth and well-being, as well as to develop
and improve statistics on related indicators, as a part of a "New Growth Strategy"
adopted by the government. The discussions of this Commission were published in
the December 2011 report "Measuring National Well-Being -- Proposed Well-being
Indicators." The framework is based on three domains; socio-economic conditions,
health and relatedness, and each domain contain both subjective and objective
indicators. www5.cao.go.jp/keizai2/koufukudo/pdf/koufukudosian_english.pdf
www.japanfs.org/en/news/archives/news_id032635.html
Luxembourg
Well-being GDP/
Luxembourg Index of
Well-being
Statec (the
National Statistics
and Economic
Studies Institute),
the Economic and
Social Council, and
the Higher Council
for Sustainable
Development
The Luxembourg Index of Well-Being (“PIBien-être”) was developed through a
collaboration between the National Statistics and Economic Studies Institute
(Statec), the Economic and Social Council, and the Higher Council for Sustainable
Development. It reports on 63 indicators, grouped under 11 domains of life, which
closely correspond to the domains of the OECD framework for measuring well-
being. In an additional step, these indicators are also summarised through a
synthetic index. This is intended to provide a “compass” to guide users through the
data, and is used in the 2017 report to evaluate trends in overall well-being, as well
as trends in specific domains, since 2009.
http://luxembourg.public.lu/fr/actualites/2017/11/15-well-being/index.html
Netherlands Monitor of Well-Being Central Bureau of
Statistics
In 2017, The Dutch Cabinet commissioned Statistics Netherlands (CBS) to compile
an annual Monitor of well-being, with the aim that it will serve as the instrument to
facilitate the public and political debate on well-being. The policy assessment
agencies – the Netherlands Bureau for Economic Policy Analysis (CPB), the
Netherlands Environmental Assessment Agency (PBL) and the Netherlands
Institute for Social Research (SCP) – will also contribute to the Monitor. In addition
they will conduct a periodic exploration of well-being based on the monitor. The
monitor will be based on the Sustainability monitor, which has been published since
2011 and reports on progress in three themes: The set of indicators consists of three
individual dashboards: quality of life here and now; resources for the future and the
impact on other countries, and a total of nine dimensions. http://download.cbs.nl/pdf/2015-a324-pub.pdf;
www.cbs.nl/en-gb/news/2017/07/cbs-to-compile-a-monitor-of-well-being

12 │ SDD/DOC(2018)7
POLICY USE OF WELL-BEING METRICS: DESCRIBING COUNTRIES’ EXPERIENCES Unclassified
Country Measurement
initiative/ indicator set
Leading agency Short description and link for further information
Scotland
Scotland Performs/
the National
Performance
Framework
Scottish
Government
(particularly the
office of the Chief
Statistician and
Chief Economist)
The Scottish government’s National Performance Framework was first published as
part of the 2007 Spending Review, providing a 10 year vision for Scotland which
uses an outcomes-based approach to measuring government’s achievements
measuring national and societal well-being, rather than inputs and outputs. It
features 5 strategic objectives, 16 national outcomes, and 55 national indicators.
The National Performance Framework forms the basis of performance agreements
with public service delivery bodies, and is used to monitoring their
effectiveness. www.gov.scot/About/Performance/scotPerforms
Please note: In June 2018 the Scottish Government launched a new and revised
version of the National Performance Framework
(http://nationalperformance.gov.scot/). References in this paper are to the previous
edition of the framework, as it stood in February 2018.
Slovenia Indicators of Well-
Being in Slovenia
Institute of
Macroeconomic
Analysis and
Development
(IMAD), Statistics
Slovenia (SURS),
the Slovenian
Environment
Agency (ARSO),
National Institute of
Public Health
(NIJZ)
Indicators of Well-being have been developed as part of the National Development
Strategy launched by the Slovenian government in 2015 to establish a common
vision of Slovenia’s future to 2050. The indicator set is implemented by a consortium
of four institutions: the Institute of Macroeconomic Analysis and Development
(IMAD), the Statistical Office of the Republic of Slovenia (SURS), the Slovenian
Environment Agency (ARSO) and the National Institute of Public Health (NIJZ). The
indicators are presented in three categories: Material, Social and Environmental
well-being. The indicators are updated once a year, and data is presented from
1996. www.kazalniki-blaginje.gov.si/en/wb-slo.html
United
Kingdom
Measuring National
Wellbeing (MNW)
programme
The UK Office for
National Statistics
The MNW started in 2010. Its aim was to monitor and report “how the UK as a whole
is doing” through measures of well-being. A progress report is published biannually
covering areas including health, natural environment, personal finances and crime.
The measures include objective and subjective data.
www.ons.gov.uk/peoplepopulationandcommunity/wellbeing
Wales Well-being of Wales
Welsh
Government’s
Chief Statistician
The Well-being of Future Generations (Wales) Act, approved by the National
Assembly for Wales in 2015, is aimed at incorporating social, economic,
environmental and cultural well-being into the considerations of public bodies in
Wales. As part of this, the act puts in place seven well-being goals for a prosperous,
healthier, resilient, more equal and globally responsible Wales, with cohesive
communities and a vibrant culture and thriving Welsh language. The act mandates
a report updating on progress towards the achievement of the 7 well-being goals.
Through a consultative process, 46 indicators were selected to monitor progress on
well-being.
https://gov.wales/statistics-and-research/well-being-wales/?lang=en

SDD/DOC(2018)7 │ 13
POLICY USE OF WELL-BEING METRICS: DESCRIBING COUNTRIES’ EXPERIENCES Unclassified
Box 2.2. Public consultations within national measurement framework initiatives
Several countries have undertaken public consultations1 as part of the process of
developing well-being measurement frameworks. According to the 2017 OECD
Recommendation on Open Government, consultations would ideally take place at all
stages of the policy cycle. These consultations were part of the design of national
measurement frameworks, and as such, have been held at different stages of the process
of establishing the well-being framework. The inputs from the consultations have been
used to shape the frameworks in different ways. Public consultations require time and
resources, and can considerably extend the time needed to complete a process of
selecting indicators, but can also contribute meaningful insight into what matters most
to people.
Consultations can have several advantages: they can be used to ensure the measurement
approach and selected indicators resonate with the public, and have the legitimacy that
comes from meaningful engagement with a wide range of stakeholders; they offer a
visible way to demonstrate commitment to people’s well-being through exploring what
is important for the public to know and measure; and they can raise awareness among
the public and foster broad acceptance of the measurement framework and recognition
of its potential usefulness.
International examples of consultations on well-being include:
In Italy, as part of the process launched by the Italian statistical office (ISTAT)
of establishing the BES framework (BES – benessere equo e sostenibile –
“equitable and sustainable well-being”), a steering group was established on the
“Measurement of Progress in Italian Society”, including 33 representatives of
entrepreneurs, professional associations, trade unions, environmental groups,
Italian cultural heritage groups, women groups, consumer protection groups and
civil society networks. In addition, a Scientific Commission with 80 researchers
and experts from ISTAT (Italian Statistical Office), universities and other
institutions was also established to consult on this process. Moreover, a
representative survey of the Italian population was conducted (about 45 000
people interviewed), inquiring which dimensions are important for well-being.
This was further supported by a dedicated website, a blog and an online survey
to consult with the public on the committee’s decisions (approximately 2 500
respondents). Finally, after the presentation of the first report, the initiative was
presented in a series of meeting in different regions of Italy. Since then, ISTAT
publishes an annual publication on BES indicators, including composite
measures for the different thematic domains.
The New Zealand Treasury conducted targeted workshops in the development
of its Living Standards Framework. In the first round of consultation, held in
2009, workshops were held with government, business, academia and
community groups to get feedback on the proposed framework, the
communication of the framework and what topics or themes were important,
with some 200 participants. Additionally, an advisory group was set up to consult
on the framework, and the group included representatives both from government
and outside it.2

14 │ SDD/DOC(2018)7
POLICY USE OF WELL-BEING METRICS: DESCRIBING COUNTRIES’ EXPERIENCES Unclassified
Germany initiated a “national dialogue” on the main issues that are important
for quality of life in 2015, which took place over a period of six months.3 This
process was aimed at identifying the measures that can be used to describe
quality of life, through identifying what is important to people. The dialogue
consisted of several forms of public consultation: meetings, online surveys and
feedback postcards. About 200 meetings were held throughout the country with
over 8 000 participants. The Chancellor, members of government, and Cabinet
ministers participated in fifty of these meetings. Civil society, representative
organisations, business associations and trade unions also supported the
dialogue. Over 7 000 people responded through the online survey and the
postcards. The outcomes of the dialogue were incorporated, together with
international comparison and research projects, into a framework with twelve
dimensions and 46 indicators, which will be updated on a regular basis.
In the United Kingdom, the consultation process formed the beginning of the
“Measuring National Well-being” programme in November 2010, with a six
month National Debate. This consultation asked people “what matters?” in order
to understand what should be included in measures of national well-being. The
National Debate was carried out by the Office of National Statistics (ONS) and
included 175 events which were held around the UK, involving around
7 250 people and received more than 34 000 responses, as well as responses from
organisations representing many more people. Meetings were also held with
citizens, hard to reach groups, organisations, charities, various experts, the
National Statistician's Advisory Forum and a Technical Advisory Group (ONS,
2011). Following the National Debate, the UK ONS has taken formal public
consultation on several other well-being measurement issues, including
proposals of domains and headline measures of national well-being, as well as
on measures of human and natural capital.
In Israel, the process for selecting indicators to monitor “Well-being,
Sustainability and Resilience” included a public consultation process held
alongside the work of expert groups on each of nine domains covered in the
framework. Following the consultation, two additional domains were added to
the Israeli framework. The consultation consisted of two elements – an online
survey, which garnered responses from approximately 1 600 respondents, and
workshops with populations that have less access to the internet, which included
some 400 participants. The responses from the two elements were analysed
together and a mapping was derived highlighting the dimensions that are
important for quality of life, according to respondents. In addition, expert groups,
comprising representatives of government, private sector, civil society, labour
unions, academia and other organisations, were set up for each domain.
In France, following the enactment of the law on “New Wealth Indicators”, the
process of selecting indicators involved a two-fold process of consultation. The
first part saw the establishment of a working group of over 60 people, comprising
researchers, representatives of civil society, international organisations and
experts. The working group established an initial list of themes and indicators.
The second part of the process was a wider public consultation, intended to assess
the adequacy of the indicators and prioritizing the themes and indicators in order
to narrow down the final set. Three types of consultations were held: an online

SDD/DOC(2018)7 │ 15
POLICY USE OF WELL-BEING METRICS: DESCRIBING COUNTRIES’ EXPERIENCES Unclassified
survey, where over 4 000 respondents taking part were asked to order the themes
according to their importance; a telephone survey with a representative sampling
of the total population, where respondents were asked to rank the themes and
indicators; and four focus groups were set up with ten participants in each, where
the approach, themes and indicators selected were debated.
1. According to the OECD recommendation on Open Government, consultation is defined as: “Consultation:
a more advanced level of participation that entails a two-way relationship in which stakeholders provide
feedback to the government and vice-versa. It is based on the prior definition of the issue for which views
are being sought and requires the provision of relevant information, in addition to feedback on the outcomes
of the process”. See: https://legalinstruments.oecd.org/en/instruments/OECD-LEGAL-0438.
2. www.stats.govt.nz/browse_for_stats/environment/environmental-economic-accounts/public-
sustainable-development-workshop-summary.aspx.
3. https://buergerdialog.gut-leben-in-deutschland.de/DE/Home/home_node.html.
16 │ SDD/DOC(2018)7
POLICY USE OF WELL-BEING METRICS: DESCRIBING COUNTRIES’ EXPERIENCES Unclassified
3. Using well-being metrics in policy settings
9. The development of well-being measurement initiatives and indicator sets is an
important step in building the evidence base and developing a shared understanding of what
makes for better lives. Nevertheless, supplying a breadth of information on the lives of
people does not in itself fulfil the ambition to improve policy and decision making.
Although the assembling, regular measurement and publication of data on people’s well-
being is a prerequisite, and can in itself influence policy, there is also the risk that newly
developed indicators may become “just another report” rather than leading to a substantial
change in the setting and framing of policy. So how can governments use these indicators
to make better policies for better lives?
3.1. The policy cycle, and stages at which indicators and evidence can be used
10. There is a wide range of ways in which indicators and evidence, in broad terms,
can shape policy: from influencing public debate on strategic priorities and emergent
issues, through to use in studies commissioned by government agencies to evaluate the
impact of specific policy programmes. One way to characterise the various opportunities
for metrics to influence policy decisions is to consider the different stages of the policy
cycle (Figure 3.1). Based on various policy cycles described in the literature (e.g. Jann et
al., 2006; Cairney, 2013), we can distinguish the following stages:
1. Priority/Agenda setting. Based on a strategic analysis of the current situation,
including trends over time, and inequalities, a strategic review of policy goals may
lead to identifying areas which require government intervention, followed by
prioritisation and agenda setting. This stage typically involves national
governments, national planning agencies and/or parliaments.
2. Policy formulation (ex ante). This stage includes the investigation of policy options,
the evaluation of their costs, benefits and feasibility, and finally the selection of
relevant policy instruments and levers. This stage usually involves the national
planning agency, government agencies responsible for designing and delivering the
policy interventions, allocation of financial resources among government agencies
(e.g. by Treasury or the Finance Ministry), and government or parliament decisions
on budgeting.
3. Implementation. This phase involves executing programmes and policy
interventions by government agencies and other public service delivery bodies,
which are responsible for the implementation and are provided with the necessary
resources, in accordance with prioritisation and policy formulation.
4. Monitoring. A prerequisite for evaluating policy impacts is that the policy
interventions are monitored, both during and after implementation. Monitoring
involves taking stock of the inputs used for the policy intervention, the outputs
generated and the outcomes observed; a comprehensive evaluation can also benefit
from monitoring the counterfactual of the policy intervention, i.e. to establish a
baseline to compare the policy intervention to. At this stage, both the national
planning agency, the government agency implementing the policy as well as
external stakeholders may be involved to monitor the impacts of policy
interventions.

SDD/DOC(2018)7 │ 17
POLICY USE OF WELL-BEING METRICS: DESCRIBING COUNTRIES’ EXPERIENCES Unclassified
5. Evaluation (ex post). This stage requires assessing the results of the policy
intervention in view of their goals, deciding on either termination, reformulation or
continuation. This stage of policy making can involve the relevant line ministry,
the national planning agency, Treasury or Finance Ministry, and the various
potential stakeholders as well as central auditors’ offices.
Figure 3.1 The Policy Cycle
3.2. What is different about a well-being or “beyond GDP” approach?
11. Many well-being indicators already have a well-established role in policy and are
used throughout the policy cycle. Jobs and earnings, educational attainment, housing
affordability, and health outcomes, for example, are often monitored closely by ministries
with relevant responsibilities in these areas. So how and why is it different when policy is
approached through a well-being lens? How might policy-making be different – and better?
Some of the potential value-added of considering well-being indicators in a policy context
include:
Providing a more complete and coherent picture – and in particular drawing
attention to outcomes that matter to people’s living conditions and quality of life,
but that are often not currently considered in routine policy analysis.
Supporting the strategic alignment of outcomes across government.
Throughout the policy cycle, cooperation and cohesion across government is
essential. Government agencies often operate in silos, focusing on the resources
and outputs for which they are directly accountable and without reference to the
wider impacts of their actions, and are predisposed to focusing on the outcomes for
which they are directly responsible. For example, crime and justice agencies tend
to focus on the direct impacts of their actions in reducing crime and enforcing safety
measures when setting priorities, despite the fact that spill-overs from other policy
areas and society-wide patterns on personal safety outcomes are large. Policy spill-
overs also operate in the other direction, with the personal safety as a major
determinant of outcomes in other policy areas. Personal security, for example, is a
Agenda setting (identify policy
goals)
Policy formulation (ex-ante)
ImplementationMonitoring
Evaluation
(ex-post)
18 │ SDD/DOC(2018)7
POLICY USE OF WELL-BEING METRICS: DESCRIBING COUNTRIES’ EXPERIENCES Unclassified
driver of education outcomes, health and social connections. Similar spill-overs
occur in nearly all policy areas. By framing an explicit range of outcomes to be
considered, frameworks for measuring people’s well-being can promote
consistency and coherence across government and provide a common language for
agencies to discuss these consequences. Additionally, the integration of well-being
frameworks can potentially generate interactions between government agencies and
therefore enhance dialogue and cooperation. It can also assist in clarifying
responsibilities across and within different levels of government and different
groups of stakeholders, increasing co-ordination among policies.
Highlighting inequalities and the diversity of experience through providing
data at the granular, people-centred level. In contrast to many aggregate
measures, which focus on the performance of economic systems as a whole, a focus
on people and outcomes at the individual and household level enables the
production and analysis of statistics allowing to identify inequalities, pockets of
deprivation and vulnerability, and/or groups among whom outcomes are diverging
over time.
Considering both well-being outcomes today and resources for tomorrow. A
key critique of GDP is that it fails to take sustainability into account – both in terms
of whether economic growth is itself sustainable over time, but also whether that
growth is being achieved in a sustainable way – i.e. without environmental and
social costs that offset the overall societal benefits of growth, and could undermine
the stability of that growth in future. The broad-based economic, environmental and
social coverage of well-being measures is therefore a key advantage. In addition,
many approaches to measuring well-being include forward-looking components,
such as indicators covering the natural, human and economic capital stocks that
will support future well-being. This balances out the focus on “here and now” when
thinking about the progress of societies, and also enables governments to examine
whether progress on well-being today is being achieved at the expense of depleting
stocks of resources for future generations.
Promoting evaluation of the impact of policy programmes on people’s lives. If
different government departments could be encouraged to consider a wider range
of well-being outcomes and impacts, this has the potential to help make policy
trade-offs and spill-overs more explicit and more clearly articulated. Efficient and
effective governance is supported by strong accountability, as well as the possibility
for feedback loops, policy adaptation and refinement. These also provide rationale
for the evaluation of policy interventions ex post, and are an important input into
strategic priority setting. Well-being frameworks can form the basis for the
accountability procedures and feedback for government agencies. In defining the
set of desired outcomes expected from policy interventions through a range of
indicators relating to people’s well-being, ex post policy evaluation can lead to
higher accountability on a wider range of outcomes than previously considered.
The agreement around the dimensions and indicators that reflect people’s well-
being can also streamline external accountability measures, such as parliamentary
oversight, audit agencies and civil society, by creating a common language and a
consensus on measured outcomes.
Fostering public debate. This allows a discussion which is based on an underlying
common concept of what makes for a good life, between all stakeholders, from
politicians, civil society, businesses and policy makers. For example, public

SDD/DOC(2018)7 │ 19
POLICY USE OF WELL-BEING METRICS: DESCRIBING COUNTRIES’ EXPERIENCES Unclassified
engagement and consultations (e.g. Box 2.2) can provide a space for the public to
comment and relate to the set of indicators or dimensions being proposed,
encourage shared ownership of indicators, and stimulate debate about what matters
most for well-being.
3.3. Mechanisms for integrating well-being indicators in policy decision-making
12. Routine reporting of well-being statistics can, in itself, help to highlight issues and
inform policy decisions in the agenda-setting phase of the policy cycle, without recourse to
special policy tools or levers. For example, simply making data on well-being levels,
inequalities and trends available to a wide range of stakeholders (e.g. civil society,
politicians, business and the media) can shift opinion, inform debate, and influence policy
priority-setting.
13. Nevertheless, to unleash some of the potential benefits of well-being metrics
outlined in the previous section, it is necessary to go beyond simply making indicators
available to wide audiences. For example, integrating well-being metrics in the stages of
policy formulation and evaluation requires a conscious decision on the part of those
performing or commissioning this research and analysis, as well as a demand (from
decision-makers) for an evidence base on which to draw, and an established set of tools
and techniques recognized across the analyst profession within governments (such as the
methods set out in the United Kingdom Treasury’s Green Book: Appraisal and Evaluation
in Central Government, HM Treasury, 2011).
14. Several OECD countries have therefore developed more formal and/or structured
mechanisms to ensure that well-being or “beyond GDP” indicators are integrated into their
policy processes. These can target specific aspects of the policy cycle, or encompass several
steps. Table 3.1 provides an overview of ten countries which have developed such
mechanisms, the leading agency, and the stage(s) of the policy cycle in which the
mechanism largely integrated. For seven of the ten countries reviewed in Table 3.1, detailed
case studies are presented in the Annex. It should be noted, that the countries selected for
the case studies were chosen according to availability of information and relevance to the
issue at hand.
15. The case studies presented in the Annex to this paper provide more detail and
context on seven of these initiatives. The countries presented as case studies are Ecuador,
France, Italy, New Zealand, Scotland, Sweden and the United Kingdom. For each case
study the settings in which the policy mechanisms and frameworks were developed are
described. From the case studies, it is possible to identify some common themes,
differences and challenges that arise when implementing well-being frameworks into
policy settings through various mechanisms. A short discussion of these follows.

20 │ SDD/DOC(2018)7
POLICY USE OF WELL-BEING METRICS: DESCRIBING COUNTRIES’ EXPERIENCES Unclassified
Table 3.1 Examples of mechanisms and frameworks for integrating well-being metrics into
policy-making, from selected countries
Country Mechanism Leading
entity
Short description Stage(s) of the
policy cycle
targeted
Australia Well-being framework
Treasury
A well-being framework developed in 2004 by the Treasury in order to underpin analysis and advice across the Treasury’s policy responsibilities. The framework consists of five elements of well-being: the level of consumption possibilities, their distribution, the degree of risk borne by individuals and society, the degree of complexity we face in our choices, and the level of freedom and opportunity we enjoy. In 2016 the Treasury Secretary moved away from the Living Standards framework and undertook a new, focusing on the budget, productivity and globalisation.1
Policy formulation, policy evaluation
Ecuador
1. Constitution
2. National Development Plan
3. Buen Vivir Secretariat
Buen Vivir Secretariat under the
Presidency
The concept of Buen Vivir was integrated into the Ecuadorian constitution in 2008, and in June 2013 then-President Rafael Correa created the “Buen Vivir Secretariat”, a new Ministry within the national government. A key mechanism is the National Development Plans, which lay out the national strategy for Buen Vivir every four years.
Agenda-setting, policy formulation, policy evaluation
France
Budget law, drawing on
New Indicators of Wealth
France Strategy and
the Economic, Social and
Environmental Council (EESC)
In April 2015, the French Parliament passed law 411, which requires the Government to submit an annual report to Parliament on progress against 10 new leading indicators that reflect the country’s economic, social and environmental situation. In addition, the report aims to include an impact assessment of the main reforms envisaged in light of these indicators. If the government requests, the report can also be debated in Parliament.
Agenda-setting, policy formulation; policy evaluation
Italy
Budget law, drawing on
Measures of equitable and sustainable well-being
Ministry of Economics
and Finance
Building on ISTAT’s “Measures of equitable and sustainable well-being”, a law approved in 2016 stipulated that a narrow subset (12) of these indicators should be annually reported to Parliament in the context of budgetary discussions.
Agenda-setting, policy formulation
and evaluation
Netherlands “Accountability
Day” Netherlands
Cabinet
In February 2017, the Dutch Cabinet commissioned Statistics Netherlands to compile an annual Monitor of well-being (see Table 2.1, above). The Monitor will form the basis of Cabinet considerations on the state of well-being in the Netherlands. These Cabinet’s considerations will subsequently be part of the accountability debate in the House of Representatives, which takes place annually on the third Wednesday in May.
In addition, the policy assessment agencies in the Netherlands (the Netherlands Bureau for Economic Policy Analysis, the Netherlands Environmental Assessment Agency, and the Netherlands Institute for Social Research) will contribute to the Monitor and “conduct a periodic exploration of well-being”, based on the Monitor”.
Agenda-setting
New
Zealand
Living Standards Framework
Treasury
The Treasury Living Standards Framework was developed in 2011, as part of an internal process intended to enhance policy advice and as a response to external criticisms regarding the Treasury’s vision. The Living Standards Framework is intended to provide evidence-based advice to Ministers on the lives of New Zealanders, and is intended as an input into the policy process, rather than a decision-making tool in itself.
Policy formulation
Scotland Scotland Performs
Government
The Scottish government’s National Performance Framework was first published as part of the 2007 Spending Review, and was refreshed in June 2018. It sets out a vision for Scotland which uses an outcomes-based approach to measuring government’s achievements, rather than inputs and outputs. The National Performance Framework forms the basis of performance agreements with public service delivery bodies, and is used to monitoring their effectiveness.
Agenda-setting; monitoring; evaluation
Sweden New measures for prosperity
Ministry of Finance
The New Measures of Well-being developed by the Swedish government as a complement to GDP have been integrated into the Budget Bill 2017.
Agenda-setting, policy evaluation

SDD/DOC(2018)7 │ 21
POLICY USE OF WELL-BEING METRICS: DESCRIBING COUNTRIES’ EXPERIENCES Unclassified
Country Mechanism Leading
entity
Short description Stage(s) of the
policy cycle
targeted
United
Kingdom
The What Works Centre for Wellbeing; various central
government activities
The What Works Centre for Wellbeing
(an independent
agency); various central
government departments,
previously coordinated
by the Cabinet Office
Efforts to bring well-being metrics into policy in the United Kingdom have taken several different forms. One is the What Works Center for Wellbeing, an independent collaborative center that aims to develop and boost generation of high quality evidence on well-being intended for decision-makers in government, communities, businesses and other organisations to use in their work.
Policy formulation, policy evaluation
United Arab
Emirates The Happiness Policy Manual
Ministry of State for
Happiness and Wellbeing
In October 2017, a Happiness Policy Manual was published by the National Program for Happiness and Positivity, proposing the use of subjective well-being measures to inform policy. The approach to implementation is presented through three stages of the policy cycle: policy formulation, policy assessment and policy implementation.
Whole policy cycle
1. David Uren, Economics Editor, “Treasury department to get back to basics under John Fraser”, The Australian,
22 September 2016, www.theaustralian.com.au/national-affairs/treasury/treasury-department-to-get-back-to-basics-under-john-
fraser/news-story/852e47a30515a74d90d7ef49cbd52da9 (accessed on 25/10/2017).
3.4. Some commonalities, differences and challenges in using well-being indicators
in policy settings
16. The case studies presented in the Annex point to some of the challenges and
complexities of developing mechanisms for integrating well-being indicators into policy
making and decisions. Some common themes emerge relating to the measurement
framework, the process and the political context.
3.4.1. The process of implementing well-being indicators in the policy cycle
17. As noted earlier, in some countries, well-being indicators were not specifically
developed with a direct policy use in mind. By contrast, in others, the process started with
a conceptual or paradigm shift, aiming to expand what is considered as important to
improve people’s lives, such as in Ecuador. Or somewhat similarly, such as in Scotland,
the well-being indicators were integrated into a performance monitoring framework.
18. The stage of the policy cycle in which the indicators are used differs as well. Well-
being indicators are mostly used at the policy formulation stage, such in New Zealand and
Ecuador, or at the evaluation stage, such as in the United Kingdom. In France, Italy and
Sweden, indicators are more commonly used at the agenda setting stage, with parliamentary
reporting at that start of the budget process. Notably, the recently published UAE
Happiness Policy Manual addresses the use of happiness data throughout the policy cycle,
so examining its implementation in practice may prove useful for future research.
3.4.2. The selection of well-being indicators
19. The number and type of indicators used in policy settings varies significantly
across countries. In Sweden, Italy and France, where implementation is mainly through
reporting to parliament, the number of indicators is significantly limited, from six/ten
(France) to twelve (Italy) and fifteen (Sweden) to facilitate communication. At the other

22 │ SDD/DOC(2018)7
POLICY USE OF WELL-BEING METRICS: DESCRIBING COUNTRIES’ EXPERIENCES Unclassified
extreme, in the cases of New Zealand and the United Kingdom, a very wide variety of
indicators are available from the respective NSOs for policy makers to draw on.4 Ecuador
and Scotland lie in between, with a defined number of indicators, and well-defined
monitoring procedures (through the National Development Plan in the case of the former,
and a National Performance Framework in the case of the latter).
20. The use of subjective well-being indicators in policy settings also varies across
countries. For example, in Italy, one of the criteria for selecting indicators for the budget
law was being able to forecast trends three years ahead; due to limited data collection and
quality, subjective well-being indicators were excluded from the list. By contrast, a strong
emphasis on subjective well-being outcomes is adopted by the What Works Centre for
Well-Being in the United Kingdom.
3.4.3. The political process
21. In some cases, well-being policy frameworks have been supported by parliament,
whether or not they were first initiated by parliament or government. This is the case for
France, Italy, and the Netherlands, where the intention is for parliament to have an evidence
base with which to hold government accountable for performance, through annual reporting
of well-being indicators. To a lesser extent this is also the case in Sweden. In other cases,
a central government agency has taken the lead, such as in New Zealand where the Treasury
in charge of the framework, or Ecuador, where the Buen Vivir Secretariat and the Planning
Ministry (SENPLADES) were in the lead.
22. More broadly, as shown in Table 3.1, some of the initiatives presented here have
benefited from strong leadership, often involving a prominent political figure promoting
the concept of well-being. The most notable example is Ecuador, where the previous
president, Rafael Correa, initiated a revision of the constitution to incorporate the concept
of Buen Vivir in it. It was also the case in France, with the introduction of a law by a member
of Senate, Eva Sas, and in the United Kingdom, with the launch of the Measuring National
Well-Being Programme by former Prime Minister David Cameron. Strong political
leadership, however, can be a double edged sword, as while it can effectively promote and
realise meaningful incorporation of well-being into policy, it can also generate risks of
retraction of polices with the change of political leadership.
23. Finally, is worth recalling that most of these initiatives are still quite recent, so
adjustments and modifications are to be expected and it is probably too early to draw out
“best practice” lessons. Nevertheless, for those with a few years of implementation, it is
clear that ensuring continuity in political engagement with respect to well-being concepts
and policy objectives remains essential (see Australia in Table 3.1). Potential difficulties
can be compounded when the initiatives are strongly associated with a political figure – i.e.
can the actions to implement well-being frameworks outlast their instigator? This remains
to be seen, and most likely depends also on how widely accepted the well-being approach
is by the public and whether it is mainstreamed within the civil service.
4. This is also the case with the Italian national statistical office’s BES indicators (see Table 2.1),
but a much narrower set of headlines have been selected for the purposes of informing the budget
process.

SDD/DOC(2018)7 │ 23
POLICY USE OF WELL-BEING METRICS: DESCRIBING COUNTRIES’ EXPERIENCES Unclassified
4. Summary and conclusions
24. This paper has described a number of national initiatives to measure well-being and
some of the mechanisms that have been developed to more systematically integrate well-
being metrics in policy decision-making.
25. While national experiences vary, commonalities also exist – for example, all
approaches considered take a multidimensional view of well-being, and large-scale public
consultations have generally been used to inform concepts and measures. Context matters
too, whether political or procedural, and all the case studies featured in this paper are
describing new developments in the way that measuring well-being is impacting policy
making. This review sets the stage for a deeper discussion of the tools and practices that
can further advance the policy take-up of well-being measures, which will form part of a
follow-up report in 2019. Many questions still remain to be answered, and monitoring the
developments in this area is crucial for a deeper understanding.
26. Continuing exploration of the barriers to uptake of well-being frameworks in policy
settings will serve this purpose. The project on ‘Bringing alternative indicators into policy’
identified three types of barriers for use of well-being indicator sets in policy (BRAINPOol,
see Seaford and Berry, 2014):
Political barriers – these include a lack of legitimacy for the process to develop
new indicators, a poorly defined narrative and a lack of strong political imperative
to look “Beyond GDP”, i.e. limited demand for the use of alternative well-being
indicators from the political level.
Indicator barriers – these are mainly related to the methodology used for measuring
well-being and sustainability, and to the lack of consensus around a dashboard of
indicators as a measure of well-being.
Process and structural barriers – these barriers relate to the support and incentives
within policy making for using well-being frameworks, as well as institutional
resistance to change and poor communication of the frameworks to potential users
and stakeholders.
27. Some of these obstacles are apparent in the case studies reviewed in this paper,
while others are harder to identify. The process for selecting which indicators to monitor is
complex, and there is still room for improvement if consensus is to be achieved. As
described, national level policy approaches currently vary in both the number of indicators
considered, and their composition.
28. It is evident that the well-being measurement initiatives, when based on a clear
conceptual framework, are useful in outlining how to think about people’s well-being, and
how to broaden the set of outcomes that the policy process should try to target. However,
it is unclear whether this should be in the form of a specific set of indicators adhered to
stringently, or whether it should be viewed as a prism through which to examine various
policies.
29. Different audiences and actors might also require different tools. The National
Statistical Offices deal with clearly defined statistics, with agreed (and often
internationally-agreed) methodologies that allow comparison and scrutiny. But ministries,
parliaments and accountability agencies might not relate to the indicators but rather to the

24 │ SDD/DOC(2018)7
POLICY USE OF WELL-BEING METRICS: DESCRIBING COUNTRIES’ EXPERIENCES Unclassified
conceptual framework, while still achieving the objective of broadening the set of
considerations in policy setting to important aspects of people’s lives. Civil service and
policy analysts may also require different tools or a hybrid, allowing both an in depth
analysis based on well-being metrics as well as lighter touch communication tools, for
example. Communication with the wider public will require a different strategy, and
making the data accessible and understandable is key to promoting the use of well-being
metrics.
30. Further investigation should also address several challenges which have been
apparent in this review of national experiences:
In order to evaluate the ‘success’ of the well-being metrics in impacting policy
making, it is necessary to define and identify what an expected impact is, and what
the counterfactual is, i.e. business as usual. Identifying the impact of a single
indicator on policy is difficult. Policy processes are complex and diffuse, especially
at the agenda-setting stage of the policy cycle, where well-being metrics are likely
to have the greatest immediate influence. It will thus be extremely rare to find
evidence of specific decisions being taken on the basis of a single analysis or piece
of evidence alone.
The development of evidence-based policies will require continued iterative
progress in data collection, dissemination, analysis, and policy experimentation.
Sustaining the use of well-being metrics over time is a challenge. What steps are
necessary in order to mainstream the use of metrics and prevent initiatives from
fading away? What is the role of advocacy and what tools are effective in widening
the interest across stakeholders?
Structural barriers could hinder integration. For example, government agencies and
ministries tend to focus on the outcomes for which they are directly accountable,
even within a well-being framework. This can result in the marginalization of
dimensions that, while important for people’s well-being, are not under the specific
responsibility of a government agency and so will not be addressed appropriately.
Conversely, expanding the range of outcomes for which policy should be
responsible might see the encroachment of agencies into areas which they do not
have sufficient knowledge or experience (for example, should the ministry of
education or the ministry of health be responsible for healthy education programs?).
Generating continuous engagement and buy-in from across government as well as
broader social partners is crucial in order to maintain effectiveness and on-going
use of well-being in policy, rather than a one-off exercise. This requires revisiting
the reasoning and motivation for integrating well-being into policy as well as
examining how this can be made relevant in day-to-day governance and politics.
Demonstrating causality in a public policy context is always difficult. The optimal
experimental conditions for establishing cause and effect are extremely rare when
trying to improve people’s lives in a fair and balanced way through major national
policy decisions. Collection of the right kinds of data, at the right times, is also
central to building the necessary evidence base. Policies targeted at specific
outcomes may inadvertently affect a multitude of other factors, or generate
unintended outcomes. In the case of well-being metrics there is an additional
challenge because of the multidimensional nature of well-being, the interlinkages
between different well-being metrics can be difficult to map out and identify. For
example, in the policy evaluation stage of the policy cycle, using well-being metrics

SDD/DOC(2018)7 │ 25
POLICY USE OF WELL-BEING METRICS: DESCRIBING COUNTRIES’ EXPERIENCES Unclassified
broadens the set of outcomes assessed, but isolating the impacts on various
dimensions of well-being is most challenging. For many of the well-being
indicators that have only been recently introduced in large-scale and high-quality
data collections in countries’ national statistics it will take some time yet to build
the time series needed to investigate major policy questions of interest, and to
enable analytical work such as forecasting. Routine inclusion of well-being metrics
in studies commissioned to evaluate policy impacts is also needed to build up the
evidence base required.

26 │ SDD/DOC(2018)7
POLICY USE OF WELL-BEING METRICS: DESCRIBING COUNTRIES’ EXPERIENCES Unclassified
Annex A. Seven case studies of well-being indicator and policy frameworks
Ecuador: The good life (Buen Vivir)
31. The concept of “Buen Vivir” (the good life) has been at the core of Ecuador’s
initiative to integrate well-being frameworks into policy making. Buen Vivir goes beyond
the anthropocentric view of well-being and values the well-being of nature, not in a
utilitarian perspective but for its own intrinsic worth. At the initiative of the Ecuadorian
government led by President Rafael Correa, Buen Vivir was included in a revision of the
constitution in 2008.5 Buen Vivir was placed at the centre of the country’s National
Development Plans, and a dedicated Buen Vivir Ministry was established in 2013.
Buen Vivir - A concept embedded in the National Constitution
32. Approved by referendum in September 2008, the Ecuadorian Constitution defined
a social vision for the years to come. Its articles go beyond civic rights, the organization of
power and the limits of the political regime, to conceptualize the values and world view of
the native Quechua peoples around what they call Sumak Kawsay, which in Spanish can
be translated as Buen Vivir. The academic literature presents various definitions for the
term, each of them highlighting different values and theoretical frameworks. However, the
Constitution was the result of a democratic process which brought together 130 Ecuadorian
citizens in a Constitutional assembly, agreeing on common ground: that Buen Vivir can be
understood as the achievement of internal harmony; of harmony within the community and
among communities, as well as harmony with Nature. This last dimension is of particular
importance due to the country’s renowned biodiversity, embodied, for example, in the
Galapagos Islands. Ecuador is in fact the first nation to recognize nature as having
constitutional rights.
5. The Twentieth constitution of Ecuador states that: “We, the sovereign people of Ecuador, hereby
decide to build a new form of citizen coexistence in diversity and harmony with nature, to reach the
good way of living, the sumak kawsay”, Constitution of the Republic of Ecuador, Preamble, 2008
Asemblea Constituyente (2008),
www.asambleanacional.gov.ec/documentos/constitucion_de_bolsillo.pdf (accessed on
19 October 2017).

SDD/DOC(2018)7 │ 27
POLICY USE OF WELL-BEING METRICS: DESCRIBING COUNTRIES’ EXPERIENCES Unclassified
Figure A.1. The three core components of Buen Vivir
Source: Adapted from “Buen vivir en el Ecuador: Del concepto a la medición”, p.52.
33. Ultimately, this vision aims for new form of sustainable development, which
considers progress beyond economic growth by focusing on people’s well-being within
communities and respecting Nature as a subject, not simply as a human resource.
34. In 2013, former President Correa issued an executive decree to create a “State
Secretariat for Good Living” (or Secretaría del Buen Vivir, in Spanish), Although its
original mandate was until December 2017, it was terminated following last year’s
presidential election. Nevertheless, the initiative lasted for just under 4 years, and was
allocated a budget of approximately 12 million USD.6 A total of 21 people worked for the
Secretariat, with different backgrounds ranging from fields such as sociology and
anthropology, to communications and project management.7 The three main areas of
activity were research and promotion of “good living” practices via national media
channels and schools, development proposals to other ministries on the topic of Buen Vivir,
and the dissemination of Buen Vivir on an international scale. According to Spanish
sociologist and former Director of the Secretariat, Jesús Sanz,8 all objectives were met with
just 30% of the budget provided. Projects included a “National Values Plan” implemented
across public institutions, the launch of a book for children on “values and virtues” at the
2016 CELAC summit,9 initiatives in close collaboration with other institutions to promote
volunteering, and over 100 videos for national television on citizens’ experience in the
pursuit of happiness.10
6. González, J. (2017), “Secretaría del Buen Vivir ya empieza su proceso de cierre”, El Universo,
www.eluniverso.com/noticias/2017/05/29/nota/6205012/secretaria-buen-vivir-ya-empieza-su-proceso-cierre
(accessed on 22 November 2017).
7. Ibid.
8. Ibid.
9. https://educacion.gob.ec/el-libro-de-todos-los-ninos/.
10. “¿Qué ha hecho la Secretaría del Buen Vivir?”, El Telégrafo, www.eltelegrafo.com.ec/noticias/buen-
vivir/37/que-ha-hecho-la-secretaria-del-buen-vivir (accessed on 22 November 2017).
Buen vivir
Internal harmony
Harmony within and among
communities
Harmony with Nature

28 │ SDD/DOC(2018)7
POLICY USE OF WELL-BEING METRICS: DESCRIBING COUNTRIES’ EXPERIENCES Unclassified
35. The next step taken by the Ecuadorian government to implement this new vision
was to incorporate the concept of Buen Vivir in the National Development Plans, which set
out 4-year objectives for the political project (2009-2013; 2013-2017; 2017-2021). The
Ministry of Planning (SENPLADES), states in its most recent report (SENPLADES, 2017):
“The citizens’ revolution is committed to Buen Vivir, for everyone. We want a society in
which people can satisfy their needs, live and die worthily with social equality and justice,
free of violence and discrimination, achieving individual, social and natural harmony”.11
36. The National Plan for Buen Vivir 2017-2021 stems from a Constitutional mandate
for the Government, which is to “plan national development, eradicate poverty, promote
sustainable development and an equal redistribution of resources and riches, to achieve
Buen Vivir” (Article 3). It sets out goals for national policy, based on core elements of the
Constitution that guarantee certain rights. Subtitled “Planning for a lifetime”, the main
objective of the national plan is to adopt an inclusive approach so that no one is left out of
the development process for Buen Vivir. This approach is structured around three main
policy areas: “Lifelong rights for all citizens”, “an economy at the service of society”, and
“a wider society for a better State”. Each area contains three goals representing national
interests, with detailed target levels to be achieved by 2021. The 38 targets are based on a
range of indicators aligned with each goal.
Buen Vivir metrics at the heart of policy alignment
37. Such a central role in the national development strategy required a measurement
tool in accordance with the conceptual outline drawn by the Constitution, in order to help
design and evaluate public policy. In close collaboration with the SENPLADES, the
Ecuadorian National Institute for Statistics (INEC) was responsible for developing a
holistic, multidimensional set of metrics for monitoring the programs carried out by the
national government. In 2015, INEC delivered its first methodological proposal for
measuring Buen Vivir, in a report12 which would be the starting point for a study in tandem
with the Statistical Commission for the Construction of New Metrics for Buen Vivir. Based
on the dimensions presented in Figure A.1, Buen Vivir is composed as three components,
each based on different units of analysis: people, communities and nature. Due to the lack
of methodological knowledge on simultaneously integrating three units of analysis into a
single synthetic indicator, the strategy adopted by INEC has been to start measuring Buen
Vivir using the first component: people. Given the equal importance Buen Vivir gives to
the other components, this implies expanding the indicators so that they reflect
flourishment and quality of life, and not just subsistence.
38. The selection of 7 dimensions and over 35 objective and subjective indicators is
based on the various rights recognized by the Constitution, international experiences of life
quality measurement (including the OECD Guidelines on Measuring Subjective Well-
being13), as well as national literature on the more subjective and spiritual facets of Buen
Vivir (Table A.1).
11. Informal translation.
12. León, M. (2015), Buen Vivir en el Ecuador: Del concepto a la medición,
www.researchgate.net/publication/305557457_Buen_Vivir_en_el_Ecuador_del_concepto_a_la_medicion
(accessed on 22 August 2018).
13. OECD (2013), OECD Guidelines on Measuring Subjective Well-being, OECD Publishing,
Paris, https://doi.org/10.1787/9789264191655-en.

SDD/DOC(2018)7 │ 29
POLICY USE OF WELL-BEING METRICS: DESCRIBING COUNTRIES’ EXPERIENCES Unclassified
Table A.1. Buen Vivir dimensions and indicators at a glance
Dimension Example indicators
Habitat and housing Households with acceptable living conditions, adequate sanitation systems,
safe housing ownership.
Water and sanitation Access to water through safe sources, access to adequate sanitation,
hygiene.
Health Access to and contact with health services, quality of services and
installations, acceptable waiting time. Jobs and security Employment opportunities, necessary employment conditions, child labor.
Education Adult educational attainment, educational equipment: computers, sports
facilities, internet, libraries, laboratories. Relations amongst communities and
subjective well-being
Trust amongst people and communities, solidarity and volunteering, human
flourishment.
Environmental practices Good water-saving and energy-saving practices, good consumption practices,
sustainable mobility.
39. Initially, a workshop among local actors and academics was organized in order to
identify common ground amongst the different schools of thought, within the legal
framework stipulated by the Constitution. Shortly afterwards, a second workshop brought
together international actors (OECD, FAO, OPHI among others) to open up the debate.
Finally, discussion groups were put in place to hear the voice of civil society on what
matters most for Buen Vivir. Although the final goal of constructing a multidimensional
index is yet to come to fruition, important measures have been implemented since 2016,
such as the inclusion of a set of questions to the national household survey to begin
quantifying certain indicators that to date, had never been measured in Ecuador.

30 │ SDD/DOC(2018)7
POLICY USE OF WELL-BEING METRICS: DESCRIBING COUNTRIES’ EXPERIENCES Unclassified
France: New Wealth Indicators (Les nouveaux indicateurs de richesse)
40. A law stipulating that government will present a report on “New Wealth Indicators”
to parliament on an annual basis was approved by parliament on 14 April 2015. The report
should cover progress made in view of the “New Wealth Indicators”, and will also assess
the impact of the main reforms enacted in the previous year according to these indicators.
The timing of the report was set to coincide with the national budget process.
Previous initiatives prepared the ground for the New Wealth Indicators law
41. At the time of the law proposal, several previous initiatives had already raised
public awareness and shaped policy dialogues in France. For example, since the early
2000s, several local authorities14 have been developing alternative measures of
performance beyond GDP. In 2003, the Nord-Pas-de-Calais region first computed a Human
Development Index (HDI) at the regional level. Building on this first initiative, and with
the assistance of researchers and representatives of civil society and trade unions, the
regional government of Nord-Pas-de-Calais then developed a set of indicators measuring
the social health of all French regions in 2008 (Jany-Catrice and Marlier, 2015).
42. That same year, President Nicolas Sarkozy established the Stiglitz-Sen-Fitoussi
Commission on the Measurement of Economic Performance and Social Progress, which
has subsequently had a profound role in the integration of beyond-GDP indicators. Based
on the recommendations of the Commission, the French National Statistics Office (INSEE)
ran a survey in 2011 measuring French quality of life and has since published several
documents on this topic (INSEE, 2013). INSEE has also developed a set of indicators to
assess the quality of life at different regional levels (INSEE, 2014).
43. In the same period, the “Forum pour d'autres indicateurs de richesse” (“Forum for
other indicators of wealth”) was created by a group researchers and civil society actors
aiming to support the use of alternative indicators when forming and assessing public
policies. This forum regularly publishes documents, organizes debates and participates in
public conferences in order to communicate the importance of using alternative indicators
to complement GDP.
The New Wealth Indicators law was approved with no objection
44. The New Wealth Indicators law was first filed on 14 October 2014 by a group of
three parliamentarians led by Eva Sas (Senator from the Green Party). The law proposal
was approved unanimously by the National Assembly and the Senate. While the law
proposal suggested that the report on the new wealth indicators would be published in
October, when discussions on the budget law are held in parliament,15 some representatives
argued that it should be published in June when the final public spending for the previous
year is approved by parliament.
14. For example, la Région Hauts-de-France and l'Ile-de-France.
15. The government is required to submit the draft budget law to Parliament by the first Tuesday of October. The budget
is first debated in the National Assembly, which has 40 days for the debate, and then the Senate, which has 20 days to
debate the law. The October debate is preceded by pre-budget debates in the second quarter, where the government
presents a report on the national economy’s evolution and a public finances outlook. The Parliament must approve the
budget within 70 days of the October submission (OECD, 2004).

SDD/DOC(2018)7 │ 31
POLICY USE OF WELL-BEING METRICS: DESCRIBING COUNTRIES’ EXPERIENCES Unclassified
45. The final version of the law approved on 14 April 2015 stipulates that16: “The
government will submit annually to the parliament, on the first Tuesday of October, a
report presenting the evolution, over the last years, of new wealth indicators as indicators
on inequalities, quality of life and sustainable development, as well as a qualitative or
quantitative assessment of the main reforms initiated in the previous, in the current, and in
the following year. The report will be presented during the debates on the budget law and
these new indicators will be compared to the GDP. The report can be debated in the
Parliament.”17
46. Two issues were of vital importance in the law for Representative Eva Sas, initiator
of the law: (i) that the law would not prescribe the list of indicators; the indicators must
instead be selected after a large national consultation which would include researchers,
representatives of civil society, international organizations and experts. An additional
requirement was that surveys would be run to further validate that the indicators accurately
reflect the views of citizens; (ii) that the report can be debated in a plenary session in
Parliament at the government’s request. This is to allow for the New Wealth Indicators to
be considered concurrently with the discussions of the budget law.
47. After the law on the new wealth indicators was ratified, “France Stratégie”, a
consultative body attached to the Prime Minister, and the Economic, Social and
Environmental Council (CESE), a consultative assembly, initiated comprehensive work in
order to select the new wealth indicators.
48. The final set of indicators which was presented in June 2016 is the result of an
extensive consultation process, which included both a working group, which set the ground
for the public consultation, and an extensive three-part public consultation, including an
online survey, a representative telephone survey and designated workshops (see Box 2.2).
At the end of the consultation process, France Stratégie and CESE published a list of ten
themes measured by fifteen indicators, with the recommendation to government to adopt
ten of these indicators (France Stratégie-CESE, 2015). For some of the themes, more than
one indicator was proposed, allowing the government to select from these. The list of
indicators is shown in Table A.2 below.
16. LOI n° 2015-411 du 13 avril 2015 : « Le Gouvernement remet annuellement au Parlement, le premier
mardi d'octobre, un rapport présentant l'évolution, sur les années passées, de nouveaux indicateurs de richesse,
tels que des indicateurs d'inégalités, de qualité de vie et de développement durable, ainsi qu'une évaluation
qualitative ou quantitative de l'impact des principales réformes engagées l'année précédente et l'année en cours
et de celles envisagées pour l'année suivante, notamment dans le cadre des lois de finances, au regard de ces
indicateurs et de l'évolution du produit intérieur brut. Ce rapport peut faire l'objet d'un débat devant le
Parlement.»,
www.legifrance.gouv.fr/affichTexte.do?cidTexte=JORFTEXT000030478182&categorieLien=id.
17. Informal translation.

32 │ SDD/DOC(2018)7
POLICY USE OF WELL-BEING METRICS: DESCRIBING COUNTRIES’ EXPERIENCES Unclassified
Table A.2. France’s New Wealth Indicators (Les nouveaux indicateurs de richesse)
Themes Indicators suggested by France Stratégie-
CESE and the public consultation
Indicators selected by
Government in the 2015/6
reports
Indicators included in
the budget
Performance Indicator
Set
Economics
Employment Employment rate Employment rate Yes
Investment Fixed assets or R&D expenditure ( % of
the GDP) or Triadic patent families
R&D expenditure ( % of the
GDP) Yes
Financial
stability
Debt-to-GDP ratio by sectors
(government, firms and households)
Debt-to-GDP ratio by
sectors (government, firms
and households)
No
Social
Health Healthy life years Healthy life years Yes Quality of life Life satisfaction Life satisfaction No
Inequalities
Income decile share ratio (S90/S10) or
Income poverty or material deprivation
rate
S80/S20 and material
deprivation rate No
Education
Share of people with tertiary educational
attainment or share of people with a
vocational and technical degree
Early school leavers (18-25
years old) Yes
Environment
Climate Carbon footprint Carbon footprint Yes
Biodiversity Bird index Proportion of artificialized
areas No
Natural resource Share of municipal waste recycled No
The implications of the law
49. The law on the new wealth indicators has several implications, the most immediate
one being the publication of a report presenting these indicators, and evaluating how the
main reforms initiated in the previous, current and following year will affect the
indicators.18 The report, published every year in October by the Prime Minister’s Office,
shows the evolution of the indicators over the past decade19 and compares France’s position
with the EU average or to a group of European countries.20 It also explains how the main
reforms introduced during the previous year impacted the evolution of the 10 indicators
(through a short qualitative and, when possible, quantitative assessment). In 2015, the
government released the report presenting it to selected Parliamentary committees21
(Cultural Affairs, Economic Affairs, Finance, and Sustainable Development) rather than in
a Parliament plenary session. In 2016, the Prime Minister’s Office released the second
report on the new wealth indicators, including a more extensive assessment of the effects
18. Premier Ministre - SIG (2015), “Les nouveaux indicateurs de richesse”,
www.strategie.gouv.fr/sites/strategie.gouv.fr/files/atoms/files/a9rb245.pdf, and Premier Ministre - SIG
(2016), “Les nouveaux indicateurs de richesse”.
19. The law does not stipulate a period of reference for the presentation of the indicators. Their presentations
depend mainly of the data availability.
20. The group of countries is composed of Italy, Spain, Germany and the United Kingdom.
21. The Committees are tasked with preparing the debate before discussions in the plenary session of the
Assemblée Nationale and coordinating with government. The committees proportionally represent the political
groups of the Assemblée Nationale and bring together 72 or 73 deputies.

SDD/DOC(2018)7 │ 33
POLICY USE OF WELL-BEING METRICS: DESCRIBING COUNTRIES’ EXPERIENCES Unclassified
of reforms, but without discussing the report in either a Parliament plenary session or in
parliamentary committees.
50. A note released in March 201722 by the Minister of Budget suggested to integrate
six out of the ten new wealth indicators into the Performance Indicator Set that were first
introduced in 2001.23 For the 2018 budget, 5 out of 6 the new wealth indicators are in fact
included in the 95 first-level indicators (Table A.2).
51. In July 2017, senator Franck Montaugé of the Socialist party filed a law proposal
related to the new wealth indicators, comprised of three articles.24 The first article proposes
to establish a Council for the Evaluation of Public Policy and Well-Being, with the
objective of informing parliament on the consequences of public policies on well-being and
sustainability. The Council would also be responsible for creating and maintaining a digital
platform communicating the new wealth indicators for the general public. The Council
would be composed of 18 members of parliament and 18 senators, and be assisted by a
scientific committee. The second article of the law suggests an assessment of the new
wealth indicators in order to determine if there is room for improvement or complementary
qualitative indicators. The final article proposes that an independent body will present a
second opinion alongside the publication of the annual report by the Prime Minister’s
Office. This law proposal will be discussed in parliament by the beginning of 2018.
52. Additionally, in 2016 the General Commission for Territorial Equality (CGET)
published a report on the new wealth indicators at the regional levels,25 and committed to
an annual publication of these indicators.
22. www.performance-publique.budget.gouv.fr/documents-budgetaires/les-circulaires-budgetaires/circulaire-
budgetaire-31032017.
23. The Performance Indicator Set was first established in 2001 with the passing of a law defining the legal
process for setting the national budget. The budget for a year is devised in two phases: in the first phase, the
budget is divided among the ministries and in the second phase each minister defines how their budget will be
allocated between missions and programmes. For the 2018 budget, the budget is composed of 31 missions
comprising 121 programs. A set of performance indicators is associated to each mission and programme, in
order to set targets for the next three years and for retrospective assessment at the end of the budgetary year.
At the mission level, 95 indicators have been identified and more than 600 indicators are used at the programme
level.
24. www.senat.fr/leg/ppl16-611.html.
25. CGET (2016), “New regionalised indicators for defining wealth”, En Bref, No. 15,
www.cget.gouv.fr/sites/cget.gouv.fr/files/atoms/files/en-bref-15-cget-03-2016-gb.pdf.

34 │ SDD/DOC(2018)7
POLICY USE OF WELL-BEING METRICS: DESCRIBING COUNTRIES’ EXPERIENCES Unclassified
Italy: Equitable and Sustainable Well-Being (Benessere Equo e Sostenibile)
53. The process of implementing well-being frameworks into policy settings began in
Italy with the formulation of a measurement framework on well-being. This has provided
the basis for subsequent efforts to integrate the set of indicators into policy making through
the public finance process.
54. The annual budget cycle is set, de facto, in two parts: the three years horizon
planning document (DEF – Documento di Economia e Finanza) issued in April26 and the
Budget law submitted to Parliament in mid-October and approved by the end of the year.
55. The Budget reform’s law, which introduces officially well-being indicators in the
Italian public finance process, provides for:
A Report attached to the DEF that includes the evolution of the selected well-being
indicators over the last three years and the forecast over the following three years,
also considering the possible impact of the economic policy announced by the
Government over this period. The report is based on data provided by the Italian
Institute of Statistics (ISTAT), and on forecasting simulation models by the
Ministry of Economy and Finance (MEF);
A Report to be presented to the Italian Parliament by February 15th every year,
illustrating the impact of the policy measures included in the Budget law on the
well-being indicators for the future three years.
The “Benessere Equo Sostenibile” (BES) framework
56. In December 2010, the National Council for Economics and Labor (CNEL, a
constitutional body that advises the Italian government, the Parliament and the regions, and
promotes legislative initiatives on economic and social matters) and the Italian Institute of
Statistics (ISTAT) launched the “Equitable and Sustainable Well-Being” (“Benessere Equo
e Sostenibile” – BES) project, with the goal of agreeing on a measurement framework that
could be used to assess people’s well-being in Italy.
57. The first stage of this project involved the creation of a Steering Committee
(“Comitato di Indirizzo”) to select the well-being domains. The Steering Committee was
supported by a Scientific Commission composed of ISTAT experts and academics from
different fields. The Scientific Commission selected the indicators for each of the domains
identified by the Steering Committee, while a Support Group (“Gruppo di supporto”),
whose members were selected by ISTAT and CNEL, helped coordination between the two
bodies and the Steering committee.
58. The measurement framework, which was defined as a “work in progress”, has also
been shaped by two public consultations: the first focused on the importance of the fifteen
aspects of well-being identified by the Committee and was conducted by ISTAT based on
a representative sample of the Italian population through the Italian General Social Survey
26. The submission of the DEF report marks the beginning of the annual budget cycle, by defining
macroeconomic projections for the next three years and providing the broad orientation for fiscal policy,
including the size of expenditure cuts required for the subsequent Budget and Stability laws.
SDD/DOC(2018)7 │ 35
POLICY USE OF WELL-BEING METRICS: DESCRIBING COUNTRIES’ EXPERIENCES Unclassified
(“Indagine Multiscopo”) in February 201127; the second was conducted online, with
citizens invited to communicate on the domains of well-being identified by the committee
through a dedicated website28 (see Box 2.2). Following the first BES report in 2013, more
than 100 meetings were organised by ISTAT and civil society actors which resulted in
methodological and technical improvements to incorporate higher-quality and more timely
measures within the BES framework.
59. The BES framework now includes 130 indicators, covering both objective and
subjective measures of well-being, equality and sustainability29, grouped in twelve
domains: health; education and training; work and life balance; economic well-being;
social relationships; politics and institutions; security; subjective well-being; landscape and
cultural heritage; environment; research and innovation; and quality of services. ISTAT is
responsible for the annual publication of national indicators, which are based on either
administrative data or official surveys. Measures of “Equitable and Sustainable well-being”
(BES) are also available at sub-national level (i.e. provincial- and city-levels), thanks to the
collaboration of local government.
The policy use of well-being measures in Italy
60. On the basis of the Budget reform law, on August 4th 2016, the Italian Prime
Minister established a Committee30 with the task of selecting indicators to measure
equitable and sustainable well-being, drawing on national and international experience.
This followed the proposal by the Ministry of Economy and Finance (MEF), and was
enacted through a revision of the Budget law. The Committee was chaired by the Minister
of Economy and Finance and comprised of the president of ISTAT, the Governor of the
Bank of Italy and two experts with outstanding scientific experience.
61. The revision of the budget law stipulated that the indicators selected by the
Committee would be integrated into a report drafted by the MEF as the Document on the
Economy and Finance (DEF), which is submitted to both houses of Parliament for
transmission to the Parliamentary commissions by 15 February each year. The submission
of the DEF report marks the beginning of the annual budget cycle, by defining
macroeconomic projections for the next three years and providing the broad orientation for
fiscal policy, including the size of expenditure cuts required for the subsequent Budget and
Stability laws.
62. The new revision of the law mandates that the DEF would incorporate a report on
progress made in view of the well-being indicators. This would cover a period of the
previous three years, and forecasts for the next three years. The report would be based on
data provided by ISTAT, and on forecasting simulation models. The Committee selected
27. Respondents were asked to rate the 12 conditions of well-being identified by the Committee on a 0-10
scale (for more details, refer to: www.misuredelbenessere.it/fileadmin/upload/benessere-stat-report.pdf (Italian
only).
28. Being self-selected, the sample of 2 518 individuals who responded to the online consultation was not
representative of the Italian population. The respondents were mainly aged 25-64 (90% of the sample), two
thirds of them having at least an upper secondary degree and almost half of them living in Northern Italy (48%;
32% in the Centre and around 19% in the South) (for more details, refer to:
www.misuredelbenessere.it/fileadmin/relazione-questionarioBES.pdf (Italian only).
29. There is no direct link to the Sustainable Development Goals.
30. “Comitato per gli indicatori di benessere equo sostenibile”.

36 │ SDD/DOC(2018)7
POLICY USE OF WELL-BEING METRICS: DESCRIBING COUNTRIES’ EXPERIENCES Unclassified
twelve indicators from the 130 metrics considered in the BES framework, which are
detailed in Table A.3.
Table A.3. BES indicators selected for the DEF report
Indicator Details Source
Average household gross adjusted disposable income per capita
Average income that a person living in Italy can “potentially” spend, after deducting taxes and social contributions and adding the receivable social transfers in kind
ISTAT, National Accounts
Inter-quintile income share (measure of income inequality)
The ratio between the average equalized1 income of the richest 20% of the population and the average equalized income of the poorest 20% of the population
ISTAT, EU-SILC survey
Index of absolute poverty (measure of social exclusion)
Percentage of people living in households with average expenditure below the absolute poverty threshold, over the resident population
ISTAT, Household expenditure survey
Healthy life expectancy at birth
Average number of years that a newborn can expect to live in good health ISTAT, Mortality tables and Italian general social survey
Obesity and overweight rate (measure of health risk)
Standardized percentage of people aged 18 or more obese or overweight ISTAT, Italian general social survey
Early leavers from education and training (EU2020 target measure)
Percentage of young people (aged 18-24) who have completed at most a lower secondary education and are not engaged in education, employment or training
ISTAT, Labour force survey
Unused labor participation
Sum of unemployed people and “potential additional labor force”(i.e. people available to work, even if they did not look for a job in the past 4 weeks) over the total labor force (the total employed and unemployed) and the “potential additional labor force”, referring to people aged 15-74
ISTAT, Labour force survey
Employment ratio for women caring for young children
Ratio of employment rate for women 25-49 years with children under compulsory school age to the employment rate of women in the same age range without children
ISTAT, Labour force survey
Criminality index Number of burglaries, pick-pockets and robberies per 1,000 inhabitants Police and ISTAT survey on personal security
Efficiency of the judicial system
Length of civil proceedings of ordinary cognizance of first and second degree: Average duration in days of civil proceedings defined by a judgment.
Ministry of Justice
Emissions of CO2 and other greenhouse gases (measure of environmental risk)
CO2 and CO2 equivalent methane (CH4) and nitrous oxide (N2O) man-made emissions due to agricultural, urban and industrial activity per capita
ISTAT, Emissions accounts “NAMEA”
Illegal building rate Ratio of the number of unauthorized buildings to the number of building permits issued by the Municipalities2
Centro ricerche economiche sociali di mercato per l’edilizia e per il territorio (CRESME)
1. Income is equalized when it has been adjusted to take into account the household composition (as children and adults
have different needs and there are economies of scale when people live together).
2. The Committee has, however, raised concerns about the quality of this indicator.
63. The indicators were selected against the criteria of parsimony (i.e. focusing on a
limited number of indicators to facilitate their adoption in the public debate), sensitivity to
policy intervention (accountability), data availability, timeliness and availability of long-
and high-frequency time-series. Subjective indicators were excluded, on the grounds that
they are not suitable for forecasting, although their importance in understanding people’s
experiences of life was acknowledged by the committee. The committee also highlighted
the importance of:
periodically reviewing the list, to take into account the socio-economic evolution
of the country, and to reflect the latest measurement and methodological
advancements;
monitoring the evolution of well-being in the three years preceding the DEF beyond
the twelve selected indicators; and,

SDD/DOC(2018)7 │ 37
POLICY USE OF WELL-BEING METRICS: DESCRIBING COUNTRIES’ EXPERIENCES Unclassified
investing in the improvement and development of forecasting models for the
evaluation of the impact of policies in the well-being indicators.
64. The law entered into force in September 2016 and, in the 2017 publication of the
DEF, a first experimental exercise of policy impact and forecasting was conducted on a
subset of 4 indicators (average household gross adjusted disposable income per capita,
inter-quintile income share, missed labour participation and emissions of CO2 and other
greenhouse gases). For each indicator, in additional to the information on its evolution over
the past three years, a three-year forecasting scenario based on actual policies (i.e. “scenario
tendenziale”) and on the policy measures introduced in the DEF 2017 (i.e. “scenario
programmatico”) was provided.
65. In August 2017, the twelve indicators were favourably reviewed by the Budget
Committee of the Chamber of Deputies (lower house of the bicameral Italian parliament),
with a large consensus across parties and after collecting the opinion of the parliamentary
commissions. The president of the Budget Committee of the Senate (higher house of the
Italian parliament) has also given a positive review of the indicators. The law will be fully
implemented in 2018, under the clause of financial neutrality (i.e. with no additional cost
for the Public finance). As such, impacts of the reform on policy making are yet to be
identified. Continued monitoring of the implementation of the law and of its impacts on the
policy setting in Italy will be valuable for learning from this experience.

38 │ SDD/DOC(2018)7
POLICY USE OF WELL-BEING METRICS: DESCRIBING COUNTRIES’ EXPERIENCES Unclassified
New Zealand – The Living Standards Framework
The Living Standards Framework is currently undergoing rapid development in New
Zealand, and the Treasury launched a consultation on a new Living Standards
Framework dashboard of indicators in June 2018. Research for this case study was
conducted towards the end of 2017, and reflects the state of play at that time.
66. New Zealand has made substantial efforts to implement a well-being framework
into policy setting, mainly within the work of The Treasury. The experience of New
Zealand is more mature than some other case studies presented in this paper, and shows the
importance of adaptability of the framework as well as on-going engagement and senior
buy-in.
67. While this work was carried out as part of The Treasury’s commitment to
continuously improve its policy advice, it was also triggered by criticisms about the lack of
clarity surrounding The Treasury’s vision (LECG, 2009), as well as by the emergence of
an international body of research on the need for government policy to look ‘beyond GDP’.
In particular, the recommendations of the Commission on the Measurement of Economic
Performance and Social Progress (also known as the Stiglitz, Sen and Fitoussi report, 2009)
was particularly influential, prompting the former Secretary to the Treasury, John
Whitehead, to launch an internal work stream to evaluate how the CMEPSP findings could
be applied to the department’s research and analysis. The result of these efforts was
published as the first version of the Living Standards Framework in 2011 (New Zealand
Treasury, 2011). However, Treasury always saw the Framework as a multi-step process
(New Zealand Treasury, 2012), which should evolve for different purposes.
The Living Standards Framework
68. The Living Standards Framework is “intended to help Treasury consistently
provide Ministers robust, theoretically-grounded and evidence-based advice that aims to
improve the lives of all New Zealanders” (New Zealand Treasury, 2011). It was developed
on the basis of a number of guiding principles (New Zealand Treasury 2011, 2012), namely:
there are a broad range of material and non-material determinants of living
standards beyond income and GDP;
freedoms, rights and capabilities are important for living standards;
the distribution of living standards across different groups in society is an ethical
concern for the public, and a political concern for governments;
the sustainability of living standard over time is important, implying that policy
needs to weigh up short-term and long-term costs and benefits; and,
measuring living standards through subjective measures of well-being provides a
useful cross-check of what is important to individuals.
69. The Framework is based on a model of societal stocks and flows (Figure A.2). Four
capital stocks – financial/physical, human, social and natural capital – are identified as the
drivers of current flows in society. In turn, flows - such as income, employment, leisure,
freedom, security and amenities – affect future stocks and, therefore, future living
standards. In the first presentation of the Framework (New Zealand, 2011), a number of
dimensions and indicators were proposed as a way to operationalise the model for policy
use. In total, ten dimensions – income, wealth, employment, leisure, education and skills,

SDD/DOC(2018)7 │ 39
POLICY USE OF WELL-BEING METRICS: DESCRIBING COUNTRIES’ EXPERIENCES Unclassified
health, security, environment, and subjective well-being – were represented by
44 preliminary indicators, showing overall performance in New Zealand as well as
distribution across the population.
Figure A.2. Stocks and flows in the Living Standard Framework
Source: New Zealand Treasury 2011, 2012.
70. For the next few years The Treasury shifted emphasis to meeting the need to
provide guidance to day-to-day policy decisions and choices (New Zealand Treasury,
2012). This meant that, while the capital stocks and flows model still underpinned the
Framework, guidance to Treasury analysts on the use of the framework emphasised ‘key
focus areas’ to encourage analysts to broaden their policy analysis beyond traditional
financial measures of costs and benefits, to consider potential impacts on economic growth,
sustainability for the future, equity, social cohesion, and resilience. These five focus areas
were selected to make the tool more practical for Treasury analysts. The focus areas were
selected based on four criteria: they are areas where government decisions are a key
influence; they reflect Treasury’s role in the Government’s policy process; they focus on
areas that make a major (rather than marginal) difference to living standards; and, they
represent key areas of tension where Government is often faced with competing objectives
(New Zealand Treasury, 2012).
71. From around 2016, development attention focused on the four capitals and the need
to understand their interactions, substitutability, complementarity and trade-offs across
them in order to support further deepening of the applicability of the framework to policy
advice. The Treasury’s 2016 Long Term Fiscal Statement, called He Tirohanga Mokopuna,
was released. It used the Four Capitals as a framework for reporting on the long term fiscal
issues facing the economy and signalled a renewed emphasis on the stock- flow approach
identified previously. The four capitals are now depicted as an interwoven mat, with a focus
on raranga or weaving, to signify the interrelationship between the capitals.
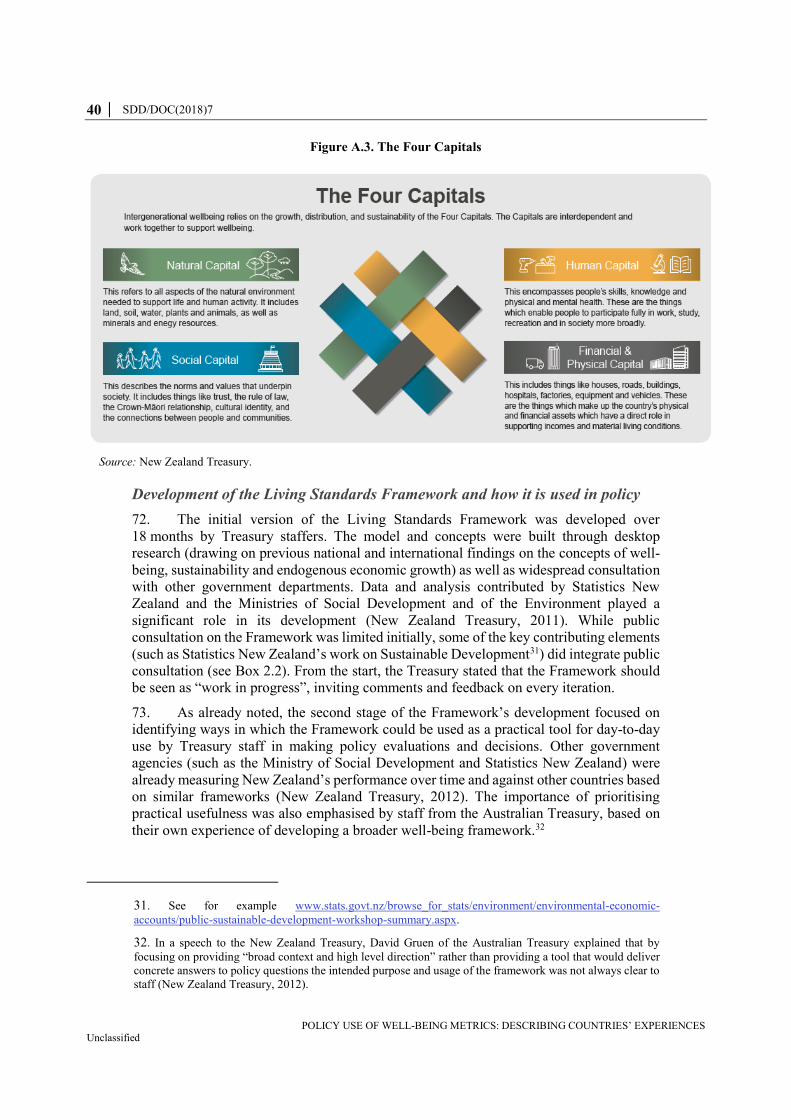
40 │ SDD/DOC(2018)7
POLICY USE OF WELL-BEING METRICS: DESCRIBING COUNTRIES’ EXPERIENCES Unclassified
Figure A.3. The Four Capitals
Source: New Zealand Treasury.
Development of the Living Standards Framework and how it is used in policy
72. The initial version of the Living Standards Framework was developed over
18 months by Treasury staffers. The model and concepts were built through desktop
research (drawing on previous national and international findings on the concepts of well-
being, sustainability and endogenous economic growth) as well as widespread consultation
with other government departments. Data and analysis contributed by Statistics New
Zealand and the Ministries of Social Development and of the Environment played a
significant role in its development (New Zealand Treasury, 2011). While public
consultation on the Framework was limited initially, some of the key contributing elements
(such as Statistics New Zealand’s work on Sustainable Development31) did integrate public
consultation (see Box 2.2). From the start, the Treasury stated that the Framework should
be seen as “work in progress”, inviting comments and feedback on every iteration.
73. As already noted, the second stage of the Framework’s development focused on
identifying ways in which the Framework could be used as a practical tool for day-to-day
use by Treasury staff in making policy evaluations and decisions. Other government
agencies (such as the Ministry of Social Development and Statistics New Zealand) were
already measuring New Zealand’s performance over time and against other countries based
on similar frameworks (New Zealand Treasury, 2012). The importance of prioritising
practical usefulness was also emphasised by staff from the Australian Treasury, based on
their own experience of developing a broader well-being framework.32
31. See for example www.stats.govt.nz/browse_for_stats/environment/environmental-economic-
accounts/public-sustainable-development-workshop-summary.aspx.
32. In a speech to the New Zealand Treasury, David Gruen of the Australian Treasury explained that by
focusing on providing “broad context and high level direction” rather than providing a tool that would deliver
concrete answers to policy questions the intended purpose and usage of the framework was not always clear to
staff (New Zealand Treasury, 2012).

SDD/DOC(2018)7 │ 41
POLICY USE OF WELL-BEING METRICS: DESCRIBING COUNTRIES’ EXPERIENCES Unclassified
74. A 2015 review of the policy uses of the Framework (Au and Karacaoglu, 2015)
highlighted a number of ways that the Framework had been applied to that point. These
included that the Framework had:
Served as a reminder of the wider dimensions of well-being that Treasury
advisers should take into account when formulating policy advice. The
Framework had been used for brainstorming in the early stages of a project, or for
conducting a thorough review of the potential effects of a given policy or group of
policies. This use had helped policy analysts focus on what matters the most to
people, as well as providing a fresh way of thinking about old problems.
Served as a guide for the quantitative assessment of trade-offs between
alternative policy options. The Framework had been used to explore which aspects
of living standards are most important to people, in order to understand the trade-
offs that people are willing to accept and help decision-makers make optimal public
policy choices. For example, a multi-criteria analysis based on the Framework
using a sophisticated surveying methodology had allowed Treasury researchers to
explore people’s views related to different pension finance scenarios, to identify
the policy package most in line with people’s preferences (Au et al. 2015).
Served as a guide for designing policies, based on a shared vision of how New
Zealanders wish to live. Together, the five focus areas of the Framework – potential
economic growth, sustainability, equity, social cohesion, and resilience – were
intended to encompass all policy-amenable aspects of New Zealanders’ living
standards.
75. Work to advance and refine the policy uses of the Framework is ongoing. The
intention continues to be to apply the Framework in different ways to different policy areas
and different stages of the policy process. One important use is to guide analysts to the
areas of the research literature which should be reviewed, and the particular research
communities with which to connect, to ensure a comprehensive assessment of relevant and
up-to-date evidence. This flexibility can be useful in a range of situations. In an April 2015
survey, 59% of the Treasury’s public sector stakeholders were aware of the Living
Standards Framework; of those who were aware, 63% found it either very or fairly useful
(Au and Karacaoglu, 2015).
76. While in the early stages of the development of the Framework the Treasury chose
to focus on the practical usage of the Framework as a heuristic, rather than emphasising the
development of indicators, this was not because the role of measurement was seen as
unimportant. On the contrary, the importance of measurement and official statistics was
recognised since the beginning, and Statistics New Zealand was one of the most important
partners in the evolution of the Framework. Statistics New Zealand had already devoted
much work and public consultation to develop a broad range of social, economic and
environmental progress indicators, which were launched in 200833.
77. The two agencies continue to collaborate to ensure that core indicators used in the
Framework are based on official, high-quality statistics to the extent possible, while also
having regard to the range of other data available that should be considered to ensure
comprehensive coverage of the relevant wellbeing domains. As the Framework has evolved
33. www.stats.govt.nz/browse_for_stats/snapshots-of-nz/Measuring-NZ-progress-sustainable-dev-
%20approach/sustainable-development/innovation.aspx.

42 │ SDD/DOC(2018)7
POLICY USE OF WELL-BEING METRICS: DESCRIBING COUNTRIES’ EXPERIENCES Unclassified
to be adapted to a variety of different policy contexts and applications, the relevant
measures differ depending on circumstances.
78. The current phase of the work is focused on supporting the stock-flow approach
based on the four capitals, and developing the measurement framework to assess current
well-being in New Zealand. After a review of a range of available international
frameworks, The Treasury has chosen to base the measurement development work on the
OECD’s Better Life Initiative framework, with the Better Life Index (BLI) and its array of
sub-measures (Burton et al., 2017). The Treasury intends to adapt and supplement the BLI
measures with additional indicators of particular relevance to New Zealand, as well as
refine the set of measures to focus on priority social and economic areas and pressures in
New Zealand. This is work in progress.
SDD/DOC(2018)7 │ 43
POLICY USE OF WELL-BEING METRICS: DESCRIBING COUNTRIES’ EXPERIENCES Unclassified
Scotland: Scotland Performs
The Scottish Government launched a new and revised version of the National
Performance Framework in June 2018 (http://nationalperformance.gov.scot/). This case
study refers to the previous edition of the framework, as it stood in February 2018.
79. The experience of using indicators relating to people’s well-being and sustainability
in Scotland was preceded by the development of an outcomes oriented performance
framework. The framework then integrated indicators relating to people’s well-being,
broadening the set of outcomes by which government performance was monitored.
80. In 2007, the Scottish National Party was elected on the basis of a manifesto that
promised a number of public sector reforms, including streamlining departmental structures
to improve efficiency and reduce silos, exploring new monitoring approaches to assess
government performance, and producing a regular “Health of the Nation” report on a range
of economic and social outcomes.34 The new Government’s 2007 Budget Spending Review
introduced the National Performance Framework for the first time, with the aim of putting
these promises into practice (Scottish Government, 2007). The Framework aimed to put
the focus of government priorities on outcomes (rather than purely on inputs or outputs),
and was inspired by an outcomes-based model used in the Commonwealth of Virginia in
the United States, known as Virginia Performs.35 Over the years, the Scottish National
Performance Framework has continued to evolve, but remains a central element of
government planning and performance evaluation in the country.
Description of Scotland’s National Performance Framework
81. The National Performance Framework (NPF) was developed to guide a whole-of
government approach for developing policy and assessing progress. Each part of the
performance framework is directed towards, and contributes to a single overarching
purpose, namely to, “focus government performance and public services on creating a more
successful country, with opportunities for all of Scotland to flourish, through increasing
economic sustainable growth” (Scottish Government, 2007). This purpose is supported by
a number of high-level purpose targets, strategic objectives, national outcomes, and finally
by a set of national indicators, as set out in Figure A.4.
34. Scottish National Party Manifesto 2007, www.politicsresources.net/area/uk/ass07/man/scot/snp.pdf
(accessed on 15 November 2017).
35. Virginia Performs website, accessed 15 November 2017, http://vaperforms.virginia.gov/.

44 │ SDD/DOC(2018)7
POLICY USE OF WELL-BEING METRICS: DESCRIBING COUNTRIES’ EXPERIENCES Unclassified
Figure A.4. The structure of the National Performance Framework
Source: Scottish Government (2007, 2016).
82. The content, including all underlying indicators, can be accessed on the Scotland
Performs website, the main channel for the Scottish Government’s reporting on progress
within the NPF.36 As it stood in 2017, at the heart of the Framework were 16 National
Outcomes, which together describe a vision for what the Government strives to achieve,
covering economic, societal and environmental goals related to business, employment,
education and skills, child-well-being, health, inequalities, social exclusion, safety,
community, sustainable consumption, and other areas (see Box A.1). At that time, the NPF
was underpinned by 55 indicators to measure progress towards the outcomes, and support
the over-arching purpose.37 Each national outcome was then linked to a number of
indicators, and various indicators are attached to multiple outcomes.
Box A.1. National Outcomes in Scotland’s National Performance Framework
1. We live in a Scotland that is the most attractive place for doing business in
Europe.
2. We realize our full economic potential with more and better employment
opportunities for our people.
3. We are better educated, more skilled and more successful, renowned for
our research and innovation.
4. Our young people are successful learners, confident individuals, effective
contributors and responsible citizens.
5. Our children have the best start in life and are ready to succeed.
6. We live longer, healthier lives.
7. We have tackled the significant inequalities in Scottish society.
36. Scotland Performs website, www.gov.scot/About/Performance/scotPerforms (accessed on 15 November
2017).
37. “National Indicators” on Scotland Performs website,
www.gov.scot/About/Performance/scotPerforms/indicator (accessed on 16 November 2017).

SDD/DOC(2018)7 │ 45
POLICY USE OF WELL-BEING METRICS: DESCRIBING COUNTRIES’ EXPERIENCES Unclassified
8. We have improved the life chances for children, young people and families
at risk.
9. We live our lives safe from crime, disorder and danger.
10. We live in well-designed, sustainable places where we are able to access
the amenities and services we need.
11. We have strong, resilient and supportive communities where people take
responsibility for their own actions and how they affect others.
12. We value and enjoy our built and natural environment and protect it and
enhance it for future generations.
13. We take pride in a strong, fair and inclusive national identity.
14. We reduce the local and global environmental impact of our consumption
and production.
15. Our people are able to maintain their independence as they get older and
are able to access appropriate support when they need it.
16. Our public services are high quality, continually improving, efficient and
responsive to local people's needs.
The development of the National Performance Framework
83. Since the launch of the NPF in 2007, it has been regularly reviewed, and two
‘refreshed’ versions have been released (in 2011 and 2016).38 Changes principally concern
the indicator set, with some indicators being replaced, and more being added over time
(expanding from 45 in the original set to the 55 in 2017). In the 2016 refresh, amendments
were also made to a selection of the Purpose Targets. For the development and review of
the Framework, the Scottish Government has consulted with a number of partners from
other sectors, such as academia and civil society.39
84. While the concept of well-being did not factor explicitly into early communication
around the Framework, this has been embraced more strongly over time. The
recommendations of the Commission on the Measurement of Economic Performance and
Social Progress (otherwise known as the Stiglitz, Sen and Fitoussi report, 2009) and a report
by the Carnegie Trust (2011) on the importance of looking beyond GDP were influential
in emphasising the importance of well-being measures and underlining the role of the
Framework as a well-being policy tool. An explanation of the 2011 revision stated:
85. “Consideration was given to the growing interest in wellbeing, following from the
Stiglitz-Sen-Fitoussi agenda… and the subsequent report from the Carnegie Trust …The
refreshed NPF continues to provide a range of indicators that, when taken together, provide
an overall picture of individual and societal wellbeing in Scotland. It retains many of the
previous indicators of subjective wellbeing, including mental wellbeing, satisfaction with
38. “National Performance Framework Changes” on the Scotland Performs website,
www.gov.scot/About/Performance/scotPerforms/NPFChanges (accessed on 16 November 2017).
39. See, for example, “Briefing on the National Performance Framework” by Scottish Environmental LINK,
Oxfam and STUC, www.scotlink.org/wp/files/documents/NPF-briefing-Jan-2017-2.pdf (accessed on 14
November 2017).

46 │ SDD/DOC(2018)7
POLICY USE OF WELL-BEING METRICS: DESCRIBING COUNTRIES’ EXPERIENCES Unclassified
neighbourhood, and perception of local crime rate, and adds a new subjective measure of
self-assessed general health. It also retains many of the more objective indicators that
measure societal wellbeing beyond GDP, such as poverty, housing, crime victimisation,
biodiversity and renewables, and adds several new indicators such as children‘s deprivation
and cultural engagement.” (SPICe Information Centre , 2012)
86. However, in comparison to the UK National Well-being Programme led by the UK
Office for National Statistics (ONS), no special emphasis is given to the importance of
subjective well-being in the NPF. In addition, the Scottish Framework uses the Warwick-
Edinburgh Measure of Mental Well-being (WEMWBS)40 rather than the four questions on
subjective wellbeing developed by the ONS (Carnegie Trust, 2013).
Role in government decision making
87. The National Performance Framework has had a fundamental impact on the
structure and working methods of the Scottish public sector by providing a set of objectives,
and accompanying indicators, around which all departments and agencies, at central
government and local level, aim to be aligned. As the head of the Scottish Government
Performance Unit, Anne-Marie Conlong, put it: “Quite simply, the National Performance
Framework transformed how we do government in Scotland – in policy terms, in
partnership working and in the leadership, management and culture of our organisation”.41
88. In terms of direct links between the NPF measures and decision-making processes
in government, the situation has evolved over time. Initially, the Scotland Performs website
was developed as a stand-alone resource, providing ongoing updates on the progress made
in each indicator, with little or no additional reporting provided to Parliament or other
stakeholders. The Scotland Performs Technical Assessment Group (made up of Scottish
Government chief professional officers and senior analysts) set thresholds for each
indicator and target to represent what constitutes a ‘stable’ position. Performance in each
indicator is assessed over time, with the time period and method for assessing trends
varying depending on the indicator, and communicated in technical notes on the site.42
However, over the years, there have been calls to integrate NPF reporting more closely
with the policy-making, and especially the budget-setting process (e.g. SPICe Information
Centre, 2012; RSE 2013).
89. As a result, specific measures have been taken to improve the way that measures
and analysis related to the NPF are communicated to policy makers, starting with
‘scorecards’ being produced to accompany the budget review process, which usually takes
place every two to three years. These scorecards summarise ‘at a glance’ the evolution of
indicators for relevant NPF outcomes, for each committee in the Scottish Parliament,
showing whether performance is improving, maintaining or worsening. More recently, the
scorecards have been accompanied by an additional report setting out more strongly the
inter-relationship between the Government’s activities, spending plans and Scotland
Performs, outlining the key choices made and a number of representative examples
40. NHS Health Scotland, The Warwick-Edinburgh Mental Well-being Scale,
www.healthscotland.com/documents/1467.aspx.
41. “Wellbeing outcomes and national government: Scotland”, Blog Post,
www.whatworkswellbeing.org/case-study/wellbeing-outcomes-national-government-scotland/.
42. “Technical Notes” on Scotland Performs website,
www.gov.scot/About/Performance/scotPerforms/TechNotes (accessed on 17 November 2017).
SDD/DOC(2018)7 │ 47
POLICY USE OF WELL-BEING METRICS: DESCRIBING COUNTRIES’ EXPERIENCES Unclassified
(Scottish Government, 2015). While it has been noted that this form of reporting has been
widely used by Committees,43 recent Finance Committee guidelines for the draft 2016-
2017 budget process suggests that there is more scope to use the NPF to hold public bodies
to account for the delivery of outcomes.44
90. Overall, the ‘Scottish experiment’ in outcomes-based performance management
has been widely commended, both in the UK and internationally (Carnegie Trust, 2013).
Some department s have gone quite far in producing strategies that link their own actions
to the NPF targets and outcomes, accompanied with concrete indicators of change, such as
the Justice department’s 2017 strategy document “Justice in Scotland: Vision and
Priorities”.45 However, linking the high-level purpose, targets and outcomes of the
Framework with the government’s actions and spending programmes remains an ongoing
challenge
91. The Scottish Government remains committed to the NPF, and to its continued
adaptation for more effective policy guidance for improving well-being and sustainability
outcomes in the country. Another review is being undertaken in 2017-18, which aims to
revisit the purpose, outcomes and indicators in a more fundamental way than previous
refreshes, given that a decade has now passed since its launch (and the original 10-year
‘vision’). Public outreach will play a much more fundamental role in this review than
previously, with discussions with community groups and members of the public being held
across a number of different channels and events to provide a more bottom-up perspective.
92. While the NPF was developed and promoted by the Scottish National Party, which
has been in power for its duration, a Community Empowerment Bill came into force in July
2015, meaning that the Framework is now embedded in legislation and will continue no
matter who is in government.46
43. Scottish Government’s response to the Report of the Finance Committee on the Draft 2015-2016 Budget,
www.parliament.scot/S4_FinanceCommittee/General%20Documents/Cabinet_Secretary_for_Finance_Consti
tution_and_Economy_to_Convener_dated_3_February_2015(1).pdf (accessed on 17 November 2017).
44. “Draft Budget 2016-17, Finance Committee Guidance to other Committees,
www.parliament.scot/S4_FinanceCommittee/General%20Documents/Guidance_to_subject_committees.pdf
(accessed on 17 November 2017).
45. “Justice in Scotland: Vision and Priorities”, www.gov.scot/Publications/2017/07/9526 (accessed on
7 December 2017).
46. Community Empowerment Bill FAQs, Scottish Government website,
www.gov.scot/Topics/People/engage/CommunityEmpowermentBillFAQs (accessed on 17 November 2017).

48 │ SDD/DOC(2018)7
POLICY USE OF WELL-BEING METRICS: DESCRIBING COUNTRIES’ EXPERIENCES Unclassified
Sweden: New Measures of Well-being (nya mått på välstånd)
93. A framework dedicated to measuring well-being has been implemented into the
Swedish budget law very recently, using a limited set of indicators. However, Sweden has
previous experience in using an indicator set for accountability and monitoring of policy,
under the Environmental Quality Objectives program.
The Environmental Quality Objectives in Sweden – An earlier implementation
of beyond-GDP measures into policy
94. The use of “beyond-GDP” measures in the Sweden within policy-making settings
was made substantial in Sweden with the integration of Sustainable Development
indicators into environmental policy. In 1999, the Riksdag approved a new structure for
designing environmental policy by establishing fifteen environmental quality objectives
(EQO) goals. The Ministry of Environment and Energy sets the responsibility for achieving
the EQOs as shared among a wide range of actors, which include public authorities, non-
governmental organizations, the business community, households and private
individuals.47 There are twenty five government agencies that are responsible for following
up and evaluating specific environmental quality objectives and eight agencies directly
accountable for achieving the objectives. The Swedish Environmental Protection Agency,
working with all the relevant agencies, prepares an overall report to the Government,
presented every year.
95. The motivation for setting the EQOs was to ensure accountability and measurement
of progress on environmental performance, including regular monitoring of the EQOs, with
annual reports to government, and an in-depth evaluation once every parliamentary term.
Over the years, the Riksdag has adopted a number of additional and revised interim targets
for the EQOs. These targets are replaced on an ongoing basis with milestone targets, which
define steps on the way to achieving the EQOs.48
96. Setting the EQOs is based on a wide set of indicators relating to sustainable
development, and the Swedish government and parliament have managed to integrate the
indicators in a meaningful way ìn the policy cycle stages of policy evaluation and agenda
setting. However, some challenges in implementation exist. The EQOs, as an ambitious
environmental agenda, have not established policy priorities in a way that aligns with
available resources, and this has reduced their effectiveness (OECD, 2014). Another
challenge is the institutional autonomy of local governments, which leads to significant
differences in their implementation capacity so that inconsistencies in implementation are
apparent.
The New Measures on Well-being – implementing a well-being framework into
the budget process
97. Building on its experience with integrating beyond GDP indicators into policy
through the EQOs, the Swedish government has recently developed New Measures on
Well-being, focusing on the long-term sustainability of economic growth as well as the
quality of life and well-being of the citizens. The underlying conceptual framework
47. Ministry of Sustainable Development, Sweden, Article no. M2006.26, Summary of Government Bill
2004/05:150, “Environmental Quality Objectives: – A Shared Responsibility”.
48. www.miljomal.se/Environmental-Objectives-Portal/Undre-meny/About-the-Environmental-Objectives/
(accessed on 13 October 2017).

SDD/DOC(2018)7 │ 49
POLICY USE OF WELL-BEING METRICS: DESCRIBING COUNTRIES’ EXPERIENCES Unclassified
recognizes the multidimensionality of people’s lives and the resources sustaining a better
life and a better society over time. The indicators are also related to the UN Agenda 2030
and the SDGs, which as a list of policy commitments agreed by the world leaders also
underscores the shared responsibilities for delivering a sustainable future.
98. The framework, titled “New Measures for Well-being”, was presented in the 2017
Spring Budget Bill. The budgeting process in Sweden is made up of two distinct phases,
with a Spring Fiscal Policy Bill in April, setting the aggregates for fiscal policy, followed
by a government Budget Bill, detailing the allocations for the budget year ahead (OECD,
2017b). The annual budget process is one of the key parts of the Swedish policy-making
process, and it is characterized by strong collaboration across government. Following
presentation of the Spring Budget Bill, budget priorities are negotiated and policy measures
are discussed widely.49
99. This process was initiated with the publication of a report on “Measuring Quality
of Life” which was presented to the Swedish government in 2015.50 This report was
commissioned by government in 2014, and aimed at mapping and analyzing proposed
indicators for monitoring well-being in Sweden, to complement GDP per capita. In
addition, a focus was also directed at measuring the distributions of outcomes among
different groups in society.
100. Based on this report, the Swedish government tasked the National Bureau of
Statistics (Statistics Sweden) to develop a framework for measuring well-being, in
consultation with government offices, and to suggest a set of indicators.51 The indicators
were to be based on existing data, and take into account gender equality and equality
between different population groups and regions when possible.
101. The fifteen New Measures for Well-being (Table A.4) were presented in the spring
2017 Budget Bill. The indicators are divided into three categories: Economic,
Environmental and Social. Each category has five indicators, and they are a mixture of both
objective and subjective measures.
49. A performance framework is embedded into the national budget in Sweden through the
classification of overall government expenditure into 27 distinct “Expenditure Areas”. On the basis
of these, high-level goals and indicators can be set. However, the use of the framework is not very
systematic, as there is no overarching coherent concept that organizes the framework. Although the
Expenditure Areas include goals and key indicators, the indicators are selected by agencies and are
not necessarily directly related to the goals (OECD, 2017b).
50. “Får vi det bättre? Om mått på livskvalitet” , Betänkande av Utredningen om mått på livskvalitet,
Stockholm 2015, www.regeringen.se/contentassets/dbb4c911287747b3943b4f61cf2b344f/far-vi-det-battre-
om-matt-pa-livskvalitet-.pdf.
51. Statistiska centralbyråns, “Indikatorer om hållbar utveckling och livskvalitet till budgetarbetet” SCB,
Stockholm.

50 │ SDD/DOC(2018)7
POLICY USE OF WELL-BEING METRICS: DESCRIBING COUNTRIES’ EXPERIENCES Unclassified
Table A.4. New Measures for Well-being (nya mått på välstånd)
Economic Headline Indicators Environmental Headline Indicators Social Headline Indicators
GDP per capita Air quality Low-level living standard
Employment rate Water quality Self-assessed health status
Unemployment rate Protected nature Education level
Household debts Chemical pollution Interpersonal trust
Public debts Greenhouse gas emissions Life satisfaction
Source: Government Offices of Sweden, “New Measures of Well-being”,
www.government.se/articles/2017/08/new-measures-of-wellbeing.
102. Developing and presenting this framework is a strong signal from the Swedish
government for agencies at all levels of government to adopt it into the key processes of
policy-making. More specifically, the government states its intentions to incorporate the
New Measures on Well-being in the following ways (Lundin, 2017):
Monitor socioeconomic development:
Provide input to policy choices and considerations
Support the assessment of effects of government reforms
Presented as complementary performance indicators in the spring Budget Bill
annually
103. Coordination of the work on the New Measures for Well-being has been led by the
Ministry of Finance. The publication of the framework has generated interest from various
stakeholders and academia, and a review of the framework is intended for future
publications. At this stage, there is no intention for the indicators to be used to set national
targets. It is not yet clear whether the Ministry of Finance, which is coordinating the work
on the New Measures for Well-being, intends on integrating these into the Expenditure
Areas.

SDD/DOC(2018)7 │ 51
POLICY USE OF WELL-BEING METRICS: DESCRIBING COUNTRIES’ EXPERIENCES Unclassified
United Kingdom: What works for Well-being?
104. The UK Office of National Statistics (ONS) has a long history of reporting on
societal outcomes through its regular Social Trends publication, first produced in 1970. In
2007, the ONS started looking in more depth at existing datasets to assess how these could
be used to help build a more detailed picture of societal well-being. Two years later, an All-
Parliamentary Group on Wellbeing Economics was formed to discuss and promote the
development of policies to promote well-being.52 Together, these efforts laid the
groundwork for the official launch of the UK Measuring National Wellbeing program by
then Prime Minister David Cameron in November 2010.53 Under this program, the ONS
was tasked with developing a new system for the measurement of national progress, guided
“not just by how our economy is growing, but by how our lives are improving; not just by
our standard of living, but by our quality of life”.54
105. Over the years, the National Wellbeing program has led to the development of a
comprehensive measurement framework and indicators, and has been accompanied by a
number of associated initiatives to raise the profile and impact of well-being measures in
policy. These include:
The Social Impacts Taskforce. The taskforce brings together analysts from across
central government and the devolved administrations. It was set up prior to the
launch of the National Wellbeing Programme (in August 2010) but played an
important role in sharing good practice and guidance on policy-relevant well-being
analysis in subsequent years.55
The What Works Centre for Wellbeing. Launched in 2014, the What Works
Centre for Well-being is an independent, collaborative organization aiming to draw
evidence together, develop meaningful methods of comparison and produce
practical guidance that government, businesses and communities can use to help
improve wellbeing across the UK.
Multiple initiatives to mainstream well-being into different policy areas and
levels of government. A number of government departments began to make more
systematic use of well-being frameworks and measures (particular subjective well-
being measures), including management and evaluation tools for public health,
community learning, local government, occupational health, transport, sports and
culture, and environmental quality.56
Development of a well-being measurement framework
106. The dimensions and indicators developed by the ONS for the Measuring National
Wellbeing program provide a common understanding and measurement framework for
52. https://wellbeingeconomics.wordpress.com/about/.
53. www.gov.uk/government/speeches/pm-speech-on-wellbeing.
54. Ibid.
55. www.gov.uk/government/publications/social-impacts-task-force-update-on-recent-work.
56. “Wellbeing Policy and Analysis: An update of wellbeing work across Whitehall”, June 2013,
www.gov.uk/government/uploads/system/uploads/attachment_data/file/224910/Wellbeing_Policy_and_Anal
ysis_FINAL.PDF (accessed on 24 November 2017).
52 │ SDD/DOC(2018)7
POLICY USE OF WELL-BEING METRICS: DESCRIBING COUNTRIES’ EXPERIENCES Unclassified
policy work on well-being in the UK. The framework was developed on the basis of
extensive public consultation and inputs from stakeholders from across different sectors,
which included a national debate, an Advisory Forum and a Technical Advisory Group (see
Box 2.2 for further details).
107. The framework comprises 41 indicators grouped into ten dimensions: personal
well-being, our relationships, health, what we do, where we live, personal finance,
economy, education and skills, governance and the environment. To communicate the
indicators, the ONS developed a ‘well-being wheel’ to show results at a glance across all
dimensions.57 However, in 2017, the wheel was replaced by an online dashboard to foster
user interaction.58 The dataset underpinning the framework is open to the public and the
ONS reports on progress on the headline well-being measures twice a year through its
website.59
108. While the framework comprises ten dimensions, subjective well-being measures
(included in the ‘personal well-being dimension’) have received particularly close attention
in the UK policy context.60 The ONS measures subjective well-being through four
questions, focusing on the life evaluation (self-reported life satisfaction), eudaimonia
(feeling that the things respondents do in their life are worthwhile), positive affect
(happiness), and negative affect (anxiety).
The role of the What Works Centre for Well-being
109. The What Works Centre for Well-being was established to build on the work of the
ONS, as well as the findings of the Commission on Wellbeing and Policy.61 While the
Centre was set up with government support, and in particular from the Cabinet Office, it is
managed as an independent social enterprise, with a mission to “develop and share robust,
accessible and useful evidence that governments, businesses, communities and people can
use to improve wellbeing across the UK”.62 It has 17 founding partners that provide in-kind
resources and financial support, including a number of government departments as well as
the ONS, and major funding bodies such as the Economic and Social Research Council and
the Big Lottery Fund. Its funding totalled approximately GBP 600 000 per year for the
period 2014-17, with five full-time staff.63
110. The What Works Centre for Well-being forms part of a network of seven What
Works Centres and two affiliate members, each addressing a different policy issue or
geographic region. In addition, Dr. David Halpern, Chief Executive of the Behavioral
Insights Team, was appointed in the part-time position of What Works for Policy National
57. See, for example
www.ons.gov.uk/peoplepopulationandcommunity/wellbeing/articles/measuringnationalwellbeing/sept2016.
58. https://blog.ons.gov.uk/2017/03/28/national-statistical-blog-reinventing-the-well-being-wheel/.
59.
www.ons.gov.uk/peoplepopulationandcommunity/wellbeing/articles/measuringnationalwellbeing/apr2017.
60. See, for example, O’Donnell et al. 2014, where wellbeing and subjective wellbeing are treated
synonymously.
61. www.gov.uk/government/news/new-what-works-centre-for-wellbeing.
62. www.whatworkswellbeing.org/about/about-the-centre/.
63. www.alliance4usefulevidence.org/assets/Ansa_A4UE_whatworks_final_Full-report-standard.pdf.

SDD/DOC(2018)7 │ 53
POLICY USE OF WELL-BEING METRICS: DESCRIBING COUNTRIES’ EXPERIENCES Unclassified
Advisor in 2013.64 The model for all of the What Works Centres is to help to ensure that
thorough, high quality, independently assessed evidence shapes decision-making at every
level, by:
collating existing evidence on the effectiveness of policy programs and practices;
producing high-quality synthesis reports and systematic reviews in areas where
they do not currently exist;
sharing findings in an accessible way; and
encouraging practitioners, commissioners and policymakers to use these findings
to inform their decisions.
111. The What Works for Wellbeing Centre applies this model to policy areas relevant
for well-being. For the first three years of its operations, starting in June 2015,65 the research
activities of the Centre have been focused on a limited selection of themes, covering:
lifelong well-being, work, sport and culture, and community well-being. The themes were
selected through discussions with the Centre’s partners, as well as through a more
widespread consultation with over 4 000 individuals and organizations from across the UK
(including six public dialogues). For the Centre’s activities beyond the end of the current
three-year work program in 2018, discussions are ongoing with existing and prospective
partners.
112. In addition to the policy themes, the Centre also conducts work in three cross-
cutting areas: educating stakeholders about how to integrate well-being into policy and
organizational change; providing advice and reflection on how to measure and evaluate
well-being; and convening actors across government and other sectors.
The impact of the Centre’s work on policy
113. The focus of the Centre is currently on helping to build a movement around the
value of taking a well-being approach, and providing evidence-based thought leadership
around emerging issues. The Centre has a number of different channels through which to
disseminate its findings to policy makers, including through its participation in the Social
Impact Taskforce, through its relationship with multiple government departments, and
through its representation at the Cabinet Office by the What Works National Advisor.
However, as the Centre is focused mainly on providing syntheses of evidence and
discussion papers to highlight issues, rather than on advocating for precise policy choices,
it is difficult to assess the direct impact of the Centre’s work on specific policy decisions.
Nonetheless, the reach of the Centre’s work is widespread (going beyond the policy sector,
to businesses and other organizations). As of 2017, the Centre’s website had 82 000 online
visitors, and almost 15 000 downloads of its resources. In addition, the Centre had
organized over 60 events for over 4 000 policy makers, practitioners and academics.66 It
had also contributed to 225 calls for evidence, with its work being featured in a number of
government reviews and documents, including the Stevenson-Farmer Review of Mental
64. www.gov.uk/government/news/dr-david-halpern-reappointed-as-what-works-national-adviser.
65. While the Centre was created in 2014, the first few months were spent identifying appropriate research
areas and teams, with the first three-year work programme launched in June 2015.
66. www.whatworkswellbeing.org/.
54 │ SDD/DOC(2018)7
POLICY USE OF WELL-BEING METRICS: DESCRIBING COUNTRIES’ EXPERIENCES Unclassified
Health and Employers,67 the Culture White Paper,68 and the 10-year Plan on Disability,
Mental Health and Work produced by the Department of Work and Pensions and the
Department of Health.69
67. www.gov.uk/government/publications/thriving-at-work-a-review-of-mental-health-and-employers.
68. www.gov.uk/government/publications/culture-white-paper.
69. www.gov.uk/government/publications/improving-lives-the-future-of-work-health-and-disability.

SDD/DOC(2018)7 │ 55
POLICY USE OF WELL-BEING METRICS: DESCRIBING COUNTRIES’ EXPERIENCES Unclassified
References
Blöndal, J., L. von Trapp and E. Hammer (2016), “Budgeting in Italy”, OECD Journal on Budgeting,
Vol. 15/3, https://doi.org/10.1787/budget-15-5jm0qg8kq1d2.
Burton, T., S. Morrissey and T. Ng. (2017), Improving economic policy advice, The Treasury, New
Zealand, https://treasury.govt.nz/sites/default/files/2017-12/improving-economic-policy-nov17.pdf.
Cairney, P.((n.d.)), Policy Concepts in 1000 Words: The Policy Cycle and its Stages, Paul Cairney:
Politics & Public Policy (blog), https://paulcairney.wordpress.com/2013/11/11/policy-concepts-in-
1000-words-the-policy-cycle-and-its-stages/ (accessed on 7 November 2017).
Camera dei deputati (2017), Relazione finale del Comitato per gli indicatori di benessere equo e
Sostenibile,
http://documenti.camera.it/apps/nuovosito/attigoverno/Schedalavori/getTesto.ashx?file=0428_F002.p
df&leg=XVII#pagemode=none (accessed on 16 October 2017).
Camera dei deputati (2017), Schema di decreto ministeriale recante individuazione degli indicatori di
benessere equo e sostenibile, Atto del Governo 428,
http://documenti.camera.it/Leg17/Dossier/Pdf/BI0431.Pdf, (accessed on 16 October 2017).
Camera dei deputati (2016), Atto del governo sottoposto a parere parlamentare N.428, articolo 14,
comma 2, della legge 4 agosto 2016, n. 163,
http://documenti.camera.it/apps/nuovosito/attigoverno/Schedalavori/getTesto.ashx?file=0428.pdf&leg
=XVII#pagemode=none, (accessed on 16 October 2017).
Camera dei Deputati (2016), Relazione illustrativa relativa all’atto di governo 428,
http://documenti.camera.it/apps/nuovosito/attigoverno/Schedalavori/getTesto.ashx?file=0428_F001.p
df&leg=XVII#pagemode=none, (accessed on 16 October 2017).
Campbell, A. (2012), The National Performance Framework and Scotland Performs, Scottish Parliament
Information Centre.
Carnegie Trust (2011), More than GDP: Measuring What Matters,
www.carnegieuktrust.org.uk/publications/more-than-gdp-measuring-what-matters/.
Carnegie Trust (2013), “Shifting the dial in Scotland: How Scotland performs on wellbeing and what it
should do next”, www.carnegieuktrust.org.uk/carnegieuktrust/wp-
content/uploads/sites/64/2016/02/pub1455011589.pdf.
Cnel - Istat (2012), “La misurazione del Benessere Equo e Sostenibile (BES)”,
www.misuredelbenessere.it/fileadmin/upload/docPdf/BES.pdf (accessed on 16 October 2017).
Cnel - Istat (2012), “Le opinioni dei cittadini sulle misure di benessere: Risultati della consultazione
online”, Roma, www.misuredelbenessere.it/fileadmin/relazione-questionarioBES.pdf (accessed on
16 October 2017).
Downes, R., D. Moretti and T. Shaw (2017), “Budgeting in Sweden”, OECD Journal on Budgeting,
Vol. 16/2, https://doi.org/10.1787/budget-16-5jg1f8p0jh7b.
Eurostat (2017), Final Report of the Expert Group on Quality of Life Indicators, Publications Office of
the European Union, Luxembourg, http://ec.europa.eu/eurostat/web/products-statistical-reports/-/KS-
FT-17-004.
56 │ SDD/DOC(2018)7
POLICY USE OF WELL-BEING METRICS: DESCRIBING COUNTRIES’ EXPERIENCES Unclassified
Exton, C., V. Siegerink and C. Smith (forthcoming), “Measuring subjective well-being in national
statistics: taking stock of recent OECD activities”, OECD Publishing, Paris.
France Stratégie-CESE (2015), Au-delà du PIB, un tableau de bord pour la France, Note d’Analyse,
No. 32.
Gleisner, B., M. Llewellyn-Fowler and F. McAlister (2011), “Working towards higher living standards
for New Zealanders”, New Zealand Treasury paper, No. 11/02, New Zealand Treasury.
HM Treasury, (2011), The Green Book, Appraisal and Evaluation in Central Government, London.
INSEE (2014), Une approche de la qualité de vie dans les territoires, Insee première, No. 1519.
INSEE (2013), Qualité de vie et bien-être vont souvent de pair, Insee première, N. 1428.
Istat (2015), “Rapporto Bes 2015: il benessere equo e sostenibile in Italia”,
www.istat.it/it/files/2015/12/Rapporto_BES_2015.pdf (accessed on 16 October 2017).
Istat (2013), “Rapporto Bes 2013: il benessere equo e sostenibile in Italia”,
www.istat.it/it/files/2013/03/bes_2013.pdf (accessed on 16 October 2017).
Istat (2011), “L’importanza delle dimensioni di benessere per i cittadini”, Statistiche Report,
www.misuredelbenessere.it/fileadmin/upload/benessere-stat-report.pdf (accessed on 16 October
2017).
Jann, W. and K. Wegrich (2006), “Theories of the policy cycle”, in Fischer, F. and G. Miller (eds.),
Handbook of Public Policy Analysis, Routledge, New York, pp. 43-62.
Jany-Catrice, F. and G. Marlier (2015), « L’Indicateur de Santé Sociale (ISS) des régions françaises »,
L’Encyclopédie du Développement Durable, No. 219.
Le Gouvernement du Grand-Duché de Luxembourg (2017), “Le“Luxembourg Index of Well-being” veut
mesurer le bien-être des Luxembourgeois”, www.luxembourg.public.lu/fr/actualites/2017/10/30-
index/index.html (accessed on 10 July 2018).
León, M. (2015), Buen Vivir en el Ecuador: Del concepto a la medición,
www.researchgate.net/profile/Mauricio_Leon5/publication/305557457_Buen_Vivir_en_el_Ecuador_
del_concepto_a_la_medicion/links/5793658d08aed51475bda6c0/Buen-Vivir-en-el-Ecuador-del-
concepto-a-la-medicion.pdf?origin=publication_detail (accessed on 19 October 2017).
Lundin, N. (2017), “Getting governments organised to deliver on Agenda 2030 and the SDGs”, Country
Brief – Sweden, presented at the side event “Getting governments organized to deliver on SDGs” at
the UN High-Level Political Forum 2017 on Sustainable Development, 18 July 2017, New York.
Ministry of Economy and Finance (2016), Estratto dalla Legge n.163 del 4 agosto 2016 (doc 1/2016),
www.mef.gov.it/ministero/comitati/CBES/documenti/Estratto_dalla_Legge_n_163_del_2016.pdf
(accessed on 16 October 2017).
O’Donnell, G. et al. (2014), Report of the Commission for Well-being and Policy, Legatum Institute,
https://lif.blob.core.windows.net/lif/docs/default-source/commission-on-wellbeing-and-
policy/commission-on-wellbeing-and-policy-report---march-2014-pdf.pdf?sfvrsn=0.
OECD (2018), Measuring Well-Being and Progress: Well-Being Research,
http://www.oecd.org/statistics/measuring-well-being-and-progress.htm,(accessed on 28 August 2018).
OECD (2017a), How’s Life? 2017: Measuring Well-being, OECD Publishing, Paris,
https://doi.org/10.1787/how_life-2017-en.
OECD (2017b), Government at a Glance 2017, OECD Publishing, Paris,
https://doi.org/10.1787/gov_glance-2017-en.

SDD/DOC(2018)7 │ 57
POLICY USE OF WELL-BEING METRICS: DESCRIBING COUNTRIES’ EXPERIENCES Unclassified
OECD (2014a), How’s Life in Your Region? Measuring Regional and Local Well-being for Policy Making,
OECD Publishing, Paris, https://doi.org/10.1787/9789264217416-en.
OECD (2014b), OECD Environmental Performance Reviews: Sweden 2014, OECD Environmental
Performance Reviews, OECD Publishing, Paris, https://doi.org/10.1787/9789264213715-en.
OECD (2013), OECD Guidelines on Measuring Subjective Well-being, OECD publishing, Paris,
http://dx.doi.org/10.1787/9789264191655-en
OECD (2011), How’s Life? Measuring well-being, OECD publishing, Paris.
http://dx.doi.org/10.1787/9789264121164-en
OECD (2005), OECD Journal on Budgeting, Vol.4/3: The Legal Framework for Budget Systems: An
International Comparison, OECD Publishing, Paris, https://doi.org/10.1787/budget-v4-3-en.
Office for National Statistics (2011), “Measuring what matters: National Statistician’s reflections on the
national debate on measuring national well-being”, http://socialvalueint.org/wp-
content/uploads/2016/12/nsreporten_tcm77-230272.pdf.
RSE Royal Society of Edinburgh (2013), “The Scottish Government’s National Performance
Framework: a response to the Scottish Parliament’s Finance Committee”, Advice Paper 13/08,
www.rse.org.uk/wp-content/uploads/2016/09/AP13_08.pdf.
Scottish Government (2016), “An Introduction to Scotland’s National Performance Framework”,
www.gov.scot/Resource/0049/00495539.pdf.
Scottish Government (2015), “Scotland Performs Update 2015-2016”,
www.gov.scot/Resource/0046/00460523.pdf.
Scottish Government (2007), “Scottish Budget Spending Review 2007”,
www.gov.scot/Publications/2007/11/13092240/0.
Seaford, C. (2014), Beyond GDP: From Measurement to Politics and Policy,
www.brainpoolproject.eu/wp-content/uploads/2014/03/BRAINPOoL-Final-Conference-Background-
Paper-FINAL.pdf (accessed on 7 October 2017).
SENPLADES (2017), Plan Nacional para el Buen Vivir 2017-2021: Planificamos para toda una vida,
www.planificacion.gob.ec/wp-content/uploads/downloads/2017/07/Plan-Nacional-para-el-Buen-
Vivir-2017-2021.pdf (accessed on 19 October 2017).
SPICe Information Centre (2012), “The National Performance Framework and Scotland Performs”,
Financial Scrutiny Unit Briefing, Scottish Parliament,
www.parliament.scot/ResearchBriefingsAndFactsheets/S4/SB_12-12.pdf.
Stiglitz, J.E., A. Sen and J.-P. Fitoussi (2009), Report by the Commission on the Measurement of
Economic and Social Progress,
http://ec.europa.eu/eurostat/documents/118025/118123/Fitoussi+Commission+report.
UK Cabinet Office, (2013), Well-being Policy and Analysis, An Update of Well-being Work across
Whitehall, www.gov.uk/government/collections/national-wellbeing.
UK Office for National Statistics (2011), Measuring what matters: National Statisticians’ reflections on
the national debate on measuring national well-being, www.ons.gov.uk/ons/guide-method/user-
guidance/well-being/wellbeing-knowledge-bank/understanding-wellbeing/measuring-what-matters--
national-statistician-s-reflections-on-the-national-debate-on-measuring-national-well-being.pdf.
United Nations Department of Economic and Social Affairs (2015), Sustainable Development Goals,
https://sustainabledevelopment.un.org/sdgs, (accessed on 22 August 2018)

58 │ SDD/DOC(2018)7
POLICY USE OF WELL-BEING METRICS: DESCRIBING COUNTRIES’ EXPERIENCES Unclassified
Welsh Government (2017), “Well-being of Wales”, https://gov.wales/statistics-and-research/well-being-
wales/background/?lang=en (accessed on 11 July 2018).


![Topologic study of Wax Lake Delta and metrics describing ... · lecture notes GISWR, 2011]. The delta land surface and shoreline evolution are observed ... LANDSAT imagery ideal for](https://img.pdfslide.us/doc/110x75/5f1d1fdede8106701e0311ea/topologic-study-of-wax-lake-delta-and-metrics-describing-lecture-notes-giswr.jpg)


![Metrics for Deep Generative Models - arxiv.org · (PGA) [Fletcher et al., 2004] describing the variability of data on a manifold uses geodesics in Principal com-ponent analysis. Recent](https://img.pdfslide.us/doc/110x75/5cb944f488c99358338bc98e/metrics-for-deep-generative-models-arxivorg-pga-fletcher-et-al-2004.jpg)