Embed Size (px)
Citation preview
Policy Statistics: Data Need Assessment for Integrated Statistics
M.Sairi Hasbullah Deputy Chief Statistician for Social Statistics
BPS-Statistics Indonesia
Workshop “Understanding Data Needs for Inclusive Development” UNESCAP, Bangkok 28-30 November 2017
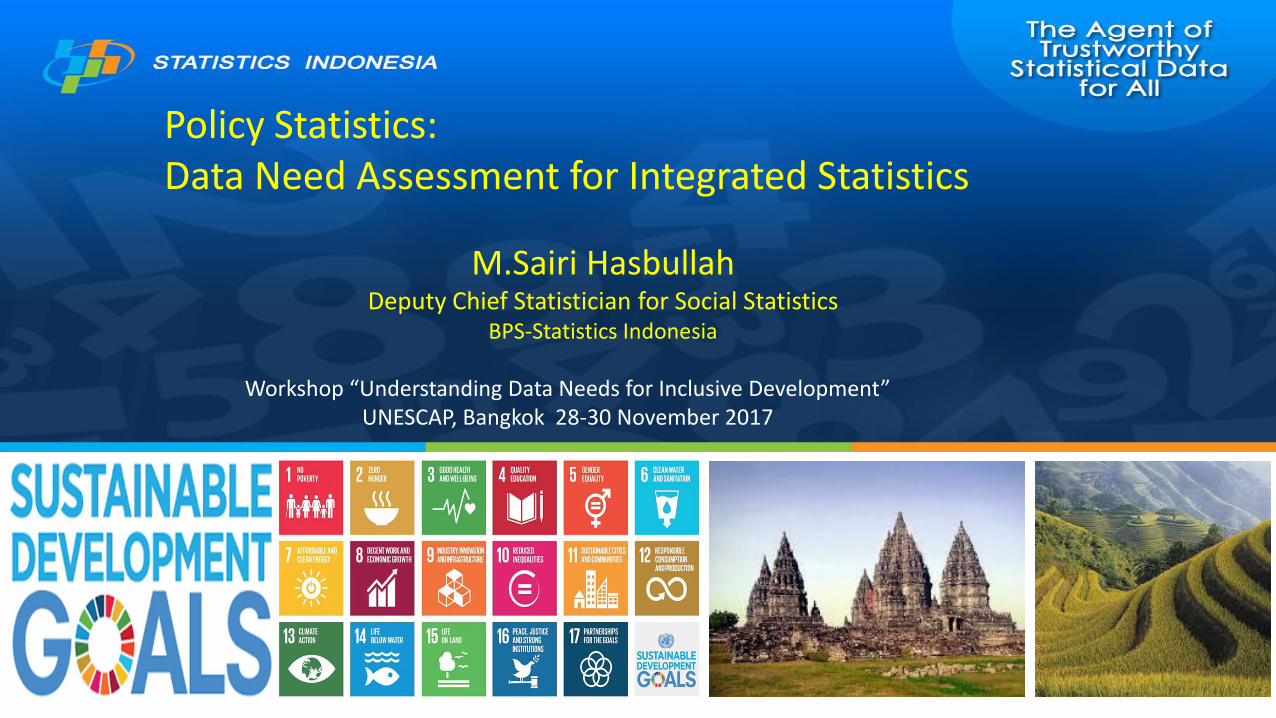
Achieve Three Goals of the RSG
• Enabling policy environment to maintain demand for PSS.
• Strengthened production of the core set of PSS
• Enhanced accessibility and use of the core set of PSS.
How we understand data need for policy implementatation? • Focus on how NSS work effectively • How we understand the problem of data availability both in
national and in sub-national level. • How we match between data availability and policy
implementation need. • BPS-Statistics Indonesia strongly suggest the government for
data disaggregation.
3
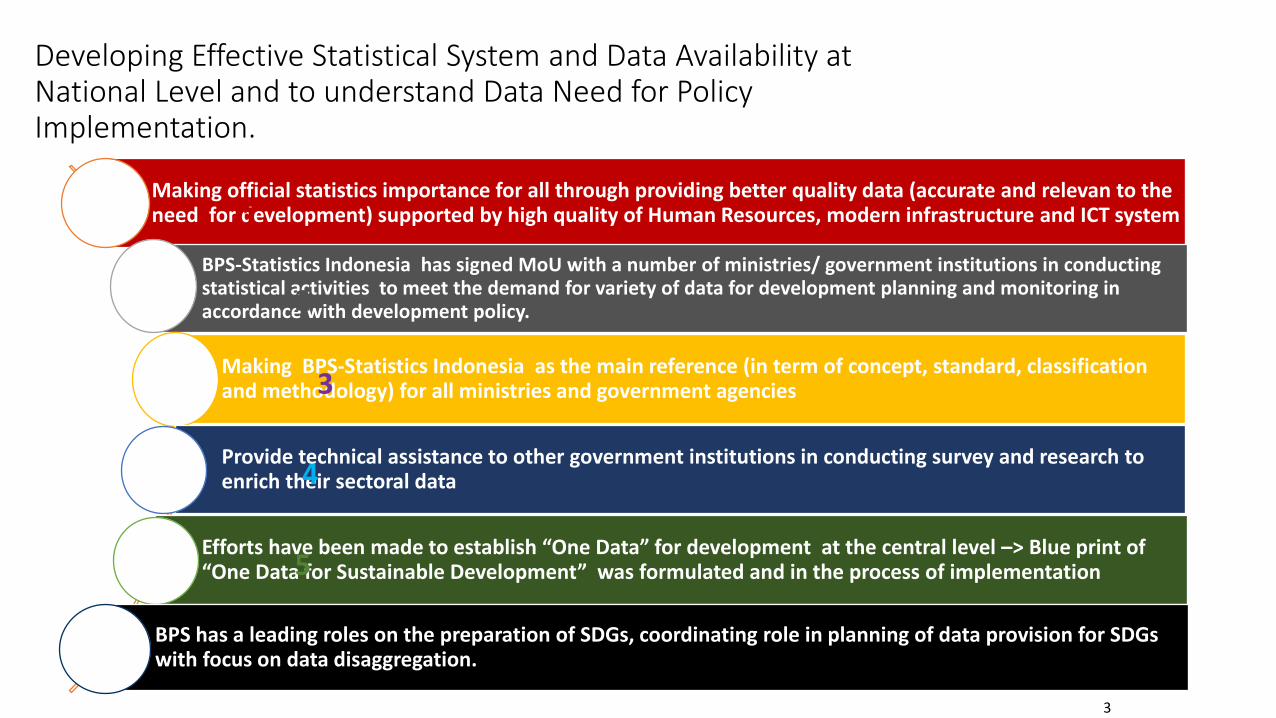
Making official statistics importance for all through providing better quality data (accurate and relevan to the need for development) supported by high quality of Human Resources, modern infrastructure and ICT system
BPS-Statistics Indonesia has signed MoU with a number of ministries/ government institutions in conducting statistical activities to meet the demand for variety of data for development planning and monitoring in accordance with development policy.
Making BPS-Statistics Indonesia as the main reference (in term of concept, standard, classification and methodology) for all ministries and government agencies
Provide technical assistance to other government institutions in conducting survey and research to enrich their sectoral data
Efforts have been made to establish “One Data” for development at the central level –> Blue print of “One Data for Sustainable Development” was formulated and in the process of implementation
BPS has a leading roles on the preparation of SDGs, coordinating role in planning of data provision for SDGs with focus on data disaggregation.
Developing Effective Statistical System and Data Availability at National Level and to understand Data Need for Policy Implementation.
1
2
3
4
5
4
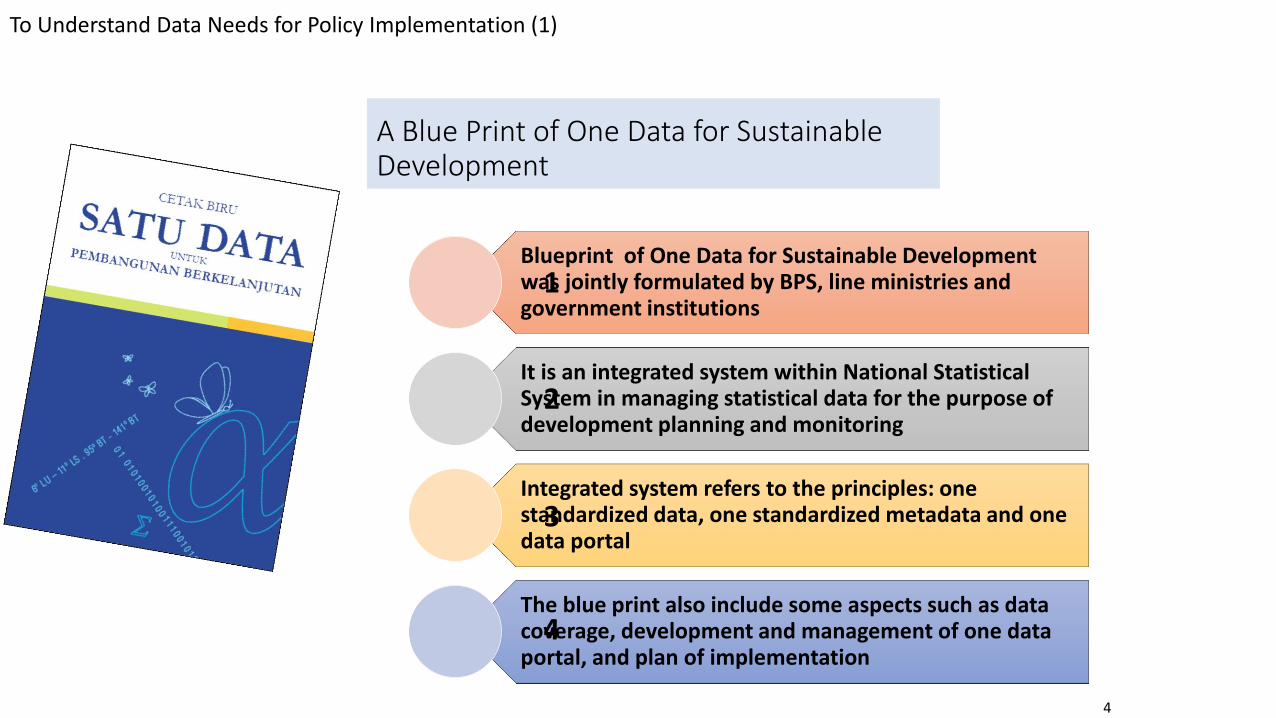
Blueprint of One Data for Sustainable Development was jointly formulated by BPS, line ministries and government institutions
It is an integrated system within National Statistical System in managing statistical data for the purpose of development planning and monitoring
Integrated system refers to the principles: one standardized data, one standardized metadata and one data portal
The blue print also include some aspects such as data coverage, development and management of one data portal, and plan of implementation
A Blue Print of One Data for Sustainable Development
1
2
3
4
To Understand Data Needs for Policy Implementation (1)
5
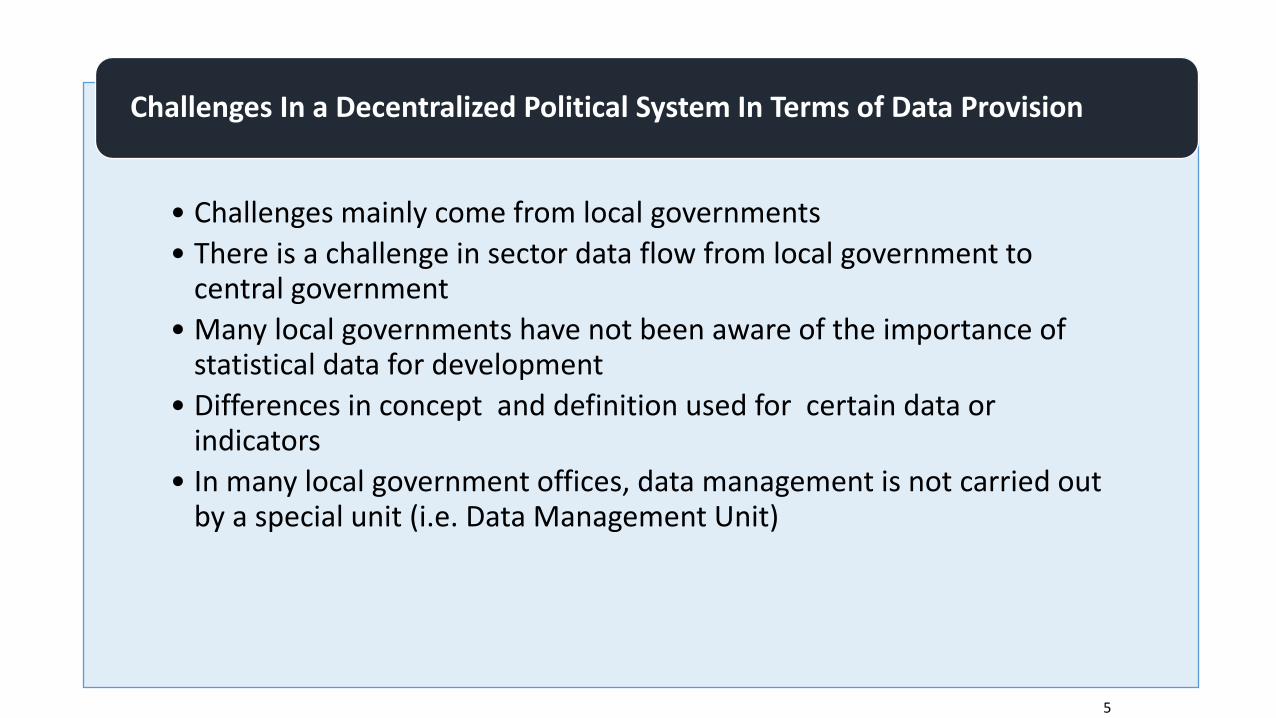
• Challenges mainly come from local governments
• There is a challenge in sector data flow from local government to central government
• Many local governments have not been aware of the importance of statistical data for development
• Differences in concept and definition used for certain data or indicators
• In many local government offices, data management is not carried out by a special unit (i.e. Data Management Unit)
Challenges In a Decentralized Political System In Terms of Data Provision
6
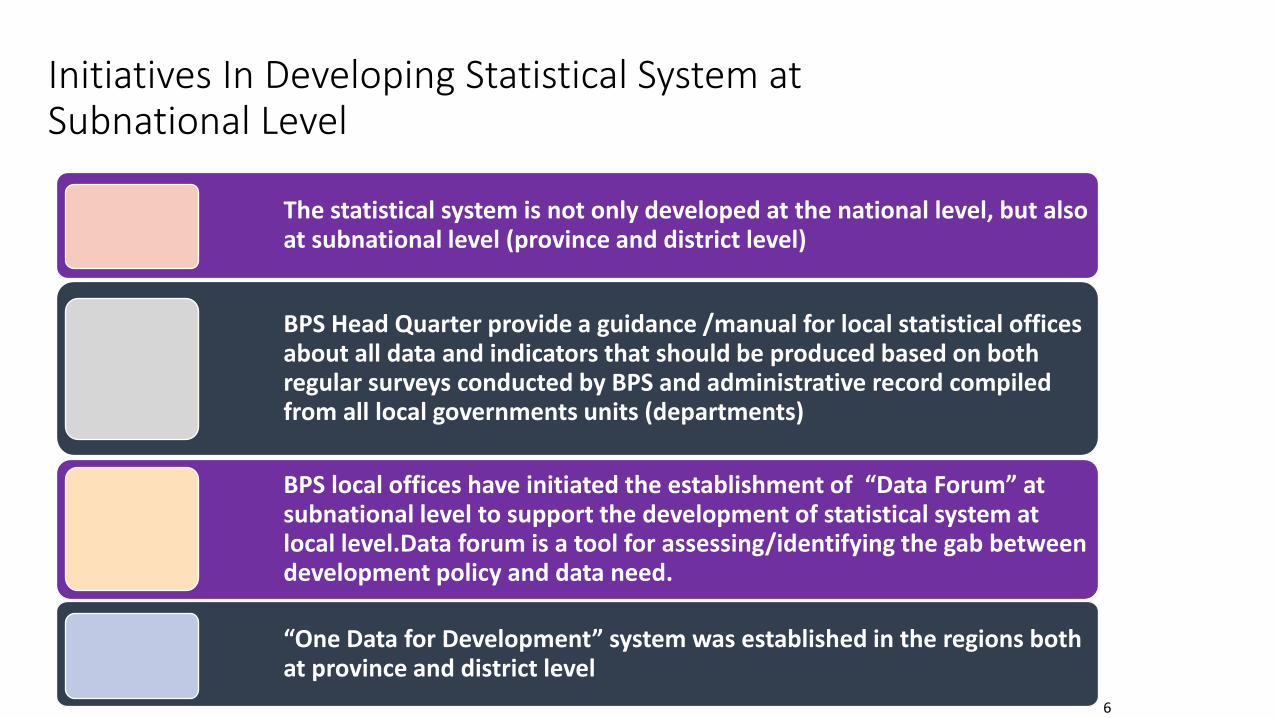
The statistical system is not only developed at the national level, but also at subnational level (province and district level)
BPS Head Quarter provide a guidance /manual for local statistical offices about all data and indicators that should be produced based on both regular surveys conducted by BPS and administrative record compiled from all local governments units (departments)
BPS local offices have initiated the establishment of “Data Forum” at subnational level to support the development of statistical system at local level.Data forum is a tool for assessing/identifying the gab between development policy and data need.
“One Data for Development” system was established in the regions both at province and district level
Initiatives In Developing Statistical System at Subnational Level
7
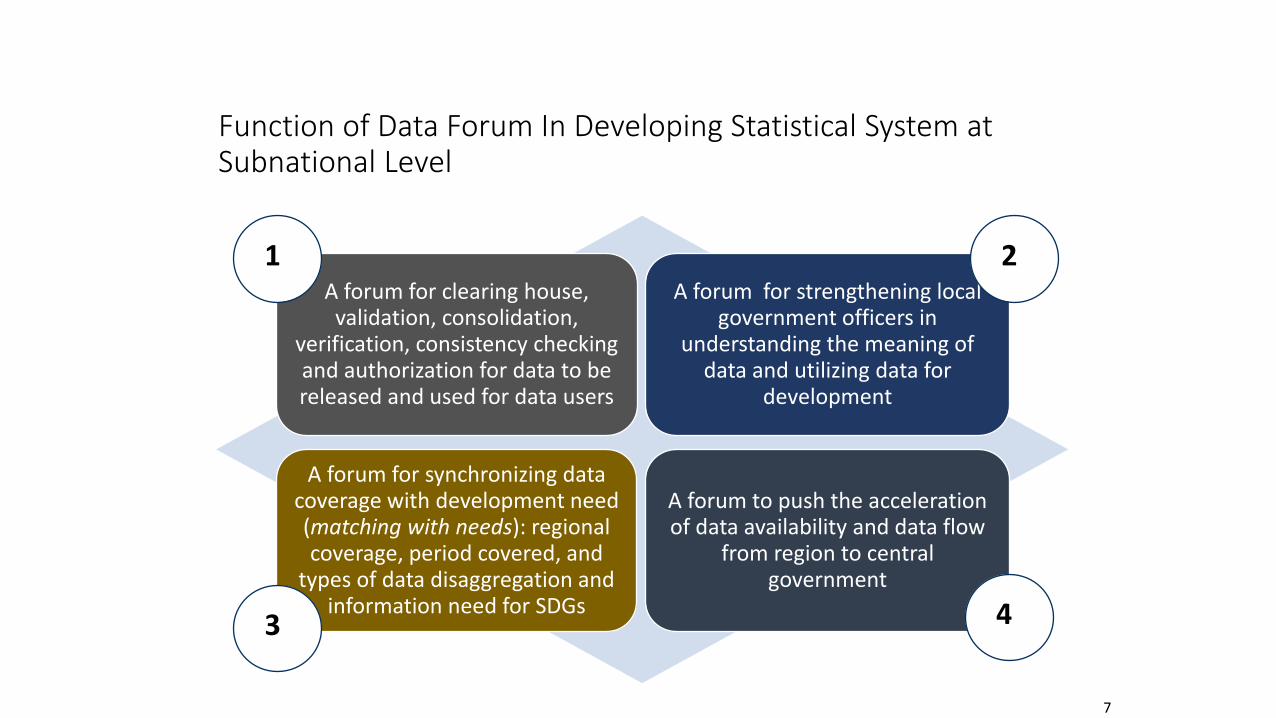
A forum for clearing house, validation, consolidation,
verification, consistency checking and authorization for data to be released and used for data users
A forum for strengthening local government officers in
understanding the meaning of data and utilizing data for
development
A forum for synchronizing data coverage with development need (matching with needs): regional coverage, period covered, and
types of data disaggregation and information need for SDGs
A forum to push the acceleration of data availability and data flow
from region to central government
Function of Data Forum In Developing Statistical System at Subnational Level
1
3
2
4
8
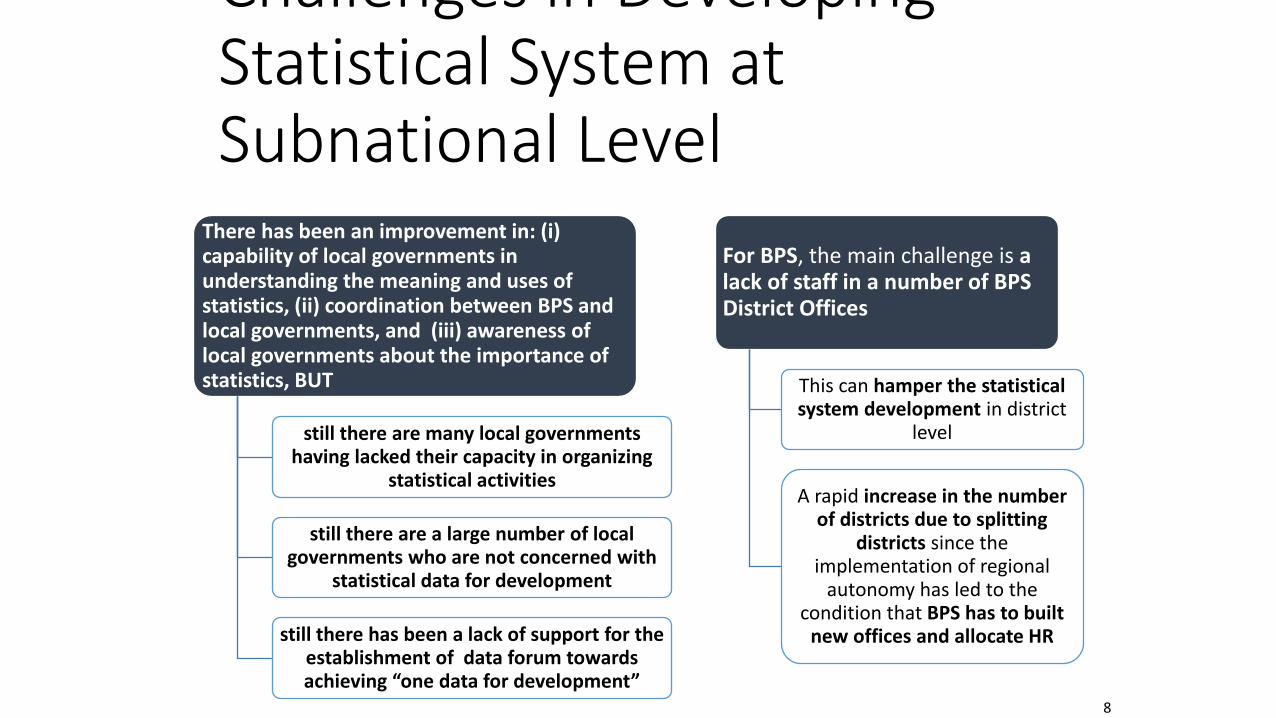
There has been an improvement in: (i) capability of local governments in understanding the meaning and uses of statistics, (ii) coordination between BPS and local governments, and (iii) awareness of local governments about the importance of statistics, BUT
still there are many local governments having lacked their capacity in organizing
statistical activities
still there are a large number of local governments who are not concerned with
statistical data for development
still there has been a lack of support for the establishment of data forum towards achieving “one data for development”
For BPS, the main challenge is a lack of staff in a number of BPS District Offices
This can hamper the statistical system development in district
level
A rapid increase in the number of districts due to splitting
districts since the implementation of regional
autonomy has led to the condition that BPS has to built
new offices and allocate HR
Challenges in Developing Statistical System at Subnational Level
9
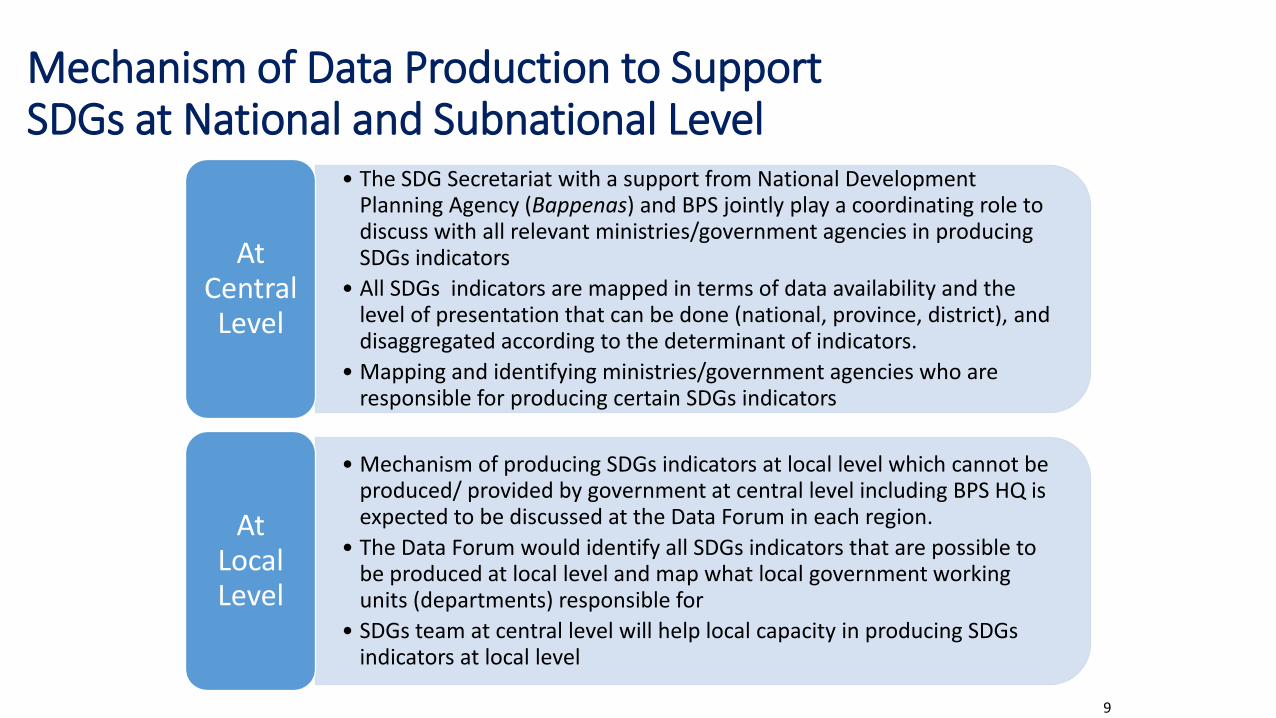
• The SDG Secretariat with a support from National Development Planning Agency (Bappenas) and BPS jointly play a coordinating role to discuss with all relevant ministries/government agencies in producing SDGs indicators
• All SDGs indicators are mapped in terms of data availability and the level of presentation that can be done (national, province, district), and disaggregated according to the determinant of indicators.
• Mapping and identifying ministries/government agencies who are responsible for producing certain SDGs indicators
At Central Level
• Mechanism of producing SDGs indicators at local level which cannot be produced/ provided by government at central level including BPS HQ is expected to be discussed at the Data Forum in each region.
• The Data Forum would identify all SDGs indicators that are possible to be produced at local level and map what local government working units (departments) responsible for
• SDGs team at central level will help local capacity in producing SDGs indicators at local level
At Local Level
Mechanism of Data Production to Support SDGs at National and Subnational Level
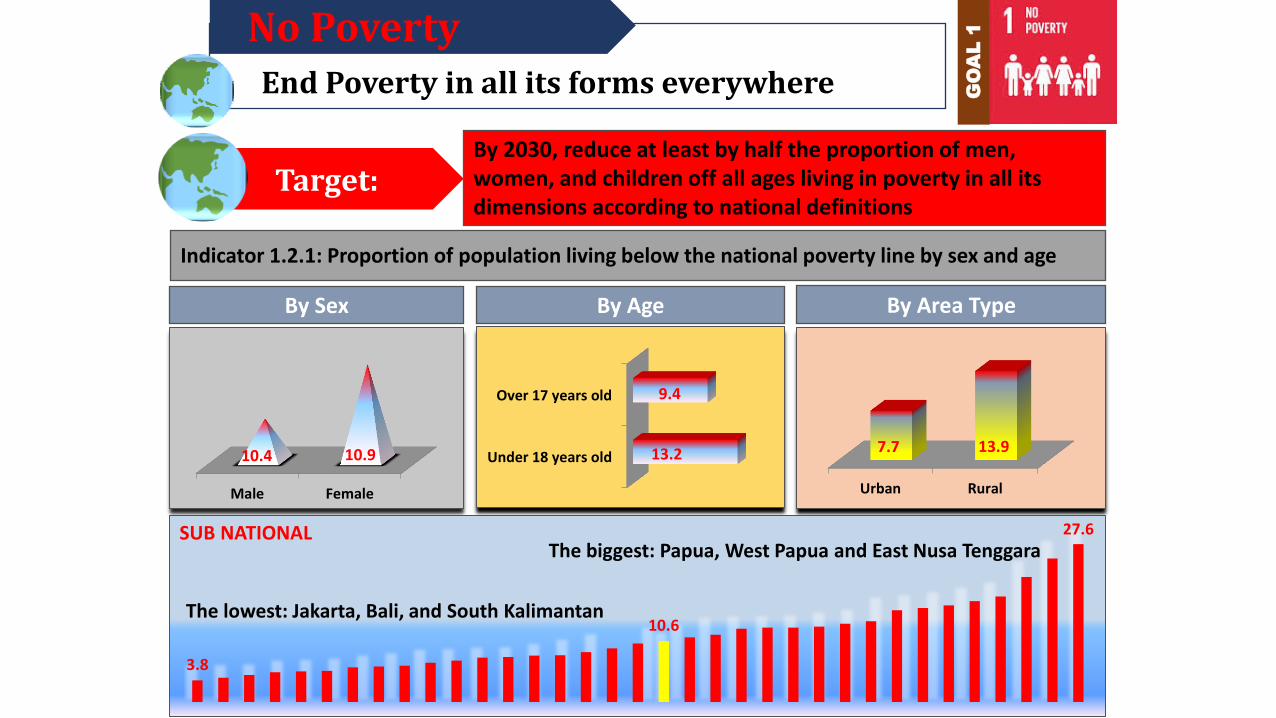
End Poverty in all its forms everywhere
No Poverty
Target:
GO
AL
1
By Sex By Area Type
Indicator 1.2.1: Proportion of population living below the national poverty line by sex and age
By 2030, reduce at least by half the proportion of men, women, and children off all ages living in poverty in all its dimensions according to national definitions
Urban Rural
7.7 13.9
By Age
Male Female
10.4 10.9 Under 18 years old
Over 17 years old
13.2
9.4
3.8
10.6
27.6
The lowest: Jakarta, Bali, and South Kalimantan
The biggest: Papua, West Papua and East Nusa Tenggara SUB NATIONAL
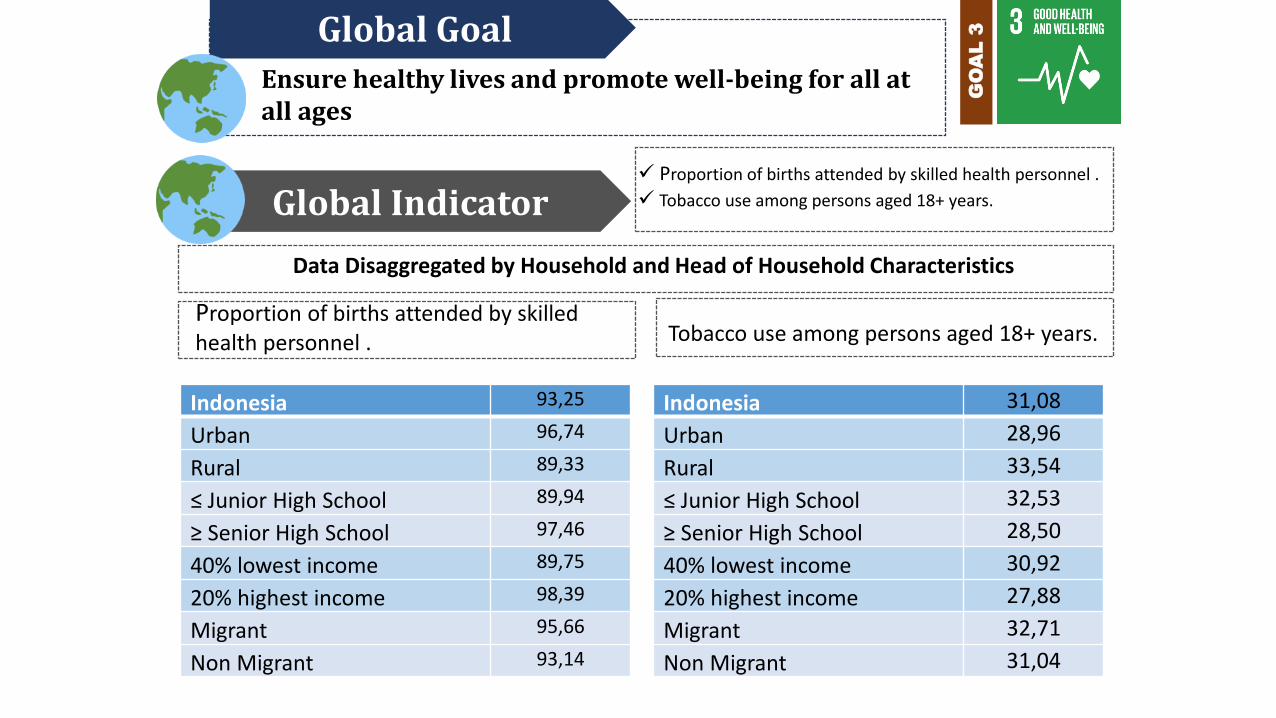
Ensure healthy lives and promote well-being for all at all ages
Global Goal
Global Indicator
GO
AL
3
Proportion of births attended by skilled health personnel .
Tobacco use among persons aged 18+ years.
Proportion of births attended by skilled health personnel .
Data Disaggregated by Household and Head of Household Characteristics
Tobacco use among persons aged 18+ years.
Indonesia 31,08
Urban 28,96
Rural 33,54
≤ Junior High School 32,53
≥ Senior High School 28,50
40% lowest income 30,92
20% highest income 27,88
Migrant 32,71
Non Migrant 31,04
Indonesia 93,25
Urban 96,74
Rural 89,33
≤ Junior High School 89,94
≥ Senior High School 97,46
40% lowest income 89,75
20% highest income 98,39
Migrant 95,66
Non Migrant 93,14
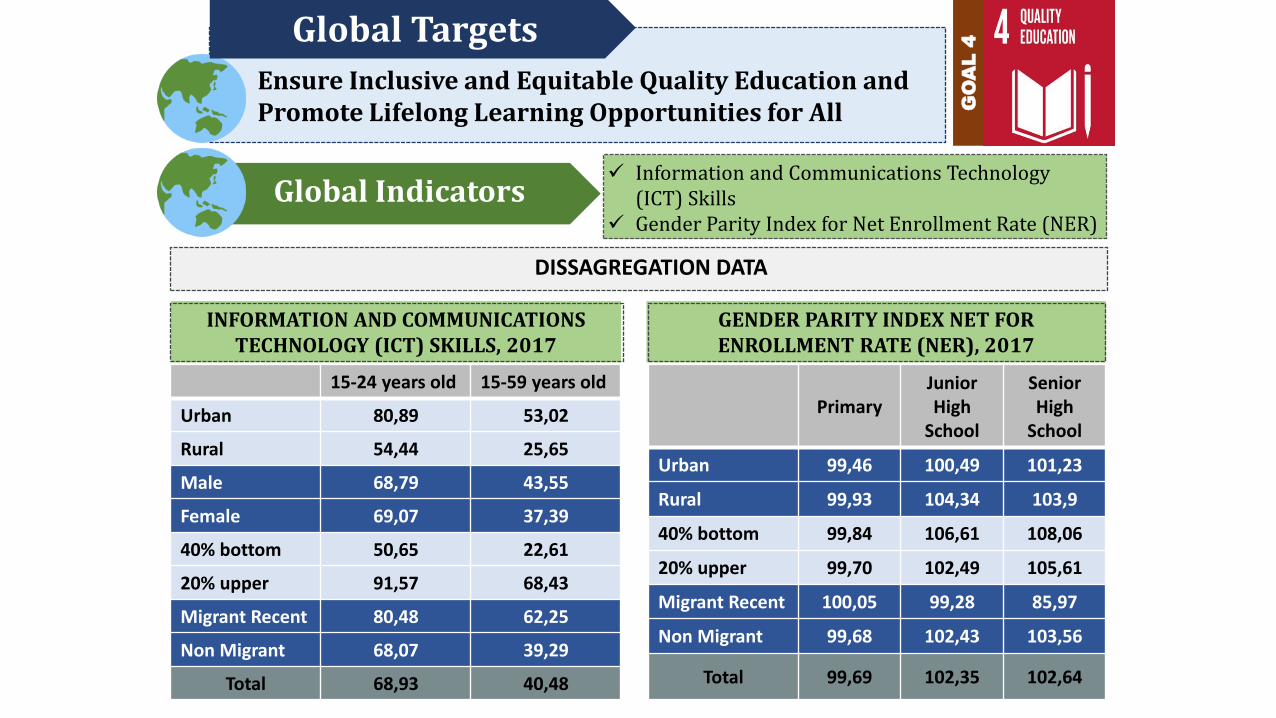
Ensure Inclusive and Equitable Quality Education and Promote Lifelong Learning Opportunities for All
Global Targets
GO
AL
4
Information and Communications Technology (ICT) Skills
Gender Parity Index for Net Enrollment Rate (NER)
INFORMATION AND COMMUNICATIONS TECHNOLOGY (ICT) SKILLS, 2017
GENDER PARITY INDEX NET FOR ENROLLMENT RATE (NER), 2017
DISSAGREGATION DATA
Global Indicators
15-24 years old 15-59 years old
Urban 80,89 53,02
Rural 54,44 25,65
Male 68,79 43,55
Female 69,07 37,39
40% bottom 50,65 22,61
20% upper 91,57 68,43
Migrant Recent 80,48 62,25
Non Migrant 68,07 39,29
Total 68,93 40,48
Primary Junior High
School
Senior High
School
Urban 99,46 100,49 101,23
Rural 99,93 104,34 103,9
40% bottom 99,84 106,61 108,06
20% upper 99,70 102,49 105,61
Migrant Recent 100,05 99,28 85,97
Non Migrant 99,68 102,43 103,56
Total 99,69 102,35 102,64
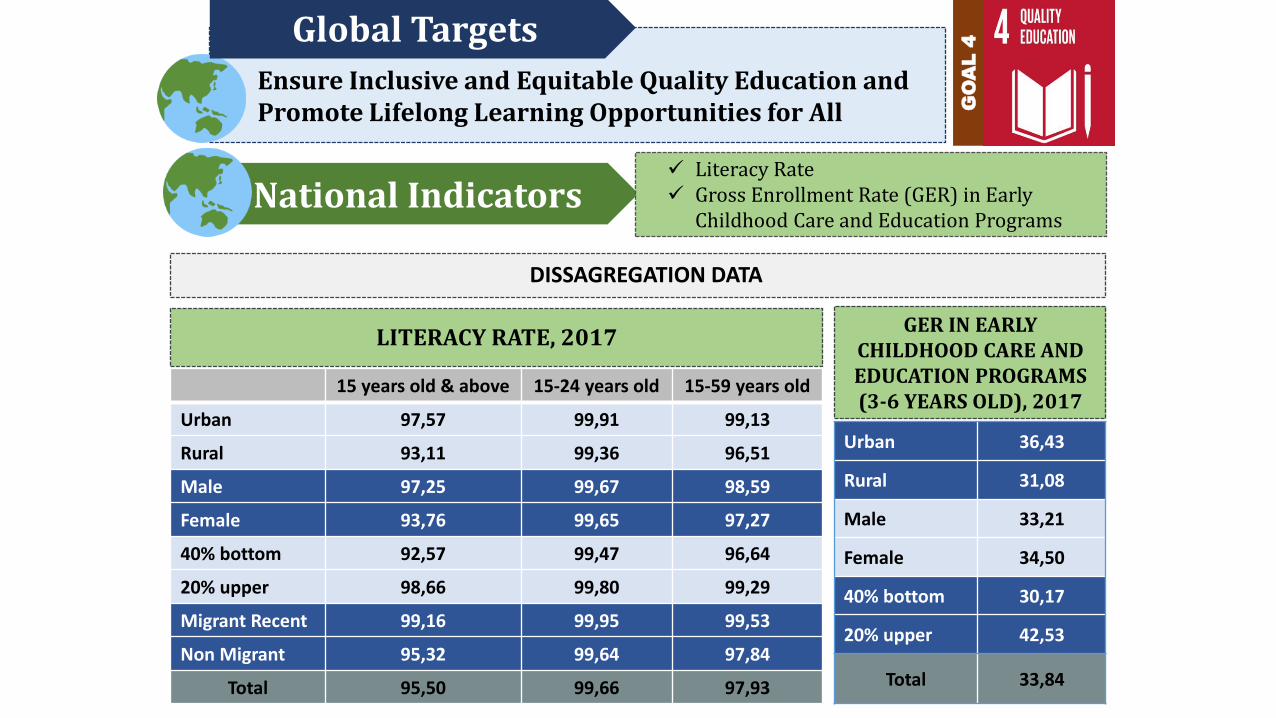
Ensure Inclusive and Equitable Quality Education and Promote Lifelong Learning Opportunities for All
Global Targets
National Indicators
GO
AL
4
Literacy Rate Gross Enrollment Rate (GER) in Early
Childhood Care and Education Programs
LITERACY RATE, 2017 GER IN EARLY
CHILDHOOD CARE AND EDUCATION PROGRAMS (3-6 YEARS OLD), 2017
DISSAGREGATION DATA
15 years old & above 15-24 years old 15-59 years old
Urban 97,57 99,91 99,13
Rural 93,11 99,36 96,51
Male 97,25 99,67 98,59
Female 93,76 99,65 97,27
40% bottom 92,57 99,47 96,64
20% upper 98,66 99,80 99,29
Migrant Recent 99,16 99,95 99,53
Non Migrant 95,32 99,64 97,84
Total 95,50 99,66 97,93
Urban 36,43
Rural 31,08
Male 33,21
Female 34,50
40% bottom 30,17
20% upper 42,53
Total 33,84
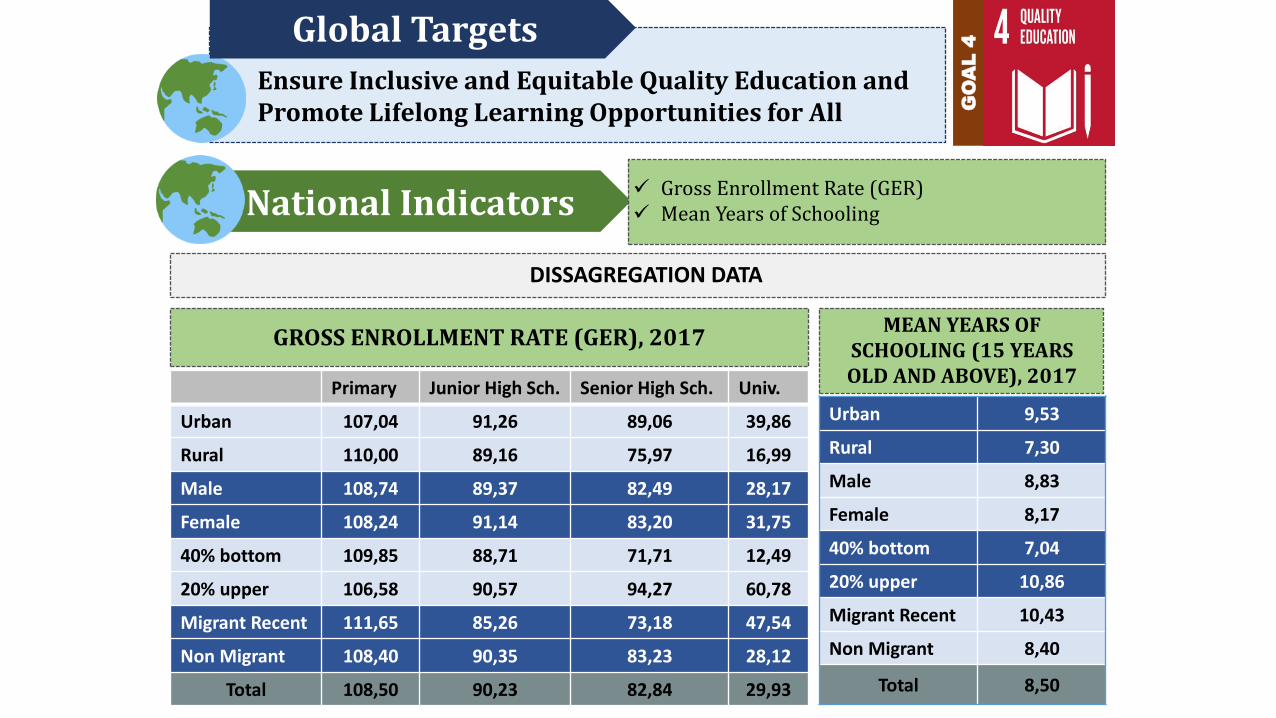
Ensure Inclusive and Equitable Quality Education and Promote Lifelong Learning Opportunities for All
Global Targets
National Indicators
GO
AL
4
Gross Enrollment Rate (GER) Mean Years of Schooling
GROSS ENROLLMENT RATE (GER), 2017 MEAN YEARS OF
SCHOOLING (15 YEARS OLD AND ABOVE), 2017
DISSAGREGATION DATA
Primary Junior High Sch. Senior High Sch. Univ.
Urban 107,04 91,26 89,06 39,86
Rural 110,00 89,16 75,97 16,99
Male 108,74 89,37 82,49 28,17
Female 108,24 91,14 83,20 31,75
40% bottom 109,85 88,71 71,71 12,49
20% upper 106,58 90,57 94,27 60,78
Migrant Recent 111,65 85,26 73,18 47,54
Non Migrant 108,40 90,35 83,23 28,12
Total 108,50 90,23 82,84 29,93
Urban 9,53
Rural 7,30
Male 8,83
Female 8,17
40% bottom 7,04
20% upper 10,86
Migrant Recent 10,43
Non Migrant 8,40
Total 8,50
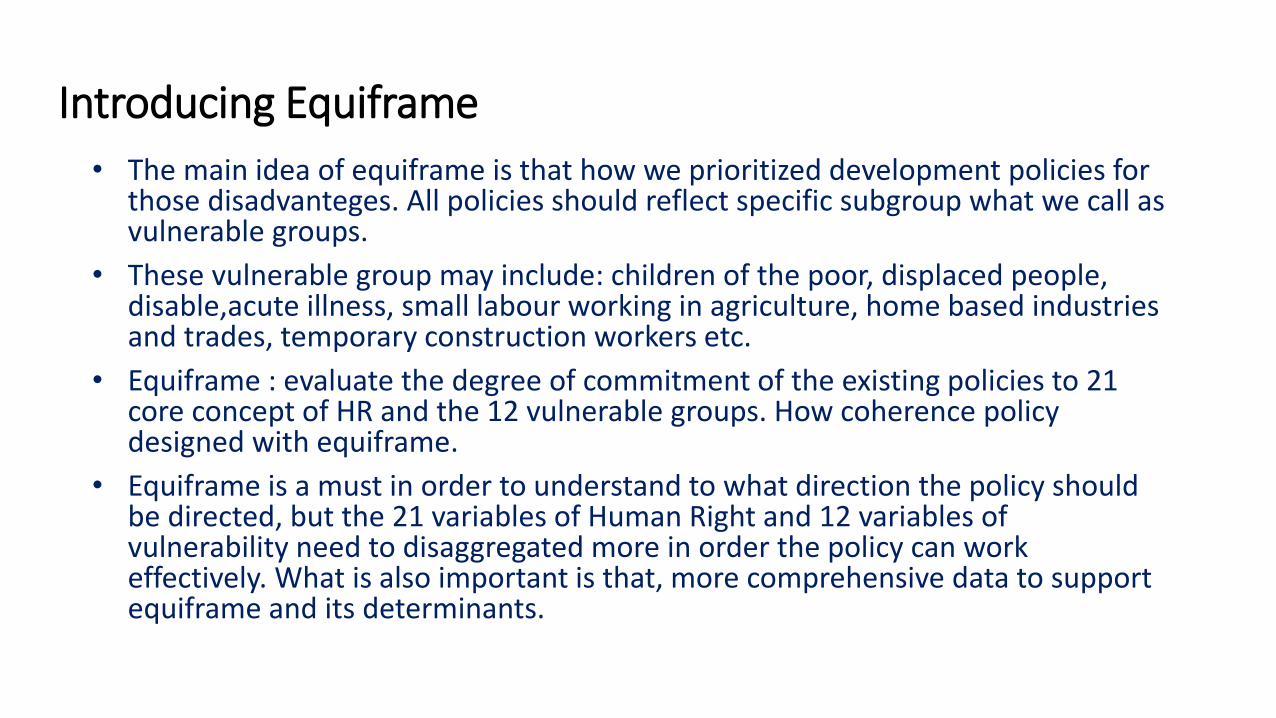
Introducing Equiframe
• The main idea of equiframe is that how we prioritized development policies for those disadvanteges. All policies should reflect specific subgroup what we call as vulnerable groups.
• These vulnerable group may include: children of the poor, displaced people, disable,acute illness, small labour working in agriculture, home based industries and trades, temporary construction workers etc.
• Equiframe : evaluate the degree of commitment of the existing policies to 21 core concept of HR and the 12 vulnerable groups. How coherence policy designed with equiframe.
• Equiframe is a must in order to understand to what direction the policy should be directed, but the 21 variables of Human Right and 12 variables of vulnerability need to disaggregated more in order the policy can work effectively. What is also important is that, more comprehensive data to support equiframe and its determinants.
Thank You M.Sairi Hasbullah
Deputy Chief Statistician for Social Statistics BPS-Statistics Indonesia
Workshop “Understanding Data Needs for Inclusive Development” UNESCAP, Bangkok 28-30 November 2017


![STRUCTURAL AND BIOLOGICAL STUDIES OF SOME CALIX[4]RESORCINARENE BOHARI M YAMIN HAMZAM ABODISAYA AISHAH HASBULLAH JUMINA](https://img.pdfslide.us/doc/110x75/551aa881550346e0158b5d9f/structural-and-biological-studies-of-some-calix4resorcinarene-bohari-m-yamin-hamzam-abodisaya-aishah-hasbullah-jumina.jpg)