Embed Size (px)
Citation preview

Working paper
Environmental policy, river pollution, and infant health
Evidence from Mehta vs. Union of India
Quy-Toan Do Shareen Joshi Samuel Stolper
February 2016
Environmental Policy, River Pollution, and Infant Health:
Evidence from Mehta vs. Union of India∗
Quy-Toan Do
World Bank
Shareen Joshi
Georgetown University
Samuel Stolper
Harvard University
February 19, 2016
Abstract
India’s rivers are heavily polluted. One of the more polluted sites is the city of Kanpur, on the
banks of the river Ganga (or Ganges). The river receives large amounts of toxic waste from the
city’s domestic and industrial sectors, particularly the tannery industry. We study the impact of a
landmark piece of judically mandated environmental legislation in this city. In September 1987, the
Supreme Court of India ordered the tanneries of Kanpur to either clean their waste or shut down.
We explore the mortality burden of this ruling in Kanpur district as well as districts downstream,
and find a significant drop in both river pollution (as measured by Biochemical Oxygen Demand)
and health risk (as measured by infant mortality). We also explore the channels that drive these
policy impact and cannot reject that the drop in pollution levels following the Supreme Court
decision accounted for the entire observed effect on infant mortality.
Keywords: Pollution, neonatal mortality, biochemical oxygen demand.
JEL Codes: Q53, Q56
∗We are grateful to Prashant Bharadwaj, Jishnu Das, Garance Genicot, Susan Godlonton, Rema Hanna, HananJacoby, Remi Jadwab, Guido Kuersteiner, Samik Lall, Arik Levinson, Rohini Pande, Martin Rama, Martin Ravallion,John Rust, Simone Schaner, George Shambaugh, Shinsuke Tanaka, and Jennifer Tobin for useful comments. Manythanks to Mr Mehta for helpful discussions. The findings, interpretations, and conclusions expressed in this work do notnecessarily reflect the views of the World Bank, its Board of Executive Directors, or the governments they represent.
1
1 Introduction
River pollution is a growing problem. In developing countries, as much as 70 percent of industrial waste
and 80 percent of domestic waste is said to flow untreated into rivers (World Water Development Report
2012). Direct exposure to untreated water is blamed for a variety of health risks: infections, chronic
illnesses, reproductive issues and premature mortality of children who live on the river banks. Indirect
exposure through contaminated food chains and groundwater imparts a health risk even at substantial
distances from the site of pollution (World Health Organization 2008a and 2008b). In the case of
rivers, pollution’s impact can be particularly severe: polluted water generally flows downward to a
continuum of downstream communities, creating a trail of ecological degradation and toxicity (Oates
2001, Lipscomb and Mobarak 2007).
This paper examines these issues in the context of India, where the issue of water pollution is
increasingly regarded as a crisis. According to the latest estimates, more than half of India’s rivers
and other surface water bodies are now significantly polluted (CPCB 2015 as reported in Daily Mail
April 15 2015). The issue is particularly salient for the largest and holiest river, the Ganges (or
Ganga), which routinely hosts some of the largest bathing rituals in the world and has experienced
a significant reduction in water flow as well as a rise in pollution levels over the past two decades.
The current Prime Minister, Narendra Modi, made the cleaning of this river a major electoral promise
when he campaigned from the riverside pilgrimage city of Varanasi. Within a month of being in office,
the government announced “Namami Ganga,” (Sanskrit for “Respect for the Ganges”), an Integrated
Ganges Development Project that received funding of US$334 million and promised a clean Ganges in
three years. The Modi administration has recently launched the "Ganga River Basin Management Plan
— 2015", featuring a comprehensive action plan for cleaning the river in the short term (three years),
medium term (five years), and long term (ten years and beyond).1 There is also strong international
support for such initiatives. Since 2011, the World Bank has spent more than $1 billion on the
National Ganga River Basin Project to help the National Ganga River Basin Authority (NGRBA)
build institutional capacity for cleaning the river.2
These ambitious actions, and many others across the developing world, assume that policy can
be an effective tool in reducing pollution. But examples of impactful policies are hard to come by.
But much of the evidence on the impact of legislation comes from developed countries, where the
major interventions were in the distant past. Alsan and Goldin (2015) for example, find that the1The document is not released to the public, but the content was widely reported across the Indian media in the
week of May 9th, 2015. The report was prepared by the IITC, a cluster of seven IITs (Bombay, Delhi, Madras,Kanpur, Kharagpur, Guwahati and Roorkee) and the plan was released at a conference in early May from the OvalObserver Foundation. Some details of the documents recommendations are summarized on the foundation’s website(http://ovalobserver.org/Event/economic-financial-instruments-restoration-ganga/), accesssed on May 12th, 2015.
2http://www.worldbank.org/en/news/feature/2015/03/23/india-the-national-ganga-river-basin-project, Accessed onMay 12th, 2015.
2

establishment of water and sewage systems around Bostin can explain about 37 percent of the decline
in infant mortality between 1880 and 1915. In the high pollution context of developing countries today,
environmental policies are often poorly designed, feature numerous loopholes, and are loosely enforced.
Greenstone and Hanna (2014), for example, find no statistically significant impact of India’s flagship
river pollution control program – the National River Conservation Plan – on surface water quality in
India.
Even when environmental policies are effective, it is often difficult to identify the specific mecha-
nisms that are at work in generating the impacts. Much environmental regulation is motivated at least
in part by the desire to improve public health, but when such improvements are achieved, is it be-
cause of better environmental quality, or because of a change in the behavior of the target population?
Policy implementation often raises awareness of environmental problems, either explicitly through
informational and educational programs or implicitly through the media and the myriad observable
changes produced by the policy. Assessment of policy impacts typically measures the combined effect
of environmental policy on health.
In this research, we directly target these outstanding questions about pollution policy. We study
a unique and historically-important policy intervention: Supreme Court rulings sparked by the pio-
neering environmental public-interest litigation in India. The lack of precedent for and quasi-random
geographic incidence of these rulings - which targeted the highly-polluting tanning industry of Kan-
pur, India - facilitate a difference-in-difference analysis of policy impacts. We find that the Supreme
Court verdicts produced a significant drop in both river pollution (as measured by Biochemical Oxygen
Demand) and health risk (as measured by infant mortality). This provides evidence that bottom-up
regulation with local (as opposed to national) geographic scope can produce desirable environmental
and health outcomes. It further contributes to a growing body of research findings on environmental
policy impacts in the developing world (such as those of Galiani et al. 2004, Almond et al. 2009, and
Greenstone and Hanna 2014).
Armed with this finding, we then shift our focus to the mechanisms of policy impact. While the
Supreme Court verdict unquestionably targeted river pollution and was motivated by evidence of health
concerns, the link between the two may be driven by other factors. The salience of the ruling may
have improved citizen information about both pollution and health, and encouraged them to change
behaviors. This is particularly an issue in the Ganga Basin, where informational campaigns were part
of the policy response. Another channel is economic. Furthermore, there was significant concern about
the economic impacts of regulation on an industry that was such a major source of employment and
wealth in Kanpur. To shed light on the relative importance of the pollution channel - as opposed to
income, behavioral, and other channels - in policy impacts, we construct two instruments for river
3

pollution. The first is upstream river pollution, which we argue is a valid instrument conditional
our controls and fixed effects. The second is the Kanpur policy itself, which we do not argue to be
necessarily valid because it affects pollution at the same time as it affects wages and information (among
other possible determinants of health). We compare results of two separate instrumental variables (IV)
regressions of infant mortality on river pollution: one in which we use only the upstream pollution
instrument; and one in which we additionally use the Kanpur policy instrument. Our intuition is
that the former regression captures the direct effect of river pollution on infant mortality; therefore,
if the Kanpur policy’s mortality impacts came predominantly through the pollution channel, then its
inclusion as a second instrument should not alter our estimates of the pollution-mortality relationship.
We propose a basic model of health that motivates a direct comparison of the coefficients generated
by these two IV regressions. Because we have two potential instruments and one endogenous regressor,
the Sargan-Hansen test of overidentification restrictions provides a statistical “test of mechanisms”.
We find high p-values for the Sargan-Hansen test statistic in most cases, which suggests that the
Kanpur policy did indeed reduce infant mortality primarily by reducing river pollution. This result
speaks directly to a common uncertainty about whether targeting pollution reduction is valuable when
informational campaigns and incentives for avoidance behavior are viable alternatives.
Our estimate of the BOD-infant mortality dose-response function represents another data point
in the literature on pollution and health in developing countries. In Bangladesh, Field, Glennerster,
and Hussam (2013) show that switching to wells contaminated by domestic pollution has driven infant
mortality upwards. In India, Brainerd and Menon (2014) show that agricultural water pollution is
associated with increases in infant mortality. Our own work shows that industrial water pollution
is another contributor to infant health risk. Furthermore, our work takes the pollution spillovers
literature one step forward, by connecting these spillovers to measurable health impacts for the first
time.
The remainder of this paper is organized as follows. Section 2 provides an overview of the context
of our study, particularly river pollution and environmental legislation in India. It also describes the
specific type of environmental regulation we examine here, rulings from India’s judicial system in the
aftermath of public interest litigation. Section 3 describes our model, including the key equations
we seek to estimate. Section 4 describes the various sources of data. Section 5 provides empirical
results from both reduced form and instrumental variable estimation strategies. Section 6 provides a
discussion of the results. Section 7 concludes.
4
2 Context
2.1 Rivers and River Pollution
More than a century’s of epidemiology research has established a strong link between water pollution
and human health. The early seminal work of John Snow (1854) connected the Broad Street cholera
outbreak in London to fecal bacteria leaking from the sewage system. Epidemiology research (see e.g.
Fewtrell and Bartram 2001) has subsequently advanced to produce evidence linking water pollution to a
host of pathogens (e.g. E. coli, rotavirus) and illnesses (cholera, diarrhea, etc.). Furthermore, drinking
is not the only way to get contaminated; Cifuentes et al. (2000) identify irrigation to be a link between
water pollution and health, while Carr (2001) highlights bathing, food, and person-to-person contact
as modes of transmission of diseases from polluted water. More recently, the link between heightened
river pollution and morbidity and mortality has been documented in both China and India. Ebenstein
(2010) finds that a one-grade deterioration in Chinese river water quality is associated with a 9.7
percent increase in the incidence of digestive cancer. Brainerd and Menon (2011), meanwhile, find
that a 10-percent increase in agrichemical levels in Indian rivers during the month of conception is
associated with an 11-percent increase in one-year mortality.
In addition to human and agricultural waste, industrial pollution of rivers has been the by-product
of rapid economic growth and industrialization in some parts of the developing world. Small-scale
factories, such as textile dyeing, pulp and paper, pharmaceuticals, leather tanning, lead battery, or
metal smelting to name a few, tend to produce a large amount of waste that contains highly toxic
or hazardous substances like chromium, mercury, lead, and cyanide. When untreated, these pollute
rivers, streams, lakes, soil, and also groundwater resources (ILO 2011). In Shanghai for example, 3.4
million cubic metres of industrial and domestic waste pour into Suzhou creek and Huangpu river, which
flow through the heart of the city. Because of serious pollution, the river and creek have essentially
become devoid of life and are blamed for high rates of cancer as well as other chronic illnesses in the
surrounding area (ILO 2011).
In India, the direct health risks of poor river water quality are compounded by both the cultural
importance of rivers and the country’s reliance on rivers not just for drinking water, but also for
transportation and irrigation. Rivers have played a critical role in shaping India’s economy, society,
culture and religion for more than 5,000 years. Seven major rivers, along with their many tributaries,
provide potable water, cheap transportation, agricultural livelihoods, and spiritual anchors to India’s
population of 1.3 billion people. The most significant is the Ganga, or Ganges. Worshipped as a
goddess by Hindus worldwide, it flows more than 2,200 kilometers through eight Indian states. Its
basin holds 47 percent of India’s irrigated land and feeds 500 million people (Hollick 2008; Government
5
of India 2009).
In the aftermath of several decades of population and industrial growth, India’s rivers are heavily
polluted (United Nations 2013). The results of water quality monitoring carried out by India’s Central
Pollution Control Board (CPCB) for the indicator Biological Oxygen Demand (BOD)—which measures
organic pollution (see Section 4 for further discussion)—suggests that water at approximately half of all
sampling stations did not meet the threshold of acceptability for bathing (BOD below 3); the number
of sampling stations exhibiting unacceptable levels of pollution (BOD above 5) has increased since
1995 (Rajaram and Das 2008; CPCB 2014). The pollution challenge has been growing over time: the
number of rivers classified as “polluted” (BOD above 3) has more than doubled in the last five years,
from 121 to 275, and the number of polluted river stretches, which are defined as having BOD levels
in excess of 3, has also doubled from 150 in 2009 to 302 currently (CPCB, 2015, as reported in Daily
Mail, 2015). Indeed, only 160 out of nearly 8,000 towns have sewerage systems and treatment plants
(CPCB 2013). As a consequence, exposure to contaminated water can be high in the basins of rivers.
High levels of population density along the banks of the river, coupled with the ritual significance
of bathing in the river, increases individuals’ exposure to river water. Two million people are said
to bathe in the Ganga river each day, and 60,000 in Varanasi alone (Hamner et al. 2013). Religious
festivals frequently occur on the banks of rivers. At the Kumbh Mela, which rotates between Haridwar,
Allahabad, Ujjain, and Nashik, more than 100 million people can bathe in a river within a single month
(Illiyas 2013). A growing number of studies document a relationship between pollution and health,
particularly along the Ganga and its tributaries. Pandey et al. (2005) found that high concentration
of nitrate, chloride and fecal coliforms in the city of Varanasi are associated with the prevalence of
enteric diseases. Even in the case of treated water, improperly maintained pipes and seepage into the
piped water system introduce contamination (Pandey et al. 2005). Several studies have attempted
to estimate the various impacts of industrial pollution and sewage on human health, agriculture and
livestock and other sectors of the economy (Shankar 2001, Dasgupta 2001, Reddy and Behera 2006).
2.2 Water Pollution Policies
The harms associated with water pollution, in India and the world over, have spawned a great many
policies targeting water quality, water access, and sanitation. Researchers have, in turn, used many of
these policies as natural experiments in environmental regulation. In recent years, program evaluation
has linked various public health initiatives – such as water filtration and chlorination (Cutler and
Miller, 2005), piped water access (Gamper-Rabindran et al., 2010), spring protection (Kremer et al
2011), deep-water tube wells (Field et al., 2011), privatization of water provision (Galiani et al., 2005),
and sanitation projects (Watson 2006, and Spears 2013) – to infant health impacts.
6
In India, there is little evidence that water quality interventions have been successful. The most
salient government effort to reduce river pollution is the National River Conservation Plan (NRCP), a
national, top-down program targeting domestic pollution into India’s surface waters. NRCP began in
1985 as the Ganga Action Plan but has expanded over thirty years to now cover 190 towns in 41 rivers
across India. Its goal since 1987 has been to restore the Ganga River to the “Bathing Class” standard,
as defined by India’s “Designated Best Use” (DBU) classification system (see Appendix Table 1 for
the full rubric). The primary lever for achieving this goal has been the “interception, diversion, and
treatment” of sewage (Government of India 2003); to that end, 4,704 million-liters per day of sewage
treatment capacity have been created since its inception (Ministry of Environment and Forests [MoEF],
2013)3. Despite all of this, the popular media has panned NRCP for reasons such as poor inter-agency
cooperation, funding imbalances across sites, and inability to keep pace with growing sewage loads
(Suresh 2007). Confirming public opinion priors, Greenstone and Hanna (2014) find no discernible
impact of NRCP on water quality levels.
The executive branch, however, is not the only source of environmental regulation in India; the
Indian judiciary has, through the years, developed a reputation for environmental activism. Article
21 of the Indian Constitution provides citizens with the “Right to Life”, and much jurisprudence has
centered on the protection of this constitutional right. In the famous case "Subash Kumar versus the
state of Bihar", the Supreme Court invoked the Water Act of 1974 together with Article 21 of the
Constitution to rule in favor of the citizen who accused a major industrial plant of polluting the waters
of the local river (Murlidhar 2006). In this judicial ruling, as well as the ruling on which we focus in
this paper, the Supreme Court repeatedly stated that the Government of India has a responsibility to
protect the environment.
2.3 Mehta vs. Union of India
Just as the Ganga Action Plan was ushering in ambitious interventions by the executive branch to
reduce domestic river pollution, the groundwork was being laid for judicial-branch action to reduce
industrial river pollution. The story of Supreme Court involvement in river pollution began in the
pilgrimage city of Hardwar along the Ganga River; a matchstick tossed by a smoker resulted in the river
catching on fire for more than 30 hours due to a toxic layer of chemicals produced by a pharmaceutical
firm (Mehta 2001). In response to this event, environmental lawyer and social activist M.C. Mehta
filed a writ petition in the Supreme Court of India charging that government authorities had not taken
effective steps to prevent environmental pollution in the Ganga’s waters. The scale of the case, the
whole 2,500-km stretch of the river, proved to be intractable. The court requested Mr. Mehta to3Improvements to riverside bathing ghats, crematoria, toilets have also been a part of NRCP interventions (MoEF
2013)
7

narrow his focus; he chose the city of Kanpur.
Kanpur is a city of 2.9 million people lying directly on the Ganga River in Uttar Pradesh state (see
Figure 1). For more than 100 years, Kanpur has been a major center for India’s tannery industry. Most
of the tanneries are located in the neighborhood of Jajmau, which lies outside the main city on the
southern bank of the river Ganges. Leather is a highly polluting industry. The processes of washing,
liming, fleshing, tanning, splitting and finishing involve a large number of chemicals (Cheremisinoff
2001).4 Tannery effluent is generally characterized by its strong color (reddish dull brown), high BOD,
high pH, and high dissolved solids. It also contains highly toxic chemicals like sulphide and chromium.
In Jajmau, the reddish colored effluent, complete with chemicals, are routinely discharged from the
tanneries directly into the river, rendering both river water and ground water unfit for drinking,
irrigation, and general consumption (Beg and Ali 2008, Tewari Dubey, and Singh 2012). During
the period of increased economic growth in the 1980s, pollution in Kanpur increased significantly as
a result of many factors: increased diversion of the Ganga’s upstream waters to meet the growing
demand for power, increased municipal waste in the city of Kanpur and increased pollution from the
cluster of leather tanneries as they kept up with rising demand. Though Kanpur is relatively unique in
its concentration of tanneries, the story of growing economic activity, growing demand for electricity,
and growing pollution is actually common to most cities in the Ganga Basin, as well as other rivers of
India.
Mehta selected Kanpur although he was not from Kanpur and had not lived in Kanpur. “It was
in the middle of the Ganga basin, the reddish color of the pollution made the pollution highly salient,
and the city seemed representative of many other cities in the Ganga basin” (Mehta 2014). In his
petition, Mr. Mehta named eighty-nine respondents; among them were seventy-five tanneries of the
Jajmau district of the city, the Union of India, the Chair of the Central Pollution Control Board, the
Chair of the Uttar Pradesh Pollution Control Board, and the Indian Standards Institute (Singh, G.
1995:88). The petition also claimed that the Municipal Corporation of Kanpur was not fulfilling its
responsibilities. The court subsequently bifurcated the petition into two parts. The first dealt with
the tanneries of Kanpur and the second with the Municipal Corporation. These are now called Mehta
I and Mehta II in legislative digests, and became the "Ganga Pollution Cases" and the most significant
water pollution litigation in the Indian court system. By October 1987, the Court had invoked the
Water Act and Environment (Protection) Act as well as Article 21 of the Indian constitution to rule
in Mr. Mehta’s favor and ordered the tanneries of Jajmau to clean their wastewater within six months
or shut down entirely. This was followed by a January 1988 judgment that required the Kanpur local4One ton of hide generally leads to the production of 20 to 80 m3of turbid and foul-smelling wastewater, including
chromium levels of 100–400 mg/l, sulfide levels of 200–800 mg/l and high levels of fat and other solid wastes, as well asnotable pathogen contamination. Pesticides are also often added for hide conservation during transport. (Cheremisinoff2001).
8
municipal bodies to take several immediate measures to control water pollution: the relocation of
80,000 cattle housed in dairies or the safe removal of animal waste from these locations; the cleaning
of the city’s sewers; the building of larger sewer systems; the construction of public latrines; and an
immediate ban on the disposal of corpses into the river. The court also required all schools to devote
one hour each week to environmental education and awareness.
3 Econometric Model
Our econometric model exploits the 1987 Supreme Court decision ruling in favor of Mr. Mehta. Since
public interest litigation was relatively new in India at this time, and the selection of Kanpur was an
arbitrary decision by Mr. Mehta when asked to reduce the scale of his original petition, we begin our
analysis with the assumption of exogeneity of this ruling and rely on a reduced-form model that links
pollution to infant mortality.
3.1 Reduced-form impact
To assess the impact of such ruling on welfare, we specify a simple reduced-form model of mortality:
Mortalityidt = a+ bTdt +Xit · γ + eidt (1)
where Mortalityidt is a dummy variable indicating whether a child i, born in district d, in year-month
t, died within the first month of life, Tdt is the policy variable – the October 1987 Mehta vs. Union
of India court decision in our case – in district d and period t, and Xidt is a vector of individual,
location*time characteristics, which includes location and time fixed effects. Typically, Tdt will be
a dummy variable that takes value 1 in districts that are subject to environmental regulation and
in periods following the date regulation was enacted. The crux of our identification strategy is that
the error term eidt is such that Cov (Tdt, eidt) = 0. As discussed earlier, Mr. Mehta indicated that
one key factor motivating the choice of Kanpur for his legal challenges was related to the salience of
pollutants coming from the tanneries. It therefore seems that Kanpur was unlikely to have been chosen
for (unobserved) characteristics that could independently affect infant mortality, reducing the concern
of endogenous placement.
3.2 Mechanisms
While the reduced-form estimate of b in (1) might be of interest in itself, we further seek to gauge
the relative relevance of the various channels that could lead environmental policy to affect infant
mortality. To do so, we specify a parsimonious model of the determinants of infant mortality rates:
9
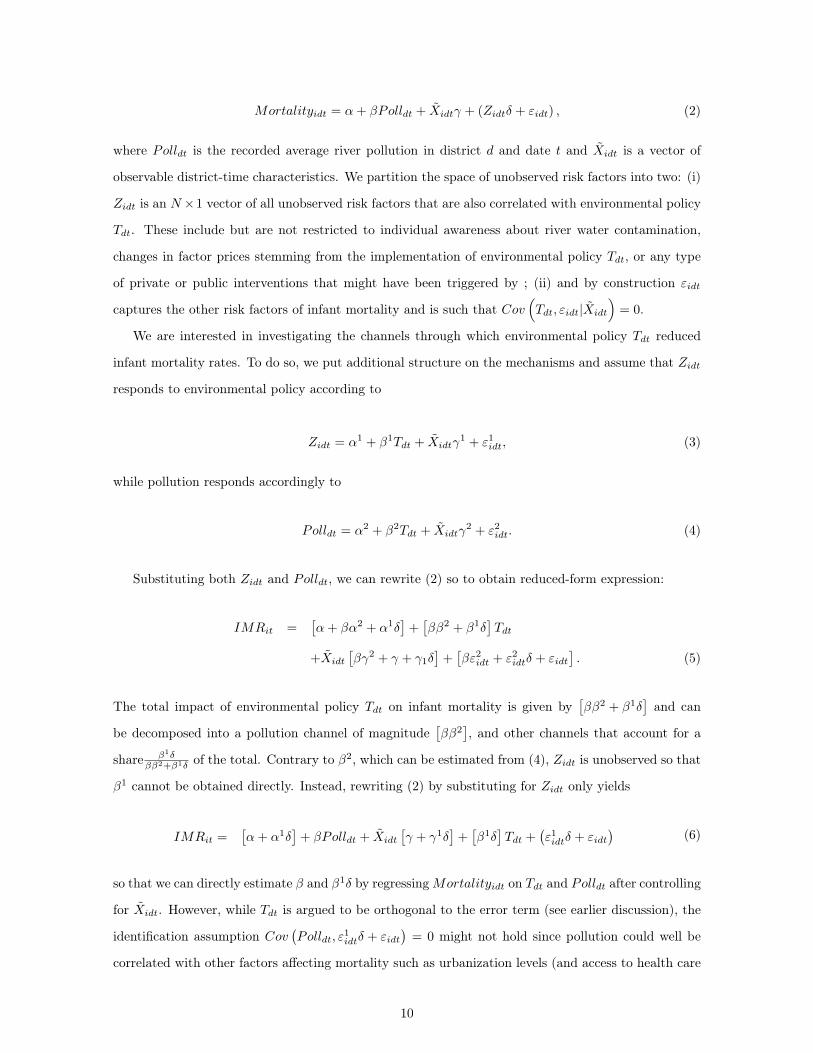
Mortalityidt = α+ βPolldt + X̃idtγ + (Zidtδ + εidt) , (2)
where Polldt is the recorded average river pollution in district d and date t and X̃idt is a vector of
observable district-time characteristics. We partition the space of unobserved risk factors into two: (i)
Zidt is an N ×1 vector of all unobserved risk factors that are also correlated with environmental policy
Tdt. These include but are not restricted to individual awareness about river water contamination,
changes in factor prices stemming from the implementation of environmental policy Tdt, or any type
of private or public interventions that might have been triggered by ; (ii) and by construction εidt
captures the other risk factors of infant mortality and is such that Cov(Tdt, εidt|X̃idt
)= 0.
We are interested in investigating the channels through which environmental policy Tdt reduced
infant mortality rates. To do so, we put additional structure on the mechanisms and assume that Zidt
responds to environmental policy according to
Zidt = α1 + β1Tdt + X̃idtγ1 + ε1idt, (3)
while pollution responds accordingly to
Polldt = α2 + β2Tdt + X̃idtγ2 + ε2idt. (4)
Substituting both Zidt and Polldt, we can rewrite (2) so to obtain reduced-form expression:
IMRit =[α+ βα2 + α1δ
]+[ββ2 + β1δ
]Tdt
+X̃idt
[βγ2 + γ + γ1δ
]+
[βε2idt + ε2idtδ + εidt
]. (5)
The total impact of environmental policy Tdt on infant mortality is given by[ββ2 + β1δ
]and can
be decomposed into a pollution channel of magnitude[ββ2
], and other channels that account for a
share β1δββ2+β1δ of the total. Contrary to β2, which can be estimated from (4), Zidt is unobserved so that
β1 cannot be obtained directly. Instead, rewriting (2) by substituting for Zidt only yields
IMRit =[α+ α1δ
]+ βPolldt + X̃idt
[γ + γ1δ
]+
[β1δ
]Tdt +
(ε1idtδ + εidt
)(6)
so that we can directly estimate β and β1δ by regressingMortalityidt on Tdt and Polldt after controlling
for X̃idt. However, while Tdt is argued to be orthogonal to the error term (see earlier discussion), the
identification assumption Cov(Polldt, ε
1idtδ + εidt
)= 0 might not hold since pollution could well be
correlated with other factors affecting mortality such as urbanization levels (and access to health care
10

facilities or education) or agricultural productivity. We address this endogeneity problem by revisting
(4) and assuming that pollution levels are also driven by Poll−1dt , river pollution upstream of district
d at time t. By writing ε2idt = ε̃2it + η2Poll−1dt , we can write
Polldt = α2 + β2Tdt + X̃idtγ2 + η2Poll−1
dt + ε̃2it, (7)
and hence exclude Polldt from second-stage equation (6). Identification is thus obtained by assuming
that while η1 > 0, we have Cov(Poll−1
dt , Zidtδ + εidt|X̃idt
)= 0. In other words, we assume that
upstream pollution affects infant mortality rates only because of its persistence. We can then estimate
(6) using 2SLS, which will give unbiased estimates of both β and β1δ. We can then test H0 : β1δ = 0.
Alternatively, we note that under the null H0 : β1δ = 0, (6) can be rewritten
IMRit =[α+ α1δ
]+ βPolldt + X̃idt
[γ + γ1 · δ
]+
(ε1idtδ + εidt
)(8)
so that Tdt is alongside Poll−1dt excluded from the second stage equation (8) and is thus another valid
instrument for Polldt. A test of H0 thus pins down to an overidentification test that assesses the
orthogonality condition for Tdt, as part of the larger set of instruments{Tdt, Poll
−1dt
}. We will thus
construct a C-statistic (see e.g. Eichenbaum, Hansen, and Singleton, 1988) or difference-in-Sargan test
statistic, which consists of taking the difference of the two Sargan-Hansen J-statistics obtained from
the regression using both Tdt and Poll−1dt as instrument on the one hand and the one using only Poll−1
dt
on the other hand.
4 Data
4.1 Pollution data
Our main source of data are a subset of the universe of data collected under India’s national water
quality monitoring program, culled from a combination of CPCB online and print records. These data
were originally gathered and used by Greenstone and Hanna (2012). We limit our analysis to the years
1986-2004, because our most recent infant mortality data are from 2004 and our earliest pollution data
are from 1986. We further limit our analysis to the geographic region encompassed by the Ganga River
Basin. We make this second restriction because of the singularity of the Ganga in the context of our
analysis. The Ganga River Basin is not only a much more densely populated region than anywhere else
in India; it is also a historical hotbed of government attention, especially with respect to water quality.
Furthermore, at the time of the Supreme court decision at the heart of this analysis, the National
River Conservation Plan (NRCP) was exclusively aimed at the Ganga Basin (the Yamuna, Damodar,
11
Gomti, Mahananda, and - most extensively - Ganga Rivers). Extending the analysis beyond the Ganga
and its tributaries might then confound the effect of NRCP. The aforementioned sample restrictions
produce a set of 101 unique pollution monitors situated along 29 rivers within the Ganga Basin. Over
the seventeen-year sample time period, this set provides 13,466 monitor-month observations of water
quality. As many as 46 different measures of water quality are recorded at these monitoring stations,
but only a few measures are consistently recorded over the whole sample timeframe. To mitigate
measurement errors and missing values, we average the data over a four-month window at the district
level.
For our analysis, we choose to focus primarily on BOD. This common, broad-based measure of water
pollution measures the amount of dissolved oxygen needed by water-borne, aerobic biological organisms
to break down organic material present (at a certain temperature, over a specific time period). Its units
are milligrams of oxygen consumed per liter (mg/l). Reduction of BOD is the primary goal of waste
treatment plants in general (Brown and Caldwell 2001), but BOD is a particularly good choice for
pollution measurement in the setting of Kanpur. Pollution from the tanning process primarily comes
from two sources: the animal hides themselves, and the chemicals used to tan them. Both of these
sources contain large amounts of organic matter and are reflected in abnormally high effluent levels of
BOD. According to the United Nations Industrial Development Organization (UNIDO, 2011), effluent
discharge into surface water typically is limited to below a BOD of 30-40 mg/l, while the typical BOD
in raw tannery effluent is approximately 2,000. Total suspended solids (TSS), and total dissolved
solids (TDS) are potential alternatives to BOD in analysis, but the first of these is not recorded in
large numbers in our data, and the second does not provide adequate coverage of our policy pre-period.
Chromium, perhaps the highest-profile pollutant in the tanning process, was not widely measured by
the CPCB as of 2004.
To support the evidence provided by BOD, we also consider four other pollutants that shed light
on the impacts of the Kanpur Supreme Court verdicts: calcium, sulfates, chlorides, and fecal coliforms
(FCOLI). Calcium is the key component of lime, which is a standard ingredient used in the removal
of hair, the removal of flesh, and the splitting of the hide into its two primary layers. Sulfates and
chloride ions, meanwhile, are the main components of the TDS produced in tanning. FCOLI is a
measure of domestic (as opposed to industrial) pollution, which is the major focus of the National
River Conservation Plan. Together, calcium and sulfates are a robustness check on our primary
BOD-based analyses: if the policy has truly reduced pollution, and if what we are capturing in our
difference-in-difference analysis is indeed that policy impact, then we should find a reduction in these
pollutants after policy implementation. Chlorides and FCOLI, on the other hand, provide falsification
checks. The former is present in high numbers in tannery effluent but is so soluble in water that it is
12

not affected by standard tannery waste treatment (UNIDO 2011). The latter should not be affected
by tannery regulation, since it is not produced in large quantities by tanning.
Our econometric model and identification strategy rely heavily on the measurement of upstream
pollution values. Many water quality monitors in our dataset have more than one possible upstream
counterpart. We take the choice of which one to use seriously; this is because there is a balance to be
struck between the upstream instrument’s strength (or “relevance”) and its validity. When an upstream
monitor is relatively closer to its downstream counterpart, more of its pollution will remain in the river
at the downstream location (this is our desired source of identification); however, it will also, in general,
lead to a higher spatial correlation, driven by off-river factors like region-wide economic shocks (this
is variation we wish to avoid using). The ideal upstream monitor is far enough away to minimize this
latter concern but not so far away that all of its pollution decays before arriving at the downstream
locale. We therefore adopt a variety of definitions of upstream. To assign an upstream counterpart to
a given pollution monitor, we use the following algorithm: first, we follow the river upstream until it
reaches a new district; next, we locate the nearest monitor along the river that falls within a distance
range (in km) of [X, 200] from the original monitor, where X ∈ {0, 20, 50, 100}. When a river splits
upstream of a given monitor, so that there is an upstream monitor on each of two tributaries, we take
the average of these monitors as our upstream measure. When there is no upstream monitor to be
found, we use the river’s origin as an upstream location (subject to the distance-range requirement)
and attach sample-wide minimum values of pollution as our upstream measure.
4.2 Health data
Research has documented a wide variety of adverse impacts on health due to water pollution; adults
(e.g., Ebenstein 2012) and children (e.g., Galiani et al 2005) alike are susceptible, and morbidity (e.g.,
Kremer et al 2012) as well as mortality (e.g., Brainerd and Menon 2014) are potentially affected. For
our own study of the health burden imposed by river pollution in India, we choose infant mortality as
our key health outcome. This choice follows those of many others in the literature and is motivated
by science, policy, and statistical considerations. Research in epidemiology has shown that infants
are highly susceptible to pollutants (Fewtrell and Bartram, 2001). Recent work suggests that this
susceptibility - even in utero - can have long-term impacts on individual welfare, through channels
such as birthweight, cognitive development and susceptibility to diseases (Currie, 2008 and Currie and
Almond, 2011). The vulnerability of infants to water pollution is of particular policy interest in India,
where infant death rates remain quite high relative to the global average (United Nations, 2011). While
infant mortality is clearly an incomplete measure of the health costs imposed by water pollution, it
nonetheless represents a very large loss of life in the Indian context.
13
Furthermore, the use of infant mortality as an outcome of interest conveys at least two significant
advantages. The first is general to infant health outcomes, as noted by Chay and Greenstone (2003)
and Currie et al. (2009): newborns do not have a long history of prior exposure to pollution, so the
link between water quality and their health is immediate, and an analysis of pollution levels during
the first year of life nearly fully captures lifetime exposure (in direct contrast with studies of adult,
or even under-5, mortality). The second is pertains to statistical power: complete birth histories are
available in certain Indian demographic surveys, so we can construct long pseudo-panels of infant
survival status. Variables such as diarrhea incidence and low birth weight, on the other hand, are only
available cross-sectionally from the time of survey. Panel variation in infant mortality allows us to
include detailed temporal and cross-sectional fixed effects in regression analysis, removing some of the
concern we have about omitted variable bias.
Our infant health data come from the Reproductive and Child Health II (RCH-2) module of the
District-Level Household Survey II (DLHS-2), a national demographic survey conducted in two phases
from 2002 to 2005. In the RCH-2 module, mothers report age and survival for all of their children;
from these birth histories, we create a panel of district-month infant mortality rates. We start with
the raw total of 1,393,431 births from 1967 through 2004 that are reported in RCH-2. We then match
each birth to pollution data from the district in which the birth took place5; this restricts our sample
to 264,375 births. Finally, collapsing from the individual level to district-level means yields a panel
of 4,394 district-month observation with non-missing infant mortality rate and BOD, spanning 41
districts and 8 states.
4.3 Other data
We include several types of variables as controls in many of our regression analyses. The main body of
these controls are cross-sectional survey answers about birth, mother, and child characteristics taken
from RCH-2. A pair of climate controls are created using monthly, gridded rainfall averages from the
University of Delaware and air temperature averages from the Indian Meteorological Institute; we use
the climate grids to interpolate rainfall and temperature values at each monitor-month. We further
measure the distance between a monitor and its upstream pair. Finally, we observe municipal sewage
treatment capacity and the incidence of major river cleanup policy (NRCP, see description in Section
2).5In DLHS-2 as well as all other potential data sources of which we are aware, infant location is only available down
to the district level.
14
5 Empirical Results
5.1 Summary statistics
Table 1 reports summary statistics for the variables used in the regression analyses. Our main outcome
variables of interest, one-month and one-year mortality district averages, indicate a 4.5 percent neo-
natal (one month) mortality rate for India as a whole, while the one-year rate (conditional on one-month
survival) is at .5 percent (Table 1, panel A). Restricting to districts in the Ganga basin, Table 1 panel
B shows that one-month and one-year mortality rates are markedly higher at 5.8 and .7 percent,
respectively. Turning to pollution data, Table 1 reports levels for the two main pollutants used in our
analyses: bio-oxygen demand (BOD) and fecal coliforms (FCOLI). Both levels and dummy variables
indicating CPCB’s standards for “bathing class” quality are reported. These corresponds to BOD
lower or equal to 3, and FCOLI levels equal or below 5000. Statistics presented in Table 1 are district-
month averages since our health outcome variables are observed only at the district-month level. Panel
A suggests that 32 percent of all districts in India have BOD levels above 3, while 15 percent have
FCOLI levels above the threshold of 5000. The Ganga basin is more polluted with 37 percent of
districts reporting high BOD levels, while pollution due to fecal coliforms is markedly higher at 37
percent.
5.2 The impact of Mehta vs. Union of India on health
Understanding the health burden of water pollution is important generally in India (and developing
countries broadly) because it is not clear whether the poor environmental quality observed in such
countries is optimal (due to, e.g., a high marginal utility of consumption) or rather the result of
political economic distortions (like corruption) or market failures (like poor information about health
impacts; Greenstone and Jack 2015).
We thus look at the reduced-form impact of the 1987 Mehta vs. Union of India Supreme Court
decision on health outcomes. Our primary "treatment" group Tdt consists of the districts of Kanpur,
Unmao, and Rae Bareli. We include all three of these districts in our definition of treatment because
they lie within 25 kilometers of the tanneries of Jajmau. All three districts are equally likely to directly
receive contaminated water either directly through the domestic water supply or indirectly via the local
vegetable supply chain.
Since water is flowing downstream, we also construct a dummy variable that takes value 1 for dis-
tricts along the Ganga and downstream of Allahabad. Whether we should expect an effect downstream
of Allahabad is an empirical question. For Allahabad is the confluence between the Ganga and the
Yamuna, the river’s second largest tributary. In Allahabad furthermore, the Yamuna is larger than
15
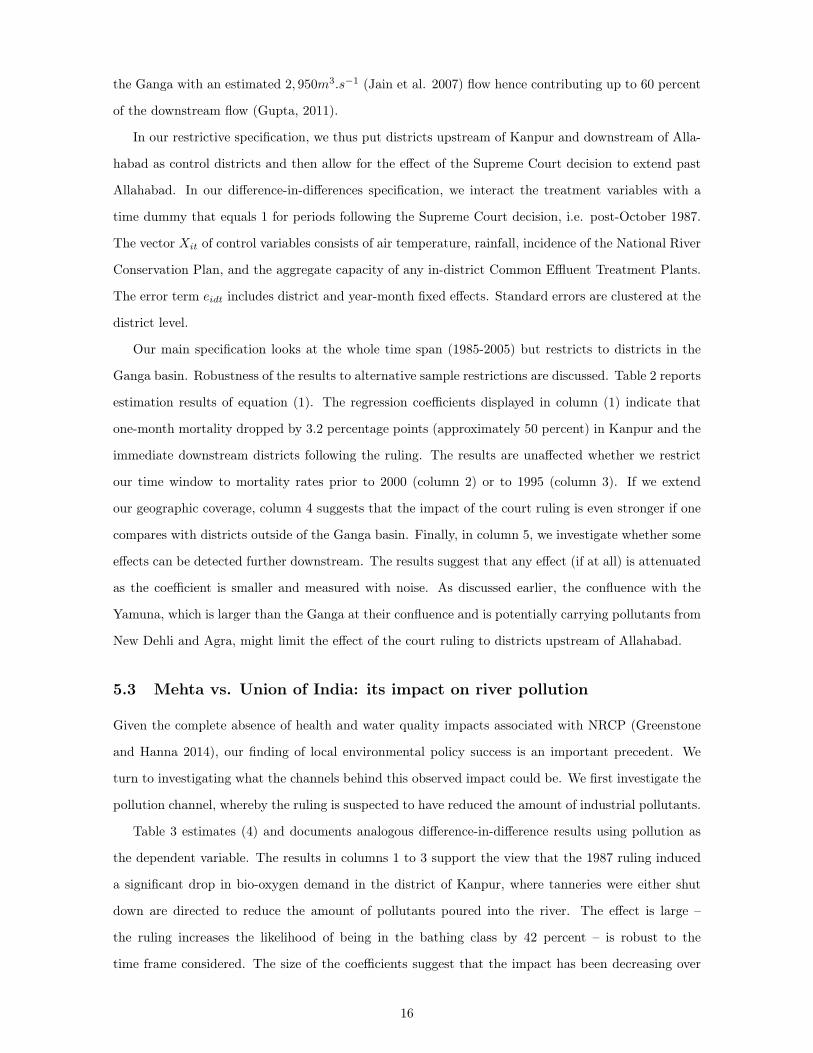
the Ganga with an estimated 2, 950m3.s−1 (Jain et al. 2007) flow hence contributing up to 60 percent
of the downstream flow (Gupta, 2011).
In our restrictive specification, we thus put districts upstream of Kanpur and downstream of Alla-
habad as control districts and then allow for the effect of the Supreme Court decision to extend past
Allahabad. In our difference-in-differences specification, we interact the treatment variables with a
time dummy that equals 1 for periods following the Supreme Court decision, i.e. post-October 1987.
The vector Xit of control variables consists of air temperature, rainfall, incidence of the National River
Conservation Plan, and the aggregate capacity of any in-district Common Effluent Treatment Plants.
The error term eidt includes district and year-month fixed effects. Standard errors are clustered at the
district level.
Our main specification looks at the whole time span (1985-2005) but restricts to districts in the
Ganga basin. Robustness of the results to alternative sample restrictions are discussed. Table 2 reports
estimation results of equation (1). The regression coefficients displayed in column (1) indicate that
one-month mortality dropped by 3.2 percentage points (approximately 50 percent) in Kanpur and the
immediate downstream districts following the ruling. The results are unaffected whether we restrict
our time window to mortality rates prior to 2000 (column 2) or to 1995 (column 3). If we extend
our geographic coverage, column 4 suggests that the impact of the court ruling is even stronger if one
compares with districts outside of the Ganga basin. Finally, in column 5, we investigate whether some
effects can be detected further downstream. The results suggest that any effect (if at all) is attenuated
as the coefficient is smaller and measured with noise. As discussed earlier, the confluence with the
Yamuna, which is larger than the Ganga at their confluence and is potentially carrying pollutants from
New Dehli and Agra, might limit the effect of the court ruling to districts upstream of Allahabad.
5.3 Mehta vs. Union of India: its impact on river pollution
Given the complete absence of health and water quality impacts associated with NRCP (Greenstone
and Hanna 2014), our finding of local environmental policy success is an important precedent. We
turn to investigating what the channels behind this observed impact could be. We first investigate the
pollution channel, whereby the ruling is suspected to have reduced the amount of industrial pollutants.
Table 3 estimates (4) and documents analogous difference-in-difference results using pollution as
the dependent variable. The results in columns 1 to 3 support the view that the 1987 ruling induced
a significant drop in bio-oxygen demand in the district of Kanpur, where tanneries were either shut
down are directed to reduce the amount of pollutants poured into the river. The effect is large –
the ruling increases the likelihood of being in the bathing class by 42 percent – is robust to the
time frame considered. The size of the coefficients suggest that the impact has been decreasing over
16
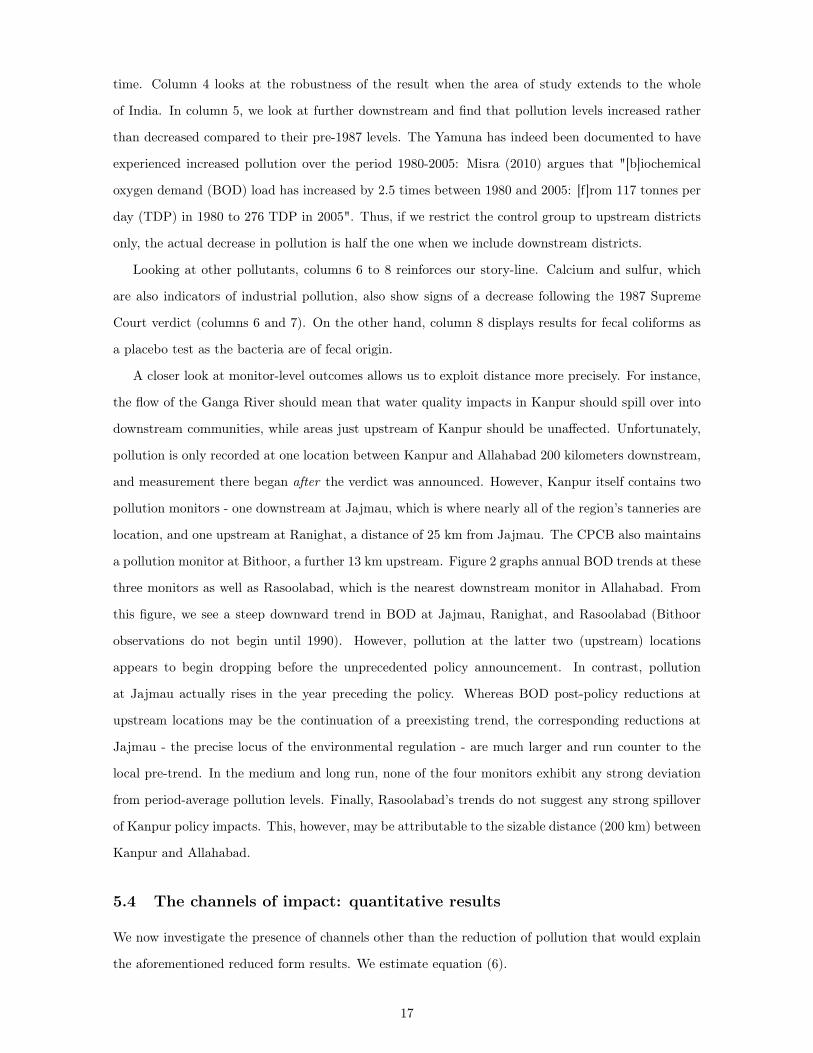
time. Column 4 looks at the robustness of the result when the area of study extends to the whole
of India. In column 5, we look at further downstream and find that pollution levels increased rather
than decreased compared to their pre-1987 levels. The Yamuna has indeed been documented to have
experienced increased pollution over the period 1980-2005: Misra (2010) argues that "[b]iochemical
oxygen demand (BOD) load has increased by 2.5 times between 1980 and 2005: [f]rom 117 tonnes per
day (TDP) in 1980 to 276 TDP in 2005". Thus, if we restrict the control group to upstream districts
only, the actual decrease in pollution is half the one when we include downstream districts.
Looking at other pollutants, columns 6 to 8 reinforces our story-line. Calcium and sulfur, which
are also indicators of industrial pollution, also show signs of a decrease following the 1987 Supreme
Court verdict (columns 6 and 7). On the other hand, column 8 displays results for fecal coliforms as
a placebo test as the bacteria are of fecal origin.
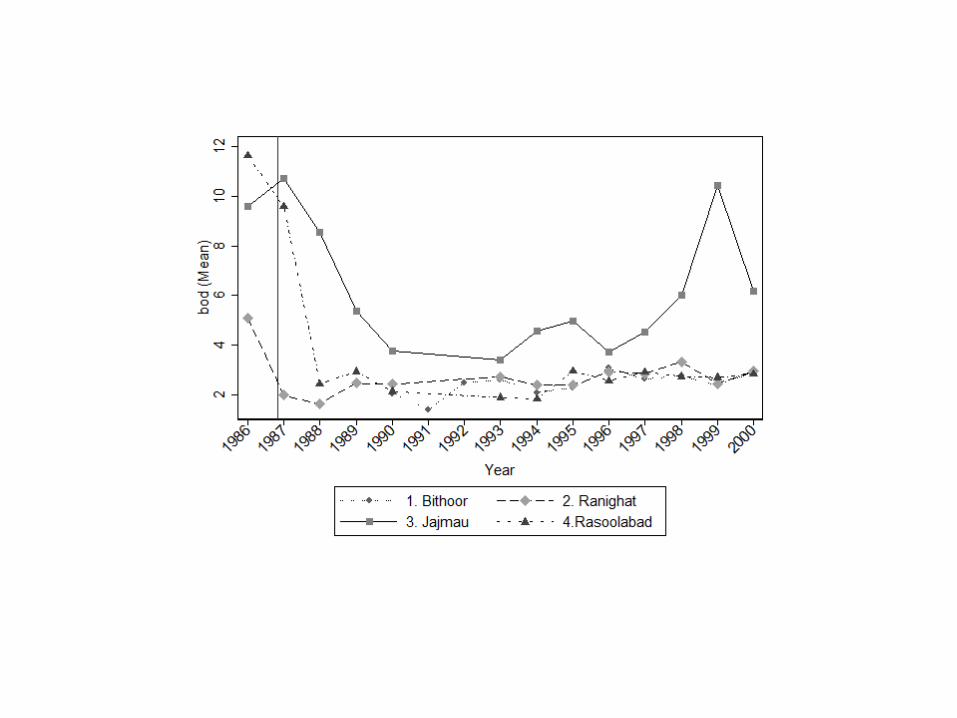
A closer look at monitor-level outcomes allows us to exploit distance more precisely. For instance,
the flow of the Ganga River should mean that water quality impacts in Kanpur should spill over into
downstream communities, while areas just upstream of Kanpur should be unaffected. Unfortunately,
pollution is only recorded at one location between Kanpur and Allahabad 200 kilometers downstream,
and measurement there began after the verdict was announced. However, Kanpur itself contains two
pollution monitors - one downstream at Jajmau, which is where nearly all of the region’s tanneries are
location, and one upstream at Ranighat, a distance of 25 km from Jajmau. The CPCB also maintains
a pollution monitor at Bithoor, a further 13 km upstream. Figure 2 graphs annual BOD trends at these
three monitors as well as Rasoolabad, which is the nearest downstream monitor in Allahabad. From
this figure, we see a steep downward trend in BOD at Jajmau, Ranighat, and Rasoolabad (Bithoor
observations do not begin until 1990). However, pollution at the latter two (upstream) locations
appears to begin dropping before the unprecedented policy announcement. In contrast, pollution
at Jajmau actually rises in the year preceding the policy. Whereas BOD post-policy reductions at
upstream locations may be the continuation of a preexisting trend, the corresponding reductions at
Jajmau - the precise locus of the environmental regulation - are much larger and run counter to the
local pre-trend. In the medium and long run, none of the four monitors exhibit any strong deviation
from period-average pollution levels. Finally, Rasoolabad’s trends do not suggest any strong spillover
of Kanpur policy impacts. This, however, may be attributable to the sizable distance (200 km) between
Kanpur and Allahabad.
5.4 The channels of impact: quantitative results
We now investigate the presence of channels other than the reduction of pollution that would explain
the aforementioned reduced form results. We estimate equation (6).
17
Column 1 simply regresses one-month mortality on river pollution and the policy variables of
interest. Estimating this relationship has historically been difficult because of the inherent endogeneity
of pollution; it is not randomly assigned and may therefore be correlated with unobservable economic
and/or infrastructural characteristics that themselves affect health outcomes. As discussed earlier,
we attempt to resolve this challenge by instrumenting for pollution in each location x with pollution
measured at some locale upstream of x. Our identification assumption is that, conditional on a vector
of fixed effects and control variables, upstream pollution affects mortality only through local pollution.
This assumptions motivates the 2SLS regressions of Equation (6).
Columns 2-4 show the regression results in which pollution levels are instrumented with upstream
pollution. The results suggest that exceeding the BOD threshold for bathing-class water in one district
is associated with an increase of 9 to 17 percent in the probability of one-month mortality in that
district. The results are stronger the narrower the time window under consideration, suggesting a
decrease in the effect of pollution on mortality over time. The residual effect of the Supreme Court
decision is however not significantly different from zero, lending support to the view that pollution is
the sole mechanism through which the Court ruling impacted infant mortality rates.
To test this proposition further, we estimate (8) whereby the policy variables are excluded from
the second stage. Under the null that the Supreme Court decision affected mortality only through
a reduction in pollution, the interaction term between the treatment group dummy and the time
dummy is a second valid instrument for pollution. Columns 5-7 display the results of the 2SLS
estimations, where both upstream pollution and the interaction term are excluded from the first stage.
The coefficient on pollutants is slightly lower and the J-test fails to reject the null that the instruments
are indeed excludable.
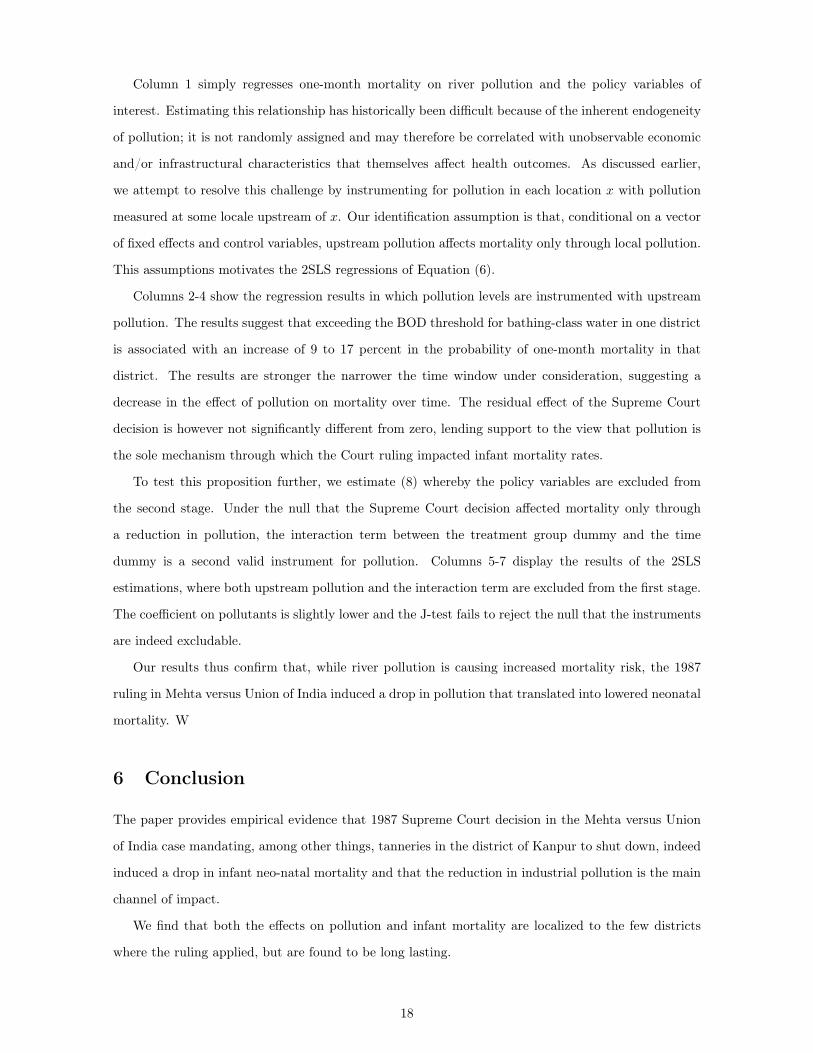
Our results thus confirm that, while river pollution is causing increased mortality risk, the 1987
ruling in Mehta versus Union of India induced a drop in pollution that translated into lowered neonatal
mortality. W
6 Conclusion
The paper provides empirical evidence that 1987 Supreme Court decision in the Mehta versus Union
of India case mandating, among other things, tanneries in the district of Kanpur to shut down, indeed
induced a drop in infant neo-natal mortality and that the reduction in industrial pollution is the main
channel of impact.
We find that both the effects on pollution and infant mortality are localized to the few districts
where the ruling applied, but are found to be long lasting.
18

REFERENCES
Agrawal, P. K. (Ed.). (1994). Environment Protection and Pollution Control in the Ganga. MD
Publications Pvt. Ltd..
Alsan, M., and Goldin, C. (2015). Watersheds in Infant Mortality: The Role of Effective Water
and Sewerage Infrastructure, 1880 to 1915 (No. w21263). National Bureau of Economic Research.
Beg, K. R., and Ali, S. (2008). Chemical contaminants and toxicity of Ganga River sediment from
up and down stream area at Kanpur. American Journal of Environmental Sciences, 4(4), 362-366.
Brown and Caldwell (2001). A Guidebook for Local Governments Developing Regional Watershed
Protection Plans: Appendix B. Description of Commonly-Considered Water Quality Constituents.
Prepared for the Georgia Environmental Protection Division.
Central Pollution Control Board (CPCB) (2013). Pollution Assessment: River Ganga, Central
Pollution Control Board, Ministry of Environment and Forests, Government of India.
Central Pollution Control Board (CPCB) (2013). Status of Water Quality in India. Central
Pollution Control Board, Ministry of Environment and Forests, Government of India.
Cheremisinoff, N. P. (2001). Handbook of pollution prevention practices. CRC Press.
Corcoran, E., Nellemann, C., Baker, E., Bos, R., Osborn, D. and Savelli, H. (eds). (2010) Sick
Water? The Central Role of Wastewater Management in Sustainable Development. A Rapid Response
Assessment. The Hague, UN-Habitat/UNEP/ GRID-Arendal.
Currie, J. (2008). Healthy, wealthy, and wise: Socioeconomic status, poor health in childhood, and
human capital development (No. w13987). National Bureau of Economic Research.
Currie, J., and Almond, D. (2011). Human capital development before age five. Handbook of
Labor Economics, 4, 1315-1486.
Dasgupta, P. (2004). Valuing health damages from water pollution in urban Delhi, India: a health
production function approach. Environment and Development Economics, 9(01), 83-106.
Galiani, S., P.J. Gertler, and E. Schargrodsky (2005). Water for Life: The Impact of the Privati-
zation of Water Services on Child Mortality. Journal of Political Economy 113: 83-120.
Almond, D., Y. Chen, M. Greenstone, and H. Li (2009). Winter Heating or Clean Air? Unintended
Impacts of China’s Huai River Policy. American Economic Review: Papers and Proceedings 99(2):
184-190.
Greenstone, M. and R. Hanna (2014). Environmental Regulations, Air and Water Pollution, and
Infant Mortality in India. American Economic Review 104(10): 3038-3072.
Grumbine, R. E and M. K. Pandit (2013). Threats from India’s Himalaya Dams. Science 339
(6115): 36-37.
19
Garduno, Hector; Romani, Saleem; Sengupta, Buba; Tuinhof, Albert; Davis, Richard (2011). India
Groundwater Governance Case Study. World Bank, Washington, DC.
Government of India, National River Conservation Directorate, Ministry of Environment and
Forests (2009) Status Paper on River Ganga: State of Environment and Water Quality.
Hamner, S., Damon P., Michelle W., Gopal P., Rajesh K. M., Veer B. M., Catherine P., and
Timothy E. F. (2013). Sewage pollution of the River Ganga: an ongoing case study in Varanasi, India.
River Systems, 20(3-4), 157-167
Hollick, Julian Crandall (2008). Ganga: A Journey Down the Ganges River. Island Press, 2008.
Illiyas, F. T., Mani, S. K., Pradeepkumar, A. P., and Mohan, K. (2013). Human stampedes during
religious festivals: A comparative review of mass gathering emergencies in India. International Journal
of Disaster Risk Reduction, 5, 10-18.
References International Labor Organization. (2011). Industrial Pollution in Developing Countries.
In: Encyclopedia of Occupational Health and Safety by Kjellström, Tord,Yassi, Annalee (Editors)
and Jeanne Mager Stellman (Editor-in-Chief). International Labor Organization, Geneva.
References McKenzie, D. and I. Ray. 2004. Household Water Delivery Options in Urban and Rural
India’, Working Paper No. 224. Stanford Centre for International Development, Stanford University.
Available at: http://siteresources.worldbank.org/DEC/Resources/ SCID224.pdf.
Mishra, V. B. (2005). The Ganga at Varanasi and a travail to stop her abuse. Current Science. 89
(5): 755-763.
Murlidhar, S. (2006). The Right to Water: An Overview of the Indian Legal Regime. In E. Riedel
and P. Rothen (Editors), The Human Right to Water (pp. 65–81). Berlin: Berliner Wissenschafts–
Verlag.
Pandey, J. et al. (2005). Ganga Water Pollution and Occurrence of Enteric Diseases in Varanasi
City. Indian Journal of Community Medicine: Vol. 30, No. 4.. pp. 115-120.
Pearce, D. W., Warford, J. J., Izaguirre, S. D., Palma, H., Meyrat, N., Rojas de Pacheco, M.,
Fallas, H. et al. (1993). World without end, economics, environment, and sustainable development
(No. GTZ-566). IICA, Managua (Nicaragua).
Pruss-Ustun, A., Bos, R., Gore, F., and Bartram, J. (2008). Safer water, better health: costs,
benefits and sustainability of interventions to protect and promote health. World Health Organization:
Geneva.
Rajaram T. and Ashutosh Das (2008). Water pollution by industrial effluents in India: Discharge
scenarios and case for participatory ecosystem specific local regulation, Futures, 40(1), 56-69.
Rangachari, R., Sengupta, N., Iyer, R. R., Banerji, P., and Singh, S. (2000). Large dams: India’s
experience. Final Report, prepared for the World Commission on Dams, Cape Town, South Africa,
20
Secretariat of World Commission on Dams.
Reddy, V. R., and Behera, B. (2006). Impact of water pollution on rural communities: An economic
analysis. Ecological Economics, 58(3), 520-537.
Sankar, U. (2001). Economic analysis of environmental problems in tanneries and textile bleaching
and dyeing units and suggestions for policy action. Allied Publishers, New Delhi.
Schjolden, A. (2000). Leather Tanning in India: Environmental Regulation and Firms’ Compliance.
FIL Working Paper No. 21.
Sharma, V., Bhadula, S., and Joshi, B. D. (2012). Impact of mass bathing on water quality of
Ganga river during Maha Kumbh-2010. Nat Sci, 10, 1-5.
Spears, Dean. (2013). How much international variation in child height can sanitation explain?.
World Bank policy research working paper 6351, World Bank, Washington DC.
Tewari, A., Dubey, A., and Singh, P. (2012). Impact of tanning industries on ground water re-
sources. Journal of Environmental Research And Development Vol, 6(3A).
Tripathi, B. D., and Tripathi, S. (2014). Issues and Challenges of River Ganga. In Our National
River Ganga (pp. 211-221). Springer International Publishing.
References World Health Organization (2004). Sulfate in Drinking Water.
References World Health Organization (2005). Nutrients in Drinking Water. WHO: Geneva.
References World Health Organization (2008a). Safer Water, Better Health: Costs, Benefits and
Sustainability of Interventions to Protect and Promote Health. Geneva, WHO.
World Health Organization (2008b). The Global Burden of Disease: 2004 Update. Geneva, WHO.
21
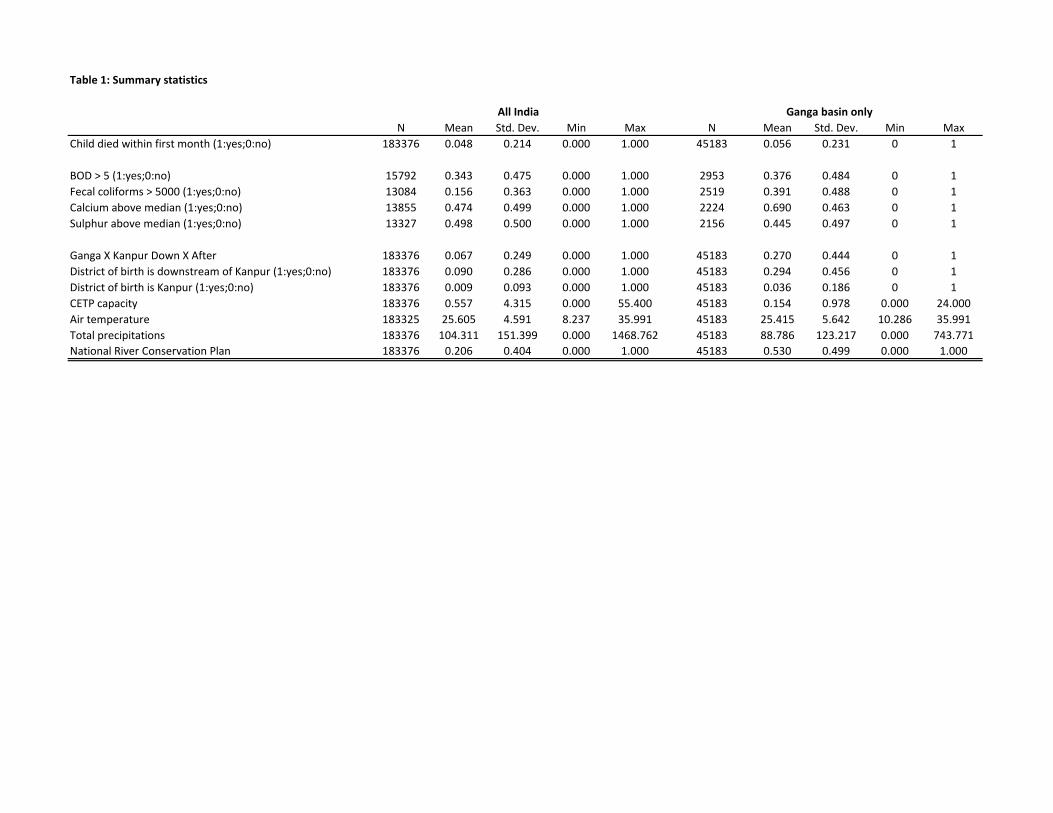
Table 1: Summary statistics
N Mean Std. Dev. Min Max N Mean Std. Dev. Min Max
Child died within first month (1:yes;0:no) 183376 0.048 0.214 0.000 1.000 45183 0.056 0.231 0 1
BOD > 5 (1:yes;0:no) 15792 0.343 0.475 0.000 1.000 2953 0.376 0.484 0 1
Fecal coliforms > 5000 (1:yes;0:no) 13084 0.156 0.363 0.000 1.000 2519 0.391 0.488 0 1
Calcium above median (1:yes;0:no) 13855 0.474 0.499 0.000 1.000 2224 0.690 0.463 0 1
Sulphur above median (1:yes;0:no) 13327 0.498 0.500 0.000 1.000 2156 0.445 0.497 0 1
Ganga X Kanpur Down X After 183376 0.067 0.249 0.000 1.000 45183 0.270 0.444 0 1
District of birth is downstream of Kanpur (1:yes;0:no) 183376 0.090 0.286 0.000 1.000 45183 0.294 0.456 0 1
District of birth is Kanpur (1:yes;0:no) 183376 0.009 0.093 0.000 1.000 45183 0.036 0.186 0 1
CETP capacity 183376 0.557 4.315 0.000 55.400 45183 0.154 0.978 0.000 24.000
Air temperature 183325 25.605 4.591 8.237 35.991 45183 25.415 5.642 10.286 35.991
Total precipitations 183376 104.311 151.399 0.000 1468.762 45183 88.786 123.217 0.000 743.771
National River Conservation Plan 183376 0.206 0.404 0.000 1.000 45183 0.530 0.499 0.000 1.000
All India Ganga basin only
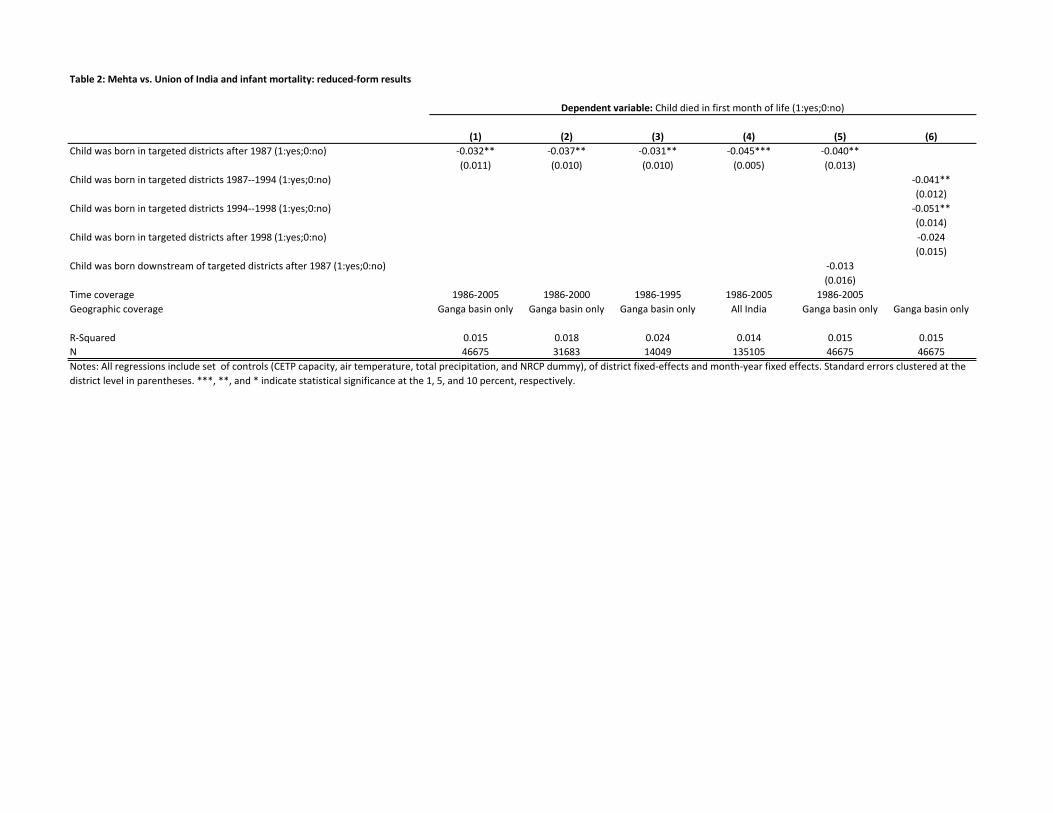
Table 2: Mehta vs. Union of India and infant mortality: reduced-form results
(1) (2) (3) (4) (5) (6)
Child was born in targeted districts after 1987 (1:yes;0:no) -0.032** -0.037** -0.031** -0.045*** -0.040**
(0.011) (0.010) (0.010) (0.005) (0.013)
Child was born in targeted districts 1987--1994 (1:yes;0:no) -0.041**
(0.012)
Child was born in targeted districts 1994--1998 (1:yes;0:no) -0.051**
(0.014)
Child was born in targeted districts after 1998 (1:yes;0:no) -0.024
(0.015)
Child was born downstream of targeted districts after 1987 (1:yes;0:no) -0.013
(0.016)
Time coverage 1986-2005 1986-2000 1986-1995 1986-2005 1986-2005
Geographic coverage Ganga basin only Ganga basin only Ganga basin only All India Ganga basin only Ganga basin only
R-Squared 0.015 0.018 0.024 0.014 0.015 0.015
N 46675 31683 14049 135105 46675 46675
Dependent variable: Child died in first month of life (1:yes;0:no)
Notes: All regressions include set of controls (CETP capacity, air temperature, total precipitation, and NRCP dummy), of district fixed-effects and month-year fixed effects. Standard errors clustered at the
district level in parentheses. ***, **, and * indicate statistical significance at the 1, 5, and 10 percent, respectively.

Table 3: Mehta vs. Union of India and its impact on river pollution
BOD BOD BOD BOD BOD BOD Fecal coliforms Calcium Sulphur
(1) (2) (3) (4) (5) (6) (7) (8) (9)
Targeted districts after 1987 (1:yes;0:no) -0.426*** -0.471*** -0.556*** -0.610*** -0.341* 0.041 -0.116* -0.677***
(0.054) (0.049) (0.082) (0.042) (0.137) (0.132) (0.050) (0.069)
Targeted districts 1987--1994 (1:yes;0:no) -0.437**
(0.156)
Targeted districts 1994--1998 (1:yes;0:no) -0.348
(0.173)
Targeted districts after 1998 (1:yes;0:no) -0.461***
(0.083)
0.173**
(0.054)
Time coverage 1986-2005 1986-2000 1986-1995 1986-2005 1986-2005 1986-2005 1986-2005 1986-2005 1986-2005
Geographic coverage Ganga basin only Ganga basin only Ganga basin only All India Ganga basin only Ganga basin only Ganga basin only Ganga basin only Ganga basin only
R-Squared 0.696 0.670 0.714 0.617 0.619 0.697 0.580 0.613 0.400
Number of observations 3027 1809 1025 6575 6575 3027 2574 2296 2195
Notes: All regressions include set of controls (CETP capacity, air temperature, total precipitation, and NRCP dummy), of district fixed-effects and month-year fixed effects. Standard errors clustered at the district level in
parentheses. ***, **, and * indicate statistical significance at the 1, 5, and 10 percent, respectively. In columns (1)-(5), the dependent variable is whether BOD levels are above 3, in column (6), the dependent variable is whether
fecal coliforms exceed cutoff of 5,000, and in columns (7) and (8), the dependent variable is whether levels of calcium or sulphur are above the sample median.
Dependent variable: pollutant
Downstream of targeted districts after 1987
(1:yes;0:no)

Table 4: Mehta vs. Union of India and infant mortality: channels of impact
OLS
(1) (2) (3) (4) (5) (6) (7) (8) (9)
BOD > 3 (1:yes,0:no) 0.003 0.089* 0.166* 0.165* 0.097* 0.092*** 0.109** 0.098*** 0.079***
(0.004) (0.043) (0.082) (0.073) (0.040) (0.022) (0.041) (0.029) (0.019)
-0.035** -0.002 0.034 0.060
(0.011) (0.022) (0.039) (0.049)
0.004
(0.025)
-0.021
(0.023)
0.023
(0.025)
Geographic coverage
Sample period 1986-2005 1986-2005 1986-2000 1986-1995 1986-2005 1986-2005 1986-2000 1986-1996 1986-2005
J-statistic (P-value) 0.474 0.716 0.326
R-Squared 0.016 -0.008 -0.038 -0.022 -0.010 -0.008 -0.013 -0.002 -0.005
Number of observations 46675 46675 31683 14049 46675 46675 31683 14049 46675
Notes: All regressions include set of controls (CETP capacity, air temperature, total precipitation, and NRCP dummy), of district fixed-effects and month-year fixed effects.
Standard errors clustered at the district level in parentheses. ***, **, and * indicate statistical significance at the 1, 5, and 10 percent, respectively. Columns (2)-(5) show second-
stage results of 2SLS where endogenous variable (BOD > 3) is instrumented using upstream pollution (BOD > 3). Columns (5)-(7) display second-stage results of 2SLS where
endogenous variable (BOD > 3) is instrumented using both upstream pollution (BOD > 3) and interaction variable "Child born in Kanpur after 1987". J-statistic tests validity of
latter instrument.
2SLS: 1 instrument 2SLS: 2 instruments
Dependent variable: Child died in first month of life (1:yes;0:no)
Child was born in targeted districts
after 1987 (1:yes;0:no)
Ganga basin only
Child was born in targeted districts
1987--1994 (1:yes;0:no)
Child was born in targeted districts
1994--1998 (1:yes;0:no)
Child was born in targeted districts
after 1998 (1:year; 0:no)

Designed by soapbox.
The International Growth Centre (IGC) aims to promote sustainable growth in developing countries by providing demand-led policy advice based on frontier research.
Find out more about our work on our website www.theigc.org
For media or communications enquiries, please contact [email protected]
Subscribe to our newsletter and topic updates www.theigc.org/newsletter
Follow us on Twitter @the_igc
Contact us International Growth Centre, London School of Economic and Political Science, Houghton Street, London WC2A 2AE