Embed Size (px)
Citation preview

Policy Research
WORKING PAPERS Wf$IOG2World Development Report
Office of the Vice PresidentDevelopment Economics
The World BankDecember 1992
WPS 1062
Background paper for World Development Report 1992
Economic Development,Environmental Regulation,
and the International Migrationof Toxic Industrial Pollution
1960-88
Robert E.B. LucasDavid Wheeler
andHemamala Hettige
Net displacement of toxic intensity toward developing countriesmay not have been inevitable in the last two decades. And toxicindustrial migration seems to have been the result of restrictivetrade policies in the developing countries themselves more thanof regulatory cost differences between the North and the South.
PoaicyRhWmkingPapcsdiucintethcfndinowofwrimmnp5o Zwenbmhgetbec efidm eanmogBInka"ffandaI1o4mdintedinsdNeloimeUntpThmcpapw.&utbdbyhResmc tAdvisnyS.ffcatyitensmoftmsthordctonythervc,ndBh1dbtulsedbdcisdaccoioyThfoglygMefindiaus,_sndaoondca&lettethorWfl'.ThCeyshodnot be au,butd to the Wedd Bank, its Bord of Di,cta its managment, or say of ic maebercountbieai
Pub
lic D
iscl
osur
e A
utho
rized
Pub
lic D
iscl
osur
e A
utho
rized
Pub
lic D
iscl
osur
e A
utho
rized
Pub
lic D
iscl
osur
e A
utho
rized

Policy Research
World Development Report
WPS 1062
This paper- a product of the Office of the Vice President, Development Economics - is one in a seriesof background papers prepared for the World DevelopmentReport 1992. The Report, on development andthe environment, discusses the possible effects of the expected dramatic growth in the world's population,industrial output, use of energy, and demand for food. Copies of this and other WorldDevelopmentReportbackground papers are available free from the World Bank, 1818 H Street NW, Washington, DC 20433.Please contact the WorldDevelopmentReportoffice, room T7-101, extension 31393 (December 1992,20pages).
Several previous studies have asked whether * This happens because manufacturing has aenvironmental controls imposed in the industrial declining share of GDP at higher income levels,economies are diverting investments in pollu- not because of any shift toward a cleaner mix ofJon-intensive activities off-shore. Broadly, these manufacturing activities.studies conclude that direct investment does notappear to be stimulated by such regulations, * The more rapidly growing high-incomepartly because the cost of emission controls is countries have actually enjoyed negative growthgenerally a tiny fraction of operating costs. in toxic intensity of their manufacturing mix.
Yet direct investment reflects only part of o Stricter regulation of pollution-intensivewhat may be happening to world production production in the OECD countries appears topatterns. Technology transfers may occur with have led to significant locational displacement,no simultaneous direct investment, and produc- with consequent acceleration of industrialtion may readily shift toward a different global poUudon intensity in developing countries. Thedistribution without either direct investment or poorest economies seem to have the highesttechnology transfer. growth in toxic intensity. One cannot, of course,
be certain of the causal connection.Lucas, Wheeler, and Hettige attempt a
general test of the displacement hypothesis, * Polution intensity has grown most rapidlydeveloping time series estimates of manufactur- in developing economies that are relativelying pollution intensity for a large sample of closed to world market forces. Relatively closed,developed and developing countries between fast-growing economies experienced rapid1960 and 1988. Among their conclusions: structural transitions toward greater toxic inten-
sity. The opposite seems to have been true for- As a result of shifts in industrial composi- more open economies.
tion, total manufacturing emissions relative toGDP grow faster than GDP at lower levels of percapita income and slower than GDP at higherlevels of income.
ThePolicy Research Working PaperSeriesdisseminates thefmidings of workunder way intheBank. Anobjectiveof the seriesis to get these findings out quickly, even if presentations are less than fully polished. The fmdings, interpretations, andconclusions in these papers do not necessarily represent official Bank policy.
Produced by the Policy Research Dissemination Center
Economic Development. Environmental Regulationand the International Migration of Toxic Industrial Pollution:
19-601988
Robert E.B. Lucas *David Wheeler
andHemamala Hettige
Prepared as a Background Paper for theWorld Development Report 1992
* This paper reports on work co-sponsored by the World Bank and the Center for EconomicStudies, U.S. Bureau of the Census. The authors' affiliations are, respectively: Department ofEconomics, Boston University; Environment Department, World Bank; Industry/EnergyDepartment, World Bank.

The World Development Report 1992, "Development and the Environment," discusses thepossible effects of the expected dramatic growth in the world's population, industrial output, useof energy, and demand for food. Under current practices, the result could be appallingenvironmental conditions in both urban and rural areas. The World Development Reportpresents an alternative, albeit more difficult, path - one that, if taken, would allow futuregenerations to witness improved environmental conditions accompanied by rapid economicdevelopment and the virtual eradication of widespread poverty. Choosing this path will requirethat both industrial and developing countries seize the current moment of opportunity to reformpolicies, institutions, and aid programs. A two-fold strategy is required.
* First, take advantage of the positive links between economic efficiency, income growth,and protection of the environment. This calls for accelerating programs for reducing poverty,removing distortions that encourage the economically inefficient and environmentally damaginguse of natural resources, clarifying property rights, expanding programs for education (especiallyfor girls), family planning services, sanitation and clean water, and agricultural extension, creditand research.
* Second, break the negative links between economic activity and the environment.Certain targeted measures, described in the Report, can bring dramatic improvements inenvironmental quality at modest cost in investment and economic efficiency. To implement themwill require overcoming the power of vested interests, building strong institutions, improvingknowledge, encouraging participatory decisionmaking, and building a partnership of cooperationbetween industrial and developing countries.Other World Development Report background papers in the Policy Research Working Paperseries include:
Dennis Anderson, "Economic Growth and the Environment"
Dennis Anderson and William Cavendish, "Efficiency and Substitution in Pollution Abatement:Simulation Studies in Three Sectors"
William Ascher, "Coping with the Disappointing Rates of Return of Development Projects withEnvironmental Aspects"
Edward B. Barbier and Joanne C. Burgess, "Agricultural Pricing and EnvironmentalDegradation"
Robin W. Bates and Edwin A. Moore, "Commercial Energy Efficiency and the Environment"
Wilfred Beckennan, "Economic Development and the Environment: Conflict orComplementarity?"
Richard E. Bilsborrow, "Rural Poverty, Migration, and the Environment in DevelopingCountries: Three Case Studies"
Charles R. Blitzer, R.S. Eckaus, Supriya Lahiri, and Alexander Meezaus,(a) "Growth and Welfare Losses from Carbon Emission Restrictions: A GeneralEquilibrium Analysis for Egypt";(b) "The Effects of Restrictions of Carbon Dixide and Methane Emissions on the IndianEconomy"
Judith M. Dean, "Trade and the Environment: A Survey of the Literature"

Behrouz Guerami, "Prospects for Coal and Clean Coal Technology"
David 0. Hall, "Biomass"
Ravi Kanbur, "Heterogeneity, Distribution and Cooperation in Common Property ResourceManagement"
Arik Levinson and Sudhir Shetty, "Efficient Environment Regulation: Case Studies of Urban AirPollution"
Robert E.B. Lucas, David Wheeler, and Hemamala Hettige, "Economic Development,Environmental Regulation and the International Migration of Toxic Industrial Pollution:1960-1988"
Robert E.B. Lucas, "Toxic Releases by Manufacturing: World Patterns and Trade Policies"
Ashoka Mody and Robert Evenson, "Innovation and Diffusion of Environmentally ResponsiveTechnologies"
David Pearce, "Economic Valuation and the Natural World"
Nemat Shafik and Sushenjit Bandyopadhyay, "Economic Growth and Environmental Quality:Time Series and Cross-Country Evidence"
Anwar Shah and Bjorn Larsen,(a) "Carbon Taxes, the Greenhouse Effect, and Developing Countries";(0) "World Energy Subsidies and Global Carbon Emissions"
Margaret E. Slade,(a) "Environmental Costs of Natural Resource Commodities: Magnitude andIncidence";(b) "Do Markets Underprice Natural Resouce Commodities?"
Piritta Sorsa, "The Environment - A New Challenge to GAIT?"
Sheila Webb and Associates, "Waterborne Diseases in Peru"
Background papers in the World Bank's Discussion Paper series include:
Shelton H. Davis, "Indigenous Views of Land and the Environment"
John B. Homer, "Natural Gas in Developing Countries: Evaluating the Benefits to theEnvironment"
Stephen Mink, "Poverty, Population and the Environment"
Theodore Panayotou, "Policy Options for Controlling Urban and Industrial Pollution"
Other (unpublished) papers in the series are available direct from the World Development ReportOffice, room T7-101, extension 31393. For a complete list of titles, consult pages 182-3 of theWorld Development Report. The World Development Report was prepared by a team led byAndrew Steer; the background papers were edited by Will Wade-Gery.

Table of Contents
Introduction . 1
I. Sources of Change in Pollution Intensity .1.......... . .. . . .. . .. . .. . .. . . . I
1. Development and Private Cost Advantage ......... . . . .. . . . . . . . .. . 12. Environmental Regulation .2............................... . 23. Economic Policy Regime .2............................... . 24. Towards Testable Hypotheses ............................... 3
II. Data: Sources and Issues ....................................... 4
1. Data Sources .......................................... 42. The Assumption of Constant Sectoral Intensities .................... 6
II. Toxic Intensity of Industrial Production: Economic Development,Time Trends and Trade Policies ................................ 7
1. Levels of Development and Time Trends ......................... 72. Trade Liberalization and Toxic Intensity of Manufacturing ............. 10
IV. Summary and Conclusions .................................... 13
Appendix .......................................... 16
1. Constancy Across Measures of Pollution Intensity .............. 162. Constancy Across OECD Countries ...................... 173. Constancy Over Time in the U.S. ....................... 184. Process and Abatement Considerations ..................... 185. Conclusion ...................................... 19
References ............................................ 20

Introduction
This paper is largely empirical. It examines how the structure of manufactulringproduction varies, both across colintries and through time, in relation to the toxic emissions ofcomponent industries. Evidence is also presented on the connection between these variations andtrade policy liberalization.'
Industrial emissions may be thought of as output multiplied by the pollution intensity ofthat output. In turn the pollution intensity of output derives from the mix of industrial products,the processes used to produce each of these goods, and the treatment of the resultant waste fromthese processes. It is important to establish at the outset that the present investigation addressesonly the first of these elements -- the effect of product (or industrial) mix. This scope ofanalysis is dictated by the nature of the data available, which are described in section II. Yetthis evidence does offer some interesting insights, for little systematic evidence currently existsin this sphere.2
Meanwhile section I discusses, in broad terms, some of the elements likely to affect thepollution intensity of industrial production, before turning to the results in section III.
I. Sources of Change in Pollution Intensity
1. Development and Private Comparative Advantage
In the absence of binding controls on the generation of environmental bads - includingfailure of private contractual arrangements to contain damaging effects - there will be over-production and over-consumption of environmentally harmful commodities. Free trade in suchan unregulated context results in a distribution of production across countries founded oncomparative private cost advantages without regard to environmental costs: the capacity orwillingness of nations to withstand or accept environmental damage does not enter the tradecalculus.
As nations develop, the range of commodities in which they have a private comparativecost advantage in trade obviously shifts. These shifts may arise from accumulating capitalavailable per worker, from improvements in the state of know-how and worker skills, or fromenhanced ability to exploit natural resources. Even if there were no environmental regulationin wealthier economies, free trade under these conditions might well lead to disproportionatelyrapid growth of industrial pollution in developing countries. Rising manufacturing emission
1. See, in add-";on, the earlier study bv Lucas, 'Toxic Releases by Manufacturing: WorldPatterns and Policies," also prepared as a Background Paper for the World Development Report1992 and available in the Policy Research Working Paper Series. This includes various toxicemissions data and regressions that are not included in the present study.
2. See, however, Grossman and Krueger (1991).
1
intensity with income might simply reflect a shift toward comparative advantage inmanufacturing generally, and of more capital intensive (smokestack) industries, which alsohappen to be particularly pollution intensive.
2. Environmental Regulation
The standards required by envii.nmental regulations vary substantially across countriesfor several reasons:
(a) World income inequality: The desire for a cleaner environment ispresumably a normal good, in the sense that demands for tighter standards risewith income. The lower income countries would then be less concerned to avoidlocal environmental damage, as were the advanced nations at an earlier stage intheir growth.
(b) Environmental absorptive capacity: Being able to locate industries withemissions harmful to humans far from densely populated areas presumably hasits attractions. On the other hand, some sparsely populated regions exhibitparticularly fragile eco-systems, diminishing their capacity to withstand toxicreleases.
(c) Regulatory capability: Differences in the ability to enforce regulations mayexplain some of the observable gaps in legislated norms and in the strictness ofenforcement.
In principle, regulating environmental damage and taxing emissions can be used tointernalize the external costs stemming from various forms of pollution. To be effective, suchinstruments must alter the costs of production and hence comparative cost advantages in trade.If the externalities inherent in environmental damage are appropriately contained, then trade willtake place according to the social comparative advantage of nations, an advantage defined by abalance of environmental and other costs. But since both private costs and environmental costsdiffer from country to country, one would not expect to see an even spatial distribution of toxicemissions in an optimally regulated world. Indeed, rising incomes may well cause worseningemission levels, as cost advantage shifts toward pollution intensive industries. This trend maythen be overtaken at higher income levels by electoral demands for a cleaner environment andperhaps enhanced capacity for enforcement.
3. Economic Policy Regime
Industrial development has traditionally been viewed as damaging to the environment.Since environmentalists have joined most economists in associating liberal economic regimeswith more rapid industrial growth, they have tended to look askance at openness. However, thisview neglects the possibility that more open economies might follow a less pollution-intensiveindustrial development path. If openness were to decrease pollution intensity, then its negative
2

environmental impact via aggregate growth would certainly be mitigated, and might even bereversed.
The labor cost advantage of developing economies, if allowed free rein in the market,would enhance the prospects of many 1: ht assembly activities with modest environmentalimpacts. Protection, on the other hand, is often focused on relatively capital- and pollution-intensive sectors such as chemicals and steel.
4. Towards Testable Hypotheses
The previous discussion identifies three forces which may have significantly affected theworldwide incidence of industrial pollution: development-related changes in private comparativeadvantage; environmental regulation in the wealthier economies; and differences in economicpolicy regimes. From this we distill three lines of analysis for further examination.
(i) Development and sectoral composition: The patterns of pollution intensityof manufacturing production in relation to level of economic development, asmeasured by income per capita, are explored. In particular, it is frequentlyasserted that pollution exhibits an inverse U-shaped relationship with per capitaincome: in other words, pollution is believed to first rise faster than output at lowlevels of income, then to rise more slowly than output after some critical incomethreshold.3
(ii) OECD enviromnental regulation and displacement: Since it is difficult toproxy for the strictures and implementation of OECD environmental regulations,direct tests of any resultant production relocation are difficult to undertake.Nonetheless, at a minimum, broad differences in trends across differing timeperiods may be examined to ascertain whether production relocation of dirtierindustries has been more rapid during episodes of enhanced OECD environmentalregulation.
(iii) LDC economic policy and pollution intensity: Has actual import protectionamong the developing countries promoted or discouraged production of dirtierindustrial products? This is examined here by posing the question: Have periodsof trade liberalization led to more or less rapid growth in pollution intensiveindustries among LDCs?
3. Although there are many assertions that such a pattern prevails there is little systematicevidence either to support or refute this presumption. See, however, Grossman and Krueger(1991) who indeed find such an inverse-U pattern in a cross country study of urban air pollution.
3

II. Data: Sources and issues
1. Data Sources
For the purposes oi this study, four primary data sources are drawn upon to derive ameasure of manufacturing output's pollution intensity in some 80 countries over the period 1960to 1988.4
The first data source is a sample of 15,000 plants, drawn from the US EnvironmentalProtection Agency's (EPA's) Toxic Release Inventory (fRI) for 1987. First mandated byamendments to U.S Superfund legislation in 1986, the TRI records air, water, underground andso!id waste releases of 320 toxic substances by each reporting plant.
For the second data source, the US Census Bureau has provided output data, drawn fromthe 1987 Census of Manufactures, for each of the 15,000 EPA sample plants. After matchingplant-level observations and translating from U.S. five digit SIC identifiers to ISIC codes, theaggregate toxic releases per unit of output are calculated for each of 37 ISIC industry categories.
The third data source provides information about the toxic risk of different pollutants;three toxic intensity measures per unit of output are considered. The first is simply total poundsreleased of all 320 toxic substances -- whether atmospheric, effluent or solid -- per dollar'sworth of output. In Table 1, this measure is labeled Total Release Intensity. However, thismeasure neglects the fact that some emissions are of greater concern than others. We havetherefore developed alternative risk measures using the EPA's Human Health and EcotoxityDatabase (HHED), which contains several measures of toxicological and carcinogenic potencyfor each substance.
One of these is an ordinal measure of human toxicity risk, ranging from category 1(mild) through 4 (very serious). Our second measure of toxic intensity uses these risk factorsin a linear weighted sum of toxic releases per dollar's worth of output. The implicit assumptionis that the HHED risk scale is inherently linear, with one pound of emission with risk factor 4as damaging as four pounds of releases with risk factor 1. This may not be a reasonableapproximation; in consequence, we have also constructed a third weighted index, which assumesthat the HHED risk factors are exponential (1, 10, 100, 1000), instead of linear. In Table 1,the latter two measures are labeled Linear and Exponential Intensities. One feature of the threeintensity measures in Table 1 is particularly significant for our analysis: their simple(unweighted) correlation is very high across the 37 ISIC categories (See Table 2). Little is lost,therefore, by focusing on one index, and we have chosen to work with the total (unweighted)toxic intensity.
4. For full technical details, see Martin, Wheeler, Hettige, Stengren (1991).
4
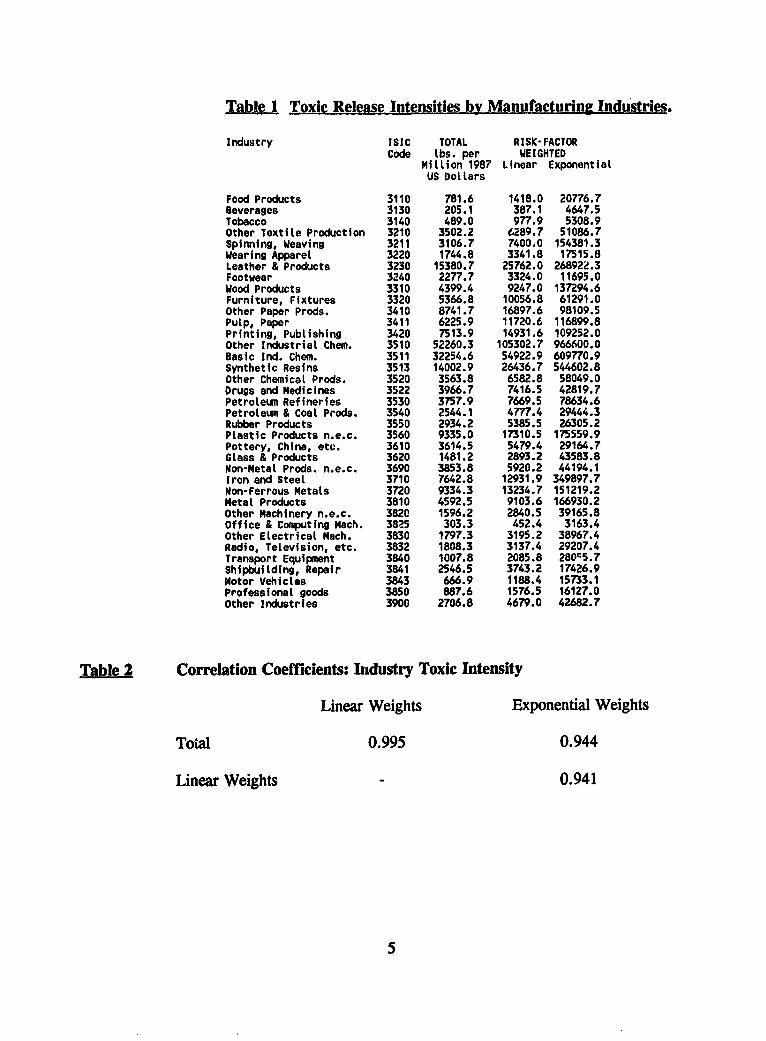
Tab-leI Toxic Release Intensities by Manufacturing Industries.
Industry ISIC TOTAL RISK-FACTORCode lbs. per WEIGHTED
Million 1987 Linear ExponentialUS Dollars
Food Products 3110 781.6 1418.0 20776.7Beverages 3130 205.1 387.1 4647.5Tobacco 3140 489.0 977.9 5308.9Other Textile Production 3210 3502.2 6289.7 51086.7Spinning, Weaving 3211 3106.7 7400.0 154381.3Wearing Apparel 3220 1744.8 3341.8 17515.8Leather & Products 3230 15380.7 25762.0 268922.3Footwear 3240 2277.7 3324.0 11695.0Wood Products 3310 4399.4 9247.0 137294.6Furniture, Fixtures 3320 5366.8 10056.8 61291.0Other Paper Prods. 3410 8741.7 16897.6 98109.5Pulp, Paper 3411 6225.9 11720.6 116899.8Printing, Publishing 3420 7513.9 14931.6 109252.0Other Industrial Chem. 3510 52260.3 105302.7 966600.0Basic Ind. Chem. 3511 32254.6 54922.9 609770.9Synthetic Resins 3513 14002.9 26436.7 544602.8Other Chemical Prods. 3520 3563.8 6582.8 58049.0Drugs and Medicines 3522 3966.7 7416.5 42819.7Petroleun Refineries 3530 3757.9 7669.5 78634.6Petroleun & Coal Prods. 3540 2544.1 4777.4 29444.3Rubber Products 3550 2934.2 5385.5 26305.2Plastic Products n.e.c. 3560 9335.0 17310.5 175559.9Pottery, China, etc. 3610 3614.5 5479.4 29164.7Glass & Products 3620 1481.2 2893.2 43583.8Non-Metal Prods. n.e.c. 3690 3853.8 5920.2 44194.1Iron and Steel 3710 7642.8 12931.9 349897.7Non-Ferrous Metals 3720 9334.3 13234.7 151219.2Metal Products 3810 4592.5 9103.6 166930.2Other Machinery n.e.c. 3820 1596.2 2840.5 39165.8Office & Computing Mach. 3825 303.3 452.4 3163.4Other Electrical Mach. 3830 1797.3 3195.2 38967.4Radio, Television, etc. 3832 1808.3 3137.4 29207.4Transport Equipment 3840 1007.8 2085.8 280'5.7Shipbuilding, Repair 3841 2546.5 3743.2 17426.9Motor Vehicles 3843 666.9 1188.4 15733.1Professional goods 3850 887.6 1576.5 16127.0other Industries 3900 2706.8 4679.0 42682.7
Table 2 Correlation Coefficients: Industry Toxic Intensity
Linear Weights Exponential Weights
Total 0.995 0.944
Linear Weights - 0.941
5

The fourth data source is the U.N. annual sectoral output series for each reportingcountry during the period 1960-1988.5 To create annual toxic intensity estimates for eachsample country, the Total Toxicity Intensity measures from Table 1 are applied to ISIC sectorshares. These national intensity estimates form the basis for section III's analysis of the sourcesand probable environmental consequences of changing sectoral composition.
2. The Assumption of Constant Sectoral Intensities
As noted in the introduction, this paper does not attempt a comprehensive analysis ofchanges in international industrial pollution. Constant, U.S.-based, output intensities are adoptedbecause there is no choice -- international data on within-sector process mix and abatementchoices have not yet been collected. Nevertheless, the following estimates will have first-ordervalidity if there is rough stability in the relative pollution intensity of sectors across countriesand over time. Such an assumption of fixed toxic intensity embodies at least three elements:
* The application of observed US emission intensities to other countries assumessimilar technologies and enforcement standards across countries. For instance,to the extent that lower income countries lIave more pollution-intensive techniquesfor given industries than does the US (whether because of the state of know-how,differing regulations, or greater difficulty in enforcement), the measures generatedhere understate toxic outputs from lower income nations. On the other hand, ifemissions per unit of output are roughly similar no matter where the product isproduced, then the measures will provide a reasonable approximation.
* Closely related to the above is an issue arising from the level of disaggregationavailable in the industrial data. The application of US intensities to othercountries assumes either that the pollution intensities of various products withinan industry group are not too dissimilar or that the mix of products within eachindustry is essentially the same across countries.
* Emissions are assumed to relate to an industry's output rather than, forinstance, to value added. This may not be an unreasonable assumption; thelimited availability of data on international value added prevent any systematicevaluation.
In fact most existing empirical work assumes rough constancy in relative cross-sectoralpollution intensity, invariably identifying the same sets of "heavy polluters" (e.g. metals,cement, pulp and paper, chemicals) and "light polluters" (e.g. most light assembly, food
5. Some of these data are published in the United Nations Industrial Statistics Yearbook. Thesedata are deflated using the GDP deflator for each country, since specific deflators for eachmanufacturing sector are generally unavailable.
6

products, instruments). This assumption is largely based on two sources: (a) case-orientedengineering estimates of intensities in the few air and water pollutants which have beenconventionally regulated in the OECD economies since 1975; and (b) reported annual totaloutput- or investment-based intensities of expenditure on pollution abatement and control. Inan appendix to this paper some partial evidence is reviewed on the plausibility of roughconstancy in sectoral intensities, which suggests that this assumption may not be too misleading,at least as a first approximation. Thus the following analysis retains the assumption of fixedtoxic intensity that is common to almost all prior work.
m, Toxic Intensity of Industrial Production: Economic Development. Time Trends andTrade Policies
In this section some proximate determinants of variations in industrial toxic intensity areexplored. The results are presented in two parts: first, the pattern with respect to income percapita and through time, and second, the role of trade policy.
1. Levels of Development and Time Trends
The visual evidence in Figures l.A6 and 1.B brings out two important points:
- Across countries, an inverse U relationship does indeed bold between GDP percapita and total estimated toxic releases from manufacturing relative to GDP.This is shown in Figure L.A (and is confirmed in unreported regressionanalysis).' This does not, of course, necessarily imply that every country mustfollow a pattern of rising toxic intensity of production as development proceeds,followed by declining intensity at more advanced stages of development: the timepath for individual countries need not follow the cross country pattern. It shouldalso be emphasized that this pattern does not necessarily imply a decline inaggregate toxic releases at higher levels of GDP, only that toxic releases per unitof production fall among higher income countries.
* However, Figure 1.B exhibits no tendency for intensity of manufacturingtoxicity per unit of manufacturing output to decline among high income countries.Thus, the declining portion in the inverse U relationship just noted is a result of
6. The measure on the vertical axis in Figure 1.A is pounds of toxic emissions per 1000 US1987$ of GDP in each country.
7. See the earlier study by Lucas, "Toxic Releases by Manufacturing: World Patterns and TradePolicies," also prepared as a Background Paper for the World Development Report 1992 andavailable in the Policy Research Working Paper Series.
7
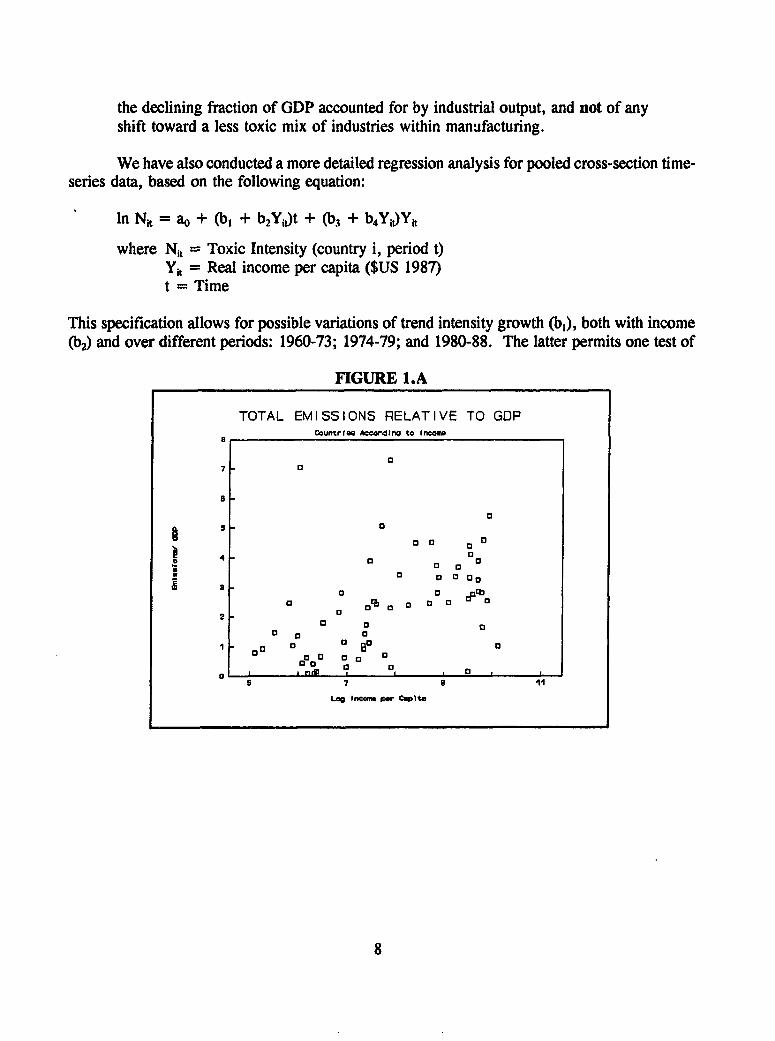
the declining fraction of GDP accounted for by industrial output, and not of anyshift toward a less toxic mix of industries within manufacturing.
We have also conducted a more detailed regression analysis for pooled cross-section time-series data, based on the following equation:
In Ni, = ao + (b, + b2Y,J)t + (b3 + b4Yj)Yj,
where N1, = Toxic Intensity (country i, period t)Yh = Real income per capita ($US 1987)t = Time
This specification allows for possible variations of trend intensity growth (bl), both with income(b2) and over different periods: 1960-73; 1974-79; and 1980-88. The latter permits one test of
FIGURE L.A
TOTAL EMISSIONS RELATIVE TO GDPCounltrf( Acrdt no to incowne
7
S 00 a~0
0~~~~~~~~~~
13 a
7
Log lncme per Cmpltn
8

FIGURE 1.B
EMISSIONS / MANUFACTURING OUTPUTOoufftree According to Income
9la
o~~~~~~
0 _
al 5 a El a o
8 ° 01 0 0o o4 a~ 0
a 013~ a
2 0 0
5 7 9 *11
Log Inmcw per Captet
the possibility that stricter OECD environmental regulation in the mid-late 1970's had asignificant overall impact on the international location of pollution-intensive industries. Theresponsiveness of toxic intensity with respect to income (b3) is also permitted, in thisspecification, to vary with income itself (b4).
Table 3 reports fixed-effects estimates of this equation for the period 1960-1988, withone dummy variable included per country. When intensity is defined as industrial emissionsdivided by GDP, the rise in intensity with respect to rising income at least tapers off at higherincome levels. On the other hand, when intensity is defined as pollutants per unit ofmanufacturing output, this is definitely not the case (indeed, the relationship in equation (2) goesthe other way).
To summarize, these results imply:
* that there is no transition to lower toxic intensity in manufacturing at high incomes.The toxic intensity of GDP declines only because the manufacturing share in GDPdeclines beyond a certain level of income.
* that growth in toxic intensity has been far more rapid in developing countries.
9
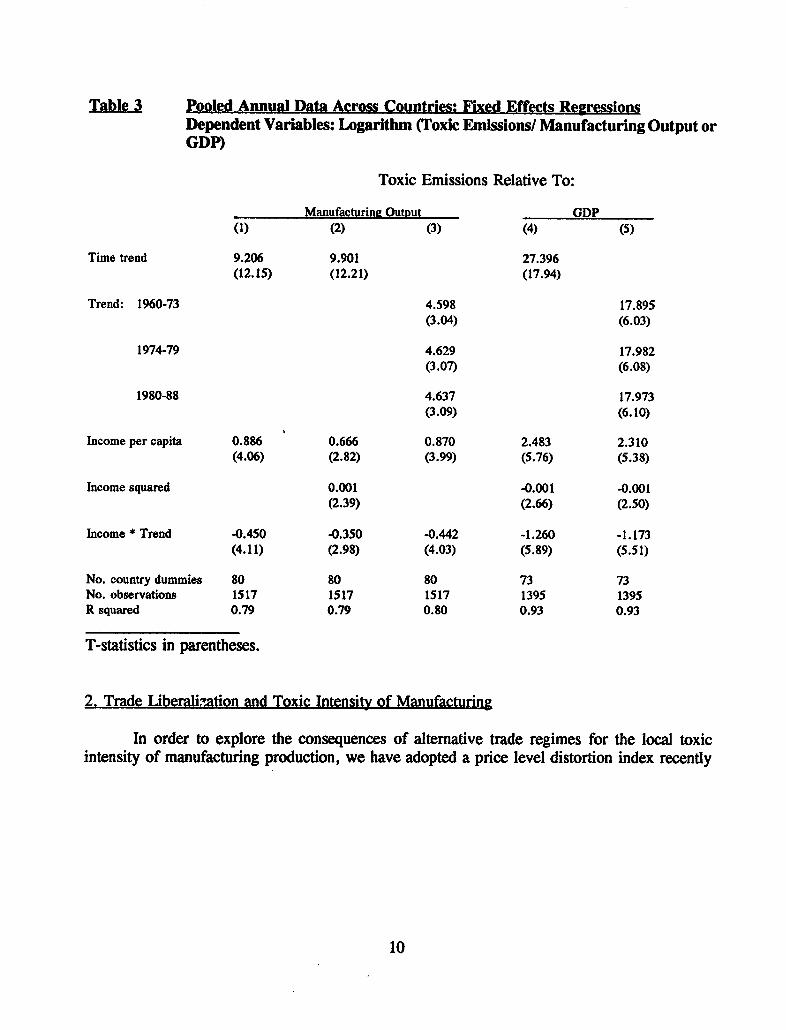
Table 3 Pooled Annual Data Across Countries: Fixed Effects RegressionsDependent Variables: Logarithm (Toxic Emissions/ Manufacturing Output orGDP)
Toxic Emissions Relative To:
Manufacturina Output GDP(1) (2) (3) (4) (5)
Time trend 9.206 9.901 27.396(12.15) (12.21) (17.94)
Trend: 1960-73 4.598 17.895(3.04) (6.03)
1974-79 4.629 17.982(3.07) (6.08)
1980-88 4.637 17.973(3.09) (6.10)
Income per capita 0.886 0.666 0.870 2.483 2.310(4.06) (2.82) (3.99) (5.76) (5.38)
Income squared 0.001 -0.001 -0.001(2.39) (2.66) (2.50)
Income * Trend -0.450 40.350 -0.442 -1.260 -1.173(4.11) (2.98) (4.03) (5.89) (5.51)
No. country dummies 80 80 80 73 73No. observations 1517 1517 1517 1395 1395R squared 0.79 0.79 0.80 0.93 0.93
T-statistics in parentheses.
2. Trade Liberalifation and Toxic Intensity of Manufacturing
In order to explore the consequences of altemative trade regimes for the local toxicintensity of manufacturing production, we have adopted a price level distortion index recently
10

developed by David Dollar (1990) for the period 1973-1985.' For present purposes, Dollar'ssample of 95 developing countries is divided into seven rank groups: rank 1 LDCs exhibit theleast distortion from international price norms; rank 7, the highest. The OECD economies arenot included in Dollar's sample. Two approaches are therefore adopted for the OECD countries:(a) assigning a Dollar rank of 0 to these cases, and; (b) omitting the OECD countries from thesample.
The average annual rate of growth in total toxic intensity relative to manufacturing outputwithin each country is regressed upon Dollar's index of trade openness.9 More precisely,country growth rates in toxic intensity are regressed upon the growth rate :n per capita iricomewithin countries over the relevant time interval, the logarithm of the per capita income at thebeginning of each interval, and the Dollar index interacted with the growth in per capita income.The estimated equations also incorporate a measure of the share of export earnings derived fromfuel exports (in an attempt to capture any impact of related toxic-intensive sectors), but in thebalance this has no apparent effect.
One interpretation of any differences between the three decades is as follows: the 1960'sprovide a pre-environmentalist control, while the 1970's and 1980's may provide evidence aboutshort- and long-run adjustments in the wake of stricter OECD regulation. Table 4 presents theestimated results for the three decades.
For the 1960's, when almost no environmental regulations had yet been imposed by thevarious countries, the regression has no explanatory power; from these data we are unable todetect any significant general trend in toxic intensity change. There is no impact for eitherinitial income or income growth during the 1960s.
In the 1970's and 80's, however, the situation changes sharply. The implications of theresults for these two decades are perhaps most readily seen from the tableau marked as Table5.
8. Briefly, Dollar's index uses the Summers and Heston price index for a constant basket ofcommodities across countries. Under free trade, such a basket of tradeable goods ought to havethe same price everywhere. Departures from unity may then be interpreted as a consequence ofsome form of trade barrier. In practice some nontradeables enter the basket of commodities.Dollar attempts to control for this latter difficulty by regressing the raw index on measures offactor endowments (presumed to affect relative prices of nontradeables across countries). Theresidual from these regressions is then adopted to form the purged index.
9. The annual growth rates are first estimated by fitting a regression of intensity upon timewithin each of three time intervals: 1960-69; 1970-79; 1980-88. The trend growth rate isestimated this way only for countries with at least five observations available within each timeperiod, so the sample size varies slightly from decade to decade.
11

Table 4 Inpact of Income Growth. Level of Development. Openness to Trade and FuelStatus on the Growth Rate of Toxic Intensity, by decade
Dependent Variable: Growth Rate in Toxic Emissions/ Manufacturing Output
Includino OECD Countries Exciuding OECD Countries
60's 70's 80's 60's 70's 8B's
Intercept -0.071 0.053 -0.030 0.03 0.094 -0.067(0.78) (2.39) (1.19) (0.19) (2.39) (1.60)
Growth in per capita 0.096 -0.596 -1.71 -0.008 -0.696 -1.96income (0.19) (1.63) (2.72) (0.30) (1.57) (2.1)
Ln (initial per 0.008 -0.005 0.006 0.001 -0.012 0.012capita income) (0.60) (1.80) (1.65) (0.01) (2.0) (1.9)
Fuel share in exports -0.046 -0.021 -0.003 -0.010 -0.031 -0.016(0.32) (0.834) (0.14) (0.06) (1.09) (0.51)
Dollar's index 0.223 0.589 0.297 0.664Interacted with (1.92) (3.10) (2.10) (2.37)income growth
No. observations 25 56 55 19 44 39
R squared 0.03 0.18 0.19 .01 0.22 0.22
T-statistics in parentheses
This tableau has three dimensions:
Three income levels are represented:Low ($150)Middle ($1800)High ($22000)
Two annual growth rates are shown:Slow (1 %)Fast (6%)
And two level's of Dollar's index are depicted:Open (1)Closed (6)
12

Table 5 Percent Change in Total Toxic Intensity Relative to Manufacturing Output
LOW INCOME COUNTRIES
Policy RegimeOpen Closed
Per CapitaIncome Growth 70s 80s 70s SOS
Slow 2.4 -1.2 3.5 1.8Fast .6 -6.7 7.2 10.9
MIDDLE INCOME COUNTRIES
Policy RegimeOpen Closed
Per CapitaIncome Growth 70s 80s 70s 80s
Slow 1.2 .4 2.3 3.3Fast -.1 -5.2 6.0 12.4
HIGH INCOME COUNTRIESPer CapitaIncome Growth 70s 80s
Slow -.1 1.9Fast -1.9 -3.7
The fundamental importance of policy emerges strikingly in these results. Fast-growingclosed economies experienced very rapid change toward toxic intensive structures in both the1970s and 1980s, with acceleration in the latter decade for both low- and middle-incomedeveloping countries. In contrast, fast-growing open economies experienced essentially toxic-neutral structural change in the 1970s and a strong shift toward less-toxic structure in the 1980s.The same trends are evident in slower-growing economies, but less pronounced. This evidenceleads us to a strong qualification of our earlier conclusions:
While developing countries as a whole had greater toxic intensity growth inthe 1970s and 1980s, trends for individual countries depended heavily on thegrowth rate of income and the policy regime. The story of "toxicdisplacement" seems to have been focused in relatively closed, fast-growingeconomies.
IV. Summary and Conclusions
Several previous studies have asked whether environmental controls imposed in theindustrialized economies are diverting investments in pollution intensive activities off-shore.10
10. Dean (1991) offers a very useful survey of this material.
13

In broad terms these studies reach a negative conclusion: direct investment does not appear tobe stimulated by such regulations, in part because the cost of emission controls is generally atiny fraction of operating costs. Yet direct investment reflects only a portion of what may behappening to world production patterns; technology transfers may occur with no simultaneousdirect investment, and production may readily shift toward a different global distribution withouteither direct investment or technology transfer.
In this paper, a very general test of the displacement hypothesis has been attempted. Timeseries estimates of manufacturing pollution intensity for a large sample of developed anddeveloping countries during the period 1960-1988 have been developed. The results derivedfrom these data may be summarized in terms of the three lines of analysis set out in section 1.4.
* Development and sectoral composition:
(a) As a result of industrial composition shifts, total manufacturing emissionsrelative to GDP grow faster than GDP at lower levels of income per capita, then,at higher levels of income, grow less quickly. In other words, an inverse U-shape is confirmed between industrial pollution intensity and income.
(b) The decline observed in total industrial emissions rela:ive to GDP at higherincome levels, is a result of the declining share of manuf; -"!ring in GDP, ratherthan of any shift toward a cleaner mix of manufacturing activities. The pooledcross-country time series estimates reveal no tendency for toxic intensity ofmanufacturing itself to exhibit an inverse U-shape. On the other hand, the datado indicate that the more rapidly growing high income countries have actuallyenjoyed a negative growth in toxic intensity of their manufacturing mix. To whatextent the latter result is a reflection of more rapid introduction of cleanertechnologies in more rapidly growing economies cannot be discerned, but it iscertainly a potential explanation.
9 OECD environmental regulation and displacement:
It is frequently asserted that stricter regulation of pollution-intensive productionin the OECD countries has led to significant locational displacement, withconsequent acceleration of industrial pollution intensity in developing countries.All our results are consistent with this hypothesis. Both sets of estimates suggestthat the poorest economies have the highest toxic intensity growth. The estimatedtoxic intensity elasticity of income growth for a typical (midrange-distortion) LDCeconomy was apparently negligible in the 1960's, positive in the 1970's, and evenhigher in the 1980's. Of course, one cannot be certain of a causal connectionbetween these decadal patterns and the roughly concurrent shifts in OECDenvironmental policies. The results are nonetheless suggestive of a strongcontributory effect.
14

* LDC economic policy and pollution intensity:
Pollution intensity has grown most rapidly in developing economies that arerelatively closed to world market forces. Relatively closed, fast-growingeconomies experienced very rapid structural transitions toward greater toxicintensity. The opposite seems to have been true, however, for more openeconomies.
More work on this issue clearly needs to be done, but the results in this papersuggest that net toxic displacement toward the LDCs may not have been inevitableduring the past two decades. Restrictive trade policies imposed by the developingcountries themselves may even have been the main stimulus to toxic industrialmigration, rather than regulatory cost differences between the North and South.
It is hoped that these results will suggest future directions for analysis; much remains tobe done. For instance, although the present results suggest that more liberal trade policies amongthe developing countries have focused manufacturing production on a cleaner mix of industries,we still lack evidence of the effects of freer trade policies on the choice of production technique,on waste disposal, on toxicity of consumption activities and environmental harm from changesin agriculture. Moreover, this paper has focused on the global distribution of toxic emissionsrather than upon changes in the global aggregate. It is too early to draw any sweepingconclusions about the connections between protectionist trade policies and environmental effects,but it is hoped that this paper has at least suggested some empirical foundations for the debate.
15

APPENDIX
This appendix presents four types of evidence relating to the international and intertemporalconstancy of toxic intensity for different industries.
1. Constancy Across Measures of Pollution IntensityThe analysis in the text uses the US Environmental Protection Agency's Toxic Release Inventory(TRI) data. Since these data are not available before 1987 (and then only for the U.S.), nointernational or intertemporal series is available for cross checking. Useful indirect evidence canbe obtained, however, by checking the intersectoral correlation between the TRI data and theUS data on Pollution Abatement and Control Expenditures (PACE). Figure A. 1 is a scatter plotof ranks for 19 2-digit industries according to: (a) the percentage of new plant and equipmentexpenditures absorbed by pollution abatement and control; (b) the linear weighted toxic pollutionintensity of the industry. In this graph there is a clear outlier -- SIC 27 (printing and publishing)-- which exhibits high emissions according to the TRI data but very low pollution abatementexpenditures. If this exception is excluded, then pollution intensity (whether total, linear orexponentially weighted) is quite highly correlated with pollution abatement expenditures. (SeeTable A.1).
Table A.1 Rank Correlations: PACE Expenditure IntensIty (19881 and Measures of Toxic Pollution Intensky (19 2-DialtSIC Sectors)
Printing and PLblishing (SIC 27):Toxic Intensity Excluded Included
Unweighted .72 .55Linear Human .76 .55Exponential Human .74 .64
Flaure A.1 PACE Expenditure Intensity Rank (19861 vs. Linear Weiahted Toxic Pollution Intensity Rank (1987) (19 2-Diat SIC Sectos)
PACE Rank
19 +18 +17+16+ *15+14+13+ *12+11+10+ *9+ *8+ *7+ *6+ *S+ *4+ *3+ *2+ *1+ *
I (SIC 27)
1 2 3 4 5 6 7 8 9 10 11 12 13 14 15 16 17 18 19Toxic Intensity Rank
16

2. Constancy Across Countries in the OECDFigure A.2 plots the rank of 13 industries in West Germany during the mid-1970s and the USfor 1975, according to pollution abatement expenditures relative to new investments in plant andequipment. The raw data underlying this graph are presented in Table A.2. There is a clearpositive association in sectoral ranking across the two countries, and in fact the rank correlationis 0.8. Comparable data for other countries (and especially for the LDCs) are not available.However, this two country comparison suggests that industries needing substantial abatementcontrols in one country also require expensive controls in another, despite differences inemphasis on the various pollutants and media of release in the two countries.
Table A.2 Percent of New Plant and Eaulpment Expendkturos on Pollution Control. mid-1970's
WestU.S. Germany*
Nonferrous metals 24.1 8.4Paper 16.8 9.6Stone, cLay, glass 14.3 --Iron, Steel 13.5 10.7PetroLeun 11.8 19.9Chemicals 10.9 11.1Electric power 9.7 --Electrical machinery 5.8 1.9Lumber, furniture, instruments, misc. 5.3 2.4Food, beverages 5.2 3.2Textiles 4.6 1.5R.ubber 4.0 1.9Motor vehicles 3.9 2.0Apparel, leather, tobacco, printing/publishing 2.8 1.5Machinery, except electrical 1.8 1.3Fabricated metals -- .5
*West German data are averages for the period 1971-77Sources: Tietenberg (1988), drawn from various US Surveys of
Current Business; OECD (1985)
17

EFurg A.2 09eotor Poiluton Abatement ExRanditure Intensitny 1nkinas. West Germany vs. United StAteS
West GermanySectoral Rank
14 +
13. *
12 +I ~ ~ ~~~~~* *
11 +
10 1i * *
9 +
81 *
71*6+ *
5 +g*
4 +3 .*
2+ *
1+ *
I
1 2 3 4 5 6 7 8 9 10 11 12 13 14 15
U.S. Sectorat Rank
3. Constancy Over Time in the U.S.In the U.S., sectoral Pollution Abatement Control Expenditure data have been collected sincethe 1970's. Table A.3 presents correlations for PACE expenditure intensities (PACE divided bytotal shipment value) in 1974, 1980, and 1986."1 The correlations are very high and show nosign of decreasing over time. We conclude that, in the U.S. at least, sectoral "heavy polluters"have retained their identity since 1970.
Table A.3 Correlations: Seetoral PACE Exoendkure Intensities (19 2-DiLt SIC Seotorsl
1974 1980
1980 .941986 .94 .94
4. Process and Abatement ConsiderationsEconomists generally assume that sectoral technology mix will be different in developing
11. Our thanks to Hamid Alavi for generously making these data available to us.
18

countries, and that pollution abatement equipment will not be installed in the absence of formalregulation. Empirical work on the technology question from an environmental perspective hasonly recently begun, and survey evidence on abatement choices is practically nonexistent. A fewrecent studies, however, raise some doubts about the conventional wisdom.
A twenty-five year analysis of international diffusion for wood pulping technology by Wheelerand Martin (1991) finds that developing countries with open trade policies exhibit no lag inadoption of the newest and cleanest technology. Huq and Wheeler (1991, forthcoming) reportsurvey results for a small sample of pulp and fertilizer plants in Bangladesh. The combinationof public ownership and aid dependency in this extremely poor economy has led to technologyadoption which is largely dictated by prevailing norms in donor countries. Although formalregulation is almost entirely lacking, many large, polluting Bangladeshi enterprises have alreadyinstituted monetary compensation and first-level effluent treatment in response to strong pressurefrom neighboring communities.
There is at present no strongly persuasive evidence about the environmentally relevant directionof departures from typical OECD technology mix in developing countries. Wheeler and Huq(1991, forthcoming) find rapid adoption of the newest, least polluting (electric arc) steeltechnology in many developing countries. This, coupled with newcomer avoidance of the highly-polluting open hearth process, which remained important in many OECD countries during the1970's, implies average pollution intensities which may be quite close to typical OECDintensities, even allowing for significant differences in abatement. Thus Wheeler and Martin(1992, forthcoming) find that slower average adoption of new clean pulping technology bydeveloping countries is almost exactly counterbalanced by slower average decline in the oldesttechnology (mechanical pulping), which is also quite clean.
5. ConclusionThis evidence, although admittedly sparse, nonetheless suggests that an assumption of constantrelative toxic intensities within industries, both across countries and though time, may not be tooegregious: the adopted measures of toxic intensity are highly correlated with PACE expenditureintensity; for the U.S. and West Germany aggregate sectoral PACE expenditure intensities arehighly correlated; within the U.S., PACE expenditure intensities have very high intertemporalcorrelations; and case study evidence suggests a number of reasons why LDC technologies arenot necessarily more pollution intensive, as often presumed.
19

REF'ERENCES
Dean, Judith, 1991, "Trade and the Environment: A Survey of the Literature," paper preparedfor the World Development Report 1992; forthcoming in Policy Research Working Paper Series.
Dollar, David, 1990, Outward Orientation and Growth: An Empirical Study Using a Price-BasedMeasure of Openness, (Washington: World Bank)
Grossman, Gene M. and Alan B. Krueger, 1991, "Environmental Impacts of a North AmericanFree Trade Agreement," paper prepared for the conference on the US-Mexico Free TradeAgreement.
Huq, Mainul, and David Wheeler, 1991, "Industrial Cleanup Without Regulation: PublicEnterprises in Bangladesh", mimeo, Environment Department, World Bank.
Lucas, "Toxic Releases by Manufacturing: World Patterns and Policies," prepared as aBackground Paper for the World Development Report 1992; available in the Policy ResearchWorking Paper Series.
Martin, Paul, David Wheeler, Mala Hettige, and Ralph Stengren, 1991, The Industrial PollutionProjection System: Concept, Initial Development, and Critical Assessment, (Washington: WorldBank)
OECD, 1985, Environmental Policy and Technical Change, (Paris: OECD)
UNCTAD, 1987, Handbook of Trade Control Measures of Developing Countries
Tietenberg, Tom, 1988, Enyironmental and Natural Resource Economics, (Chicago: ScottForesman)
Wheeler, David, and Paul Martin, 1991, Prices. Policies, and the International Diffusion ofClean Technology: The Case of Wood Puip Production, (Washington: World Bank)
, 1992 (forthcoming), 'Cross Country Projection of Pollution Intensity:A Test on Technology Mix in Wood Pulp,"mimeo. (Washington: World Bank)
Wheeler, David, and Mainul Huq, 1991, "Technical Change, International Diffusion, andEnvironmental Impact in the Steel Industry: 1960-1989", mimeo. (Washington: World Bank)
20

Policy Research Working Paper Serles
ContactTitle Author Date for paper
WPS1047 C6te d'lvoire: Private Sector Enrique Rueda-Sabater November 1992 P. InfanteDynamics and Constraints Andrew Stone 37642
WPS1048 Targets and Indicators in World George Baldwin November 1992 0. NadoraBank Population Projects 31091
WPS1049 Money Demand and Seignorage- William Easterly November 1992 R. MartinMaximizing Inflation Paolo Mauro 31448
Klaus Schmidt-Hebbel
WP31050 Marginal Income Tax Rates and William Easterly November 1992 R. MartinEconomic Growth in Developing Sergio Rebelo 314448Countries
WPS1051 The Legal Framework for Private Cheryl W. Gray November 1992 M. BergSector Activity in the Czech and 36969Slovak Federal Republic
WPS1052 A Reappraisal of How Oral Hoda Rashad November 1992 0. NadoraRehydration Therapy Affected Mortality 31091in Egypt
WPS1053 Development of the Zimbabwe Alex F. Zinanga December 1992 0. NadoraFamily Planning Program 31091
WPS1054 Distributional Impact of Cash and Branko Milanovic December 1992 S. MoussaIn-Kind Social Transfers in Eastern 39019Europe and Russia
WPS1055 Wealth, Weather Risk, and the Mark R. Rosenzweig December 1992 C. BantonComposition and Profitability of Hans P. Binswanger 34783Agricultural Investments
WPS1056 Earnings and Education in Latin George Psacharopoulos December 1992 L. LongoAmerica: Assessing Priorities for Ying Chu Ng 39244Schooling Investments
WPS1057 Measuring the Incomes of Economies Socio-Economic Data December 1992 E. Zamoraof the Former Soviet Union Division 33706
International EconomicsDepartment
WPS1 058 The Pricing of Country Funds and Ishac Diwan December 1992 R. VoTheir Role in Capital Mobilization for Vihang Errunza 31047Emerging Economies Lemna W. Senbet
WPS1 059 Political Economy of Policy Reform Ziya bnis December 1992 S. Gustafsonin Turkey in the 1980s Stev3n B. Webb 37856

Policy Research Working Paper Series
ContactTitle Author Date for paper
WPS1060 Economies of the Former Soviet Dmitri Steinberg December 1992 E. ZamoraUnion. An Input-Output Approach 33706to the 1987 National Accounts
WPS1061 Dynamic Response to Foreign Klaus Schmidt-Hebbel December 1992 A. MaranonTransfers and Terms-of-Trade Luis Serven 39074Shocks in Open Economies
WPS1 062 Economic Development, Robert E. B. Lucas December 1992 WDREnvironmental Regulation, and the David Wheeler 31393International Migration of Toxic Hemamala HettigeIndustrial Pollution, 1960-88