Embed Size (px)
Citation preview
The Economic and Social Review, Vol. 42, No. 2, Summer, 2011, pp. 213–235
POLICY PAPER
The Distributional Effects of Value Added Tax
in Ireland
EIMEAR LEAHYEconomic and Social Research Institute, Dublin
SEÁN LYONSEconomic and Social Research Institute, DublinTrinity College Dublin
RICHARD S. J. TOLEconomic and Social Research Institute, DublinTrinity College DublinInstitute for Environmental Studies, Vrije Universiteit, AmsterdamDepartment of Spatial Economics, Vrije Universiteit, Amsterdam
Abstract: In this paper we examine the distributional effects of Value Added Tax (VAT) in Ireland.Using the 2004/2005 Household Budget Survey, we assess the amount of VAT that householdspay as a proportion of weekly disposable income. We measure VAT payments by equivalisedincome decile, households of different composition and different household sizes. The currentsystem is highly regressive. With the use of a micro-simulation model we also estimate the impactof changing the VAT rate on certain groups of items and the associated change in revenue. We alsoconsider how the imposition of a flat rate across all goods and services would affect households indifferent categories. The Irish Government has recently announced that it proposes to increasethe standard rate of VAT to 22 per cent in 2013 and to 23 per cent in 2014. We examine thedistributional implications of such increases. The general pattern of results shows that thosehardest hit are households in the first income decile, households in rural areas, 6 personhouseholds and households containing a single adult with children.
213
Acknowledgements: We are grateful to Anne Jennings and Donal McCarthy for data support. Anearlier version of this paper was presented at the Economic and Social Research Institute;participants had excellent comments that helped to improve the exposition. We are also gratefulto Leo Varadkar, T.D. for providing useful comments on an earlier draft of the paper.
06 Tol article_ESRI Vol 42-1 12/07/2011 10:37 Page 213
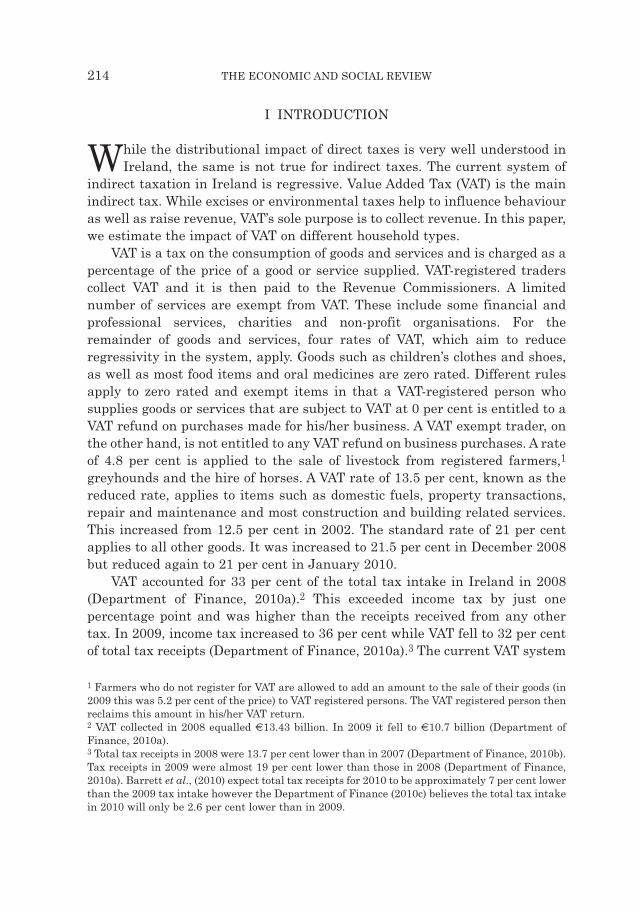
I INTRODUCTION
While the distributional impact of direct taxes is very well understood inIreland, the same is not true for indirect taxes. The current system of
indirect taxation in Ireland is regressive. Value Added Tax (VAT) is the mainindirect tax. While excises or environmental taxes help to influence behaviouras well as raise revenue, VAT’s sole purpose is to collect revenue. In this paper,we estimate the impact of VAT on different household types.
VAT is a tax on the consumption of goods and services and is charged as apercentage of the price of a good or service supplied. VAT-registered traderscollect VAT and it is then paid to the Revenue Commissioners. A limitednumber of services are exempt from VAT. These include some financial andprofessional services, charities and non-profit organisations. For theremainder of goods and services, four rates of VAT, which aim to reduceregressivity in the system, apply. Goods such as children’s clothes and shoes,as well as most food items and oral medicines are zero rated. Different rulesapply to zero rated and exempt items in that a VAT-registered person whosupplies goods or services that are subject to VAT at 0 per cent is entitled to aVAT refund on purchases made for his/her business. A VAT exempt trader, onthe other hand, is not entitled to any VAT refund on business purchases. A rateof 4.8 per cent is applied to the sale of livestock from registered farmers,1
greyhounds and the hire of horses. A VAT rate of 13.5 per cent, known as thereduced rate, applies to items such as domestic fuels, property transactions,repair and maintenance and most construction and building related services.This increased from 12.5 per cent in 2002. The standard rate of 21 per centapplies to all other goods. It was increased to 21.5 per cent in December 2008but reduced again to 21 per cent in January 2010.
VAT accounted for 33 per cent of the total tax intake in Ireland in 2008(Department of Finance, 2010a).2 This exceeded income tax by just onepercentage point and was higher than the receipts received from any othertax. In 2009, income tax increased to 36 per cent while VAT fell to 32 per centof total tax receipts (Department of Finance, 2010a).3 The current VAT system
214 THE ECONOMIC AND SOCIAL REVIEW
1 Farmers who do not register for VAT are allowed to add an amount to the sale of their goods (in2009 this was 5.2 per cent of the price) to VAT registered persons. The VAT registered person thenreclaims this amount in his/her VAT return. 2 VAT collected in 2008 equalled €13.43 billion. In 2009 it fell to €10.7 billion (Department ofFinance, 2010a). 3 Total tax receipts in 2008 were 13.7 per cent lower than in 2007 (Department of Finance, 2010b).Tax receipts in 2009 were almost 19 per cent lower than those in 2008 (Department of Finance,2010a). Barrett et al., (2010) expect total tax receipts for 2010 to be approximately 7 per cent lowerthan the 2009 tax intake however the Department of Finance (2010c) believes the total tax intakein 2010 will only be 2.6 per cent lower than in 2009.
06 Tol article_ESRI Vol 42-1 12/07/2011 10:37 Page 214
has been criticised for being too regressive (Barrett and Wall, 2006) as has thesystem in the UK (Crawford et al., 2008). However, the distributional impactof VAT payments has received very little attention in Ireland to date. To ourknowledge, the only paper on this topic is that of Barrett and Wall (2006) whostudied the distributional impacts of the 2000 and 2004 VAT reforms. Theyalso estimated how different income groups would be affected by imposinguniform rates of 13.5 per cent and 21 per cent. Results show that householdsat the lower end of the income distribution pay a higher proportion of incomein VAT relative to higher income households. In fact, in 2004 households in thelowest equivalised income decile spent 14.5 per cent of income in VAT whereasfor the top income decile, the figure was only 6.8 per cent.
The introduction of a uniform rate is favoured by some commentators(Durkan, 2010) because it would reduce the variability of indirect tax receiptswhen demand weakens and it would also broaden the tax base. The thirdreport of the Commission on Taxation (1984) recommended that VAT shouldbe levied at a single rate on as broad a base as possible because it would reduceadministrative costs and enhance efficiency. However, a flat rate across allgoods and services could still be regressive if the proportion of income saveddiffered by income decile. For example, if poor households were to spend all oftheir money and rich households were to save some money, then the poorwould still be paying a higher proportion of their income in VAT (Barrett andWall, 2006).4
In this paper we update and considerably extend the work of Barrett andWall (2006). We use a more recent dataset with which we create a micro-simulation model for VAT in Ireland. We analyse the distribution of VAT pay -ments across different household types as well as across equivalised incomedeciles based on the expenditure profile of the 2004/05 Household BudgetSurvey (HBS), (Central Statistics Office, 2007a). We also assess what thelikely distribu tional effects of a variety of rate changes would be for privatehouseholds in Ireland. The change in revenue that is collected as a result ofchanging VAT rates is also considered. Because we analyse the distributionalimpacts of VAT using household expenditure data, we cannot take into accountthe VAT that is paid by businesses or establishments in which people residecollectively such as hospitals, hostels or prisons. Thus the changes in revenuethat result from altering the VAT rates refer to revenue from privatehouseholds only.
VAT is just one form of indirect taxation in Ireland and is generallyregarded as a rather blunt instrument for redistribution. Excise duty is
THE DISTRIBUTIONAL EFFECTS OF VALUE ADDED TAX IN IRELAND 215
4 One could argue that this tax will be paid when savings are eventually spent.
06 Tol article_ESRI Vol 42-1 12/07/2011 10:37 Page 215
another important indirect tax and accounted for over 14 per cent of the totaltax intake in 2009 (Department of Finance, 2010a). Excise is a duty that islevied on selected categories of goods; mineral oils, alcohol and alcoholicbeverages, and manufactured tobacco. It is also chargeable on some activitiessuch as betting and premises such as those which have a license to sell liquor.In the 2010 Budget, excise was extended to selected fuels for heating as wellas petrol and diesel: the carbon tax. Excise is levied as a euro amount on thevolume or quantity sold rather than as a percentage of the price as is the casewith VAT.5 Rates also vary depending on the product. Ideally, we would like toanalyse the redistributive impact of the entire indirect tax system but we arelimited by the available data. However, this paper offers an exploratoryanalysis of excises.
The distributional effects of direct taxation have received more attentionthan those of indirect taxation. The ESRI’s tax benefit model, SWITCH, usesdata from the Central Statistics Office’s Survey on Income and LivingConditions (EU-SILC) to simulate welfare and income tax changes. Theresult ing effects on different household types and income levels can then beassessed. Most recently, the distributional impact of replacing PRSI contribu -tions, the health contribution and the income levy with a universal socialcharge (assumed to be 7.5 per cent of gross income) was examined. Resultsshow that the top 20 per cent of earners in Ireland would gain but losses wouldbe incurred by the remainder of workers (Callan et al., 2010). Thedistributional impact of a carbon tax in Ireland was examined by Callan et al.(2009). The authors find that a carbon tax of €20/tCO2 would be regressive. Ina similar study Verde and Tol (2009) find that households in the lowest incomedecile would pay over 2 per cent of their disposable income in carbon taxes ifthe tax was €20/t CO2. The highest earners, on the other hand, would pay onlyabout 0.3 per cent of their disposable income. The carbon tax that wasintroduced in Budget 2010 is €15/t CO2. In 2010 Callan et al., studied thedistributional impacts of a property tax in Ireland. The authors assume a taxof 0.4 per cent of the capital value of the property and find that households inthe third income decile would be worst hit. Income exemption limits andmarginal relief would be needed to protect low income households.
We also consider the changes in revenue that result from changes in therates of VAT. The expenditure pattern is that of the 2004/2005 HBS. TotalVAT collected in 2005 was €12.1 billion. We estimate that the total VAT intakefrom private households based on the expenditure items included in the HBS
216 THE ECONOMIC AND SOCIAL REVIEW
5 In the case of cigarettes, excise is charged at 183.42 per thousand together with an amount equalto 18.25 per cent of the price at which the cigarettes are sold by retail.
06 Tol article_ESRI Vol 42-1 12/07/2011 10:37 Page 216
was €5.8 billion.6 Using Housing Statistics data from The Department of theEnvironment, Heritage and Local Government, we estimate that the total VATpayments on the sale of houses in 2005 were over €3 billion (DoEHLG, 2006).The remaining €3 billion comes from a variety of sources. These include VATpayments from households on services such as legal services and estate agents(which are not captured accurately in the HBS) as well as VAT paid by smallbusinesses that are not entitled to VAT refunds. The VAT paid by people whoreside in residences such as nursing homes and army barracks is also excludedfrom our study. This paper continues as follows. Section II presents the dataand methodology. In Section III we discuss the results and Section IV providesa discussion and conclusion.
II DATA AND METHODOLOGY
The data used is the anonymised data file for the 2004/2005 HBS (CSO,2007a). This is a survey of a representative random sample of all privatehouseholds in Ireland. The main aim of the HBS is to determine householdexpenditure in order to update the weightings used for the Consumer PriceIndex. Detailed information is also provided on income, householdcharacteristics and household facilities. In 2004/2005, 6,884 private house -holds participated in the survey.
Respondents are asked to fill out an expenditure diary in which they listall items bought and the relevant amount spent in the previous week.Expenditure on items such as domestic fuels is recorded over a longer period.In order to estimate the amount that each household pays in VAT per week,we assign the appropriate VAT rate (exempt, 0 per cent, 4.8 per cent, 13.5 percent or 21 per cent) to 1,469 expenditure items recorded in the survey. Thewebsite of the Office of the Revenue Commissioners (2010) providedinformation on the appropriate rates for each item in both 2009 and 2010. TheHBS provides a household equivalisation factor based on a Eurostatdefinition. This scale counts the first adult in the household as one, otheradults are given a value of 0.7 and children are given a value of 0.5. We canthus assess the proportion of weekly disposable income spent in VAT byequivalised income decile. We also compare the results using differentequivalisation factors. Results are weighted using an appropriate grossingfactor. We also compare VAT spending in urban versus rural locations and
THE DISTRIBUTIONAL EFFECTS OF VALUE ADDED TAX IN IRELAND 217
6 We analyse VAT expenditure as a proportion of disposable income by households of differentsizes in the HBS. We apply these expenditure patterns to all households in Ireland using the 2006Census (CSO, 2007b).
06 Tol article_ESRI Vol 42-1 12/07/2011 10:37 Page 217
across households of different size and composition. We then simulate whatthe distributional impacts of various rate changes would be. First, we assumea flat rate of 10.9 per cent on all goods and services. We then increase this to13.5 per cent and 21 per cent. A flat rate of 7 per cent is also considered.7
We also assess the impacts of taxing food, alcohol, tobacco, children’sclothing and fuel at various rates. Food is currently subject to VAT at 0 percent, 13.5 per cent and 21 per cent, making the system somewhat complex.8
The 2004/05 HBS shows that .08 per cent of all food and alcohol spending fallsin the exempt category, 46 per cent is zero rated, 20 per cent is at a rate of 13.5per cent and 34 per cent is at the 21 per cent rate. 73 per cent of VAT collectedon food and alcohol comes from the standard rate and the remainder comesfrom the reduced rate. We are interested in seeing what the effects of taxingall food at the same rate would be. Like food, fuel is a necessary item, thepurchase of which tends to impact more heavily on poorer households. Thus,we examine various rate changes on these goods. We analyse the effect of ratechanges on children’s clothing because children’s clothing is currently zerorated so as to reduce regressivity. The rates on alcohol and tobacco are alsoconsidered because, like fuel these goods are heavily taxed. They are subjectto both VAT and excise.
In common with most tax benefit models, we assume that demand does notchange when VAT changes. This is a reasonable assumption for goods with lowprice elasticities such as basic food items and fuel, but less realistic for luxurygoods. The Irish Government states in the National Recovery Plan that thestandard rate of VAT will increase to 22 per cent in 2013 and to 23 per cent in2014. We analyse the distributional implications of such increases. The resultsare presented in the next section.
III RESULTS
In this section the distributional effects of various VAT rates for privatehouseholds are discussed. We consider the imposition of a flat VAT ratebecause this would lower administrative costs and remove market distortions.However, the introduction of a flat rate may make the system more regressivethan it is at present. Thus, we analyse how a flat VAT rate affects households
218 THE ECONOMIC AND SOCIAL REVIEW
7 Article 97(1) of Council Directive 2006/112/EC (Official Journal of the European Union, 2006)states that from 1 January 2006 until 31 December 2010, the standard rate may not be less than15 per cent. Thus, our analyses of standard rates lower than this are purely academic.8 The motivation for different rates on food is to reduce regressivity. Staple foods are zero-rated,luxury foods are standard-rated, and in-between foods are reduced-rated. However, the manner inwhich food items are assigned to different groups is arbitrary. For example, chocolate chip biscuitsare subject to VAT at 13.5 per cent while chocolate biscuits are charged at 21 per cent.
06 Tol article_ESRI Vol 42-1 12/07/2011 10:37 Page 218
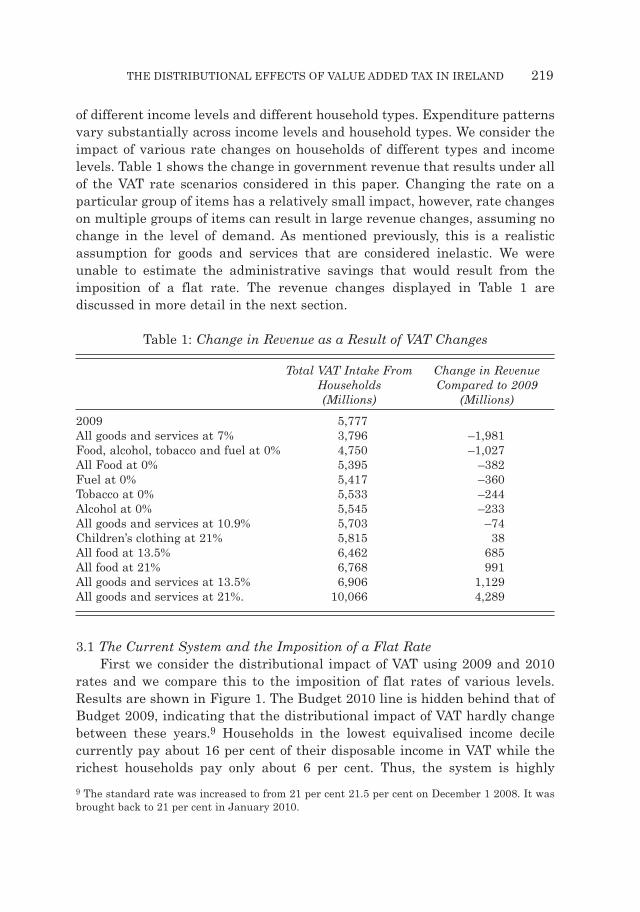
of different income levels and different household types. Expenditure patternsvary substantially across income levels and household types. We consider theimpact of various rate changes on households of different types and incomelevels. Table 1 shows the change in government revenue that results under allof the VAT rate scenarios considered in this paper. Changing the rate on aparticular group of items has a relatively small impact, however, rate changeson multiple groups of items can result in large revenue changes, assuming nochange in the level of demand. As mentioned previously, this is a realisticassumption for goods and services that are considered inelastic. We wereunable to estimate the administrative savings that would result from theimposition of a flat rate. The revenue changes displayed in Table 1 arediscussed in more detail in the next section.
Table 1: Change in Revenue as a Result of VAT Changes
Total VAT Intake From Change in Revenue Households Compared to 2009(Millions) (Millions)
2009 5,777All goods and services at 7% 3,796 –1,981Food, alcohol, tobacco and fuel at 0% 4,750 –1,027All Food at 0% 5,395 –382Fuel at 0% 5,417 –360Tobacco at 0% 5,533 –244Alcohol at 0% 5,545 –233All goods and services at 10.9% 5,703 –74Children’s clothing at 21% 5,815 38All food at 13.5% 6,462 685All food at 21% 6,768 991All goods and services at 13.5% 6,906 1,129All goods and services at 21%. 10,066 4,289
3.1 The Current System and the Imposition of a Flat RateFirst we consider the distributional impact of VAT using 2009 and 2010
rates and we compare this to the imposition of flat rates of various levels.Results are shown in Figure 1. The Budget 2010 line is hidden behind that ofBudget 2009, indicating that the distributional impact of VAT hardly changebetween these years.9 Households in the lowest equivalised income decilecurrently pay about 16 per cent of their disposable income in VAT while therichest households pay only about 6 per cent. Thus, the system is highly
THE DISTRIBUTIONAL EFFECTS OF VALUE ADDED TAX IN IRELAND 219
9 The standard rate was increased to from 21 per cent 21.5 per cent on December 1 2008. It wasbrought back to 21 per cent in January 2010.
06 Tol article_ESRI Vol 42-1 12/07/2011 10:37 Page 219
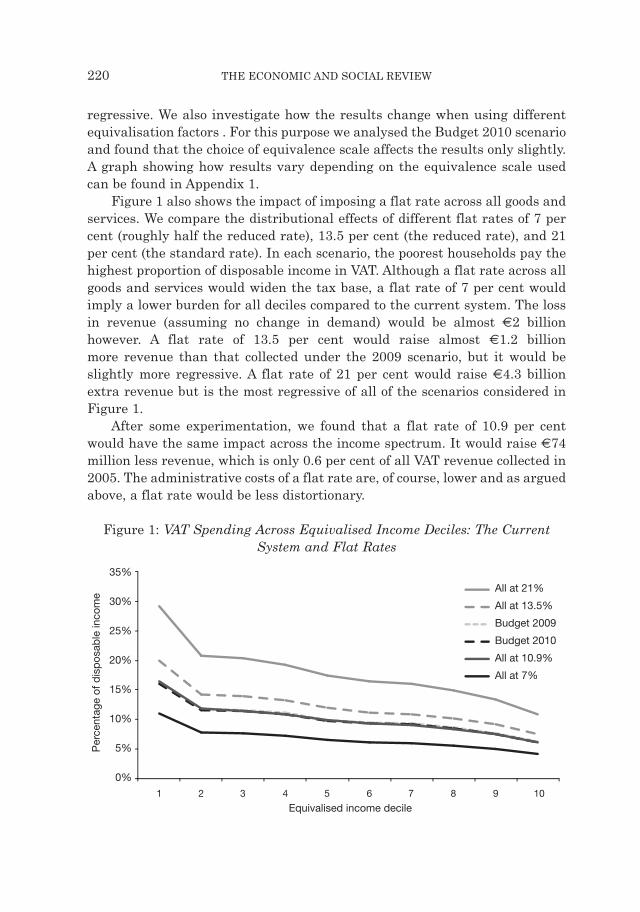
regressive. We also investigate how the results change when using differentequivalisation factors . For this purpose we analysed the Budget 2010 scenarioand found that the choice of equivalence scale affects the results only slightly.A graph showing how results vary depending on the equivalence scale usedcan be found in Appendix 1.
Figure 1 also shows the impact of imposing a flat rate across all goods andservices. We compare the distributional effects of different flat rates of 7 percent (roughly half the reduced rate), 13.5 per cent (the reduced rate), and 21per cent (the standard rate). In each scenario, the poorest households pay thehighest proportion of disposable income in VAT. Although a flat rate across allgoods and services would widen the tax base, a flat rate of 7 per cent wouldimply a lower burden for all deciles compared to the current system. The lossin revenue (assuming no change in demand) would be almost €2 billionhowever. A flat rate of 13.5 per cent would raise almost €1.2 billion more revenue than that collected under the 2009 scenario, but it would beslightly more regressive. A flat rate of 21 per cent would raise €4.3 billionextra revenue but is the most regressive of all of the scenarios considered inFigure 1.
After some experimentation, we found that a flat rate of 10.9 per centwould have the same impact across the income spectrum. It would raise €74million less revenue, which is only 0.6 per cent of all VAT revenue collected in2005. The administrative costs of a flat rate are, of course, lower and as arguedabove, a flat rate would be less distortionary.
Figure 1: VAT Spending Across Equivalised Income Deciles: The CurrentSystem and Flat Rates
220 THE ECONOMIC AND SOCIAL REVIEW
Perc
enta
ge o
f d
isp
osab
le inco
me
35%
30%
25%
20%
15%
10%
5%
0%
All at 21%
All at 13.5%
Budget 2009
Budget 2010
All at 10.9%
All at 7%
1 2 3 4 5 6 7 8 9 10
Equivalised income decile
06 Tol article_ESRI Vol 42-1 12/07/2011 10:37 Page 220
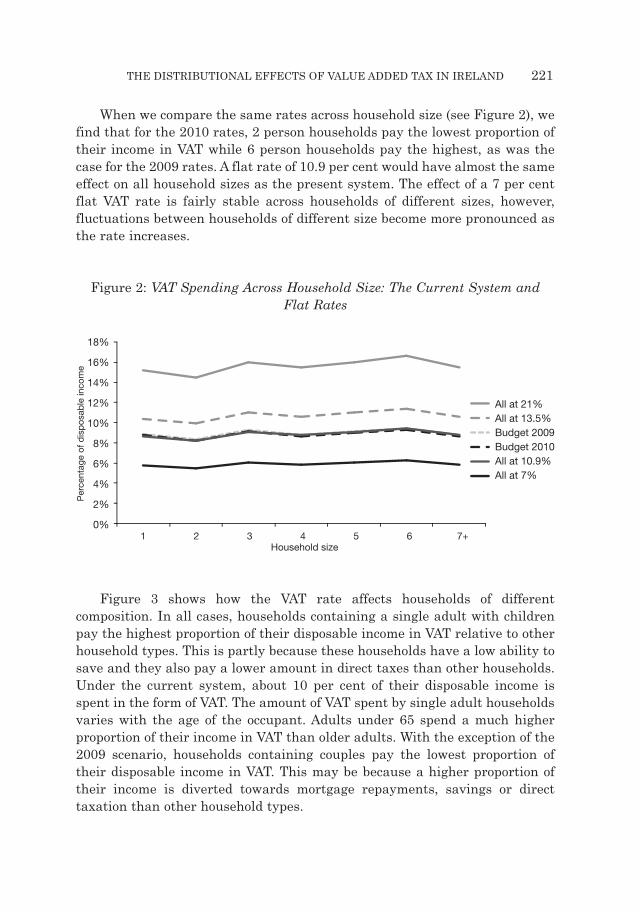
When we compare the same rates across household size (see Figure 2), wefind that for the 2010 rates, 2 person households pay the lowest proportion oftheir income in VAT while 6 person households pay the highest, as was thecase for the 2009 rates. A flat rate of 10.9 per cent would have almost the sameeffect on all household sizes as the present system. The effect of a 7 per centflat VAT rate is fairly stable across households of different sizes, however,fluctuations between households of different size become more pronounced asthe rate increases.
Figure 2: VAT Spending Across Household Size: The Current System andFlat Rates
Figure 3 shows how the VAT rate affects households of differentcomposition. In all cases, households containing a single adult with childrenpay the highest proportion of their disposable income in VAT relative to otherhousehold types. This is partly because these households have a low ability tosave and they also pay a lower amount in direct taxes than other households.Under the current system, about 10 per cent of their disposable income isspent in the form of VAT. The amount of VAT spent by single adult householdsvaries with the age of the occupant. Adults under 65 spend a much higherproportion of their income in VAT than older adults. With the exception of the2009 scenario, households containing couples pay the lowest proportion oftheir disposable income in VAT. This may be because a higher proportion oftheir income is diverted towards mortgage repayments, savings or directtaxation than other household types.
THE DISTRIBUTIONAL EFFECTS OF VALUE ADDED TAX IN IRELAND 221P
erc
enta
ge o
f d
isp
osab
le inco
me
18%
16%
14%
12%
10%
8%
6%
4%
2%
0%
All at 21%
All at 13.5%
Budget 2009
Budget 2010
All at 10.9%
All at 7%
1 2 3 4 5 6 7+Household size
06 Tol article_ESRI Vol 42-1 12/07/2011 10:37 Page 221
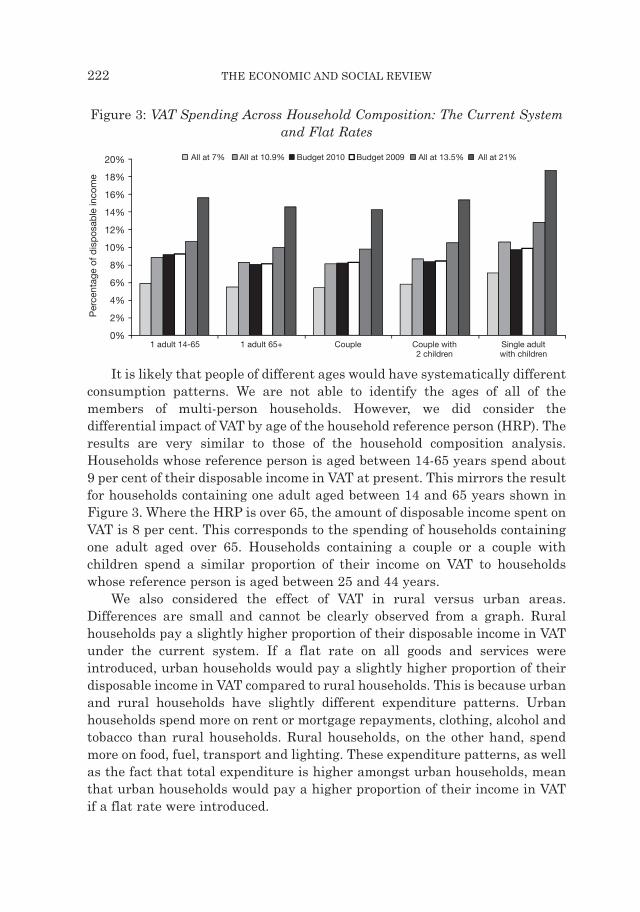
Figure 3: VAT Spending Across Household Composition: The Current Systemand Flat Rates
It is likely that people of different ages would have systematically differentconsumption patterns. We are not able to identify the ages of all of themembers of multi-person households. However, we did consider thedifferential impact of VAT by age of the household reference person (HRP). Theresults are very similar to those of the household composition analysis.Households whose reference person is aged between 14-65 years spend about9 per cent of their disposable income in VAT at present. This mirrors the resultfor households containing one adult aged between 14 and 65 years shown inFigure 3. Where the HRP is over 65, the amount of disposable income spent onVAT is 8 per cent. This corresponds to the spending of households containingone adult aged over 65. Households containing a couple or a couple withchildren spend a similar proportion of their income on VAT to householdswhose reference person is aged between 25 and 44 years.
We also considered the effect of VAT in rural versus urban areas.Differences are small and cannot be clearly observed from a graph. Ruralhouseholds pay a slightly higher proportion of their disposable income in VATunder the current system. If a flat rate on all goods and services wereintroduced, urban households would pay a slightly higher proportion of theirdisposable income in VAT compared to rural households. This is because urbanand rural households have slightly different expenditure patterns. Urbanhouseholds spend more on rent or mortgage repayments, clothing, alcohol andtobacco than rural households. Rural households, on the other hand, spendmore on food, fuel, transport and lighting. These expenditure patterns, as wellas the fact that total expenditure is higher amongst urban households, meanthat urban households would pay a higher proportion of their income in VATif a flat rate were introduced.
222 THE ECONOMIC AND SOCIAL REVIEW
20%
18%
16%
14%
12%
10%
8%
6%
4%
2%
0%
Perc
enta
ge o
f d
isp
osab
le inco
me
1 adult 14-65 1 adult 65+ Couple Couple with2 children
Single adultwith children
All at 7% All at 10.9% Budget 2010 Budget 2009 All at 13.5% All at 21%
06 Tol article_ESRI Vol 42-1 12/07/2011 10:37 Page 222
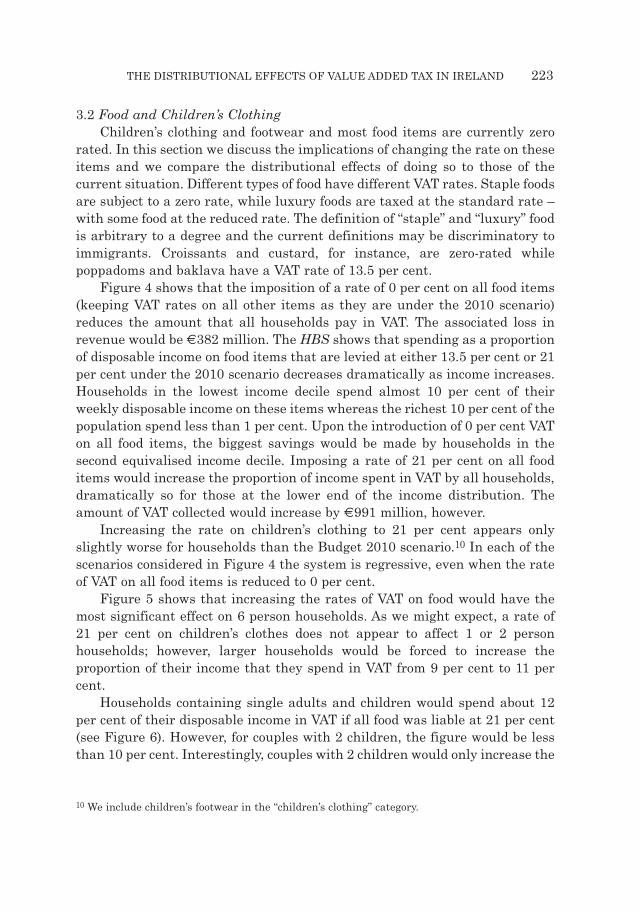
3.2 Food and Children’s ClothingChildren’s clothing and footwear and most food items are currently zero
rated. In this section we discuss the implications of changing the rate on theseitems and we compare the distributional effects of doing so to those of thecurrent situation. Different types of food have different VAT rates. Staple foodsare subject to a zero rate, while luxury foods are taxed at the standard rate –with some food at the reduced rate. The definition of “staple” and “luxury” foodis arbitrary to a degree and the current definitions may be discriminatory toimmigrants. Croissants and custard, for instance, are zero-rated whilepoppadoms and baklava have a VAT rate of 13.5 per cent.
Figure 4 shows that the imposition of a rate of 0 per cent on all food items(keeping VAT rates on all other items as they are under the 2010 scenario)reduces the amount that all households pay in VAT. The associated loss inrevenue would be €382 million. The HBS shows that spending as a proportionof disposable income on food items that are levied at either 13.5 per cent or 21per cent under the 2010 scenario decreases dramatically as income increases.Households in the lowest income decile spend almost 10 per cent of theirweekly disposable income on these items whereas the richest 10 per cent of thepopulation spend less than 1 per cent. Upon the introduction of 0 per cent VATon all food items, the biggest savings would be made by households in thesecond equivalised income decile. Imposing a rate of 21 per cent on all fooditems would increase the proportion of income spent in VAT by all households,dramatically so for those at the lower end of the income distribution. Theamount of VAT collected would increase by €991 million, however.
Increasing the rate on children’s clothing to 21 per cent appears onlyslightly worse for households than the Budget 2010 scenario.10 In each of thescenarios considered in Figure 4 the system is regressive, even when the rateof VAT on all food items is reduced to 0 per cent.
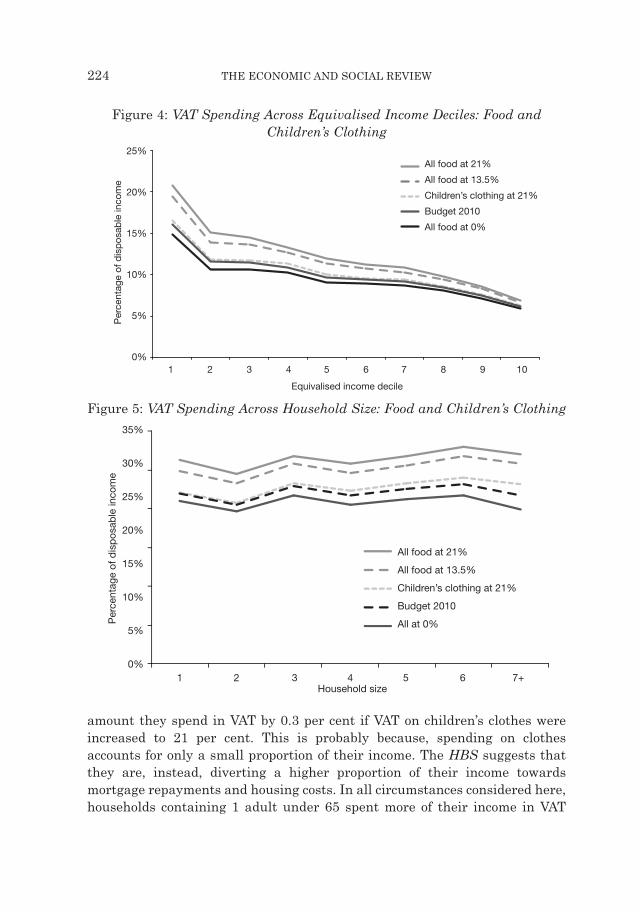
Figure 5 shows that increasing the rates of VAT on food would have themost significant effect on 6 person households. As we might expect, a rate of21 per cent on children’s clothes does not appear to affect 1 or 2 personhouseholds; however, larger households would be forced to increase theproportion of their income that they spend in VAT from 9 per cent to 11 percent.
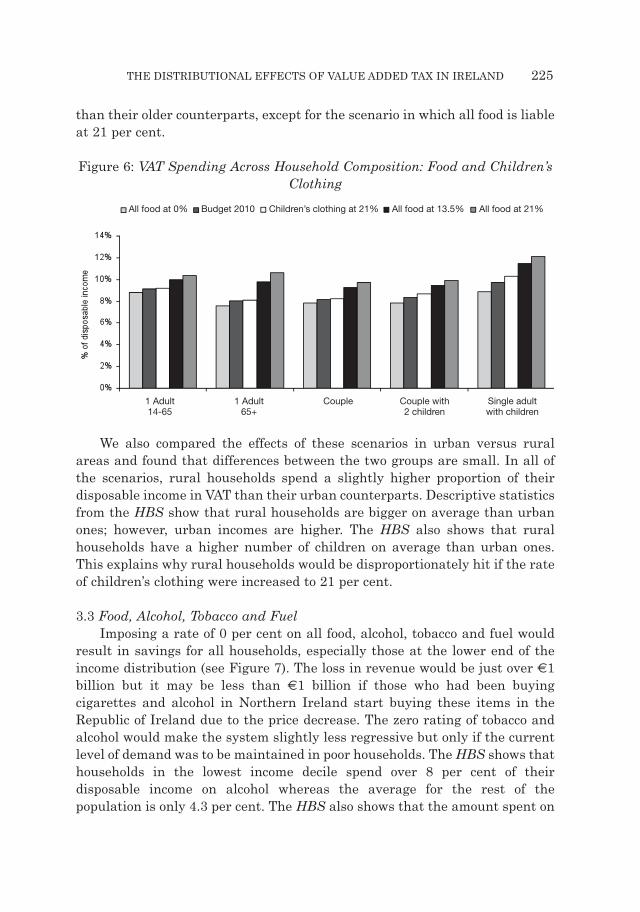
Households containing single adults and children would spend about 12per cent of their disposable income in VAT if all food was liable at 21 per cent(see Figure 6). However, for couples with 2 children, the figure would be lessthan 10 per cent. Interestingly, couples with 2 children would only increase the
THE DISTRIBUTIONAL EFFECTS OF VALUE ADDED TAX IN IRELAND 223
10 We include children’s footwear in the “children’s clothing” category.
06 Tol article_ESRI Vol 42-1 12/07/2011 10:37 Page 223
amount they spend in VAT by 0.3 per cent if VAT on children’s clothes wereincreased to 21 per cent. This is probably because, spending on clothesaccounts for only a small proportion of their income. The HBS suggests thatthey are, instead, diverting a higher proportion of their income towardsmortgage repayments and housing costs. In all circumstances considered here,households containing 1 adult under 65 spent more of their income in VAT
224 THE ECONOMIC AND SOCIAL REVIEW
Figure 4: VAT Spending Across Equivalised Income Deciles: Food andChildren’s Clothing
Figure 5: VAT Spending Across Household Size: Food and Children’s Clothing
25%
20%
15%
10%
5%
0%
All food at 21%
All food at 13.5%
Children’s clothing at 21%
Budget 2010
All food at 0%
Perc
en
tag
e o
f d
isp
osab
le in
co
me
1 2 3 4 5 6 7 8 9 10
Equivalised income decile
Perc
enta
ge o
f d
isp
osab
le inco
me
35%
30%
25%
20%
15%
10%
5%
0%
1 2 3 4 5 6 7+Household size
All food at 21%
All food at 13.5%
Children’s clothing at 21%
Budget 2010
All at 0%
06 Tol article_ESRI Vol 42-1 12/07/2011 10:37 Page 224
than their older counterparts, except for the scenario in which all food is liableat 21 per cent.
Figure 6: VAT Spending Across Household Composition: Food and Children’sClothing
We also compared the effects of these scenarios in urban versus ruralareas and found that differences between the two groups are small. In all ofthe scenarios, rural households spend a slightly higher proportion of theirdisposable income in VAT than their urban counterparts. Descriptive statisticsfrom the HBS show that rural households are bigger on average than urbanones; however, urban incomes are higher. The HBS also shows that ruralhouseholds have a higher number of children on average than urban ones.This explains why rural households would be disproportionately hit if the rateof children’s clothing were increased to 21 per cent.
3.3 Food, Alcohol, Tobacco and FuelImposing a rate of 0 per cent on all food, alcohol, tobacco and fuel would
result in savings for all households, especially those at the lower end of theincome distribution (see Figure 7). The loss in revenue would be just over €1billion but it may be less than €1 billion if those who had been buyingcigarettes and alcohol in Northern Ireland start buying these items in theRepublic of Ireland due to the price decrease. The zero rating of tobacco andalcohol would make the system slightly less regressive but only if the currentlevel of demand was to be maintained in poor households. The HBS shows thathouseholds in the lowest income decile spend over 8 per cent of theirdisposable income on alcohol whereas the average for the rest of thepopulation is only 4.3 per cent. The HBS also shows that the amount spent on
THE DISTRIBUTIONAL EFFECTS OF VALUE ADDED TAX IN IRELAND 225
1 Adult14-65
1 Adult65+
Couple Couple with2 children
Single adultwith children
All food at 0% Budget 2010 Children’s clothing at 21% All food at 13.5% All food at 21%
06 Tol article_ESRI Vol 42-1 12/07/2011 10:37 Page 225
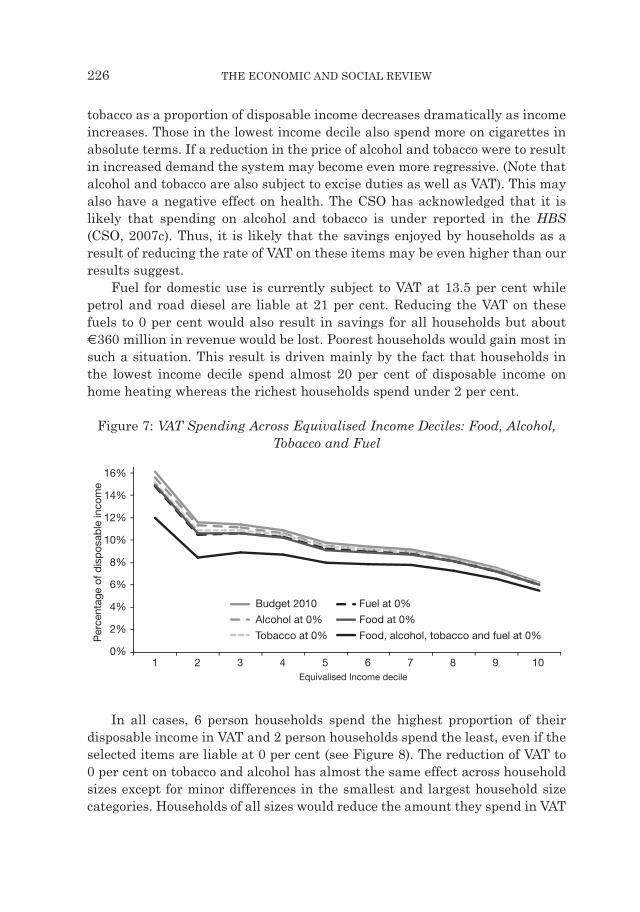
tobacco as a proportion of disposable income decreases dramatically as incomeincreases. Those in the lowest income decile also spend more on cigarettes inabsolute terms. If a reduction in the price of alcohol and tobacco were to resultin increased demand the system may become even more regressive. (Note thatalcohol and tobacco are also subject to excise duties as well as VAT). This mayalso have a negative effect on health. The CSO has acknowledged that it islikely that spending on alcohol and tobacco is under reported in the HBS(CSO, 2007c). Thus, it is likely that the savings enjoyed by households as aresult of reducing the rate of VAT on these items may be even higher than ourresults suggest.
Fuel for domestic use is currently subject to VAT at 13.5 per cent whilepetrol and road diesel are liable at 21 per cent. Reducing the VAT on thesefuels to 0 per cent would also result in savings for all households but about€360 million in revenue would be lost. Poorest households would gain most insuch a situation. This result is driven mainly by the fact that households inthe lowest income decile spend almost 20 per cent of disposable income onhome heating whereas the richest households spend under 2 per cent.
Figure 7: VAT Spending Across Equivalised Income Deciles: Food, Alcohol,Tobacco and Fuel
In all cases, 6 person households spend the highest proportion of theirdisposable income in VAT and 2 person households spend the least, even if theselected items are liable at 0 per cent (see Figure 8). The reduction of VAT to0 per cent on tobacco and alcohol has almost the same effect across householdsizes except for minor differences in the smallest and largest household sizecategories. Households of all sizes would reduce the amount they spend in VAT
226 THE ECONOMIC AND SOCIAL REVIEW
Budget 2010
Alcohol at 0%
Tobacco at 0%
Fuel at 0%
Food at 0%
Food, alcohol, tobacco and fuel at 0%
16%
14%
12%
10%
8%
6%
4%
2%
0%
Perc
enta
ge o
f d
isp
osab
le inco
me
1 2 3 4 5 6 7 8 9 10
Equivalised Income decile
06 Tol article_ESRI Vol 42-1 12/07/2011 10:37 Page 226
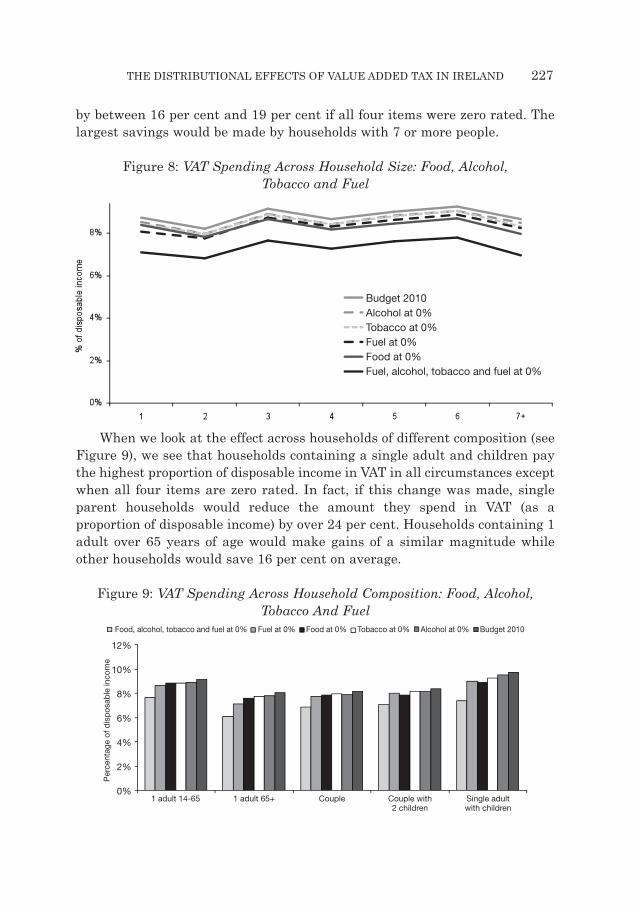
by between 16 per cent and 19 per cent if all four items were zero rated. Thelargest savings would be made by households with 7 or more people.
Figure 8: VAT Spending Across Household Size: Food, Alcohol, Tobacco and Fuel
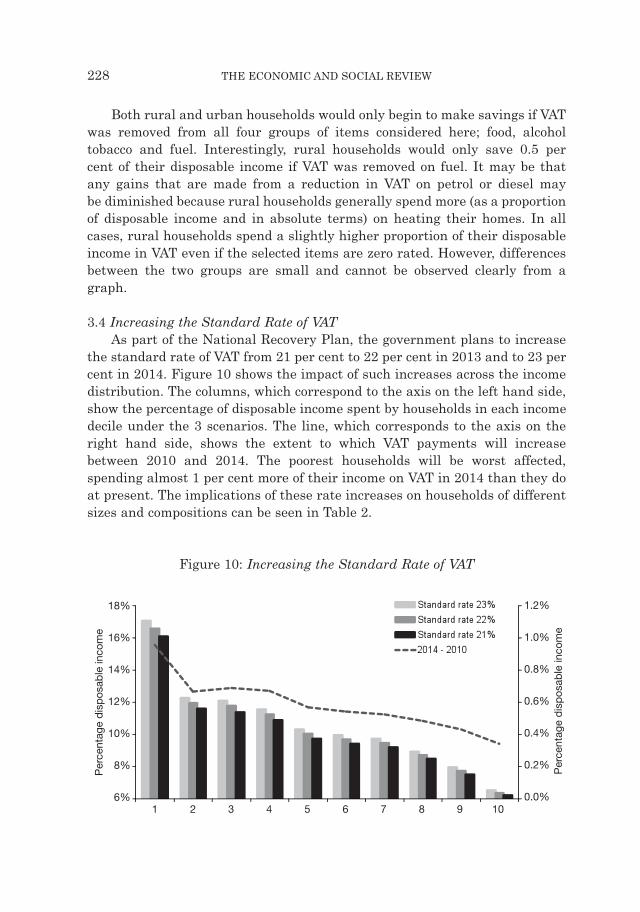
When we look at the effect across households of different composition (seeFigure 9), we see that households containing a single adult and children paythe highest proportion of disposable income in VAT in all circumstances exceptwhen all four items are zero rated. In fact, if this change was made, singleparent households would reduce the amount they spend in VAT (as aproportion of disposable income) by over 24 per cent. Households containing 1adult over 65 years of age would make gains of a similar magnitude whileother households would save 16 per cent on average.
Figure 9: VAT Spending Across Household Composition: Food, Alcohol,Tobacco And Fuel
THE DISTRIBUTIONAL EFFECTS OF VALUE ADDED TAX IN IRELAND 227
Budget 2010
Alcohol at 0%
Tobacco at 0%
Fuel at 0%
Food at 0%
Fuel, alcohol, tobacco and fuel at 0%
12%
10%
8%
6%
4%
2%
0%
Perc
en
tag
e o
f d
isp
osab
le in
co
me
1 adult 14-65 1 adult 65+ Couple Couple with2 children
Single adultwith children
Food, alcohol, tobacco and fuel at 0% Fuel at 0% Food at 0% Tobacco at 0% Alcohol at 0% Budget 2010
06 Tol article_ESRI Vol 42-1 12/07/2011 10:37 Page 227
Both rural and urban households would only begin to make savings if VATwas removed from all four groups of items considered here; food, alcoholtobacco and fuel. Interestingly, rural households would only save 0.5 per cent of their disposable income if VAT was removed on fuel. It may be that any gains that are made from a reduction in VAT on petrol or diesel may be diminished because rural households generally spend more (as a proportionof disposable income and in absolute terms) on heating their homes. In allcases, rural households spend a slightly higher proportion of their disposableincome in VAT even if the selected items are zero rated. However, differencesbetween the two groups are small and cannot be observed clearly from agraph.
3.4 Increasing the Standard Rate of VATAs part of the National Recovery Plan, the government plans to increase
the standard rate of VAT from 21 per cent to 22 per cent in 2013 and to 23 percent in 2014. Figure 10 shows the impact of such increases across the incomedistribution. The columns, which correspond to the axis on the left hand side,show the percentage of disposable income spent by households in each incomedecile under the 3 scenarios. The line, which corresponds to the axis on theright hand side, shows the extent to which VAT payments will increasebetween 2010 and 2014. The poorest households will be worst affected,spending almost 1 per cent more of their income on VAT in 2014 than they doat present. The implications of these rate increases on households of differentsizes and compositions can be seen in Table 2.
Figure 10: Increasing the Standard Rate of VAT
228 THE ECONOMIC AND SOCIAL REVIEW
18%
16%
14%
12%
10%
8%
6%
Perc
enta
ge d
isp
osab
le inco
me
Perc
enta
ge d
isp
osab
le inco
me
1 2 3 4 5 6 7 8 9 10
1.2%
1.0%
0.8%
0.6%
0.4%
0.2%
0.0%
06 Tol article_ESRI Vol 42-1 12/07/2011 10:37 Page 228
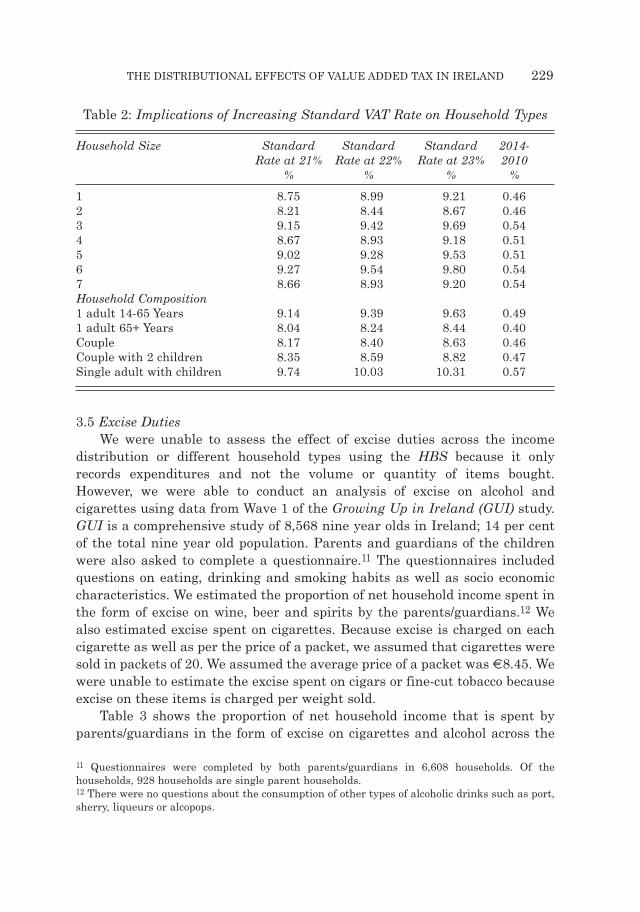
Table 2: Implications of Increasing Standard VAT Rate on Household Types
Household Size Standard Standard Standard 2014-Rate at 21% Rate at 22% Rate at 23% 2010
% % % %
1 8.75 8.99 9.21 0.462 8.21 8.44 8.67 0.463 9.15 9.42 9.69 0.544 8.67 8.93 9.18 0.515 9.02 9.28 9.53 0.516 9.27 9.54 9.80 0.547 8.66 8.93 9.20 0.54Household Composition1 adult 14-65 Years 9.14 9.39 9.63 0.491 adult 65+ Years 8.04 8.24 8.44 0.40Couple 8.17 8.40 8.63 0.46Couple with 2 children 8.35 8.59 8.82 0.47Single adult with children 9.74 10.03 10.31 0.57
3.5 Excise DutiesWe were unable to assess the effect of excise duties across the income
distribution or different household types using the HBS because it onlyrecords expenditures and not the volume or quantity of items bought.However, we were able to conduct an analysis of excise on alcohol andcigarettes using data from Wave 1 of the Growing Up in Ireland (GUI) study.GUI is a comprehensive study of 8,568 nine year olds in Ireland; 14 per centof the total nine year old population. Parents and guardians of the childrenwere also asked to complete a questionnaire.11 The questionnaires includedquestions on eating, drinking and smoking habits as well as socio economiccharacteristics. We estimated the proportion of net household income spent inthe form of excise on wine, beer and spirits by the parents/guardians.12 Wealso estimated excise spent on cigarettes. Because excise is charged on eachcigarette as well as per the price of a packet, we assumed that cigarettes weresold in packets of 20. We assumed the average price of a packet was €8.45. Wewere unable to estimate the excise spent on cigars or fine-cut tobacco becauseexcise on these items is charged per weight sold.
Table 3 shows the proportion of net household income that is spent byparents/guardians in the form of excise on cigarettes and alcohol across the
THE DISTRIBUTIONAL EFFECTS OF VALUE ADDED TAX IN IRELAND 229
11 Questionnaires were completed by both parents/guardians in 6,608 households. Of thehouseholds, 928 households are single parent households. 12 There were no questions about the consumption of other types of alcoholic drinks such as port,sherry, liqueurs or alcopops.
06 Tol article_ESRI Vol 42-1 12/07/2011 10:37 Page 229
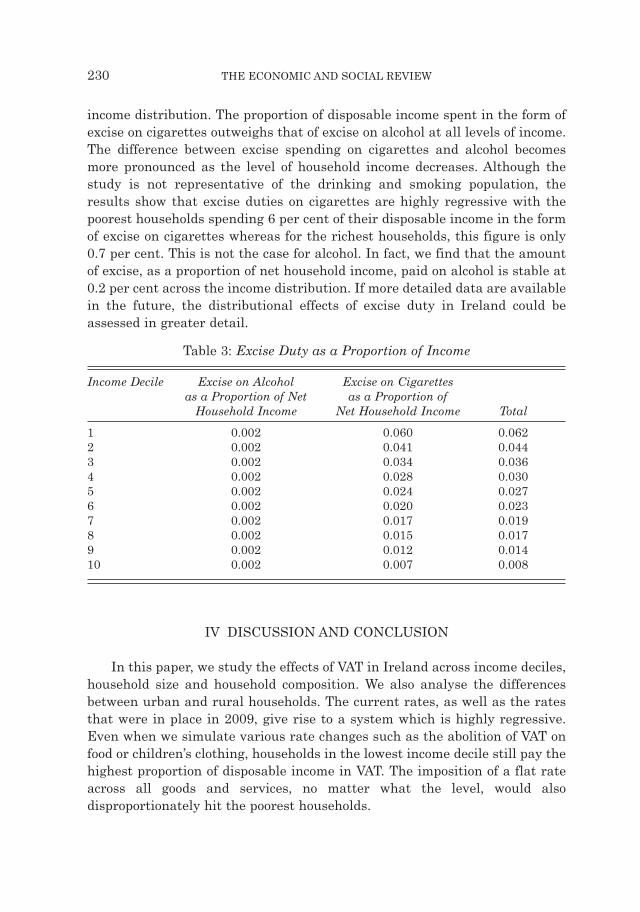
income distribution. The proportion of disposable income spent in the form ofexcise on cigarettes outweighs that of excise on alcohol at all levels of income.The difference between excise spending on cigarettes and alcohol becomesmore pronounced as the level of household income decreases. Although thestudy is not representative of the drinking and smoking population, theresults show that excise duties on cigarettes are highly regressive with thepoorest households spending 6 per cent of their disposable income in the formof excise on cigarettes whereas for the richest households, this figure is only0.7 per cent. This is not the case for alcohol. In fact, we find that the amountof excise, as a proportion of net household income, paid on alcohol is stable at0.2 per cent across the income distribution. If more detailed data are availablein the future, the distributional effects of excise duty in Ireland could beassessed in greater detail.
Table 3: Excise Duty as a Proportion of Income
Income Decile Excise on Alcohol Excise on Cigarettesas a Proportion of Net as a Proportion of
Household Income Net Household Income Total
1 0.002 0.060 0.0622 0.002 0.041 0.0443 0.002 0.034 0.0364 0.002 0.028 0.0305 0.002 0.024 0.0276 0.002 0.020 0.0237 0.002 0.017 0.0198 0.002 0.015 0.0179 0.002 0.012 0.01410 0.002 0.007 0.008
IV DISCUSSION AND CONCLUSION
In this paper, we study the effects of VAT in Ireland across income deciles,household size and household composition. We also analyse the differencesbetween urban and rural households. The current rates, as well as the ratesthat were in place in 2009, give rise to a system which is highly regressive.Even when we simulate various rate changes such as the abolition of VAT onfood or children’s clothing, households in the lowest income decile still pay thehighest proportion of disposable income in VAT. The imposition of a flat rateacross all goods and services, no matter what the level, would alsodisproportionately hit the poorest households.
230 THE ECONOMIC AND SOCIAL REVIEW
06 Tol article_ESRI Vol 42-1 12/07/2011 10:37 Page 230
The Irish Government has made an attempt to address this regressivity byzero rating most food and children’s clothes and shoes.13 While the system isstill regressive, we find that if the rates on these items were increased, thesituation would be even worse and households in the second income decilewould suffer most. Conversely, imposing a rate of 0 per cent on all food itemswould bring some relief to poor households. As stated earlier, some bakeryproducts are subject to VAT at 13.5 per cent while 21 per cent VAT is chargedon confectionery, some savoury snacks and soft drinks. If all of these itemswere zero rated, households in the lowest income decile would spend 7 per centless of their disposable income in VAT while households in the second incomedecile would save 9 per cent, the highest of any group. We also examined theimpact of zero rating alcohol and tobacco. While this could make the systemslightly less regressive, policy makers should take into account the adversehealth effects which could result from increased consumption of these goods.
We have also examined the possible effects of introducing a flat rate of VATacross all goods and services and the associated revenue changes. Weconsidered rates of 7 per cent, 10.9 per cent, 13.5 per cent and 21 per cent. Arate of 7 per cent would result in gains for all households while a rate of 10.9per cent would have approximately the same effect on the income distributionas the current system, but would lower administrative costs, widen the taxbase and reduce economic distortions.14 The Commission on Taxation (1984)suggested that those households that are disproportionately hit could becompensated with some form of welfare payment which would be moreeffective in achieving redistribution than the use of zero-rating. This point wasreiterated by Durkan (2010). Our analysis suggests that such compensationshould particularly target children and single parents. Crawford et al. (2008)suggest that all zero and reduced rates, except for those on housing andexports, should be ended in the UK. However, they warn that such a moveshould be matched by increased benefits and tax credits for the pooresthouseholds. Not only would this result in increased revenue for governmentbut the poorest 30 per cent of the population would subsequently be better off.
We also analysed the distributional implications of VAT increasesproposed in The National Recovery Plan. Increasing the standard rate of VATto 22 per cent and 23 per cent will disproportionately hit the pooresthouseholds if it is not offset by other measures. As far as we know, this is thefirst paper to consider the distribution of Irish VAT payments based on
THE DISTRIBUTIONAL EFFECTS OF VALUE ADDED TAX IN IRELAND 231
13 Apart from the principles of equity, it is likely that these rates have been kept at 0 per centbecause the potential political costs of increasing them would be too high. 14 We are not suggesting that a uniform tax rate would lead to uniformity in the system. For adiscussion on the optimality or otherwise of uniform indirect taxation see Stern (1990).
06 Tol article_ESRI Vol 42-1 12/07/2011 10:37 Page 231
household characteristics. In relation to household size, 6 person householdspay the highest proportion of disposable income in VAT. The imposition of aflat rate or the zero rating of various items does not change this result. In thehousehold composition category, households containing a single adult andchildren are worst affected. Reducing the rate on all food and/or fuel to 0 percent, however, would result in significant gains for these households. Theanalyses of VAT spending by household composition and age of the HRP yieldsimilar results. Considering location, in almost all circumstances, rural house -holds bear a disproportionate burden of VAT compared to urban households.The exception occurs in a situation where a flat rate would be applied to allgoods and services. However, the differences between the two groups aresmall.
We were unable to estimate the effects of VAT on people who live incollective residences, as they are omitted from the HBS. For the same reason,age and ethnicity are excluded from the current analysis. The analysis for thedifferent types of households suggests that VAT falls more heavily on youngerpeople than older people.
The available data do not allow us to include excise duties on alcohol andtobacco in the main analysis. However, data from another, imperfectly suitedsource suggests that the excise paid on alcohol is proportional to income, whilepoorer household pay a much larger share of their income towards excise ontobacco.
This paper offers a descriptive analysis. Changes in VAT rates wouldinduce changes in demand and supply but these considerations are omittedfrom this paper. We find a flat rate VAT that would not affect the incomedistribution and it would raise approximately the same amount of revenue.Reduced VAT rates apply to necessary goods which (by definition) have a lowprice elasticity. The revenue-neutral flat rate VAT is therefore lower whencorrecting for the response of the market. Furthermore, market power isdifferent for different goods and services. Retail margins of supermarkets inIreland are not published but they are believed to be particularly high (Officeof the Revenue Commissioners and CSO, 2009). Thus, one may suspect that aprice increase from zero- to flat-rate VAT for food would be partly absorbed bythe retailer.
A single VAT rate would have wider consequences for the economy. Duringrecessions, households tend to maintain their expenditure on essentials andconsumables but postpone the purchase of luxury goods and durables. A flatrate VAT would shift consumption towards luxuries and durables and mayhave a counter-cyclical impact. Cross-border shoppers and touristsdisproportionally purchase luxury goods. A flat rate VAT would make Irelandmore attractive to them. These issues are deferred to future research.
232 THE ECONOMIC AND SOCIAL REVIEW
06 Tol article_ESRI Vol 42-1 12/07/2011 10:37 Page 232
BIBLIOGRAPHY
BARRETT, A. and C. WALL, 2006. The Distributional Impact of Ireland’s Indirect TaxSystem, Dublin: Combat Poverty Agency, http://www.cpa.ie/publications/TheDistributionalImpactOfIrelandsIndirectTaxSystem_2006.pdf
BARRETT, A., I. KEARNEY, T. CONEFREY and C. O’SULLIVAN, 2010. QuarterlyEconomic Commentary, Autumn 2010, Dublin: The Economic and Social ResearchInstitute.
CALLAN, T., C. KEANE and J. R. WALSH, 2010. “What Role for Property Taxes inIreland?” The Economic and Social Review, Vol. 41, No. 1, pp. 87-107.
CALLAN, T., S. LYONS, S. SCOTT, R. S. J. TOL and S. VERDE, 2009. “TheDistributional Implications of a Carbon Tax in Ireland”, Energy Policy, Vol. 37, No. 2, pp. 407-412.
CALLAN, T., B. NOLAN, C. KEANE, J. R. WALSH and M. LANE, 2010.“Restructuring Taxes, Levies and Social Insurance: What Role for a UniversalSocial Charge?” in T. Callan (ed.), Budget Perspectives, 2011, ESRI Research Series18, Dublin: The Economic and Social Research Institute, http://www.scjms.ie/publications/search_for_a_publication/search_results/view/index.xml?id=3111
CRAWFORD, I., M. KEEN, S. SMITH, 2008. VAT and Excises, Background Paper forthe Mirrlees Review, Reforming the Tax System for the 21st Century, London:Institute for Fiscal Studies. http://www.ifs.org.uk/mirrleesreview/reports/indirect.pdf.
CENTRAL STATISTICS OFFICE, 2007a. Household Budget Survey 2004/2005,Dublin: Central Statistics Office, http://www.eirestat.cso.ie/surveysandmethodologies/surveys/housing_households/survey_hbs.htm.
CENTRAL STATISTICS OFFICE, 2007b. Census 2006, Volume 6 – Housing, Dublin:Central Statistics Office, http://www.cso.ie/census/Census2006_Volume6.htm
CENTRAL STATISTICS OFFICE, 2007c. January 2007 Consumer Price Index, Dublin:Central Statistics Office, http://www.cso.ie/newsevents/pr_cpijan07.htm
DEPARTMENT OF THE ENVIRONMENT, HERITAGE AND LOCAL GOVERN -MENT, 2006. Annual Housing Statistics Bulletin 2005, Dublin: Department of the Environment, Heritage and Local Government, http://www.environ.ie/en/Publications/StatisticsandRegularPublications/HousingStatistics/FileDownLoad,2115,en.pdf
DEPARTMENT OF FINANCE, 2010a. Exchequer Statements, Dublin: Department ofFinance, http://www.finance.gov.ie/documents/exchequerstatements/2009/echeqfinaldec09.pdf
DEPARTMENT OF FINANCE, 2010b. Exchequer Statements, Dublin: Department ofFinance, http://www.finance.gov.ie/documents/exchequerstatements/2010/endsepttaxreceipts.pdf
DEPARTMENT OF FINANCE, 2010c. Exchequer Statements, Dublin: Department ofFinance. http://www.finance.gov.ie/documents/exchequerstatements/2009/excheqstatdec08.pdf
DURKAN, J., 2010. “Fiscal Policy: Some Lessons from Crises of the Past” in T. Callan(ed.), Budget Perspectives 2011. ESRI Research Series 18, Dublin: The Economicand Social Research Institute, http://www.scjms.ie/publications/search_for_a_publication/search_results/view/index.xml?id=3111
THE DISTRIBUTIONAL EFFECTS OF VALUE ADDED TAX IN IRELAND 233
06 Tol article_ESRI Vol 42-1 12/07/2011 10:37 Page 233
OFFICE OF THE REVENUE COMMISSIONERS, 2010. VAT Leaflets. Dublin: Officeof the Revenue Commissioners, http://www.revenue.ie/en/tax/vat/leaflets/index.html
OFFICE OF THE REVENUE COMMISSIONERS and CENTRAL STATISTICSOFFICE, 2009. The Implications of Cross Border Shopping for the Irish Exchequer.Dublin: Department of Finance, http://www.finance.gov.ie/documents/publications/reports/2009/crossborderefb09.pdf
OFFICIAL JOURNAL OF THE EUROPEAN UNION, 2006. Tax Legislation, Brussels:European Union, http://ec.europa.eu/taxation_customs/common/legislation/legislation/taxation/archives_2006_en.htm
STERN, N., 1990. “Uniformity Versus Selectivity in Indirect Taxation,” Economics andPolitics, Vol. 2, No. 1, pp. 83-108.
THE COMMISSION ON TAXATION, 1984. Third Report of the Commission onTaxation. Indirect Taxes. Dublin: The Stationery Office.
VERDE, S., and R. S. J. TOL, 2009. “The Distributional Impact of a Carbon Tax inIreland”, The Economic and Social Review, Vol. 40, No. 3, pp. 317-338.
234 THE ECONOMIC AND SOCIAL REVIEW
06 Tol article_ESRI Vol 42-1 12/07/2011 10:37 Page 234
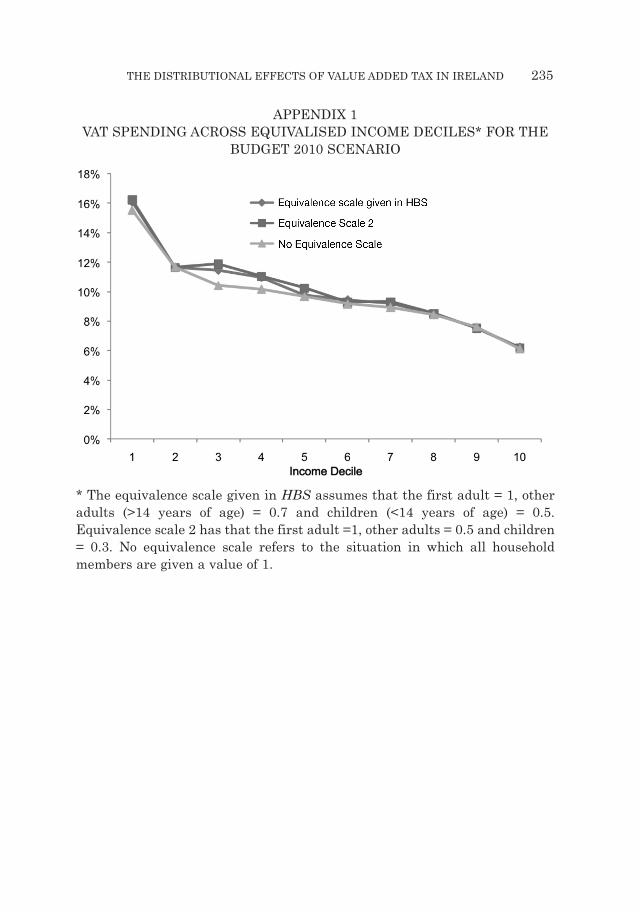
APPENDIX 1VAT SPENDING ACROSS EQUIVALISED INCOME DECILES* FOR THE
BUDGET 2010 SCENARIO
* The equivalence scale given in HBS assumes that the first adult = 1, otheradults (>14 years of age) = 0.7 and children (<14 years of age) = 0.5.Equivalence scale 2 has that the first adult =1, other adults = 0.5 and children= 0.3. No equivalence scale refers to the situation in which all householdmembers are given a value of 1.
THE DISTRIBUTIONAL EFFECTS OF VALUE ADDED TAX IN IRELAND 235
06 Tol article_ESRI Vol 42-1 12/07/2011 10:37 Page 235