Embed Size (px)
Citation preview

SOCIAL PROTECTION POLICY PAPERS
Paper 17
Social protection for older persons: Policy trends and statistics 2017–19
Social Protection Department International Labour Office

Copyright © International Labour Organization 2018 First published 2018 Publications of the International Labour Office enjoy copyright under Protocol 2 of the Universal Copyright Convention. Nevertheless, short excerpts from them may be reproduced without authorization, on condition that the source is indicated. For rights of reproduction or translation, application should be made to ILO Publications (Rights and Permissions), International Labour Office, CH-1211 Geneva 22, Switzerland, or by email: [email protected]. The International Labour Office welcomes such applications.
Libraries, institutions and other users registered with reproduction rights organizations may make copies in accordance with the licences issued to them for this purpose. Visit www.ifrro.org to find the reproduction rights organization in your country.
ILO Cataloguing in Publication Data
Social protection for older persons: Policy trends and statistics 2017-19 / International Labour Office, Social Protection Department. - Geneva: ILO, 2018 (Social protection policy paper; No. 17, ISSN: 1020-9581; 1020-959X (web pdf) ISBN: 978-92-2-132055-5 (print) ; 978-92-2-132056-2 (web pdf) International Labour Office Social Protection Dept. social protection / older people / ageing population / pension scheme / social security reform / social assistance 02.03.1 The designations employed in ILO publications, which are in conformity with United Nations practice, and the presentation of material therein do not imply the expression of any opinion whatsoever on the part of the International Labour Office concerning the legal status of any country, area or territory or of its authorities, or concerning the delimitation of its frontiers.
The responsibility for opinions expressed in signed articles, studies and other contributions rests solely with their authors, and publication does not constitute an endorsement by the International Labour Office of the opinions expressed in them.
Reference to names of firms and commercial products and processes does not imply their endorsement by the International Labour Office, and any failure to mention a particular firm, commercial product or process is not a sign of disapproval.
ILO publications and electronic products can be obtained through major booksellers or ILO local offices in many countries, or direct from ILO Publications, International Labour Office, CH-1211 Geneva 22, Switzerland. Catalogues or lists of new publications are available free of charge from the above address, or by email: [email protected]
Visit our web site: www.ilo.org/publns
The editor of the series is the Director of the Social Protection Department, ILO. For more information on the series, or to submit a paper, please contact: Isabel Ortiz, Director Social Protection Department International Labour Organization 4 Route des Morillons CH-1211 Geneva 22 Switzerland Tel. +41.22.799.6226 • Fax:+41.22.799.79.62 Printed in Switzerland

Social protection for older persons: Policy trends and statistics 2017-19 iii
Abstract
This policy paper: (i) provides a global overview of the organization of pension systems and their contribution to the Sustainable Development Goals (SDG); (ii) monitors SDG indicator 1.3.1 for older persons, analyses trends and recent policies in 192 countries, including the extension of legal and effective coverage in a large number of low- and middle-income countries, through a mix of contributory and non-contributory schemes; (iii) looks at persisting inequalities in access to income security in old-age; (iv) presents lessons from three decades of pension privatization and the trend to returning to public systems; (v) calls for countries to double their efforts to extend system coverage, including the extension of social protection floors, while at the same time improving the adequacy of benefits.
JEL Classification: H55, J26, J39
Keywords: social security and public pensions, retirement policies, public policy


Social protection for older persons: Policy trends and statistics 2017-19 v
Table of contents
Page
Abstract ............................................................................................................................................. iii
Acknowledgments ............................................................................................................................. ix
Executive Summary .......................................................................................................................... xi
1. Sustainable Development Goals and income security in old age ............................................ 1
2. Structure of social security pension systems ........................................................................... 3
2.1. Types of pension schemes ............................................................................................ 3
2.2. The ILO Multi-Pillar Pension Model ............................................................................ 4
3. Legal coverage ........................................................................................................................ 8
4. Effective coverage: Monitoring SDG indicator 1.3.1 for older persons ................................. 9
5. Trends in pension coverage across the world: Achieving universal social protection for all older persons ................................................................................................................. 12
6. Expenditure on social protection for older persons ................................................................. 17
7. Inequalities and the persistent gender gap in access to income security in old age ................ 20
8. The adequacy of pensions to provide genuine income security to older persons ................... 23
8.1. Preventing erosion of the value of pensions over time: Ensuring regular adjustments 25
8.2. Reforming pension systems in the context of fiscal consolidation and austerity policies .................................................................................................... 26
9. Reversing pension privatization .............................................................................................. 31
9.1. Lessons from three decades of pension privatization ................................................... 31
9.2. Turning back to public pension systems ....................................................................... 36
10. Ensuring income security for older persons: The continuing challenge ................................. 38
Bibliography ...................................................................................................................................... 40
Annexes
I. Minimum requirements in ILO social security standards: Overview tables ........................... 45
II. Statistical tables ....................................................................................................................... 48

vi Social protection for older persons: Policy trends and statistics 2017-19
Page
List of tables
1. Indexation methods ................................................................................................................. 25
2. Government announcements of pension reforms (contraction), 2010–16 .............................. 28
3. Old-age pensions: Parametric reforms, selected countries, 2013–17 ...................................... 28
4. Typology of Pension Privatization Reforms 1981–2010 ........................................................ 31
A.1. Main requirements: ILO social security standards on income security in old age .................. 46
A.2. Main requirements: ILO social security standards on survivors’ benefits .............................. 47
B.1. Ratification of ILO up-to-date social security conventions .................................................... 48
B.2. Overview of national social security systems ......................................................................... 54
B.3. Old-age pensions: Key features of main social security programmes .................................... 63
B.4. Non-contributory pension schemes: Main features and indicators ......................................... 102
B.5. Old-age effective coverage: Active contributors..................................................................... 112
B.6. Old-age effective coverage: Old-age pension beneficiaries .................................................... 117
B.7. Public social protection expenditure by guarantee .................................................................. 123
List of figures
1. Overview of old-age pension schemes, by type of scheme and benefit, 2015 or latest available year ............................................................................................................. 3
2. Old-age pensions, legal coverage: Percentage of the working-age population (15–64 years) covered by existing law under mandatory contributory and non‑ contributory old-age pensions, by region and type of scheme, latest available year .............. 8
3. SDG indicator 1.3.1 on effective coverage for older persons: Percentage of persons above statutory pensionable age receiving a pension, by region, latest available year ........... 9
4. Old-age pensions, effective coverage: Active contributors to pension schemes as a percentage of the labour force and working-age population, by region, latest available year ................................................................................................................. 10
5. SDG indicator 1.3.1 on effective coverage for older persons: Percentage of the population above statutory pensionable age receiving an old-age pension, 2000 and 2010–15 ................................................................................................................... 15
6. SDG indicator 1.3.1 on effective coverage for older persons: Comparison of the proportion of the population above statutory pensionable age receiving an old‑age pension, 2000 and 2010–16 .................................................................................. 16
7. Public social protection expenditure on pensions and other benefits, excluding health, for persons above statutory pensionable age (percentage of GDP), and share of persons aged 65 and above in total population (percentage), latest available year ............. 17
8. Public social protection expenditure on pensions and other benefits, excluding health, for persons above statutory pensionable age, by country income level, latest available year. 18
9. Old-age pensions, effective coverage: Percentage of the labour force contributing to a pension scheme, by sex, latest available year................................................................... 20
10. SDG indicator 1.3.1 on effective coverage for older persons: Percentage of the population above statutory pensionable age receiving an old-age pension, by sex, latest available year ..................................................................................................... 21

Social protection for older persons: Policy trends and statistics 2017-19 vii
Page
11. Non-contributory pensions as a percentage of the national poverty line, single person, latest available year ................................................................................................................. 24
12. Average replacement rates at retirement in public pension schemes, selected European countries, 2013 and projected for 2060 ................................................................................... 26
List of boxes
1. International standards on old-age pensions ........................................................................... 2
2. Universal social pensions in the Plurinational State of Bolivia, Botswana, Lesotho, Namibia, Timor‑Leste and Zanzibar (United Republic of Tanzania)..................................... 12
3. Universal social protection for older persons through a mix of contributory and non- ontributory schemes: Argentina, Brazil, Cabo Verde, China, Kyrgyzstan, Maldives, South Africa, Thailand, Trinidad and Tobago ........................................................................ 13
4. Monitoring pension benefit adequacy ..................................................................................... 23
5. Implicit pension debt ............................................................................................................... 27
6. International social security standards and the organization and financing of social security systems ........................................................................................................ 32
7. Reversing pension privatization in Hungary ........................................................................... 36


Social protection for older persons: Policy trends and statistics 2017-19 ix
Acknowledgments
The lead author of this paper is Fabio Durán-Valverde, Head of the Public Finance, Actuarial and Statistical Unit of the Social Protection Department. As a product of the research conducted for the ILO’s World Social Protection Report 2017–19, this policy paper was prepared by the Social Protection Department and field specialists of the ILO, a team supervised and coordinated by the Director of the ILO Social Protection Department, Isabel Ortiz, Christina Behrendt, Head of the Social Policy Unit and Fabio Durán-Valverde. Specific contributions were received from colleagues of the ILO Social Protection Department (in alphabetical order): James Canonge, Social Protection Policy Officer; Jeronim Capaldo, former Data and Econometrics Specialist; Loveleen De, Social Protection Officer; Victoria Giroud-Castiella, Social Protection Officer; Aidi Hu, Specialist Social Security Asia; Kagisanyo Kelobang, Social Protection Analyst; Kroum Markov, Social Protection Policy Specialist; Quynh Anh Nguyen, Junior Social Protection Policy and Research Officer; Karuna Pal, Head of the Programming, Partnerships and Knowledge-Sharing Unit; André Picard, Head of the Actuarial Services Unit; Xenia Scheil-Adlung, Senior Health Policy Coordinator; Valérie Schmitt, Deputy Director; Emmanuelle Saint Pierre-Guilbault, Legal Specialist Social Security; Maya Stern Plaza, Legal Officer; Ippei Tsuruga, Junior Professional Officer Social Protection Policy; Stefan Urban, Junior Professional Officer Social Protection Financing; Clara van Panhuys, Social Protection Officer; and Veronika Wodsak, Social Security Expert.
Contributions were also received from colleagues in ILO field offices (in alphabetical order): Pascal Annycke, Social Security Specialist, ILO Decent Work Team for North Africa, Cairo; Dramane Batchabi, Specialist Social Protection, ILO Decent Work Team for Central Africa, Yaoundé; Fabio Bertranou, Director, ILO Decent Work Team for the South Cone of Latin America, Santiago de Chile; Joana Borges Henriques, Technical Officer Social Protection, ILO Cabo Verde; Theopiste Butare, former Senior Social Security Technical Specialist, ILO Decent Work Team for West Africa, Dakar; Pablo Casalí, Specialist Social Protection and Economic Development, ILO Decent Work Team for the South Cone of Latin America, Santiago de Chile; Nuno Cunha, Senior Technical Specialist Social Protection, ILO Decent Work Team for East and South-East Asia and the Pacific, Bangkok; Hiba Dbaibo, ILO Regional Office for the Arab States, Beirut; Luis Frota, Specialist Social Security, ILO Decent Work Team for Eastern and Southern Africa, Pretoria; Kenichi Hirose, Senior Specialist Social Protection, ILO Decent Work Team for Central and Eastern Europe, Budapest; Ursula Kulke, Senior Specialist Social Security, ILO Regional Office for the Arab States, Beirut; Qingyi Li, National Programme Officer, ILO Country Office for China and Mongolia, Beijing; Hellen Magutu, National Project Coordinator, ILO Kenya Office; Patience Matandiko, National Project Officer, ILO Country Office for Zambia, Malawi and Mozambique, Lusaka; Dampu Ndenzako, National Project Officer, ILO Country Office for the United Republic of Tanzania, Kenya, Rwanda and Uganda, Dar es Salaam; Luca Pellerano, Chief Technical Advisor, ILO Country Office for Zambia, Malawi and Mozambique, Lusaka; Céline Peyron Bista, Chief Technical Advisor, ILO Regional Office for Asia and the Pacific, Bangkok; Marielle Phe Goursat, Expert Social Health Protection, ILO Country Office for Zambia, Malawi and Mozambique, Lusaka; Ariel Pino, Specialist Social Protection and OSH, ILO Decent Work Team for the Caribbean, Port of Spain; Markus Ruck, Senior Specialist Social Security, ILO Decent Work Team for South Asia, New Delhi; Helmut Schwarzer, Specialist Social Protection and Economic Development, ILO Country Office for Mexico and Cuba, Mexico; Sergio Velasco, Specialist Social Security, ILO Decent Work Team for the Andean Countries, Lima; and Ruben Vicente Andres, Social Protection Expert, ILO Mozambique.
The enormous work of data collection and processing, from the design and dissemination of the ILO Social Security Inquiry, to the collection and validation of data from countries, as well as the compilation of the ILO World Social Protection Database, was supervised by the Director of the Social Protection Department, Isabel Ortiz, and produced by a team led by

x Social protection for older persons: Policy trends and statistics 2017-19
Fabio Durán Valverde, Head of the Public Finance, Actuarial and Statistics Unit at the ILO Social Protection Department, consisting of (in alphabetical order): Sara Abdulrehim, Actuarial and Social Protection Consultant; Andrés Acuña Ulate, Social Security Actuary; Jeronim Capaldo, formerly Data and Econometrics Specialist, now ILO Research Department; Luis Cotinguiba, Technical Officer Social Protection; Valeria Nesterenko, Social Protection Officer (Statistician); as well as Zhiming Yu, Technical Officer Social Protection; Vanessa Sampaio, Consultant; and Roshelle Wee Eng, Consultant. This work was carried out in close collaboration with the International Social Security Association (ISSA), under the supervision of Dominique La Salle, Director of the ISSA Social Security Development Branch; Raúl Ruggia Frick, Head of the Centre for Excellence; Shea McClanahan, former Project Manager and Technical Officer; and Roddy McKinnon, Publications, and Editor and Manager of the International Social Security Review. Rafael Diez de Medina, Chief Statistician/Department Director, and Stephen Kapsos, Head Data Production and Analysis Unit of the ILO Department of Statistics provided support on the regional and global estimations, so as to be in accordance with other ILO-monitored SDGs. Special thanks go to the team led by Yongyi Min, Chief of the Sustainable Development Goal Monitoring Unit, Statistics Division, of the Department of Economic and Social Affairs at the United Nations, and to all the national statistical offices that contributed to the data collection efforts.
The report benefited from the guidance of Deborah Greenfield, ILO Deputy Director-General for Policy; Sangheon Lee, Director a.i. of the ILO Research Department; and James Howard, Senior Adviser to the ILO Director-General.
Karuna Pal, Head of the Programming, Partnerships and Knowledge-Sharing Unit, and Victoria Giroud-Castiella, Social Protection Officer, both of the ILO Social Protection Department, coordinated the editing, translation, production, publication and dissemination of this report. Warm thanks are due to Adam Bowers, Hans von Rohland and Rosalind Yarde of the ILO Department for Communications; and many others involved in the preparation of this report.

Social protection for older persons: Policy trends and statistics 2017-19 xi
Executive Summary
� This policy paper: (i) provides a global overview of the organization of pension systems and their contribution to the Sustainable Development Goals (SDG’s); (ii) analyses trends and recent policies in 192 countries, including the extension of legal and effective coverage in a large number of low- and middle-income countries, through a mix of contributory and non-contributory schemes; (iii) looks at persisting inequalities in access to income security in old-age; (iv) presents lessons from three decades of pension privatization and the trend to returning to public systems; (v) calls for countries to double their efforts to extend system coverage, including the extension of social protection floors, while at the same time improving the adequacy of benefits.
� Pensions for older women and men are the most widespread form of social protection in the world, and a key element in Sustainable Development Goal (SDG) 1.3. At the global level, 68 per cent of people above retirement age receive a pension, either contributory or non-contributory.
� Significant progress has been made in extending pension system coverage in developing countries. Universal pensions have been developed in Argentina, Belarus, the Plurinational State of Bolivia, Botswana, Cabo Verde, China, Georgia, Kyrgyzstan, Lesotho, Maldives, Mauritius, Mongolia, Namibia, Seychelles, South Africa, Swaziland, Timor-Leste, Trinidad and Tobago, Ukraine, Uruguay, Uzbekistan and Zanzibar (United Republic of Tanzania). Other developing countries, such as Azerbaijan, Armenia, Brazil, Chile, Kazakhstan and Thailand, are near universality.
� However, the right to social protection of older persons is not yet a reality for many. In most low-income countries, less than 20 per cent of older persons over statutory retirement age receive a pension. In many developing countries, a large proportion of older persons still depend heavily on family support arrangements.
� Observed trends vary substantially across regions and even between countries within the same region. In countries with comprehensive and mature systems of social protection, with ageing populations, the main challenge is to maintain a good balance between financial sustainability and pension adequacy. At the other extreme, many countries around the world are still struggling to extend and finance their pension systems; these countries face structural barriers linked to development, high levels of informality, low contributory capacity, poverty and insufficient fiscal space, among others.
� A noticeable trend in developing countries is the proliferation of non-contributory pensions, including universal social pensions. This is very positive, particularly in countries with high levels of informality, facing difficulties in extending contributory schemes. Trends show that many countries are succeeding in introducing a universal floor of income security for older persons.
� Public schemes, based on solidarity and collective financing, are by far the most widespread form of old-age protection globally. Pension privatization policies, implemented in the past in a number of countries, did not deliver the expected results, as coverage and benefits did not increase, systemic risks were transferred to individuals and fiscal positions worsened. As a result, a number of countries are reversing privatization measures and returning to public solidarity-based systems.
� Recent austerity or fiscal consolidation trends are affecting the adequacy of pension systems and general conditions of retirement. In several countries, these reforms are putting at risk the fulfilment of the minimum standards in social security, and eroding

xii Social protection for older persons: Policy trends and statistics 2017-19
the social contract. Countries should be cautious when designing reforms to ensure that pension systems fulfil their mission of providing economic security to older persons.

Social protection for older persons: Policy trends and statistics 2017-19 1
1. Sustainable Development Goals and income security in old age
Ensuring income security for people during their old age is a crucial objective among the welfare goals that modern societies seek to realize (see box 1). Throughout their working life, when most people enjoy good health and productive capacity, they contribute to national development and progress, so it would seem fair that once they get older they are not left behind and that prosperity is shared with them.
In order to meet this objective, which is closely linked to the human right to social security, reliable mechanisms that ensure systematic protection against risks of vulnerability of older persons are required. While some population groups can access protection mechanisms through individual efforts, such as personal savings or house ownership, or even if others can take advantage of intra-generational family support mechanisms, the reality faced by the majority of the world’s population, especially in the developing world, is that sources of income are unreliable even during working age. In particular, as the direct consequence of informality, which is linked to the structural problems of economic development in many countries, only a small fraction of the world population has the capacity to fend for itself during old age. Hence the crucial role played by social protection systems for older persons.
For these reasons, public pension systems have become a foundation on which income security for older persons has been built. Income security in old age also depends on the availability of, access to, and cost of other social services including health care, housing and long-term care. In addition to the public social services, in-kind benefits may also include housing and energy subsidies, home help and care services, and residential care. If affordable access to such services is not provided, older persons and their families can be pushed into extreme poverty, even in developed countries. In countries with wider access to quality public services, poverty among older persons is also significantly lower.
The 2030 Agenda, in particular Sustainable Development Goal (SDG) target 1.3, calls for the implementation of national social protection systems for all, including floors, with special attention to the poor and the vulnerable. In order to guarantee that no older person is left behind, policy- and decision-makers should take into consideration the construction of comprehensive social protection systems based on the principle of universality. Recommendation No. 202, adopted unanimously by ILO constituents in 2012, calls for combining contributory public pensions with non-contributory pension schemes in order to protect the whole population. While SDG 1.3 calls explicitly for the implementation of nationally appropriate social protection systems and measures for all, including floors that provide income security in old age, it has to be noted that social protection – and income security in old age in particular – contributes to a variety of other goals and addresses issues beyond SDG 1. Income security in old age also contributes significantly to SDG 5 (supporting gender equality and the empowerment of women) and SDG 10 (helping to reduce inequality within and among countries). Furthermore, income security in old age contributes indirectly to many other SDGs, for instance to SDG 11, where income security in old age can be instrumental in supporting families and individuals in accessing adequate, safe and affordable housing. Income security in old age therefore plays a key role in achieving the goals set by the global community under the framework of the Sustainable Development Goals and contributes to, among others, the fundamental commitment to end poverty in all its forms and dimensions, including eradicating extreme poverty by 2030, ensuring that all people enjoy a decent standard of living.

2 Social protection for older persons: Policy trends and statistics 2017-19
Box 1 International standards on old-age pensions
The rights of older persons to social security and to an adequate standard of living to support their health and well-being, including medical care and necessary social services, are laid down in the major international human rights instruments, the Universal Declaration of Human Rights (UDHR), 1948, and (in more general terms) the International Covenant on Economic, Social and Cultural Rights (ICESCR), 1966. 1 The content of these rights is further specified in the normative body of standards developed by the ILO, which provide concrete guidance to countries for giving effect to the right of older persons to social security, from basic levels to full realization. 2
The Social Security (Minimum Standards) Convention, 1952 (No. 102), the Old-Age, Invalidity and Survivors’ Benefits Convention, 1967 (No. 128), and its accompanying Recommendation No. 131, and the Social Protection Floors Recommendation, 2012 (No. 202), provide an international reference framework setting out the range and levels of social security benefits that are necessary and adequate for ensuring income maintenance and income security, as well as access to health care, in old age. The extension of coverage to all older persons is an underlying objective of these standards, with the aim of achieving universality of protection, as explicitly stated in Recommendation No. 202.
Conventions Nos 102 and 128 and Recommendation No. 131 make provision for the payment of pensions in old age, at guaranteed levels, upon completion of a qualifying period, and their regular adjustment to maintain pensioners’ purchasing power. More particularly, Conventions Nos 102 and 128 envisage the provision of income security to people who have reached pensionable age through earnings-related contributory pensions (guaranteeing minimum benefit levels, or replacement rates corresponding to a prescribed proportion of an individual’s past earnings – in particular for those with lower earnings) and/or by flat-rate non-contributory pensions which can be either universal or means‑tested. The guaranteed minimum levels for the latter should be a prescribed proportion of the average earnings of a typical unskilled worker, but the “total of the benefit and other available means … shall be sufficient to maintain the family of the beneficiary in health and decency” (Convention No. 102, Art. 67(a)).
Recommendation No. 202 completes this framework by calling for the guarantee of basic income security to all persons in old age, prioritizing those in need and those not covered by existing arrangements. Such a guarantee would act as a safeguard against poverty, vulnerability and social exclusion in old age for people not covered by contributory pension schemes. It is also of high relevance to pensioners whose benefits are affected by the financial losses suffered by pension funds, whose pensions are not regularly adjusted to changes in the costs of living, or whose pensions are simply inadequate to secure effective access to necessary goods and services and allow life in dignity. ILO social security standards thus provide a comprehensive set of references and a framework for the establishment, development and maintenance of old-age pension systems at national level.
An important social policy challenge facing ageing societies is to secure an adequate level of income for all people in old age without overstretching the capacities of younger generations. In view of the financing and sustainability challenge faced by social security systems in the context of demographic change, the State has a vital role to play in forecasting the long-term balance between resources and expenditure in order to guarantee that institutions will meet their obligations towards older persons. The principle in ILO social security standards, strongly reaffirmed recently by Recommendation No. 202, of the overall and primary responsibility of the State in this respect will undoubtedly play an important role in how future governments are held accountable for the sustainability of national social security systems in view of, among other factors, demographic change.
1 UDHR, Arts 22 and 25(1); ICESCR, Art. 9. 2 See CESCR, 2008.
Social protection for older persons: Policy trends and statistics 2017-19 3
2. Structure of social security pension systems
2.1. Types of pension schemes
Throughout the history of social security, public pension schemes have proved to be an effective instrument in ensuring income security of older persons as well as in combating poverty and social inequality.
According to international experience, pension systems can be organized in many different ways. The objective of classifying pension schemes is to categorize the underlying operative principles of such schemes, as well as to enable general comparisons of their impact in fulfilling the social security objectives. From the ILO perspective, all pension schemes that contribute towards old-age income security are relevant. Their degree of relevance is however gauged by their compliance with ILO standards on social security.
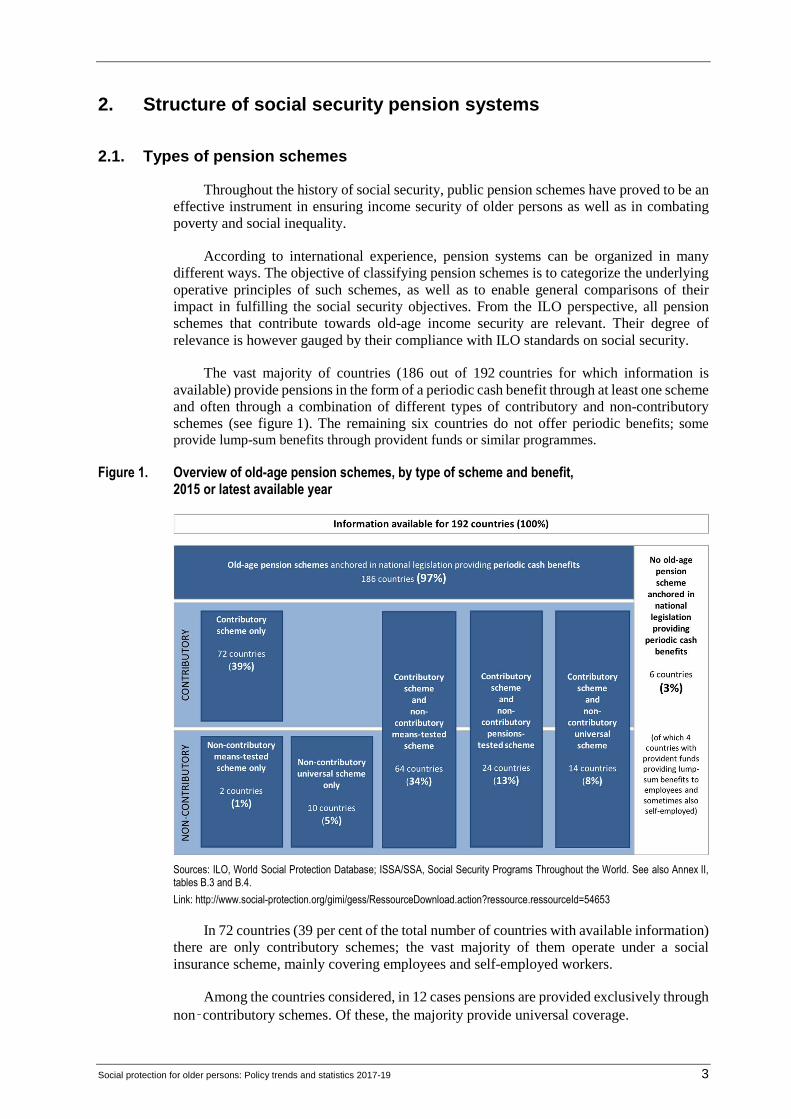
The vast majority of countries (186 out of 192 countries for which information is available) provide pensions in the form of a periodic cash benefit through at least one scheme and often through a combination of different types of contributory and non-contributory schemes (see figure 1). The remaining six countries do not offer periodic benefits; some provide lump-sum benefits through provident funds or similar programmes.
Figure 1. Overview of old-age pension schemes, by type of scheme and benefit, 2015 or latest available year
Sources: ILO, World Social Protection Database; ISSA/SSA, Social Security Programs Throughout the World. See also Annex II, tables B.3 and B.4.
Link: http://www.social-protection.org/gimi/gess/RessourceDownload.action?ressource.ressourceId=54653
In 72 countries (39 per cent of the total number of countries with available information) there are only contributory schemes; the vast majority of them operate under a social insurance scheme, mainly covering employees and self-employed workers.
Among the countries considered, in 12 cases pensions are provided exclusively through non‑contributory schemes. Of these, the majority provide universal coverage.

4 Social protection for older persons: Policy trends and statistics 2017-19
The combination of contributory and non-contributory schemes is the most predominant form of organization of pension systems in the world: 102 countries feature both contributory and non‑contributory pension schemes. The non-contributory schemes in these countries vary: 14 countries provide universal benefits to all older persons above a certain age threshold; 24 countries provide pensions-tested benefits to older persons who do not receive any other pension; and 64 countries provide means-tested benefits to older persons below a certain income threshold.
2.2. The ILO Multi-Pillar Pension Model
Since its foundation in 1919, the ILO has played a key role in the global development of social security systems, including pension systems. The ILO's contribution in the field covers three main areas.
First, over almost 100 years, the ILO has developed a set of normative instruments related to social security systems, embodied in International Conventions and Recommendations covering all areas of social security, including pension systems. These standards are agreed collectively by governments, employers and workers, and constitute a guide in terms of principles both for policy design and implementation of social security systems. At the global level, the majority of countries with the most advanced social security systems as well as countries with developing systems have ratified and adopted ILO conventions and recommendations on social security. This reflects the critical importance of the standards in designing and reforming pension systems.
Second, the ILO has played a leading role in the development of quantitative, actuarial, financial and economic instruments for the assessment of pension systems. The ILO methodological framework is accepted as a best practice virtually everywhere.
The third area of ILO contribution to the development of pension systems relates to the continued provision of technical advisory services. A majority of pension systems around the world have been designed with the technical assistance provided by the ILO. A fundamental characteristic of the ILO is its commitment to support countries in their efforts to build systems through social dialogue. This is a differentiating element of the ILO's work in comparison with other international organizations.
ILO principles as a starting point for designing and reforming pension systems
An international consensus has been forged by governments, and employers’ and workers’ organizations on the objectives, functions and appropriate design principles of pension systems. These are embodied in the International social security standards.
Principle 1. Universality
Social security is a human right, which in practical terms is understood as the need to guarantee universal protection without leaving anyone behind. The principle of universality is enshrined in the ILO’s Constitution and its body of standards, as well as in several UN instruments, including the Universal Declaration of Human Rights, which states in its article 22 that “everyone, as a member of society, has the right to social security.”
Principle 2. Social solidarity and collective financing
Social solidarity and solidarity in financing are at the heart of social security and, hence, of ILO’s standards and action. Contrary to privately operated pension schemes based on individual savings accounts, collectively financed protection mechanisms generate positive

Social protection for older persons: Policy trends and statistics 2017-19 5
redistribution effects and do not transfer the financial and labour market risks onto individuals
Principle 3. Adequacy and predictability of benefits
This principle refers to the entitlement to defined pension benefits prescribed by law. The Social Security (Minimum Standards) Convention, 1952 (No.102) and the Invalidity, Old-Age and Survivors’ Benefits Convention, 1967 (No. 128) envisage the provision of income security to people who have reached pensionable age through: (i) earnings-related contributory pensions (guaranteeing minimum benefit levels, or replacement rates corresponding to a prescribed proportion of an individual’s past earnings – in particular for those with lower earnings); and/or (ii) flat-rate pensions (mostly residency-based and financed by the general budget) and/or means‑tested pensions. These standards prescribe that earnings-related schemes, for example, need to provide periodic payments of at least 40 per cent (Convention No. 102) or 45 per cent (Convention No. 128) of the reference wage after 30 years of contribution or employment. These standards also require that pensions need to be periodically adjusted following substantial changes in the cost of living and/or the general level of earnings.
Principle 4. Overall and primary responsibility of the State
It refers to the obligation of the State, as the overall guarantor for social protection, to ensure the “financial, fiscal and economic sustainability” of the national social protection system “with due regard to social justice and equity” by collecting and allocating the needed resources with a view to effectively delivering the protection guaranteed by national law (Recommendation No. 202).
Principle 5. Non-discrimination, gender equality and responsiveness to special needs
With a view to secure gender equality, pension designs should duly take into account solidarity between men and women, by adopting financing mechanisms, eligibility conditions and benefit conditions that offset gender inequalities originating in the labour market or due to interruption in the careers of women arising from their reproductive roles and/or care responsibilities (Recommendation No. 202).
Principle 6. Financial, fiscal and economic sustainability
Sustainability refers to the current and future capacity of the economy to bear the costs of social security. Ensuring the sustainability is a permanent challenge for the State in exercising its overall and primary responsibility to guarantee a functional and comprehensive social protection system. This requires taking all necessary measures, including realizing periodically the necessary actuarial studies and introducing as required minor parametric reforms to ensure the sustainability of the pension system. According to Recommendation No. 202, the State is also accountable to ensure the sustainability of national social security systems in view of, among other factors, demographic change.
Principle 7. Transparent and sound financial management and administration
The principle refers to the need for good governance of the system, particularly with respect to financing, management and administration, to ensure compliance with the legal and regulatory frameworks (Convention No. 102 and Recommendation No. 202).

6 Social protection for older persons: Policy trends and statistics 2017-19
Principle 8. Involvement of social partners and consultations with other stakeholders
The principle recognises the need to ensure social dialogue and representation of protected persons in social security governance bodies. The principle of participatory management of social security systems has been since long established in international social security standards, namely in Article 72(1) of Convention No. 102, which stipulates that “where the administration is not entrusted to an institution regulated by the public authorities or to a government department responsible to a legislature, representatives of the persons protected shall participate in the management, or be associated therewith in a consultative capacity, under prescribed conditions; national laws or regulations may likewise decide as to the participation of representatives of employers and of the public authorities”.
The ILO Multi-Pillar Pension Model
The main idea behind the concept of a Multi-Pillar Pension System is the possibility of combining a set of social protection instruments, each of which plays one or more functions, to guarantee the whole range of objectives of a national pension system.
The following diagram illustrates the main components of the multi-pillar model based on the ILO principles described in the previous section.
Pillar 0 or the Pension Floor
It is aimed at establishing a social protection floor for older persons. This pillar is usually provided through a non-contributory pension scheme. It is financed from the general budget (often tax-financed). Universality of coverage can be achieved through a universal non-contributory scheme or by a combination of social insurance and a means-tested or pension-tested pension scheme. Regardless of the specific design of Pillar 0, it should guarantee a minimum level of income, with adequate levels of benefit, for a life in decency and dignity. The setting-up of a social protection floor for older persons represents one of the most important priorities in developing countries with high levels of informality and poverty, and where the extension of contributory coverage is likely to take decades. Together with health protection, Pillar 0 should ensure at a minimum that all older persons in need

Social protection for older persons: Policy trends and statistics 2017-19 7
have access to essential health care and to basic income security which together secure effective access to goods and services defined as necessary at the national level.
1st Pillar or Social Insurance Pillar
It follows the typical design of social security pension systems, defined-benefit and mandatory, financed through employer and worker contributions. Its objective is to provide higher levels of pension benefits in order to maintain the standard of living after retirement. It should provide at least a minimum pension at 40 per cent of pre-retirement insured income for 30 years of contributions, as well as a reduced/adjusted minimum benefit for those who have contributed for at least 15 years.
Sound general and financial governance, and the implementation of as necessary successive parametric reforms, are required to ensure its sustainability.
Pillars 0 and I represent the fundamental components of any social security pension system.
Countries are developing important innovations to adapt Pillar I to cover those who are not yet protected, including persons working in the informal economy, self-employed workers and workers in non-standard forms of employment.
2nd Pillar or Complementary Pillar
Not all countries need to have this pillar, it is a complementary contributory component, voluntary or mandatory, employment-based occupational or non-occupational, defined-benefit or defined-contribution, usually financed by employer’s contributions and privately managed, aimed at supplementing the pension benefits from the previous two pillars. Its operation requires a high level of commitment by the State, particularly with respect to proper regulation and supervision.
3rd Pillar or Voluntary Personal Savings Pillar
Pillar III is also complementary, comprised of a set of voluntary private pension schemes for those with the economic capacity to make additional personal savings, generally managed by private pension administrators under full market competition and government regulation.
International experience has shown that pension schemes based on individual accounts, such as those usually applied in the 2nd Pillar and 3rd Pillar, place many risks -macroeconomic, financial and demographic- on individuals and are unable to guarantee the principles of social security. Therefore, the ILO’s policy is that such systems, while they may be adopted by countries to complement social security pensions set out in Pillars I and II, should in no way attempt to replace them.
To conclude, the multi-pillar pension model presented in this policy brief brings together, on the one hand, the social security principles agreed by governments, employers and workers and, on the other hand, the extensive practical experience and knowledge developed by the work of the ILO over several decades.

8 Social protection for older persons: Policy trends and statistics 2017-19
3. Legal coverage
While a global trend towards increasing both legal and effective coverage of pension systems is observed, for most of the world’s population the right to income security in old age is unfulfilled, and considerable inequalities persist. Globally, 67.6 per cent of the working-age population are covered by existing laws under mandatory contributory and non-contributory schemes, 1 and would therefore potentially be eligible for an old-age pension on reaching the prescribed age if these laws were properly implemented and enforced (see figure 2). In addition to mandatory contributory and non-contributory schemes, 17.7 per cent of the working-age population have the possibility to contribute voluntarily, yet in many cases few people make use of this option.
Legal coverage for women is somewhat lower than that for the entire population, at 64.1 per cent, which largely reflects their lower labour market participation rates and their over-representation among those working as self-employed or unpaid family workers, particularly in agriculture, as domestic workers or in other occupations or sectors frequently not covered by existing legislation. For example, in the Arab States, legal coverage of women is only 34.8 per cent, while total population coverage is at 45.9 per cent. Similar trends can be observed for sub-Saharan and Northern Africa, where women’s legal coverage is lower in comparison to total population. In these regions, women whose husbands were covered by contributory schemes are in many countries entitled to survivors’ pensions which often become their only source of income.
Figure 2. Old-age pensions, legal coverage: Percentage of the working-age population (15–64 years)
covered by existing law under mandatory contributory and non‑‑‑‑contributory old-age
pensions, by region and type of scheme, latest available year
Note: Regional and global estimates weighted by working-age population.
Sources: ILO, World Social Protection Database, based on SSI; ISSA/SSA, Social Security Programs Throughout the World; ILOSTAT, completed with national statistical data for the quantification of the groups legally covered. See also Annex II, table B.3.
Link: http://www.social-protection.org/gimi/gess/RessourceDownload.action?ressource.ressourceId=54654
1 The extent of legal coverage for old age is defined as the proportion of the working-age population (or alternatively the labour force) covered by law with schemes providing periodic cash benefits once statutory pensionable age or other eligible age is reached. The population covered is estimated by using the available demographic, employment and other statistics to quantify the size of the groups covered as specified in the national legislation. Actual, effective coverage is often significantly lower than legal coverage where laws are not implemented fully or enforced. For additional details, see the glossary in Annex I, as well as Annex II, of the World Social Protection Report 2017-19 (ILO, 2017b).

Social protection for older persons: Policy trends and statistics 2017-19 9
4. Effective coverage: Monitoring SDG indicator 1.3.1 for older persons
While legal coverage refers to the extent to which existing legal frameworks offer legal entitlements, effective coverage refers to the effective implementation of the legal framework. The beneficiary coverage ratio presented in figure 3 shows the percentage of older persons above statutory pensionable age receiving contributory or non-contributory pensions. This serves for monitoring the SDG indicator 1.3.1.
Figure 3. SDG indicator 1.3.1 on effective coverage for older persons: Percentage of persons above statutory pensionable age receiving a pension, by region, latest available year
Notes: Proportion of older persons receiving a pension: ratio of persons above statutory pensionable age receiving an old-age pension to the persons above statutory pensionable age. Regional and global estimates weighted by population of pensionable age.
Sources: ILO, World Social Protection Database, based on SSI; ILOSTAT; OECD SOCR; national sources. See also Annex II, tables B.5 and B.6.
Link: http://www.social-protection.org/gimi/gess/RessourceDownload.action?ressource.ressourceId=54655
Worldwide, 68 per cent of people above retirement age receive a pension, either contributory or non-contributory.2 Consequently, compared with other social protection functions, income protection of older persons is the most widespread form of social protection, showing significant development over the last few years. Regional differences in income protection for older persons are very significant: coverage rates in higher-income
2 Weighted by population of pensionable age.

10 Social protection for older persons: Policy trends and statistics 2017-19
countries are close to 100 per cent, while in sub-Saharan Africa they are only 22.7 per cent, and in Southern Asia 23.6 per cent. 3
Figure 4 presents two additional indicators to understand the extent to which the existing statutory frameworks are implemented. Focusing on contributory pensions, the “contributor coverage ratio” in its two variants provides some indication of future pension coverage: it shows the percentages of, respectively, those who are economically active (“contributors/labour force coverage ratio”) and those of working age (“contributors/population coverage ratio”) who contribute to existing contributory pension schemes.
Figure 4. Old-age pensions, effective coverage: Active contributors to pension schemes as a percentage of the labour force and working-age population, by region, latest available year
Notes: Active contributors: the age range considered is 15–64 for the denominator and, as far as possible, also for the numerator in the case of active contributors. Regional and global estimates weighted by working-age population.
Sources: ILO World Social Protection Database, based on SSI; ILOSTAT; national sources. See also Annex II, tables B.5 and B.6.
Link: http://www.social-protection.org/gimi/gess/RessourceDownload.action?ressource.ressourceId=54656
The contributor coverage ratio gives an indication of the proportion of the working-age population – or the labour force – which will have access to contributory pensions in the future based on current contributory effort. Although this measure does not reflect non-contributory pensions, it still provides an important signal regarding future coverage levels, taking into account that benefit levels in contributory pension schemes are normally higher than those from non-contributory schemes. At the global level, roughly a quarter of the working-age population (24.9 per cent) contribute to a pension scheme, with large regional variations ranging from 6.3 per cent in sub-Saharan Africa to 76.2 per cent in Northern America.
3 As the available data for many countries do not allow for a detailed age breakdown of old-age pensioners, the indicator is calculated as the total number of beneficiaries of old-age pensions as a proportion of the population above statutory pensionable age.

Social protection for older persons: Policy trends and statistics 2017-19 11
Looking at the contributor coverage ratio as a percentage of the labour force, 34.5 per cent of the global labour force contribute to a pension insurance scheme, and can therefore expect to receive a contributory pension upon retirement. Owing to the high proportion of informal employment in sub-Saharan Africa, only 9.0 per cent of the labour force contribute to pension insurance and accumulate rights to a contributory pension. In South-Eastern Asia, about one-fifth of the labour force (20.4 per cent) contribute, while in Southern Asia coverage is only 13.7 per cent; contributor coverage ratios are slightly higher in the Arab States (31.4 per cent), Eastern Asia (34.1 per cent), Northern Africa (38.2 per cent), Latin America and the Caribbean (40.4 per cent), Central and Western Asia (57.1 per cent) and Eastern Europe (68.3 per cent). Northern, Southern and Western Europe and Northern America reach coverage rates of 86.7 and 97.0 per cent respectively, followed by Europe and Central Asia and Oceania with 75.6 and 69.9 per cent of the labour force respectively.
In lower-income countries, usually only a very small proportion of those employed are wage and salary earners with formal employment contracts, and are thus relatively easily covered by contributory pensions. Informality, contribution evasion and fragile governance (including lack of institutional capacity to ensure enforcement of laws) are also more prevalent in lower-income countries. That is why effective coverage seems to be strongly associated with a country’s income level, although it is in fact labour market structures, law enforcement and governance that actually exert the critical influence.
With efforts to extend contributory schemes to all with some contributory capacity, and with the introduction of non-contributory pensions in a larger number of countries, coverage has been extended significantly to workers in informal employment, providing at least a minimum of income security in old age. The following section will address these trends in more detail.

12 Social protection for older persons: Policy trends and statistics 2017-19
5. Trends in pension coverage across the world: Achieving universal social protection for all older persons
While there is still room for improvement, a significant number of countries across the world have achieved substantial progress in terms of effective pension coverage in recent years. Whereas in 2000 only 34 countries reached high effective coverage of more than 90 per cent of the population above statutory pensionable age, 53 countries fall into this category in 2015–17. In addition, the number of countries where pension provision reaches less than 20 per cent of older persons fell to 51, according to the most recent data available, compared to 73 countries in 2000. Overall, the data indicate positive trends, both in legal and effective coverage.
Many countries experienced a marked increase in coverage between 2000 and 2015–17, and a large number of developing countries achieved universal coverage for all older persons. Universal pensions have been instituted in Algeria, Argentina, Armenia, Azerbaijan, Belarus, the Plurinational State of Bolivia, Botswana, Brazil, Cabo Verde, Chile, China, Cook Islands, Georgia, Guyana, Kazakhstan, Kiribati, Kosovo, Kyrgyzstan, Lesotho, Maldives, Mauritius, Mongolia, Namibia, Nepal, Seychelles, South Africa, Swaziland, Thailand, Timor-Leste, Trinidad and Tobago, Ukraine, Uruguay, Uzbekistan and Zanzibar (United Republic of Tanzania). Experience shows that universal coverage may be achieved by either creating tax-funded non‑contributory social pensions for all (see box 2), or by a mix of contributory and non‑contributory schemes (see box 3).
Box 2 Universal social pensions in the Plurinational State of Bolivia, Botswana,
Lesotho, Namibia, Timor‑‑‑‑Leste and Zanzibar (United Republic of Tanzania)
The experiences of the Plurinational State of Bolivia, Botswana, Lesotho, Namibia and Zanzibar (United Republic of Tanzania) show that universal, non-contributory social pensions for older persons are feasible and can be financed by governments of low- and middle-income countries.
Plurinational State of Bolivia: Despite having the lowest GDP per capita on the South American continent, the Plurinational State of Bolivia has one of the highest coverage rates in old-age pensions. With the introduction of the non-contributory old‑age pension called Renta Dignidad in 2007, it achieved universal coverage. Renta Dignidad reaches around 91 per cent of the population over the age of 60, providing benefit levels at around US$36 per beneficiary without a contributory pension and around US$29 for recipients of contributory schemes. The programme costs around 1 per cent of GDP and is financed from a direct tax on hydrocarbons and dividends from state-owned companies. It has led to a 14 per cent poverty reduction at the household level and has secured beneficiary incomes and consumption. In households receiving the benefit, child labour has dropped by half and school enrolment has reached close to 100 per cent.
Botswana: The universal old-age pension is estimated to reach all citizens above 65 years of age. The pension is a monthly cash transfer of US$30, which is just over a third of the food poverty line. This is modest and sustainable. The pension and other social protection programmes, complemented by drought response and recovery measures, have contributed substantially to overall poverty reduction, with extreme poverty in Botswana falling from 23.4 per cent in 2003 to 6.4 per cent in 2009–10.
Lesotho: With more than 4 per cent of its population above the age of 70, Lesotho has a larger share of older people than many countries in sub-Saharan Africa. All citizens over 70 years of age are entitled to a monthly old-age pension (OAP) of LSL 550, equivalent to US$40. It is the largest regular cash transfer in Lesotho, covering about 83,000 persons. While coverage of eligible persons is approximately 100 per cent, it is estimated that many more benefit indirectly. The OAP costs about 1.7 per cent of GDP and is financed by general taxation, which largely comes from revenues of the Southern African Customs Union. Complementary services and transfers provided as part of the national social protection system include subsidized or free primary health care at government health centres and government hospitals, free antiretroviral treatment medication for HIV/AIDS patients, and a cash grant administered by local governments for those deemed “needy”. �

Social protection for older persons: Policy trends and statistics 2017-19 13
Namibia: The Basic Social Grant in Namibia guarantees all residents over 60 years of age a monthly allowance of NAD 1,100 (approximately US$78), lifting the beneficiary well above the poverty line. Beneficiaries have been found to share the grant with the extended family, especially by supporting the schooling and well-being of grandchildren. While there are some problems in reaching people in remote areas, the total coverage is
estimated to be over 90 per cent.
Timor-Leste: The old-age and disability pension is a universal non-contributory scheme for all Timorese people above 60 years of age and those living with disabilities. It reaches 86,974 older people and provides US$30 per month, which is slightly above the national poverty line. A 2011 simulation estimated that the pension had reduced national poverty from 54 to 49 per cent, and poverty among older persons from 55.1 to 37.6 per cent. With the creation of the Contributory Social Security Scheme in future, it is estimated that some of the current beneficiaries will move to the contributory system and thus reduce pressure on the budget for the non-contributory scheme.
Zanzibar: In April 2016, Zanzibar (United Republic of Tanzania) became the first territory in East Africa to implement a social pension financed fully by the Government. The Universal Pension Scheme provides all residents over the age of 70 a monthly pension of TZS 20,000 (US$9). In a place with high poverty and high work informality, very few people are eligible for the contributory pension. The benefit level is admittedly modest and cannot lift older people out of poverty on its own, but it is a reasonable first step towards expanding a universal pension. In May 2016, 21,750 people, or 86 per cent of the eligible population, received the universal pension.
Sources: Based on Global Partnership for Universal Social Protection, 2016a, 2016b, 2016c, 2016d, 2016e, 2016f.
Box 3 Universal social protection for older persons through a mix of contributory
and non-contributory schemes: Argentina, Brazil, Cabo Verde, China, Kyrgyzstan, Maldives, South Africa, Thailand, Trinidad and Tobago
In recent decades, many countries have made significant efforts to expand the coverage of contributory pension schemes and establish non-contributory social pensions to guarantee basic income security for all older persons. The experiences described here show that extending pension coverage to citizens over a relatively short period is possible.
Argentina: Coverage rates in Argentina rose from 69 to close to 100 per cent of older persons between 2003 and 2015. The extension was made possible partly through a temporary flexibilization measure (the pension moratorium), under which older adults who do not have the 30 years of contributions required to receive benefits were made eligible for a pension if they joined a plan to pay the contribution years they had missed retroactively, under very favourable conditions.
Brazil: The old-age pension system integrates contributory, semi-contributory and non-contributory schemes which cover both public and private sector workers as well as smallholder farmers and rural workers. The non-contributory social assistance grants are means-tested benefits for people aged 65 or over and persons with disabilities. The system has nearly universal coverage, as 80.2 per cent of those aged 65 and over received a pension in 2014. Benefit levels are earnings-related for the contributory schemes. They are equal to the minimum wage for smallholder farmers and rural workers and those receiving the social assistance pension.
Cabo Verde: With social protection high on its development agenda, Cabo Verde took two major steps towards a universal pension system by creating the National Centre of Social Pensions (CNPS) in 2006 and unifying pre-existing non-contributory pension programmes. This unified scheme guarantees basic income security for persons over 60 years old and persons with disabilities including children with disabilities living in poor families. Social pensions have helped reduce poverty, adding a key pillar to Cabo Verde’s strategy of establishing a more comprehensive social protection floor. Today social pensions, in combination with the contributory scheme, cover about 85.8 per cent of the population above pensionable age, and provide benefits at around US$65 (20 per cent higher than the poverty line). Pensioners also benefit from the Mutual Health Fund, which subsidizes the purchase of medicines from private pharmacies and provides a funeral allowance. The social pensions cost nearly 0.4 per cent of GDP and are fully financed from the general state budget, whereas the Mutual Health Fund is financed from beneficiaries’ monthly contributions of 2 per cent of the social pension’s current value.
China: Before 2009, only two institutional mechanisms for income security in old age existed in China: one for urban workers based on social insurance principles, and one for civil servants and others of similar status based on the employer liability approach. Together they covered in 2008 under 250 million people (including pensioners), or about 23 per cent of the population aged 15 and above. Following a series of reforms in 2009, 2011, 2014 and 2015, an old-age pension scheme was established for the rural and urban populations not participating in the social insurance scheme, while the civil servants’ scheme was merged with the social insurance scheme for urban workers. In 2015, 850 million people were covered under the pension system; by 2017, universal coverage had been achieved.

14 Social protection for older persons: Policy trends and statistics 2017-19
Kyrgyzstan: The contributory retirement, disability and survivors’ pension is the largest social protection scheme in Kyrgyzstan. It covers workers in the public and private sectors as well as informal economy and agricultural workers. In addition, a non-contributory Monthly Social Benefit covers other older people, with a benefit amount fixed at KGS 1,000 since 2011. More than 90 per cent of the population over the age of 65 receives a pension, which has a major impact on reducing poverty in old age.
Maldives: Coverage was successfully extended through a series of reforms between 2009 and 2014, establishing a two-pillar system including the non-contributory Old Age Basic Pension and the contributory Maldives Retirement Pension Scheme. The system covers public sector employees and has extended coverage to the private sector (2011) and to expatriates (2014). The Senior Citizen Allowance provides a further pension top-up to address poverty and inequality. Pension coverage has gradually increased since the reforms and in 2017 is close to 100 per cent.
South Africa: South Africa was the first African country to introduce a social pension for older persons to extend coverage for those who did not have social insurance. The Older Person’s Grant (is an income-tested, monthly payment of ZAR 1,500 (US$112) for persons aged 60–75 years and ZAR 1,520 (US$114) for those above 75 years. It is paid to around three million older persons in South Africa, reaching up to 100 per cent coverage in some jurisdictions. The Older Person’s Grant is given to citizens, permanent residents and refugees with legal status, and is estimated to have significantly helped reduce inequality, with a Gini coefficient of 0.77 (without grants) and 0.60 (with grants).
Thailand: The pension system comprises several contributory schemes for public-sector officials, private-sector employees and informal-economy workers, reaching about a quarter of the population above 60 years of age. Additionally, a non-contributory old-age allowance provides some protection to people without access to regular pension payments. The monthly benefit is tiered and varies between THB 600–1,000, equivalent to US$18–30, which is less than half the poverty line. The universal old-age allowance serves as the only form of pension for many people working in the informal economy. To encourage participation in the contributory system, the Government provides a matching contribution under the voluntary social insurance scheme.
Trinidad and Tobago: A contributory retirement pension administered by the National Insurance Board and a non-contributory Senior Citizens’ Pension (SCP) provide income security for older people in the country. The SCP is a monthly grant of up to TTD 3,500 (US$520) paid to residents aged 65 or more. This is higher than the established poverty line. The SCP cost 1.6 per cent of GDP in 2015. With 90,800 citizens receiving the SCP in September 2016, it is estimated that the combination of the contributory retirement pension and the SCP reach universal coverage of older persons in the country.
Source: Based on Global Partnership for Universal Social Protection, 2016g, 2016h, 2016i, 2016j, 2016k, 2016l.
As indicated in figures 5 and 6, a number of countries have also been successful in expanding effective coverage: Bangladesh, Belarus, Belize, Ecuador, Republic of Korea, India, Philippines and Viet Nam, among others. In many countries the extension of coverage was made possible mainly through the establishment or extension of non-contributory pension schemes which provide at least a basic level of protection for many older persons, while others have combined the expansion of contributory schemes to previously uncovered groups of the population with other measures.
Figure 6 indicates that despite significant efforts to extend coverage around the world, not all countries have fared well, in contrast to the success stories presented above. Albania, Azerbaijan and Greece, for instance, countries that had previously achieved coverage rates close to 90 per cent or higher in 2000, have since suffered a significant decrease, with coverage rates dropping by 12–16 percentage points.
Social protection for older persons: Policy trends and statistics 2017-19 15
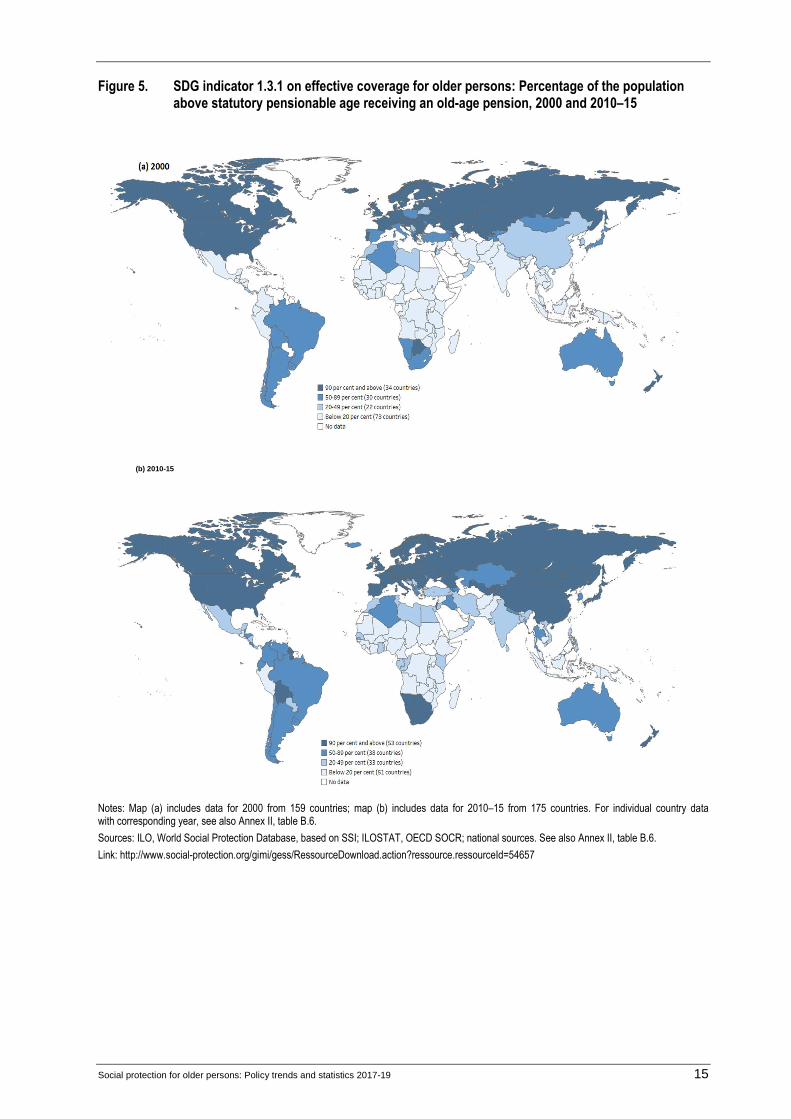
Figure 5. SDG indicator 1.3.1 on effective coverage for older persons: Percentage of the population above statutory pensionable age receiving an old-age pension, 2000 and 2010–15
Notes: Map (a) includes data for 2000 from 159 countries; map (b) includes data for 2010–15 from 175 countries. For individual country data with corresponding year, see also Annex II, table B.6.
Sources: ILO, World Social Protection Database, based on SSI; ILOSTAT, OECD SOCR; national sources. See also Annex II, table B.6.
Link: http://www.social-protection.org/gimi/gess/RessourceDownload.action?ressource.ressourceId=54657
(b) 2010-15

16 Social protection for older persons: Policy trends and statistics 2017-19
Figure 6. SDG indicator 1.3.1 on effective coverage for older persons: Comparison of the proportion of
the population above statutory pensionable age receiving an old‑‑‑‑age pension, 2000 and
2010–16 (percentage)
Sources: ILO, World Social Protection Database, based on SSI; ILOSTAT, OECD SOCR; national sources. See also Annex II, table B.6.
Link: http://www.social-protection.org/gimi/gess/RessourceDownload.action?ressource.ressourceId=54658

Social protection for older persons: Policy trends and statistics 2017-19 17
6. Expenditure on social protection for older perso ns
The level of expenditure on the income security of older persons is a useful measure for understanding the development level of pension systems. National public pension expenditure levels are influenced by a complexity of factors, comprising demographic structure, effective coverage, adequacy of benefits, relative size to GDP, and the variations in the policy mix between public and private provision for pensions and social services. Public social security expenditure on pensions and other non-health benefits earmarked for older persons amounts on average to 6.9 per cent of GDP globally (see figure 7). 4
Public non-health social protection expenditure for older persons takes the highest proportion of GDP in Northern, Southern and Western Europe, at 10.7 per cent. It is worth noting that this region has the highest ratio of older persons, comprising 19.6 per cent of the total population. Central and Western Asia as well as Latin America and the Caribbean have relatively high average expenditure ratios at 6.8 and 6.0 per cent respectively, whilst their population ratios of older persons are relatively low at 7.7 per cent and 7.5 per cent respectively. Interestingly, Northern America has the same average GDP expenditure rate as Central and Western Asia at 6.8 per cent, while the ratio of its older population is nearly double that of Central and Western Asia. The Arab States and sub-Saharan Africa, on the other hand, have similar older population ratios, whereas the expenditure rate for the Arab States is twice that of sub-Saharan Africa, probably reflecting the lower levels of effective coverage in the latter region. South-Eastern Asia has a GDP expense ratio similar to that of sub-Saharan Africa, although its older population ratio is nearly twice as high.
Figure 7. Public social protection expenditure on pensions and other benefits, excluding health, for persons above statutory pensionable age (percentage of GDP), and share of persons aged 65 and above in total population (percentage), latest available year
Source: ILO, World Social Protection Database, based on SSI. See Annex II, table B.7.
Link: http://www.social-protection.org/gimi/gess/RessourceDownload.action?ressource.ressourceId=54659
4 While the data include not only pensions but, so far as possible, other cash and in-kind benefits for older persons, they do not include expenditure on long-term care, the cost of which in many countries is already significant and is likely to increase further in the future due to demographic change.

18 Social protection for older persons: Policy trends and statistics 2017-19
Figure 8. Public social protection expenditure on pensions and other benefits, excluding health, for persons above statutory pensionable age, by country income level, latest available year (percentage of GDP)
Source: ILO, World Social Protection Database, based on SSI. See Annex II, table B.7.
Link: http://www.social-protection.org/gimi/gess/RessourceDownload.action?ressource.ressourceId=54660

Social protection for older persons: Policy trends and statistics 2017-19 19
Figure 8 provides a country-by-country review of the share of GDP allocated to the income security needs of older persons. For more effective comparisons, the countries are grouped by income status, namely high, low and middle income. As expected, the general trend is that higher-income countries are allocating a higher ratio of their GDP to the income security needs of older persons. The expected higher population ratio of older persons in developed countries, and achievements in terms of adequacy and effective coverage (the proportion of older persons receiving pension benefits) are key contributors to the observed trend. Countries with a strong social welfare background are also expected to exhibit higher social protection expenditure trends. It is noted that France, Greece and Italy are the lead countries, with the highest allocations. The high- and middle-income country groups exhibit a wide degree of variance in expenditure ratios. This variance is informed by the contrasting demographic and social protection system profiles. The low-income country group exhibits the lowest expenditure ratios, with the lead country in this group (United Republic of Tanzania) spending only 2 per cent of GDP on the income security needs of older persons.

20 Social protection for older persons: Policy trends and statistics 2017-19
7. Inequalities and the persistent gender gap in access to income security in old age
Income security in old age and access to pension benefits are closely associated with the inequalities that exist in the labour market and in employment. Such inequalities become evident from examination of a disaggregation of coverage rates by gender, the focus of this section (see figures 9 and 10).
It is widely known that women tend to face a higher risk of poverty than men do, and there are many underlying reasons why this also applies to women in old age. First, there is the fact that women live longer, resulting in predominance at the oldest ages of women with poor levels of support and livelihood (UNFPA and HelpAge International, 2012; UNRISD, 2010). Not many pension systems succeed in meeting the needs of men and women equitably: contributory pension coverage of women tends to be significantly lower than men’s, and the amounts received by women on average tend to be lower (Razavi et al., 2012).
A gender-biased design of pension schemes (e.g. lower pensionable age for women, or the application of sex-specific mortality tables to calculate benefit levels which result in women receiving lower pensions than men with the same contribution record and retirement age) can lead to inequalities; yet in many cases a more significant driver of gender inequality is found in the discrimination against women in the labour market, coupled with a pension scheme design which does not compensate for differences deriving from labour market conditions and sometimes even magnifies them (Behrendt and Woodall, 2015). In this context, many women struggle to accrue pension rights that are equal to their male counterparts. Women’s wage employment, particularly in formal labour markets, has historically been lower than men’s and continues to be so in many parts of the world (ILO, 2012). Likewise, women systematically earn less than men (ILO, 2014b), which lowers their contributions to pension schemes. As women tend to take on a greater share of family responsibilities, they are more likely to shorten or interrupt their employment careers and face a higher risk of working in precarious and informal employment, which also affects their ability to build up pension entitlements. These factors lead to relatively low pension benefits where these are calculated on an earnings-related basis, unless effective measures are put in place to compensate for gender inequalities.
Figure 9. Old-age pensions, effective coverage: Percentage of the labour force contributing to a pension scheme, by sex, latest available year
Sources: ILO, World Social Protection Database, based on SSI; ILOSTAT; national sources. See also Annex II, table B.5
Link: http://www.social-protection.org/gimi/gess/RessourceDownload.action?ressource.ressourceId=54661

Social protection for older persons: Policy trends and statistics 2017-19 21
Figure 10. SDG indicator 1.3.1 on effective coverage for older persons: Percentage of the population above statutory pensionable age receiving an old-age pension, by sex, latest available year
Sources: ILO World Social Protection Database, based on SSI; OECD SOCR; ILOSTAT; national sources. See also Annex II, table B.6.
Link: http://www.social-protection.org/gimi/gess/RessourceDownload.action?ressource.ressourceId=54662
Non-contributory pensions can play a key role in ensuring women’s access to at least a basic pension, yet benefit levels are often low, insufficient to fully meet their needs; nor do they fully compensate for the lack of contributory coverage. Greater efforts are necessary, also to ensure increased participation by women in contributory schemes (ILO, 2016).
It should also be noted that in many parts of the world women are disproportionately represented among the rural population, where paid work, even if available, is likely to be relatively poorly paid, informal and insecure – reflecting, in part at least, the movement of men to cities in search of better-paid work at the more formalized end of the labour market spectrum. At the same time, the growing importance of non-contributory pensions in the provision of old-age income, especially in low- and lower-middle income countries, is clearly helping to bridge the coverage gap between men and women to some extent. For instance, in Thailand, 84.6 per cent of women above retirement age are receiving the non‑
contributory pension, but only 77.9 per cent of men (figure 10). Likewise, Azerbaijan provides a pension for 95 per cent of its female citizens through its universal social protection system that, among others, consists of a contribution-based labour pension and social allowances (transfers).
On the other hand, Costa Rica indicates a relatively low coverage of its female population, with currently only 48.8 per cent above statutory pensionable age receiving an old-age pension, as opposed to 65.4 per cent of the male population. Yet the data in figure 9 also show a relatively high proportion of females (63.8 per cent) contributing to a pension scheme, compared to only 36.3 per cent of males. According to these data it can be assumed that the level of coverage among females is likely to increase in the future. In Colombia and Ecuador, for example, the data indicate a higher contributory coverage for females than for males and thus a potential improvement in coverage in the long run. In the Plurinational State of Bolivia, the proportion of older women receiving the non-contributory Renta Dignidad only (as opposed to a reduced level of Renta Dignidad in addition to a contributory pension) is significantly higher than that of men (83.3 per cent versus 66.3 per cent).
More optimistic prospects may nevertheless be seen in a number of nascent trends that address inequality in pension coverage. There are efforts everywhere to expand the effective coverage of contributory schemes to at least some categories of self-employed and other workers with contributory capacity. In addition, the establishment of large-scale non-contributory pension schemes in many countries has expanded effective coverage and

22 Social protection for older persons: Policy trends and statistics 2017-19
reduced inequalities, both between women and men, and between rural and urban populations.
Gender equality considerations are gaining some ground in the public debate on pensions. Proactive policy measures have been implemented in some countries to reduce the effect of differentiated career patterns on old-age income security. The most obvious discriminatory elements and parameters of national pension schemes, such as the differential pension ages which were common until recently, are rapidly being eliminated, albeit in the context of general increases in pension ages for both women and men.
Other steps in the same direction include crediting pension accounts during maternity, paternity and parental leave, and a better recognition of care work undertaken by both women and men. Measures to facilitate a more equal sharing of care responsibilities between women and men contribute to addressing some of the inequalities in the labour market and in social protection more broadly, and may be reflected in a reduction of gender inequalities in labour markets and pension systems in the long run.
As with so many other aspects of social protection, those relating to the promotion of equitable treatment of women and men must – if they are to be addressed effectively and in a spirit of social justice – be dealt with on a basis which fully integrates labour market and social protection policy-making.
Social protection for older persons: Policy trends and statistics 2017-19 23
8. The adequacy of pensions to provide genuine income security to older persons
The twin objectives of pension systems are to reach all older persons in need and to do so at an appropriate monetary level of benefit provision. While there are sufficient data to assess the extent of coverage (sections 3 and 4), comparative assessments of the adequacy of post-retirement benefits are challenging, given that it is difficult to identify a comparable methodology and benchmark that can be applied globally (see box 4). 5
Box 4 Monitoring pension benefit adequacy
Trends move in different directions; in some cases pension systems improve the benefit level and in other cases pension benefits are reduced. It is worth noting that recent fiscal consolidation trends are having a negative impact on the adequacy of pension payments in many countries, compromising the social contract.
The United Kingdom has recently introduced changes to its public pension scheme designed to improve the adequacy of pension for low-income earners. The reforms will see the two-tier benefit structure (a flat-rate basic pension and an earnings-related additional pension) being merged into a flat-rate basic pension. The new flat-rate benefit will deliver an enhanced minimum pension benefit. Participants will be able to gain additional earnings-related pension credits through external voluntary pension arrangements.
The retirement benefits of the public pension in Slovakia introduce a new indexation formula entering into force in 2018 which removes linkages to the national average earnings growth constituted solely by the consumer price index. Similar adjustments to the indexation formula have also been introduced in Azerbaijan, Czech Republic, Honduras and Spain as part of broader reforms to their national pension systems.
Several national pension schemes have recently announced upward adjustments to pension benefits, namely Belarus, China, Georgia, Ireland, Mauritius, Namibia, Nicaragua, Panama, Philippines, Portugal, Russian Federation, Seychelles, Turkey and Zimbabwe.
In 2014 the Republic of Korea introduced a new formula for determining minimum pensions, which resulted in the minimum pension being revised to nearly twice the previous amount. Armenia’s national social pension system has also delivered pension benefit increases of 15 per cent in both 2014 and 2015.
Spain will, effective 2019, introduce sustainability adjustment factors to automatically adjust new pension benefits to counter the increased life expectancy of new pensioners. A similar adjustment was previously introduced to the public pension scheme in Finland, where it is expected to have reduced pension benefits by 21 per cent by 2060 (OECD, 2015).
In Hungary a bonus 13th payment in the public pension system is to be replaced by conditional indexation.
Source: ILO Social Protection Monitor.
The extent to which retirement pensions are considered sufficient varies from one society to another, in particular in prevailing attitudes on matters such as the distribution of responsibility between individuals and the State, redistribution and the support to be provided to the poor and vulnerable, and intergenerational solidarity. Other aspects include the age at which retirement takes place, the level of income security that should be
5 The OECD, in collaboration with the World Bank, has made some attempts to calculate replacement indicators beyond EU and OECD countries, specifically regarding replacement rates provided by pension systems in different countries for hypothetical individuals with different levels of earnings and contributory past service (see Whitehouse, 2012); however, these are not yet included in the World Bank Pension Database. HelpAge’s Global AgeWatch Index (HelpAge International, 2015) looks at the overall income situation of older people, not specifically at the levels of protection provided by existing pension systems. Within the AgeWatch Index, income security of older persons is measured by four indicators: percentage of older persons receiving pensions, relative poverty rates of older persons, relative income/consumption position of older persons (average incomes of those over 60 as a proportion of average incomes of the rest of the population), and the GNI per capita.

24 Social protection for older persons: Policy trends and statistics 2017-19
guaranteed and to whom, and the degree of intergenerational solidarity that should be expected in financing pensions.
It is important to take into consideration that the adequacy of retirement benefits depends not only on the quantum of the cash benefits provided, but also on the costs of essential services such as health care, food, accommodation, and so on. Furthermore, the assessment of the adequacy of retirement benefits is dynamic and will therefore evolve over time as social, cultural, demographic and economic conditions change.
Despite global progress in social protection, adequacy of benefits remains a major challenge. As shown in figure 11, in countries such as Armenia, Belize, Bolivia (Plurinational State), Colombia, India and Turkey the amount of the non-contributory pension represents less than 40 per cent of the value of the national poverty line. Older persons receiving a social pension in these countries are still poor.
Figure 11. Non-contributory pensions as a percentage of the national poverty line, single person, latest available year
Source: ILO, World Social Protection Database, based on SSI; HelpAge International; national sources. See also Annex II; Annex IV, table B.10.
Link: http://www.social-protection.org/gimi/gess/RessourceDownload.action?ressource.ressourceId=54799

Social protection for older persons: Policy trends and statistics 2017-19 25
Although pension systems in many high-income countries include a universal social pension or a minimum pension, benefit levels often fall below the poverty threshold and thus fail to prevent poverty in old age (European Commission, 2015b). Actually, according to OECD data, old-age poverty is increasing in some OECD countries.
If the level of benefits provided by social protection systems is insufficient in terms of minimum living standards, this will jeopardize the achievements of the poverty reduction goals of the 2030 Agenda. The adequacy of benefits thus plays a crucial role in strategies for achieving the SDGs on social protection.
8.1. Preventing erosion of the value of pensions ov er time: Ensuring regular adjustments
An important consideration on the adequacy of pensions is their ability to retain their purchasing power and real value. A good practice in the design of pension systems is the establishment of an initial income replacement at retirement, and then ensuring the preservation of such income level for the life of the retiree. Unless the quantum of pensions is adjusted or indexed, the standard of living of pensioners will be jeopardized.
Conventions Nos 102 and 128 both call for levels of benefits in payment to be reviewed following substantial changes in level of earnings or of cost of living, while Recommendation No. 131 explicitly stipulates that benefit levels should be periodically adjusted to take into account changes in the general level of earnings or cost of living. Recommendation No. 202, on the other hand, requires social protection floor guaranteed levels to be reviewed regularly through a transparent procedure established by national laws, regulations or practice. The practice of indexation varies across countries and schemes, as shown in table 1.
Table 1. Indexation methods
Indexation method Number of schemes
Price indexation 44
Wage indexation 27
Mixed price/wage 21
Regular, not specified 24
Ad hoc 4
No information 57
Total 177
Note: “no information” in most cases means “no indexation”.
Source: ILO, 2014a, based on ISSA/SSA, Social Security Programs Throughout the World.
Link: http://www.social-protection.org/gimi/gess/RessourceDownload.action?ressource.ressourceId=54784
While wage indexation was more popular in the past, nowadays an increasing number of schemes guarantee, at best, only adjustments in line with cost of living increases. The choice of an indexation method may appear to be a technical detail, but it can have a significant impact on the level of pensions, and consequently on expenditure on pensions. Where wages increase faster than prices, the change from wage-based indexation to price-based indexation offers significant reductions in pension expenditure but also leads to the decoupling of pensioners’ living standards from those of the working population. A classic example of this decoupling has taken place in Slovakia’s national pension system. Pensions in payment were initially indexed to a mix of growth of average earnings growth and price inflation. Consistent with broader reforms to improve the sustainability of the scheme, the

26 Social protection for older persons: Policy trends and statistics 2017-19
share of earnings growth and inflation in the indexation formula changed from 40:60 in 2014 to 30:70 in 2015, 20:80 in 2016, and subsequently 10:90 in 2017. From 2018 indexation will be based solely on the consumer price index (IMF, 2017).
Many newly established schemes provide ad hoc pension increases. Particularly in inflationary environments, this results in a majority of pensioners eventually receiving nominal pensions with limited poverty reduction impact. Figure 11 shows the average replacement rates at retirement in public pension schemes across selected European countries, indicating a clear reduction towards 2060 in projected data. Unless pensions are adjusted in line with increases in real wages or other measures related to the overall cost of living, the standard of living of older persons will deteriorate and they may be subsequently pushed into poverty.
Figure 12. Average replacement rates at retirement in public pension schemes, selected European countries, 2013 and projected for 2060 (percentage)
Note: A 40 per cent replacement rate after 30 years of contributions is prescribed by Convention No. 102 for periodic old-age benefits.
Source: European Commission, 2015a, p. 13, table 2.
Link: http://www.social-protection.org/gimi/gess/RessourceDownload.action?ressource.ressourceId=54663
8.2. Reforming pension systems in the context of fiscal consolidation and austerity policies 6
Under fiscal pressure, many countries (mostly high-income but also some middle-income countries) have introduced a series of adjustment measures affecting the adequacy of pension systems. More precisely, these measures affect eligibility conditions and delay pension receipt – for instance, by increasing penalties for early retirement, raising the statutory pensionable age, and indexing the retirement age to increases in life expectancy, among others. These trends, sometimes linked to the fear of “implicit pension debt” (see box 5), pose a risk to the maintenance of social protection systems and the social contract.
6 In this report, “fiscal consolidation” refers to the wide array of adjustment measures adopted to reduce government deficits and debt accumulation. Fiscal consolidation policies are often referred to as austerity policies.

Social protection for older persons: Policy trends and statistics 2017-19 27
Box 5 Implicit pension debt
The concept of implicit pension debt was formulated by World Bank staff in the 1990s; it is an adaptation of the concepts commonly used in the private insurance sector. A pension debt is liability created when pension benefits have been promised but not funded. The term is often defined in two different ways: (1) implicit social security pension debt equals the present value of all future benefits to present pensioners and all accrued rights of current insured members, minus the amount of the initial reserve of the pension scheme; (2) implicit social security pension debt equals the present value of all future benefits to present and future pensioners, minus the amount of the initial reserve of the scheme, minus the present value of all expected future contribution payments of present and future insured persons at a constant initial contribution rate.
The first definition follows a strict private insurance concept and was used by the World Bank in its publication Averting the old age crisis (World Bank, 1994).
The second definition is a variation of the concept and follows a public finance approach and has been the definition preferred by the ILO (Gillion et al., 2000); it reflects the principles of solidarity and collective financing comprised in several ILO Conventions in the field of social security.
The implicit pension debt concept has been used as a justification for replacing public pension systems with private pension systems based on individual accounts. The main argument is that large amounts of pension debt associated with “unreformed” public systems are allegedly being amassed. But implicit debt only occurs if the present value of all future pension benefits minus the present value of all future social security taxes or contributions is negative. If contribution rates are increased in line with expenditure, or if expenditure is reduced through parametric reforms to meet acceptable contribution levels, the implicit pension debt disappears. The concept thus implies that no parametric adjustments will be made in the pension systems over many decades – which is contrary to all historical experience. In practice, all partially funded or PAYG pension schemes are built on the assumption that contribution or tax rates will have to increase periodically in the future to match the natural maturation process of these schemes (Cichon, 2004).
The discussion on implicit pension debt has a direct connection with the level and pattern of funding. Private pension systems are usually fully funded, i.e. they have to have sufficient resources to honour their obligations should the insurance company, the occupational pension scheme or the sponsor of an occupational scheme be dissolved. If this condition is met, the scheme is fully funded. Public pension schemes, which are backed by a societal promise guaranteeing their liquidity and – ideally – indefinite existence, do not require the same level of funding. The level of funding in social security schemes is determined by considerations other than the exclusive financial safeguarding of pension promises. Most social security pension systems are in practice partially funded. Even systems which were originally designed to be fully funded have often become partially funded when inflation undermined the value of reserves (ILO, 2001).
Approximately 105 governments in 60 developing and 45 high-income countries are discussing changes to their pension systems such as reducing employers’ contribution rates, increasing eligibility periods, prolonging the retirement age and lowering benefits, sometimes with structural reform of contributory social security pensions. As a result, future pensioners are expected to receive lower benefits. The ILO estimates that future old-age pensioners will receive lower pensions in at least 14 European countries; several national courts in Europe have found the cuts unconstitutional (ILO, 2014 and 2017).
In order to ensure the sustainability of pension systems the ILO supports introducing structural or parametric reforms, provided that such measures are in line with the principles and legal conditions contained in international standards on social security, including the necessary gradualism in terms of implementation so as not to abruptly affect the living conditions of older persons. To this end, the ILO endeavours to monitor reforms, as well as to provide technical support to countries in designing and implementing their reforms in the context of social dialogue, complying with international standards and ensuring the participation of ILO constituents.
According to data collected by the ILO Social Protection Monitor, between 2010 and 2016 a total of 169 contraction measures in pension schemes were announced by governments from various regions of the world, mainly in regard to contributory pension schemes. Of these, 103 reforms were related to delaying pension receipt. These included raising the retirement age (72 announcements), the elimination of early retirement, the introduction or increase of penalties on early retirement, the introduction or increase of
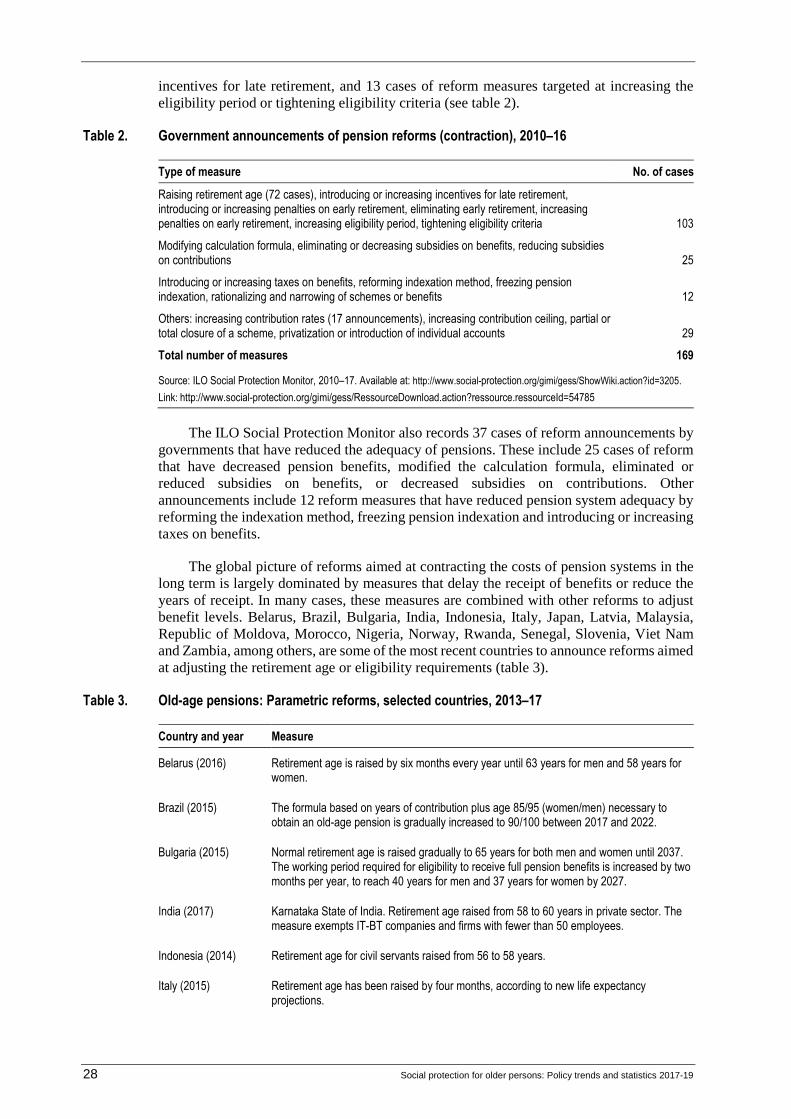
28 Social protection for older persons: Policy trends and statistics 2017-19
incentives for late retirement, and 13 cases of reform measures targeted at increasing the eligibility period or tightening eligibility criteria (see table 2).
Table 2. Government announcements of pension reforms (contraction), 2010–16
Type of measure No. of cases
Raising retirement age (72 cases), introducing or increasing incentives for late retirement, introducing or increasing penalties on early retirement, eliminating early retirement, increasing penalties on early retirement, increasing eligibility period, tightening eligibility criteria 103
Modifying calculation formula, eliminating or decreasing subsidies on benefits, reducing subsidies on contributions 25
Introducing or increasing taxes on benefits, reforming indexation method, freezing pension indexation, rationalizing and narrowing of schemes or benefits 12
Others: increasing contribution rates (17 announcements), increasing contribution ceiling, partial or total closure of a scheme, privatization or introduction of individual accounts 29
Total number of measures 169
Source: ILO Social Protection Monitor, 2010–17. Available at: http://www.social-protection.org/gimi/gess/ShowWiki.action?id=3205.
Link: http://www.social-protection.org/gimi/gess/RessourceDownload.action?ressource.ressourceId=54785
The ILO Social Protection Monitor also records 37 cases of reform announcements by governments that have reduced the adequacy of pensions. These include 25 cases of reform that have decreased pension benefits, modified the calculation formula, eliminated or reduced subsidies on benefits, or decreased subsidies on contributions. Other announcements include 12 reform measures that have reduced pension system adequacy by reforming the indexation method, freezing pension indexation and introducing or increasing taxes on benefits.
The global picture of reforms aimed at contracting the costs of pension systems in the long term is largely dominated by measures that delay the receipt of benefits or reduce the years of receipt. In many cases, these measures are combined with other reforms to adjust benefit levels. Belarus, Brazil, Bulgaria, India, Indonesia, Italy, Japan, Latvia, Malaysia, Republic of Moldova, Morocco, Nigeria, Norway, Rwanda, Senegal, Slovenia, Viet Nam and Zambia, among others, are some of the most recent countries to announce reforms aimed at adjusting the retirement age or eligibility requirements (table 3).
Table 3. Old-age pensions: Parametric reforms, selected countries, 2013–17
Country and year Measure
Belarus (2016) Retirement age is raised by six months every year until 63 years for men and 58 years for women.
Brazil (2015) The formula based on years of contribution plus age 85/95 (women/men) necessary to obtain an old-age pension is gradually increased to 90/100 between 2017 and 2022.
Bulgaria (2015) Normal retirement age is raised gradually to 65 years for both men and women until 2037. The working period required for eligibility to receive full pension benefits is increased by two months per year, to reach 40 years for men and 37 years for women by 2027.
India (2017) Karnataka State of India. Retirement age raised from 58 to 60 years in private sector. The measure exempts IT-BT companies and firms with fewer than 50 employees.
Indonesia (2014) Retirement age for civil servants raised from 56 to 58 years.
Italy (2015) Retirement age has been raised by four months, according to new life expectancy projections.

Social protection for older persons: Policy trends and statistics 2017-19 29
Country and year Measure
Japan (2013) Mandatory retirement age was raised from 55 to 60 years in 1998. It will go up to 61 and increase gradually at the rate of one year of age every three years until 2025, when the mandatory retirement age will be 65.
Latvia (2014) Retirement age is gradually raised by three months every year from 2014, reaching 65 years in 2025. In 2025, the minimum contributory period to qualify for an old-age pension will be 20 years.
Malaysia (2013) Minimum retirement age for private-sector workers is raised from 55 to 60 years.
Moldova, Republic of (2016)
Retirement age is gradually raised to 63 years by 2028, from the previous limit of 57 for women and 62 for men. Miners’ right to early retirement at the age of 54 is cut, making them retire with the same conditions as other workers.
Morocco (2016) Retirement age will increase progressively over a six-year period from 60 to 63 years. Accrued pension rights have decreased from 2.5 to 2 per cent per contribution year. Employee and employer contributions are to increase progressively from 10 to 14 per cent over three years until 2019. The benefit formula is moving from an end-of-career calculation towards a career-average approach, based on the average salary of the last eight years.
Nigeria (2016) Retirement age for academic and non-academic staff of the state-owned tertiary institutions is raised from 60 to 65 years.
Norway (2015) Age at which employers can terminate a worker’s employment contract has been raised from 70 to 72. New increases are expected.
Rwanda (2015) Minimum retirement age raised from 55 to 60 years in 2015.
Senegal (2014) Retirement age in the private sector raised from 55 to 60.
Slovenia (2015) Statutory retirement age was raised and economic incentives for retiring at a later age were introduced.
Viet Nam (2015) Retirement age for government officials and members of the armed forces raised to 65 for men and 60 for women in 2015.
Zambia (2015) Normal retirement age is raised to 60 years, with options of 55 and 65 respectively as early and late retirement, while 60 is normal retirement age.
Source: ILO Social Protection Monitor, 2010–17. Available at: http://www.social-protection.org/gimi/gess/ShowWiki.action?id=3205.
Link: http://www.social-protection.org/gimi/gess/RessourceDownload.action?ressource.ressourceId=54786
Based on current trends, it is expected that an increasing number of workers will have to resort to tax‑financed social assistance or guaranteed minimum income schemes in their old age as a result of the pension reforms. Unfortunately, after introducing the reforms, some national pension systems in countries that have ratified ILO Convention No. 102 and/or the European Code of Social Security will no longer meet the requirements needed to fulfil them in terms of eligibility conditions and adequacy.
Countries introducing reforms to their pension systems need to find a suitable balance between sustainability objectives and retirement conditions, including adequacy, in order to accomplish the purpose of pension systems. In the developing world, where the phenomena of poverty and informality are widespread, a significant proportion of older and unskilled workers are moving from formal jobs, with social protection, to informal ones or to unemployment, which makes it difficult for them to meet the legal requirements for a contributory pension. In particular, the minimum number of contributions, the retirement age and other related parameters must be handled with caution in order to ensure that the social protection system meets its objective of protecting all older persons. In the context of the aims of Agenda 2030, it is important to consider the need for pension reforms that reach

30 Social protection for older persons: Policy trends and statistics 2017-19
the most vulnerable groups, guaranteeing social protection floors for older persons excluded from contributory pension benefits.

Social protection for older persons: Policy trends and statistics 2017-19 31
9. Reversing pension privatization
9.1. Lessons from three decades of pension privatiz ation
Since the 1990s, many countries have introduced structural reforms to their pension systems, to move from the public defined benefit (DB) model to defined contribution (DC) with individual accounts and private administration model. Structural reforms entailed setting up privately managed and invested pension pillars with defined contributions, investing people’s savings into capital markets. These structural reforms shifted responsibility and financial burden from the public sector and changed the way old-age security was viewed (Mesa-Lago, 2014). A large number of the reforms were designed and driven by the World Bank, based on the argument of the impending crisis of ageing and its impact on the sustainability of pension systems (e.g. World Bank, 1994). The most profound and extensive pension reforms modifying the financing model and the role of the State took place in the 1990s in Latin America, Eastern Europe and Central Asia.
In 1995, ILO and the International Social Security Association (ISSA) (Beattie and McGillivray, 1995) published a first report with a critical assessment of the World Bank’s privatization strategy, arguing that the strategy outlined in the report, involving the replacement of social insurance pension schemes by mandatory individual savings schemes, would cause an unacceptably high degree of risk for workers and pensioners, that it would make old-age protection more costly, and that the transition would impose a heavy burden on the current generation of workers. This and other ILO and ISSA assessments conclude that a more efficient and less disruptive approach to the provision of retirement pensions would be to focus efforts on measures to rectify design deficiencies and inequities in public schemes, i.e. parametric reforms to public schemes rather than systemic reforms. Box 6 provides a view based on international social security standards including those of the ILO Committee of Experts on the Application of Conventions and Recommendations (CEACR).
Between 1981 and 2018, 30 countries undertook pension reforms introducing either partial privatization or full privatization with individual accounts and private administration. Table 4 presents the main features of these reform models and provides country examples.
Table 4. Typology of Pension Privatization Reforms 1981–2010
Full privatization Partial privatization
Main features
This involves replacing the public Pay As You Go (PAYG) system by a privately managed pension system, based on fully-funded individual accounts and defined contributions (DC).
This involves the introduction of a complementary fully-funded individual accounts component in a larger system, resulting in several pension schemes, some public (with DB, PAYG and public administration features) and others privately managed (with DC, fully-funded individual accounts). The weight of the pillars can significantly differ among countries.
Country examples
Chile (1981), Bolivia (1997), Mexico (1997), El Salvador (1998), Kazakhstan (1998), Nicaragua (2000), Dominican Republic (2003), Nigeria (2004)
Argentina (1994), Uruguay (1996), Hungary (1998), Poland (1999), Costa Rica (2001), Latvia (2001), Bulgaria (2002), Croatia (1999), Estonia (2002), the Russian Federation (2002), Lithuania (2004), Romania (2004), Slovakia (2005), Macedonia (2006), Ghana (2010)
Source: Mesa-Lago, 2004; Mesa-Lago and Hohnerlein, 2002; Obermann T.P. 2005; Orenstein M. A. 2008; Grishchenko, 2014.
Due to the difficulties experienced by private systems in meeting expectations regarding performance, some countries have been gradually reversing their previous reforms in different ways, while in other countries there are ongoing discussions to re-reform.
At least six countries, Argentina (2008), Bolivia (2009), Czech Republic (2016), Hungary (2011), Poland (2014), and the Russian Federation (2012), underwent re‑reforms

32 Social protection for older persons: Policy trends and statistics 2017-19
leading to a return to or a strengthening of their public and solidary pension schemes. Other countries such as Bulgaria (2007), Estonia (2009), Latvia (2009), Lithuania (2009), Romania (2009), Macedonia (2011), Croatia (2011), Slovakia (2012) and Kazakhstan (2013), drastically reduced the size of their individual account schemes by lowering their contribution rates and redirecting the financing to the public defined benefit systems (Kay, 2014)
In 2008, Chile adopted reforms aimed at improving the balance between social risks and individual effort throughout a new tax-financed public solidarity pension component, and in El Salvador there are ongoing discussions to introduce some re-reforms to the private system adopted in 1998.
Box 6 International social security standards and
the organization and financing of social security systems
Throughout the 1990s there was a drive to reduce the State’s responsibility to provide social security pensions by increasing the role of private institutions and gradually reducing the public tier. Such new forms of delivering and managing social security schemes were not necessarily deemed to be in direct contradiction to the framework of internationally accepted principles embodied in the international social security standards, as the latter were drafted in a flexible manner so as to take into account various methods of ensuring protection without prejudging any system as such, provided that it adhered to certain core principles considered to represent the cornerstone of the notion of social security.
International social security standards lay down certain general principles with regard to the organization and management of social security systems. Thus, the Social Security (Minimum Standards) Convention, 1952 (No. 102), provides that the State must accept general responsibility for the due provision of benefits and proper administration of the institutions and services concerned, and that social security systems should be financed collectively by means of insurance contributions or taxation or both, such that the risks are spread among the members of the community. Indeed, an essential part of the concept of social security is for the risk being managed to be pooled through collective assumption of the financial burden of paying benefits. Other principles include the periodic nature of the cash benefits; the obligation to guarantee their level and to maintain their real value; the need for the representatives of the persons protected to participate in the management of the schemes or be associated with them in all cases where the administration is not entrusted to an institution regulated by the public authorities or a government department; the exclusion of solutions which would prove unduly onerous for persons of modest means; and the establishment of an upper limit on the share of employees, in order that at least half of the revenues of social security schemes will be derived in a more social manner through subsidies from general revenues or employer contributions. These principles were recently reaffirmed and strengthened in 2012 through the adoption by the International Labour Conference of the Social Protection Floors Recommendation, 2012 (No. 202).
Regardless of the type of scheme (public, private or mixed systems), these basic principles of organization and management should continue to underlie the structure of social security systems with a view to keeping the balance maintained by Convention No. 102 between the protection of the general interests of the community and the rights of individuals. In practice, experience shows that certain of the above basic principles have proved to be hardly implementable by certain new types of schemes. For example, the periodic nature of the cash benefits, or the obligation to guarantee their level and to maintain their real value, cannot be ensured by private defined contribution schemes. Notwithstanding the different levels of protection required by the international standards, there are certain limits to reforms, particularly to those which lead to privatization of social security. The core principles referred to above represent a guarantee against social regress.
It should be borne in mind that the design of a pension scheme is the result of a large array of choices. Of these, two in particular stand out and are often used as the basis on which to characterize the scheme as a whole: (i) whether the basis of pension calculation should be related to active life earnings (so-called defined benefit, or DB schemes) or directly to contributions paid (so-called defined contribution, or DC schemes); and (ii) whether the financial system should be based on the provision of monies as needed for each year’s benefit payments (so-called pay-as-you-go, or PAYG financing) or based on the advance accrual (from higher contribution rates) of assets which are invested in reserved funds (so-called full or partial funding). From a technical perspective, each choice has advantages and disadvantages. Many schemes seek to maximize the former and minimize the latter by means of a so-called “multi-pillar” or “multi-tier” approach, in which elements of DB or DC design, PAYG or funding, are combined in selected proportions. In recent years, a strong trend has developed towards schemes with DC pensions, often associated with fully funded financing based on individual accounts. Such schemes (if implemented on a single-tier basis) carry high risks for members, whose prospective pensions are very vulnerable to the risks associated with investment fluctuations – as seen vividly in the recent global financial crisis.

Social protection for older persons: Policy trends and statistics 2017-19 33
For this reason, the ILO supervisory bodies consider that DC schemes often may not meet the requirements of Convention No. 102. In light of the diverse range of possibilities, it is necessary to analyse carefully both the adequacy of and the risks associated with each national system in its entirety. Over recent decades, many reforms have attempted to restructure the public PAYG defined benefit systems through the establishment of often privately managed fully funded schemes based on individual pension accounts, which has resulted in the reduction of social solidarity previously ensured through redistributive mechanisms. Ever since, the ILO supervisory bodies have engaged in an intensive dialogue with the governments concerned on a broad spectrum of issues concerning non-compliance with ILO social security standards. They have observed in particular that pension schemes based on the capitalization of individual savings managed by private pension funds were organized in disregard of the principles of solidarity, risk sharing and collective financing which are the essence of social security, as well as in disregard of the principles of transparent, accountable and democratic management of pension schemes featuring the participation of representatives of the insured persons. The Committee of Experts on the Application of Conventions and Recommendations (CEACR) pointed out in 2009 that these principles underpin all ILO social security standards and technical assistance and offer the appropriate guarantees of financial viability and sustainable development of social security; neglecting them, and at the same time removing state guarantees, exposed members of private schemes to greater financial risks.
Recently, however, the developments which followed the international financial crisis led to the reaffirmation of these basic principles through the emergence of a new consensus for a prosperous world economy, of which social protection and good governance now form an integral part, together with greater involvement by governments through strengthening of the rule of law. In this new development paradigm, a precondition to sustainable progress is seen to be the recasting of the regulatory framework of the financial system, strengthening public oversight and consolidating solidarity-based social security systems. It is noticeable that one of the main lessons of the economic crisis has been the conclusion that, where the schemes were financed collectively and fully managed by the State, in particular through PAYG financing, the immediate impact has been small. In contrast, fully privately funded schemes, where individual savings were invested in relatively volatile products, have sustained severe losses. The failure of so many private pension schemes to deliver decent pensions, not least due to the losses sustained during the financial crisis, has led many governments to undertake a second round of significant reforms, allowing workers to switch back to PAYG schemes and re-establishing or reinforcing solidarity and income redistribution mechanisms. It is therefore possible to observe a certain reinforcement of the involvement of the State and the reconstruction of solidarity mechanisms based on the principle of collective financing as major components of national social security systems. Besides improving social security administration, management and supervision, public systems more readily abide by the governance principles set out in ILO social security instruments, as observed typically in the well-established social security systems of high-income countries.
Source: Based on ILO, 2011.
Over the years, the central topics of debate regarding social security pension privatization and its reversal have been coverage extension, administrative costs, return on investments, adequacy of benefits, fiscal impact and governance. Expectations were high when introducing reforms, and countries hoped to improve both their pension systems and their overall economic performance. Coverage rates and benefit levels were expected to increase, inequality to decrease, administrative costs to decline through market competition, governance of pension management to improve, and capital markets to deepen supporting new investments and economic growth.
In practice, however, pension privatization did not deliver the expected results. Coverage rates stagnated or decreased, pension benefits deteriorated and gender and income inequality increased, making reforms very unpopular. The risk of financial market fluctuations was shifted to individuals. Administrative costs increased further reducing pension benefits. Workers participation in management was eliminated. The high costs of transition –often underestimated- created large fiscal pressures. While private pension fund administration was supposed to improve governance, it weakened it instead, as in many cases, the regulatory and supervisory functions were captured by the same economic groups responsible for managing the pension funds, creating a serious conflict of interest; further, the pension industry tended towards concentration. Last, but not least, pension reforms had limited effects on capital markets and growth. The following points reflect evidence after three decades of privatization reforms.

34 Social protection for older persons: Policy trends and statistics 2017-19
Low coverage. Evidence suggests that the introduction of individual accounts increased neither coverage nor compliance rates (Bertranou, Calvo and Bertranou, 2009). Coverage rates and benefit levels stagnated or decreased in most countries which had introduced individual accounts. In Argentina, the number of contributors fell from 46 per cent in 1993 (prior to the privatization reform) to 35 per cent in 2002 for male, and from 86 per cent to 72 per cent for female. while Bolivia`s coverage did not change and stagnated around 12 per cent, the lowest rate in Latin America. Likewise, coverage rates in Hungary and Kazakhstan failed to live up to high expectations or decreased with respect to pre-reform levels In Poland, the reform did not have a major impact on coverage; first, there was a decrease and later an increase – the overall number of persons covered was mainly a function of general employment levels.
Coverage rates in Chile dropped from 64 per cent in 1981 (year of the reform) to 61 per cent in 2007 (Mesa Lago, 2014). Likewise, coverage in Colombia contracted from 29.3 per cent in 1993 to 23 per cent in 2001 (Kleinjans, 2003). Similarly, coverage rates from 1993 to 2001 dropped in Mexico from 37 per cent to 30 per cent, in Uruguay from 73 per cent to 22 per cent, in Peru from 31 per cent to 12 per cent and in El Salvador from 26 per cent to 17 per cent (Crabbe, 2005). Mesa Lago (2004) points out that the weighted average of coverage in nine countries7 decreased from 38 per cent before the reform to 27 per cent in 2002 after reform. While the absolute coverage figures may differ between publications, the overall trend is the same, indicating a clear drop in coverage as a result of the privatization reforms.
High administrative costs. In most cases the costs rose to high levels, well above the pre-existing levels in the old public systems. There is extensive documentation of the high rates of administration costs of individual account systems, explained by the effect of high management fees and high premiums for financing survival and disability insurance. The direct consequence was a significant reduction in the net rate of return for contributors, affecting the net value of return on investments, while the profits of the management companies were very high. This unforeseen rise in administrative costs in the privatized pension systems resulted in significant pressure on the benefit levels and their popularity. In El Salvador, the management cost of the public system before the reform (as a percentage of the worker’s wage) was 0.5 per cent, but rose to 2.98 per cent in 2003 following the privatization. The highest management costs emerged in Mexico and Argentina, where they increased to 38 and 32 per cent of contribution payments respectively. According to Mesa-Lago (2004), the non-weighted average of administrative costs as a percentage of contributions in 11 Latin American countries was 26 per cent in 2003. Even in Chile, the percentage level of the total administrative cost initially rose from 2.44 per cent of the contributory salaries in 1981 to 3.6 per cent in 1984, and only declined to 2.26 per cent in 2003, 22 years after the reform. In Poland, fee levels remained unregulated until 2004 and some pension fund managers charged as much as 10 per cent of the contribution value.
Lower pension benefits and replacement rates. The shift from DB to DC systems in the privatization process had major implications on replacement rates. The risk of financial market fluctuations was left to pensioners, who thus risked losing their total life savings if financial markets collapsed, as happened during the global financial crisis. A study by the Inter-American Development Bank (IADB) highlighted a decline in replacement rates in the Chilean pension system from 1990 to 2000, when half the private system participants received a declining minimum pension (Crabbe, 2005). Borzutzky and Hyde (2016) further state that replacement rates were particularly low among women as a result of low female participation and that overall pension performance in Chile was weak, resulting in inadequate pensions. A financial (actuarial) assessment of the Argentinian pension system conducted by the ILO in 2004 projected a drop in replacement rates of about one-third. Further, Cichon (2004) concluded that average pension amounts were likely to gravitate
7 These include: Argentina, Bolivia, Chile, Colombia, Costa Rica, El Salvador, Mexico, Peru and Uruguay.
Social protection for older persons: Policy trends and statistics 2017-19 35
towards the minimum levels; according to Crabbe (2005), an increased proportion of the population would fail to qualify for the minimum pension, and as a result the reformed pension systems would fail to fulfil their purpose of old-age income protection. Altiparmakov (2014) concludes that private pension funds in Eastern Europe have realized rates of returns that are lower and more volatile than the corresponding PAYG rates of return, even before the financial crisis strongly affected market returns. Last but not least, Ebbinghaus (2015) points out the deteriorating effects of the private pension pillar due to lack of crediting contribution years for child-rearing and long‑term care, and the interruptions in contribution years as a result of an increasing share of atypical non-standard employment (e.g. freelancing) and premature job termination. All in all, pension privatization as observed in Eastern Europe and Latin America has resulted in a deterioration of the pension replacement rate and an erosion of the core idea of a social contract based on solidarity, redistribution and adequacy.
High fiscal costs. In most cases, the main source of motivation for the introduction of private pension systems was the fiscal pressures created by public pension systems. According to the evidence, however, the reforms failed to deliver an improvement in fiscal and financing terms, and financing the transition towards individual accounts exacerbated pre-existing fiscal pressures in most countries. The transition costs associated with moving from a DB to a private DC system were vastly underestimated in all countries, sometimes because no sound analysis was carried out at all prior to the reform, sometimes because calculations were based on unfounded optimistic assumptions. The halt or substantial reductions in contributions to the public pension system generated much higher transition costs than expected, inducing additional fiscal pressure and rising levels of debt. In Bolivia, transition costs were 2.5 times the initial projection of the World Bank. Debt levels in Chile were still 4.7 per cent of GDP in 2010, 30 years after the reform (Mesa‑Lago, 2014), while in Argentina the public system was running a deficit of 3.3 per cent of GDP by the year 2000, with around 1.5 per cent of GDP accounting for contributions diverted to the private system (Kay, 2014).. In Poland during the period 1999–2012, the cumulated costs of transfers to the second pillar were estimated to be 14.4 per cent of 2012 GDP, accompanied by approximately 6.8 per cent of GDP consumed by servicing additional public debt.
Lack of social dialogue. A number of normative ILO instruments establish the need to ensure social dialogue and representation of protected persons in social security governance bodies. Most structural reforms that privatized pensions in Central and Eastern Europe and Latin America were implemented with limited social dialogue, which later led to legitimacy problems (Mesa-Lago, 2014). Prior to the reforms, most public pension funds had some form of tripartite administration through representatives of workers, employers and the government. The privatization eliminated such participation in the private system, despite the workers being owners of the individual accounts (in Chile, small private pension funds initially had such representation, but it eventually disappeared). Likewise, in Hungary, the tripartite administration of the public system continued immediately following the reform but was later abolished. In Bolivia, the original privatization reform was undertaken against strong opposition from the Ministries of Labour and Health as well as trade unions, leading to public demonstrations. In Argentina, in the framework of the discussions to return to public pensions, the Government initially encouraged major debates including all key actors in 2002/03, but moved very quickly and without any consultations when introducing the re-reform measures in 2007 and 2008. It announced the project to re-nationalize the pension system at the end of October 2008 and the new Pension Act was passed without major changes and approved in both Chambers of Congress only a month later (Hujo and Rulli, 2014). Even though widely supported, the main actors concerned by the reform, such as pension funds (Administradoras de Fondos de Jubilaciones y Pensiones, AFJPs) and unions, were left with no time to react and there was no scope for formal participation in the process (ibid.).

36 Social protection for older persons: Policy trends and statistics 2017-19
9.2. Turning back to public pension systems
The fiscal pressures created by private systems were a major justification for reversing the privatization of pensions. The wave of pension privatization reversals coincided with the 2008 financial crisis. This increased pressure on countries that had already been coping with external fiscal constraints. In addition, countries that wanted to join the Eurozone had to cope with the Maastricht criteria regarding debt and fiscal deficits. As a consequence of unmet expectations and the fiscal challenges, many countries elaborated ways to reverse the policy measures undertaken in the 1990s.
In total, 18 countries, thirteen in Eastern Europe/Former Soviet Union and five in Latin America, reversed privatizations, that is, two-thirds of the countries that had privatized pensions reversed the process and started to switch back to public systems.
The first was Venezuela (2000), then Ecuador (2002) and Nicaragua (2005), where pension privatizations were repealed and/or considered unconstitutional. Some pension privatization reversals fully eliminated the previously established individual accounts: in Argentina (2008) the government closed the individual accounts and transferred the funds to the PAYG system; Hungary officially nationalized private pension assets and eliminated the second private pillar in 2011 (see box 7); in Bolivia (2009) a constitutional ban on social security privatization was passed, closing the individual accounts system for new entrants; in the Russian Federation (2012) contributions to individual accounts were diverted to social insurance; in Poland (2014) all individual accounts were transferred back to the social insurance PAYG system; and in Czech Republic (2016) the new government ended the Individual Accounts System.
In other countries the re-reforms adopted the strategy of downsizing individual accounts. In Bulgaria (2007) the contribution increase in the individual account pillar was cancelled; in Estonia (2009) the government suspended its contribution of 4 per cent to the second individual accounts pillar; in Latvia (2009) the contribution rate to individual accounts was reduced from 8 per cent to 2 per cent. In Lithuania (2009) the contribution rate to individual accounts was reduced from 5.5 per cent to 1.5 per cent; in Romania (2009) the government reduced and froze contribution rates to the second individual account pillar; in Macedonia (2011) the contribution rate to mandatory individual accounts was cut from 7.42 per cent to 5.25 per cent; in Croatia (2011) the contribution rate to the mandatory individual accounts was decreased from 10 per cent to 5 per cent; in Slovakia (2012) the contribution rate to the individual accounts was cut from 9 per cent to 4 per cent; and in Kazakhstan (2013) individual accounts were transferred to the Unified Pension Fund administrated by the Government as a defined contribution scheme.
Box 7 Reversing pension privatization in Hungary
The Hungarian pension system was historically based on a Bismarckian public pension model. In the early 1990s it consisted of a PAYG tier (pillar I), an anti-poverty tier (Pillar 0) and a voluntary private pension tier (pillar III). While an overarching parametric reform programme had been developed by the Hungarian Government in the early 1990s, pension privatization promoted by the International Monetary Fund (IMF) and the World Bank had come to dominate the agenda by the mid-1990s, so that Hungary adopted the Argentinian “mixed” model in 1997. The system reform was accompanied by parametric reforms, including a gradual increase in the retirement age to 62 years for both women and men until 2009.
Hungarian as well as international banks and insurance companies (including AXA, ING, AEGON, Allianz and Erste) entered the Hungarian private pension market in 1998. Initially, a 6 per cent employee contribution was directed to the private pillar II, while the state-run pension fund (pillar I) received 25 per cent employers’ contribution. The public pillar I remained dominant, and contribution rates to the private pension (pillar II) changed somewhat over time according to political cycles. Future pensioners were planned to receive 75 per cent of their benefits from the PAYG pillar and 25 per cent from their individual private accounts.

Social protection for older persons: Policy trends and statistics 2017-19 37
Around the mid-2000s it became clear that the positive impact that was expected to emerge as a result of the privatization was not materializing. No substantial positive effect on the Hungarian financial markets nor on employment rates and economic output was observed. At the same time, the costs of transition from the solely PAYG to the mixed system increased from 0.3 per cent of GDP in 1998 to 1.2 per cent by 2010, leading to additional borrowing from the IMF and an overall increase in debt. Real yields of private pension funds lagged behind even conservative expectations, due to high administrative costs that rose above 10 per cent.
Intertwined internal and external economic and political factors contributed to the reversal of pension privatization in Hungary, with the re-nationalization taking full effect in 2011. The driving factors behind the reversal were the sharp fall in GDP and revenues during the global economic crisis, and the fact that a new conservative Government (Fidesz, or Hungarian Civic Alliance) intended to use private pension assets to pay off the emergency loan provided by the IMF in 2008. The Government first redirected private pension contributions to the State for an interim period of 14 months, and later created unfavourable conditions that made private pension fund membership very unattractive. As a result, 97 per cent of members opted by 2011 to be solely enrolled in the public scheme. Accumulated assets were transferred to the newly created Fund for Pension Reform and the Decrease of the Deficit.
The Fidesz cabinet implemented its reform agenda in an extremely short time. Opposition parties, trade unions and private pension funds were not consulted. As part of the reform, the Government eliminated early retirement and separated disability benefits from the old-age pension scheme.
By 2012 Hungary had returned to its pre-1998 mandatory pension system. Despite the attempt to correct the defects of the privatization process, Hungary’s pension system still had major design flaws. Concerns regarding the sustainability and adequacy remain unaddressed and will require action in the years ahead.
Sources: Based on Mesa-Lago, 2014; Kay, 2014; Hirose, 2011.

38 Social protection for older persons: Policy trends and statistics 2017-19
10. Ensuring income security for older persons: The continuing challenge
Agenda 2030 calls for achieving substantial coverage of the poor and the vulnerable and for the construction of comprehensive and universal social protection systems.
Great progress is being made globally in terms of extending legal and effective coverage of older persons. The trend, however, shows strong variations, with major coverage deficits persisting in most of the developing world. Depending on the specific regional and country context, the major obstacles in extending coverage to older persons include: lack of political will, which is however imperative in supporting the development of a well-functioning pension system; lack of fiscal space for the financing of pension systems and to prioritize expenditure in social protection measures for old age in the long term; high levels of informality, in particular in low- and lower middle-income countries; and the challenge of building trust among contributors and beneficiaries.
A positive trend throughout the developing world is the proliferation of non-contributory pension systems. However, schemes are often too narrowly targeted, leaving many people unprotected. A challenge for these countries is to transform their systems into universal ones in order to guarantee a floor of income security for all older persons, leaving no-one behind.
Many developing countries (including those in demographic transition) have been able to extend their contributory pension systems. In the Latin American region, for example, developments in pensions during the last decade include both the extension of tax-funded social pension schemes and the expansion of pre-existing contributory schemes. The latter are linked to a set of formalization policies. The main challenge for these countries is to consolidate the labour market policies that have made possible the formalization and extension of social insurance coverage, while protecting the fiscal space already allocated to non-contributory and partially contributory schemes.
While in most parts of the developing world the focus is on extending coverage, discussions in high‑ and upper middle-income countries focus on pension adequacy issues and financial sustainability, and on how to maintain the systems. With ageing demographic structures and mature pension systems, the main challenge in most developed countries is maintaining a balance between adequacy and sustainability. Trends in recent years have been dominated by the introduction of cost-saving reforms with a fiscal objective, by raising the retirement age, reforming pension formulas and reducing the overall level of benefits, as well as by diversifying the sources of funding for old-age income security. Fiscal consolidation policies dominate the discussions around social protection systems, putting at risk the social pact and the principles on which social security systems were founded.
Pension privatization in the 1990s in Eastern and Central Europe and Latin America brought many promises, including higher benefit levels, extension of coverage and lower fiscal costs. Yet, as expectations were not met and the privatized schemes widely underperformed, often leading to reduced coverage and benefit adequacy, the reversal of the pension privatization in the 2000s reintroduced or strengthened the public schemes based on the concept of defined benefits, with elements of solidarity and redistribution.
It is worth highlighting that against the odds and in spite of all the challenges faced by pension systems around the world, great progress has been achieved in income security of the older person, in particular in terms of coverage extension.

Social protection for older persons: Policy trends and statistics 2017-19 39
In order to comply with the SDGs, countries must double their efforts to extend system coverage, including the construction of social protection floors that reach the most vulnerable older persons, at the same time as progress is made towards improving the adequacy of benefits.

40 Social protection for older persons: Policy trends and statistics 2017-19
Bibliography
Adascalitei, D.; Domonkos, S. 2015. “Reforming against all odds: Multi-pillar pension systems in the Czech Republic and Romania”, in International Social Security Review, Vol. 68, No. 2, pp. 85–104. DOI: 10.1111/issr.12066.
Altiparmakov, N. 2014. Disappointing performance of pension privatization in Eastern Europe, Working Paper. Available at: www.bancaditali.it.
Beattie, R.; McGillivray, W. 1995. “A risky strategy: reflections on the World Bank report Averting the old age crisis”, in International Social Security Review, Vol. 48, No. 3–4, pp. 5–23.
Behrendt, C.; Woodall, J. 2015. “Pensions and other social security income transfer systems”, in J. Berg (ed.): Labour markets, institutions and inequality: Building just societies in the 21st century (Geneva, ILO; Cheltenham, Edward Elgar), pp. 242–262.
Bertranou, F.M.; Calvo, E.; Bertranou, E. 2009. Is Latin America retreating from individual retirement accounts? (Cambridge, MA, Boston College Center for Retirement Research).
Borzutzky, M.; Hyde, S. 2016. “Chile’s private pension system at 35: Impact and lessons”, in Journal of International and Comparative Social Policy, Vol. 32, No. 1, pp. 57–73. DOI: http://dx.doi.org/10.1080/21699763.2016.1148623.
Cichon, M. 2004. Approaching a common denominator? An interim assessment of World Bank and ILO position on pensions (Geneva, ILO).
—; Scholz, W.; van Meerendonk, A.; Hagemejer, K.; Bertranou, F.; Plamondon, P. 2004. Financing Social Protection (Geneva, International Labour Office and International Social Security Association). Available at: https://www.social-protection.org/gimi/gess/RessourcePDF.action?id=8030.
Crabbe, C. (ed.). 2005. A quarter century of pension reform in Latin America and the Caribbean: Lessons learned and next steps (Washington, DC, Inter-American Development Bank).
Ebbinghaus, B. 2015. “The privatization and marketization of pensions in Europe: A double transformation facing the crisis”, in European Policy Analysis, Vol. 1, No. 1, pp. 56–73.
European Commission. 2015a. Adequacy and sustainability of pensions (Brussels).
—. 2015b. The 2015 Pension Adequacy Report: current and future income adequacy in old age in the EU (Brussels).
—. 2015c. The 2015 Ageing Report: Economic and budgetary projections for the 28 EU Member States (2013–2060) (Brussels).
Gillion, C.; Turner, J.A.; Bailey, C.; Latulippe, D. (eds). 2000. Social security pensions: Development and reform (Geneva, ILO).

Social protection for older persons: Policy trends and statistics 2017-19 41
Global Partnership for Universal Social Protection. 2016a. Universal old-age and disability pensions in Timor-Leste, Universal Social Protection Series (Washington, DC, World Bank; Geneva, ILO).
—. 2016b. Universal pensions in Bolivia, Universal Social Protection Series (Washington, DC, World Bank; Geneva, ILO).
—. 2016c. Universal old-age pensions in Botswana, Universal Social Protection Series (Washington, DC, World Bank; Geneva, ILO).
—. 2016d. Universal pensions in Lesotho, Universal Social Protection Series (Washington, DC, World Bank; Geneva, ILO).
—. 2016e. The Basic Social Grant for all older persons in Namibia, Universal Social Protection Series (Washington, DC, World Bank; Geneva, ILO).
—. 2016f. The Universal Pension Scheme in Zanzibar, Universal Social Protection Series (Washington, DC, World Bank; Geneva, ILO).
—. 2016g. Universal pensions in China, Universal Social Protection Series (Washington, DC, World Bank; Geneva, ILO).
—. 2016h. Universal pensions in Cabo Verde, Universal Social Protection Series (Washington, DC, World Bank; Geneva, ILO).
—. 2016i. Universal pensions in South Africa, Universal Social Protection Series (Washington, DC, World Bank; Geneva, ILO).
—. 2016j. Universal pensions in Thailand, Universal Social Protection Series (Washington, DC, World Bank; Geneva, ILO).
—. 2016k. Universal pensions in Trinidad and Tobago, Universal Social Protection Series (Washington, DC, World Bank; Geneva, ILO).
—. 2016l. Universal old-age pensions in Maldives, Universal Social Protection Series (Washington, DC, World Bank; Geneva, ILO).
Grishchenko N. 2015. Pensions after pension reforms: A comparative analysis of Belarus, Kazakhstan, and Russia, paper presented at the 1st International Conference on Applied Economics and Business (ICAEB), 27–28 October 2015, Tehran, Islamic Republic of Iran.
HelpAge International, 2015. Global AgeWatch Index 2015: Insight report (London, HelpAge International).
Hirose, K. (ed.) 2011. Pension reform in Central and Eastern Europe in times of crisis, austerity and beyond (Budapest, ILO Regional Office for Central and Eastern Europe).
Hujo, K.; Rulli, M. 2014. The political economy of pension re-reform in Chile and Argentina: Toward more inclusive protection, Research Paper No. 2014-1 (Geneva, UNRISD).
Iyer, S. 1999. Actuarial mathematics of social security pensions (Geneva, International Labour Office and International Social Security Association). Available at: https://www.social-protection.org/gimi/RessourcePDF.action?id=778.

42 Social protection for older persons: Policy trends and statistics 2017-19
ILO (International Labour Office). 2001. Social security: Issues, challenges and prospects, Report VI, International Labour Conference, 89th Session, Geneva, 2001 (Geneva).
—. 2010. Profile of social security system in Kosovo (within the meaning of UNSC Resolution 1244 [1999]) (Budapest, ILO DWT and Country Office for Central and Eastern Europe). National legislation.
—. 2011. Social security and the rule of law: General survey concerning social security instruments in the light of the 2008 Declaration on Social Justice for a Fair Globalization, Report III (Part 1B), International Labour Conference, 100th Session, Geneva, 2011 (Geneva).
—. 2012. Global Employment Trends for Women 2012 (Geneva).
—. 2014a. World Social Protection Report 2014/15: Building economic recovery, inclusive development and social justice (Geneva).
—. 2014b. Global Wage Report 2014/15: Wages and income inequality (Geneva).
—. 2016. Women at Work: Trends 2016 (Geneva).
—. 2017a. Building social protection systems: International standards and human rights instruments (Geneva). Available at: https://www.social-protection.org/gimi/gess/RessourcePDF.action?id=54434.
—. 2017b. World Social Protection Report 2017-19: Universal social protection to achieve the Sustainable Development Goals (Geneva). Available at: https://www.social-protection.org/gimi/RessourcePDF.action?ressource.ressourceId=54887.
—. 2018. The ILO Pension Model: A technical guide (Geneva). Available at: https://www.social-protection.org/gimi/RessourcePDF.action?id=55195.
ILO Pension Primer online. Available at: https://www.social-protection.org/gimi/ShowWiki.action?id=63.
Kay, S. 2014. Political risk and pension reform in Latin America and Central and Eastern Europe (Atlanta, Federal Reserve Bank).
Kleinjans, K.J. 2003. “The Colombian pension system after the reform of 1994: An evaluation”, in International Social Security Review, Vol. 56, 1/2003, pp. 31–52.
Mesa-Lago, C.; Hohnerlein, E. M. 2002. “Testing the assumptions concerning the effects of the German pension reform based on Latin American and Eastern European outcomes,” European Journal of Social Security, Vol. 4, No. 4, pp. 285–330. DOI: 10.1177/138826270200400402.
Mesa-Lago, C. 2004. “An appraisal of a quarter-century of structural pension reforms in Latin America”, in CEPAL Review, Vol. 84, pp. 57–81.
—. 2014. Reversing pension privatization: The experience of Argentina, Bolivia, Chile and Hungary, Extension of Social Security (ESS) Paper Series No. 44 (Geneva, ILO).
Obermann T.P. 2005. The effect of the privatization of pension plans on financial and regulatory systems in Latin America (Atlanta, GA, Federal Reserve Bank of Atlanta).
Orenstein, M. A. 2008. Privatizing pensions: the transnational campaign for social security reform (Princeton, NJ, Princeton University Press).

Social protection for older persons: Policy trends and statistics 2017-19 43
Razavi, S.; Arza, C.; Braunstein, E.; Cook, S.; Goulding, K. 2012. Gendered impacts of globalization: Employment and social protection, Gender and Development Paper No. 16 (Geneva, UNRISD).
UNICEF; Oxford Policy Management (OPM); Ministry of Employment, Social Affairs and Solidarity. 2012. Côte d’Ivoire. Cadre de Développement de la Stratégie Nationale de Protection Sociale en Côte d’Ivoire. Tome 1 État des lieux, Défis et Perspectives de Renforcement de la Protection Sociale (Abidjan, UNICEF). Available at: http://www.opml.co.uk/sites/default/files/Situational%20analysis%20of%20social%20protection%20%28in%20French%29.pdf [May 2017].
United Nations, Department of Economic and Social Affairs, Population Division. 2015. World Population Prospects: The 2015 Revision (New York). Available at: https://esa.un.org/unpd/wpp/ [June 2017].
UNFPA (United Nations Population Fund); HelpAge International. 2012. Ageing in the twenty-first century: A celebration and a challenge (New York and London).
UNRISD (United Nations Research Institute for Social Development). 2010. Combating poverty and inequality: Structural change, social policy and politics (Geneva).
Whitehouse, E. 2012. Adequacy (1) Pension entitlements, replacement rates and pension wealth, World Bank Pension Indicators and Database: Briefing 3 (Washington, DC, World Bank).
World Bank. 1994. Averting the old age crisis: Policies to protect the old and promote growth, World Bank Policy Research Report No. 13584 (Washington, DC).
International statistics and data sources
ADB (Asian Development Bank). 2017. Social Protection Index. Available at: http://spi.adb.org/spidmz/index.jsp [1 June 2017].
Barrientos, A; Nino-Zarazúa, M.; Maitrot, M. 2010. Social Assistance in Developing Countries Database (version 5.0) (Manchester and London, Brooks World Poverty Institute and Overseas Development Institute). Available at:
https://assets.publishing.service.gov.uk/media/57a08af9ed915d3cfd000a5a/social-assistance-database-version-5.pdf [1 June 2017].
CISSTAT (Interstate Statistical Committee of the Commonwealth of Independent States). 2017. WEB Database Statistics of the CIS. Available at:
http://www.cisstat.com/0base/index-en.htm [1 June 2017].
ECLAC (Economic Commission for Latin America and the Caribbean). Statistics and Indicators: Social Public Expenditure. Available at:
http://estadisticas.cepal.org/cepalstat/WEB_CEPALSTAT/Portada.asp?idioma=i [1 June 2017].
Eurostat. 2014. Living Conditions and Welfare: Social Protection Database (ESSPROS) (Luxembourg). Available at:
http://appsso.eurostat.ec.europa.eu/nui/show.do?dataset=spr_exp_gdp&lang=en [8 June 2017].
—. 2017. Pensions Beneficiaries Data. Available at: http://appsso.eurostat.ec.europa.eu/nui/show.do?dataset=spr_pns_ben&lang=en
[1 June 2017].

44 Social protection for older persons: Policy trends and statistics 2017-19
ILO (International Labour Office). 2010–17. Social Protection Monitor. Available at: http://www.social-protection.org/gimi/gess/ShowWiki.action?id=3205 [1 June 2017].
—. ILOSTAT. 2017. Available at: http://www.ilo.org/global/statistics-and-databases/lang--en/index.htm [1 June 2017].
—. 2017. NORMLEX: Information System on International Labour Standards. Available at: http://www.ilo.org/dyn/normlex/en/.[1 June 2017].
—. 2017. World Social Protection Database based on the Social Security Inquiry (SSI). http://www.social-protection.org/gimi/gess/ShowTheme.action?id=4457 [1 June 2017].
ISSA (International Social Security Association); SSA (US Social Security Administration). Various dates. Social Security Programs Throughout the World. Available at:
http://www.ssa.gov/policy/docs/progdesc/ssptw/ and https://www.issa.int/en_GB/country-profiles [20 June 2017].
IMF (International Monetary Fund). 2017. World Economic Outlook Database. Available at: http://www.imf.org/external/pubs/ft/weo/2013/02/weodata/index.aspx [1 June 2017].
MISSCEO (Mutual Information System on Social Protection of the Council of Europe). 2017. Comparative Tables. Available at: http://www.missceo.coe.int/ [1 June 2017].
MISSOC (Mutual Information System on Social Protection/Social Security). 2017. Available at: http://www.missoc.org/ [1 June 2017].
OECD (Organisation for Economic Co-operation and Development). 2017. SOCR: Social Protection Recipients Database. Available at:
http://www.oecd.org/social/recipients.htm [26 May 2017].
—. Social Expenditure Database (SOCX): Social and Welfare Statistics. Available at: https://stats.oecd.org/Index.aspx?DataSetCode=SOCX_AGG [8 June 2017].
World Bank. 2017. World Development Indicators. Available at: http://data.worldbank.org/data-catalog/world-development-indicators [18 June 2017].
—. 2017. Pensions data. Available at: http://web.worldbank.org/WBSITE/EXTERNAL/TOPICS/EXTSOCIALPROTECT
ION/EXTPENSIONS/0,,contentMDK:23231994~menuPK:8874064~pagePK:148956~piPK:216618~theSitePK:396253,00.html [1 June 2017].

Social protection for older persons: Policy trends and statistics 2017-19 45
Annex I. Minimum requirements in ILO social security standards: Overview tables
ILO social security standards have come to be recognized globally as key references for the design of rights-based, sound and sustainable social protection schemes and systems. They also give meaning and definition to the content of the right to social security as laid down in international human rights instruments (notably the Universal Declaration of Human Rights, 1948, and the International Covenant on Economic, Social and Cultural Rights, 1966), thereby constituting essential tools for the realization of this right and the effective implementation of a rights-based approach to social protection.
Guiding ILO policy and technical advice in the field of social protection, ILO social security standards are primarily tools for governments which, in consultation with employers and workers, are seeking to draft and implement social security law, establish administrative and financial governance frameworks, and develop social protection policies. More specifically, these standards serve as key references for:
– the elaboration of national social security extension strategies;
– the development and maintenance of comprehensive national social security systems;
– the design and parametric adjustments of social security schemes;
– the establishment and implementation of effective recourse, enforcement and compliance mechanisms;
– the good governance of social security and improvement of administrative and financial structures;
– the realization of international and regional obligations, and the operationalization of national social protection strategies and action plans; and
– working towards the achievement of Sustainable Development Goals, particularly Goals 1, 3, 5, 8, 10 and 16.
The ILO’s normative social security framework consists of eight up-to-date Conventions and nine Recommendations. The most prominent of these are the Social Security (Minimum Standards) Convention, 1952 (No. 102), and the Social Protection Floors Recommendation, 2012 (No. 202). Other Conventions and Recommendations set higher standards in respect of the different social security branches, or spell out the social security rights of migrant workers.
ILO standards establish qualitative and quantitative benchmarks which together determine the minimum standards of social security protection to be provided by social security schemes when life risks or circumstances occur, with regard to:
– definition of the contingency (what risk or life circumstance must be covered?)
– persons protected (who must be covered?)
– type and level of benefits (what should be provided?)
– entitlement conditions, including qualifying period (what should a person do to get the right to a benefit?)
– duration of benefit and waiting period (how long must the benefit be paid/provided for?)
In addition, they set out common rules of collective organization, financing and management of social security, as well as principles for the good governance of national systems. These include:
– the general responsibility of the State for the due provision of benefits and proper administration of social security systems;
– solidarity, collective financing and risk-pooling;
– participatory management of social security schemes;
– guarantee of defined benefits;
– adjustment of pensions in payment to maintain the purchasing power of beneficiaries; and
– the right to complain and appeal.
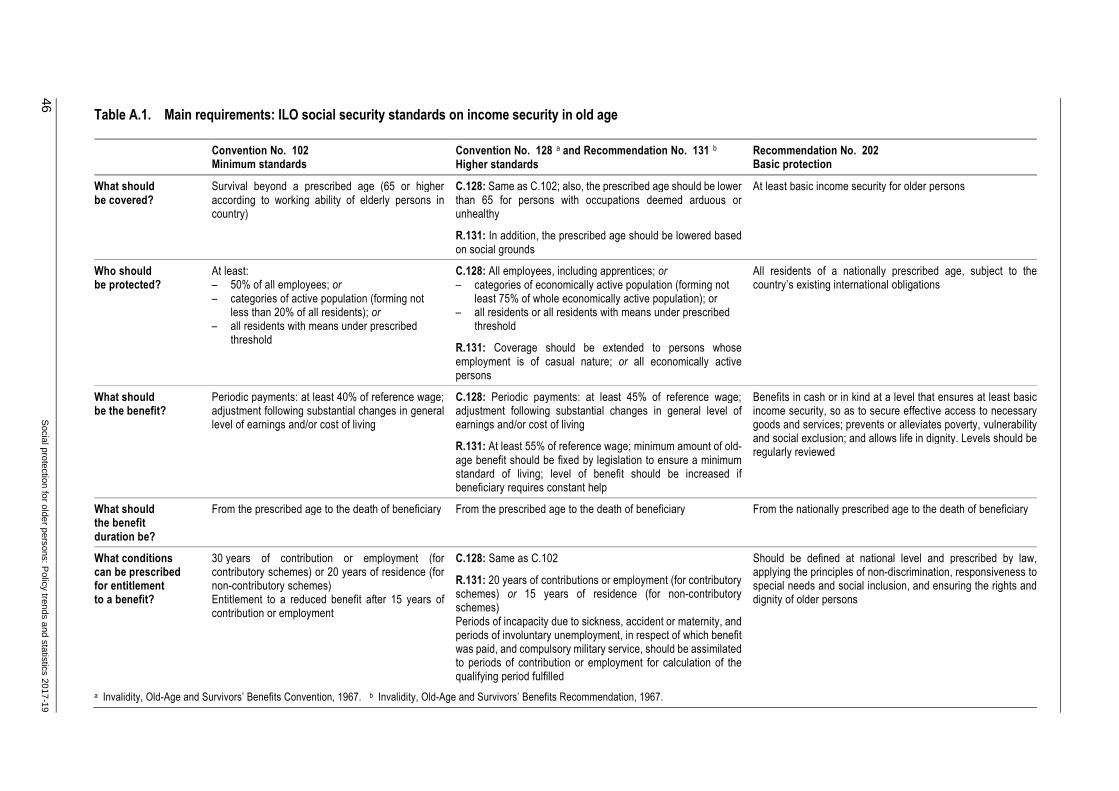
46 S
ocial protection for older persons: Policy trends and statistics 2017-19
Table A.1. Main requirements: ILO social security standards on income security in old age
Convention No. 102 Minimum standards
Convention No. 128 a and Recommendation No. 131 b Higher standards
Recommendation No. 202 Basic protection
What should be covered?
Survival beyond a prescribed age (65 or higher according to working ability of elderly persons in country)
C.128: Same as C.102; also, the prescribed age should be lower than 65 for persons with occupations deemed arduous or unhealthy
R.131: In addition, the prescribed age should be lowered based on social grounds
At least basic income security for older persons
Who should be protected?
At least: – 50% of all employees; or – categories of active population (forming not
less than 20% of all residents); or – all residents with means under prescribed
threshold
C.128: All employees, including apprentices; or – categories of economically active population (forming not
least 75% of whole economically active population); or – all residents or all residents with means under prescribed
threshold
R.131: Coverage should be extended to persons whose employment is of casual nature; or all economically active persons
All residents of a nationally prescribed age, subject to the country’s existing international obligations
What should be the benefit?
Periodic payments: at least 40% of reference wage; adjustment following substantial changes in general level of earnings and/or cost of living
C.128: Periodic payments: at least 45% of reference wage; adjustment following substantial changes in general level of earnings and/or cost of living
R.131: At least 55% of reference wage; minimum amount of old-age benefit should be fixed by legislation to ensure a minimum standard of living; level of benefit should be increased if beneficiary requires constant help
Benefits in cash or in kind at a level that ensures at least basic income security, so as to secure effective access to necessary goods and services; prevents or alleviates poverty, vulnerability and social exclusion; and allows life in dignity. Levels should be regularly reviewed
What should the benefit duration be?
From the prescribed age to the death of beneficiary From the prescribed age to the death of beneficiary From the nationally prescribed age to the death of beneficiary
What conditions can be prescribed for entitlement to a benefit?
30 years of contribution or employment (for contributory schemes) or 20 years of residence (for non-contributory schemes) Entitlement to a reduced benefit after 15 years of contribution or employment
C.128: Same as C.102
R.131: 20 years of contributions or employment (for contributory schemes) or 15 years of residence (for non-contributory schemes) Periods of incapacity due to sickness, accident or maternity, and periods of involuntary unemployment, in respect of which benefit was paid, and compulsory military service, should be assimilated to periods of contribution or employment for calculation of the qualifying period fulfilled
Should be defined at national level and prescribed by law, applying the principles of non-discrimination, responsiveness to special needs and social inclusion, and ensuring the rights and dignity of older persons
a Invalidity, Old-Age and Survivors’ Benefits Convention, 1967. b Invalidity, Old-Age and Survivors’ Benefits Recommendation, 1967.

Social protection for older persons: P
olicy trends and statistics 2017-19 47
Table A.2. Main requirements: ILO social security standards on survivors’ benefits
ILO Convention No. 102 Minimum standards
ILO Convention No. 128 and Recommendation No. 131 Higher standards
ILO Recommendation No. 202 Basic protection
What should be covered?
Widow’s or children’s loss of support in the event of death of the breadwinner
C.128: Widow’s or children’s loss of support in case of death of breadwinner
R.131: Same as C.128
At least basic income security for those who are unable to earn a sufficient income due to the absence of family support
Who should be protected?
Wives and children of breadwinners representing at least 50% of all employees; or wives and children of members of economically active persons representing at least 20% of all residents; or all resident widows and children with means under prescribed threshold
C.128: Wives, children and other dependants of employees or apprentices; or wives, children and other dependants forming not less than 75% of active persons; or all widows, children and other dependants who are residents or who are residents and whose means are under prescribed threshold
R.131: In addition, coverage should progressively be extended to wives and children and other dependants of persons in casual employment or all economically active persons. Also, an invalid and dependent widower should enjoy same entitlements as a widow
At least all residents and children, subject to the country’s existing international obligations
What should the benefit be?
Periodic payment: at least 40% of reference wage Adjustment following substantial changes in general level of earnings and/or cost of living
C.128: Periodic payment: at least 45% of reference wage. Rates must be adjusted to cost of living
R.131: Benefits should be increased to at least 55% of reference wage; a minimum survivors’ benefit should be fixed to ensure a minimum standard of living
Benefits in cash or in kind should ensure at least basic income security so as to secure effective access to necessary goods and services at a level that prevents or alleviates poverty, vulnerability and social exclusion and allows life in dignity. Levels should be regularly reviewed
What should the benefit duration be?
Until children reach active age; no limitation for widows
C.128 and R.131: Until children reach active age or longer if disabled; no limitation for widows
As long as the incapacity to earn a sufficient income remains
What conditions can be prescribed for entitlement to a benefit?
15 years of contributions or employment (for contributory or employment based schemes) or 10 years of residence (for non-contributory schemes); entitlement to a reduced benefit after five years of contributions For widows, benefits may be conditional on being -incapable of self-support; for children, until 15 years of age or school-leaving age
C.128: same as C.102; In addition, possible to require a prescribed age for widow, not higher than that prescribed for oldage benefit. No requirement of age for an invalid widow or a widow caring for a dependent child of deceased.
R.131: same as C.128: Periods of incapacity due to sickness, accident or maternity and periods of involuntary unemployment, in respect of which benefit was paid and compulsory military service, should be assimilated to periods of contribution or employment for calculation of the qualifying period fulfilled
Should be defined at national level and prescribed by law, applying the principles of non-discrimination, responsiveness to special needs and social inclusion, and ensuring the rights and dignity of people
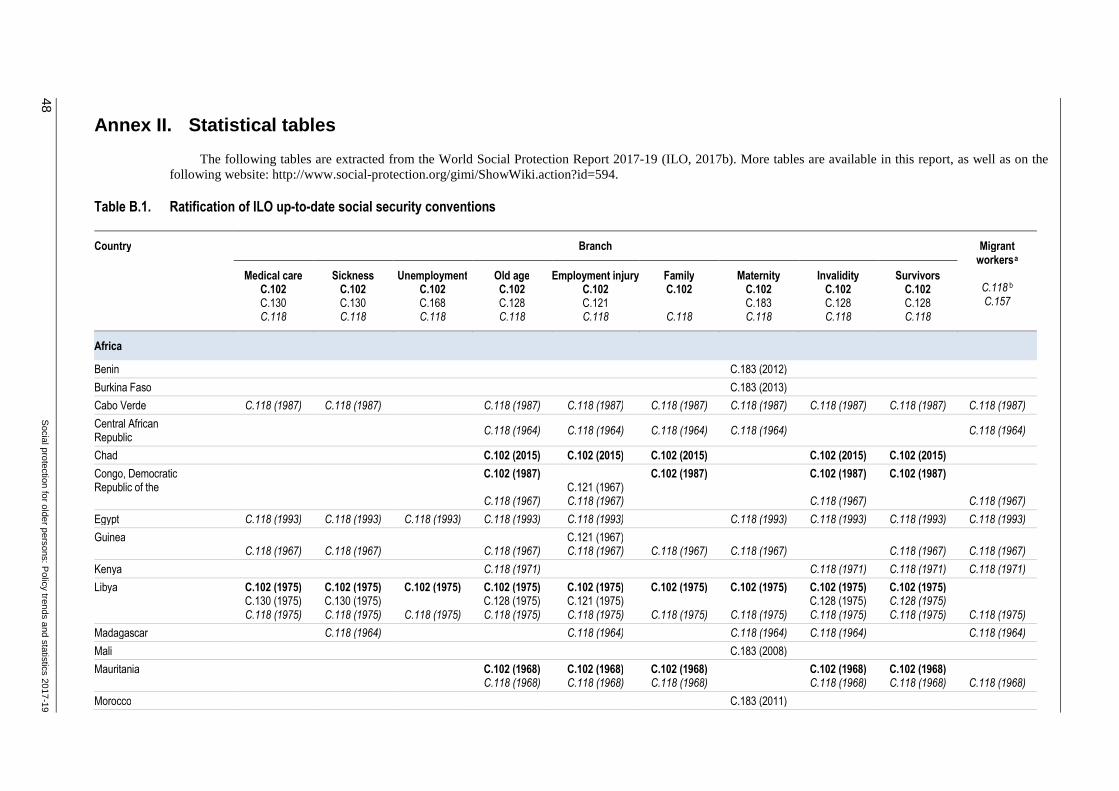
48 S
ocial protection for older persons: Policy trends and statistics 2017-19
Annex II. Statistical tables
The following tables are extracted from the World Social Protection Report 2017-19 (ILO, 2017b). More tables are available in this report, as well as on the following website: http://www.social-protection.org/gimi/ShowWiki.action?id=594.
Table B.1. Ratification of ILO up-to-date social security conventions
Country Branch Migrant workers a
C.118 b C.157
Medical care C.102 C.130 C.118
Sickness C.102 C.130 C.118
Unemployment C.102 C.168 C.118
Old age C.102 C.128 C.118
Employment injury C.102 C.121 C.118
Family C.102
C.118
Maternity C.102 C.183 C.118
Invalidity C.102 C.128 C.118
Survivors C.102 C.128 C.118
Africa
Benin C.183 (2012)
Burkina Faso C.183 (2013)
Cabo Verde C.118 (1987) C.118 (1987) C.118 (1987) C.118 (1987) C.118 (1987) C.118 (1987) C.118 (1987) C.118 (1987) C.118 (1987)
Central African Republic
C.118 (1964) C.118 (1964) C.118 (1964) C.118 (1964) C.118 (1964)
Chad C.102 (2015) C.102 (2015) C.102 (2015) C.102 (2015) C.102 (2015)
Congo, Democratic Republic of the
C.102 (1987)
C.118 (1967)
C.121 (1967) C.118 (1967)
C.102 (1987) C.102 (1987)
C.118 (1967)
C.102 (1987)
C.118 (1967)
Egypt C.118 (1993) C.118 (1993) C.118 (1993) C.118 (1993) C.118 (1993) C.118 (1993) C.118 (1993) C.118 (1993) C.118 (1993)
Guinea C.118 (1967)
C.118 (1967)
C.118 (1967)
C.121 (1967) C.118 (1967)
C.118 (1967)
C.118 (1967)
C.118 (1967)
C.118 (1967)
Kenya C.118 (1971) C.118 (1971) C.118 (1971) C.118 (1971)
Libya C.102 (1975) C.130 (1975) C.118 (1975)
C.102 (1975) C.130 (1975) C.118 (1975)
C.102 (1975)
C.118 (1975)
C.102 (1975) C.128 (1975) C.118 (1975)
C.102 (1975) C.121 (1975) C.118 (1975)
C.102 (1975)
C.118 (1975)
C.102 (1975)
C.118 (1975)
C.102 (1975) C.128 (1975) C.118 (1975)
C.102 (1975) C.128 (1975) C.118 (1975)
C.118 (1975)
Madagascar C.118 (1964) C.118 (1964) C.118 (1964) C.118 (1964) C.118 (1964)
Mali C.183 (2008)
Mauritania C.102 (1968) C.118 (1968)
C.102 (1968) C.118 (1968)
C.102 (1968) C.118 (1968)
C.102 (1968) C.118 (1968)
C.102 (1968) C.118 (1968)
C.118 (1968)
Morocco C.183 (2011)
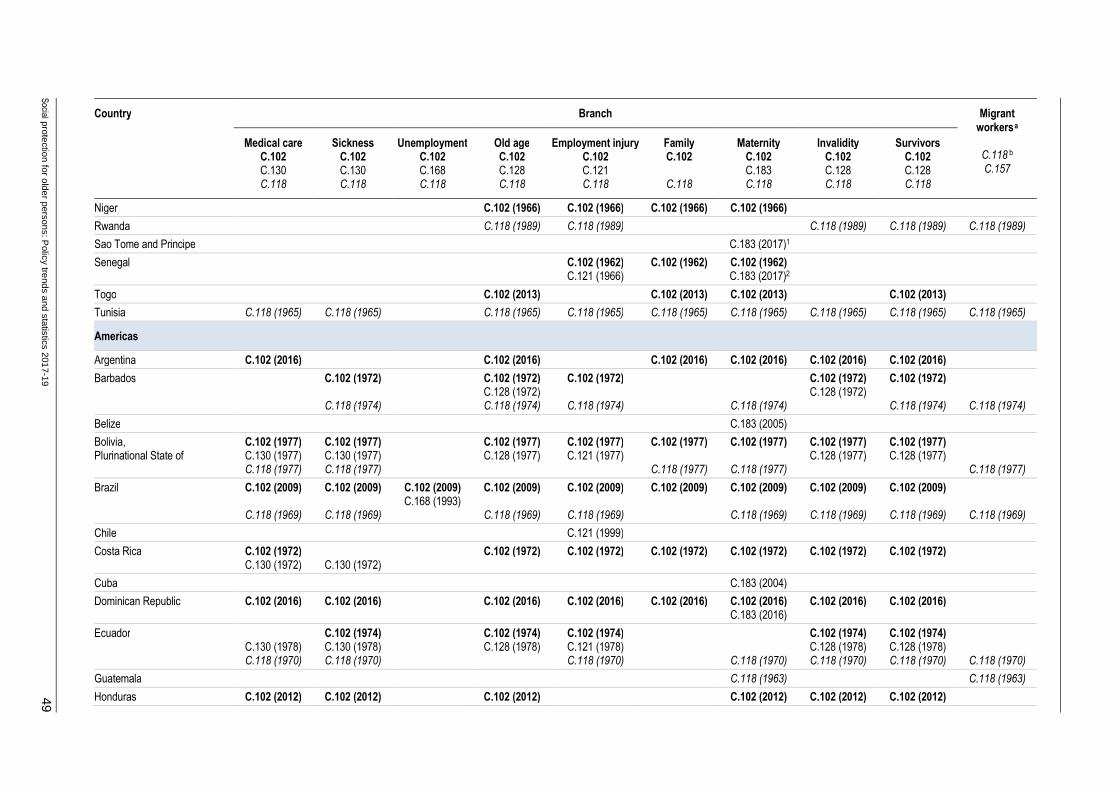
Social protection for older persons: P
olicy trends and statistics 2017-19 49
Country Branch Migrant workers a
C.118 b C.157
Medical care C.102 C.130 C.118
Sickness C.102 C.130 C.118
Unemployment C.102 C.168 C.118
Old age C.102 C.128 C.118
Employment injury C.102 C.121 C.118
Family C.102
C.118
Maternity C.102 C.183 C.118
Invalidity C.102 C.128 C.118
Survivors C.102 C.128 C.118
Niger C.102 (1966) C.102 (1966) C.102 (1966) C.102 (1966)
Rwanda C.118 (1989) C.118 (1989) C.118 (1989) C.118 (1989) C.118 (1989)
Sao Tome and Principe C.183 (2017)1
Senegal C.102 (1962) C.121 (1966)
C.102 (1962) C.102 (1962) C.183 (2017)2
Togo C.102 (2013) C.102 (2013) C.102 (2013) C.102 (2013)
Tunisia C.118 (1965) C.118 (1965) C.118 (1965) C.118 (1965) C.118 (1965) C.118 (1965) C.118 (1965) C.118 (1965) C.118 (1965)
Americas
Argentina C.102 (2016) C.102 (2016) C.102 (2016) C.102 (2016) C.102 (2016) C.102 (2016)
Barbados C.102 (1972)
C.118 (1974)
C.102 (1972) C.128 (1972) C.118 (1974)
C.102 (1972)
C.118 (1974)
C.118 (1974)
C.102 (1972) C.128 (1972)
C.102 (1972)
C.118 (1974)
C.118 (1974)
Belize C.183 (2005)
Bolivia, Plurinational State of
C.102 (1977) C.130 (1977) C.118 (1977)
C.102 (1977) C.130 (1977) C.118 (1977)
C.102 (1977) C.128 (1977)
C.102 (1977) C.121 (1977)
C.102 (1977)
C.118 (1977)
C.102 (1977)
C.118 (1977)
C.102 (1977) C.128 (1977)
C.102 (1977) C.128 (1977)
C.118 (1977)
Brazil C.102 (2009)
C.118 (1969)
C.102 (2009)
C.118 (1969)
C.102 (2009) C.168 (1993)
C.102 (2009)
C.118 (1969)
C.102 (2009)
C.118 (1969)
C.102 (2009) C.102 (2009)
C.118 (1969)
C.102 (2009)
C.118 (1969)
C.102 (2009)
C.118 (1969)
C.118 (1969)
Chile C.121 (1999)
Costa Rica C.102 (1972) C.130 (1972)
C.130 (1972)
C.102 (1972) C.102 (1972) C.102 (1972) C.102 (1972) C.102 (1972) C.102 (1972)
Cuba C.183 (2004)
Dominican Republic C.102 (2016) C.102 (2016) C.102 (2016) C.102 (2016) C.102 (2016) C.102 (2016) C.183 (2016)
C.102 (2016) C.102 (2016)
Ecuador C.130 (1978) C.118 (1970)
C.102 (1974) C.130 (1978) C.118 (1970)
C.102 (1974) C.128 (1978)
C.102 (1974) C.121 (1978) C.118 (1970)
C.118 (1970)
C.102 (1974) C.128 (1978) C.118 (1970)
C.102 (1974) C.128 (1978) C.118 (1970)
C.118 (1970)
Guatemala C.118 (1963) C.118 (1963)
Honduras C.102 (2012) C.102 (2012) C.102 (2012) C.102 (2012) C.102 (2012) C.102 (2012)
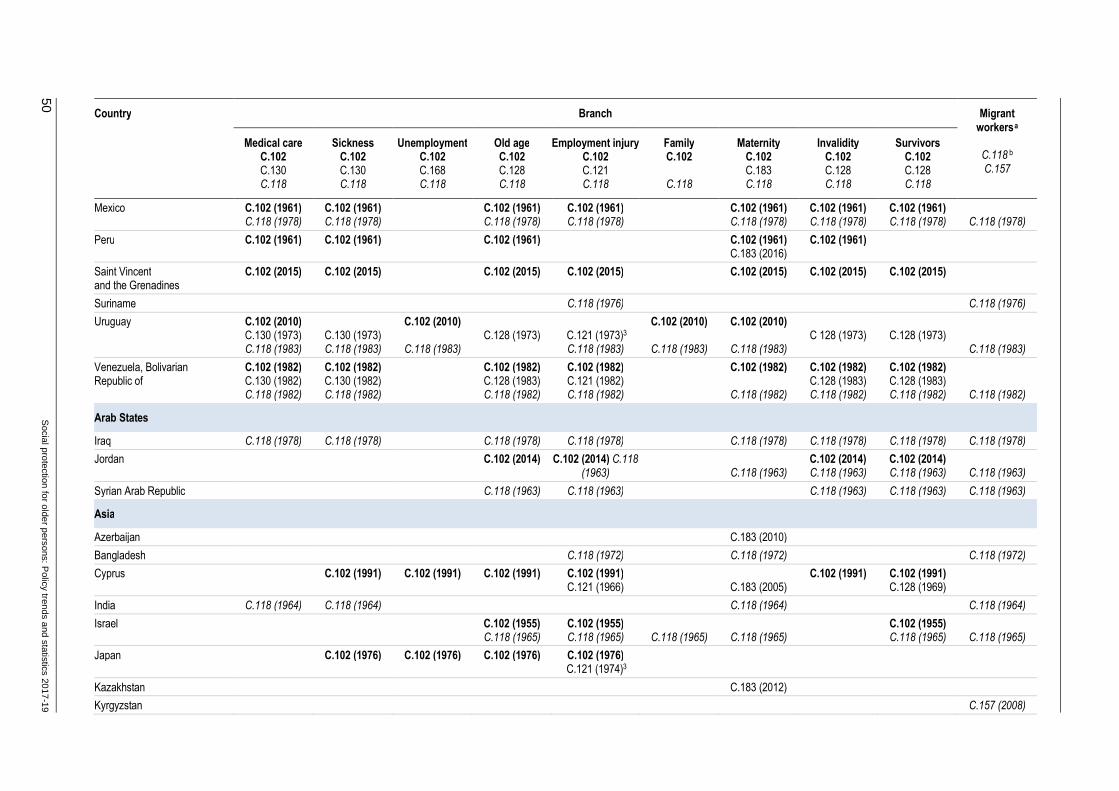
50 S
ocial protection for older persons: Policy trends and statistics 2017-19
Country Branch Migrant workers a
C.118 b C.157
Medical care C.102 C.130 C.118
Sickness C.102 C.130 C.118
Unemployment C.102 C.168 C.118
Old age C.102 C.128 C.118
Employment injury C.102 C.121 C.118
Family C.102
C.118
Maternity C.102 C.183 C.118
Invalidity C.102 C.128 C.118
Survivors C.102 C.128 C.118
Mexico C.102 (1961) C.118 (1978)
C.102 (1961) C.118 (1978)
C.102 (1961) C.118 (1978)
C.102 (1961) C.118 (1978)
C.102 (1961) C.118 (1978)
C.102 (1961) C.118 (1978)
C.102 (1961) C.118 (1978)
C.118 (1978)
Peru C.102 (1961) C.102 (1961) C.102 (1961) C.102 (1961) C.183 (2016)
C.102 (1961)
Saint Vincent and the Grenadines
C.102 (2015) C.102 (2015) C.102 (2015) C.102 (2015) C.102 (2015) C.102 (2015) C.102 (2015)
Suriname C.118 (1976) C.118 (1976)
Uruguay C.102 (2010) C.130 (1973) C.118 (1983)
C.130 (1973) C.118 (1983)
C.102 (2010)
C.118 (1983)
C.128 (1973)
C.121 (1973)3 C.118 (1983)
C.102 (2010)
C.118 (1983)
C.102 (2010)
C.118 (1983)
C 128 (1973)
C.128 (1973)
C.118 (1983)
Venezuela, Bolivarian Republic of
C.102 (1982) C.130 (1982) C.118 (1982)
C.102 (1982) C.130 (1982) C.118 (1982)
C.102 (1982) C.128 (1983) C.118 (1982)
C.102 (1982) C.121 (1982) C.118 (1982)
C.102 (1982)
C.118 (1982)
C.102 (1982) C.128 (1983) C.118 (1982)
C.102 (1982) C.128 (1983) C.118 (1982)
C.118 (1982)
Arab States
Iraq C.118 (1978) C.118 (1978) C.118 (1978) C.118 (1978) C.118 (1978) C.118 (1978) C.118 (1978) C.118 (1978)
Jordan
C.102 (2014)
C.102 (2014) C.118 (1963)
C.118 (1963)
C.102 (2014) C.118 (1963)
C.102 (2014) C.118 (1963)
C.118 (1963)
Syrian Arab Republic C.118 (1963) C.118 (1963) C.118 (1963) C.118 (1963) C.118 (1963)
Asia
Azerbaijan C.183 (2010)
Bangladesh C.118 (1972) C.118 (1972) C.118 (1972)
Cyprus C.102 (1991) C.102 (1991) C.102 (1991) C.102 (1991) C.121 (1966)
C.183 (2005)
C.102 (1991) C.102 (1991) C.128 (1969)
India C.118 (1964) C.118 (1964) C.118 (1964) C.118 (1964)
Israel
C.102 (1955) C.118 (1965)
C.102 (1955) C.118 (1965)
C.118 (1965)
C.118 (1965)
C.102 (1955) C.118 (1965)
C.118 (1965)
Japan C.102 (1976) C.102 (1976) C.102 (1976) C.102 (1976) C.121 (1974)3
Kazakhstan C.183 (2012)
Kyrgyzstan C.157 (2008)

Social protection for older persons: P
olicy trends and statistics 2017-19 51
Country Branch Migrant workers a
C.118 b C.157
Medical care C.102 C.130 C.118
Sickness C.102 C.130 C.118
Unemployment C.102 C.168 C.118
Old age C.102 C.128 C.118
Employment injury C.102 C.121 C.118
Family C.102
C.118
Maternity C.102 C.183 C.118
Invalidity C.102 C.128 C.118
Survivors C.102 C.128 C.118
Pakistan C.118 (1969) C.118 (1969) C.118 (1969)
Philippines C.118 (1994) C.118 (1994) C.118 (1994) C.118 (1994) C.118 (1994) C.118 (1994) C.118 (1994) C.118 (1994) C.157 (1994)
Turkey C.102 (1975) C.118 (1974)
C.102 (1975) C.118 (1974)
C.102 (1975) C.118 (1974)
C.102 (1975) C.118 (1974)
C.102 (1975) C.118 (1974)
C.102 (1975) C.118 (1974)
C.102 (1975) C.118 (1974)
C.118 (1974)
Europe
Albania C.102 (2006) C.102 (2006) C.102 (2006) C.168 (2006)
C.102 (2006) C.102 (2006) C.102 (2006) C.183 (2004)
C.102 (2006) C.102 (2006)
Austria C.102 (1969) C.102 (1978) C.102 (1969) C.128 (1969)
C.102 (1969) C.102 (1969) C.183 (2004)
Belarus C.183 (2004)
Belgium C.102 (1959) C.130 (2017)4
C.102 (1959) C.130 (2017)4
C.102 (1959) C.168 (2011)
C.102 (1959) C.128 (2017)4
C.102 (1959) C.121 (1970)
C.102 (1959) C.102 (1959) C.102 (1959) C.128 (2017) 4
C.102 (1959) C.128 (2017)4
Bosnia and Herzegovina C.102 (1993) C.102 (1993) C.102 (1993) C.102 (1993) C.102 (1993) C.121 (1993)
C.102 (1993) C.183 (2010)
C.102 (1993)
Bulgaria C.102 (2008) C.102 (2008) C.102 (2016) 5 C.102 (2008) C.102 (2008) C.102 (2008) C.102 (2008) C.183 (2001)
C.102 (2008)
Croatia C.102 (1991) C.102 (1991) C.102 (1991) C.102 (1991) C.102 (1991) C.121 (1991)
C.102 (1991) C.102 (1991)
Czech Republic C.102 (1993) C.130 (1993)
C.102 (1993) C.130 (1993)
C.102 (1993) C.128 (1993)
C.102 (1993) C.102 (1993) C.102 (1993) C.102 (1993)
Denmark C.102 (1955) C.130 (1978) C.118 (1969)
C.130 (1978) C.118 (1969)
C.102 (1955)
C.118 (1969)
C.102 (1955) C.102 (1955)
C.118 (1969)
C.102 (1955)
C.118 (1969)
Finland C.130 (1974) C.118 (1969)
C.130 (1974) C.118 (1969)
C.168 (1990) C.128 (1976) C.121 (1968)3 C.118 (1969)
C.128 (1976) C.128 (1976) C.118 (1969)
France C.102 (1974) C.118 (1974)
C.118 (1974)
C.102 (1974) C.102 (1974)
C.102 (1974) C.118 (1974)
C.102 (1974) C.118 (1974)
C.102 (1974) C.118 (1974)
C.102 (1974) C.118 (1974)
C.118 (1974)
C.118 (1974)
Germany C.102 (1958) C.130 (1974) C.118 (1971)
C.102 (1958) C.130 (1974) C.118 (1971)
C.102 (1958)
C.118 (1971)
C.102 (1958) C.128 (1971)
C.102 (1958) C.121 (1972) C.118 (1971)
C.102 (1958) C.102 (1958)
C.118 (1971)
C.102 (1958) C.128 (1971)
C.102 (1958) C.128 (1971)
C.118 (1971)

52 S
ocial protection for older persons: Policy trends and statistics 2017-19
Country Branch Migrant workers a
C.118 b C.157
Medical care C.102 C.130 C.118
Sickness C.102 C.130 C.118
Unemployment C.102 C.168 C.118
Old age C.102 C.128 C.118
Employment injury C.102 C.121 C.118
Family C.102
C.118
Maternity C.102 C.183 C.118
Invalidity C.102 C.128 C.118
Survivors C.102 C.128 C.118
Greece C.102 (1955) C.102 (1955) C.102 (1955) C.102 (1955) C.102 (1955) C.102 (1955) C.102 (1955) C.102 (1955)
Hungary C.183 (2003)
Iceland C.102 (1961) C.102 (1961) C.102 (1961)
Ireland
C.118 (1964)
C.102 (1968)
C.118 (1964)
C.102 (1968)
C.118 (1964)
C.121 (1969) C.118 (1964)
C.118 (1964)
C.102 (1968)
C.118 (1964)
Italy
C.118 (1967)
C.118 (1967)
C.118 (1967)
C.102 (1956)
C.118 (1967)
C.118 (1967)
C.102 (1956)
C.118 (1967)
C.102 (1956) C.183 (2001) C.118 (1967)
C.118 (1967)
C.118 (1967)
C.118 (1967)
Latvia C.183 (2009)
Lithuania C.183 (2003)
Luxembourg C.102 (1964) C.130 (1980)
C.102 (1964) C.130 (1980)
C.102 (1964) C.102 (1964) C.102 (1964) C.121 (1972)
C.102 (1964) C.102 (1964) C.183 (2008)
C.102 (1964) C.102 (1964)
Macedonia, the former --Yugoslav Republic of
C.102 (1991) C.102 (1991) C.102 (1991) C.102 (1991) C.102 (1991) C.121 (1991)
C.102 (1991) C.183 (2012)
C.102 (1991)
Moldova, Republic of C.183 (2006)
Montenegro C.102 (2006) C.102 (2006) C.102 (2006) C.102 (2006) C.102 (2006) C.121 (2006)
C.102 (2006) C.183 (2012)
C.102 (2006)
Netherlands C.102 (1962) C.130 (2006)
C.102 (1962) C.130 (2006)
C.102 (1962) C.102 (1962) C.128 (1969)
C.102 (1962) C.121 (1966) 3
C.102 (1962) C.102 (1962) C.183 (2009)
C.102 (1962) C.128 (1969)
C.102 (1962) C.128 (1969)
Norway C.102 (1954) C.130 (1972)
C.102 (1954) C.130 (1972)
C.102 (1954) C.168 (1990)
C.102 (1954) C.128 (1968)
C.102 (1954) C.102 (1954)
C.118 (1963)
C.183 (2015)
C.128 (1968)
C.128 (1968) C.118 (1963)
C.118 (1963)
Poland C.102 (2003) C.102 (2003) C.102 (2003) C.102 (2003) C.102 (2003)
Portugal C.102 (1994) C.102 (1994) C.102 (1994) C.102 (1994) C.102 (1994) C.102 (1994) C.102 (1994) C.183 (2012)
C.102 (1994) C.102 (1994)
Romania C.102 (2009) C.102 (2009) C.168 (1992)
C.102 (2009) C.102 (2009) C.102 (2009) C.183 (2002)
Serbia C.102 (2000) C.102 (2000) C.102 (2000) C.102 (2000) C.102 (2000) C.121 (2000)
C.102 (2000) C.183 (2010)
C.102 (2000)
Slovakia C.102 (1993) C.130 (1993)
C.102 (1993) C.130 (1993)
C.102 (1993) C.128 (1993)
C.102 (1993) C.102 (1993) C.183 (2000)
C.102 (1993) C.102 (1993)

Social protection for older persons: P
olicy trends and statistics 2017-19 53
Country Branch Migrant workers a
C.118 b C.157
Medical care C.102 C.130 C.118
Sickness C.102 C.130 C.118
Unemployment C.102 C.168 C.118
Old age C.102 C.128 C.118
Employment injury C.102 C.121 C.118
Family C.102
C.118
Maternity C.102 C.183 C.118
Invalidity C.102 C.128 C.118
Survivors C.102 C.128 C.118
Slovenia C.102 (1992) C.102 (1992) C.102 (1992) C.102 (1992) C.102 (1992) C.121 (1992)
C.102 (1992) C.183 (2010)
C.102 (1992)
Spain C.102 (1988) C.102 (1988) C.102 (1988) C.102 (1988) C.157 (1985)
Sweden C.102 (1953) C.130 (1970) C.118 (1963)
C.102 (1953) C.130 (1970) C.118 (1963)
C.102 (1953) C.168 (1990) C.118 (1963)
C.128 (1968)
C.102 (1953) C.121 (1969) C.118 (1963)
C.102 (1953) C.102 (1953)
C.118 (1963)
C.128 (1968)
C.128 (1968)
C.157 (1984) C.118 (1963)
Switzerland C.168 (1990)
C.102 (1977) C.128 (1977)
C.102 (1977) C.102 (1977) C.183 (2014)
C.102 (1977) C.128 (1977)
C.102 (1977) C.128 (1977)
Ukraine C.102 (2016) C.102 (2016) C.102 (2016) C.102 (2016) C.102 (2016) C.102 (2016) C.102 (2016) C.102 (2016) C.102 (2016)
United Kingdom C.102 (1954) C.102 (1954) C.102 (1954) C.102 (1954) C.102 (1954) C.102 (1954)
a While all international social security standards apply to migrant workers unless otherwise stated, C.118 and C.157 are of particular relevance to migrant workers. b Parts of C.118 apply for selected branches (see other columns).
1 Sao Tome and Principe. C.183 will enter into force on 12 June 2018. 2 Senegal. C.183 will enter into force on 18 April 2018. 3 Finland, Japan, Netherlands, Uruguay. Accepted the text of the List of Occupational Diseases (Schedule I) amended by the ILC at its 66th Session (1980). 4 Belgium. C.128 will enter into force on 14 June 2018 and C.130 will enter into force on 22 November 2018. 5 Bulgaria. Accepted Part IV on 12 July 2016.
Source: Based on ILO. 2017a. Building social protection systems: International standards and human rights instruments (Geneva).

54 S
ocial protection for older persons: Policy trends and statistics 2017-19
Table B.2. Overview of national social security systems
Country/Territory Number of policy areas covered by at least one programme Existence of a statutory programme
Number of policy areas covered by at least one programme
Number of social security policy areas covered by a statutory programme
Child and Family 1
Maternity (cash) 2
Sickness (cash)
Unemploy- ment 3
Employment injury 4
Disability/ Invalidity 5
Survivors Old age 6
AFRICA
Northern Africa
Algeria 8 Comprehensive scope of legal coverage | 8 � � � � � � � �
Egypt 7 Nearly comprehensive scope of legal coverage | 7 None � � � � � � �
Libya 7 Nearly comprehensive scope of legal coverage | 7 � � � � � � � �
Morocco 8 Comprehensive scope of legal coverage | 8 � � � � � � � �
Sudan 4 Limited scope of legal coverage | 1 to 4 None � � � � � � �
Tunisia 8 Comprehensive scope of legal coverage | 8 � � � � � � � �
Sub-Saharan Africa
Angola 6 Intermediate scope of legal coverage | 5 to 6 � � � � � � � �
Benin 6 Intermediate scope of legal coverage | 5 to 6 � � � None � � � �
Botswana 5 Intermediate scope of legal coverage | 5 to 6 � � � � � � � �
Burkina Faso 6 Intermediate scope of legal coverage | 5 to 6 � � � None � � � �
Burundi 6 Intermediate scope of legal coverage | 5 to 6 � � � None � � � �
Cabo Verde 8 Comprehensive scope of legal coverage | 8 � � � � � � � �
Cameroon 6 Intermediate scope of legal coverage | 5 to 6 � � � � � � � �
Central African Republic 6 Intermediate scope of legal coverage | 5 to 6 � � � None � � � �
Chad 6 Intermediate scope of legal coverage | 5 to 6 � � � � � � � �
Comoros … Incomplete information available … � … None … … … …
Congo 6 Intermediate scope of legal coverage | 5 to 6 � � � None � � � �
Congo, Democratic Republic of the 6 Intermediate scope of legal coverage | 5 to 6 � � � None � � � �
Côte d’Ivoire 6 Intermediate scope of legal coverage | 5 to 6 � � � � � � � �
Djibouti 6 Intermediate scope of legal coverage | 5 to 6 � � � None � None � �
Equatorial Guinea 7 Nearly comprehensive scope of legal coverage | 7 � � � � � � � �
Eritrea … Incomplete information available … � … None … … … …
Ethiopia 7 4 Limited scope of legal coverage | 1 to 4 None � � � � � � �
Gabon 6 Intermediate scope of legal coverage | 5 to 6 � � � � � � � �
The Gambia 4 Limited scope of legal coverage | 1 to 4 None � � � � � � �
Ghana 5 Intermediate scope of legal coverage | 5 to 6 None � � None � � � �

Social protection for older persons: P
olicy trends and statistics 2017-19 55
Country/Territory Number of policy areas covered by at least one programme Existence of a statutory programme
Number of policy areas covered by at least one programme
Number of social security policy areas covered by a statutory programme
Child and Family 1
Maternity (cash) 2
Sickness (cash)
Unemploy- ment 3
Employment injury 4
Disability/ Invalidity 5
Survivors Old age 6
Guinea 7 Nearly comprehensive scope of legal coverage | 7 � � � None � � � �
Guinea-Bissau … Incomplete information available … � … None � � � �
Kenya 4 Limited scope of legal coverage | 1 to 4 None � � None � � � �
Lesotho 3 Limited scope of legal coverage | 1 to 4 None � � � � None � �
Liberia 4 Limited scope of legal coverage | 1 to 4 None None None None � � � �
Madagascar 6 Intermediate scope of legal coverage | 5 to 6 � � � None � � � �
Malawi 1 Limited scope of legal coverage | 1 to 4 None � � � � None None �
Mali 6 Intermediate scope of legal coverage | 5 to 6 � � � � � � � �
Mauritania 6 Intermediate scope of legal coverage | 5 to 6 � � � None � � � �
Mauritius 6 Intermediate scope of legal coverage | 5 to 6 � � � � � � � �
Mozambique 6 Intermediate scope of legal coverage | 5 to 6 � � � None … � � �
Namibia 7 Nearly comprehensive scope of legal coverage | 7 � � � � � � � �
Niger 6 Intermediate scope of legal coverage | 5 to 6 � � � None � � � �
Nigeria 4 Limited scope of legal coverage | 1 to 4 None � � � � � � �
Rwanda 5 Intermediate scope of legal coverage | 5 to 6 None � � � � � � �
Sao Tome and Principe 6 Intermediate scope of legal coverage | 5 to 6 None � � None � � � �
Senegal 6 Intermediate scope of legal coverage | 5 to 6 � � � None � � � �
Seychelles 7 Nearly comprehensive scope of legal coverage | 7 None � � � � � � �
Sierra Leone 4 Limited scope of legal coverage | 1 to 4 None � None None � � � �
Somalia … Incomplete information available None � … None … … … …
South Africa 8 Comprehensive scope of legal coverage | 8 � � � � � � � �
South Sudan … Incomplete information available … … … None … … … …
Swaziland 4 Limited scope of legal coverage | 1 to 4 None � None None � � � �
Tanzania, United Republic of 5 Intermediate scope of legal coverage | 5 to 6 None � � � � � � �
Togo 6 Intermediate scope of legal coverage | 5 to 6 � � � None � � � �
Uganda 4 Limited scope of legal coverage | 1 to 4 None � � � � � � �
Zambia 4 Limited scope of legal coverage | 1 to 4 None � � � � � � �
Zimbabwe 4 Limited scope of legal coverage | 1 to 4 None � None None � � � �
AMERICAS
Latin America and the Caribbean
Anguilla … Incomplete information available … … … … … � … …
Antigua and Barbuda 6 Intermediate scope of legal coverage | 5 to 6 None � � None � � � �

56 S
ocial protection for older persons: Policy trends and statistics 2017-19
Country/Territory Number of policy areas covered by at least one programme Existence of a statutory programme
Number of policy areas covered by at least one programme
Number of social security policy areas covered by a statutory programme
Child and Family 1
Maternity (cash) 2
Sickness (cash)
Unemploy- ment 3
Employment injury 4
Disability/ Invalidity 5
Survivors Old age 6
Argentina 8 Comprehensive scope of legal coverage | 8 � � � � � � � �
Aruba … Incomplete information available … … … � … … … �
Bahamas 7 Nearly comprehensive scope of legal coverage | 7 None � � � � � � �
Barbados 7 Nearly comprehensive scope of legal coverage | 7 None � � � � � � �
Belize 6 Intermediate scope of legal coverage | 5 to 6 None � � � � � � �
Bermuda 4 Limited scope of legal coverage | 1 to 4 None � � � � � � �
Bolivia, Plurinational State of 7 Nearly comprehensive scope of legal coverage | 7 � � � � � � � �
Brazil 8 Comprehensive scope of legal coverage | 8 � � � � � � � �
British Virgin Islands 6 Intermediate scope of legal coverage | 5 to 6 None � � � � � � �
Chile 8 Comprehensive scope of legal coverage | 8 � � � � � � � �
Colombia 8 Comprehensive scope of legal coverage | 8 � � � � � � � �
Costa Rica 7 Nearly comprehensive scope of legal coverage | 7 � � � � � � � �
Cuba 6 Intermediate scope of legal coverage | 5 to 6 None � � None � � � �
Dominica 6 Intermediate scope of legal coverage | 5 to 6 None � � None � � � �
Dominican Republic 7 Nearly comprehensive scope of legal coverage | 7 � � � None � � � �
Ecuador 8 Comprehensive scope of legal coverage | 8 � � � � � � � �
El Salvador 6 Intermediate scope of legal coverage | 5 to 6 None � � � � � � �
French Guiana … Incomplete information available … … … … � � � �
Grenada 6 Intermediate scope of legal coverage | 5 to 6 None � � � � � � �
Guadeloupe 6 Limited scope of legal coverage | 5 to 6 None � � None � � � �
Guatemala 6 Intermediate scope of legal coverage | 5 to 6 None � � � � � � �
Guyana 6 Intermediate scope of legal coverage | 5 to 6 None � � � � � � �
Haiti 4 Limited scope of legal coverage | 1 to 4 None � � None � � � �
Honduras 7 Nearly comprehensive scope of legal coverage | 7 � � � � � � � �
Jamaica 6 Intermediate scope of legal coverage | 5 to 6 � � � None � � � �
Martinique … Incomplete information available � � … … � � � �
Mexico 7 Nearly comprehensive scope of legal coverage | 7 � � � � � � � �
Nicaragua 6 Intermediate scope of legal coverage | 5 to 6 None � � None � � � �
Panama 7 Nearly comprehensive scope of legal coverage | 7 � � � � � � � �
Paraguay 6 Intermediate scope of legal coverage | 5 to 6 � � � � � � � �
Peru 7 Nearly comprehensive scope of legal coverage | 7 � � � � � � � �
Puerto Rico … Incomplete information available … � � … � � � �

Social protection for older persons: P
olicy trends and statistics 2017-19 57
Country/Territory Number of policy areas covered by at least one programme Existence of a statutory programme
Number of policy areas covered by at least one programme
Number of social security policy areas covered by a statutory programme
Child and Family 1
Maternity (cash) 2
Sickness (cash)
Unemploy- ment 3
Employment injury 4
Disability/ Invalidity 5
Survivors Old age 6
Saint Kitts and Nevis 6 Intermediate scope of legal coverage | 5 to 6 None � � � � � � �
Saint Lucia 6 Intermediate scope of legal coverage | 5 to 6 None � � None � � � �
Saint Vincent and the Grenadines 6 Intermediate scope of legal coverage | 5 to 6 None � � � � � � �
Suriname … Incomplete information available … … … None … … … �
Trinidad and Tobago 7 Nearly comprehensive scope of legal coverage | 7 � � � � � � � �
Uruguay 8 Comprehensive scope of legal coverage | 8 � � � � � � � �
Venezuela, Bolivarian Rep. of 7 Nearly comprehensive scope of legal coverage | 7 None � � � � � � �
Northern America
Canada 8 Comprehensive scope of legal coverage | 8 � � � � � � � �
United States 11 8 Comprehensive scope of legal coverage | 8 � � � � � � � �
ARAB STATES
Bahrain 5 Intermediate scope of legal coverage | 5 to 6 None � � � � � � �
Iraq 7 Nearly comprehensive scope of legal coverage | 7 � � � � � � � �
Jordan 6 Intermediate scope of legal coverage | 5 to 6 None � � � � � � �
Kuwait 5 Intermediate scope of legal coverage | 5 to 6 None � � � � � � �
Lebanon 5 Intermediate scope of legal coverage | 5 to 6 � � � None � � � �
Occupied Palestinian Territory … Incomplete information available … � … … … … … …
Oman 4 Limited scope of legal coverage | 1 to 4 None � None None � � � �
Qatar 4 Limited scope of legal coverage | 1 to 4 None � � None � � � �
Saudi Arabia 5 Intermediate scope of legal coverage | 5 to 6 None � � � � � � �
Syrian Arab Republic 4 Limited scope of legal coverage | 1 to 4 None � � � � � � �
United Arab Emirates … Incomplete information available … � … � … … … …
Yemen 4 Limited scope of legal coverage | 1 to 4 None � � � � � � �
ASIA AND THE PACIFIC
Eastern Asia
China 8 Comprehensive scope of legal coverage | 8 � � � � � � � �
Hong Kong, China 8 Comprehensive scope of legal coverage | 8 � � � � � � � �
Japan 8 Comprehensive scope of legal coverage | 8 � � � � � � � �
Korea, Dem. People’s Rep. of … Incomplete information available … … … None … … … …
Korea, Republic of 6 Intermediate scope of legal coverage | 5 to 6 None � � � � � � �
Macau, China … Incomplete information available … … … … … … … …

58 S
ocial protection for older persons: Policy trends and statistics 2017-19
Country/Territory Number of policy areas covered by at least one programme Existence of a statutory programme
Number of policy areas covered by at least one programme
Number of social security policy areas covered by a statutory programme
Child and Family 1
Maternity (cash) 2
Sickness (cash)
Unemploy- ment 3
Employment injury 4
Disability/ Invalidity 5
Survivors Old age 6
Mongolia 8 Comprehensive scope of legal coverage | 8 � � � � � � � �
Taiwan, China 7 Nearly comprehensive scope of legal coverage | 7 None � � � � � � �
South-Eastern Asia
Brunei Darussalam 5 Intermediate scope of legal coverage | 5 to 6 None � � None � � � �
Cambodia 10 3 Limited scope of legal coverage | 1 to 4 None � � � � � � �
Indonesia 5 Intermediate scope of legal coverage | 5 to 6 � � � � � � � �
Lao People’s Dem. Rep. 6 Intermediate scope of legal coverage | 5 to 6 None � � � � � � �
Malaysia 4 Limited scope of legal coverage | 1 to 4 None � � � � � � �
Myanmar 8 4 Limited scope of legal coverage | 1 to 4 � � � � � � � �
Philippines 6 Intermediate scope of legal coverage | 5 to 6 None � � � � � � �
Singapore 7 Nearly comprehensive scope of legal coverage | 7 � � � None � � � �
Thailand 8 Comprehensive scope of legal coverage | 8 � � � � � � � �
Timor-Leste 4 Limited scope of legal coverage | 1 to 4 None � None None � � � �
Viet Nam 8 Comprehensive scope of legal coverage | 8 � � � � � � � �
Southern Asia
Afghanistan … Incomplete information available … � … None … … … …
Bangladesh 6 Intermediate scope of legal coverage | 5 to 6 None � � � � � � �
Bhutan 4 Limited scope of legal coverage | 1 to 4 None � � None � � � �
India 7 Nearly comprehensive scope of legal coverage | 7 None � � � � � � �
Iran, Islamic Rep. of 8 Comprehensive scope of legal coverage | 8 � � � � � � � �
Maldives … Incomplete information available … … � None … � � �
Nepal 4 Limited scope of legal coverage | 1 to 4 None � � � � � � �
Pakistan 7 Nearly comprehensive scope of legal coverage | 7 � � � � � � � �
Sri Lanka 5 Intermediate scope of legal coverage | 5 to 6 � � � � � � � �
Oceania
Australia 8 Comprehensive scope of legal coverage | 8 � � � � � � � �
Cook Islands … Incomplete information available … … … … … … … �
Fiji 5 Intermediate scope of legal coverage | 5 to 6 � � � � � � � �
Kiribati 4 Limited scope of legal coverage | 1 to 4 None � � � � � � �
Marshall Islands 3 Limited scope of legal coverage | 1 to 4 None � � None None � � �
Micronesia, Fed. States of 3 Limited scope of legal coverage | 1 to 4 None None None None None � � �

Social protection for older persons: P
olicy trends and statistics 2017-19 59
Country/Territory Number of policy areas covered by at least one programme Existence of a statutory programme
Number of policy areas covered by at least one programme
Number of social security policy areas covered by a statutory programme
Child and Family 1
Maternity (cash) 2
Sickness (cash)
Unemploy- ment 3
Employment injury 4
Disability/ Invalidity 5
Survivors Old age 6
Nauru … Incomplete information available … … … None … … … …
New Caledonia … Incomplete information available … … … � … … … …
New Zealand 8 Comprehensive scope of legal coverage | 8 � � � � � � � �
Niue … Incomplete information available … … … None … … … �
Palau 3 Limited scope of legal coverage | 1 to 4 None � � None None � � �
Papua New Guinea 4 Limited scope of legal coverage | 1 to 4 None None � � � � � �
Samoa 4 Limited scope of legal coverage | 1 to 4 None � � None � � � �
Solomon Islands 4 Limited scope of legal coverage | 1 to 4 None � � � � � � �
Tonga … Incomplete information available … … … None � � � �
Tuvalu … Incomplete information available … … … � � � � �
Vanuatu 3 Limited scope of legal coverage | 1 to 4 None � � � None � � �
EUROPE AND CENTRAL ASIA
Northern, Southern and Western Europe
Albania 8 Comprehensive scope of legal coverage | 8 � � � � � � � �
Andorra 8 Comprehensive scope of legal coverage | 8 � � � � � � � �
Austria 8 Comprehensive scope of legal coverage | 8 � � � � � � � �
Belgium 8 Comprehensive scope of legal coverage | 8 � � � � � � � �
Bosnia and Herzegovina 8 Comprehensive scope of legal coverage | 8 � � � � � � � �
Croatia 8 Comprehensive scope of legal coverage | 8 � � � � � � � �
Denmark 8 Comprehensive scope of legal coverage | 8 � � � � � � � �
Estonia 8 Comprehensive scope of legal coverage | 8 � � � � � � � �
Faeroe Islands … Incomplete information available … … … … … … … �
Finland 8 Comprehensive scope of legal coverage | 8 � � � � � � � �
France 8 Comprehensive scope of legal coverage | 8 � � � � � � � �
Germany 8 Comprehensive scope of legal coverage | 8 � � � � � � � �
Greece 8 Comprehensive scope of legal coverage | 8 � � � � � � � �
Guernsey 8 Comprehensive scope of legal coverage | 8 � � � � � � � �
Iceland 8 Comprehensive scope of legal coverage | 8 � � � � � � � �
Ireland 8 Comprehensive scope of legal coverage | 8 � � � � � � � �
Isle of Man 8 Comprehensive scope of legal coverage | 8 � � � � � � � �
Italy 8 Comprehensive scope of legal coverage | 8 � � � � � � � �
Jersey 7 Nearly comprehensive scope of legal coverage | 7 � � � None � � � �

60 S
ocial protection for older persons: Policy trends and statistics 2017-19
Country/Territory Number of policy areas covered by at least one programme Existence of a statutory programme
Number of policy areas covered by at least one programme
Number of social security policy areas covered by a statutory programme
Child and Family 1
Maternity (cash) 2
Sickness (cash)
Unemploy- ment 3
Employment injury 4
Disability/ Invalidity 5
Survivors Old age 6
Kosovo 8 Comprehensive scope of legal coverage | 8 � � � � � � � �
Latvia 8 Comprehensive scope of legal coverage | 8 � � � � � � � �
Liechtenstein 8 Comprehensive scope of legal coverage | 8 � � � � � � � �
Lithuania 8 Comprehensive scope of legal coverage | 8 � � � � � � � �
Luxembourg 8 Comprehensive scope of legal coverage | 8 � � � � � � � �
Macedonia, the former Yugoslav Rep. of 8 Comprehensive scope of legal coverage | 8 � � � � � � � �
Malta 8 Comprehensive scope of legal coverage | 8 � � � � � � � �
Monaco 9 8 Comprehensive scope of legal coverage | 8 � � � � � � � �
Montenegro 8 Comprehensive scope of legal coverage | 8 � � � � � � � �
Netherlands 8 Comprehensive scope of legal coverage | 8 � � � � � � � �
Norway 8 Comprehensive scope of legal coverage | 8 � � � � � � � �
Portugal 8 Comprehensive scope of legal coverage | 8 � � � � � � � �
San Marino 8 Comprehensive scope of legal coverage | 8 � � � � � � � �
Serbia 8 Comprehensive scope of legal coverage | 8 � � � � � � � �
Slovenia 8 Comprehensive scope of legal coverage | 8 � � � � � � � �
Spain 8 Comprehensive scope of legal coverage | 8 � � � � � � � �
Sweden 8 Comprehensive scope of legal coverage | 8 � � � � � � � �
Switzerland 8 Comprehensive scope of legal coverage | 8 � � � � � � � �
United Kingdom 8 Comprehensive scope of legal coverage | 8 � � � � � � � �
Eastern Europe
Belarus 8 Comprehensive scope of legal coverage | 8 � � � � � � � �
Bulgaria 8 Comprehensive scope of legal coverage | 8 � � � � � � � �
Czech Republic 8 Comprehensive scope of legal coverage | 8 � � � � � � � �
Hungary 8 Comprehensive scope of legal coverage | 8 � � � � � � � �
Moldova, Republic of 8 Comprehensive scope of legal coverage | 8 � � � � � � � �
Poland 8 Comprehensive scope of legal coverage | 8 � � � � � � � �
Romania 8 Comprehensive scope of legal coverage | 8 � � � � � � � �
Russian Federation 8 Comprehensive scope of legal coverage | 8 � � � � � � � �
Slovakia 8 Comprehensive scope of legal coverage | 8 � � � � � � � �
Ukraine 8 Comprehensive scope of legal coverage | 8 � � � � � � � �

Social protection for older persons: P
olicy trends and statistics 2017-19 61
Country/Territory Number of policy areas covered by at least one programme Existence of a statutory programme
Number of policy areas covered by at least one programme
Number of social security policy areas covered by a statutory programme
Child and Family 1
Maternity (cash) 2
Sickness (cash)
Unemploy- ment 3
Employment injury 4
Disability/ Invalidity 5
Survivors Old age 6
Central and Western Asia
Armenia 7 Nearly comprehensive scope of legal coverage | 7 � � � � � � � �
Azerbaijan 8 Comprehensive scope of legal coverage | 8 � � � � � � � �
Cyprus 8 Comprehensive scope of legal coverage | 8 � � � � � � � �
Georgia 7 Nearly comprehensive scope of legal coverage | 7 � � � � � � � �
Israel 8 Comprehensive scope of legal coverage | 8 � � � � � � � �
Kazakhstan 8 Comprehensive scope of legal coverage | 8 � � � � � � � �
Kyrgyzstan 8 Comprehensive scope of legal coverage | 8 � � � � � � � �
Tajikistan 7 Nearly comprehensive scope of legal coverage | 7 � � � � … � � �
Turkey 7 Nearly comprehensive scope of legal coverage | 7 None � � � � � � �
Turkmenistan 8 Comprehensive scope of legal coverage | 8 � � � � � � � �
Uzbekistan 8 Comprehensive scope of legal coverage | 8 � � � � � � � �
Sources
Main source
ISSA (International Social Security Association); SSA (US Social Security Administration). Various dates.
Social security programs throughout the world (Geneva and Washington DC). Available at: http:/www.ssa.gov/policy/docs/progdesc/ssptw [31 May 2017].
Other sources
Council of Europe. Mutual Information System on Social Protection of the Council of Europe (MISSCEO). Comparative Tables Database. Available at: http://www.missceo.coe.int/ [1 June 2017].
European Commission. Mutual Information System on Social Protection (MISSOC). Comparative Tables Database. Available at: http://www.missoc.org [1 June 2017].
ILO (International Labour Office). Information System on International Labour Standards (NORMLEX) (incorporates the former ILOLEX and NATLEX databases). Available at: http://www.ilo.org/dyn/normlex/en/. [1 June 2017]
—. 2010. Profile of social security system in Kosovo (within the meaning of UNSC Resolution 1244 [1999]) (Budapest, ILO DWT and Country Office for Central and Eastern Europe). National legislation.
Notes
… Not available.
Detailed notes and definition available at: http://www.social-protection.org/gimi/gess/RessourceDownload.action?ressource.ressourceId=54602
Symbols
� At least one programme anchored in national legislation, including employer-liability programmes based on mandatory risk pooling.
� Legislation not yet entered into force.
� Limited provision (e.g. labour code only).
� Only benefit in kind (e.g. medical benefit).

62 S
ocial protection for older persons: Policy trends and statistics 2017-19
1 Additional details in table B.4 of the World Social Protection Report 2017–19 (ILO, 2017b): Child and family benefits: Key features of main social security programmes and social protection effective coverage (SDG indicator 1.3.1 for children and families with children) (http://www.social-protection.org/gimi/gess/RessourceDownload.action?ressource.ressourceld=54781).
2 Additional details in table B.5 of the World Social Protection Report 2017–19 (ILO, 2017b): Maternity: Key features of main social security programmes and social protection effective coverage (SDG Indicator 1.3.1. for mothers with newborns) (http://www.social-protection.org/gimi/gess/RessourceDownload.action?ressource.ressourceld=54605).
3 Additional details in table B.6 of the World Social Protection Report 2017–19 (ILO, 2017b): Unemployment: Indicators of effective coverage. Unemployed who actually receive benefits, 2000 to latest available year (SDG indicator 1.3.1 for unemployed) (http://www.social-protection.org/gimi/gess/RessourceDownload.action?ressource.ressourceId=54603).
4 Additional details in table B.7 of the World Social Protection Report 2017–19 (ILO, 2017b): Employment injury: Key features of main social security programmes (http://www.social-protection.org/gimi/gess/RessourceDownload.action?ressource.ressourceId=54604).
5 Additional details in table B.8 of the World Social Protection Report 2017–19 (ILO, 2017b): Disability benefits: Key features of main social security programmes and social protection effective coverage (SDG indicator 1.3.1 for persons with severe disabilities)
6 Additional details in table B.3: Old-age pensions: Key features of main social security programmes (http://www.social-protection.org/gimi/gess/RessourceDownload.action?ressource.ressourceId=54606).
7 Ethiopia. Sickness. Employer liability cash benefits are provided. A new health insurance system for public- and private-sector workers was approved by Parliament in 2010 (Social Health Insurance Proclamation 2010) and is in the process of being implemented.
8 Myanmar. Enacted its social security law in 2012. The law includes provisions for most social security branches including old age, survivors, disability, family benefits and unemployment insurance benefit (section 37), but only certain branches have been implemented so far.
9 Monaco. Unemployment. Coverage is provided through France’s programme for unemployment insurance.
10 Cambodia. Currently only public servants receive pensions. A pension scheme for workers in the private sector is yet to be implemented.
11 United States. Maternity and sickness: provisions at state level.
Definitions
The scope of coverage is measured by the number of social security policy areas provided for by law. This indicator can take the value 0 to 8 according to the total number of social security policy areas (or branches) with a programme anchored in national legislation.
The following eight branches are taken into consideration: sickness, maternity, old age, survivors, invalidity, child/family, employment injury and unemployment.
The number of branches covered by at least one programme provides an overview of the scope of legal social security provision.

Social protection for older persons: P
olicy trends and statistics 2017-19 63
Table B.3. Old-age pensions: Key features of main social security programmes
Country/ Territory
Dat
e o
f fi
rst
law
/yea
r in
tro
du
ced
Type of programme a
Pensionable age a Contribution rates: Old-age, disability, survivors a Estimate of legal coveragea for old age as a percentage of the working-age population
Total * Contributory mandatory
Contributory voluntary
Non- contributory
Men Women 2 Insured person Employer Self-employed Financing from Government
Total Women Total Women Total Women Total Women
AFRICA
Northern Africa
Algeria 1949 Social insurance 60 55 7.0 10.3 Special system Subsidizes minimum pension
100.0 100.0 37.9 13.2 0.0 0.0 100.0 100.0
… Means-tested non-contributory pension
60 60 No contribution No contribution No contribution Total cost
Egypt 1950 Social insurance 60 60 10.0 + 3.0 (lump-sum benefits)
15.0 + 3.0 (lump-sum benefits)
n.a. 1.0% of covered monthly payroll plus the cost of
any deficit
100.0 100.0 29.3 10.0 0.0 0.0 70.7 90.0
1980 Pension-tested non-contributory pension (social assistance)
65 65 No contribution No contribution No contribution Total cost
Libya 1957 Social insurance 65 60 3.8 10.5 15.7 0.75% of covered earnings; annual
subsidies
41.8 20.1 41.8 20.1 0.0 0.0 0.0 0.0
Morocco 1959 Social insurance 60 60 4.0 7.9 n.a. No contribution 29.7 10.2 29.7 10.2 … … 0.0 0.0
Sudan 1974 Social insurance 60 60 8.0 17.0 25.0 No contribution 42.2 19.9 42.2 19.9 0.0 0.0 0.0 0.0
Tunisia 1960 Social insurance 60 60 4.7 7.8 Special system Provides subsidies in low-income economic
areas to encourage the employment of
young graduates, persons with
disabilities, and other categories
of workers
43.3 21.1 43.3 21.1 … … 0.0 0.0

64 S
ocial protection for older persons: Policy trends and statistics 2017-19
Country/ Territory
Dat
e o
f fi
rst
law
/yea
r in
tro
du
ced
Type of programme a
Pensionable age a Contribution rates: Old-age, disability, survivors a Estimate of legal coveragea for old age as a percentage of the working-age population
Total * Contributory mandatory
Contributory voluntary
Non- contributory
Men Women 2 Insured person Employer Self-employed Financing from Government
Total Women Total Women Total Women Total Women
Sub-Saharan Africa
Angola 1990 Social insurance 60 60 3.0 8.0 11.0 (8.0 for partial benefit)
No contribution 60.0 50.5 60.0 50.5 0.0 0.0 0.0 0.0
Benin 1970 Social insurance 60 60 3.6 (10.0 if voluntarily insured)
6.4 n.a. No contribution 7.0 3.6 7.0 3.6 … … 0.0 0.0
Botswana 1996 Universal non-contributory pension
65 65 No contribution No contribution No contribution Total cost 100.0 100.0 0.0 0.0 0.0 0.0 100.0 100.0
Burkina Faso 1960 Social insurance 56–63 (depending on
profession)
56–63 (depending on
profession)
5.5 5.5 11.0 No contribution 41.8 19.7 5.9 3.1 35.8 16.6 0.0 0.0
Burundi 1956 Social insurance 60 60 4.0 6.0 n.a. No contribution 4.6 2.6 4.6 2.6 … … 0.0 0.0
Cabo Verde 1957 Social insurance 60 60 3.0 (+ 1.0 for admin. fees)
7.0 (+ 1.0 for admin. fees)
10.0 (+ 1.5 for admin. fees)
No contribution 100.0 100.0 62.7 46.0 0.0 0.0 37.3 53.9
2006 Pension-tested non-contributory pension
60 60 No contribution No contribution n.a. Total cost
Cameroon 1969 Social insurance 60 60 2.8 4.2 n.a. No contribution 17.4 9.4 17.4 9.4 0.0 0.0 0.0 0.0
Central African Republic
1963 Social insurance 60 60 3.0 4.0 Voluntary basis No contribution 76.3 71.2 21.8 10.0 54.5 61.2 0.0 0.0
Chad 1977 Social insurance 60 60 3.5 5.0 n.a. No contribution 5.6 1.0 5.6 1.0 0.0 0.0 0.0 0.0
Congo 1962 Social insurance 57–65 (depending on
occupation)
57–65 (depending on
occupation)
4.0 8.0 12.0 Annual subsidies if needed
17.2 6.1 17.2 6.1 … … 0.0 0.0
Congo, Democratic Republic of the
1956 Social insurance 65 60 3.5 3.5 n.a. An annual subsidy, up
to a maximum
28.2 14.0 28.2 14.0 … … 0.0 0.0
Côte d’Ivoire 1960 Social insurance 60 60 6.3 7.7 n.a. No contribution 14.0 5.2 14.0 5.2 0.0 0.0 0.0 0.0
Djibouti 1976 Social insurance 60 60 4.0 4.0 n.a. No contribution 31.9 12.6 31.9 12.6 0.0 0.0 0.0 0.0
Equatorial Guinea
1947 Social insurance 60 60 4.5 21.5 n.a. At least 25% of annual social
security receipts
57.9 51.3 57.9 51.3 0.0 0.0 0.0 0.0
Ethiopia 1963 Social insurance 60 60 7.0 11.0 18.0 No contribution 57.5 45.8 31.2 24.4 26.3 21.3 0.0 0.0
Gabon 1963 Social insurance 55 55 2.5 (2.0 for contract workers)
5.0 Special system No contribution 41.9 33.3 41.9 33.3 0.0 0.0 0.0 0.0

Social protection for older persons: P
olicy trends and statistics 2017-19 65
Country/ Territory
Dat
e o
f fi
rst
law
/yea
r in
tro
du
ced
Type of programme a
Pensionable age a Contribution rates: Old-age, disability, survivors a Estimate of legal coveragea for old age as a percentage of the working-age population
Total * Contributory mandatory
Contributory voluntary
Non- contributory
Men Women 2 Insured person Employer Self-employed Financing from Government
Total Women Total Women Total Women Total Women
The Gambia 1978 Social insurance 60 60 No contribution 15.0 n.a. No contribution 10.7 8.4 10.7 8.4 … … 0.0 0.0
1981 Provident Fund 60 60 5.0 10.0 Voluntary basis No contribution
Ghana 1972 Social insurance and mandatory
occupational (lump-sum benefit)
60 60 5.5 13.0 11.0 (social insurance); 5.0
(mandatory occupational)
Voluntary basis
No contribution 68.1 58.0 13.0 7.4 48.7 50.6 0.0 0.0
Guinea 1958 Social insurance 55-65 (depending on
profession)
55-65 (depending on
profession)
2.5 10.0 n.a. No contribution 26.8 20.5 26.8 20.5 … … 0.0 0.0
Guinea-Bissau … … … … … … … … … … … … … … … …
Kenya 1965 Mandatory individual account (pension
fund) and voluntary provident fund3
60 60 6.0 6.0 200 shillings a month or 4,800 shillings a year
No contribution 100.0 100.0 67.1 62.1 0.0 0.0 32.9 37.9
2006 Means-tested non-contributory pension
65 65 No contribution No contribution No contribution Total cost
2008 Means-tested non-contributory pension (Hunger Safety Net Programme – Pilot)c
55 55 No contribution No contribution No contribution Total cost
Lesotho 2004 Universal non-contributory pension
70 70 No contribution No contribution No contribution Total cost 100.0 100.0 0.0 0.0 0.0 0.0 100.0 100.0
Liberia 1975 Social insurance 60–65 60–65 3.0 3.0 5.0 (voluntary basis)
No contribution 100.0 100.0 12.6 5.6 47.8 52.2 39.6 42.2
1975 Means- and pension-tested, non-
contributory pension (social assistance)
60–65 60–65 n.a. n.a. n.a. Total cost
Madagascar 1969 Social insurance 60 (55 if merchant seamen)
60 (55 if merchant seamen)
1.0 (a flat rate for full-time household
workers)
9.5 (a flat rate for full-time household
workers)
n.a. No contribution 9.5 7.0 9.5 7.0 0.0 0.0 0.0 0.0
Malawi 4 2011 Mandatory individual accounts (not yet
implemented)
… … … … … … 27.9 21.7 27.9 21.7 0.0 0.0 0.0 0.0
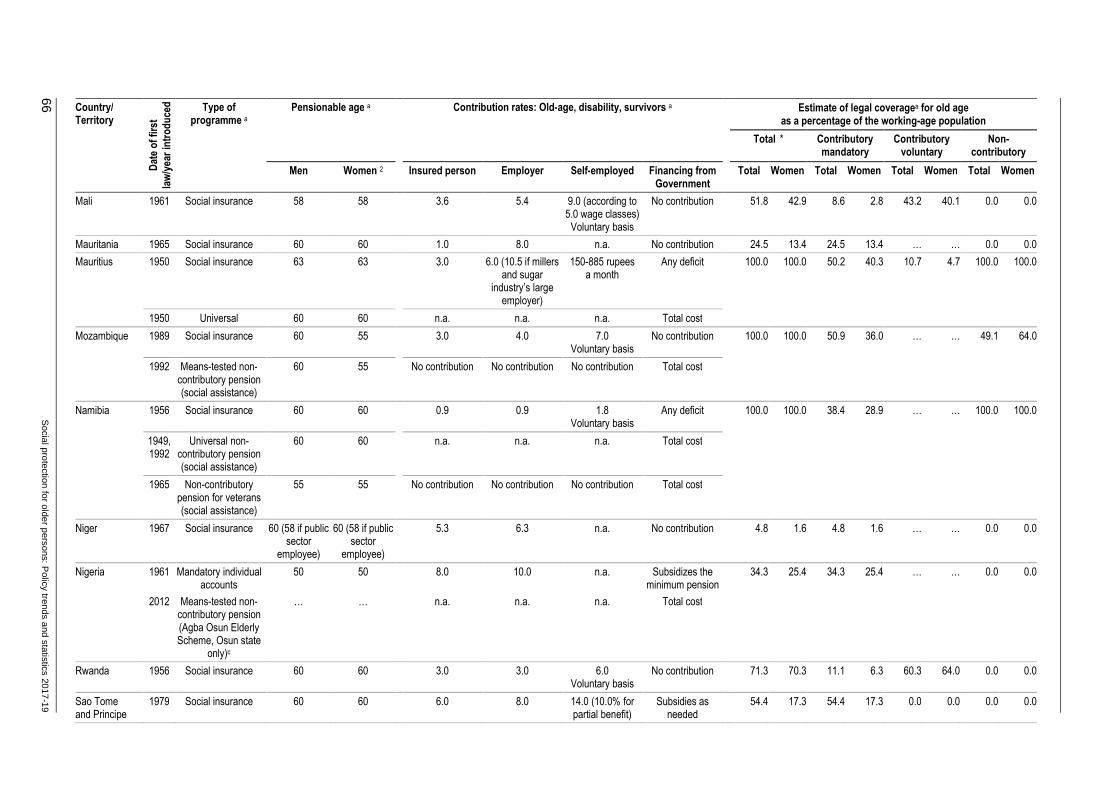
66 S
ocial protection for older persons: Policy trends and statistics 2017-19
Country/ Territory
Dat
e o
f fi
rst
law
/yea
r in
tro
du
ced
Type of programme a
Pensionable age a Contribution rates: Old-age, disability, survivors a Estimate of legal coveragea for old age as a percentage of the working-age population
Total * Contributory mandatory
Contributory voluntary
Non- contributory
Men Women 2 Insured person Employer Self-employed Financing from Government
Total Women Total Women Total Women Total Women
Mali 1961 Social insurance 58 58 3.6 5.4 9.0 (according to 5.0 wage classes)
Voluntary basis
No contribution 51.8 42.9 8.6 2.8 43.2 40.1 0.0 0.0
Mauritania 1965 Social insurance 60 60 1.0 8.0 n.a. No contribution 24.5 13.4 24.5 13.4 … … 0.0 0.0
Mauritius 1950 Social insurance 63 63 3.0 6.0 (10.5 if millers and sugar
industry’s large employer)
150-885 rupees a month
Any deficit 100.0 100.0 50.2 40.3 10.7 4.7 100.0 100.0
1950 Universal 60 60 n.a. n.a. n.a. Total cost
Mozambique 1989 Social insurance 60 55 3.0 4.0 7.0 Voluntary basis
No contribution 100.0 100.0 50.9 36.0 … … 49.1 64.0
1992 Means-tested non-contributory pension (social assistance)
60 55 No contribution No contribution No contribution Total cost
Namibia 1956 Social insurance 60 60 0.9 0.9 1.8 Voluntary basis
Any deficit 100.0 100.0 38.4 28.9 … … 100.0 100.0
1949, 1992
Universal non-contributory pension (social assistance)
60 60 n.a. n.a. n.a. Total cost
1965 Non-contributory pension for veterans (social assistance)
55 55 No contribution No contribution No contribution Total cost
Niger 1967 Social insurance 60 (58 if public sector
employee)
60 (58 if public sector
employee)
5.3 6.3 n.a. No contribution 4.8 1.6 4.8 1.6 … … 0.0 0.0
Nigeria 1961 Mandatory individual accounts
50 50 8.0 10.0 n.a. Subsidizes the minimum pension
34.3 25.4 34.3 25.4 … … 0.0 0.0
2012 Means-tested non-contributory pension (Agba Osun Elderly Scheme, Osun state
only)c
… … n.a. n.a. n.a. Total cost
Rwanda 1956 Social insurance 60 60 3.0 3.0 6.0 Voluntary basis
No contribution 71.3 70.3 11.1 6.3 60.3 64.0 0.0 0.0
Sao Tome and Principe
1979 Social insurance 60 60 6.0 8.0 14.0 (10.0% for partial benefit)
Subsidies as needed
54.4 17.3 54.4 17.3 0.0 0.0 0.0 0.0
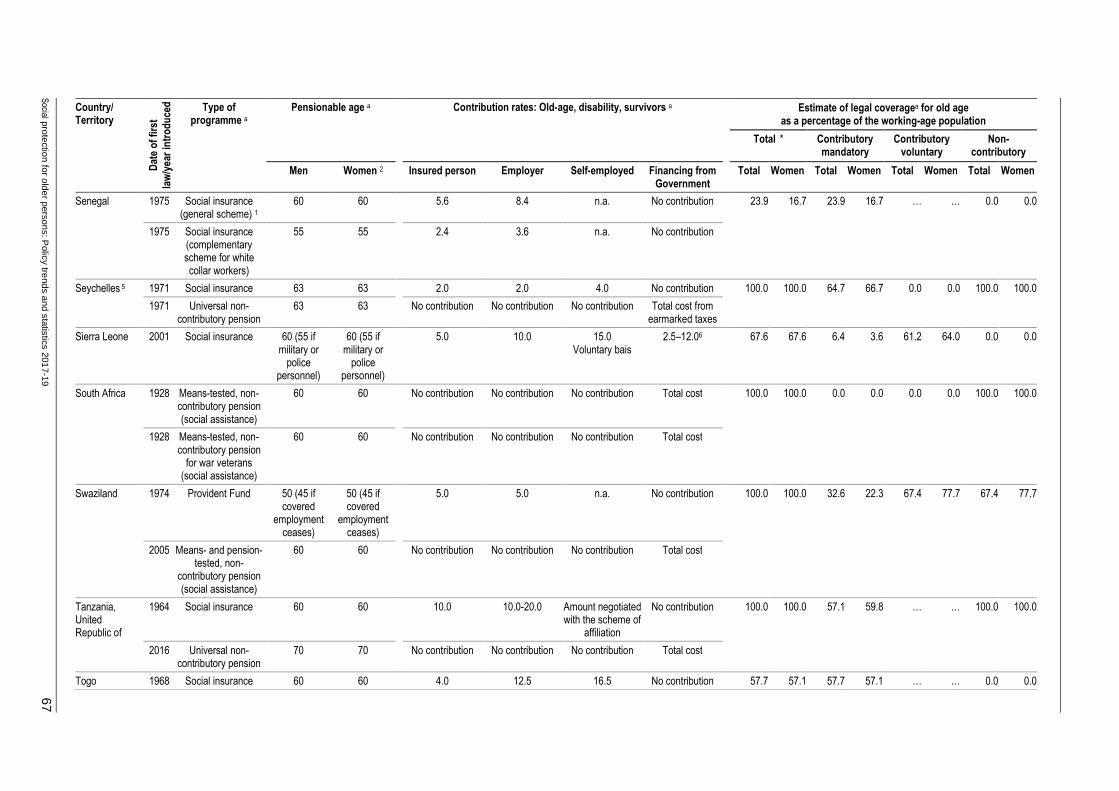
Social protection for older persons: P
olicy trends and statistics 2017-19 67
Country/ Territory
Dat
e o
f fi
rst
law
/yea
r in
tro
du
ced
Type of programme a
Pensionable age a Contribution rates: Old-age, disability, survivors a Estimate of legal coveragea for old age as a percentage of the working-age population
Total * Contributory mandatory
Contributory voluntary
Non- contributory
Men Women 2 Insured person Employer Self-employed Financing from Government
Total Women Total Women Total Women Total Women
Senegal 1975 Social insurance (general scheme) 1
60 60 5.6 8.4 n.a. No contribution 23.9 16.7 23.9 16.7 … … 0.0 0.0
1975 Social insurance (complementary scheme for white collar workers)
55 55 2.4 3.6 n.a. No contribution
Seychelles 5 1971 Social insurance 63 63 2.0 2.0 4.0 No contribution 100.0 100.0 64.7 66.7 0.0 0.0 100.0 100.0
1971 Universal non-contributory pension
63 63 No contribution No contribution No contribution Total cost from earmarked taxes
Sierra Leone 2001 Social insurance 60 (55 if military or
police personnel)
60 (55 if military or
police personnel)
5.0 10.0 15.0 Voluntary bais
2.5–12.06 67.6 67.6 6.4 3.6 61.2 64.0 0.0 0.0
South Africa 1928 Means-tested, non-contributory pension (social assistance)
60 60 No contribution No contribution No contribution Total cost 100.0 100.0 0.0 0.0 0.0 0.0 100.0 100.0
1928 Means-tested, non-contributory pension
for war veterans (social assistance)
60 60 No contribution No contribution No contribution Total cost
Swaziland 1974 Provident Fund 50 (45 if covered
employment ceases)
50 (45 if covered
employment ceases)
5.0 5.0 n.a. No contribution 100.0 100.0 32.6 22.3 67.4 77.7 67.4 77.7
2005 Means- and pension-tested, non-
contributory pension (social assistance)
60 60 No contribution No contribution No contribution Total cost
Tanzania, United Republic of
1964 Social insurance 60 60 10.0 10.0-20.0 Amount negotiated with the scheme of
affiliation
No contribution 100.0 100.0 57.1 59.8 … … 100.0 100.0
2016 Universal non-contributory pension
70 70 No contribution No contribution No contribution Total cost
Togo 1968 Social insurance 60 60 4.0 12.5 16.5 No contribution 57.7 57.1 57.7 57.1 … … 0.0 0.0

68 S
ocial protection for older persons: Policy trends and statistics 2017-19
Country/ Territory
Dat
e o
f fi
rst
law
/yea
r in
tro
du
ced
Type of programme a
Pensionable age a Contribution rates: Old-age, disability, survivors a Estimate of legal coveragea for old age as a percentage of the working-age population
Total * Contributory mandatory
Contributory voluntary
Non- contributory
Men Women 2 Insured person Employer Self-employed Financing from Government
Total Women Total Women Total Women Total Women
Uganda 1967 Provident Fund 55 55 5.0 10.0 n.a. No contribution 100.0 100.0 16.5 10.9 … … 100.0 100.0
2011 Universal and pensions- tested
regional non-contributory pension
65 (60 in Karamoja
region)
65 (60 in Karamoja
region)
No contribution No contribution No contribution Total cost
Zambia 1966 Social insurance 55 55 5.0 (10.0 if voluntarily insured)
5.0 10.0 Voluntary basis
No contribution 48.1 35.9 12.0 5.5 36.1 30.3 0.0 0.0
2007 Means-tested noncontributory pension (Social Cash Transfer, Katete – Pilot)c
60 60 n.a. n.a. n.a. Total cost
Zimbabwe 1989 Social insurance 60 60 3.5 3.5 n.a. No contribution 27.2 31.4 27.2 31.4 0.0 0.0 0.0 0.0
AMERICAS
Latin America and the Caribbean
Antigua and Barbuda
1972 Social insurance 60 60 4.0 6.0 10.0 No contribution 100.0 100.0 59.8 56.9 0.0 0.0 40.2 43.1
1993 Means- and pension-tested non-
contributory pension
87 (60 if blind or disabled)
87 (60 if blind or disabled)
No contribution No contribution No contribution Total cost
Argentina 7 1904 Social insurance 65 60 11.0 10.17-12.71 -(depending on the type of enterprise)
27.0 Contributes funding for the
social insurance pensions
100.0 100.0 57.9 49.8 … … 42.1 50.2
1994 Means- and pension-tested non-
contributory pension (social assistance)
70 70 No contribution No contribution No contribution Total cost
Aruba 1960 Universal non-contributory pension
60 60 No contribution No contribution No contribution Total cost 100.0 100.0 0.0 0.0 0.0 0.0 100.0 100.0
Bahamas 1956 Social insurance 65 65 3.9 5.9 6.8 No contribution 100.0 100.0 76.2 72.2 … … 23.8 27.8
1956 Means- and pension-tested non-
contributory pension
65 65 No contribution No contribution No contribution Total cost

Social protection for older persons: P
olicy trends and statistics 2017-19 69
Country/ Territory
Dat
e o
f fi
rst
law
/yea
r in
tro
du
ced
Type of programme a
Pensionable age a Contribution rates: Old-age, disability, survivors a Estimate of legal coveragea for old age as a percentage of the working-age population
Total * Contributory mandatory
Contributory voluntary
Non- contributory
Men Women 2 Insured person Employer Self-employed Financing from Government
Total Women Total Women Total Women Total Women
Barbados 1966 Social insurance 66 and 6 months
66 and 6 months
5.93-6.75 (+ 0.1 for the catastrophe
fund); 8.3 (if voluntarily insured)
5.93-6.75 13.5 (+0.1 for the catastrophe fund)
No contribution 100.0 100.0 71.4 68.9 … … 28.6 31.1
1937 Pension-tested non-contributory pension (social assistance) 66
66 and 6 months
66 and 6 months
2.0 2.0 2.0 Any deficit
Belize 1979 Social insurance 65 65 Contribution rates vary according to 8
wage classes
Contribution rates vary according to 8
wage classes
7.0 No contribution 100.0 100.0 67.0 44.5 … … 33.0 55.5
2003 Means-tested non-contributory pension (social assistance)
67 65 No contribution No contribution No contribution Financed by the Social Security
Board
Bermuda 1967 Social insurance 65 65 A weekly flat rate of BMD 32.07
A weekly flat rate of BMD 32.07
A weekly flat rate of BMD 64.17
No contribution … … … … … … … …
1998 Mandatory occupational pension
65 65 5.0 5.0 10.0 No contribution
1967 Pension-tested non-contributory pension (social assistance)
65 65 No contribution No contribution No contribution Total cost
Bolivia, Plurinational State of 8
1949 Mandatory individual account with
solidarity pensions
55 50 12.71 (individual account) + 0.5–10 (solidarity pension,
depending on 4 income bands)
No contribution (individual account)
+ 3 (solidarity pension; 2 for mining sector)
10.0+ 1.71 (disabiliy and
survivors)+ 0.5 (admin. fees)
Finances the value of accrued rights under the social insurance system and the funeral grant.
100.0 100.0 28.5 21.2 34.9 25.5 100.0 100.0
1997 Universal non-contributory pension
60 60 No contribution No contribution No contribution Total cost

70 S
ocial protection for older persons: Policy trends and statistics 2017-19
Country/ Territory
Dat
e o
f fi
rst
law
/yea
r in
tro
du
ced
Type of programme a
Pensionable age a Contribution rates: Old-age, disability, survivors a Estimate of legal coveragea for old age as a percentage of the working-age population
Total * Contributory mandatory
Contributory voluntary
Non- contributory
Men Women 2 Insured person Employer Self-employed Financing from Government
Total Women Total Women Total Women Total Women
Brazil 1923 Social insurance (Age Pension)
65 (urban), 60 (rural)
60 (urban), 55 (rural)
Urban sector: 8.0-11.0 (according to 3 income bands); 20.0 (if voluntarily
insured)
Rural sector: No contribution (proof of 60-180 months
of rural work)
Urban sector: 20.0 (2.75- 7.83 for
small businesses depending on
annual earnings and sector)
Rural sector: n.a
Urban sector: 20
Rural sector: n.a.
Earmarked taxes finance admin costs and any deficit of social
insurance
100.0 100.0 61.2 48.6 38.8 51.4 38.8 51.4
1996 Means- and pension-tested non-
contributory pension (social assistance,
Basic Old-Age Solidarity Pension)
65 65 No contribution No contribution No contribution Total cost
British Virgin Islands
1979 Social insurance 65 65 3.3 3.3 8.5 No contribution 79.6 71.1 79.6 71.1 … … 0.0 0.0
Chile 1924 Social insurance 65 60 18.84-30.0 (depending on the occupation) + 1.39
(admin. fees)
No contribution 18.8 Total cost of accrued rights
under the social insurance system
100.0 100.0 61.5 51.4 … … 38.5 48.6
1980 Mandatory individual account
65 60 10.0 + 1.39 (admin. fees)
1.0 (2.0 if in arduous work)
+ 1.15 (disability and survivors)
10.0 + 1.15 (disability and
survivors) + 1.39 (admin. fees)
Finances the minimum benefit,
old-age and disability social
security solidarity top-up benefits; subsidizes first 24 contributions
of young workers
2008 Means- and pension-tested non-
contributory pension
65 65 No contribution No contribution No contribution Total cost

Social protection for older persons: P
olicy trends and statistics 2017-19 71
Country/ Territory
Dat
e o
f fi
rst
law
/yea
r in
tro
du
ced
Type of programme a
Pensionable age a Contribution rates: Old-age, disability, survivors a Estimate of legal coveragea for old age as a percentage of the working-age population
Total * Contributory mandatory
Contributory voluntary
Non- contributory
Men Women 2 Insured person Employer Self-employed Financing from Government
Total Women Total Women Total Women Total Women
Colombia 9 1946 Social insurance and individual account
62 57 4.0 12.0 15.9 (social insurance) or 16
(individual account)
Partially finances the Pension
Solidarity and Guarantee Fund;
subsidizes contributions for vulnerable self-
employed persons
100.0 100.0 68.1 56.6 … … 31.9 43.4
2003 Means-tested non-contributory pension (social assistance)
59 54 1.0-2.0 (depending on
income)
No contribution Voluntary contributions
Remaining cost
Costa Rica 1941 Social insurance 65 65 2.8 5.1 7.9 0.58% of the gross income of all workers and self-employed
persons
100.0 100.0 59.2 43.4 0.0 0.0 40.8 56.6
1941 Individual account 65 65 1.0 + 0.19 (admin. fees)
3.3 n.a. No contribution
1974 Means-and pension-tested non-
contributory pension (social assistance) 67
65 65 No contribution 5.0 No contribution Provides subsidies
Cuba 1963 Social insurance 65 60 1.0 to 5.0 12.5 (public sector); – 14.5 (private sector)
Special system Any deficit 100.0 100.0 51.0 41.2 0.0 0.0 49.0 58.8
… Means- and pension-tested non-
contributory pension (social assistance)
65 60 No contribution No contribution No contribution Total cost
Dominica 1970 Social insurance 62 62 5.0 6.8 11.0 No contribution 50.2 39.8 50.2 39.8 … … 0.0 0.0

72 S
ocial protection for older persons: Policy trends and statistics 2017-19
Country/ Territory
Dat
e o
f fi
rst
law
/yea
r in
tro
du
ced
Type of programme a
Pensionable age a Contribution rates: Old-age, disability, survivors a Estimate of legal coveragea for old age as a percentage of the working-age population
Total * Contributory mandatory
Contributory voluntary
Non- contributory
Men Women 2 Insured person Employer Self-employed Financing from Government
Total Women Total Women Total Women Total Women
Dominican Republic 10
1947 Mandatory individual accounts
60 60 2.9 7.1 n.a. Partially finances the guaranteed
minimum pension and the value of
accrued rights for those who made
contributions under the old
social insurance system
… … … … … … … …
… Means-tested non-contributory pension (social assistance)
60 60 No contribution No contribution No contribution Total cost
Ecuador 11 1928 Social insurance up to age 70 (depending
on months of contri-butions)
up to age 70 (depending
on months of contri-butions)
6.64 (public sector); 8.64
(private sector)
1.10 (private sector); 3.1 (public
sector)
9.74+ 1 (special disability pension)
40% of the cost of old-age, disability,
and survivor social insurance
pensions
100.0 100.0 62.9 46.7 37.0 53.2 37.0 53.2
2003 Means- and pension-tested non-
contributory pension (social assistance)
65 65 No contribution No contribution No contribution Total cost
El Salvador 12 1953 Social insurance (phasing out) and
mandatory individual account
60 55 6.3 4.6 13.0 Total cost of the guaranteed
minimum pension
100.0 100.0 36.0 21.9 20.2 19.8 43.7 58.1
2009 Means- and pension-tested non-
contributory pension (social assistance)
70 70 No contribution No contribution No contribution Total cost
French Guiana … … … … … … … … … … … … … … … …
Grenada 1969 Social insurance 60 60 4.0 4.0 (+1.0 if younger than 16 and 60 or older)
8.0 (6.75 if voluntarily insured)
No contribution 51.9 41.8 51.9 41.8 … … 0.0 0.0
Guadeloupe … … … … … … … … … … … … … … … …

Social protection for older persons: P
olicy trends and statistics 2017-19 73
Country/ Territory
Dat
e o
f fi
rst
law
/yea
r in
tro
du
ced
Type of programme a
Pensionable age a Contribution rates: Old-age, disability, survivors a Estimate of legal coveragea for old age as a percentage of the working-age population
Total * Contributory mandatory
Contributory voluntary
Non- contributory
Men Women 2 Insured person Employer Self-employed Financing from Government
Total Women Total Women Total Women Total Women
Guatemala 1969 Social insurance 60 60 1.8 3.7 5.5 25% of total contributions paid
100.0 100.0 59.2 23.8 22.3 19.3 18.5 56.9
2005 Means-tested non-contributory pension (social assistance)
65 65 No contribution No contribution No contribution Total cost
Guyana 1944 Social insurance 60 60 5.6 8.4 (+ 1.5 if younger than 16.0 or older than 60.0)
12.5 Covers any deficit 100.0 100.0 56.5 38.2 … … 100.0 100.0
1944 Universal non-contributory pension (social assistance)
65 65 No contribution No contribution No contribution Total cost
Haiti 1965 Social insurance 55 55 6.0 6.0 n.a. Subsidies as needed
7.0 4.7 7.0 4.7 … … 0.0 0.0
Honduras 13 1959 Social insurance 65 60 2.5 3.5 4.0 At least 0.5% of the total insured and employer contributions
76.7 48.3 76.7 48.3 … … 0.0 0.0
Jamaica 1965 Social insurance 65 64 and 9 months
2.5 (J$100.0 a week for
household workers and voluntarily
insured)
2.5 (J$100.0 a week for
household workers)
5.0 No contribution 100.0 100.0 57.3 49.6 … … 42.7 50.4
2001 Means- and pension-tested non-
contributory pension
60 60 No contribution No contribution No contribution Total cost
Martinique 1943 Social insurance and mandatory individual
account
65 65 1.125 + 0.625 (disability and
survivors)
5.15 + 1.75 (disability and
survivors)
6.275+ 2.375 (disability and
survivors)
Subsidizes individual
accounts and finances the guaranteed minimum pension51
100.0 100.0 44.0 31.7 17.2 12.0 38.8 56.3
2001 Pension-tested non-contributory pension (social assistance)
65 65 No contribution No contribution Total cost

74 S
ocial protection for older persons: Policy trends and statistics 2017-19
Country/ Territory
Dat
e o
f fi
rst
law
/yea
r in
tro
du
ced
Type of programme a
Pensionable age a Contribution rates: Old-age, disability, survivors a Estimate of legal coveragea for old age as a percentage of the working-age population
Total * Contributory mandatory
Contributory voluntary
Non- contributory
Men Women 2 Insured person Employer Self-employed Financing from Government
Total Women Total Women Total Women Total Women
Nicaragua 15 1956 Social insurance 60 60 4.0 9.5 10.0 No contribution 60.8 53.5 35.4 28.5 25.4 18.1 0.0 0.0
1941 Social insurance only
62 57 9.3 4.3 13.5 A deposit of NIO 140 million a year to a reserve
fund
100.0 100.0 46.8 50.9 … … 53.2 49.1
2010 Social insurance and individual account
62 57 9.3 4.3 n.a. 0.8% of all insured persons’ earnings
and annual subsidy of
NIO 20.5 million
2010 Individual account only
62 57 n.a. n.a. 13.5 (of 52% of gross annual
earnings)
No contribution
2010 Means- and pension-tested non-
contributory pension (social assistance)
65 65 No contribution No contribution No contribution Total cost
Paraguay 1943 Social insurance 60 60 9.0 14.0 12.5 + 0.5 (admin. fees)
1.5% of gross earnings
100.0 100.0 41.2 33.0 29.0 25.0 29.8 42.0
2009 Means- and pension-tested non-
contributory pension (social assistance)
65 65 No contribution No contribution No contribution Total cost
Peru 16 1936 Social insurance 65 65 13.0 No contribution 13.0 Cost of minimum pension and subsidies as
needed
100.0 100.0 64.1 49.8 8.6 12.0 27.3 38.2
1992 Individual account 65 65 10.0 (old age) + 1.23 (disability and survivors) + 1.25
(admin. fees)
No contribution 10.0 (old age) + 0.96 (disability and survivors) + 1.25
(admin. fees)
Finances the value of accrued rights under the social insurance system (for those who changed to
individual accounts)

Social protection for older persons: P
olicy trends and statistics 2017-19 75
Country/ Territory
Dat
e o
f fi
rst
law
/yea
r in
tro
du
ced
Type of programme a
Pensionable age a Contribution rates: Old-age, disability, survivors a Estimate of legal coveragea for old age as a percentage of the working-age population
Total * Contributory mandatory
Contributory voluntary
Non- contributory
Men Women 2 Insured person Employer Self-employed Financing from Government
Total Women Total Women Total Women Total Women
2011 Means- and pension-tested non-
contributory pension (social assistance)
65 65 No contribution No contribution Total cost
Puerto Rico … … … … … … … … … … … … … … … …
Saint Kitts and Nevis
1968 Social insurance 62 62 5.0 5.0 10.0 No contribution 100.0 100.0 56.9 35.1 … … 43.1 64.9
1998 Means- and pension-tested non-
contributory pension (social assistance)
62 62 No contribution No contribution No contribution Total cost
Saint Lucia 1970 Social insurance 65 65 5.0 5.0 Contributions vary according to wage
categories
No contribution 63.2 51.6 63.2 51.6 … … 0.0 0.0
Saint Vincent and the Grenadines
1970 Social insurance 60 60 4.5 5.5 9.5 No contribution 100.0 100.0 60.8 48.6 … … 39.2 51.4
2009 Means- and pension-tested non-
contributory pension (social assistance, Elderly Assistance
Benefit)
75 75 No contribution No contribution No contribution Total cost
2009 Means- and pension-tested non-
contributory pension (social assistance, non-contributory Assistance Age
Pension)
85 85 No contribution No contribution No contribution Total cost
Suriname 1973 Universal non-contributory pension
60 60 No contribution No contribution No contribution Total cost 100.0 100.0 0.0 0.0 0.0 0.0 100.0 100.0
Trinidad and Tobago
1939 Social insurance 60 60 4 .0 (11.4 if voluntarily insured)
8.0 n.a. No contribution 100.0 100.0 53.8 48.9 … … 46.2 51.1
… Mandatory occupational pension
60 60 5.0 or 6.0 (depending on
plan)
5.0 or 6.0 (depending on
plan)
n.a. No contribution
1939 Means-tested non-contributory pension (social assistance)
65 65 No contribution No contribution No contribution Total cost

76 S
ocial protection for older persons: Policy trends and statistics 2017-19
Country/ Territory
Dat
e o
f fi
rst
law
/yea
r in
tro
du
ced
Type of programme a
Pensionable age a Contribution rates: Old-age, disability, survivors a Estimate of legal coveragea for old age as a percentage of the working-age population
Total * Contributory mandatory
Contributory voluntary
Non- contributory
Men Women 2 Insured person Employer Self-employed Financing from Government
Total Women Total Women Total Women Total Women
Uruguay 17 1995 Social insurance and individual account
60 60 15.0 No contribution 15.0 No contribution 100.0 100.0 69.5 61.8 0.7 13.5 29.8 24.7
1829 Social insurance only
60 60 15.0 7.5 15.0 Any deficit
1919 Means-tested non-contributory pension (social assistance)
70 70 No contribution No contribution No contribution Total cost
Venezuela, Bolivarian Rep. of
1940 Social insurance 60 55 4.0 (private sector); 2.0 (public sector)
9.0 -11.0 (depending on
assessed degree of risk)
13.0 A least 1.5% of total covered
earnings to cover the cost of
administration
100.0 100.0 39.1 32.2 7.5 8.6 53.3 59.0
2011 Means-tested non-contributory pension (social assistance)
60 55 No contribution No contribution No contribution Total cost
Northern America
Canada 18 1952 Social insurance 65 65 4.95 (5.35 in Quebec)
4.95 (5.35 in Quebec)
9.9 (10.65 in Quebec)
No contribution 100.0 100.0 75.7 72.2 0.0 0.0 100.0 100.0
1927 Means-tested non-contributory pension
65 65 No contribution No contribution No contribution Total cost
United States 1935 Social insurance 66 66 6.2 6.2 12.4 Contributes to the Trust Fund from earmarked taxes on social security
benefit
100.0 100.0 73.6 67.8 … … 26.4 32.2
1935 Means-tested non-contributory pension (social assistance)
65 65 No contribution No contribution No contribution Total cost
ARAB STATES
Bahrain 1976 Social insurance 60 55 6.0 (15.0 if voluntarily insured)
9.0 15.0 Voluntary basis
No contribution 69.9 38.5 67.7 38.0 2.2 0.3 0.0 0.0

Social protection for older persons: P
olicy trends and statistics 2017-19 77
Country/ Territory
Dat
e o
f fi
rst
law
/yea
r in
tro
du
ced
Type of programme a
Pensionable age a Contribution rates: Old-age, disability, survivors a Estimate of legal coveragea for old age as a percentage of the working-age population
Total * Contributory mandatory
Contributory voluntary
Non- contributory
Men Women 2 Insured person Employer Self-employed Financing from Government
Total Women Total Women Total Women Total Women
Iraq 1956 Social insurance 60 55 4.1 9.9 (15.0 for the oil sector)
n.a. May provide a subsidy
100.0 100.0 21.0 5.9 0.0 0.0 79.0 94.1
2014 Means- and pension-tested non-contributory
allowance (social assistance)
60 55 n.a. n.a. n.a. Total cost
Jordan 1978 Social insurance 60 55 6.5 (17.5 if voluntarily insured)
11.0 (+1.0 for hazardous
professions)
17.5 Any deficit 35.5 13.4 35.5 13.4 … … 0.0 0.0
Kuwait 19,20 1976 Social insurance: Basic system
51 51 5.0 10.0 5.0–15.0 (according to
27 income levels)
10.0-32.5 71.0 46.1 71.0 46.1 0.0 0.0 0.0 0.0
1992 Social insurance: Supplementary
system
51 51 5.0 10.0 n.a. 10
2014 Social insurance: Remuneration
system
51 51 2.5 No contribution 2.5 5
Lebanon 1963 Social insurance (lump-sum benefits
only)
60-64 60-64 No contribution 8.5 n.a. No contribution 30.7 18.7 30.7 18.7 0.0 0.0 0.0 0.0
Oman 1991 Social insurance 60 55 7.0 10.5 6.5–16.0 (depending on income level)
5.5% of monthly salary; between 4.0% and 13.5% for self-employed
(depending on income level;
highest contributions for lowest income
level)
27.5 10.6 27.5 10.6 … … 0.0 0.0
Qatar 2002 Social insurance 60 60 5.0 10.0 n.a. Covers admin. costs
and any deficit
… … … … … … … …
Saudi Arabia 1969 Social insurance 58 53 9.0 9.0 18.0 Voluntary basis
Any actuarial deficit
20.8 7.9 17.1 7.7 3.7 0.2 0.0 0.0

78 S
ocial protection for older persons: Policy trends and statistics 2017-19
Country/ Territory
Dat
e o
f fi
rst
law
/yea
r in
tro
du
ced
Type of programme a
Pensionable age a Contribution rates: Old-age, disability, survivors a Estimate of legal coveragea for old age as a percentage of the working-age population
Total * Contributory mandatory
Contributory voluntary
Non- contributory
Men Women 2 Insured person Employer Self-employed Financing from Government
Total Women Total Women Total Women Total Women
Syrian Arab Republic
1959 Social insurance 60 55 7.0 14.1 21.1 No contribution 36.9 10.0 36.9 10.0 … … 0.0 0.0
Yemen 1980 Social insurance 60 55 6.0 9.0 n.a. No contribution 25.8 8.6 25.8 8.6 0.0 0.0 0.0 0.0
ASIA AND THE PACIFIC
Eastern Asia
China 21,22 1951 Social insurance and individual accounts for urban workers
(Basic Old-age Insurance Scheme for Urban Workers)
60 60 (professional women); 55
(nonprofessional salaried women); 50
(other female workers)
No contribution (social insurance)
or 8 (individual accounts)
Up to 20% of payroll (social
insurance) or no contribution (individual accounts)
12 (social insurance) or 8
(individual accounts)
Central and local governments
provide subsidies as needed
100.0 100.0 49.8 43.8 50.2 56.2 0.0 0.0
2011 Non-contributory pension and
individual account schemes for rural and non-salaried urban residents
60 60 No contribution (non-contributory
pensions) or voluntary basis
(individual accounts)
n.a. No contribution (non-contributory
pensions) or voluntary basis
(individual accounts)
At least 70.0 yuan (tax-funded) or
50% of the cost, depending on region (non-contributory pensions); 30 yuan
(individual accounts)
Hong Kong, China
1995 Mandatory occupational pension
(Private provident funds)
65 65 5.0 5.0 5.0 No contribution 100.0 100.0 68.7 62.3 0.0 0.0 100.0 100.0
1973 Universal non-contributory pension
(Fruit Money)
70 70 No contribution No contribution No contribution Total cost
1973 Means- and pension-tested non-
contributory pension
65 65 No contribution No contribution No contribution Total cost
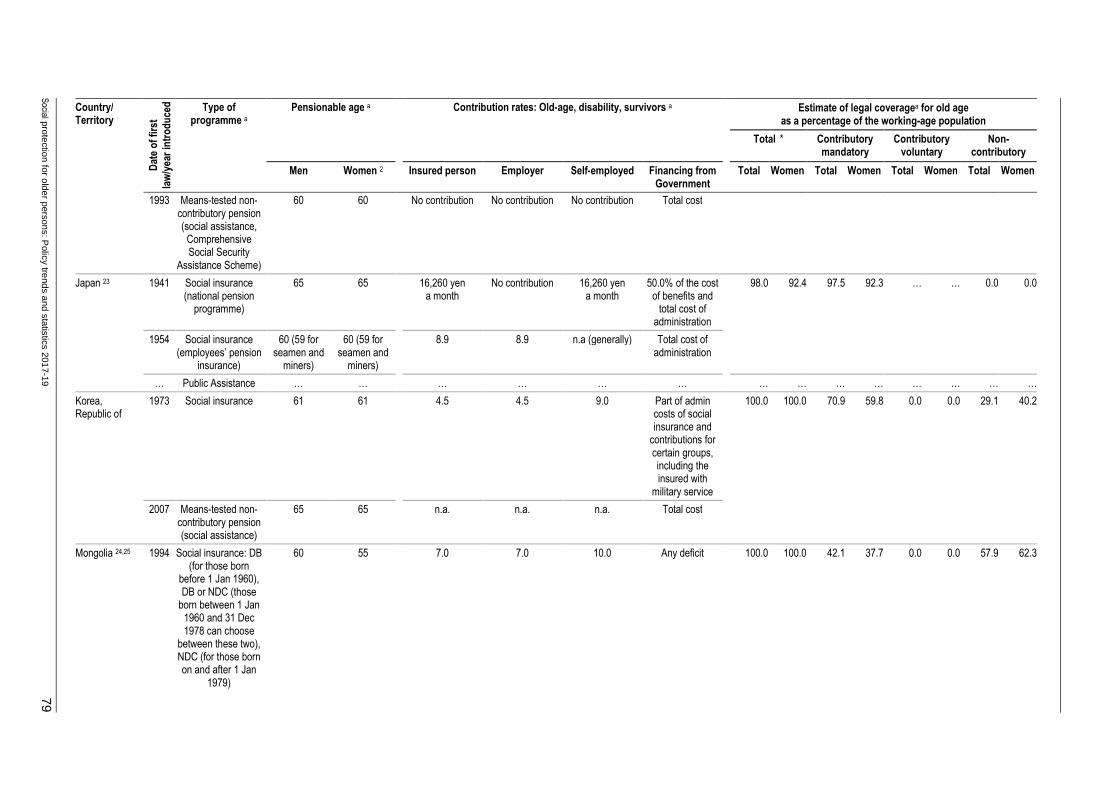
Social protection for older persons: P
olicy trends and statistics 2017-19 79
Country/ Territory
Dat
e o
f fi
rst
law
/yea
r in
tro
du
ced
Type of programme a
Pensionable age a Contribution rates: Old-age, disability, survivors a Estimate of legal coveragea for old age as a percentage of the working-age population
Total * Contributory mandatory
Contributory voluntary
Non- contributory
Men Women 2 Insured person Employer Self-employed Financing from Government
Total Women Total Women Total Women Total Women
1993 Means-tested non-contributory pension (social assistance,
Comprehensive Social Security
Assistance Scheme)
60 60 No contribution No contribution No contribution Total cost
Japan 23 1941 Social insurance (national pension
programme)
65 65 16,260 yen a month
No contribution 16,260 yen a month
50.0% of the cost of benefits and
total cost of administration
98.0 92.4 97.5 92.3 … … 0.0 0.0
1954 Social insurance (employees’ pension
insurance)
60 (59 for seamen and
miners)
60 (59 for seamen and
miners)
8.9 8.9 n.a (generally) Total cost of administration
… Public Assistance … … … … … … … … … … … … … …
Korea, Republic of
1973 Social insurance 61 61 4.5 4.5 9.0 Part of admin costs of social insurance and
contributions for certain groups, including the insured with
military service
100.0 100.0 70.9 59.8 0.0 0.0 29.1 40.2
2007 Means-tested non-contributory pension (social assistance)
65 65 n.a. n.a. n.a. Total cost
Mongolia 24,25 1994 Social insurance: DB (for those born
before 1 Jan 1960), DB or NDC (those
born between 1 Jan 1960 and 31 Dec 1978 can choose
between these two), NDC (for those born on and after 1 Jan
1979)
60 55 7.0 7.0 10.0 Any deficit 100.0 100.0 42.1 37.7 0.0 0.0 57.9 62.3

80 S
ocial protection for older persons: Policy trends and statistics 2017-19
Country/ Territory
Dat
e o
f fi
rst
law
/yea
r in
tro
du
ced
Type of programme a
Pensionable age a Contribution rates: Old-age, disability, survivors a Estimate of legal coveragea for old age as a percentage of the working-age population
Total * Contributory mandatory
Contributory voluntary
Non- contributory
Men Women 2 Insured person Employer Self-employed Financing from Government
Total Women Total Women Total Women Total Women
1995 Social welfare: Pension-tested non-contributory pension
60 55 No contribution No contribution No contribution Total cost
Taiwan, China 1950 Social insurance: National pension
65 65 5.1 No contribution 5.1 3.4 100.0 100.0 40.6 32.2 13.5 12.1 45.9 55.7
1950 Social insurance: Labour Insurance
Programme
60 60 1.8 6.7 5.7 0.95
1950 Mandatory individual account
60 60 Up to 6.0 Voluntary basis
At least 6.0 Up to 6.0 Voluntary basis
No contribution
2007 Means- and pension-tested non-
contributory pension (social assistance)
65 65 No contribution No contribution No contribution Total cost
South-Eastern Asia
Brunei Darussalam
1955 Provident fund 55 55 5.0 5.0 n.a. No contribution 100.0 100.0 62.5 50.6 3.2 2.0 100.0 100.0
1955 Supplementary individual account
scheme
60 60 3.5 3.5 Flat rate of BND 17.50/
month
Any deficit and supplements
contributions for low-income
employees and self-employed
1984 Universal non-contributory pension
60 60 No contribution No contribution No contribution Total cost
Cambodia 26 1994 Social insurance 55 55 No contribution No contribution No contribution Total cost 0.0 0.0 0.0 0.0 0.0 0.0 0.0 0.0
Indonesia 27,28 1977 Provident fund (Jaminan Hari Tua)
56 56 2.0 3.7 n.a. No contribution 69.7 65.9 3.8 0.0 0.0
2004 DB pension scheme (private sector
workers, Jaminan pensiun)
56 56 1.0 2.0 n.a. No contribution

Social protection for older persons: P
olicy trends and statistics 2017-19 81
Country/ Territory
Dat
e o
f fi
rst
law
/yea
r in
tro
du
ced
Type of programme a
Pensionable age a Contribution rates: Old-age, disability, survivors a Estimate of legal coveragea for old age as a percentage of the working-age population
Total * Contributory mandatory
Contributory voluntary
Non- contributory
Men Women 2 Insured person Employer Self-employed Financing from Government
Total Women Total Women Total Women Total Women
2006 Means- tested non-contributory pension (social assistance,
Asistensi Sosial Usia Lanjut)
70 (60 if chronically ill)
70 (60 if chronically ill)
n.a. n.a. n.a. Total cost
Lao People’s Dem. Rep.
1999 Social insurance 60 55 2.5 (6.0 for civil servants, police
and military personnel)
2.5 5.0 Voluntary basis
No contribution 80.5 85.8 13.8 13.8 66.7 72.0 0.0 0.0
Malaysia 29 1951 Social insurance 55 55 0.5 (according to 45 wage classes)
0.5 (according to 45 wage classes)
50-5 000 ringgits a month
No contribution 100.0 100.0 48.6 38.1 14.5 13.2 36.9 48.6
Provident Fund 55 55 8.0 13.0 n.a. Matches 10% of contributions up to 120 ringgits a year for self-employed and household
workers
… Means-tested non-contributory pension (social assistance)
60 60 No contribution No contribution No contribution Total cost
Myanmar 2012 Social insurance 60 60 3.0 3.0 6.0 No contribution … … … … … … … …
Philippines 1954 Social insurance 60 60 3.6 7.4 11.0 Any deficit 100.0 100.0 57.5 43.7 … … 42.5 56.3
2011 Means-tested non-contributory pension (social assistance)
60 60 No contribution No contribution No contribution Total cost
Singapore 1953 Provident Fund 55 55 20.0 17.0 4.0-10.5 (depending on age
and earnings)
No contribution 100.0 100.0 65.4 62.0 … … 34.6 38.0
2015 Means-tested (social assistance, Silver Support Scheme)
65 65 No contribution No contribution No contribution Total cost
Thailand 30,31 1990 Social insurance: formal-sector
pension
55 55 3.0 3.0 An annual flat rate of THB 5,184
1% of the insured’s monthly
earnings
100.0 100.0 36.3 32.2 38.9 37.9 100.0 100.0

82 S
ocial protection for older persons: Policy trends and statistics 2017-19
Country/ Territory
Dat
e o
f fi
rst
law
/yea
r in
tro
du
ced
Type of programme a
Pensionable age a Contribution rates: Old-age, disability, survivors a Estimate of legal coveragea for old age as a percentage of the working-age population
Total * Contributory mandatory
Contributory voluntary
Non- contributory
Men Women 2 Insured person Employer Self-employed Financing from Government
Total Women Total Women Total Women Total Women
2011 Social insurance and national savings
fund: Informal sector pension
60 60 n.a. n.a. THB 100 a month Voluntary basis
50–100% of the insured’s
contributions (depending on the
insured’s age)
1993 Pension-tested non-contributory pension (social assistance)
60 60 No contribution No contribution No contribution Total cost
Timor-Leste 2008 Universal non-contributory pension
60 60 No contribution No contribution No contribution Total cost 100.0 100.0 … … … … 100.0 100.0
2012 Non-contributory pension 32
60 60 … … … …
2016 Social Insurance 60 60 … … … …
Viet Nam 33 1961 Social insurance 60 55 8.0 14.0 22.0 Voluntary basis
Subsidies as needed
100.0 100.0 33.1 27.6 66.9 72.4 66.9 72.4
2004 Means-tested non-contributory pension/
Pension-tested above 80
60, 80 60, 80 No contribution No contribution No contribution Total cost
Southern Asia
Bangladesh 1998 Means- and pension-tested non-
contributory pension
65 62 No contribution No contribution No contribution Total cost 2.8 1.5 2.8 1.5 0.0 0.0 0.0 0.0
Bhutan 1976 Provident fund 56 56 5.0 5.0 n.a. No contribution 20.5 9.3 20.5 9.3 0.0 0.0 0.0 0.0
India 1952 Provident Fund 58 58 12.0 3.67 (+ 0.85 for admin costs)
n.a. No contribution 100.0 100.0 10.4 0.8 … … 87.5 95.4
1952 Pension scheme (social insurance)
58 58 No contribution 8.3 n.a. 1.16% of the insured’s basic
wages
… Gratuity schemes for industrial workers (lump-sum benefit
– employer liability)
… … No contribution 4.0 n.a. No contribution

Social protection for older persons: P
olicy trends and statistics 2017-19 83
Country/ Territory
Dat
e o
f fi
rst
law
/yea
r in
tro
du
ced
Type of programme a
Pensionable age a Contribution rates: Old-age, disability, survivors a Estimate of legal coveragea for old age as a percentage of the working-age population
Total * Contributory mandatory
Contributory voluntary
Non- contributory
Men Women 2 Insured person Employer Self-employed Financing from Government
Total Women Total Women Total Women Total Women
1995 Means-tested non-contributory pension (social assistance)
60 60 n.a. n.a. n.a. Total cost
Iran, Islamic Rep. of
1953 Social insurance 60 55 5.0 (9.5 for commercial
drivers)
14.0 18.0 (12.0 for partial benefit)
2.0% of earnings for employed, self-
employed and voluntarily insured persons; 9.5% for
commercial drivers. The Government
pays the employer’s
contributions for up to five employees per company for certain strategic
industries
38.6 12.4 38.6 12.4 … … 0.0 0.0
Maldives 2009 Social Insurance 65 65 n.a. n.a. n.a. Total cost … … … … … … … …
2010 Pension-tested non-contributory pension (social assistance)
65 65 No contribution No contribution No contribution Total cost
Nepal 1962 Provident Fund (government employees;
voluntary coverage for firms with at least
10 employees)
58 58 10.0 10.0 n.a. No contribution 100.0 100.0 2.0 0.8 … … 70.9 70.4
1995 Pension-tested non-contributory pension (social assistance)
70 (60 in some areas)
70 (60 in some areas)
No contribution No contribution No contribution Total cost
Pakistan 1976 Social insurance 60 55 1.0 5.0 n.a. No contribution 21.0 4.9 21.0 4.9 … … 0.0 0.0
Sri Lanka 1958 Provident Fund 55 50 8.0 12.0 … (certain groups covered)
No contribution 42.7 45.8 32.9 29.3 9.8 16.6 0.0 0.0
1980 Trust fund (supplementary
pension)
60 60 No contribution 3.0 At least 25 rupees a month
No contribution

84 S
ocial protection for older persons: Policy trends and statistics 2017-19
Country/ Territory
Dat
e o
f fi
rst
law
/yea
r in
tro
du
ced
Type of programme a
Pensionable age a Contribution rates: Old-age, disability, survivors a Estimate of legal coveragea for old age as a percentage of the working-age population
Total * Contributory mandatory
Contributory voluntary
Non- contributory
Men Women 2 Insured person Employer Self-employed Financing from Government
Total Women Total Women Total Women Total Women
Oceania
Australia 1908 Mandatory occupational pension
system (superannuation)
56 56 Voluntary basis 9.5 Voluntary basis Co-contribution: Matches AUD 0.50 for each AUD 1.0 of the insured’s
voluntary contributions from at least AUD 20 up to AUD 500 a year for annual after-tax
incomes up to AUD 36,021
100.0 100.0 62.4 60.8 12.8 5.8 24.8 33.4
1908 Means-tested non-contributory pension
65 65 No contribution No contribution No contribution The total cost
Cook Islands 1966 Universal non-contributory pension
60 60 No contribution No contribution No contribution Total cost 100.0 100.0 … … 0.0 0.0 100.0 100.0
Fiji 34 1966 Provident fund 55 55 8.0 10.0 An annual contribution of at
least FJD 84
No contribution 100.0 100.0 31.0 36.0 … … 69.0 64.0
2000 Pension-tested non-contributory pension (social assistance)
68 68 No contribution No contribution No contribution Total cost
Kiribati 34 1976 Provident fund 50 50 7.5 7.5 At least A$5 a month
No contribution 100.0 100.0 20.8 15.4 … … 100.0 100.0
2003 Universal non-contributory pension
65 65 No contribution No contribution No contribution Total cost
Marshall Islands 34
1967 Social insurance 60 60 7.0 7.0 14.0% of 75.0% of gross income
No contribution 55.0 33.3 55.0 33.3 0.0 0.0 0.0 0.0
Micronesia, Federated States of 35
1968 Social insurance 65 65 7.5 7.5 5.0 No contribution … … … … … … … …
Niue … … 60 60 … … … … … … … … … … … …
New Zealand 1898 Universal non-contributory pension
65 65 No contribution No contribution No contribution Total cost 100.0 100.0 0.0 0.0 0.0 0.0 100.0 100.0
Palau 36 1967 Social insurance 62 62 6.0 6.0 12.0 No contribution … … … … … … … …

Social protection for older persons: P
olicy trends and statistics 2017-19 85
Country/ Territory
Dat
e o
f fi
rst
law
/yea
r in
tro
du
ced
Type of programme a
Pensionable age a Contribution rates: Old-age, disability, survivors a Estimate of legal coveragea for old age as a percentage of the working-age population
Total * Contributory mandatory
Contributory voluntary
Non- contributory
Men Women 2 Insured person Employer Self-employed Financing from Government
Total Women Total Women Total Women Total Women
Papua New Guinea 34
1980 Mandatory occupational
retirement system
55 55 6.0 8.4 At least 20.0 kina a month
No contribution 6.2 34.7 6.2 34.7 32.6 36.3 0.0 0.0
2009 Universal non-contributory scheme
(Old Age and Disabled Pension
Scheme (New Ireland only)c
60 60 … … … …
Samoa 34,37 1972 Provident fund with -annuity option
55 55 7.0 7.0 100 – 2,000 tala a month
Voluntary basis
No contribution 100.0 100.0 21.4 15.1 9.0 10.5 100.0 100.0
1990 Universal non-contributory pension (social assistance)
65 65 No contribution No contribution No contribution Total cost
Solomon Islands 34
1973 Provident fund 50 50 5.0 7.5 … Voluntary basis
No contribution 10.1 5.5 10.1 5.5 0.0 0.0 0.0 0.0
Tonga … … … … … … … … … … … … … … … …
Tuvalu … Non-contributory pension
70 70 No contribution No contribution No contribution Total cost 100.0 100.0 0.0 0.0 0.0 0.0 100.0 100.0
Vanuatu 34 1986 Provident fund 55 55 4.0 4.0 1 000–10 000 vatu a month
No contribution 100.0 100.0 20.5 15.2 79.5 84.8 0.0 0.0
EUROPE AND CENTRAL ASIA
Northern, Southern and Western Europe
Albania 1947 Social insurance 65 60 8.8 12.8 21.6; a flat rate if working in agriculture
Any deficit; pays contributions for certain groups
38.3 28.0 38.3 28.0 … … 0.0 0.0
2015 Pension- and means- tested non-contributory pension (social assistance)
70 70 No contribution No contribution No contribution Total cost

86 S
ocial protection for older persons: Policy trends and statistics 2017-19
Country/ Territory
Dat
e o
f fi
rst
law
/yea
r in
tro
du
ced
Type of programme a
Pensionable age a Contribution rates: Old-age, disability, survivors a Estimate of legal coveragea for old age as a percentage of the working-age population
Total * Contributory mandatory
Contributory voluntary
Non- contributory
Men Women 2 Insured person Employer Self-employed Financing from Government
Total Women Total Women Total Women Total Women
Andorra 1966 Social insurance 65 65 5.5 14.5 18.0 Any deficit … … … … … … … …
1966 Means-tested non-contributory pension (social assistance)
65 (60 if receiving a
survivor pension)
65 (60 if receiving a
survivor pension)
No contribution No contribution No contribution Total cost
Austria 1906 Social insurance 65 60 10.3 12.6 Special system A subsidy and the cost of the care
benefit and income-tested
allowance
72.9 68.7 72.9 68.7 0.0 0.0 0.0 0.0
1978 Means- and pension-tested
noncontributory pension (Austrian
Compensatory Supplement)
65 60 … … … …
Belgium 1900 Social insurance 65 65 7.5 8.9 n.a. Annual subsidies 100.0 100.0 62.9 52.2 0.0 0.0 37.1 47.8
2001 Means-tested non-contributory pension
65 65 No contribution No contribution No contribution Total cost
Bosnia and Herzegovina
… Social insurance 65 65 17.0 7.0 …. … … … … … … … …
Croatia 38 1922 Social insurance and mandatory individual
account
65 61 and 6 months
20.0 No contribution (except for
employees in arduous or unhealthy
occupations)
20.0 Pays contribution for categories of state employees
51.8 49.3 51.8 49.3 0.0 0.0 0.0 0.0
Denmark 39 1891 Social insurance 65 65 Set amount Set amount Set amount No contribution 100.0 100.0 70.3 69.2 … … 100.0 100.0
1891 Universal 65 65 No contribution No contribution No contribution Total cost
Estonia 40 1924 Social insurance 63 63 No contribution 16.0 16.0 Pension supplements and
allowances for some categories of insured persons; and the cost of funeral grants
100.0 100.0 62.9 73.2 … … 37.1 26.8

Social protection for older persons: P
olicy trends and statistics 2017-19 87
Country/ Territory
Dat
e o
f fi
rst
law
/yea
r in
tro
du
ced
Type of programme a
Pensionable age a Contribution rates: Old-age, disability, survivors a Estimate of legal coveragea for old age as a percentage of the working-age population
Total * Contributory mandatory
Contributory voluntary
Non- contributory
Men Women 2 Insured person Employer Self-employed Financing from Government
Total Women Total Women Total Women Total Women
2004 Mandatory individual account
63 63 2.0 4.0 4.0 No contribution
… Pension-tested non--contributory pension (social assistance)
63 63 No contribution No contribution No contribution Total cost
Faeroe Islands … Universal non-contributory pension
67 67 No contribution No contribution No contribution Total cost … … … … … … … …
Finland 1937 Mandatory occupational pension
(earnings-related pension)
63-68 (flexible retirement)
63-68 (flexible retirement)
5.7 18.0 Special system No contribution 100.0 100.0 70.7 69.3 0.0 0.0 29.3 30.7
1937 Means-tested non-contributory pension (National Pension)
65 65 No contribution No contribution No contribution Total cost
2010 Means-tested non-contributory
pension (Guarantee Pension)
65 65 No contribution No contribution No contribution …
France 41 1928 Social insurance 61 and 7 months
(legal minimum age)
61 and 7 months
(legal minimum age)
6.9 (old age) + 0.35 (survivor
allowance)
8.55 (old age) + 1.85 (survivor
allowance)
Special system Variable subsidies 100.0 100.0 71.4 61.6 10.1 9.9 18.5 28.5
1947 Mandatory complementary
schemes
3.0-8.0 (depending on the scheme)
4.65-12.75 (depending on the scheme)
n.a. No contribution
1956 Means-tested non-contributory
pension
65 65 No contribution No contribution No contribution Total cost (a portion of
revenues from the general social contribution
(CSG))

88 S
ocial protection for older persons: Policy trends and statistics 2017-19
Country/ Territory
Dat
e o
f fi
rst
law
/yea
r in
tro
du
ced
Type of programme a
Pensionable age a Contribution rates: Old-age, disability, survivors a Estimate of legal coveragea for old age as a percentage of the working-age population
Total * Contributory mandatory
Contributory voluntary
Non- contributory
Men Women 2 Insured person Employer Self-employed Financing from Government
Total Women Total Women Total Women Total Women
Germany 1889 Social insurance 65 and 5 months (67 if born after
1963)
65 and 5 months (67 if born after
1963)
9.3 9.3 18.7 Subsidizes certain benefits and pays contributions for
caregivers providing unpaid care for at least 14 hours a week
100.0 100.0 76.4 72.0 23.5 27.9 0.1 0.1
2003 Means-tested non-contributory pension (social assistance)
65 65 No contribution No contribution No contribution Total cost
Greece 1934 Social insurance (national old-age
pension and contributory pension)
67 (national pension);
62–67 (contributory
pension, varies
according to contribution
levels)
67 (national pension);
62–67 (contributory
pension, varies
according to contribution
levels)
6.67 (8.87 for arduous or
unhealthy work)
13.33 (14.73 for arduous or
unhealthy work)
20.0 (according to 14.0 insurance
categories)
A guaranteed annual subsidy
100.0 100.0 49.0 43.5 … … 51.0 56.5
1982 Means-tested non-contributory pension (social assistance)
65 65 No contribution No contribution No contribution Total cost
Guernsey 1925 Social insurance 65 65 6.0 (9.9 if unemployed)
6.5 10.5 15.0% of total contributions
… … … … … … … …
1984 Means-tested non-contributory pension (social assistance)
60 60 No contribution No contribution No contribution Total cost
Iceland 42 1909 Mandatory occupational pension
67 67 4.0 8.0 12.0 No contribution 100.0 100.0 91.8 88.2 0.0 0.0 100.0 100.0
1980 Means-tested non-contributory pension
67 (60 for some
seamen)
67 (60 for some
seamen)
No contribution 7.4 7.4 Any deficit
Ireland 1908 Social insurance 66 66 4.0 8.5-10.75 (depending on
employees’ weekly earnings)
4.0 Any deficit 100.0 100.0 67.0 60.8 0.0 0.0 33.0 39.2

Social protection for older persons: P
olicy trends and statistics 2017-19 89
Country/ Territory
Dat
e o
f fi
rst
law
/yea
r in
tro
du
ced
Type of programme a
Pensionable age a Contribution rates: Old-age, disability, survivors a Estimate of legal coveragea for old age as a percentage of the working-age population
Total * Contributory mandatory
Contributory voluntary
Non- contributory
Men Women 2 Insured person Employer Self-employed Financing from Government
Total Women Total Women Total Women Total Women
1908 Means-and pension-tested non-
contributory pension (social assistance)
66 66 No contribution No contribution No contribution Total cost
Isle of Man 1948 Social insurance 65 63 11.0 (weekly flat rate of £14.10 if
voluntarily insured)
12.8 8.0% of annual earnings + a
weekly flat rate of £5.40
No contribution … … … … … … … …
… Means-tested non--contributory pension (social assistance)
80 80 No contribution No contribution No contribution The total cost of means-tested
allowances and other non-
contributory benefits
Italy 1919, 1995
Social insurance (phasing out) and notional defined
contribution (NDC)
66 and 7 months
62 and 7 months
9.19 (9.89 for dancers)
23.81 (25.81 for dancers)
23.1 Any deficit 100.0 100.0 58.5 48.8 … … 41.5 51.2
1969 Means- and pension-tested non-
contributory pension (social assistance)
65 and 7 months
65 and 7 months
No contribution No contribution No contribution Total cost
Jersey 1951 Social insurance 65 65 6.0 6.5 12.5 No contribution … … … … … … … …
Kosovo b 2002 Universal non-contributory pension
65 65 No contribution No contribution No contribution Total cost … … … … … … … …
Latvia 1922 Notional defined contribution (NDC)
and mandatory individual account
62 and 9 months
62 and 9 months
10.5 23.6 30.6 Contributes for certain groups
100.0 100.0 76.3 70.3 23.7 29.7 23.7 23.7
… Pension-tested non--contributory pension (social assistance)
67 and 9 months
67 and 9 months
No contribution No contribution No contribution Total cost
Liechtenstein 43 1952 Social insurance 64 64 4.6 12.8 Flat rate plus percentage for
administration and disability benefits
Contributes 50 million francs
annually
… … … … … … … …
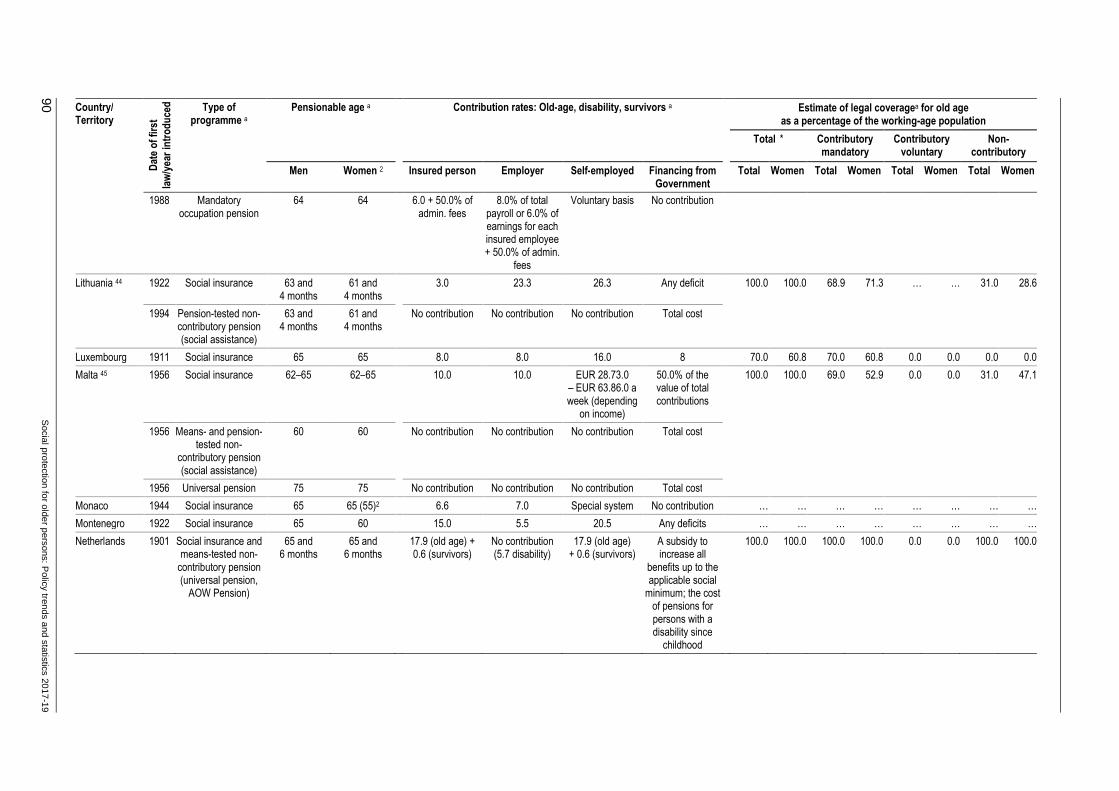
90 S
ocial protection for older persons: Policy trends and statistics 2017-19
Country/ Territory
Dat
e o
f fi
rst
law
/yea
r in
tro
du
ced
Type of programme a
Pensionable age a Contribution rates: Old-age, disability, survivors a Estimate of legal coveragea for old age as a percentage of the working-age population
Total * Contributory mandatory
Contributory voluntary
Non- contributory
Men Women 2 Insured person Employer Self-employed Financing from Government
Total Women Total Women Total Women Total Women
1988 Mandatory occupation pension
64 64 6.0 + 50.0% of admin. fees
8.0% of total payroll or 6.0% of earnings for each insured employee + 50.0% of admin.
fees
Voluntary basis No contribution
Lithuania 44 1922 Social insurance 63 and 4 months
61 and 4 months
3.0 23.3 26.3 Any deficit 100.0 100.0 68.9 71.3 … … 31.0 28.6
1994 Pension-tested non-contributory pension (social assistance)
63 and 4 months
61 and 4 months
No contribution No contribution No contribution Total cost
Luxembourg 1911 Social insurance 65 65 8.0 8.0 16.0 8 70.0 60.8 70.0 60.8 0.0 0.0 0.0 0.0
Malta 45 1956 Social insurance 62–65 62–65 10.0 10.0 EUR 28.73.0 – EUR 63.86.0 a week (depending
on income)
50.0% of the value of total contributions
100.0 100.0 69.0 52.9 0.0 0.0 31.0 47.1
1956 Means- and pension-tested non-
contributory pension (social assistance)
60 60 No contribution No contribution No contribution Total cost
1956 Universal pension 75 75 No contribution No contribution No contribution Total cost
Monaco 1944 Social insurance 65 65 (55)2 6.6 7.0 Special system No contribution … … … … … … … …
Montenegro 1922 Social insurance 65 60 15.0 5.5 20.5 Any deficits … … … … … … … …
Netherlands 1901 Social insurance and means-tested non-
contributory pension (universal pension,
AOW Pension)
65 and 6 months
65 and 6 months
17.9 (old age) + 0.6 (survivors)
No contribution (5.7 disability)
17.9 (old age) + 0.6 (survivors)
A subsidy to increase all
benefits up to the applicable social
minimum; the cost of pensions for persons with a disability since
childhood
100.0 100.0 100.0 100.0 0.0 0.0 100.0 100.0

Social protection for older persons: P
olicy trends and statistics 2017-19 91
Country/ Territory
Dat
e o
f fi
rst
law
/yea
r in
tro
du
ced
Type of programme a
Pensionable age a Contribution rates: Old-age, disability, survivors a Estimate of legal coveragea for old age as a percentage of the working-age population
Total * Contributory mandatory
Contributory voluntary
Non- contributory
Men Women 2 Insured person Employer Self-employed Financing from Government
Total Women Total Women Total Women Total Women
Norway 46,47 1936 Social insurance (old system) and notional defined contribution
62 (flexible) 62 (flexible) 8.2 14.1 11.4 Any deficit 100.0 100.0 77.0 74.9 0.0 0.0 23.0 25.1
1936 Means-tested non-contributory pension
67 67 … … … …
Portugal 1935 Social insurance 66 66 11.0 23.8 29.6 (34.75 for sole proprietors and
owners of certain type of companies)
Partial financing through a portion
of the value-added tax
100.0 100.0 68.3 64.4 … … 31.7 35.6
1980 Means- and pension-tested non-
contributory pension (social assistance)
66 and 2 months
66 and 2 months
No contribution No contribution No contribution Total cost
San Marino 48 1955 Social insurance and mandatory individual
accounts
65 65 5.4 (social insurance) + 1.5
(individual account)
16.1 (social insurance) + 1.5
(individual account)
14.5-22 (social insurance,
depending on income level) + 3.0 (individual account)
5.0% of total contributions
(higher contributions are
made for agricultural
workers) or up to 25.0% to cover
any deficit; subsidies as
needed
65.7 57.5 65.7 57.5 … … 0.0 0.0
Serbia 1922 Social insurance 65 61 14.0 12.0 26.0 Guarantees cash benefits and
covers any deficit
57.9 50.4 57.9 50.4 0.0 0.0 0.0 0.0
Slovenia 49 1922 Social insurance 65 65 15.5 8.9 24.35 (15.5 for certain farmers)
Covers the cost for war veterans
and certain groups of insured
persons; any deficit
100.0 100.0 71.6 63.5 … … 16.5 30.5
1999 Means-tested non-contributory pension
68 68 No contribution No contribution No contribution Total cost

92 S
ocial protection for older persons: Policy trends and statistics 2017-19
Country/ Territory
Dat
e o
f fi
rst
law
/yea
r in
tro
du
ced
Type of programme a
Pensionable age a Contribution rates: Old-age, disability, survivors a Estimate of legal coveragea for old age as a percentage of the working-age population
Total * Contributory mandatory
Contributory voluntary
Non- contributory
Men Women 2 Insured person Employer Self-employed Financing from Government
Total Women Total Women Total Women Total Women
Spain 1919 Social insurance 65 65 4.7 23.6 Special system An annual subsidy 100.0 100.0 60.0 54.7 0.0 0.0 40.0 45.3
1994 Means- and pension-tested non-
contributory pension (social assistance)
65 65 No contribution No contribution No contribution Total cost
Sweden 50 1913 Notional defined contribution (NDC)
and mandatory individual account
61 (flexible) 61 (flexible) 7.0 (old age) + admin. fees
10.21 (old age) + 4.85 (disability) + 1.17 (survivors)
17.21 + admin. fees
The government pays contributions based on notional
income for persons receiving
sickness or disability benefits,
student aid, or cash parental
benefits
100.0 100.0 78.9 77.1 0.0 0.0 21.0 22.8
1913 Means-tested non-contributory pension (social assistance)
65 65 No contribution No contribution No contribution Total cost
Switzerland 1946 Social insurance 65 64 4.2 (old age) + 0.7 (disability)
4.2 (old age) + 0.7 (disability)
4.2–7.8 (depending on income level) +
0.75–1.4 (disability)
Annual federal subsidies cover 19.55% of the cost of old-age and survivors benefits and
37.7% of the cost of disability
benefits
100.0 100.0 100.0 100.0 … … 100.0 100.0
1982 Mandatory occupational pension
65 64 7.0-18 (depending on age)
At least equal to the employee’s
contribution
Varies according to the pension fund
No contribution
1946 Pension-tested non-contributory pension
65 64 No contribution No contribution No contribution Provided by the cantons

Social protection for older persons: P
olicy trends and statistics 2017-19 93
Country/ Territory
Dat
e o
f fi
rst
law
/yea
r in
tro
du
ced
Type of programme a
Pensionable age a Contribution rates: Old-age, disability, survivors a Estimate of legal coveragea for old age as a percentage of the working-age population
Total * Contributory mandatory
Contributory voluntary
Non- contributory
Men Women 2 Insured person Employer Self-employed Financing from Government
Total Women Total Women Total Women Total Women
United Kingdom 51
1908 Social insurance 65 63 12.0 (+ 2.0 for higher earnings)
13.8 Flat rate of £2.80 a week+ 9.0% of declared annual
earnings (+2.0 for higher earnings)
Treasury grant to contributory
programmes for any deficit
100.0 100.0 69.2 70.6 … … 30.8 29.4
1908 Means- and pension-tested non-
contributory pension (social assistance,
Pension Credit)
65 65 No contribution No contribution No contribution The total cost of means-tested old-age pension and
other non--contributory
benefits
1908 Means-tested non-contributory pension (social assistance,
Old-Person’s Pension)
80 80 No contribution No contribution No contribution The total cost of means-tested old-age pension and
other non-contributory
benefits
Eastern Europe
Belarus 1956 Social insurance 60 55 1.0 28.0 (contribution varies according
industry)
29.0 The cost of military personnel
pensions; provides subsidies
as needed
100.0 100.0 70.9 67.6 0.0 0.0 29.1 32.4
… Pension-tested non-contributory pension (social assistance)
65 60 No contribution No contribution No contribution Total cost
Bulgaria 1924 Social insurance 63 and 10 months
60 and 10 months
7.9 9.9 12.8 Any deficit 100.0 100.0 64.8 61.1 0.0 0.0 35.2 38.9
… Mandatory individual account
63 and 10 months
(earlier depending
on the occupation)
60 and 10 months
(earlier depending
on the occupation)
2.2 2.8 5.0 No contribution
… Means-tested non-contributory pension (social assistance)
70 70 No contribution No contribution No contribution Total cost

94 S
ocial protection for older persons: Policy trends and statistics 2017-19
Country/ Territory
Dat
e o
f fi
rst
law
/yea
r in
tro
du
ced
Type of programme a
Pensionable age a Contribution rates: Old-age, disability, survivors a Estimate of legal coveragea for old age as a percentage of the working-age population
Total * Contributory mandatory
Contributory voluntary
Non- contributory
Men Women 2 Insured person Employer Self-employed Financing from Government
Total Women Total Women Total Women Total Women
Czech Republic
1906 Social insurance 63 62 and 4 months
6.5 21.5 28.0 Any deficit 91.5 87.3 71.0 62.7 20.5 24.6 0.0 0.0
Hungary 52 1928 Social insurance & mandatory individual account (voluntary)
63 and 6 months
63 and 6 months
10.0 27.0 10.0 Any deficit 100.0 100.0 70.1 60.7 29.9 39.3 29.9 39.3
1993 Means-tested non-contributory pension (social assistance)
62 62 No contribution No contribution No contribution Total cost
Moldova, Republic of
1956 Social insurance 62 57 6.0 23.0 (22.0 for the agricultural sector)
An annual flat rate of MDL 6,372
(1,584 for agricultural
landowners)
No contribution 100.0 100.0 42.3 31.9 0.0 0.0 57.7 68.1
1956 Pension-tested non-contributory pension (social assistance)
62 57 No contribution No contribution No contribution Total cost
Poland 53,54 1927 –99
Social insurance or notional defined
contribution (NDC)
65 60 9.76 (old age) + 1.5 (disability and
survivors)
9.75 (old age) + 6.5 (disability and
survivors)
19.52 (old age) + 1.5 (disability and
survivors)
Total cost of the guaranteed
minimum pension; pays pension
contributions for certain groups
68.8 58.8 68.8 58.8 … … 0.0 0.0
1999 Notional defined contribution (NDC)
and individual account
65 60 NDC: 6.84 (old age) + 1.5
(disability and survivors)
Ind. account: 2.92 (old age) + 1.75
(admin. fees)
NDC: 9.75 (old age) + 6.5
(disability and survivors)
Ind.account: No contribution
NDC: 16.6 (old age) + 1.5 (admin. fees)
Ind. account: 2.92 (old age) + 1.75
(admin. fees)
The total cost of the guaranteed
minimum pension
… Means- and pension-tested non-
contributory pension (social assistance)
65 60 … … … …

Social protection for older persons: P
olicy trends and statistics 2017-19 95
Country/ Territory
Dat
e o
f fi
rst
law
/yea
r in
tro
du
ced
Type of programme a
Pensionable age a Contribution rates: Old-age, disability, survivors a Estimate of legal coveragea for old age as a percentage of the working-age population
Total * Contributory mandatory
Contributory voluntary
Non- contributory
Men Women 2 Insured person Employer Self-employed Financing from Government
Total Women Total Women Total Women Total Women
Romania 1912 Social insurance and mandatory individual
accounts
65 60 5.4 (social insurance) + 5.1
(individual account) or 10.5
(if social insurance only)
15.8–25.8 (social insurance, varies depending
on profession)
21.2 (social insurance) + 5.1
(individual account) or 26.3
(if social insurance only)
Any deficit 58.3 48.1 58.3 48.1 … … 0.0 0.0
Russian Federation 55
1922 Notional defined contribution (NDC)
60 55 No contribution 22.0 Annual contribution of 17,328.48 rubles
No contribution 100.0 100.0 66.2 62.7 … … 33.8 37.3
… Pension-tested non-contributory pension (social assistance)
65 60 No contribution No contribution The total cost of social pensions.
Regional and local governments may
finance supplementary
benefits
Slovakia 56,57 1906 Social insurance and individual account
62 62 7.0 17.0 (social insurance) + 4.0
(individual account)
24.0 (social insurance) + 4.0
(individual account)
Any deficit 65.4 58.7 65.4 58.7 0.0 0.0 0.0 0.0
Ukraine 1922 Social insurance 60 57 and 6 months
No contribution 22.0 22.0 Subsidies as needed for central
and local governments
100.0 100.0 60.8 56.1 … … 39.2 43.9
… Means- and pension-tested non-
-contributory pension (social assistance)
63 60 and 6 months
No contribution No contribution No contribution The cost of state social benefits
Central and Western Asia
Armenia 58 1956 Social insurance 63 63 Portion of personal income tax
No contribution Portion of personal income tax
Subsidies as needed
100.0 100.0 56.1 48.6 0.0 0.0 43.9 51.4
2014 Mandatory individual account
63 63 5.0 No contribution 5.0 10.0
… Pension-tested non-contributory pension (social assistance)
65 65 n.a. No contribution n.a. Total cost

96 S
ocial protection for older persons: Policy trends and statistics 2017-19
Country/ Territory
Dat
e o
f fi
rst
law
/yea
r in
tro
du
ced
Type of programme a
Pensionable age a Contribution rates: Old-age, disability, survivors a Estimate of legal coveragea for old age as a percentage of the working-age population
Total * Contributory mandatory
Contributory voluntary
Non- contributory
Men Women 2 Insured person Employer Self-employed Financing from Government
Total Women Total Women Total Women Total Women
Azerbaijan 1956 Social insurance and notional defined
contribution (NDC)
63 60 3.0 22.0 20.0; 50.0 (if in trade or construction
sector)
Provides subsidies
100.0 100.0 49.3 45.5 0.0 0.0 50.7 54.5
2006 Pension-tested non-contributory pension (social assistance)
67 62 (57) No contribution No contribution No contribution Total cost
Cyprus 1957 Social insurance 65 (63 if miner)
65 (63 if miner)
7.8 (13.0 if voluntarily insured)
7.8 14.6 4.6 (4.1 if voluntarily
insured)
100.0 100.0 64.1 59.1 … … 35.9 40.9
1995 Pension-tested non-contributory pension (social assistance)
65 65 No contribution No contribution No contribution Total cost
Georgia 2006 Universal non-contributory pension
65 60 No contribution No contribution No contribution Total cost 100.0 100.0 … … … … 100.0 100.0
Israel 59,60 1953 Social insurance 70 68 0.22-3.85 1.30-2.04 3.09- 5.21 Subsidies 100.0 100.0 62.6 61.0 0.0 0.0 37.4 39.0
… Means- and pension-tested non-
contributory pension (social assistance, Special Old-age Pension for New
Immigrants)
67 62 n.a. n.a. n.a. Total cost
1980 Means-tested non-contributory pension (social assistance, Income Support)
… … n.a. n.a. n.a. Total cost
Kazakhstan 1991 Mandatory individual account and
solidarity (social insurance) pension
63 58 10.0 (no contribution
for solidarity pension)
No contribution (5.0 for hazardous occupations, no contribution for
solidarity pension)
10.0 (no contribution
for solidarity pension)
No contribution to the individual
accounts; subsidizes
solidarity pension
100.0 100.0 70.6 69.2 0.0 0.0 100.0 100.0
1991 Means- and pension-tested non-
contributory pension (social assistance,
State Social Benefit)
63 58 n.a. n.a. n.a. Total cost

Social protection for older persons: P
olicy trends and statistics 2017-19 97
Country/ Territory
Dat
e o
f fi
rst
law
/yea
r in
tro
du
ced
Type of programme a
Pensionable age a Contribution rates: Old-age, disability, survivors a Estimate of legal coveragea for old age as a percentage of the working-age population
Total * Contributory mandatory
Contributory voluntary
Non- contributory
Men Women 2 Insured person Employer Self-employed Financing from Government
Total Women Total Women Total Women Total Women
1997 Universal non-contributory pension
(State Basic Pension)
63 58 n.a. n.a. n.a. Subsidies as needed
Kyrgyzstan 1922 Social insurance, notional defined
contribution (NDC) pension and
mandatory individual account
63 58 8.0 (social insurance and NDC) + 2.0
(individual account)
15.25 (0.25 for
employees’ health improvement
activities)
9.3 No contribution 100.0 100.0 57.0 28.2 0.0 0.0 43.0 71.8
1922 Pension-tested non-contributory pension (social assistance)
63 58 n.a. n.a. n.a. Total cost
Tajikistan 61 1993 Social insurance: notional defined
contribution (NDC) programme
63 58 No contribution 25.0 20.0 No contribution 100.0 100.0 64.1 56.2 0.0 0.0 35.9 43.8
1999 Mandatory individual account
63 58 1.0 No contribution n.a. No contribution
1993 Pension-tested non-contributory pension (social assistance)
63 58 No contribution No contribution No contribution Provides partial subsidies; local authorities may
provide supplementary
benefits from their own budgets
Turkey 62 1949 Social insurance 60 58 9.0 11.0 20.0 25.0% of total contributions
collected
100.0 100.0 35.2 31.9 … … 64.8 68.1
1976 Means-tested non-contributory pension (social assistance)
65 65 No contribution No contribution No contribution Total cost
Turkmenistan 63,64 1956 Social insurance: notional defined
contribution (NDC) pension
62 57 No contribution 20.0 (+3.0 for
hazardous occupations)
10.0% of minimum wage (rates vary
across occupations)
Subsidies as needed
100.0 100.0 50.0 65.9 0.0 0.0 56.2 34.1

98 S
ocial protection for older persons: Policy trends and statistics 2017-19
Country/ Territory
Dat
e o
f fi
rst
law
/yea
r in
tro
du
ced
Type of programme a
Pensionable age a Contribution rates: Old-age, disability, survivors a Estimate of legal coveragea for old age as a percentage of the working-age population
Total * Contributory mandatory
Contributory voluntary
Non- contributory
Men Women 2 Insured person Employer Self-employed Financing from Government
Total Women Total Women Total Women Total Women
… Means- and pension-tested non-
contributory pension (social assistance)
62 57 No contribution No contribution No contribution Total cost
Uzbekistan 65 1956 Social insurance 60 55 7.5 25.0 (15.0 for small and micro
enterprises)
Monthly contribution of at
least the minimum wage
Subsidies as needed
100.0 100.0 45.0 37.0 13.9 9.5 41.1 53.5
1956 Mandatory individual account
60 55 1.0 No contribution 1.0 No contribution
… Means- and pension-tested non-
contributory pension
60 55 No contribution No contribution No contribution Total cost
Sources
Main source
International Social Security Association (ISSA); US Social Security Administration (SSA). Various dates. Social security programs throughout the world (Geneva and Washington DC). Available at: http://www.ssa.gov/policy/docs/progdesc/ssptw/ [31 May 2017].
ILO World Social Protection Database, based on the Social Security Inquiry (SSI). Available at: http://www.social-protection.org/gimi/gess/RessourceDownload.action?ressource.ressourceId=54606 [June 2017].
Other sources
HelpAge International. Social Pensions Database. Available at: http://www.pension-watch.net/about-social-pensions/about-social-pensions/social-pensions-database/ [29 May 2017].
ILO (International Labour Office). ILOSTAT. Available at: http://www.ilo.org/ilostat/ [1 Jun. 2017].
«National statistical offices. Various dates. Datasets and reports from national labour force surveys or other household or establishment surveys. Available at: http://www.ilo.org/ilostat/ [1 Jun. 2017].
United Nations, Department of Economic and Social Affairs, Population Division. 2015. World Population Prospects: The 2015 Revision (New York). Available at: https://esa.un.org/unpd/wpp/ [June 2017].
Notes
n.a.: Not applicable. …: Not available. * Mandatory and voluntary; Contributory and non-contributory
a Detailed notes and definition available at: http://www.social-protection.org/gimi/gess/RessourceDownload.action?ressource.ressourceId=54606.
b As defined in United Nations Security Council Resolution No. 1244 of 1999.
c Programme is not anchored in the national legislation.
This table is complementary to table B.4: Non-contributory pension schemes: Main features and indicators (http://www.social-protection.org/gimi/gess/RessourceDownload.action?ressource.ressourceId=54607).
1 In many countries retirement is possible before the normal retirement age if employee is prematurely aged due to arduous or unhealthy work.
2 In several countries under certain conditions, women can retire before their normal retirement age for time spent raising children.
3 Kenya. Type of programme. The 2013 National Social Security Fund Act established a pension fund and a new provident fund. Membership in the pension fund is mandatory for all employed persons aged 18 to 60. Members of the old provident fund were automatically enrolled in the pension fund; their assets in the old provident fund remain there. Membership in the new provident fund is voluntary. The rates mentioned here are for both programmes combined (pension

Social protection for older persons: P
olicy trends and statistics 2017-19 99
fund and voluntary provident fund).
4 Malawi. In March 2011, a pension law established a mandatory old-age pension system based on individual accounts for private-sector workers earning above a minimum salary threshold. The law has yet to be implemented.
5 Seychelles. The old-age grant (from social insurance) is paid if the insured does not meet the contribution requirements for an old-age pension.
6 Sierra Leone. 2.5% of monthly income; 10% for civil servants and teachers; 12% for military and police personnel.
7 Argentina. From 1994 until the end of 2008, there was a mixed system where all insured workers were in the first-pillar public pay-as-you-go (PAYG) system; for the second pillar, workers chose between contributing to an individual account and to the PAYG defined benefit system. A 2008 law closed the second-pillar individual accounts and transferred all workers and their account balances to the new one-pillar PAYG system.
8 Bolivia, Plurinational State of. In 1997, all active members of the social insurance system transferred to a system of privately managed mandatory individual accounts. In 2008, a new universal pension (Renta Dignidad) replaced the Bonosol (available to all resident citizens of Bolivia older than age 65 from 1996 to 2008).
9 Colombia. An old-age family pension is paid to couples of pensionable age that do not meet contribution requirements and are classified as SISBEN I or II (poor households). Social assistance: financed by 1-2% of covered payroll of contributory scheme.
10 Dominican Republic. The pay-as-you-go (PAYG) social insurance system for private-sector workers was closed to new entrants in 2003 and is being phased out. It covers private-sector workers aged 45 or older in 2003 who chose to remain in the social insurance system and private-sector pensioners who began receiving their pensions before June 2003. Public-sector workers who opted not to join the individual account system remain in the separate social insurance system for public-sector workers. Subsidized individual accounts for self-employed persons and other vulnerable groups have not yet been implemented.
11 Ecuador. The provision under the 2001 law to create a system of individual accounts to complement the social insurance old-age pension programme was not implemented.
12 El Salvador. Insured persons who were older than age 55 (men) or age 50 (women) in 1998, and workers older than age 36 in 1998 who did not opt for the individual account system are covered under the old social insurance system. The Government subsidizes the pay-as-you-go (PAYG) system and finances an indexed bond for account holders who made contributions to the old social insurance system. The bond is the insured’s contributions to the old social insurance system plus interest.
13 Honduras. Mandatory individual accounts for persons with earnings above HNL 8,882.30 per month have not yet been implemented. Persons with earnings up to HNL 8,882.30 per month may make voluntary contributions to individual accounts.
14 Mexico. The Government contributes 0.225% of covered earnings plus an average flat-rate amount of MXN 4.21 (2013) to the individual account for each day contributed by an insured with earnings up to 15 times the legal monthly minimum wage; for disability and survivors’ benefits, 0.125% of covered earnings; finances the guaranteed minimum pension.
15 Nicaragua. There are special systems for war victims, miners, needy elderly and needy disabled (non-contributory).
16 Peru. When public- and private-sector employees enter the workforce, they may choose between the individual account system (SPP) and the public social insurance system (SNP). Insured persons who do not make a choice become SPP members. SNP members may switch to the SPP but may not switch back, except under certain circumstances.
17 Uruguay. The mixed social insurance and individual account system is mandatory for employed and self-employed persons born after 1 April 1956, with monthly earnings greater than UYU 39,871 and voluntary for those with monthly earnings of UYU 39,871 or less. All others are covered only by the social insurance system.
18 Canada. A post-retirement benefit is paid to people of pensionable age who continue working. Contributions to the pension plan are mandatory at any age under the Quebec Pension Plan; contributions are also mandatory under the Canada Pension Plan for persons aged 60 to 64 and voluntary if between 65 and 70 (employer contributions are mandatory for this last age group).
19 Kuwait. The basic, supplementary and remuneration systems are all part of the social insurance system. Eligible for the supplementary pension are employees who meet the requirement for the basic system pension, and whose monthly earnings are above KWD 1,500 (note that the self-employed are excluded for the supplementary pension only). Employees with monthly earnings above KWD 2,750 pay an additional 2.5% per month to finance benefit adjustments under the basic system (3.5% for self-employed persons with monthly earnings up to KWD 1,500; 1% for employers for employees with monthly earnings up to KWD 2,750). The pension from the remuneration system is for employees who receive either pension but not both, and who do not meet the contribution requirements. Contributions to the remuneration system cease after 18 years for all contributors (employees, self-employed persons and the government officials).
20 Kuwait. Basic system: Government: 10% of covered earnings (public employees), 32.5% of payroll (military personnel), and 25% of monthly income minus the self-employed person’s contributions (self-employed persons).
21 China. The basic pension insurance scheme has two components: a social insurance programme and mandatory individual accounts. The pension schemes for rural and non-salaried urban residents have two components: a non-contributory pension and individual accounts.
22 China. Since July 2011, existing regional and local social security schemes, including pooling arrangements, are gradually being unified under the country’s first national law on social insurance.
23 Japan. The social insurance system consists of a flat-rate benefit under the national pension programme (NP) and an earnings-related benefit under the employees’ pension insurance programme (EPI).
24 Mongolia. The new legislation adopted in 2017 provides that the retirement age shall be increased by six months every year until reaching a retirement age of 65 for men by 2026, and 65 for women by 2036 (starting from 2018). The same applies to eligible age for a social welfare pension in old age.
25 Mongolia. The new legislation adopted in 2017 increased pension contribution rates for both employers and workers by 2.5 points (1% in 2018, 0.5% in 2019 and 1% in 2020) bringing the total mandatory contribution to 19%. The same applies to the voluntary pension insurance contribution (1% in 2018, 0.5% in 2019 and 1% in 2020) rising to 12.5%.

100 S
ocial protection for older persons: Policy trends and statistics 2017-19
26 Cambodia. Only public servants receive a pension. The legal retirement age is 60 for category A, 58 for category B and 55 for categories C and D. Civil servants receive a monthly pension equal to 80% of their net basic salary when they have accomplished at least 30 years of service; and 60% of their net basic salary when they have at least 20 years but under 30 years of service by the age of retirement. Those who have completed more than 20 years of service receive a proportional annual supplementary pension of 2% of their net salary. The total amount does not exceed 80% of the seniority pension and is not lower than basic monthly salary. Civil servants who have reached the retirement age and have less than 20 years of service will have no pension and receive only a lump sum allowance, equally to eight total monthly salaries. The scheme is fully funded from the national budget. A pension scheme for workers in the private sector is yet to be implemented.
27 Indonesia. The defined benefit (DB) pension scheme (social insurance for private-sector workers) entered into effect on 1 July 2015, with the enactments of the Law on National Social Security System (Sistem Jaminan Sosial Nasional or SJSN) (No. 40/2004); then the Law on Social Security Implementing Agency (Badan Penyelenggara Jaminan Sosial or BPJS) (No. 24/2011) and government regulation on pension programme (No.45/2015).
28 Indonesia. Coverage rates are calculated with proxy data for number of workers, not exact value.
29 Malaysia. The social insurance scheme is only for civil servants.
30 Thailand. A new voluntary social security system for informal economy workers was initiated in 2011. The scheme is based on contributions from workers and the Government to finance old-age, disability, survivors’, sickness and maternity benefits.
31 Thailand. The Government’s contribution to the pension for informal economy workers depends on the insured person’s age: 50% of the insured’s contributions if younger than age 30; 80% if aged 30 to 49; and 100% if aged 50 or older.
32 Timor-Leste. The scheme covers only public servants and will be gradually integrated into the General Social Insurance scheme from 2017. Covered individuals pay no contributions, while benefits are linked to wage history.
33 Viet Nam. Subsidies as necessary and the total cost of old-age pensions for workers who retired before 1995; contributions for those employed in the public sector and retired before January 1995. From 1 January 2018, the Government will start subsidizing the voluntary contribution (Decree No. 134/2015/ND-CP of 29 December 2015).
34 Fiji, Kiribati, Marshall Islands, Papua New Guinea, Samoa, Solomon Islands, Vanuatu. Access to the old-age pension from the provident or superannuation fund prior to the normal retirement age is possible if the person has been unemployed for a certain time (depending on the country), and at any age if migrating permanently.
35 Micronesia, Federated States of. The contribution from the employer is 7.5% of twice the salary of the highest-paid employment per quarter. Self-employed persons can contribute 5% of business annual gross revenue for the previous calendar year or 5% of twice the salary of the highest paid employment (small businesses). Voluntary contributions of 15% of annual gross revenue for the previous calendar year for self-employed persons earning less than US$10,000 a year.
36 Palau. Self-employed contributions are 12% of twice the salary of his or her highest-paid employment or 12% of one-quarter of gross annual earnings with no employees.
37 Samoa. The pensionable age for the provident fund system is lowered to 50 if the person is unemployed for at least five years; at any age if emigrating permanently, medically incapacitated, or entering a theological seminary or the clergy. If covered employment continues after age 55, the fund member must continue to make contributions to the fund. If employment continues or new employment begins after funds are withdrawn at age 55, the fund member must contribute for at least 12 months before withdrawing funds again.
38 Croatia. Employed and self-employed persons pay 15% of covered earnings or the insurance base, respectively, to social insurance if contributing to both the social insurance pension and the mandatory individual account, plus an additional 5% to the mandatory individual account. They pay 20% of covered earnings or the insurance base, respectively, if contributing only to the social insurance scheme. The insurance base is a percentage of the gross average wage of all employed persons (from 65 to 100%), depending on the category of self-employment and the individual’s level of education.
39 Denmark. Contributions to the social insurance pension (labour market supplementary pension, or ATP) are a set amount with upper limits: Employees pay up to DKK 1,135.80 a year if full-time worker; self-employed persons pay up to DKK 3,408 per year; and the employer pays up to DKK 2,272.20 per year for a full-time worker.
40 Estonia. Retirement is possible up to ten years before the normal retirement age with at least 20 years of service, including ten years of work in especially hazardous occupations; up to five years before the normal retirement age with at least 25 years of service, including 12 years and six months in especially hazardous occupations; up to five years before the normal retirement age with at least 15 years of service and time spent raising children (depending on the number of children or whether a child was disabled) or if the insured was involved in the Chernobyl disaster cleanup.
41 France. The mandatory complementary schemes are for employees in commerce and industry, for salaried people in agriculture and, under certain conditions, for dependent spouses. This system of pensions is administered jointly by employers and employees.
42 Iceland. A means-tested social allowance is paid to cover living expenses costs if the annual income is below a certain threshold.
43 Liechtenstein. Self-employed persons pay a flat rate of CHF 234 (old age and survivors) for annual income up to CHF 3,000, plus 4.2% of the total contribution amount (administrative fees); 7.8% of annual income (old age and survivors) and 1.5% of annual income (disability) for annual income greater than CHF 3,000, plus 4.2% of the total contribution amount (administrative fees).
44 Lithuania. Individual accounts were introduced in 2004. While participation is voluntary for employed persons, once enrolled, an employed person may not opt out. Account holders and their employers must each contribute 2% of the insured’s earnings and receive a matching state subsidy for voluntary contributions of an additional 1% of the insured’s earnings.
45 Malta. The pensionable age for both the social insurance and social assistance pensions is 62 if born between 1952 and 1955; age 63 if born between 1956 and 1958; age 64 if born between 1959 and 1961; age 65 if born in 1962 or later. Age 75 for the senior citizen grant (social assistance).

Social protection for older persons: P
olicy trends and statistics 2017-19 101
46 Norway. A new pension system introduced in 2011 replaces the universal pension with a guaranteed minimum benefit, and the earnings-related pension with a notional defined contribution (NDC) scheme. The new system covers persons born since 1963. Persons born before 1954 remain under the old system. A transitional (mixed) system, a combination of the old and new systems, covers persons born between 1954 and 1962.
47 Norway. The pensionable age for the NDC pension is between 62 and 75. An employee can earn credits back for unpaid work caring for others, or for having performed mandatory military or civilian service. Credit is also given through unemployment benefits.
48 San Marino. A system of mandatory individual accounts was introduced in 2012 as a supplement to the social insurance system. Both the insured person and the employer are required to contribute.
49 Slovenia. Covers the cost for certain groups of insured persons, including war veterans, police personnel and former military personnel; pays employer contributions for farmers; covers any deficit in the event of an unforeseen decline in contributions; finances social assistance benefits; contributes as an employer.
50 Sweden. The social insurance old-age pension system covers employed and self-employed persons born before 1938 (contributions can no longer be made to this system). There is a gradual transition from the earnings-related social insurance system to the NDC and mandatory individual account system for persons born between 1938 and 1953.
51 United Kingdom. In April 2016, a new flat-rate single-tier state pension was introduced for workers retiring on or after 6 April 2016. The new pension replaces the previous two-tier system that consisted of the basic state retirement pension and the second state pension.
52 Hungary. A 2010 amendment to the social security law terminated the diversion of contributions to second-pillar individual accounts and automatically transferred account balances to the social insurance programme (unless an account holder opted out). Since 2009, participation in the individual account programme is voluntary.
53 Poland. In 1999, the social insurance pay-as-you-go (PAYG) system was replaced by a NDC system. Insured persons born before 1 January 1949 are still covered under the social insurance PAYG system. Insured persons born between 1 January 1949 and 31 December 1968, could choose the new NDC system only or the NDC and individual account system for old-age benefits. Until 31 December 2013 membership in the individual account system was mandatory for insured persons born after 31 December 1968. As of 1 February 2014, membership in the individual account system is voluntary for all insured persons.
54 Poland. The total cost of the guaranteed minimum pension; pays pension contributions for insured persons taking child-care leave or receiving maternity allowances, for persons receiving unemployment benefits and for unemployed graduates.
55 Russian Federation. A system of individual accounts was introduced in 2011 for persons born in 1967 or later. Currently, contributions to individual accounts are diverted to social insurance.
56 Slovakia. Since 1 January 2013, participation in the individual account programme is voluntary for new entrants. The decision to contribute to an individual account must be made before age 35 and cannot be reversed.
57 Slovakia. The government finances any deficit; contributes for persons caring for children up to age 6 (age 18 with serious chronic health conditions), for maternity benefit and disability benefit recipients (until retirement age or until the early retirement pension is paid).
58 Armenia. As of 1 January 2014, individual accounts were introduced that are mandatory for workers born on or after 1 January 1974, and voluntary for those born before 1974 until 1 July 2014, after which they become mandatory for all workers. Once a worker has chosen to participate, the decision cannot be reversed. The 2010 law on income tax replaced mandatory social contributions (Law No. HO-179 of 1997) with a tax-financed system, but the basic structure of the social insurance programme remains in place.
59 Israel. Government contribution: 0.25% of insured person’s earnings (old-age and survivors’ pensions), 0.10% of insured person’s earnings (disability benefits), 0.02% of insured and self-employed persons’ earnings (long-term care); the total cost of special old-age and survivors’ benefits and long-term care benefits for new immigrants; and the total cost of the mobility allowance. The Government also subsidizes 45.1% of total contributions for old age, disability and survivors, sickness and maternity, employment injury, unemployment and family allowances.
60 Israel. The special old-age pension for new immigrants is paid to new immigrants coming to Israel after age 60 to 62, and to persons who emigrated from the country and returned, but do not meet the contribution requirements for the social insurance pension. A means-tested supplement is paid if assets and income, including the special old-age pension, are less than the minimum established by law.
61 Tajikistan. In 2013, a NDC programme was implemented for all workers regardless of age. Under transitional rules, the rights earned under the social insurance programme will be taken into account.
62 Turkey. In May 2006, the separate systems for public and private sector employees and the self-employed were merged into one under the newly created Social Security Institution.
63 Turkmenistan. The pensionable age for the social insurance pension is reduced for mothers with three or more children and for persons with disabilities. Age 53 (men) or age 48 (women) for military personnel; age 50 (men) or age 48 (women) for pilots and flight crew.
64 Turkmenistan. Self-employed persons’ contributions vary depending on the occupational sector: entrepreneurs and the liberal professions pay 15% to 80% of the monthly minimum wage, depending on monthly income; farmers pay 10% to 20% of net income or 15% of the monthly minimum wage, whichever is greater. The monthly minimum wage is TMT 650 (January 2017).
65 Uzbekistan. The pensionable age for the social insurance pension is reduced for those working in hazardous or arduous employment or in ecologically damaged areas, for unemployed older workers, for teachers with at least 25 years of service, and for certain other categories of workers.
66 Barbados. Social assistance is financed by 2% of covered payroll of contributory scheme. The beneficiary has lived in Barbados for 12 years (citizens) or 15 years (permanent residents) since age 40 or a total of 20 years since age 18; and does not meet the contribution requirements for an old-age social insurance pension or an old-age pension from a foreign government or international organization.
67 Costa Rica. Social assistance is financed by 5% of covered payroll of contributory scheme plus 20% of the sales tax revenue.

102 S
ocial protection for older persons: Policy trends and statistics 2017-19
Table B.4. Non-contributory pension schemes: Main features and indicators
Country/ Territory
Year introduced
Name of scheme Legal requirements and characteristics of the schemes
Level of benefit (monthly) Effective coverage (number, %) Cost
Ag
e o
f el
igib
ility
Cit
izen
ship
Res
iden
cy
Inco
me
test
Ass
et t
est
Pen
sio
n-t
este
d
Nat
ion
al
curr
ency
US
D
PP
P
Yea
r
% o
f m
inim
um
wag
eb
Nu
mb
er
of
reci
pie
nts
Po
pu
lati
on
60
and
ove
r
Po
pu
lati
on
65
and
ove
r
Po
pu
lati
on
ab
ove
elig
ible
age
Yea
r
Co
st (
% o
f G
DP
Yea
r
AFRICA
Northern Africa
Algeria 1994 Allocation forfaitaire de solidarité 60 … … � … … 3 000.0 28.4 101.5 2015 16.7 284 661.0 8.0 12.1 8.0 2015 0.1 2015
Egypt 2008 Ministry of Social Assistance Social Solidarity pensions
65 … … … … � 300.0 38.3 142.2 2014 25.0 1 400 000.0 19.3 29.3 29.3 2008 0.3 2014
Sub-Saharan Africa
Botswana 1996 State Old-age Pension (OAP) 65 � � 250.0 29.8 68.0 2013 32.1 93 639.0 65.2 93.3 93.32012/2013 0.3 2010
Cabo Verde 2006 Pensao Social Minima (Minimum Social Pension)
60 … � … … � 5 000.0 50.6 102.9 2015 45.5 23 000.0 68.2 85.2 68.2 2011 0.9 2011
Kenya 2006 Older Persons Cash Transfer – Pilot (OPCT)
65 … … � … … 2 000.0 19.4 47.0 2015 8.0–36.7 310 000.0 14.8 24.0 24.0 2015 0.0 2015
2008 Hunger Safety Net Programme Pilot (Food security)
55 … � 2 550.0 26.0 54.2 2016 18.9 n.a. n.a. n.a. n.a. … n.a. …
Lesotho 2004 Old-Age Pension 70 … � 500.0 36.7 108.7 2015 37.7–41.2 83 000.0 60.8 94.3 125.52014/2015 1.3 2015
Liberia … … 60 to 65 … … � … � n.a. n.a. n.a. … n.a. n.a. n.a. n.a. n.a. … n.a. …
Mauritius 1950 Basic Retirement Pension 60 � � 5 000.0 140.5 293.1 2015 157–206 184 487.0 102.7 159.0 102.7 2014 2.9 2015
Mozambique 1992 Programa de Subsídio Social Basico (PSSB) (Basic Social Subsidy Programme)
60 (m) 55 (w)
… … � … … 280.0 6.6 15.9 2015 3.4 -8.8 341 188.0 23.8 36.4 19.3 2015 0.3 2015
Namibia 1949 (for specific group), 1992
(universal)
Old-Age Pension (OAP) 60 � � 10 000.0 74.6 158.6 2015 n.a 152 272.0 113.6 175.0 113.6 2015 1.2 2015
1965 Veteran’s Pension 55 _ _ _ _ _ 2 200.0 … … 2015 … … … … … … … …
Nigeria 2011 Ekiti State Social Security Scheme for Elderly (Ekiti State only)
65 … … … � 5 000.0 25.1 57.5 2014 277.8 25 000.0 0.3 0.5 0.5 2013 0.0 2015
2012 Agba Osun Elderly Scheme (Osun state only)
… … … � … … 1 000.0 50.3 115.0 2015 55.6 1 602.0 0.0 0.0 n.a 2015 0.0 2015

Social protection for older persons: P
olicy trends and statistics 2017-19 103
Country/ Territory
Year introduced
Name of scheme Legal requirements and characteristics of the schemes
Level of benefit (monthly) Effective coverage (number, %) Cost
Ag
e o
f el
igib
ility
Cit
izen
ship
Res
iden
cy
Inco
me
test
Ass
et t
est
Pen
sio
n-t
este
d
Nat
ion
al
curr
ency
US
D
PP
P
Yea
r
% o
f m
inim
um
wag
eb
Nu
mb
er
of
reci
pie
nts
Po
pu
lati
on
60
and
ove
r
Po
pu
lati
on
65
and
ove
r
Po
pu
lati
on
ab
ove
elig
ible
age
Yea
r
Co
st (
% o
f G
DP
Yea
r
Seychelles 1987 Old-age pension (social security fund) 63 � � 2 950.0 221.6 390.7 2015 71.0 6 951.0 71.2 99.0 88.6 2011 1.5 2012
South Africa 1927 (for specific group), 1944
Old-Age Grant 60 � � � � … 1,410.0 (upto age 74); 1,430.0 (75
or older)
110.1;111.7
256.4; 260.0
2015 n.a. 3 114 729.0 74.0 113.6 74.0 2015 1.3 2015
1928 War Veteran’s Grant 60 � � � � … Up to 1,430.0 … … 2015 … … … … … … … …
Swaziland 2005 Old-Age Grant 60 … � � … � 200.0 14.4 41.9 2015 30.4 55 000.0 77.1 134.1 77.1 2011 0.3 …
Tanzania, United Republic of
2016 Zanzibar Universal Pension Scheme (ZUPS)
70 … … … 20 000.0 9.2 29.8 2016 5.0–50.0 27 370.0 0.4 1.5 1.4 2016 0.0 2016
Uganda 2011 Senior Citizens Grant 65 (60 in Karamoja Region)
… … � … � 25 000.0 6.8 25.8 2015 416.7 60 000.0 4.3 6.2 6.5 2015 0.0 2015
Zambia 2007 Social Cash Transfer Programme, Katete (Pilot)
60 … … … … … 60 000.0 10.8 13.3 2010 22.4 4 706.0 0.9 1.3 0.9 2009 n.a …
AMERICAS
Latin America and the Caribbean
Antigua and Barbuda
1993 Old-Age Assistance Programme 87 … … � … � 255.0 94.4 151.1 2015 19.4 152.0 1.5 2.4 10.3 2011 0.0 2011
Argentina 1994 Pensiones Asistenciales 70 � � � � 3 009.3 325.9 453.9 2015 53.9 143 650.0 2.3 3.2 4.7 2012 0.0 2013
Aruba 1960 Pensioen di biehes AOV 60 � � 1 107.0 618.4 … 2017 66.0 14 000.0 79.3 100.0 79.3 2013 n.a. …
Bahamas 1956 Old-Age Non-Contributory Pension (OANCP)
65 � � … � 262.34 (60.54
weekly)
262.3 264.5 2015 31.2 1 847.0 3.8 5.7 5.7 2014 0.1 2015
Barbados 1937 Non-contributory Old-Age Pension 66.5 � � 598.0 299.0 309.2 2015 59.8 10 403.0 23.9 35.1 36.9 2011 0.7 2015
Belize 2003 Non-Contributory Pension Programme (NCP)
67 (m) 65 (w)
� � � … 100.0 50.1 87.0 2015 15.5 4 297.0 22.2 32.6 35.4 2013 0.1 2015/2012
Bermuda 1967 Non-contributory old-age pension 65 � � � 451.1 451.08 288.5 2011 n.a. n.a. n.a. n.a. n.a. … n.a. …
Bolivia, Plurinational State of
1997 Renta Dignidad or Renta Universal de Vejez (previously Bonosol)
60 � � 250.0 36.2 80.3 2015 15.1 902 749.0 91.3 130.3 91.3 2015 1.2 2015

104 S
ocial protection for older persons: Policy trends and statistics 2017-19
Country/ Territory
Year introduced
Name of scheme Legal requirements and characteristics of the schemes
Level of benefit (monthly) Effective coverage (number, %) Cost
Ag
e o
f el
igib
ility
Cit
izen
ship
Res
iden
cy
Inco
me
test
Ass
et t
est
Pen
sio
n-t
este
d
Nat
ion
al
curr
ency
US
D
PP
P
Yea
r
% o
f m
inim
um
wag
eb
Nu
mb
er
of
reci
pie
nts
Po
pu
lati
on
60
and
ove
r
Po
pu
lati
on
65
and
ove
r
Po
pu
lati
on
ab
ove
elig
ible
age
Yea
r
Co
st (
% o
f G
DP
Yea
r
Brazil 1996 Beneficio de Prestacao Continuada (BPC / Continuous Cash Benefit)
65 … � � � 880.0 264.5 471.7 2015 100.0 1 918 918.0 8.0 11.7 11.7 2015 0.3 2013
1963 Aposentadoria por Idade pelo segurado special (Age Pension for rural workers, formerly Previdencia Rural)
60 (m) 55 (w)
… … … … � 880.0 264.5 471.7 2015 100.0 5 820 780.0 27.1 40.5 22.1 2012 1.0 2012
Chile 2008 Pensión Básica Solidaria de Vejez (PBS-Vejez) (Basic Old-Age Solidarity Pension)
65 � � … � 89 764.0 137.2 239.0 2015 38.7 400 134.0 16.0 22.8 22.8 2013 0.9 2013
Colombia 2003 Programa Colombia Mayor (Regional scheme)
59 (m) 54 (w)
� � � � 40 000–75 000
13.0–24.5
33.3–62.4
2015 0.6–11.6 1 258 000.0 26.1 38.9 19.7 2014 0.1 2012
Costa Rica 1974 Programa Regimen No Contributivo 65 … … � … � 115 331.0 229.3 297.7 2012 54.6 106 544.0 17.4 24.9 24.9 2015 0.5 2015
Cuba … … 65 (m) 60 (w)
… … � … � n.a. n.a. n.a. … n.a. 71 000.0 3.7 5.1 4.3 2010 n.a. …
Dominican Republic … Programa Nonagenarios (Nonagarians Programme)
60 … … � … … 4 086.0 104.0 172.3 2012 41.3 n.a. n.a. n.a. n.a. … n.a. …
Ecuador 2003 Pensión para Adultos Mayores (Pension for Older People / Bono de Desarollo Humano)
65 � … � … � 50.0 50.0 86.2 2013 15.7 625 001.0 42.6 62.3 62.3 2013 0.3 2013
El Salvador 2009 Pensión Básica Universal (Universal basic pension)
70 … � � … � 50.0 50.0 101.6 2014 20.6–47.6 28 154.0 4.2 5.9 8.7 2013 0.1 2013
Guatemala 2005 Programa de aporte economico del Adulto Mayor (Economic contribution programme for older people)
65 … … � … … 400.0 51.4 79.1 2012 19.3–21.0 103 125.0 11.2 16.3 16.3 2010 0.1 2012
Guyana 1944 Old-Age Pension 65 � � 17 000.0 83.7 144.1 2015 48.6 42 397.0 66.5 110.4 110.4 2015 1.3 2015
Jamaica 2001 The Programme for Advancement through Health and Education (PATH)
60 … … � … � 1 500.0 15.0 26.2 2013 6.9 51 846.0 17.9 24.1 17.9 2010 0.0 2012
Mexico 2001 Pensión Para Adultos Mayores (Pension for Older People)
65 � � 580.0 35.2 71.4 2015 39.0 5 100 000.0 41.9 62.1 62.1 2013 0.2 2015
Panama 2009 120 a los 65 65 � � � � 120.0 120.0 206.9 2015 19.2 95 116.0 22.1 31.7 31.7 2015 0.2 2015
Paraguay 2009 Pensión alimentaria para las personas adultas mayores
65 � � � � 456 015.0 81.5 189.0 2015 25.0 147 170.0 24.6 36.8 36.8 2015 0.5 2015
Peru 2011 Pensión 65 65 � … � … � 125.0 37.9 81.0 2015 16.7 501 681.0 16.0 23.4 23.4 2015 0.1 2014

Social protection for older persons: P
olicy trends and statistics 2017-19 105
Country/ Territory
Year introduced
Name of scheme Legal requirements and characteristics of the schemes
Level of benefit (monthly) Effective coverage (number, %) Cost
Ag
e o
f el
igib
ility
Cit
izen
ship
Res
iden
cy
Inco
me
test
Ass
et t
est
Pen
sio
n-t
este
d
Nat
ion
al
curr
ency
US
D
PP
P
Yea
r
% o
f m
inim
um
wag
eb
Nu
mb
er
of
reci
pie
nts
Po
pu
lati
on
60
and
ove
r
Po
pu
lati
on
65
and
ove
r
Po
pu
lati
on
ab
ove
elig
ible
age
Yea
r
Co
st (
% o
f G
DP
Yea
r
Saint Kitts and Nevis
1998 Old-age social assistance pension 62 … � … … � 255.0 94.4 150.0 2015 17.7 475.0 8.0 12.0 8.3 2011 n.a …
Saint Vincent and the Grenadines
2009 Elderly Assistance Benefit 75 … � � … � 162.5 (75.0 fortnightly)
60.2 95.2 2015 14.5–25.3 1 203.0 11.0 … 15.9 2012 0.1 2015
2009 Noncontributory Assistance Age Pension
85 … � � … � 162.5 (75.0 fortnightly)
… … 2015 … … … … .. … … …
Suriname 1973 State Old-Age Pension (Algemene Oudedags Voorzieningsfonds (AOV))
60 … … 525.0 159.1 226.1 2013 n.a. 42 818.0 92.1 133.8 92.1 2008 1.6 2012
Trinidad and Tobago
1939 Senior Citizens’ Pension 65 � � 3 500.0 548.8 1055.3 2015 134.6 79 942.0 45.5 68.4 68.4 2012 1.6 2012
Uruguay 1919 Programa de Pensiones No-Contributivas (Non contributory pensions’ programme)
70 … � � … … 7 692.2 261.9 382.4 2015 76.9 33 436.0 5.2 6.9 9.6 2013 0.2 2013
Venezuela, Bolivarian Rep. of
2011/12 Gran Misión en Amor Mayor 60 (m) 55 (w)
… � � … 9 648.2 1535.3 879.0 2015 100.0 559 799.0 20.0 29.9 16.3 2014 0.9 2015
Northern America
Canada 1927 Pension de la Sécurité Vieillesse (S.V.) (Old Age Security Pension)
65 � � 570.0 428.0 467.6 2015 30.8 5 600 715.0 69.8 96.6 96.6 2015 1.8 2015
United States 1935 Old-Age Supplementary Security Income
65 � � � … … 733.0 733.0 733.0 2015 58.3 1 158 158.0 1.7 2.4 2.4 2014 0.1 2014
ARAB STATES
Iraq 2014 Social Welfare Programme Old-Age Allowance
60 (m) 55 (w)
� � � … � 420,000.0 (household)
n.a. n.a. … n.a. n.a. n.a. n.a. n.a. … n.a. …
ASIA AND THE PACIFIC
Eastern Asia
China 2011 Pension Schemes for Rural and Nonsalaried Urban Residents
60 … … … � 70.0 (basic tax-funded
benefit)
10.2 19.8 2015 3.5–7.0 148 003 000.0 70.7 112.6 70.7 2015 0.1 2012
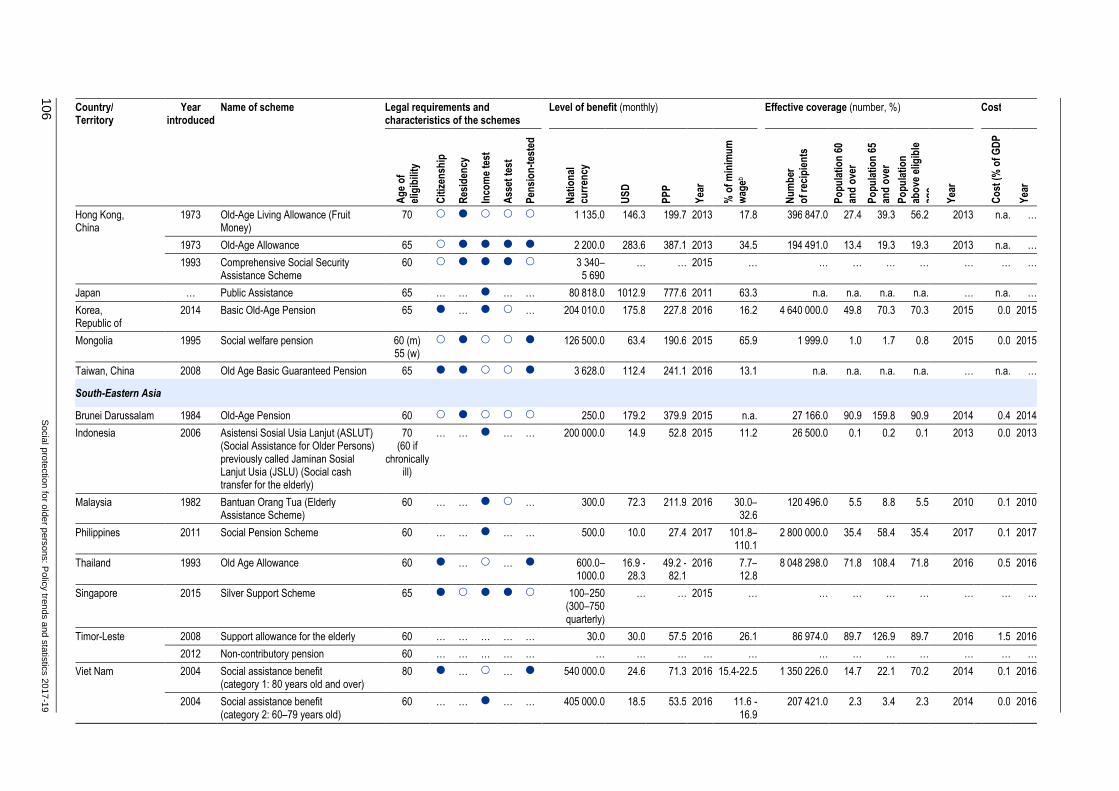
106 S
ocial protection for older persons: Policy trends and statistics 2017-19
Country/ Territory
Year introduced
Name of scheme Legal requirements and characteristics of the schemes
Level of benefit (monthly) Effective coverage (number, %) Cost
Ag
e o
f el
igib
ility
Cit
izen
ship
Res
iden
cy
Inco
me
test
Ass
et t
est
Pen
sio
n-t
este
d
Nat
ion
al
curr
ency
US
D
PP
P
Yea
r
% o
f m
inim
um
wag
eb
Nu
mb
er
of
reci
pie
nts
Po
pu
lati
on
60
and
ove
r
Po
pu
lati
on
65
and
ove
r
Po
pu
lati
on
ab
ove
elig
ible
age
Yea
r
Co
st (
% o
f G
DP
Yea
r
Hong Kong, China
1973 Old-Age Living Allowance (Fruit Money)
70 � 1 135.0 146.3 199.7 2013 17.8 396 847.0 27.4 39.3 56.2 2013 n.a. …
1973 Old-Age Allowance 65 � � � � 2 200.0 283.6 387.1 2013 34.5 194 491.0 13.4 19.3 19.3 2013 n.a. …
1993 Comprehensive Social Security Assistance Scheme
60 � � � 3 340–5 690
… … 2015 … … … … … … … …
Japan … Public Assistance 65 … … � … … 80 818.0 1012.9 777.6 2011 63.3 n.a. n.a. n.a. n.a. … n.a. …
Korea, Republic of
2014 Basic Old-Age Pension 65 � … � … 204 010.0 175.8 227.8 2016 16.2 4 640 000.0 49.8 70.3 70.3 2015 0.0 2015
Mongolia 1995 Social welfare pension 60 (m) 55 (w)
� � 126 500.0 63.4 190.6 2015 65.9 1 999.0 1.0 1.7 0.8 2015 0.0 2015
Taiwan, China 2008 Old Age Basic Guaranteed Pension 65 � � � 3 628.0 112.4 241.1 2016 13.1 n.a. n.a. n.a. n.a. … n.a. …
South-Eastern Asia
Brunei Darussalam 1984 Old-Age Pension 60 � 250.0 179.2 379.9 2015 n.a. 27 166.0 90.9 159.8 90.9 2014 0.4 2014
Indonesia 2006 Asistensi Sosial Usia Lanjut (ASLUT) (Social Assistance for Older Persons) previously called Jaminan Sosial Lanjut Usia (JSLU) (Social cash transfer for the elderly)
70 (60 if
chronically ill)
… … � … … 200 000.0 14.9 52.8 2015 11.2 26 500.0 0.1 0.2 0.1 2013 0.0 2013
Malaysia 1982 Bantuan Orang Tua (Elderly Assistance Scheme)
60 … … � … 300.0 72.3 211.9 2016 30.0–32.6
120 496.0 5.5 8.8 5.5 2010 0.1 2010
Philippines 2011 Social Pension Scheme 60 … … � … … 500.0 10.0 27.4 2017 101.8–110.1
2 800 000.0 35.4 58.4 35.4 2017 0.1 2017
Thailand 1993 Old Age Allowance 60 � … … � 600.0–1000.0
16.9 -28.3
49.2 -82.1
2016 7.7–12.8
8 048 298.0 71.8 108.4 71.8 2016 0.5 2016
Singapore 2015 Silver Support Scheme 65 � � � 100–250 (300–750 quarterly)
… … 2015 … … … … … … … …
Timor-Leste 2008 Support allowance for the elderly 60 … … … … … 30.0 30.0 57.5 2016 26.1 86 974.0 89.7 126.9 89.7 2016 1.5 2016
2012 Non-contributory pension 60 … … … … … … … … … … … … … … … … …
Viet Nam 2004 Social assistance benefit (category 1: 80 years old and over)
80 � … … � 540 000.0 24.6 71.3 2016 15.4-22.5 1 350 226.0 14.7 22.1 70.2 2014 0.1 2016
2004 Social assistance benefit (category 2: 60–79 years old)
60 … … � … … 405 000.0 18.5 53.5 2016 11.6 -16.9
207 421.0 2.3 3.4 2.3 2014 0.0 2016

Social protection for older persons: P
olicy trends and statistics 2017-19 107
Country/ Territory
Year introduced
Name of scheme Legal requirements and characteristics of the schemes
Level of benefit (monthly) Effective coverage (number, %) Cost
Ag
e o
f el
igib
ility
Cit
izen
ship
Res
iden
cy
Inco
me
test
Ass
et t
est
Pen
sio
n-t
este
d
Nat
ion
al
curr
ency
US
D
PP
P
Yea
r
% o
f m
inim
um
wag
eb
Nu
mb
er
of
reci
pie
nts
Po
pu
lati
on
60
and
ove
r
Po
pu
lati
on
65
and
ove
r
Po
pu
lati
on
ab
ove
elig
ible
age
Yea
r
Co
st (
% o
f G
DP
Yea
r
Southern Asia
Bangladesh 1998 Old-Age Allowance 65 (m) 62 (w)
� � � … � 500.0 6.4 16.9 2015 9.4 3 150 000.0 27.3 39.3 34.9 2015 0.1 2016
India 1995 Indira Gandhi National Old-Age Pension Scheme
60 … … � … … 200.0 3.0 11.4 2014 6.1 20 595 274.0 17.7 28.0 17.7 2015 0.0 2015
Maldives 2010 Old-age Basic Pension 65 … … … … � 2 300.0 150.3 235.8 2015 n.a. 16 172.0 65.6 94.6 94.6 2015 1.0 2015
Nepal 1995 Old-Age Allowance 70 (60 or older for
Dalits and residents of the Karnali
Zone)
� … � 2 000.0 18.7 63.6 2015 25.0 635 938.0 31.2 46.3 79.92010/2011 0.7 2010/2011
Oceania
Australia 1908 Age Pension 65 � � … 1728.78 (797.90
fortnightly)
1285.1 1194.3 2016 60.0 2 356 226.0 51.1 70.4 70.4 2013 2.6 2010/2011
Cook Islands 1966 Old-Age Pension (universal) 60 … … … … … 500.0 335.8 … 2014 52.1 n.a. n.a. n.a. n.a. … n.a. …
Fiji 2013 Social Pension Scheme (SPS) 68 � � 50.0 23.1 43.9 2015/ 2016
11.2 -12.0 15 000.0 18.2 28.8 51.2 2015 0.1 2015
Kiribati 2003 Elderly pension 65 � … 50.0 35.7 46.9 2012 n.a. 2 090.0 34.9 52.3 93.0 2010 1.2 2015
New Zealand 1898 Superannuation 65 � 1667.2 (384.7
weekly)
1160.6 1147.8 2016 63.6 598 933.0 70.8 99.2 99.2 2012 4.5 2012
Niue … … 60 … … 483.0 396.1 … 2013 … n.a n.a n.a n.a … n.a …
Papua New Guinea 2009 Old Age and Disabled Pension Scheme (New Ireland only)
60 … � … … … 30.0 10.2 14.6 2015 5.3 8 362.0 2.3 3.7 2.3 2015-2013
0.0 2015-2013
Samoa 1990 Senior Citizens Benefit 65 � � 135.0 58.6 97.7 2015 31.8–36.7 8 700.0 65.2 92.6 92.6 2010 0.9 2014
Tuvalu … Senior Citizen Scheme 70 … … … … … 50.0 35.9 41.8 2015 n.a n.a n.a n.a n.a … n.a …

108 S
ocial protection for older persons: Policy trends and statistics 2017-19
Country/ Territory
Year introduced
Name of scheme Legal requirements and characteristics of the schemes
Level of benefit (monthly) Effective coverage (number, %) Cost
Ag
e o
f el
igib
ility
Cit
izen
ship
Res
iden
cy
Inco
me
test
Ass
et t
est
Pen
sio
n-t
este
d
Nat
ion
al
curr
ency
US
D
PP
P
Yea
r
% o
f m
inim
um
wag
eb
Nu
mb
er
of
reci
pie
nts
Po
pu
lati
on
60
and
ove
r
Po
pu
lati
on
65
and
ove
r
Po
pu
lati
on
ab
ove
elig
ible
age
Yea
r
Co
st (
% o
f G
DP
Yea
r
EUROPE AND CENTRAL ASIA
Northern, Southern and Western Europe
Albania 2015 Social Pension 70 … … � � 6 750.0 54.4 155.9 2016 30.7 5 000.0 1.0 1.4 2.1 2015 n.a. …
Andorra 1966 Pensió de solidaritat per a la gent gran (Solidarity pension for the elderly)
65 … � � … … n.a. n.a. n.a. … n.a. n.a. n.a. n.a. n.a. … n.a. …
Austria 1978 Ausgleichszulage (Austrian Compensatory Supplement)
65 (m) 60 (w)
… … � … � 889.8 988.7 1112.3 2017 n.a. 103 431.0 5.3 6.8 5.9 2011 n.a. …
Belgium 2001 IGO/GRAPA (Income Guarantee for the Elderly)
65 … … � … … 1 052.6 1396.5 1319.8 2014 70.1 93 620.0 3.6 4.8 4.8 2012 0.3 2013
Denmark 2008 Folkepension (national pension - Universal basic pension)
65 � 6 063.0 900.7 833.3 2016 n.a. 1 074 980.0 76.8 100.0 100.0 2015 5.7 2013
Estonia 2008 National Pension 63 � � 167.4 185.2 313.5 2016 38.9 6 436.0 2.1 2.8 2.2 2013 0.1 2015
Faeroe Islands … Old-age pension (basic pension; universal)
67 … … … … … 4 169.0 592.0 … 2014 n.a. n.a. n.a. n.a. n.a. … n.a. …
Finland 1937 Kansanelake (National Pension) 65 � 634.3 701.6 701.8 2016 n.a. 479 089.0 32.0 42.5 42.5 2015 0.7 2015
2010 Takuueläke (Guarantee Pension) 65 � 766.9 848.3 848.5 2016 n.a. n.a. n.a. n.a. n.a. … n.a. …
France 1956 Allocation de Solidarité aux -Personnes Agées – ASPA (Solidarity allowance for the elderly)
65 � � 800.0 862.5 972.1 2015 54.9 512 726.7 3.8 5.0 5.0 2010 0.3 2012
Germany 2003 Grundsicherung im Alter -(Needs-based pension supplement)
65 … … � … … 407.0 452.2 515.2 2015 28.3 527 352.0 2.4 3.1 3.1 2015 0.1 2015
Greece 1982 Social Solidarity Allowance 65 � � … … 230.0 254.4 373.7 2016 34.6 67 000.0 2.5 3.2 3.2 2008 0.2 2008
Guernsey 1984 Supplementary benefits 60 … … � … � 1 764.0 2786.5 … 2012 175.0 n.a. n.a. n.a. n.a. … n.a. …
Iceland 1890 lífeyristryggingar almannatrygginga (National Basic Pension)
67 � � 39 862.0 329.4 278.3 2016 n.a. 30 201.0 51.0 71.9 83.4 2013 0.6 2013
Ireland 1909 State Pension (non-contributory) 66 � � … � 962.0 (222.0 weekly)
1064.1 1209.2 2016 62.2 95 570.0 11.4 16.1 17.4 2014 0.5 2014
Isle of Man … Old Person’s Pension 80 in April 2016
… � � … … 306.4 n.a. n.a. … n.a. n.a. n.a. n.a. n.a. … n.a. …
Italy 1969 Assegno sociale (Social Allowance) 65 and 7 months
� � � … � 448.1 495.6 616.6 2016 n.a. 859 985.0 5.3 6.9 6.9 2011 n.a. …
Kosovo a 2002 Old-age «basic pension» 65 … … 75.0 83.3 230.8 2015 44.1–57.7 125 883.0 74.1 107.8 107.8 2014 2.0 2014

Social protection for older persons: P
olicy trends and statistics 2017-19 109
Country/ Territory
Year introduced
Name of scheme Legal requirements and characteristics of the schemes
Level of benefit (monthly) Effective coverage (number, %) Cost
Ag
e o
f el
igib
ility
Cit
izen
ship
Res
iden
cy
Inco
me
test
Ass
et t
est
Pen
sio
n-t
este
d
Nat
ion
al
curr
ency
US
D
PP
P
Yea
r
% o
f m
inim
um
wag
eb
Nu
mb
er
of
reci
pie
nts
Po
pu
lati
on
60
and
ove
r
Po
pu
lati
on
65
and
ove
r
Po
pu
lati
on
ab
ove
elig
ible
age
Yea
r
Co
st (
% o
f G
DP
Yea
r
Latvia … State social security benefit 67 and 9 months
… … � 70.3 77.8 142.0 2016 19.0 1 077.0 0.2 0.3 0.3 2011 n.a. …
Lithuania … Old-age social assistance pension 63 and 4 months (m) 61 and 8 months
(w)
… … � 97.2 107.5 218.9 2016 8.0 n.a. n.a. n.a. n.a. … n.a. …
Malta 1956 Non-contributory old-age pension 60 � � � 459.85 (106.12 weekly)
508.7 768.2 2016 63.1 5 137.0 5.0 6.8 5.0 2013 0.3 2013
1956 Senior Citizens Grant 75 � … … … … … … … … … … … …
Netherlands 1957 AOW Pension (Old-age pension) 65 and 6 months
� 1 161.7 1285.0 1398.7 2017 75.9 3 131 400.0 79.8 109.9 109.9 2013 6.2 2011
Norway 1936 Grunnpensjon (Basic Pension) 67 (flexible)
� � … 7 505.7 893.5 798.4 2016 n.a 800 350.0 73.3 100.3 110.1 2013 5.3 2013
Portugal 1980 Pensao Social de Velhice (Old-Age Social Pension)
66 and 2 months
� � � � 237.3 262.5 405.6 2016 44.8 n.a n.a n.a n.a … n.a …
Slovenia 1999 Državna pokojnina (State pension) 68 … … � … … 181.4 240.6 287.4 2010 25.5 17 085.0 3.7 4.9 5.9 2011 0.1 2011
Spain 1994 Non Contributory Pension for retirement (Pensión no Contributiva de Jubilación)
65 … � � … � 367.9 407.0 554.8 2016 56.2 193 043.0 1.8 2.4 2.4 2013 0.1 2012
Sweden 1913 Guarantee Pension (Garantipension) 65 � � 7 863.0 918.4 881.9 2016 n.a. 786 388.0 31.8 41.3 41.3 2014 0.0 2014
Switzerland … Extraordinary pension 65 (m) 64 (w)
� � … … � 1 512.0 1612.5 916.9 2012 n.a. n.a. n.a. n.a. n.a. … n.a. …
United Kingdom 1909 Pension credit (Guarantee Credit) 65 � � … 674.2 (155.6 weekly)
963.2 977.5 2016 56.4 1 102 000.0 7.4 9.6 9.6 2015 0.5 2011
1909 Old-person’s pension 80 … � � … … 310.6 (71.5 weekly)
n.a n.a 2016 n.a n.a n.a n.a n.a … n.a …
Eastern Europe
Belarus … Social Pension 65 (m) 60 (w)
� � � 795 655.0 67.5 154.0 2016 33.2 51 900.0 2.7 3.9 2.2 2011 n.a. …
Bulgaria … Social Old Age Pension 70 … � � … … 115.2 65.1 170.3 2016 27.4 4 917.0 0.3 0.4 0.5 2011 0.0 2011

110 S
ocial protection for older persons: Policy trends and statistics 2017-19
Country/ Territory
Year introduced
Name of scheme Legal requirements and characteristics of the schemes
Level of benefit (monthly) Effective coverage (number, %) Cost
Ag
e o
f el
igib
ility
Cit
izen
ship
Res
iden
cy
Inco
me
test
Ass
et t
est
Pen
sio
n-t
este
d
Nat
ion
al
curr
ency
US
D
PP
P
Yea
r
% o
f m
inim
um
wag
eb
Nu
mb
er
of
reci
pie
nts
Po
pu
lati
on
60
and
ove
r
Po
pu
lati
on
65
and
ove
r
Po
pu
lati
on
ab
ove
elig
ible
age
Yea
r
Co
st (
% o
f G
DP
Yea
r
Hungary 1993 Időskorúak járadéka (Old-Age Allowance)
62 … … � … … 22 800.0 78.6 179.3 2013 23.3 6 175.0 0.3 0.4 0.3 2013 0.1 2013
Moldova, Republic of
1999 State Social Allocation for Older Persons
62(m) 57(w)
� � 129.3 6.5 19.0 2016 6.1–12.9 4 986.0 0.7 1.2 0.7 2015 0.0 2015
Poland … Targeted pension 65 (m) 60 (w)
… … � … � 419.2 128.7 208.2 2012 27.9 49 205.0 0.6 0.9 1.0 2011 n.a …
Russian Federation … State social pension 65 (m) 60 (w)
� … … … � 3 692.0 59.1 171.8 … n.a 3 000 000.0 10.4 n.a 12.1 … 0.2 …
Ukraine … Social pension + social pension supplement
63 (m) 60.5(w)
� … � … � 1 074.0 42.0 184.6 2016 69.3 213 000.0 2.3 3.0 2.2 2011 n.a …
Central and Western Asia
Armenia 1956 Old-Age Social Pension 65 … … � 16 000.0 33.3 80.8 2016 29.1 48 000.0 11.6 14.2 14.2 2007 n.a. …
Azerbaijan 2006 Social Allowance (old-age) 67(m) 62 (w)
� … � 60.0 57.3 159.6 2015 57.1 230 935.0 23.6 42.1 36.1 2015 0.3 2015
Cyprus 1995 Social Pension Scheme 65 � � 336.3 362.5 528.7 2014 38.7 15 537.0 8.1 11.5 11.5 2012 0.3 2014
Georgia 2006 Old-Age Pension 65 (m) 60 (w)
� � 160.0 67.0 183.7 2015 118.5–800.0
707 700.0 86.5 126.1 104.4 2015 4.8 2015
Israel … Special Old Age Benefit 67 (m) 62 (w)
� � … � 1 530.7 391.5 373.7 2015 36.5 61 178.0 5.2 7.5 6.1 2012 0.1 2015
1980 Income Support … � � … 1 729.6 450.4 453.4 2016 … … … … … … … …
Kazakhstan 1991 Universal State Basic Pension 63 (m) 58 (w)
� 11 886.7 34.7 127.8 2016 52.3 1 964 500.0 104.4 165.5 105.0 2015 0.7 2015
1997 Old-age State Social Benefit 63 (m) 58 (w)
� � � 11 886.7 34.7 127.8 2016 52.0 n.a. n.a. n.a. n.a. … n.a. …
Kyrgyzstan 1922 Social assistance allowance (old age) 63 (m) 58 (w)
… … … … � 1 000.0 14.5 45.4 2010 200.0 n.a. n.a. n.a. n.a. … n.a. …
Tajikistan 1993 Old-Age Pension 65 (m) 58 (w)
… … … … � 40.0 8.4 19.4 2012 50.0 91 000.0 24.4 36.0 28.8 2011 0.1 2011
Turkey 1976 Means-tested Old Age Pension 65 … … � … … 125.6 43.4 102.3 2015 9.9 n.a n.a n.a n.a … n.a …
Turkmenistan … Social Allowance 62 (m) 57 (w)
… … � … � 169.4 48.4 119.9 2016 28.7 n.a n.a n.a n.a … n.a …
Uzbekistan … Old-Age Social pension 60 (m) 55 (w)
… � � … � 142 100.0 53.1 150.1 2015 109.1 5 700.0 0.3 0.5 0.3 2011 n.a …

Social protection for older persons: P
olicy trends and statistics 2017-19 111
Sources
Main sources
HelpAge International. Social Pensions Database. Available at: http://www.pension-watch.net/about-social-pensions/about-social-pensions/social-pensions-database/ [28 May 2017].
ISSA (International Social Security Association); SSA (US Social Security Administration). Various dates. Social security programs throughout the world (Geneva and Washington DC). Available at: http://www.ssa.gov/policy/docs/progdesc/ssptw/ and https://www.issa.int/en_GB/country-profiles [28 May 2017].
Other sources
European Commission. Mutual Information System on Social Protection (MISSOC). Comparative Tables Database. Available at: http://www.missoc.org/INFORMATIONBASE/COMPARATIVETABLES/MISSOCDATABASE/comparativeTableSearch.jsp [28 May 2017].
ILO (International Labour Office). World Social Protection Database, based on the Social Security Inquiry (SSI) [June 2017].
National sources. Various dates. Detailed links available at: http://www.social-protection.org/gimi/gess/RessourceDownload.action?ressource.ressourceId=54607
Additional sources for data used as denominators
ILO (International Labour Office). ILOSTAT: Population by sex and age: UN estimates and projections. Available at: http://www.ilo.org/ilostat/faces/oracle/webcenter/portalapp/pagehierarchy/Page27.jspx?subject=ILOEST&indicator=POP_2POP_SEX_AGE_NB&datasetCode=A&collectionCode=ILOEST [9 June 2017].
—. ILOSTAT: Statutory nominal gross monthly minimum wage effective December 31st. Available at: http://www.ilo.org/ilostat/faces/wcnav_defaultSelection?_afrLoop=1401941427353402&_afrWindowMode=0&_afrWindowId=jbahgxgkv_1#!%40%40%3F_afrWindowId%3Djbahgxgkv_1%26_afrLoop%3D1401941427353402%26_afrWindowMode%3D0%26_adf.ctrl-state%3Djbahgxgkv_50 [14 June 2017].
IMF (International Monetary Fund). World Economic Outlook Database. Available at: http://www.imf.org/external/pubs/ft/weo/2014/01/weodata/index.aspx [28 May 2017].
World Bank. Databank: World Development Indicators. Official exchange rates (LCU per US$, period average). Available at: http://databank.worldbank.org/data/reports.aspx?source=2&series=PA.NUS.FCRF&country= [9 June 2017].
—. Databank: World Development Indicators. PPP conversion factor, GDP (LCU per international $). Available at: http://databank.worldbank.org/data/reports.aspx?source=2&series=PA.NUS.PPP&country= [9 June 2017].
Symbols
� Yes No
Notes
n.a.: Not applicable
…: Not available
a As defined in United Nations Security Council Resolution No. 1244 of 1999. b For the countries where the national minimum wage varies according to region and/or sector of economy, an interval was considered.
Year introduced: The first scheme that is the legal predecessor of any current scheme is indicated. Most schemes have been reformed since and the current legislation is rarely that of the founding year.
Legal requirements: Categories of criteria applicants have to fulfil, e.g. holding citizenship of the country in question, having a legal residence, having income below a set level or passing an income test, having assets below a set level, not receiving any other pension or receiving only a low pension.
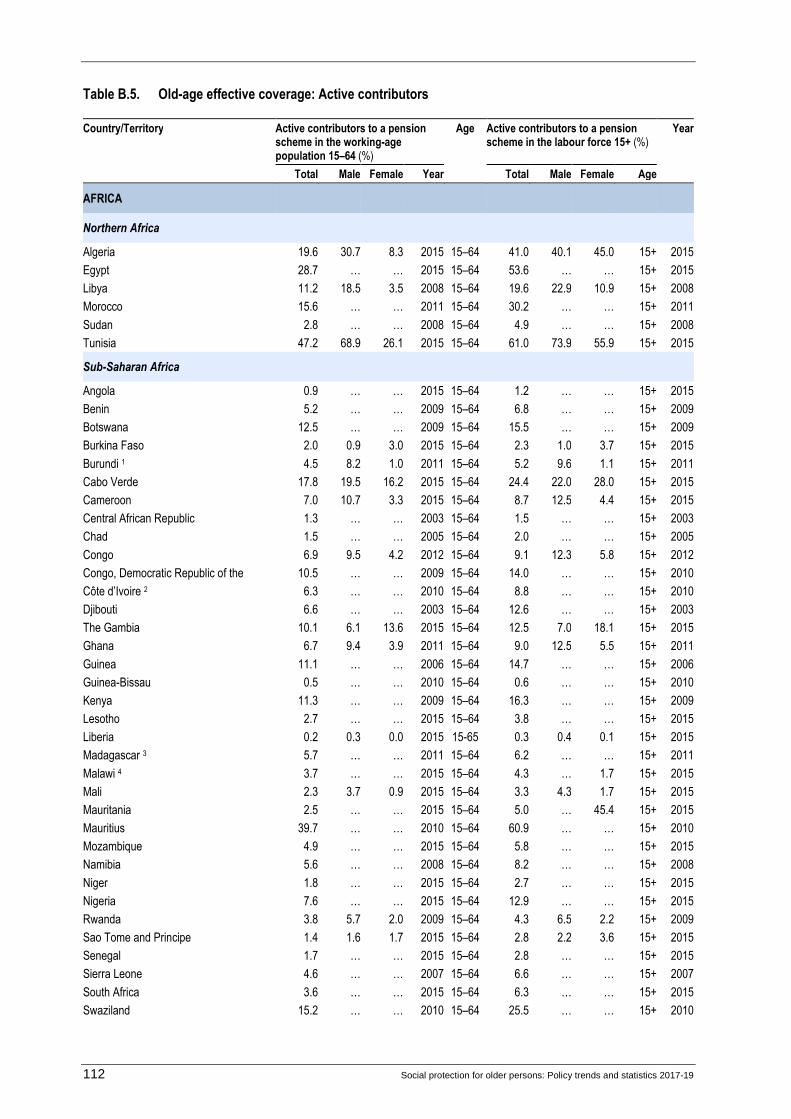
112 Social protection for older persons: Policy trends and statistics 2017-19
Table B.5. Old-age effective coverage: Active contributors
Country/Territory Active contributors to a pension scheme in the working-age population 15–64 (%)
Age Active contributors to a pension scheme in the labour force 15+ (%)
Year
Total Male Female Year Total Male Female Age
AFRICA
Northern Africa
Algeria 19.6 30.7 8.3 2015 15–64 41.0 40.1 45.0 15+ 2015
Egypt 28.7 … … 2015 15–64 53.6 … … 15+ 2015
Libya 11.2 18.5 3.5 2008 15–64 19.6 22.9 10.9 15+ 2008
Morocco 15.6 … … 2011 15–64 30.2 … … 15+ 2011
Sudan 2.8 … … 2008 15–64 4.9 … … 15+ 2008
Tunisia 47.2 68.9 26.1 2015 15–64 61.0 73.9 55.9 15+ 2015
Sub-Saharan Africa
Angola 0.9 … … 2015 15–64 1.2 … … 15+ 2015
Benin 5.2 … … 2009 15–64 6.8 … … 15+ 2009
Botswana 12.5 … … 2009 15–64 15.5 … … 15+ 2009
Burkina Faso 2.0 0.9 3.0 2015 15–64 2.3 1.0 3.7 15+ 2015
Burundi 1 4.5 8.2 1.0 2011 15–64 5.2 9.6 1.1 15+ 2011
Cabo Verde 17.8 19.5 16.2 2015 15–64 24.4 22.0 28.0 15+ 2015
Cameroon 7.0 10.7 3.3 2015 15–64 8.7 12.5 4.4 15+ 2015
Central African Republic 1.3 … … 2003 15–64 1.5 … … 15+ 2003
Chad 1.5 … … 2005 15–64 2.0 … … 15+ 2005
Congo 6.9 9.5 4.2 2012 15–64 9.1 12.3 5.8 15+ 2012
Congo, Democratic Republic of the 10.5 … … 2009 15–64 14.0 … … 15+ 2010
Côte d’Ivoire 2 6.3 … … 2010 15–64 8.8 … … 15+ 2010
Djibouti 6.6 … … 2003 15–64 12.6 … … 15+ 2003
The Gambia 10.1 6.1 13.6 2015 15–64 12.5 7.0 18.1 15+ 2015
Ghana 6.7 9.4 3.9 2011 15–64 9.0 12.5 5.5 15+ 2011
Guinea 11.1 … … 2006 15–64 14.7 … … 15+ 2006
Guinea-Bissau 0.5 … … 2010 15–64 0.6 … … 15+ 2010
Kenya 11.3 … … 2009 15–64 16.3 … … 15+ 2009
Lesotho 2.7 … … 2015 15–64 3.8 … … 15+ 2015
Liberia 0.2 0.3 0.0 2015 15-65 0.3 0.4 0.1 15+ 2015
Madagascar 3 5.7 … … 2011 15–64 6.2 … … 15+ 2011
Malawi 4 3.7 … … 2015 15–64 4.3 … 1.7 15+ 2015
Mali 2.3 3.7 0.9 2015 15–64 3.3 4.3 1.7 15+ 2015
Mauritania 2.5 … … 2015 15–64 5.0 … 45.4 15+ 2015
Mauritius 39.7 … … 2010 15–64 60.9 … … 15+ 2010
Mozambique 4.9 … … 2015 15–64 5.8 … … 15+ 2015
Namibia 5.6 … … 2008 15–64 8.2 … … 15+ 2008
Niger 1.8 … … 2015 15–64 2.7 … … 15+ 2015
Nigeria 7.6 … … 2015 15–64 12.9 … … 15+ 2015
Rwanda 3.8 5.7 2.0 2009 15–64 4.3 6.5 2.2 15+ 2009
Sao Tome and Principe 1.4 1.6 1.7 2015 15–64 2.8 2.2 3.6 15+ 2015
Senegal 1.7 … … 2015 15–64 2.8 … … 15+ 2015
Sierra Leone 4.6 … … 2007 15–64 6.6 … … 15+ 2007
South Africa 3.6 … … 2015 15–64 6.3 … … 15+ 2015
Swaziland 15.2 … … 2010 15–64 25.5 … … 15+ 2010

Social protection for older persons: Policy trends and statistics 2017-19 113
Country/Territory Active contributors to a pension scheme in the working-age population 15–64 (%)
Age Active contributors to a pension scheme in the labour force 15+ (%)
Year
Total Male Female Year Total Male Female Age
Tanzania, United Republic of 3.6 … … 2015 15–64 4.3 … … 15+ 2015
Togo 3.1 … … 2009 15–64 3.7 … … 15+ 2009
Uganda 3.8 3.4 4.2 2007 15–64 4.6 4.1 5.1 15+ 2007
Zambia 9.7 … … 2015 15–64 12.2 … … 15+ 2015
Zimbabwe 17.0 … … 2009 15–64 18.3 … … 15+ 2009
AMERICAS
Latin America and the Caribbean
Antigua and Barbuda 66.2 78.3 55.3 2015 15–64 … … … n.a. n.a.
Argentina 29.9 26.9 32.6 2015 15–64 50.2 49.8 50.8 15+ 2015
Aruba 90.8 92.0 89.8 2015 15–64 100.0 100.0 100.0 15+ 2015
Bahamas 66.7 … … 2011 15–64 81.9 … … 15+ 2011
Barbados 65.1 … … 2009 15–64 79.6 … … 15+ 2009
Belize 44.2 58.0 30.6 2011 15–64 64.0 66.8 59.4 15+ 2011
Bolivia, Plurinational State of 13.5 9.7 17.2 2015 15–64 16.7 10.7 24.2 15+ 2015
Brazil 39.2 34.2 44.1 2015 15–64 52.5 52.6 52.3 15+ 2015
Chile 41.4 35.2 47.6 2015 15–64 60.0 43.1 83.2 15+ 2015
Colombia 23.3 19.8 26.7 2015 15–64 30.8 22.7 41.4 15+ 2015
Costa Rica 50.0 36.3 63.8 2015 15–64 71.9 42.3 100.0 15+ 2015
Dominica 52.9 49.9 56.1 2011 15–64 … … … n.a. n.a.
Dominican Republic 23.1 … … 2015 15–64 32.1 … … 15+ 2015
Ecuador 29.8 23.7 35.9 2015 15–64 42.1 27.1 66.0 15+ 2015
El Salvador 20.7 18.1 22.9 2015 15–64 29.3 20.4 41.2 15+ 2015
Grenada 58.7 … … 2010 15–64 … … … n.a. n.a.
Guatemala 13.2 11.2 14.1 2015 15–64 19.7 18.8 21.4 15+ 2015
Guyana 29.7 … … 2009 15–64 45.7 … … 15+ 2009
Honduras 12.7 11.2 14.1 2015 15–64 17.3 16.3 18.7 15+ 2015
Jamaica 12.5 … … 2004 15–64 16.7 … … 15+ 2004
Mexico 18.8 14.8 22.8 2015 15–64 27.6 17.0 45.4 15+ 2015
Nicaragua 14.6 12.8 16.2 2015 15–64 21.0 14.9 30.4 15+ 2015
Panama 35.6 55.3 37.1 2015 15–64 48.7 62.0 42.7 15+ 2015
Paraguay 13.5 15.9 11.1 2011 15–64 18.9 18.5 19.5 15+ 2011
Peru 19.9 14.8 25.0 2015 15–64 24.3 16.3 34.1 15+ 2015
Saint Kitts and Nevis 77.9 76.6 79.3 2010 15–64 … … … n.a. n.a.
Saint Lucia 43.1 44.1 42.3 2008 15–64 56.5 53.1 60.3 15+ 2008
Saint Vincent and the Grenadines 49.5 … … 2007 15–64 67.3 … … 15+ 2007
Trinidad and Tobago 49.7 … … 2010 15–64 68.8 … … 15+ 2010
Uruguay 56.7 … … 2015 15–64 70.8 … … 15+ 2015
Venezuela, Bolivarian Rep. of 24.1 27.4 20.8 2009 15–64 33.9 31.8 37.3 15+ 2009
Northern America
Canada 56.1 53.1 59.3 2015 15–64 71.1 63.8 79.2 15+ 2015
United States 78.5 81.1 76.0 2010 15–64 100.0 100.0 100.0 15+ 2010
ARAB STATES
Bahrain 10.5 12.4 7.3 2007 15–64 15.1 14.1 19.0 15+ 2007
Iraq 19.8 … … 2009 15–64 45.2 … … 15+ 2009
Jordan 22.6 33.0 11.5 2010 15–64 51.5 47.4 70.1 15+ 2010
Kuwait 12.9 … … 2010 15–64 18.4 … … 15+ 2010
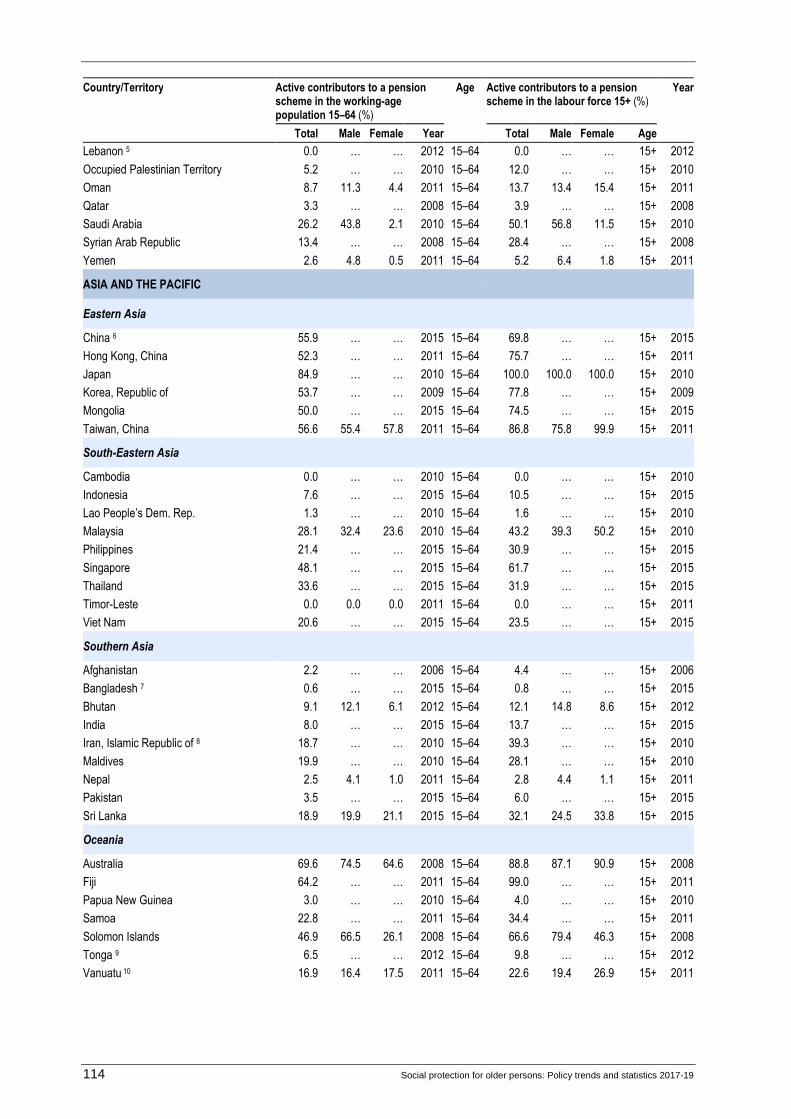
114 Social protection for older persons: Policy trends and statistics 2017-19
Country/Territory Active contributors to a pension scheme in the working-age population 15–64 (%)
Age Active contributors to a pension scheme in the labour force 15+ (%)
Year
Total Male Female Year Total Male Female Age
Lebanon 5 0.0 … … 2012 15–64 0.0 … … 15+ 2012
Occupied Palestinian Territory 5.2 … … 2010 15–64 12.0 … … 15+ 2010
Oman 8.7 11.3 4.4 2011 15–64 13.7 13.4 15.4 15+ 2011
Qatar 3.3 … … 2008 15–64 3.9 … … 15+ 2008
Saudi Arabia 26.2 43.8 2.1 2010 15–64 50.1 56.8 11.5 15+ 2010
Syrian Arab Republic 13.4 … … 2008 15–64 28.4 … … 15+ 2008
Yemen 2.6 4.8 0.5 2011 15–64 5.2 6.4 1.8 15+ 2011
ASIA AND THE PACIFIC
Eastern Asia
China 6 55.9 … … 2015 15–64 69.8 … … 15+ 2015
Hong Kong, China 52.3 … … 2011 15–64 75.7 … … 15+ 2011
Japan 84.9 … … 2010 15–64 100.0 100.0 100.0 15+ 2010
Korea, Republic of 53.7 … … 2009 15–64 77.8 … … 15+ 2009
Mongolia 50.0 … … 2015 15–64 74.5 … … 15+ 2015
Taiwan, China 56.6 55.4 57.8 2011 15–64 86.8 75.8 99.9 15+ 2011
South-Eastern Asia
Cambodia 0.0 … … 2010 15–64 0.0 … … 15+ 2010
Indonesia 7.6 … … 2015 15–64 10.5 … … 15+ 2015
Lao People’s Dem. Rep. 1.3 … … 2010 15–64 1.6 … … 15+ 2010
Malaysia 28.1 32.4 23.6 2010 15–64 43.2 39.3 50.2 15+ 2010
Philippines 21.4 … … 2015 15–64 30.9 … … 15+ 2015
Singapore 48.1 … … 2015 15–64 61.7 … … 15+ 2015
Thailand 33.6 … … 2015 15–64 31.9 … … 15+ 2015
Timor-Leste 0.0 0.0 0.0 2011 15–64 0.0 … … 15+ 2011
Viet Nam 20.6 … … 2015 15–64 23.5 … … 15+ 2015
Southern Asia
Afghanistan 2.2 … … 2006 15–64 4.4 … … 15+ 2006
Bangladesh 7 0.6 … … 2015 15–64 0.8 … … 15+ 2015
Bhutan 9.1 12.1 6.1 2012 15–64 12.1 14.8 8.6 15+ 2012
India 8.0 … … 2015 15–64 13.7 … … 15+ 2015
Iran, Islamic Republic of 8 18.7 … … 2010 15–64 39.3 … … 15+ 2010
Maldives 19.9 … … 2010 15–64 28.1 … … 15+ 2010
Nepal 2.5 4.1 1.0 2011 15–64 2.8 4.4 1.1 15+ 2011
Pakistan 3.5 … … 2015 15–64 6.0 … … 15+ 2015
Sri Lanka 18.9 19.9 21.1 2015 15–64 32.1 24.5 33.8 15+ 2015
Oceania
Australia 69.6 74.5 64.6 2008 15–64 88.8 87.1 90.9 15+ 2008
Fiji 64.2 … … 2011 15–64 99.0 … … 15+ 2011
Papua New Guinea 3.0 … … 2010 15–64 4.0 … … 15+ 2010
Samoa 22.8 … … 2011 15–64 34.4 … … 15+ 2011
Solomon Islands 46.9 66.5 26.1 2008 15–64 66.6 79.4 46.3 15+ 2008
Tonga 9 6.5 … … 2012 15–64 9.8 … … 15+ 2012
Vanuatu 10 16.9 16.4 17.5 2011 15–64 22.6 19.4 26.9 15+ 2011

Social protection for older persons: Policy trends and statistics 2017-19 115
Country/Territory Active contributors to a pension scheme in the working-age population 15–64 (%)
Age Active contributors to a pension scheme in the labour force 15+ (%)
Year
Total Male Female Year Total Male Female Age
EUROPE AND CENTRAL ASIA
Northern, Southern and Western Europe
Albania 29.8 … … 2006 15–64 43.3 … … 15+ 2006
Austria 68.3 … … 2013 15–64 88.6 … … 15+ 2013
Belgium 63.2 … … 2013 15–64 92.0 … … 15+ 2013
Bosnia and Herzegovina 24.4 … … 2008 15–64 44.6 … … 15+ 2008
Croatia 51.8 … … 2013 15–64 77.0 … … 15+ 2013
Denmark 78.1 … … 2010 15–64 96.6 … … 15+ 2010
Estonia 63.6 … … 2010 15–64 82.3 … … 15+ 2010
Finland 65.7 … … 2013 15–64 84.9 … … 15+ 2013
France 63.6 … … 2013 16-64 88.6 … … 15+ 2013
Germany 68.6 … … 2015 16-64 86.0 … … 15+ 2015
Greece 59.7 … … 2013 15–64 86.6 … … 15+ 2013
Ireland 75.4 … … 2013 15–64 100.0 … … 15+ 2013
Isle of Man … … … … … … … … …
Italy 61.0 … … 2013 15–64 93.4 … … 15+ 2013
Jersey … … … … … … … … …
Kosovo … … … … … … … … …
Latvia 72.4 … … 2013 15–64 92.6 … … 15+ 2013
Lithuania 54.5 … … 2010 15–64 76.0 … … 15+ 2010
Luxembourg 100.0 … … 2013 15–64 100.0 … … 15+ 2013
Macedonia, the former Yugoslav Republic of 52.3 … … 2011 15–64 80.0 … … 15+ 2011
Malta 63.9 … … 2013 15–64 94.7 … … 15+ 2013
Montenegro 36.8 … … 2007 15–64 80.4 … … 15+ 2007
Netherlands 74.6 … … 2013 15–64 91.4 … … 15+ 2013
Norway 76.2 … … 2013 15–64 94.1 … … 15+ 2013
Portugal 58.6 … … 2010 15–64 74.5 … … 15+ 2010
Serbia 29.7 … … 2010 15–64 61.1 … … 15+ 2010
Slovenia 60.7 … … 2013 15–64 83.3 … … 15+ 2013
Spain 56.2 … … 2013 15–64 75.0 … … 15+ 2013
Sweden 67.5 … … 2013 15–64 79.3 … … 15+ 2013
United Kingdom 71.4 … … 2005 15–64 92.9 … … 15+ 2005
Eastern Europe
Belarus 44.0 29.1 57.4 2010 15–64 66.6 41.6 91.9 15+ 2010
Bulgaria 60.0 59.3 60.7 2013 15–64 85.0 79.3 91.5 15+ 2013
Czech Republic 70.0 … … 2013 15–64 92.0 … … 15+ 2013
Hungary 59.7 … … 2013 15–64 87.5 … … 15+ 2013
Moldova, Republic of 33.6 33.5 33.7 2011 15–64 70.1 66.5 73.8 15+ 2011
Poland 59.1 … … 2010 15–64 88.0 … … 15+ 2010
Romania 45.4 … … 2013 16-64 64.6 … … 15+ 2013
Russian Federation 48.7 … … 2009 15–64 65.9 … … 15+ 2009
Slovakia 60.0 … … 2013 15–64 84.4 … … 15+ 2013
Ukraine 33.9 … … 2015 15–64 47.1 … … 15+ 2015

116 Social protection for older persons: Policy trends and statistics 2017-19
Country/Territory Active contributors to a pension scheme in the working-age population 15–64 (%)
Age Active contributors to a pension scheme in the labour force 15+ (%)
Year
Total Male Female Year Total Male Female Age
Central and Western Asia
Armenia 27.0 29.0 25.2 2015 15–64 36.9 35.0 39.1 15+ 2015
Azerbaijan 22.5 … … 2007 15–64 33.3 … … 15+ 2007
Cyprus 51.0 … … 2013 15–64 67.4 … … 15+ 2013
Georgia 22.7 … … 2008 15–64 29.5 … … 15+ 2008
Israel 69.8 … … 2011 15–64 100.0 100.0 100.0 15+ 2011
Kazakhstan 80.0 … … 2015 15–64 100.0 … … 15+ 2015
Kyrgyzstan 34.8 … … 2015 15–64 51.9 … … 15+ 2015
Tajikistan 20.5 … … 2015 15-65 28.6 … … 15+ 2015
Turkey 27.8 44.1 11.7 2011 15–64 52.1 58.4 37.1 15+ 2011
Sources
Main source
ILO (International Labour Office). World Social Protection Database, based on the Social Security Inquiry (SSI). Available at: http://www.social-protection.org/gimi/gess/RessourceDownload.action?ressource.ressourceId=54608 [1 June 2017].
Other sources
ADB (Asian Development Bank). Social Protection Index Database. Available at: http://spi.adb.org/spidmz/index.jsp [1 June 2017].
CISSTAT (Interstate Statistical Committee of the Commonwealth of Independent States). WEB Database Statistics of the CIS. Available at: http://www.cisstat.com/0base/index-en.htm [1 June 2017].
European Commission. 2015c. The 2015 Ageing Report: Economic and budgetary projections for the 28 EU Member States (2013–2060) (Luxembourg, European Union). Available at: http://ec.europa.eu/economy_finance/publications/european_economy/2015/ee3_en.htm [1 June 2017].
Hirose, K. (ed.). 2011. Pension reform in Central and Eastern Europe in times of crisis, austerity and beyond (Budapest, ILO).
National sources. Various dates. Detailed notes and sources available at: http://www.social-protection.org/gimi/gess/RessourceDownload.action?ressource.ressourceId=54608
Notes
n.a: Not applicable
…: Not available
Additional notes by country
1 Burundi. Includes old-age and survivors’ pensions for people aged 60 and over.
2 Côte d’Ivoire. Data from the Caisse nationale de prévoyance sociale (CNPS) and Caisse générale de retraite des agents de l’Etat (CGRAE).
3 Madagascar. Data refer to the Caisse nationale de la prévoyance sociale (CNaPS) and two occupational schemes for civil servants: the Caisse de retraite civile et militaire (CRCM), which covers civil servants, government workers and the military; and the Caisse de prévoyance de retraite(CPR), which covers auxiliary agents employed by the Government, who have not yet been granted full government employee status.
4 Malawi. There is no national social insurance scheme in Malawi. The Government Public Pension Scheme is a non-contributory, defined benefit, PAYG system. There are around 600 private pension funds in Malawi not included here.
5 Lebanon. There is currently no income security for the elderly through regular old-age pension benefits, only a lump sum.
6 China. The indicator for China includes contributors to the new rural social pension plan introduced nationwide in 2009. This new pension has two components: a basic pension component financed by local and central government and a personal account component based on contributions from enrolled individuals. In relatively poor regions the central Government pays approximately 80% of the cost of the basic pension component and the local government bears the rest. The first basic pension component justifies inclusion in this indicator, focusing on periodic cash benefits for the elderly to ensure basic income security.
7 Bangladesh. The Government provides its own employees with a non-contributory, defined benefit pension with survivors’ benefits, funded through tax revenues. Civil servants are eligible to receive a pension at the age of 57.
8 Iran, Islamic Republic of. Corresponds to total number of insured as principal contributors and refers to the social security organization and state retirement fund.
9 Tonga. In September 2010, the National Retirement Benefits Scheme (NRBS) Bill 2010 was passed by the Legislative Assembly, providing a similar mandatory superannuation plan for the private sector and other organizations. No statistics available yet (see: http://www.nrbf.to/ [May 2017]).
10 Vanuatu. Active member refers to a person who has at least one contribution paid on that member’s behalf for the current or any of the preceding three months (see: http://www.vnpf.com.vu/p/vnpf-index.html [May 2017]).

Social protection for older persons: Policy trends and statistics 2017-19 117
Table B.6. Old-age effective coverage: Old-age pension beneficiaries (SDG indicator 1.3.1 for older persons)
Country/Territory Proportion by sex (%) Proportion by type of programme (%) Year Statutory pensionable age (basis for reference population)
Total Male Female No distinction available
Contributory Non- contributory a
AFRICA
Northern Africa
Algeria 1 63.6 … … … 51.1 12.5 2010 60+ Men | 55+ Women
Egypt 37.5 … … … … … 2014 60+
Libya 43.3 … … … 43.3 … 2006 65+ Men | 60+ Women
Morocco 39.8 … … … 39.8 … 2009 60+
Sudan 4.6 … … … 4.6 … 2010 60+
Tunisia 33.8 … … … 24.5 9.3 2015 60+
Sub-Saharan Africa
Angola 2 14.5 … … … 14.5 … 2012 60+
Benin 9.7 … … … 9.7 … 2009 60+
Botswana 100.0 100.0 100.0 … … 100.0 2015 65+
Burkina Faso 2.7 5.4 0.7 … 2.7 … 2015 56–63+
Burundi 3 4.0 6.8 2.0 … 4.0 … 2015 65+ Men | 60+ Women
Cabo Verde 4 85.8 … … … … … 2015 60+
Cameroon 13.0 20.2 5.9 … 13.0 … 2015 60+
Chad 1.6 … … … 1.6 … 2008 60+
Congo 5 22.1 42.4 4.7 … 22.1 … 2011 57–65+
Congo, Democratic Republic of the 15.0 … … … 15.0 …
200965+ Men | 60+ Women
Côte d’Ivoire 6 7.7 … … … 7.7 … 2010 60+
Djibouti 12.0 … … … 12.0 … 2002 60+
Ethiopia 15.3 … … … 15.3 … 2015 60+
Gabon 7 16.4 … … … 16.4 … 2010 55+
The Gambia 17.0 … … … 17.0 … 2015 60+
Ghana 33.3 … … … 33.3 … 2015 60+
Guinea 8.8 … … … 8.8 … 2008 55–65+
Guinea-Bissau 6.2 … … … 6.2 … 2008 60+
Kenya 24.8 … … … … … 2015 60+
Lesotho 94.0 … … … … 94.0 2015 70+
Madagascar 4.6 … … … 4.6 … 2011 60+
Malawi 2.3 … … … 2.3 … 2016 …
Mali 2.7 5.3 0.6 … 2.7 … 2015 58+
Mauritania 9.3 … … … 9.3 … 2002 60+
Mauritius 100.0 100.0 100.0 … … 100.0 2010 63+
Mozambique 17.3 20.0 15.9 … 1.7 15.6 2011 60+ Men | 55+ Women
Namibia 98.4 … … … … 98.4 2011 60+
Niger 5.8 … … … 5.8 … 2015 60+
Nigeria 7.8 … … … 7.8 … 2015 50+
Rwanda 4.7 … … … 4.7 … 2004 60+
Sao Tome and Principe 52.5 … … … 52.5 … 2015 60 +
Senegal 23.5 … … … 23.5 … 2010 55+
Seychelles 100.0 100.0 100.0 … 11.4 88.6 2011 63+
Sierra Leone 0.9 … … … 0.9 … 2007 60+
South Africa 92.6 … … … … … 2015 60+
Swaziland 86.0 … … … … 86.0 2011 60+

118 Social protection for older persons: Policy trends and statistics 2017-19
Country/Territory Proportion by sex (%) Proportion by type of programme (%) Year Statutory pensionable age (basis for reference population)
Total Male Female No distinction available
Contributory Non- contributory a
Tanzania, United Republic of 3.2 … … … 3.2 …
2008 60+
Togo 10.9 … … … 10.9 … 2009 60+
Uganda 6.6 … … … 4.5 2.1 2012 55+
Zambia 8.8 … … … … … 2015 55+
Zimbabwe 6.2 … … … 6.2 … 2006 60+
AMERICAS
Latin America and the Caribbean
Antigua and Barbuda 83.5 86.1 81.4 … … … 2015 60+
Argentina 89.3 … … … … … 2015 65+ Men | 60+ Women
Aruba 100.0 100.0 100.0 … … 100.0 2015 60+
Bahamas 84.2 … … … 75.3 8.9 2011 65+
Barbados 68.3 … … … 33.2 35.1 2011 66.5+
Belize 64.6 … … … 32.0 32.6 2011 65+
Bolivia, Plurinational State of 100.0 100.0 100.0 … … 100.0
2015 60+ (Eligible agefor Renta Dignidad)
Brazil 8 78.3 … … … … … 2015 65+ Men | 60+ Women
Chile 78.6 … … … … … 2015 65+ Men | 60+ Women
Colombia 9 51.7 53.6 53.0 … … … 2015 62+ Men | 57+ Women
Costa Rica 10 68.8 65.4 48.8 … … … 2015 65+
Dominica 38.5 … … … 38.5 … 2011 62+
Dominican Republic 11 11.1 16.5 6.2 11.1 … … 2009 60+
Ecuador 52.0 … … 52.0 … … 2015 65+
El Salvador 18.1 31.6 10.3 … 15.9 2.2 2009 60+ Men | 55+ Women
Grenada 34.0 … … … 34.0 … 2010 60+
Guatemala 8.3 … … … … … 2015 60+
Guyana 100.0 100.0 100.0 … 4.6 100.0 2012 60+
Haiti 1.0 … … … … … 2001 55+
Honduras 7.5 7.6 7.3 … … … 2012 65+ Men | 60+ Women
Jamaica 30.3 … … … … … 2015 65+ Men | 64.8+ Women
Mexico 64.1 69.8 60.2 … 3.0 22.2 2009 65+
Nicaragua 12 23.7 42.3 16.2 … 23.7 … 2011 60+
Panama 13 37.3 49.4 28.9 37.3 … … 2008 62+ Men | 57+ Women
Paraguay 22.2 24.9 20.0 … 4.3 17.9 2013 60+
Peru 19.3 … … … … … 2015 65+
Saint Kitts and Nevis 44.7 51.6 39.7 … 36.4 8.3 2010 62+
Saint Lucia 26.5 … … … 26.5 … 2008 65+
Saint Vincent and the Grenadines 76.6 … … … 23.3 53.3
2012 60+
Trinidad and Tobago 98.4 … … … 50.7 47.7 2009 60+
Uruguay 14 76.5 74.6 77.7 … 66.9 9.6 2011 60+
Venezuela, Bolivarian Republic of 59.4 70.0 50.2 … 39.2 20.2
2012 60+ Men | 55+ Women
Northern America
Canada 100.0 100.0 100.0 … … … 2015 65+
United States 15 100.0 100.0 100.0 100.0 … … 2015 65+

Social protection for older persons: Policy trends and statistics 2017-19 119
Country/Territory Proportion by sex (%) Proportion by type of programme (%) Year Statutory pensionable age (basis for reference population)
Total Male Female No distinction available
Contributory Non- contributory a
ARAB STATES
Bahrain 40.1 … … … … … 2011 60+ Men | 55+ Women
Iraq 56.0 … … … … … 2007 60+ Men | 55+ Women
Jordan 42.2 82.3 11.8 … 42.2 … 2010 60+ Men | 55+ Women
Kuwait 27.3 … … … … … 2008 51+
Lebanon 16 0.0 … … … 0.0 0.0 2013 60–64+
Occupied Palestinian Territory
8.0 … … … … … 2009 65+
Oman 24.7 … … … … … 2010 60+ Men | 55+ Women
Qatar 18.0 22.9 8.2 … … … 2015 60+
Syrian Arab Republic 16.7 … … … … … 2006 60+ Men | 55+ Women
Yemen 8.5 … … … … … 2011 60+ Men | 55+ Women
ASIA AND THE PACIFIC
Eastern Asia
China 17 100.0 … … … … … 2015 60+ Men50–60+ Women
Hong Kong, China 72.9 … … … … 72.9 2009 65+
Japan 100.0 … … … … … 2015 65+
Korea, Republic of 77.6 … … … … … 2010 61+
Mongolia 100.0 100.0 100.0 … … … 2015 60+ Men | 55+ Women
South-Eastern Asia
Brunei Darussalam 81.7 … … … … 81.7 2011 60+
Cambodia 3.2 … … … … … 2015 55+
Indonesia 14.0 … … … … … 2015 56+
Lao People’s Dem. Rep. 5.6 … … … … … 2010 60+ Men | 55+ Women
Malaysia 18 19.8 … … … 16.2 3.6 2010 55+
Philippines 19 39.8 53.2 29.0 … 21.9 17.9 2015 60+
Singapore 0 … … … 0 0 2011 55+
Thailand 20 83.0 … … … 8.2 74.8 2016 55+
Timor-Leste 89.7 83.9 95.1 … … … 2015 60+
Viet Nam 39.9 … … … … … 2015 60+ Men | 55+ Women
Southern Asia
Afghanistan 10.7 … … … … … 2010 60+ Men | 55+ Women
Bangladesh 33.4 … … … … … 2015 65+ (62+ for Old-age -allowances for women)
Bhutan 3.2 … … … 3.2 … 2012 56+
India 24.1 … … … 9.9 14.2 2011 58+
Iran, Islamic Repbulic of 21 26.4 … … … … … 2010 60+ Men | 55+ Women
Maldives 99.7 … … … 9.1 90.6 2012 65+
Nepal 62.5 … … … 9.2 53.3 2010 58+
Pakistan 2.3 … … … … … 2010 60+ Men | 55+ Women
Sri Lanka 22 25.2 … … … … … 2015 55+ Men | 50+ Women
Oceania
Australia 74.3 … … … … 74.3 2014 56+
Fiji 10.6 … … … … … 2015 55+
Marshall Islands 64.2 … … … 64.2 … 2010 60+
Nauru 56.5 … … … 15.5 41.0 2010 55+

120 Social protection for older persons: Policy trends and statistics 2017-19
Country/Territory Proportion by sex (%) Proportion by type of programme (%) Year Statutory pensionable age (basis for reference population)
Total Male Female No distinction available
Contributory Non- contributory a
New Zealand 100.0 100.0 100.0 … … 100.0 2014 65+
Palau 48.0 … … … … … 2010 62+
Papua New Guinea 0.9 … … … … … 2010 55+
Samoa 23 49.5 … … … 3.7 45.8 2011 55+
Solomon Islands 13.1 … … … … … 2010 50+
Tonga 24 1.0 … … … … … 2012 55+
Tuvalu 19.5 … … … … … 2005 70+
Vanuatu 25 3.5 … … … … … 2011 55+
EUROPE AND CENTRAL ASIA
Northern, Southern and Western Europe
Albania 26 77.0 100.0 60.8 … … … 2011 65+ Men | 60+ Women
Austria 100.0 100.0 100.0 … 94.0 6.0 2014 65+ Men | 60+ Women
Belgium 100.0 100.0 100.0 … … … 2014 65+
Bosnia and Herzegovina 29.6 … … … 29.6 … 2009 65+
Croatia 57.6 85.1 44.2 … … … 2010 65+ Men | 61.5+ Women
Denmark 100.0 100.0 100.0 … … 100.0 2014 65+
Estonia 100.0 … … … 2014 63+
Finland 100.0 100.0 100.0 … … … 2014 63–68+
France 100.0 100.0 100.0 … … … 2014 61.6+
Germany 100.0 100.0 100.0 … … … 2015 65.5+
Greece 77.4 100.0 54.6 … 60.4 17.0 2010 67 +
Iceland 85.6 … … … … … 2014 67+
Ireland 95.8 … … … … … 2014 66+
Isle of Man … … … … … … 65+ Men | 63+ Women
Italy 100.0 100.0 100.0 … … … 2014 66.6+
Jersey … … … … … … 65+
Kosovo … … … … … … 65+
Latvia 100.0 100.0 100.0 … … … 2014 62.8+
Lithuania 100.0 100.0 100.0 … … … 2014 63.3+ Men | 61.6+ Women
Luxembourg 100.0 100.0 100.0 … … … 2014 65+
Macedonia, the former Yugoslav Republic of 71.4 … … … … …
2015 64+ Men | 62+ Women
Malta 100.0 … … … … … 2014 62–65 +
Montenegro 52.3 … … … … … 2011 65 + Men | 60+ Women
Netherlands 100.0 100.0 100.0 … … … 2014 65.5+
Norway 100.0 100.0 100.0 … … … 2014 62+
Portugal 100.0 100.0 100.0 … … … 2014 66+
Serbia 46.1 48.4 44.8 … … … 2010 65+ Men | 61+ Women
Slovenia 100.0 100.0 100.0 … … … 2014 65+
Spain 100.0 100.0 100.0 … … … 2014 65+
Sweden 100.0 100.0 100.0 … … … 2014 61+
Switzerland 100.0 100.0 100.0 … … … 2014 65+ Men | 64+ Women
United Kingdom 100.0 100.0 100.0 … … … 2014 65+ Men | 63+ Women
Eastern Europe
Belarus 100.0 … … … … … 2015 60+ Men | 55+ Women
Bulgaria 100.0 100.0 100.0 … … … 2015 63.8+ Men | 60.8+ Women
Czech Republic 100.0 100.0 100.0 … … … 2014 63+ Men | 62.3 Women
Hungary 100.0 100.0 100.0 … … … 2014 63.5+
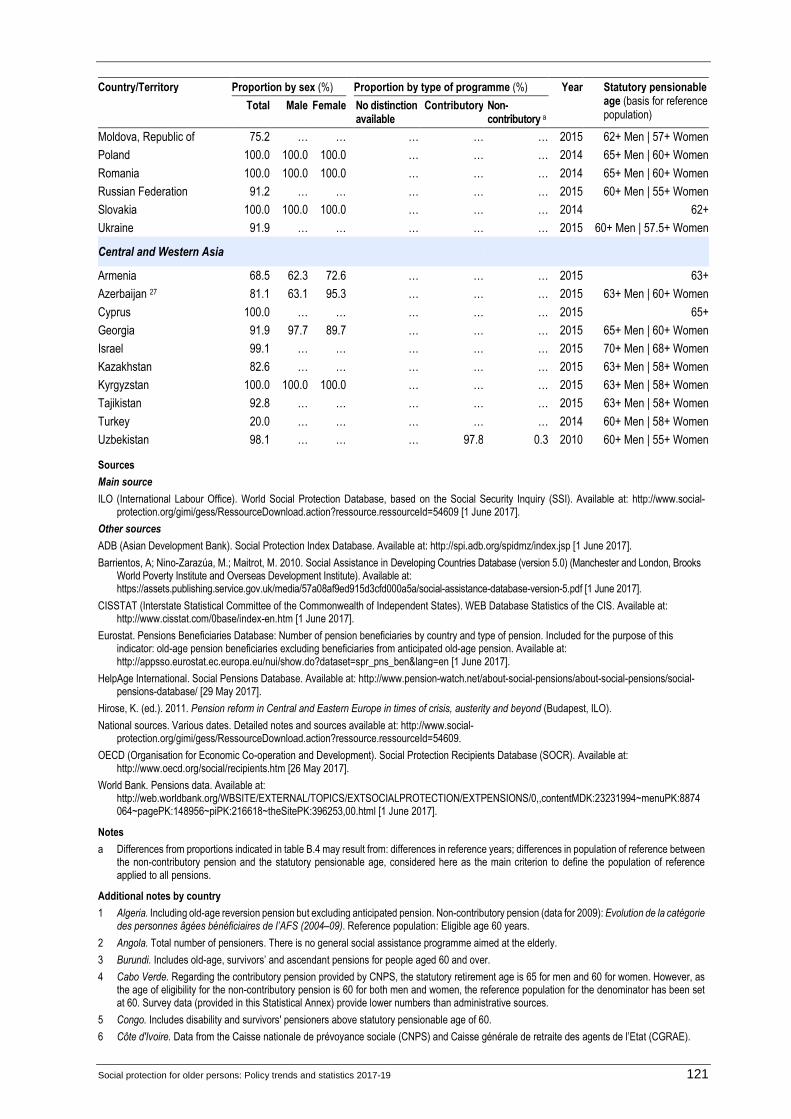
Social protection for older persons: Policy trends and statistics 2017-19 121
Country/Territory Proportion by sex (%) Proportion by type of programme (%) Year Statutory pensionable age (basis for reference population)
Total Male Female No distinction available
Contributory Non- contributory a
Moldova, Republic of 75.2 … … … … … 2015 62+ Men | 57+ Women
Poland 100.0 100.0 100.0 … … … 2014 65+ Men | 60+ Women
Romania 100.0 100.0 100.0 … … … 2014 65+ Men | 60+ Women
Russian Federation 91.2 … … … … … 2015 60+ Men | 55+ Women
Slovakia 100.0 100.0 100.0 … … … 2014 62+
Ukraine 91.9 … … … … … 2015 60+ Men | 57.5+ Women
Central and Western Asia
Armenia 68.5 62.3 72.6 … … … 2015 63+
Azerbaijan 27 81.1 63.1 95.3 … … … 2015 63+ Men | 60+ Women
Cyprus 100.0 … … … … … 2015 65+
Georgia 91.9 97.7 89.7 … … … 2015 65+ Men | 60+ Women
Israel 99.1 … … … … … 2015 70+ Men | 68+ Women
Kazakhstan 82.6 … … … … … 2015 63+ Men | 58+ Women
Kyrgyzstan 100.0 100.0 100.0 … … … 2015 63+ Men | 58+ Women
Tajikistan 92.8 … … … … … 2015 63+ Men | 58+ Women
Turkey 20.0 … … … … … 2014 60+ Men | 58+ Women
Uzbekistan 98.1 … … … 97.8 0.3 2010 60+ Men | 55+ Women
Sources
Main source
ILO (International Labour Office). World Social Protection Database, based on the Social Security Inquiry (SSI). Available at: http://www.social-protection.org/gimi/gess/RessourceDownload.action?ressource.ressourceId=54609 [1 June 2017].
Other sources
ADB (Asian Development Bank). Social Protection Index Database. Available at: http://spi.adb.org/spidmz/index.jsp [1 June 2017].
Barrientos, A; Nino-Zarazúa, M.; Maitrot, M. 2010. Social Assistance in Developing Countries Database (version 5.0) (Manchester and London, Brooks World Poverty Institute and Overseas Development Institute). Available at: https://assets.publishing.service.gov.uk/media/57a08af9ed915d3cfd000a5a/social-assistance-database-version-5.pdf [1 June 2017].
CISSTAT (Interstate Statistical Committee of the Commonwealth of Independent States). WEB Database Statistics of the CIS. Available at: http://www.cisstat.com/0base/index-en.htm [1 June 2017].
Eurostat. Pensions Beneficiaries Database: Number of pension beneficiaries by country and type of pension. Included for the purpose of this indicator: old-age pension beneficiaries excluding beneficiaries from anticipated old-age pension. Available at: http://appsso.eurostat.ec.europa.eu/nui/show.do?dataset=spr_pns_ben&lang=en [1 June 2017].
HelpAge International. Social Pensions Database. Available at: http://www.pension-watch.net/about-social-pensions/about-social-pensions/social-pensions-database/ [29 May 2017].
Hirose, K. (ed.). 2011. Pension reform in Central and Eastern Europe in times of crisis, austerity and beyond (Budapest, ILO).
National sources. Various dates. Detailed notes and sources available at: http://www.social-protection.org/gimi/gess/RessourceDownload.action?ressource.ressourceId=54609.
OECD (Organisation for Economic Co-operation and Development). Social Protection Recipients Database (SOCR). Available at: http://www.oecd.org/social/recipients.htm [26 May 2017].
World Bank. Pensions data. Available at: http://web.worldbank.org/WBSITE/EXTERNAL/TOPICS/EXTSOCIALPROTECTION/EXTPENSIONS/0,,contentMDK:23231994~menuPK:8874064~pagePK:148956~piPK:216618~theSitePK:396253,00.html [1 June 2017].
Notes
a Differences from proportions indicated in table B.4 may result from: differences in reference years; differences in population of reference between the non-contributory pension and the statutory pensionable age, considered here as the main criterion to define the population of reference applied to all pensions.
Additional notes by country
1 Algeria. Including old-age reversion pension but excluding anticipated pension. Non-contributory pension (data for 2009): Evolution de la catégorie des personnes âgées bénéficiaires de l’AFS (2004–09). Reference population: Eligible age 60 years.
2 Angola. Total number of pensioners. There is no general social assistance programme aimed at the elderly.
3 Burundi. Includes old-age, survivors’ and ascendant pensions for people aged 60 and over.
4 Cabo Verde. Regarding the contributory pension provided by CNPS, the statutory retirement age is 65 for men and 60 for women. However, as the age of eligibility for the non-contributory pension is 60 for both men and women, the reference population for the denominator has been set at 60. Survey data (provided in this Statistical Annex) provide lower numbers than administrative sources.
5 Congo. Includes disability and survivors' pensioners above statutory pensionable age of 60.
6 Côte d'Ivoire. Data from the Caisse nationale de prévoyance sociale (CNPS) and Caisse générale de retraite des agents de l’Etat (CGRAE).

122 Social protection for older persons: Policy trends and statistics 2017-19
Country/Territory Proportion by sex (%) Proportion by type of programme (%) Year Statutory pensionable age (basis for reference population)
Total Male Female No distinction available
Contributory Non- contributory a
7 Gabon. The number refers to all pensions, resulting in a possible overestimation of old-age pensioners.
8 Brazil. Age range used for the indicators: 65 and over for both men and women despite a statutory retirement age of 60 for women.
9 Colombia. Age range used for the indicator: 60 and over.
10 Costa Rica. The normal retirement age is 65 years with at least 300 months of contributions, although it can be reduced with additional months of contributions. Age 65 is used as a basis to define the reference population for this indicator.
11 Dominican Republic. Age range used for the indicator: 60 and over.
12 Nicaragua. The normal retirement age of 60 years is used as a basis to define the reference population for this indicator.
13 Panama. The normal retirement age of 62 (men) or 57 (women) are used as a basis to define the reference population for this indicator.
14 Uruguay. Proportion calculated for persons aged 60 and over. For those aged 65 and over, this proportion by sex reaches 85.9%.
15 United States. Retirement (includes OASI), all beneficiaries aged 65 and over. Includes beneficiaries in foreign countries.
16 Lebanon. There is currently no income security for the elderly through regular old-age pension benefits, only a lump sum.
17 China. Includes the number of people who have received Age Benefits for Urban and Rural Residents and Old-Age Benefits for Urban Workers. Regarding the statutory pensionable age, blue-collar female enterprise employees retire at 50 while white-collar female enterprise employees retire at 55. The 60 and above age group was taken for women.
18 Malaysia. Includes government pension scheme, which is the only one providing cash periodic benefits, and a social assistance programme targeting poor elderly with no family support.
19 Philippines. The old-age grant, launched in 2011, and the retirement programme for veterans, are considered non-contributory schemes.
20 Thailand. These proportions refer only to beneficiaries of the old-age or disability social pensions. As a result, the reference taken is not the statutory pensionable age of 55 but the age of eligibility for the old-age social pension (60 and over).
21 Iran, Islamic Republic of. Refers to the social security organization and state retirement fund.
22 Sri Lanka. This indicator refers to contributory mandatory schemes providing pensions for people above statutory retirement age (i.e. it excludes PSPS, which is a non-contributory scheme; EPF and ETF, providing lump sums; and the three voluntary social security schemes, Farmers’ Pension and Social Security Benefit Scheme, Fishermen’s Pension and Social Security Benefit Scheme, and Social Pension and Social Security Benefit Scheme (initially for self-employed only), which are voluntary and provide either lump-sum or periodic benefits.
23 Samoa. The Samoa National Provident Fund (SNPF) provides the option for a retirement pension or full withdrawal. Since the majority of SNPF members take the option of full withdrawal, there were only 445 pensioners and 276 beneficiaries (i.e. 3.7% of persons age 55 and over) in 2011.
24 Tonga. Only a minority of members opt for a regular pension once reaching pensionable age. In September 2010, the National Retirement Benefits Scheme (NRBS) Bill 2010 was passed by the Legislative Assembly, providing a similar mandatory superannuation plan for the private sector and other organizations. No statistics are available yet.
25 Vanuatu. Mainly withdrawals.
26 Albania. Includes old-age pensions including war veteran, special merit and supplementary pensions. Ratio above statutory retirement age.
27 Azerbaijan. For the calculation of the coverage, the lower eligible age (statutory pensionable age) of 60 is taken for consistency reasons.

Social protection for older persons: P
olicy trends and statistics 2017-19
123
Table B.7. Public social protection expenditure by guarantee (percentage of GDP)
Country/territory Total social protection
expenditure including health
(% of GDP)
Public social protection
expenditure for older persons
(% of GDP, without health)
Public social protection expenditure for persons of active age (% of GDP, without health)
Public social protection
expenditure for children
(% of GDP, without health)
Social benefits for persons of active
age (excluding general social assistance)
Unemployment Labour market programme
Sickness, maternity, employment injury,
disability
General social assistance
Lat
est
avai
lab
le
year
a
Yea
r
Lat
est
avai
lab
le
year
a
So
urc
e
Yea
r
Lat
est
avai
lab
le
year
a
So
urc
e
Yea
r
Lat
est
avai
lab
le
year
a
So
urc
e
Yea
r
Lat
est
avai
lab
le
year
a
So
urc
e
Yea
r
Lat
est
avai
lab
le
year
a
So
urc
e
Yea
r
Lat
est
avai
lab
le
year
a
So
urc
e
Yea
r
Lat
est
avai
lab
le
year
a
So
urc
e
Yea
r
AFRICA
Northern Africa
Algeria 8.5 2011 5.6 1 2016 0.3 5 2009 0.0 5 2009 … … 0.3 1 2009 0.9 1 2016 0.1 1 2016
Egypt 11.2 2015 3.0 2 2010 … … … … … … … … … … … …
Libya 6.6 2010 2.1 2 2010 … … n.a. … … … … … … … … …
Morocco 6.6 2010 3.0 2 2012 1.5 1 2010 n.a. 8 2010 … … 1.5 1 2010 0.1 1 2010 0.1 1 2010
Sudan 2.3 2010 … … … … … … … … … … … … … …
Tunisia 10.4 2011 5.2 2 2015 2.4 1 2010 … … … … 2.4 1 2010 0.7 1 2010 0.2 1 2010
Sub-Saharan Africa
Angola 6.0 2015 1.7 3 2015 0.2 3 2015 0.0 3 2015 … … 0.2 3 2015 … … 0.0 3 2015
Benin 4.2 2010 1.6 2 2011–15 0.1 1 2010 n.a. 8 2010 … … 0.1 1 2010 0.1 1 2010 0.4 1 2010
Botswana 6.6 2010 1.9 2 2014 1.3 1 2009 n.a. 8 2009 … … 1.3 1 2009 … … 0.6 1 2009
Burkina Faso 2.7 2015 1.0 1 2015 n.a. … n.a. 8 2009 … … 0.2 1 2015 1.4 1 2015 0.0 1 2015
Burundi 4.9 2010 0.7 2 2010 n.a. … 0.2 3 2013 … … 0.2 1 2010 0.0 3 2013 0.0 3 2013
Cabo Verde 6.9 2010 2.8 2 2013 1.9 1 2010 n.a. 8 2010 … … 1.9 1 2010 … … 0.2 1 2010
Cameroon 2.3 2010 0.5 1 2009 0.4 1 2009 n.a. 8 2009 … … 0.4 1 2009 … … 0.0 1 2014
Central African Republic 2.6 2012 0.6 1 2010 0.1 1 2010 n.a. 8 2010 … … 0.1 1 2010 … … 0.1 1 2010
Chad 1.3 2010 0.2 1 2010 0.1 1 2010 n.a. 8 2010 … … 0.1 1 2010 … … 0.0 1 2010
Congo 2.2 2012 1.0 1 2010 0.3 1 2010 0.0 1 2010 … … 0.3 1 2010 0.1 1 2010 0.1 1 2010
Congo, Democratic Republic of the 3.5 2012 0.4 2 2005 0.1 1 2005 n.a. 8 2005 … … 0.1 1 2005 … … 0.0 1 2005

124 S
ocial protection for older persons: Policy trends and statistics 2017-19
Country/territory Total social protection
expenditure including health
(% of GDP)
Public social protection
expenditure for older persons
(% of GDP, without health)
Public social protection expenditure for persons of active age (% of GDP, without health)
Public social protection
expenditure for children
(% of GDP, without health)
Social benefits for persons of active
age (excluding general social assistance)
Unemployment Labour market programme
Sickness, maternity, employment injury,
disability
General social assistance
Lat
est
avai
lab
le
year
a
Yea
r
Lat
est
avai
lab
le
year
a
So
urc
e
Yea
r
Lat
est
avai
lab
le
year
a
So
urc
e
Yea
r
Lat
est
avai
lab
le
year
a
So
urc
e
Yea
r
Lat
est
avai
lab
le
year
a
So
urc
e
Yea
r
Lat
est
avai
lab
le
year
a
So
urc
e
Yea
r
Lat
est
avai
lab
le
year
a
So
urc
e
Yea
r
Lat
est
avai
lab
le
year
a
So
urc
e
Yea
r
Côte d’Ivoire 2.0 2015 1.5 2 2013 0.2 10 2010 n.a. 8 2010 … … 0.2 1 2010 … … 0.3 10 2010
Djibouti 7.3 2007 1.5 2 2007 … … n.a. 8 2010 … … … … … … … …
Equatorial Guinea 2.8 2010 0.3 1 2010 0.2 1 2009 n.a. 8 2009 … … 0.2 1 2009 … … 0.0 1 2010
Eritrea 1.6 2011 0.3 2 2001 … … n.a. 8 2001 … … … … … … … …
Ethiopia 3.2 2010 0.3 2 2014 … … … … … … … … … … … …
The Gambia 4.2 2014 0.4 2 2006 0.2 1 2003 n.a. 8 2003 … … 0.2 1 2003 0.2 1 2003 0.0 1 2003
Ghana 5.4 2010 0.6 2 2014 0.7 1 2009 n.a. 8 2009 … … 0.7 1 2009 … … 0.3 1 2011
Guinea 2.5 2010 … … … … … … … … … … … … … …
Guinea-Bissau 5.4 2010 0.8 2 2014 0.7 1 2010 n.a. 8 2010 … … 0.7 1 2010 0.1 1 2010 0.1 1 2010
Kenya 2.3 2012 1.6 2 2013–15 0.1 5 2010 n.a. 8 2010 … … 0.1 5 2010 0.1 5 2010 0.1 5 2013
Lesotho 16.3 2011 1.3 2 2014 … … n.a. 8 2008 … … 0.0 1 2016 0.4 1 2016 0.3 1 2016
Liberia 3.3 2015 0.2 2 2010 … … n.a. 8 2010 … … … … … … … …
Madagascar 0.7 2014 1.4 2 2014 … … … … … … … … … … 0.0 3 2015
Malawi 1.0 2015 1.2 2 2015 … … … … … … … … 1.0 1 2015 … …
Mali 4.9 2010 1.6 2 2010 0.3 1 2009 n.a. 8 2009 … … 0.3 1 2009 0.1 5 2010 0.1 5 2010
Mauritania 4.9 2010 0.7 2 2007 … … n.a. 8 2009 … … … … … … … …
Mauritius 9.8 2014 4.5 2 2013–15 0.9 1 2011 0.0 1 2011 … … 0.9 1 2011 0.5 5 2011 0.3 1 2011
Mozambique 4.5 2015 1.8 2 2010 0.1 1 2010 n.a. 8 2010 … … 0.1 1 2010 0.1 1 2010 … …
Namibia 6.7 2015 2.4 2 2013 n.a. … 0.1 3 2015 … … 0.3 1 2011 0.8 1 2011 0.5 3 2015
Niger 2.9 2010 0.7 2 2006 … … … … … … … … … … … …
Nigeria 0.7 2013 0.9 2 2004 0.3 1 2004 n.a. 8 2004 … … 0.3 1 2004 0.2 1 2009 0.0 8 2004
Rwanda 7.3 2010 0.8 1 2009 n.a. … n.a. 8 2009 … … … … 0.1 1 2009 0.2 1 2009
Sao Tome and Principe 4.0 2014 0.1 1 2013 0.0 1 2013 … … … … 0.0 1 2013 0.6 1 2013 … …
Senegal 5.3 2010 1.9 1 2015 0.2 1 2010 n.a. 8 2010 … … 0.2 1 2010 0.1 1 2010 0.2 1 2015
Seychelles 7.5 2015 2.4 2 2014–15 2.3 3 2015 1.9 8 2015 … … 0.3 3 2015 … … 0.2 3 2015

Social protection for older persons: P
olicy trends and statistics 2017-19
125
Country/territory Total social protection
expenditure including health
(% of GDP)
Public social protection
expenditure for older persons
(% of GDP, without health)
Public social protection expenditure for persons of active age (% of GDP, without health)
Public social protection
expenditure for children
(% of GDP, without health)
Social benefits for persons of active
age (excluding general social assistance)
Unemployment Labour market programme
Sickness, maternity, employment injury,
disability
General social assistance
Lat
est
avai
lab
le
year
a
Yea
r
Lat
est
avai
lab
le
year
a
So
urc
e
Yea
r
Lat
est
avai
lab
le
year
a
So
urc
e
Yea
r
Lat
est
avai
lab
le
year
a
So
urc
e
Yea
r
Lat
est
avai
lab
le
year
a
So
urc
e
Yea
r
Lat
est
avai
lab
le
year
a
So
urc
e
Yea
r
Lat
est
avai
lab
le
year
a
So
urc
e
Yea
r
Lat
est
avai
lab
le
year
a
So
urc
e
Yea
r
Sierra Leone 4.2 2005 0.3 2 2014 0.1 1 2010 n.a. 8 2010 … … 0.1 1 2010 … … … …
South Africa 10.1 2015 3.4 2 2014–15 0.9 3 2015 0.2 3 2015 … … 0.6 3 2015 0.0 3 2015 1.6 3 2016
Swaziland 4.4 2012 2.1 2 2012–15 1.2 1 2010 n.a. 8 2010 … … 1.2 1 2010 0.0 1 2010 0.0 8 2010
Tanzania, United Republic of 6.8 2010 2.0 2 2013 0.0 1 2010 n.a. 8 2010 …
… 0.0 1 2010 0.4 1 2010 0.0 1 2010
Togo 2.6 2014 1.9 2 2014 0.0 1 2009 n.a. 8 2009 … … 0.0 5 2009 0.0 5 2009 0.2 5 2009
Uganda 2.2 2015 0.4 3 2015 0.4 1 2011 n.a. 8 2011 … … 0.4 1 2011 0.3 3 2015 0.0 3 2015
Zambia 5.5 2011 0.9 1 2015 0.0 1 2015 0.0 1 2015 … … 0.0 1 2015 0.1 1 2015 … …
Zimbabwe 5.6 2011 0.5 2 2015 0.1 1 2010 n.a. 8 2010 … … 0.1 5 2010 0.1 5 2011 0.2 5 2010
AMERICAS
Latin America and the Caribbean
Antigua and Barbuda 7.1 2011 0.0 2 2011 0.3 1 2006 … … … … 0.3 1 2006 … … 0.1 1 2006
Argentina … … 9.0 3 2015 n.a. … 0.1 3 2015 … … 5.1 5 2009 2.0 5 2009 1.6 3 2015
Bahamas 4.9 2015 1.9 5 2011 n.a. … 0.1 5 2011 … … 0.4 3 2015 … … 0.0 1 2011
Barbados 11.4 2010 4.1 1 2009 1.8 1 2009 0.6 1 2009 … … 1.2 1 2009 0.2 1 2009 0.0 8 2009
Belize 4.6 2015 0.1 2 2011 0.6 1 2010 n.a. 8 2010 … … 0.6 1 2009 1.1 1 2010 0.0 9 2010
Bolivia, Plurinational State of 10.2 2014 1.1 2 2014 2.5 5 2009 n.a. 8 2009
… …2.5 5 2009 1.5 1 2008
0.5 1 2014
Brazil 18.3 2015 9.6 2 2013–15 2.6 1 2010 0.7 1 2010 0.3 1 2010 1.7 1 2010 4.5 1 2010 0.6 1 2010
Chile 15.3 2015 3.0 4 2015 1.1 4 2015 0.1 4 2015 0.3 4 2015 0.7 4 2015 1.2 4 2015 1.7 4 2015
Colombia 14.1 2015 3.8 2 2015 3.9 1 2009 n.a. 8 2009 … … 3.9 1 2009 0.8 9 2010 0.4 9 2009
Costa Rica 13.6 2015 5.7 3 2015 3.4 1 2010 n.a. 8 2010 … … 3.4 1 2010 2.3 9 2010 1.3 3 2015
Cuba 18.0 2011 … … … … … … … … … … 2.7 1 2010 … …

126 S
ocial protection for older persons: Policy trends and statistics 2017-19
Country/territory Total social protection
expenditure including health
(% of GDP)
Public social protection
expenditure for older persons
(% of GDP, without health)
Public social protection expenditure for persons of active age (% of GDP, without health)
Public social protection
expenditure for children
(% of GDP, without health)
Social benefits for persons of active
age (excluding general social assistance)
Unemployment Labour market programme
Sickness, maternity, employment injury,
disability
General social assistance
Lat
est
avai
lab
le
year
a
Yea
r
Lat
est
avai
lab
le
year
a
So
urc
e
Yea
r
Lat
est
avai
lab
le
year
a
So
urc
e
Yea
r
Lat
est
avai
lab
le
year
a
So
urc
e
Yea
r
Lat
est
avai
lab
le
year
a
So
urc
e
Yea
r
Lat
est
avai
lab
le
year
a
So
urc
e
Yea
r
Lat
est
avai
lab
le
year
a
So
urc
e
Yea
r
Lat
est
avai
lab
le
year
a
So
urc
e
Yea
r
Dominica 8.0 2010 3.1 1 2011 0.5 1 2011 n.a. 8 2011 … … 0.5 1 2011 0.2 1 2011 0.0 1 2011
Dominican Republic 6.4 2014 0.9 3 2015 2.0 1 2010 n.a. 8 2010 … … 2.0 1 2010 0.8 3 2015 0.0 3 2015
Ecuador 7.8 2014 0.2 2 2012 0.2 1 2010 n.a. 8 2010 … … 0.2 1 2010 0.0 9 2010 0.2 1 2014
El Salvador 11.6 2015 1.1 3 2015 0.8 1 2015 0.0 3 2015 … … 0.8 3 2015 0.8 9 2009 0.3 9 2010
Grenada 4.3 2010 2.0 2 2006 … … n.a. 8 2006 … … … … … … … …
Guatemala 4.4 2011 0.5 1 2016 1.7 1 2009 n.a. 8 2009 … … 1.7 1 2009 0.0 9 2009 0.3 9 2009
Guyana 8.2 2010 1.1 2 2014 … … n.a. 8 2010 … … … … … … … …
Haiti 3.3 2013 … … … … … … … … … … … … … …
Honduras 4.4 2010 0.2 1 2015 0.2 1 2010 n.a. 8 2010 … … 0.2 1 2015 0.3 9 2010 0.2 9 2010
Jamaica 4.4 2011 0.9 1 2015 0.4 1 2009 n.a. 8 2009 … … 0.4 1 2009 0.8 1 2009 0.3 9 2011
Mexico 12.0 2015 1.7 2 2015 0.1 4 2011 0.0 8 2011 0.0 4 2011 0.1 4 2011 1.5 4 2011 1.1 4 2011
Nicaragua 6.3 2005 1.6 5 2009 0.5 5 2009 n.a. 8 2009 … … 0.5 5 2009 0.7 1 2009 0.1 9 2009
Panama 9.8 2015 2.7 1 2015 0.1 1 2015 0.0 1 2015 … … 0.1 1 2015 1.0 1 2015 … …
Paraguay 6.4 2010 0.4 2 2012 1.5 1 2010 n.a. 8 2010 … … 1.5 1 2010 0.7 1 2010 0.2 1 2010
Peru 5.5 2015 2.5 2 2010 0.8 1 2010 n.a. 8 2010 0.0 1 2015 0.8 1 2010 1.9 9 2010 0.1 9 2009
Saint Kitts and Nevis 5.6 2010 1.3 1 2009 1.5 1 2009 n.a. 8 2009 … … 1.5 1 2009 0.2 1 2009 0.0 1 2009
Saint Lucia 6.0 2010 1.2 1 2009 0.5 1 2009 n.a. 8 2009 … … 0.5 1 2009 0.1 1 2009 0.1 1 2009
Saint Vincent and the Grenadines 8.2 2010 1.5 2 2006 1.2 1 2006 n.a. 8 2009
… …1.2 1 2006 0.4 1 2006
0.2 1 2006
Trinidad and Tobago 9.0 2010 1.4 2 2012 0.2 1 2008 n.a. 8 2008 … … 0.2 1 2008 0.5 1 2008 0.1 1 2008
Uruguay 17.0 2015 8.9 1 2015 0.8 1 2015 0.6 1 2015 … … 0.3 1 2015 3.1 1 2010 0.4 1 2015
Venezuela, Bolivarian Republic of 8.8 2015 7.4 1 2015 …
… …
…
…
… 1.0 1 2015 …
…
…
…

Social protection for older persons: P
olicy trends and statistics 2017-19
127
Country/territory Total social protection
expenditure including health
(% of GDP)
Public social protection
expenditure for older persons
(% of GDP, without health)
Public social protection expenditure for persons of active age (% of GDP, without health)
Public social protection
expenditure for children
(% of GDP, without health)
Social benefits for persons of active
age (excluding general social assistance)
Unemployment Labour market programme
Sickness, maternity, employment injury,
disability
General social assistance
Lat
est
avai
lab
le
year
a
Yea
r
Lat
est
avai
lab
le
year
a
So
urc
e
Yea
r
Lat
est
avai
lab
le
year
a
So
urc
e
Yea
r
Lat
est
avai
lab
le
year
a
So
urc
e
Yea
r
Lat
est
avai
lab
le
year
a
So
urc
e
Yea
r
Lat
est
avai
lab
le
year
a
So
urc
e
Yea
r
Lat
est
avai
lab
le
year
a
So
urc
e
Yea
r
Lat
est
avai
lab
le
year
a
So
urc
e
Yea
r
Northern America
Canada 17.2 2015 4.6 4 2014 1.6 4 2014 0.6 4 2014 0.2 4 2014 0.8 4 2014 2.4 4 2014 1.2 4 2014
United States 19.0 2015 7.0 4 2013 2.0 4 2013 0.4 4 2013 0.1 4 2013 1.4 4 2013 1.2 4 2013 0.7 4 2013
ARAB STATES
Bahrain 4.0 2010 1.0 1 2010 0.5 1 2010 0.0 1 2010 … … 0.5 6 2010 0.1 6 2010 0.0 8 2010
Jordan 8.9 2015 4.4 3 2015 0.7 1 2010 n.a. 8 2010 0.0 1 2010 0.7 1 2010 0.6 1 2010 0.0 1 2010
Kuwait 11.4 2011 3.5 1 2011 … … n.a. 8 2011 … … … … … … … …
Lebanon 2.1 2015 2.7 2 2013 … … … … … … … … … … … …
Oman 3.8 2013 … … … … … … … … … … … … … …
Saudi Arabia 3.6 2011 0.3 2 2013 … … … … … … … … … … … …
Syrian Arab Republic 1.9 2010 1.3 2 2004 … … … … … … … … … … … …
Yemen 9.6 2012 0.5 5 2010 0.2 1 2010 n.a. 8 2010 … … 0.2 5 2010 0.1 5 2010 0.0 5 2010
ASIA AND THE PACIFIC
Eastern Asia
China 6.3 2015 3.7 1 2015 n.a. … 0.1 1 2015 0.1 1 2015 1.6 6 2009 0.3 6 2013 0.2 6 2009
Hong Kong, China 2.7 2015 1.6 2 2011 n.a. … n.a. 8 2010 … … 2.4 3 2013 0.0 6 2010 0.2 3 2013
Japan 23.1 2013 12.1 4 2013 1.4 4 2013 0.2 4 2013 0.2 4 2013 1.0 4 2013 0.4 4 2013 1.3 4 2013
Korea, Republic of 10.1 2015 2.7 4 2014 1.3 4 2014 0.3 4 2014 0.5 4 2014 0.6 4 2014 0.6 4 2014 1.1 4 2014
Mongolia 14.4 2015 5.5 1 2015 0.9 1 2015 0.1 1 2015 0.3 1 2015 0.5 1 2015 4.9 1 2015 1.3 1 2015
Taiwan, China 9.7 2010 4.7 5 2009 1.1 5 2009 0.3 1 2009 0.2 1 2009 0.6 5 2009 0.5 5 2009 0.4 5 2009
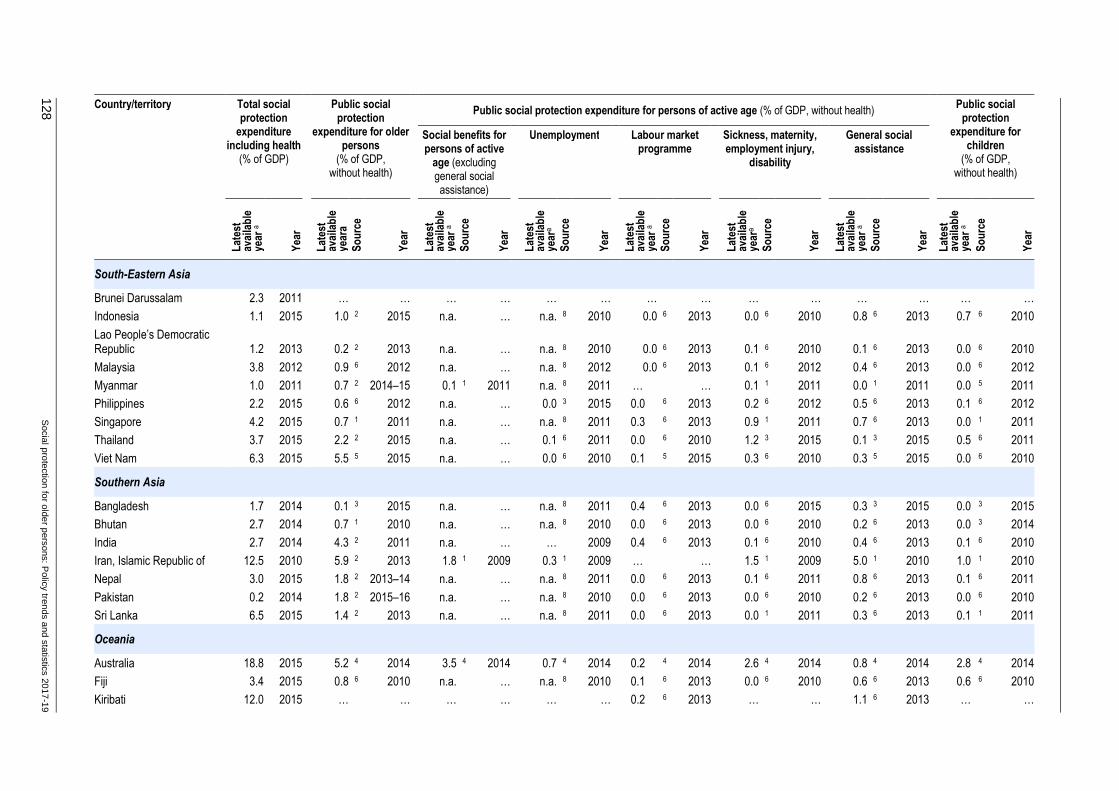
128 S
ocial protection for older persons: Policy trends and statistics 2017-19
Country/territory Total social protection
expenditure including health
(% of GDP)
Public social protection
expenditure for older persons
(% of GDP, without health)
Public social protection expenditure for persons of active age (% of GDP, without health)
Public social protection
expenditure for children
(% of GDP, without health)
Social benefits for persons of active
age (excluding general social assistance)
Unemployment Labour market programme
Sickness, maternity, employment injury,
disability
General social assistance
Lat
est
avai
lab
le
year
a
Yea
r
Lat
est
avai
lab
le
year
a
So
urc
e
Yea
r
Lat
est
avai
lab
le
year
a
So
urc
e
Yea
r
Lat
est
avai
lab
le
year
a
So
urc
e
Yea
r
Lat
est
avai
lab
le
year
a
So
urc
e
Yea
r
Lat
est
avai
lab
le
year
a
So
urc
e
Yea
r
Lat
est
avai
lab
le
year
a
So
urc
e
Yea
r
Lat
est
avai
lab
le
year
a
So
urc
e
Yea
r
South-Eastern Asia
Brunei Darussalam 2.3 2011 … … … … … … … … … … … … … …
Indonesia 1.1 2015 1.0 2 2015 n.a. … n.a. 8 2010 0.0 6 2013 0.0 6 2010 0.8 6 2013 0.7 6 2010
Lao People’s Democratic Republic 1.2 2013 0.2 2 2013 n.a. … n.a. 8 2010 0.0 6 2013 0.1 6 2010 0.1 6 2013 0.0 6 2010
Malaysia 3.8 2012 0.9 6 2012 n.a. … n.a. 8 2012 0.0 6 2013 0.1 6 2012 0.4 6 2013 0.0 6 2012
Myanmar 1.0 2011 0.7 2 2014–15 0.1 1 2011 n.a. 8 2011 … … 0.1 1 2011 0.0 1 2011 0.0 5 2011
Philippines 2.2 2015 0.6 6 2012 n.a. … 0.0 3 2015 0.0 6 2013 0.2 6 2012 0.5 6 2013 0.1 6 2012
Singapore 4.2 2015 0.7 1 2011 n.a. … n.a. 8 2011 0.3 6 2013 0.9 1 2011 0.7 6 2013 0.0 1 2011
Thailand 3.7 2015 2.2 2 2015 n.a. … 0.1 6 2011 0.0 6 2010 1.2 3 2015 0.1 3 2015 0.5 6 2011
Viet Nam 6.3 2015 5.5 5 2015 n.a. … 0.0 6 2010 0.1 5 2015 0.3 6 2010 0.3 5 2015 0.0 6 2010
Southern Asia
Bangladesh 1.7 2014 0.1 3 2015 n.a. … n.a. 8 2011 0.4 6 2013 0.0 6 2015 0.3 3 2015 0.0 3 2015
Bhutan 2.7 2014 0.7 1 2010 n.a. … n.a. 8 2010 0.0 6 2013 0.0 6 2010 0.2 6 2013 0.0 3 2014
India 2.7 2014 4.3 2 2011 n.a. … … 2009 0.4 6 2013 0.1 6 2010 0.4 6 2013 0.1 6 2010
Iran, Islamic Republic of 12.5 2010 5.9 2 2013 1.8 1 2009 0.3 1 2009 … … 1.5 1 2009 5.0 1 2010 1.0 1 2010
Nepal 3.0 2015 1.8 2 2013–14 n.a. … n.a. 8 2011 0.0 6 2013 0.1 6 2011 0.8 6 2013 0.1 6 2011
Pakistan 0.2 2014 1.8 2 2015–16 n.a. … n.a. 8 2010 0.0 6 2013 0.0 6 2010 0.2 6 2013 0.0 6 2010
Sri Lanka 6.5 2015 1.4 2 2013 n.a. … n.a. 8 2011 0.0 6 2013 0.0 1 2011 0.3 6 2013 0.1 1 2011
Oceania
Australia 18.8 2015 5.2 4 2014 3.5 4 2014 0.7 4 2014 0.2 4 2014 2.6 4 2014 0.8 4 2014 2.8 4 2014
Fiji 3.4 2015 0.8 6 2010 n.a. … n.a. 8 2010 0.1 6 2013 0.0 6 2010 0.6 6 2013 0.6 6 2010
Kiribati 12.0 2015 … … … … … … 0.2 6 2013 … … 1.1 6 2013 … …

Social protection for older persons: P
olicy trends and statistics 2017-19
129
Country/territory Total social protection
expenditure including health
(% of GDP)
Public social protection
expenditure for older persons
(% of GDP, without health)
Public social protection expenditure for persons of active age (% of GDP, without health)
Public social protection
expenditure for children
(% of GDP, without health)
Social benefits for persons of active
age (excluding general social assistance)
Unemployment Labour market programme
Sickness, maternity, employment injury,
disability
General social assistance
Lat
est
avai
lab
le
year
a
Yea
r
Lat
est
avai
lab
le
year
a
So
urc
e
Yea
r
Lat
est
avai
lab
le
year
a
So
urc
e
Yea
r
Lat
est
avai
lab
le
year
a
So
urc
e
Yea
r
Lat
est
avai
lab
le
year
a
So
urc
e
Yea
r
Lat
est
avai
lab
le
year
a
So
urc
e
Yea
r
Lat
est
avai
lab
le
year
a
So
urc
e
Yea
r
Lat
est
avai
lab
le
year
a
So
urc
e
Yea
r
New Zealand 19.7 2015 5.1 4 2014 3.3 4 2014 0.4 4 2014 0.3 4 2014 2.5 4 2014 1.0 4 2014 2.6 4 2014
Palau 7.1 2015 5.1 6 2010 n.a. … n.a. 8 2010 0.0 6 2013 0.2 6 2010 0.1 6 2015 1.7 6 2010
Papua New Guinea 3.6 2015 0.1 6 2010 0.0 6 2013 n.a. 8 2010 0.0 6 2013 … … 0.0 6 2013 0.1 6 2010
Samoa 2.0 2015 0.6 6 2011 0.1 6 2011 n.a. 8 2011 0.0 6 2013 0.0 6 2011 0.2 6 2013 0.1 6 2011
Solomon Islands 6.6 2015 1.3 6 2010 n.a. … 0.0 1 2010 0.1 6 2013 0.0 6 2010 0.0 6 2010 0.3 3 2015
EUROPE AND CENTRAL ASIA
Northern, Southern and Western Europe
Albania 11.9 2015 7.5 3 2015 0.1 3 2015 0.1 3 2015 … … 0.0 3 2015 … … 1.4 3 2015
Austria 28.0 2015 14.0 4 2013 4.0 4 2013 1.0 4 2013 0.8 4 2013 2.3 4 2013 0.5 4 2013 2.6 4 2013
Belgium 29.2 2015 10.5 4 2013 6.9 4 2013 3.2 4 2013 0.7 4 2013 2.9 4 2013 1.1 4 2013 2.9 4 2013
Croatia 21.6 2014 9.3 7 2014 3.1 7 2014 0.5 7 2014 … … 2.6 7 2014 0.2 7 2014 1.5 7 2014
Denmark 28.8 2015 10.1 4 2013 8.8 4 2013 2.3 4 2013 1.8 4 2013 4.7 4 2013 2.0 4 2013 3.7 4 2013
Estonia 17.0 2015 6.5 4 2013 2.7 4 2013 0.3 4 2013 0.2 4 2013 2.2 4 2013 0.1 4 2013 2.0 4 2013
Finland 30.6 2015 12.3 4 2013 6.8 4 2013 1.9 4 2013 1.0 4 2013 3.8 4 2013 1.4 4 2013 3.2 4 2013
France 31.7 2015 14.3 4 2013 4.2 4 2013 1.6 4 2013 0.9 4 2013 1.7 4 2013 1.5 4 2013 2.9 4 2013
Germany 25.0 2015 10.1 4 2013 3.7 4 2013 1.0 4 2013 0.7 4 2013 2.1 4 2013 0.8 4 2013 2.2 4 2013
Greece 26.4 2015 17.5 4 2012 2.3 4 2012 1.0 4 2012 0.3 4 2012 1.0 4 2012 0.7 4 2012 1.3 4 2012
Iceland 15.7 2015 2.5 4 2013 3.8 4 2013 0.9 4 2013 0.1 4 2013 2.8 4 2013 1.4 4 2013 3.6 4 2013
Ireland 17.0 2015 5.4 4 2013 5.5 4 2013 2.5 4 2013 0.9 4 2013 2.1 4 2013 0.6 4 2013 3.3 4 2013
Italy 28.9 2015 16.4 4 2013 3.8 4 2013 1.7 4 2013 0.4 4 2013 1.7 4 2013 0.2 4 2013 1.4 4 2013
Latvia 14.4 2015 7.7 4 2013 2.4 4 2013 0.5 4 2013 0.2 4 2013 1.8 4 2013 0.3 4 2013 1.2 4 2013
Lithuania 14.7 2014 6.6 7 2014 1.7 7 2014 0.3 7 2014 … … 1.4 7 2014 0.4 7 2014 1.1 7 2014
Luxembourg 22.2 2015 8.5 4 2013 4.7 4 2013 1.4 4 2013 0.6 4 2013 2.7 4 2013 0.8 4 2013 3.6 4 2013
Malta 18.2 2014 9.4 7 2014 1.2 7 2014 0.5 7 2014 … … 0.7 7 2014 0.4 7 2014 1.2 7 2014

130 S
ocial protection for older persons: Policy trends and statistics 2017-19
Country/territory Total social protection
expenditure including health
(% of GDP)
Public social protection
expenditure for older persons
(% of GDP, without health)
Public social protection expenditure for persons of active age (% of GDP, without health)
Public social protection
expenditure for children
(% of GDP, without health)
Social benefits for persons of active
age (excluding general social assistance)
Unemployment Labour market programme
Sickness, maternity, employment injury,
disability
General social assistance
Lat
est
avai
lab
le
year
a
Yea
r
Lat
est
avai
lab
le
year
a
So
urc
e
Yea
r
Lat
est
avai
lab
le
year
a
So
urc
e
Yea
r
Lat
est
avai
lab
le
year
a
So
urc
e
Yea
r
Lat
est
avai
lab
le
year
a
So
urc
e
Yea
r
Lat
est
avai
lab
le
year
a
So
urc
e
Yea
r
Lat
est
avai
lab
le
year
a
So
urc
e
Yea
r
Lat
est
avai
lab
le
year
a
So
urc
e
Yea
r
Netherlands 22.3 2015 6.4 4 2013 5.6 4 2013 1.6 4 2013 0.8 4 2013 3.1 4 2013 1.7 4 2013 1.3 4 2013
Norway 23.9 2015 7.9 4 2013 4.5 4 2013 0.3 4 2013 0.5 4 2013 3.7 4 2013 0.8 4 2013 3.0 4 2013
Portugal 24.1 2015 14.0 4 2013 4.0 4 2013 1.6 4 2013 0.5 4 2013 1.9 4 2013 0.2 4 2013 1.2 4 2013
San Marino 21.4 2010 … … … … … … … … … … … … … …
Serbia 23.4 2014 12.7 7 2014 2.4 7 2014 0.6 7 2014 … … 1.8 7 2014 0.5 7 2014 1.3 7 2014
Slovenia 22.4 2015 12.0 4 2013 3.2 4 2013 0.7 4 2013 0.4 4 2013 2.1 4 2013 0.7 4 2013 2.0 4 2013
Spain 25.4 2015 12.0 4 2013 6.3 4 2013 3.1 4 2013 0.6 4 2013 2.5 4 2013 0.3 4 2013 1.3 4 2013
Sweden 26.7 2015 10.0 4 2013 6.1 4 2013 0.5 4 2013 1.4 4 2013 4.3 4 2013 1.2 4 2013 3.6 4 2013
Switzerland 19.6 2015 6.6 4 2013 3.6 4 2013 0.8 4 2013 0.6 4 2013 2.3 4 2013 0.8 4 2013 1.6 4 2013
United Kingdom 21.5 2015 6.6 4 2013 2.5 4 2013 0.3 4 2013 0.2 4 2013 2.0 4 2013 1.8 4 2013 3.8 4 2013
Eastern Europe
Belarus 19.4 2015 8.0 2 2015 1.1 1 2010 0.0 3 2015 … … 1.1 1 2010 0.3 5 2010 0.2 3 2015
Bulgaria 18.5 2014 8.9 7 2014 1.9 7 2014 0.5 7 2014 … … 1.4 7 2014 0.3 7 2014 1.9 7 2014
Czech Republic 19.5 2015 8.9 4 2013 2.8 4 2013 0.6 4 2013 0.3 4 2013 1.8 4 2013 0.5 4 2013 2.2 4 2013
Hungary 20.7 2015 10.8 4 2013 3.2 4 2013 0.5 4 2013 0.8 4 2013 1.9 4 2013 0.4 4 2013 3.0 4 2013
Moldova, Republic of 18.1 2015 7.5 3 2015 1.8 3 2015 0.1 3 2015 … … 1.7 3 2015 1.3 3 2015 0.8 3 2015
Poland 19.4 2015 10.4 4 2012 2.9 4 2012 0.2 4 2012 0.4 4 2012 2.2 4 2012 0.2 4 2012 1.2 4 2012
Romania 14.8 2014 8.0 7 2014 0.5 7 2014 0.4 7 2014 … … 1.1 7 2014 0.2 7 2014 1.2 7 2014
Russian Federation 15.6 2015 8.7 3 2015 2.9 3 2010 0.2 1 2010 … … 2.7 1 2010 1.8 1 2010 0.6 3 2015
Slovakia 19.4 2015 7.5 4 2013 2.5 4 2013 0.4 4 2013 0.2 4 2013 1.9 4 2013 0.4 4 2013 2.1 4 2013
Ukraine 22.2 2015 13.7 3 2015 1.5 3 2015 0.4 3 2015 … … 1.1 3 2015 0.7 3 2015 1.8 3 2015
Central and Western Asia
Armenia 7.6 2015 5.6 3 2015 n.a. … 0.0 3 2015 0.0 6 2013 0.4 6 2011 2.0 6 2013 1.2 3 2015
Azerbaijan 8.2 2015 5.0 2 2014 n.a. … 0.1 6 2010 0.0 6 2013 0.5 6 2010 2.0 6 2013 0.4 3 2015

Social protection for older persons: P
olicy trends and statistics 2017-19
131
Country/territory Total social protection
expenditure including health
(% of GDP)
Public social protection
expenditure for older persons
(% of GDP, without health)
Public social protection expenditure for persons of active age (% of GDP, without health)
Public social protection
expenditure for children
(% of GDP, without health)
Social benefits for persons of active
age (excluding general social assistance)
Unemployment Labour market programme
Sickness, maternity, employment injury,
disability
General social assistance
Lat
est
avai
lab
le
year
a
Yea
r
Lat
est
avai
lab
le
year
a
So
urc
e
Yea
r
Lat
est
avai
lab
le
year
a
So
urc
e
Yea
r
Lat
est
avai
lab
le
year
a
So
urc
e
Yea
r
Lat
est
avai
lab
le
year
a
So
urc
e
Yea
r
Lat
est
avai
lab
le
year
a
So
urc
e
Yea
r
Lat
est
avai
lab
le
year
a
So
urc
e
Yea
r
Lat
est
avai
lab
le
year
a
So
urc
e
Yea
r
Cyprus 23.0 2014 12.3 7 2014 2.6 7 2014 1.9 7 2014 … … 0.7 7 2014 1.4 7 2014 1.4 7 2014
Georgia 10.6 2015 4.4 3 2015 0.8 3 2011 n.a. 8 2011 … … 0.8 6 2011 1.4 6 2011 2.3 3 2015
Israel 16.0 2015 5.4 4 2015 3.0 4 2015 0.3 4 2015 0.1 4 2015 2.5 4 2015 0.7 4 2015 1.9 4 2015
Kazakhstan 5.4 2015 3.4 1 2015 0.4 1 2015 … … 0.1 1 2015 0.3 1 2015 0.2 1 2015 0.2 1 2015
Kyrgyzstan 9.0 2014 9.0 3 2015 n.a. … 0.0 5 2014 0.0 6 2013 3.1 6 2010 2.5 6 2013 1.2 3 2015
Turkey 13.5 2014 8.3 4 2013 0.5 4 2013 0.1 4 2013 0.0 4 2013 0.3 4 2013 0.2 4 2013 0.4 4 2013
Uzbekistan 11.6 2014 6.5 2 2012 0.7 6 2010 … … 0.0 6 2013 0.7 6 2010 1.6 6 2013 1.9 6 2010
Sources
1 ILO (International Labour Office). World Social Protection Database, based on the Social Security Inquiry (SSI). Available at: http://www.social-protection.org/gimi/gess/RessourceDownload.action?ressource.ressourceId=54615 [June 2017].
2 World Bank. Pensions Database HDNSP, Performance indicators. Available at: http://web.worldbank.org/WBSITE/EXTERNAL/TOPICS/EXTSOCIALPROTECTION/EXTPENSIONS/0,,contentMDK:23231994~menuPK:8874064~pagePK:148956~piPK:216618~theSitePK:396253,00.html [7 June 2017].
3 IMF (International Monetary Fund). 2017. Government finance statistics (Washington DC) [June 2017].
4 OECD (Organisation for Economic Co-operation and Development). Social Expenditure Database (SOCX): Social and Welfare Statistics. Available at: https://stats.oecd.org/Index.aspx?DataSetCode=SOCX_AGG [8 June 2017].
5 National sources: Ministry of Finance.
6 ADB (Asian Development Bank). Social Protection Index Database. Available at: https://spi.adb.org/spidmz/ [1 June 2017].
7 Eurostat. 2014. Living Conditions and Welfare: Social Protection Database (ESSPROS) (Luxembourg). Available at: http://appsso.eurostat.ec.europa.eu/nui/show.do?dataset=spr_exp_gdp&lang=en [8 June 2017].
8 ISSA (International Social Security Association); SSA (US Social Security Administration). Various dates. Social security programs throughout the world (Geneva and Washington DC). Available at: http://www.ssa.gov/policy/docs/progdesc/ssptw/ [May 2017].
9 ECLAC (Economic Commission for Latin America and the Caribbean). Statistics and Indicators: Social Public Expenditure. Available at: http://estadisticas.cepal.org/cepalstat/WEB_CEPALSTAT/Portada.asp?idioma=i [1 June 2017].
10 UNICEF; Oxford Policy Management (OPM); Ministry of Employment, Social Affairs and Solidarity. 2012. Côte d’Ivoire. Cadre de Développement de la Stratégie Nationale de Protection Sociale en Côte d’Ivoire. Tome 1 tat des lieux, Défis et Perspectives de Renforcement de la Protection Sociale (Abidjan, UNICEF). Available at: http://www.opml.co.uk/sites/default/files/Situational%20analysis%20of%20social%20protection%20%28in%20French%29.pdf [May 2017].
Notes
…: Not available. n.a.: Not applicable. a Differences in global estimates from table B.16 of the World Social Protection Report 2017–19 (ILO, 2017b) result from differences in reference years and in number of countries considered.


![Sjzl20091240-ZXMBW AGW (V3[1].08.10) Software Installation Guide](https://img.pdfslide.us/doc/110x75/577cd5711a28ab9e789acc63/sjzl20091240-zxmbw-agw-v310810-software-installation-guide.jpg)
