Embed Size (px)
Citation preview

Evidence for ICT Policy ActionPolicy Paper 8, 2012
Understandingwhat is happening in ICTin Uganda
Ali Ndiwalana and F.F. Tusubira
A supply- and demand- side analysis of theICT sector

Research ICT AfricaResearch ICT Africa (RIA) is an information and communication technology (ICT) policy and regulation research network based in Cape Town, South Africa, under the directorship of Dr. Alison Gillwald. As a public interest think tank, RIA fills a strategic gap in the development of a sustainable information society and knowledge economy. The network builds the ICT policy and regulatory research capacity needed to inform effective ICT governance in Africa. RIA was launched a decade ago and has extended its activities through national, regional and continental partnerships. The network emanates from the growing demand for data and analysis necessary for appropriate but visionary policy required to catapult the continent into the information age. Through development of its research network, RIA seeks to build an African knowledge base in support of sound ICT policy and regulatory design, transparent implementation processes, and monitoring and review of policy and regulatory developments on the continent. The research, arising from a public interest agenda, is made available in the public domain, and individuals and entities from the public sector, private sector and civil society are encouraged to use it for purposes of teaching and further research or to enable them to participate more effectively in national, regional and global ICT policymaking and governance.
Series Editor: Alison Gillwald
Editorial assistance: Broc Rademan
Copy-editing: Chris Armstrong

Evidence for ICT Policy Action
AcknowledgementsResearch ICT Africa (RIA) is an information and communication technology (ICT) policy and regulation research network based in Cape Town, South Africa, under the directorship of Dr. Alison Gillwald. As a public interest think tank, RIA fills a strategic gap in the development of a sustainable information society and knowledge economy. The network builds the ICT policy and regulatory research capacity needed to inform effective ICT governance in Africa. RIA was launched a decade ago and has extended its activities through national, regional and continental partnerships. The network emanates from the growing demand for data and analysis necessary for appropriate but visionary policy required to catapult the continent into the information age. Through development of its research network, RIA seeks to build an African knowledge base in support of sound ICT policy and regulatory design, transparent implementation processes, and monitoring and review of policy and regulatory developments on the continent. The research, arising from a public interest agenda, is made available in the public domain, and individuals and entities from the public sector, private sector and civil society are encouraged to use it for purposes of teaching and further research or to enable them to participate more effectively in national, regional and global ICT policymaking and governance.
This research is made possible by significant funding received from the International Development Research Centre (IDRC), Ottawa, Canada, and RIA network members express their gratitude to the IDRC for its support. The network consists of members in 18 African countries, and RIA researchers in 12 countries were able to participate in the supply- and demand-side reviews of their national ICT sectors (as detailed in this and other national Sector Performance Reviews for 2012). The national reviews for 2012 were led by the following RIA network members: Dr. Patricia Makepe (Botswana); Prof. Olivier Nana Nzèpa (Cameroon); Dr. Lishan Adam (Ethiopia); Dr. Godfred Frempong (Ghana); Prof. Tim Waema (Kenya); Francisco Mabila (Mozambique); Dr. Christoph Stork (Namibia); Fola Odufuwa (Nigeria); Louise Karamage (Rwanda); Dr. Alison Gillwald (South Africa); Mary Materu-Behitsa (Tanzania); and Ali Ndiwalana (Uganda).
Dr. Christoph Stork and Mariama Deen-Swarray were responsible for the preparation of the statistical data and analysis for the 12 sets of national findings as well as comparative analysis across the 12 countries investigated in both RIA’s 2012 Household and Individual ICT Access and Use Surveys and Informal Sector ICT Access and Use Surveys. The Telecom Regulatory Environment (TRE) assessments, the compilation of supply-side indicators, and the collection and presentation of the pricing data, were coordinated across the 12 study countries by Enrico Calandro and Mpho Moyo. Additional peer-reviewing to that done amongst partners was undertaken by Steve Esselaar and Enrico Calandro.
The authors acknowledge, with thanks, assistance provided by various staff of the Uganda Communications Commission (UCC) and Bank of Uganda (BOU) towards preparation of this report, including the data collection.
AuthorsAli Ndiwalana a partner in Knowledge Consulting Ltd., has over 10 years of research experience in Africa and has undertaken various studies in ICT for development, ICT policy and regulation, and ICT access and use. He worked as a pioneer member of the Directorate for ICT Support (DICTS) at Makerere University, and as a member of the Mobile Financial Services team at Grameen Foundation, and he volunteers for the Research and Education Network of Uganda (RENU) and the UbuntuNet Alliance. He holds an MSc in Computer Science and Applications (Virginia Tech, US) and a Bachelor of Architecture (Makerere).
F.F. Tusubira (PhD, MIEE, FUIPE, CEng), a partner in Knowledge Consulting Ltd., has over 25 years of high-level leadership and consultancy experience in communication policy, regulation and technology, and ICT for development, especially within Africa. He has in-depth knowledge of Uganda’s ICT sector, having served as a founding Commissioner of the Uganda Communications Commission (UCC). He is a member (and current Chair) of the National Information Technology Agency-Uganda (NITA-U) and CEO of the UbuntuNet Alliance.
Design and layout: Grant Logan, Creative Storm | Cover image: Amy DeVoogd, Photodisc

Understanding what is happening in ICT in Uganda
Executive summaryThe analysis in this RIA Uganda Sector Performance Review (SPR) is based on the 2012 Research ICT Africa (RIA) Household and Individual ICT Access and Use Survey for Uganda, which delivered nationally representative results for households and individuals by using enumeration areas prepared by the Uganda Bureau of Statistics (UBOS) combined with suitable sample design.1
Uganda’s information and communication technology (ICT) sector has continued to grow over the last few years, driven especially by demand for both mobile voice and mobile internet services, with the ICT sector contributing 6% of the national GDP in 2010. However, despite this growth, Uganda has the second poorest Networked Readiness Index (NRI) score among the countries surveyed by RIA in 2012, ahead of only Cameroon.
The most significant recent development in Uganda’s ICT sector was the announcement in 2010 of the merger of the two regulators, the Uganda Communications Commission (UCC) and the Broadcasting Council (BC), to form one regulatory body, still called the Uganda Communications Commission (UCC). This merger was politically motivated and made via a Cabinet decision without Parliamentary input. Only in 2012 was the Uganda Communications Regulatory Authority Bill published as a draft law to consolidate the Uganda Communications Act and Electronic Media Act and provide for the merged regulator.2
Other important recent sector developments include the National Information Technology Authority Uganda Act of 2009, which established the National Information Technology Authority-Uganda (NITA-U); the revised Rural Communications Development Policy of 2009; the Regulation of the Interception of Communications Act of 2010 and Instrument of 2011 (which provide for the registration of all mobile telephony SIM cards); and the Draft Telecommunications Policy of 2012.
The number of licensed operators has not changed significantly over the last few years. MTN Uganda is the strongest player with its large market share in mobile provision, while other major players are Airtel Uganda, Warid Telecom, Orange Uganda, and Uganda Telecom. Fierce competition in mobile voice services has driven tariffs down to the point of eliminating price differentials between on-net and off-net calls. However, Uganda is still poorly ranked in Africa in terms of mobile voice cost, and its interconnection rate is still higher than in neighbouring Kenya and Tanzania.
During the 2010-11 period, the number of Ugandan mobile subscribers increased by a record 4.37million to a total of 16.7million. (The size of Uganda’s jump in active mobile SIM ownership since the previous RIA Survey in 2008 was second only to Kenya’s.) This jump has been ascribed to declining tariffs, sale of airtime in units as small as US$0.02, lower costs of handsets (approaching US$10 per unit) and the increasing penetration of mobile money. The 2012 RIA Uganda Survey revealed, however, that there are only about 8million phones in use in the country, with over 1million subscribers not owning a phone handset and merely owning only a SIM or multiple SIMs.
Access to the internet has improved, with Uganda having an estimated 4.8million internet users as of December 2011 – due to some extent to the lowering of prices since the landing of new fibre optic undersea cables on the east coast of Africa. Retail internet charges have not, however, dropped as much as would have been expected given the new fibre access because there is no effective backhaul competition. Individual internet access takes place predominantly via mobile telephony platforms, and access to computers remains very limited at only 4.8%.
1 See RIA (2012) for more on the RIA Survey Methodology.2 The merger will only be fully legal in early 2013 with the promulgation of the expected new Uganda Communications Act.
The ICT sector has contributed 6% of the national GDP
There are 4.37million more mobile subscribers than in 2010

Evidence for ICT Policy Action
The perceived level of effectiveness of Uganda’s regulatory environment, historically evaluated as one of the best on the continent, has steadily declined. The converging of the two regulators without an enabling law would appear to have had a significant underlying negative effect on perceptions of regulatory effectiveness during the period surveyed. In the absence of a clear guiding law between 2010 and 2012 on the mandate of the converged regulator, a measure of regulatory paralysis was inevitable. With the necessary legislation now passed by Parliament (and set to become effective in early 2013 via the new Uganda Communications Act), the UCC has an opportunity to re-stabilise the sector.
The key emerging trends identified in this SPR include:
the impending demise of the use of shared public payphones, due to the cheapness of handsets, the low mobile service costs, and the availability of low denominations of airtime;
dominance of mobile internet access due to the availability of internet-enabled mobile handsets/devices as well as competitive data packages tailored to all levels of users; and
growth in mobile financial services, including mobile bill payments and international money transfers.
This SPR offers the following recommendations for how Ugandan ICT policymakers can ensure that, in the near future, a significant majority of Ugandans has access to affordable ICT services and the sector plays an even greater role in the economy:
Regulatory emphasis must shift from attracting investment to ensuring better coverage and better quality of service (QoS), including regulation via effective use of QoS penalties.
The UCC must develop new approaches to ensuring greater inclusion in the benefits of ICT sector growth, through re-visiting universal service obligation (USO) targets and strategies.
Trade tariffs in Uganda are among the highest in the region. At the policy level, telecommunications should be seen as a business input, and there should be a shift from taxing inputs to taxing outputs. In addition to this, mobile phones and similar devices need to be re-categorised as computing devices so that taxes on them can be eliminated. At the regulatory level, the UCC needs to carry out analysis to ensure that trade tariffs are cost-based.
Government, the UCC, and the new NITA-U must anticipate emerging realities and position themselves in the market in such a way that the growth of new services is facilitated and promoted. In some service areas, such as mobile money, regulation is increasingly multi-sector, requiring various state entities to collaborate in oversight.
Uganda remains acutely short of policies and initiatives aimed at enabling mass ownership of connected devices, and there is also a shortage of coordinated efforts to exploit ICT sector opportunities. The national exploitation of ICT can no longer be addressed solely by the ICT line Ministry (the Ministry of Information and Communications Technology (MOICT)) and its associated entities (including the UCC). Ministries responsible for health, education, agriculture, and trade, for example, need to work with the MOICT to address matters such as e-health, m-health, e-education, m-education, e-commerce, m-commerce, and e-support services for agriculture.
An entrepreneurial culture is developing around the Ugandan mobile telephony market. An environment needs to be created in which operators are given incentives to open up their platforms to innovation, so that young entrepreneurs are able to start new businesses around existing mobile systems. Both the UCC and NITA-U have roles to play in this respect.
Internet-enabled mobile handsets have led to mobile internet dominance
Uganda remains acutely short of policies and initiatives aimed at exploiting ICT sector opportunities

Table of contents
Introduction 1
Main sector developments 3
ICT sector overview 4
Policy, legal, and institutional arrangements 4
Market structure, market share, players, and financial analysis 5
Players and market share 5
Financial analysis 6
ICT pricing 11
Mobile 13
Internet/broadband 18
ICT access and use 19
Fixed (fixed-line and fixed-mobile) 19
Mobile 21
Internet/broadband 23
Other ICTs 25
Emerging trends 28
Shared public payphones disappearing 28
Internet access increasingly mobile 29
Rise of mobile financial services 30
Mobile money 31
Registration 32
Services 34
Fees 34
Challenges 36
Telecom Regulatory Environment (TRE) assessment 37
Fixed 40
Mobile 41
Broadband 42
Historical comparison 43
Cross-country comparison 44
Conclusions 47
Recommendations 48
QoS and USO 48
Trade tariffs, taxes, and operator tariffs 48
New services 48
References 50

Evidence for ICT Policy Action
ATC American Tower Corporation
BC Broadcasting Council
BOU Bank of Uganda
BoP base of the pyramid
BPO business process outsourcing
CAGR compound annual growth rate
CCK Communications Commission of Kenya
CDMA code division multiple access
CDR call detail record
DSL digital subscriber line
EASSy Eastern Africa Submarine Cable System
FDI foreign direct investment
GDP gross domestic product
GPRS general packet radio service
GSM Global System for Mobile Communications
ICT information and communication technology
IDD international direct dialling
IMEI international mobile station equipment identity
IP Internet Protocol
ISDN integrated services digital network
ITU International Telecommunication Union
KYC Know Your Customer
LTE long-term evolution
MOICT Ministry of Information and Communications Technology
NBI National Data Transmission Backbone Infrastructure
NITA-U National Information Technology Authority - Uganda
NRI Networked Readiness Index
PIP public infrastructure provider
PSP public service provider
QoS quality of service
RCDF Rural Communications Development Fund
RIA Research ICT Africa
SIM subscriber identification module
SPR Sector Performance Review
TEAMS The East African Marine System
TRE Telecom Regulatory Environment
UBOS Uganda Bureau of Statistics
UCC Uganda Communications Commission
UGX Ugandan shilling
US$ US dollar
USF universal service fund
USO universal service obligations
UTL Uganda Telecom
VANS value-added network service
VAT value-added tax
VSAT very small aperture terminal
WiMAX worldwide interoperability for microwave access
Acronyms and abbreviations

1
Understanding what is happening in ICT in Uganda
IntroductionUganda’s ICT sector has continued to grow over the last few years, despite the global economic slowdown, thanks to the increasing demand for both mobile voice and mobile internet services. However, amongst the countries that participated in the 2012 round of RIA ICT Surveys, Uganda has the second-poorest Networked Readiness Index (NRI) score, ahead of only Cameroon (as shown in Table 1). The NRI is a combination of how favourable the country’s environment is for ICT development and diffusion (environment ranking); the ability to use, and interest in using, ICTs by individuals, businesses, and the government (readiness); and the actual use of ICTs. According to the World Economic Forum (WEF), which produces the NRI scores, Uganda’s political and regulatory environment is excellent, but its market and infrastructural environments are poor. In terms of both readiness and use, the WEF sees the Ugandan government as doing satisfactorily; but businesses are slightly behind, while individuals are seen as still lagging, reflecting potential room for growth in terms of demand for ICT services (WEF, 2011).
Table 1: WEF data on 10 RIA study countries
Country NRI Ranking
Environment Ranking
ReadinessUse
Overall Government Business Individual
Botswana 91 74 93 97 84 112 101
Cameroon 125 126 128 124 111 113 129
Ghana 99 82 80 108 116 102 112
Kenya 81 99 55 88 65 67 104
Mozambique 106 113 87 107 92 96 125
Namibia 82 56 71 109 129 90 107
Nigeria 104 105 108 99 123 81 92
South Africa 61 38 79 83 76 52 95
Tanzania 118 104 124 125 117 120 127
Uganda 107 102 105 118 109 111 121
Source: WEF (2011)
Other than Kenya (at 34.7%), Uganda reflected the highest jump (32.9%), since the previous 2008 RIA Survey, in mobile phone or active SIM ownership among RIA Survey respondents, as indicated in Figure 1. It was found that 53.6% of all respondents in the 2012 RIA Survey reported owning a mobile phone or active SIM card, a percentage that tallies with the teledensity rate of 52.1 as reported by the regulator the Uganda Communications Commission (UCC) (UCC, 2012). (It should be noted that while the 2008 Survey used 16 years of age as the cut-off age for defining adult respondents, the 2012 Survey lowered this to 15 years of age: this distorts comparisons to some extent but not sufficiently to negate the generalised observations that emerge.)
The number of licensed operators has not significantly changed over the last few years, but increasing competition amongst operators and growing demand have helped pull down the cost of most ICT services. Prices between on-net and off-net traffic have converged, resulting in operators struggling to differentiate their offerings and maintain loyal customer bases.
Increased demand for both mobile voice and internet services has kept the ICT sector growing
Increasing competition and growing demand have helped pull down the cost of most ICT services

2
Evidence for ICT Policy Action
Daily internet use has grown, as shown in Figure 2, and this increase can be attributed to some extent to better connectivity as a result of the landing of more undersea cables at the East African coast – though the resulting retail price drops have not been as significant as anticipated. Internet use is also increasingly mobile because more users now have internet-capable handsets and other mobile devices allowing internet connectivity.
Figure 1: Mobile phone or active SIM ownership in RIA countriesSource: RIA ICT Survey data 2011-12, 2007-08
Figure 2: Daily internet use among internet users in RIA countries Source: RIA ICT Survey data 2011-12, 2007-08
Ethiopia
Rwanda
Tanzania
Cameroon
Uganda
Namibia
Nigeria
Ghana
Botswana
Kenya
South Africa
3.2%
9.9%
21.5%
36.5%
20.7%
49.3%
59.8%
59.9%
52%
62.1%
19%
38.5%
41.7%
50.6%
53.6%
66.5%
69.4%
70.5%
83.5%
86.7%
87%
20082012
Cameroon
Uganda
Nigeria
Ghana
Ethiopia
Tanzania
Kenya
Botswana
Rwanda
Namibia
South Africa
11%
15%
13%
32%
15%
19%
31%
11%
35%
56%
19%
28%
34%
43%
47%
52%
53%
55%
57%
59%
64%
20082012
41%
Daily internet use has increased since the landing of undersea cables

3
Understanding what is happening in ICT in Uganda
Main sector developments
Probably the biggest development in the ICT sector since the 2008 RIA Survey has been the merger of the telecommunications sector regulator (the UCC) with the broadcast sector regulator, the Broadcasting Council (BC), to form a single regulatory body, still called the Uganda Communications Commission (UCC). Previously, broadcasting licensees would apply for spectrum from the UCC and be licensed to operate by the BC. While the merger was aimed at increasing efficiency, it has brought new challenges to the UCC, which now has to regulate matters of content (Balancing Act, 2011).
The merger also generated regulatory ineffectiveness in that it was implemented under political pressure, via a Cabinet decision, without a law to support it. The Bill (the Uganda Communications Regulation Authority Bill of 2012) for a law to merge the authority, via consolidation of the Uganda Communications Act and the Electronic Media Act, was only tabled in Parliament in 2012 and passed into law as the Uganda Communications Act in late 2012 (effective early 2013).1
Another significant development in the sector since the previous RIA ICT Survey has been the UCC’s decision to mandate operators to register all existing SIM cards (and new SIMs before activation) on their networks by March 2013, in terms of the Regulation of Interception of Communications Act of 2010. The Act provides for the registration of existing SIM cards, and the regulator has said that it will require operators to disable all SIMs not registered by the specified cut-off date of 1 March 2013. In the same vein, the UCC has said it will disable all mobile phones without IMEI numbers (referred to as “fake phones” and presumed to be counterfeits), in response to the local market being flooded with such phones from Kenya. However, the UCC has yet to follow through on this threat unlike its Kenyan counterpart the Communications Commission of Kenya (CCK) (Sudi, 2012).
Use of shared infrastructure amongst operators has gained prominence due to increased competition. In addition to leveraging the National Data Transmission Backbone Infrastructure (NBI) that is operational in some parts of the country – under the auspices of the National Information Technology Authority-Uganda (NITA-U) – operators are now spinning off their infrastructural assets as a way of minimising operational costs (NITA-U, n.d.). MTN Uganda was the first to take such a step when it signed a joint venture with American Tower Corporation (ATC), which now owns all of MTN’s tower sites in Uganda and hopes to sign on other operators for shared use (MTN Uganda, 2011). Orange Uganda then indicated its intention to sell its tower sites to Eaton Towers in 2012. These moves are motivated by operator efforts to cut costs and boost competitiveness, providing the nucleus for an independent infrastructure industry in the country (a growing trend in African states).
1 The regulatory merger will become legally formalised in early 2013 with the expected new Uganda Communications Act
A politically motivated Cabinet decision merged the tele-communications sector regulator with the broadcast sector regulator
Operators’ efforts to boost competitiveness are providing the nucleus for an independent infrastructure industry

4
Evidence for ICT Policy Action
ICT sector overview
Policy, legal, and institutional arrangements
Uganda has a new Draft Telecommunications Policy document of 2012 (MOICT, 2012), which is intended to coordinate and harmonise the disparate ICT efforts and policies across different government departments. The Ministry of Information and Communications Technology (MOICT), set up in 2006, provides oversight for the whole sector and spearheads policy formulation to support national development.
Based on a Cabinet decision taken in 2010 (as mentioned above), the regulator UCC was merged with the broadcast regulator BC to form one oversight body that is still called the UCC. Unfortunately, this merger was initiated purely under ministerial pressure in the absence of a convergence policy or enabling law. The merger thus reduced regulatory predictability in the sector and created confusion in the market: technically, the reconstituted UCC had no legal standing throughout the period covered by this SPR. Indeed, the UCC had to operate for a period without a formally constituted Commission because there was no clear framework for appointing Commissioners after the political decision to merge was taken. The merger also brought challenges to the hitherto telecommunications-focussed regulator, which now had to take on activities such as broadcast content regulation. The new law introduced to retroactively address the policy-legislative gap, the Uganda Communications Regulatory Authority Bill of 2012 (which is set to become the Uganda Communications Act of 2013), consolidated the two existing laws – the Uganda Communications Act (Cap. 106) and Electronic Media Act (Cap. 104) – which had established and detailed the mandate of the institutions prior to the merger.
The Rural Communications Development Fund (RCDF) is the closest equivalent in Uganda to a universal service fund (USF). The RCDF is managed by an independent board set up by the UCC, which retains the roles of oversight and policy direction. The Rural Communications Development Policy of 2009 was published to replace the previous Policy of 2007, but the 2009 Policy (UCC, 2009) has yet to be ratified by Parliament. The Policy is to guide the activities of the RCDF, which has made achievements in terms of rolling out infrastructure and services to rural areas. But the RCDF’s critics point out that roll-out and use are two different elements, and that some form of evaluation or impact assessment should have been an integral part of the RCDF programmes. In terms of the new Policy of 2009, the RCDF is to receive a mandate to fund research, and thus it should be able to more easily initiate monitoring and evaluation activities.
The Regulation of Interception of Communications Act of 2010 and its Instrument of 2011 provide for interception and monitoring of certain communications, irrespective of the communication channel, as a means to combat terrorism-related offences (Republic of Uganda, 2010, 2011). The law, when introduced as a Bill in 2007, initially failed to muster support in Parliament, but was then passed in 2010 after terrorist acts were committed in Uganda. When passed, the law included an amendment requiring a measure whereby all telecommunication companies must register the SIM cards of their subscribers. This law has thus provided the basis for Uganda’s ongoing SIM registration process, despite civil society arguments that the process infringes on personal privacy and has been misused by operators to sign up subscribers (without their consent) onto mobile money services (HRNJ-Uganda, 2012).
Other recent policies and strategies developed by the MOICT include the draft Transition from Internet Protocol Version 4 (IPv4) to Internet Protocol Version 6 (IPv6) Policy of 2010, the 2011 Information Management Services Policy, the 2011 National Information Security Strategy (NISS), and the 2011 Institutionalisation of ICT Function in Ministries, Departments, Agencies/Local Governments (MDAs/LGs) Report (submitted to the Ministry of Public Service for review).
Terrorist activities in 2010 ushered in the Regulation of Interception of Communications Act
The new telecom-munications regulator now has to regulate broadcast content

5
Understanding what is happening in ICT in Uganda
Another institution – in addition to the MOICT and the UCC – that influences activities in the ICT sector is the aforementioned NITA-U, which is a semi-autonomous body established to coordinate, promote and monitor ICT within the context of social and economic development in Uganda. NITA-U is responsible for the implementation of e-government, cyber-security, key public infrastructure, and management of the national fibre backbone (the aforementioned NBI). It is also responsible for promoting all aspects of IT and IT-enabled services. Although NITA-U has now been in existence for three years, its effect on the ICT sector has so far been limited.
4HYRL[�Z[Y\J[\YL��THYRL[�ZOHYL��WSH`LYZ��HUK�ÄUHUJPHS�HUHS`ZPZ
The UCC continues to operate under the technology-neutral licensing regime adopted in 2006, which differentiates between the provision of infrastructure and the provision of services. Public Infrastructure Providers (PIPs) are licensed to establish, maintain, operate, and provide telecommunication infrastructure to licensed Public Service Providers (PSPs) and private network operators. PSPs can also buy and resell capacity. Some licences were revoked during 2011 due to licensees’ inability to commence services or to fulfil regulatory requirements. The numbers of licensees in the two categories (PIP and PSP) in 2009, 2010 and 2011 are given in Table 2.
Table 2: Licensees between 2009 and 2011
Category Dec 2009 Dec 2010 Dec 2011
PIP 25 26 24
PSP (voice and data) 36 36 34
Source: UCC (2012)
The technology-neutral licensing regime has started to bear some fruit, as operators have begun to unbundle and divest their infrastructure assets (e.g. cellular towers) from core services. NITA-U has also finalised the process of outsourcing management operations for the NBI to a neutral third-party licensed as a PIP, giving birth to a nascent independent infrastructure industry.
Players and market share
The telecommunications market in Uganda is still dominated by mobile operator MTN Uganda in terms of both number of customers and revenue, although other operators have begun to erode some of this dominance, as can be seen in Table 3. The other major operators are Airtel Uganda (formerly Zain Uganda and before that Celtel Uganda), Warid Telecom, Uganda Telecom (UTL), and Orange Uganda. A few smaller players have emerged, which tend to focus on particular niches: e.g. i-Tel Uganda, which operates a CDMA network, and Smile Communications, which focuses on low-cost IP-based wireless technologies.
The technology-neutral licensing regime adopted in 2006 continues to differentiate between the provision of infrastructure and that of services

6
Evidence for ICT Policy Action
Table 3: Market shares of mobile operators, 2002-10
Operator Launch 2002 2007 2008 2010
MTN Oct. 1998 64.8% 45% 41% 48%
Airtel May 1995 21.1% 35% 25% 19%
UTL Jan. 2001 14.4% 20% 23% 13%
Warid Jan. 2008 - - 11% 14%
Orange Mar. 2009 - - - 2%
Source: UCC (2012)
Fierce competition in mobile voice services has driven down tariffs to the point of eliminating price differentials between on-net and off-net calls. Operators are now shifting their focus towards internet and data services (see Table 4) and mobile money, as differentiating vehicles through which to lure additional customers. However, by engaging in such a wide range of services, mobile operators are generating complaints of unfair competition from small businesses.
Table 4: Internet and data technologies and providers
Technology Service providers
3G, GPRS, and CDMA UTL, MTN, Airtel, Warid, Orange, i-Tel
Fibre and DSL UTL, MTN, Kampala Siti Cable, Infocom
ISDN and leased lines UTL, MTN
VSATAfsat Communications U, Africa Online Uganda, UTL, MTN, Infocom, Maisha Networks Uganda, Spidd Africa
Other wireless (including WiMAX)Foris Telecom, Tangerine Uganda, Datanet, One Solution, Augere, Infocom, Broadband Company, all telecom operators
Source: UCC (2012)
Financial analysis
The services sector dominates Uganda’s GDP (contributing 45.1% in 2011-12), in comparison to industry (26.3%) and agriculture, forestry, and fishing (23.7%), as summarised in Table 5.
Table 5: GDP contribution by sub sector
2007-8 2008-9 2009-10 2010-11 2011-12
Agriculture, forestry, and fishing 21.4% 23.1% 23.6% 22.7% 23.7%
Industry 25.8% 24.7% 24.9% 25.3% 26.3%
Services 46.9% 46.4% 45.5% 46.2% 45.1%
Source: UBOS (2012)
Pricing competition has just about eliminated differences in on-net and off-net prices

7
Understanding what is happening in ICT in Uganda
Except during the latest financial year (2011-12), growth in services has generally outpaced growth in the industry sub-sector and agriculture, forestry and fishing sub-sector in terms of GDP contributions, as shown in Table 6. One of the major components of the services sector is posts and telecommunications, which contributed 6% of GDP in the 2010 calendar year – primarily through foreign direct investment (FDI), employment, and paying taxes (UBOS, 2012).
Table 6: Growth by GDP sub sector
2007-8 2008-9 2009-10 2010-11 2011-12
Total GDP growth 8.7% 7.3% 5.9% 6.7% 3.2%
Agriculture, forestry, and fishing 1.3% 2.9% 2.4% 0.7% 3%
Industry 8.8% 5.8% 6.5% 7.9% 1.1%
Services 9.7% 8.8% 8.2% 8.4% 3.1%
Source: UBOS (2012)
Figure 3: Telecommunications sector contributions to national tax revenues (UGX, millions)Source: UCC (2012)
While competition has helped drive down ICT service costs, the costs are still high for Ugandans in low income brackets e.g. those in rural users. Typical costs, such as purchasing airtime or credit to call, include VAT (18%) and an excise duty (12%), increasing the total cost by about 30%. While such taxes generate income for government (see Figure 3), they also potentially stifle the growth and reach of telecommunications services. Evidence of the role played by pricing in ICT use can be inferred from the fact that the price war amongst operators in 2009, which reduced the price of mobile voice services, resulted in the largest one-year growth in new mobile subscriptions to date, with 4.37million new subscribers added during 2010-11. This subscriber growth also explains the surge in the telecommunications sector’s contribution to GDP – a contribution that doubled from 3.1% to 6.2% between 2009 and 2010.
2007/08
2008/09
2009/10
2010/11
PAYE VAT Excise
30 64368 245
100 750
22 56294 278
98 001
12 17654 628
88 775
11 10158 275
71 204
High taxes keep ICT costs from being affordable to rural users
The service sector’s growth has shrunk to 3.1%

8
Evidence for ICT Policy Action
Figure 4: Telecommunications sector investments and revenues (US$ millions)Source: UCC (2012)
Telecommunications operators have made significant investments in the Ugandan economy, and have in turn reaped substantial revenues (as summarised in Figure 4). However, in 2010-11, sector revenue dropped to US$660million from US$669million in 2009-10, partly due to the Ugandan shilling’s weakening against the US dollar.
Mobile network operators derive their revenues from a range of services that include, according to the UCC (proportions in brackets and based on 2009 figures):
mobile operations (voice, SMS, mobile money, handsets, etc.) (63%);
domestic interconnection (16%);
fixed-line revenue (14%);
internet revenue (4%);
international termination, roaming, etc. (2%); and
other (1%) (UCC, 2012).
A review of MTN’s interim results as of 30 June 2012 confirms the UCC’s revenue breakdown figures and helps to shed some light on the contribution of different services to the mobile operations umbrella (see Figure 5).
2005
2006
2007
2008
2009
Sector revenues (US$) Sector investments (US$)
50304
73365
368583
327640
271669
0 200 400 600 800
The majority of ICT investment goes to mobile operations

9
Understanding what is happening in ICT in Uganda
Figure 5: MTN Uganda revenue analysis (June 2012)Source: MTN Uganda (2012)
Meanwhile, network operations, distribution/marketing, and interconnection/roaming are the biggest cost categories for MTN (MTN Uganda, 2012) – as indicated in Table 7 – and presumably for other operators.
Table 7: MTN Uganda cost categories as a percentage of total revenue (June 2012)
Cost category As a percentage of revenue
Direct network and operating costs 15.6%
Cost of handsets and accessories 7.1%
Interconnect costs and roaming 10.6%
Employee benefits 5.4%
Selling, distribution, and marketing costs 11.7%
Other expenses 5.5%
TOTAL 55.9%
Source: MTN Uganda (2012)
Mobile money is emerging as a key service in operators’ arsenal that can help retain customers and maintain or grow the average revenue per user (ARPU). Publicly available figures from MTN indicate that while the churn rate for regular mobile customers is roughly 4.5% per month, the churn rate for active mobile money customers does not exceed 0.2% over a three-month period. Mobile money also directly contributes to mobile operators’ bottom-lines in a number of other ways, as summarised in the MTN Mobile Money data in Figure 6.
Other (includes MM)
Mobile handsets and accessories
SMS
Data
Interconnect
Airtime and subscription
4% 2%
63%14%
10%
7%
The churn rate of mobile money users is more than 4% lower than that of regular mobile users

10
Evidence for ICT Policy Action
Figure 6: MTN Uganda, Mobile Money gross profit contributionSource: MTN Uganda (2012)
Uplift in voice/data consumption
Airtime distribution on savings
Retained ARPU from churn reduction
Money transfer contribution
12%3%
52%33%

11
Understanding what is happening in ICT in Uganda
ICT pricingMTN Uganda’s CEO indicated in mid-2011 that MTN’s ARPU had fallen to about US$4 in the first half of 2011, compared to US$6 the previous year (Biryabarema, 2011). The drop could largely be attributed to competition amongst operators as they fought to attract each other’s customers. Marketing strategies revolve around encouraging users to call within one’s network by offering them cheaper on-network (on-net) calls (e.g. from one MTN Uganda number to another MTN Uganda number) compared to off-net (e.g. MTN to Airtel). Warid kicked off the cycle with its Pakalast campaign, which offered unlimited on-net calls for 24 hours at a flat cost of UGX1 000, forcing other operators to follow suit with similar campaigns. However, mobile operators’ infrastructure investments were not commensurate with their increasing traffic, and the inevitable results were poor quality of service (QoS) and sustained public outcry, eventually prompting the regulator to step in and limit the promotions.
A key element that emerged from this controversy around price promotions and QoS was a sector discussion of the need for determination of a standard interconnection rate amongst mobile operators. Currently, the interconnection rate for routing a call from one operator’s network to a competitor’s stands at UGX112, effective from 1 June 2012, based on a six-month study commissioned by the UCC from PricewaterhouseCoopers. Despite this UCC effort to bring down costs, Uganda remains poorly ranked in cost terms among African countries (see Table 8). Regionally in East Africa, Uganda’s interconnection rate is still higher than that of neighbours Kenya and Tanzania (Tentena, 2012).
Table 8: Mobile prepaid affordability, June 2012 monthly cost calculations, based on the OECD low-user basket
CountryCheapest product from
dominant operatorCheapest product
in country Percentage cheaper than dominant operator
Rank US$ Rank US$
Mauritius 1 2.39 5 2.39 Dominant is cheapest
Kenya 2 2.61 2 1.9 27.50%
Namibia 3 2.74 6 2.74 Dominant is cheapest
Egypt 4 2.85 7 2.85 Dominant is cheapest
Ethiopia 5 2.99 8 2.99 Monopoly
Ghana 6 3.38 9 3.28 2.90%
Sudan 7 3.53 1 1.17 66.90%
Libya 8 3.9 12 3.9 Dominant is cheapest
Rwanda 9 4.28 14 4.28 Dominant is cheapest
Tunisia 10 4.3 13 4.18 2.70%
Guinea 11 4.62 3 1.93 58.10%
Sierra Leone 12 5.04 11 3.88 23.10%
The average revenue per user dropped by US$2
A fixed interconnection rate became effective on 1 June 2012

12
Evidence for ICT Policy Action
CountryCheapest product from
dominant operatorCheapest product
in country Percentage cheaper than dominant operator
Rank US$ Rank US$
Benin 13 5.21 17 5.21 Dominant is cheapest
Tanzania 14 5.4 10 3.75 30.70%
Uganda 15 5.51 16 4.51 18.20%
Congo Brazzaville 16 5.63 19 5.63 Dominant is cheapest
Algeria 17 6.21 4 2.28 63.30%
Mozambique 18 7.4 20 7.4 Dominant is cheapest
Mauritania 19 8.02 23 7.77 3.20%
Sao Tome & Principe 20 8.21 25 8.21 Dominant is cheapest
Botswana 21 8.25 22 7.66 7.10%
Madagascar 22 8.46 27 8.46 Dominant is cheapest
South Africa 23 8.5 28 8.5 Dominant is cheapest
Liberia 24 8.51 24 8.09 4.90%
Mali 25 8.78 30 8.78 Dominant is cheapest
Burkina Faso 26 8.88 29 8.53 4%
Nigeria 27 9.14 18 5.22 42.80%
Togo 28 9.28 32 9.28 Dominant is cheapest
Central African Republic
29 9.86 35 9.86 Dominant is cheapest
Senegal 30 10.08 33 9.37 7%
Chad 31 10.14 36 10.14 Dominant is cheapest
D.R. Congo 32 10.37 21 7.62 26.50%
Côte d’Ivoire 33 10.41 38 10.41 Dominant is cheapest
Cameroon 34 10.44 37 10.28 1.50%
Zambia 35 12.05 26 8.22 31.80%

13
Understanding what is happening in ICT in Uganda
CountryCheapest product from
dominant operatorCheapest product
in country Percentage cheaper than dominant operator
Rank US$ Rank US$
Niger 36 12.3 34 9.77 20.60%
Swaziland 37 12.53 42 12.53 Dominant is cheapest
Morocco 38 12.93 44 12.93 Dominant is cheapest
Zimbabwe 39 13.48 43 12.56 6.80%
Angola 40 13.76 40 12.13 11.80%
Malawi 41 14.51 45 14.47 0.30%
Lesotho 42 15.24 41 12.43 18.40%
Gabon 43 16 31 9.09 43.50%
Cape Verde 44 18 46 18.15 Dominant is cheapest
Gambia 49 0 15 4.33 n/a
Seychelles 53 0 39 10.63 n/a
Burundi 45 0 47 0
Djibouti 46 0 48 0
Equatorial Guinea 47 0 49 0
Eritrea 48 0 50 0
Guinea-Bissau 50 0 51 0
Comoros 51 0 52 0
Somalia 52 0 53 0
Source: RIA Price Transparency Index (see RIA, n.d.) See OECD (2010) for details on the OECD telecommunication price baskets.
Mobile
As shall be seen below, there has been steady growth in the number of mobile subscribers in the past decade (i.e. since 2001) – in terms of figures which include multiple subscriptions by multiple-SIM owners (users who complement use of their primary service provider by holding additional SIMs from other providers). One would have expected the multiple-SIM phenomenon to decline when the cost of making local calls within one’s network (on-net) became similar (or even identical) to making calls on other mobile networks (off-net). As indicated in Table 9, only Warid users are in 2012 faced with a differing tariff between on-net and off-net; for the other main mobile operators, on-net and off-net calls are priced identically. (The use of multiple SIMs is an innovation that emerged to take advantage of on-net call tariffs being cheaper compared to off-net calls.)
Although there has been a growth in the number of mobile subscribers, multiple SIM ownership has not subsided

14
Evidence for ICT Policy Action
However, it is apparent that even with on-net/off-net differentials having largely disappeared, there are still other reasons why people want to own multiple SIMs. For instance, people want to take advantage of the different national coverage areas of the mobile networks, and to base use on the quality of a particular network at a particular time of day. And operators encourage users to have alternate SIMs by selling dual-SIM phones – phones that lock in the operator’s SIM but also allow for use of another SIM – seemingly in the hopes of building subscriber numbers and generating loyalty through being seen to treat users fairly. And now the large handset manufacturers, such as Nokia and Samsung, have joined what started as a niche market by producing dual-SIM phones.
Table 9: Local per-second tariffs, on-net and off-net, across the major providers (UGX)
Category Airtel MTN Orange UTL Warid
Plan Mass market offer PerSecond Talk More Standard Freedom per second
On-net Peak 4 4 4 3 3
Off-peak 4 4 4 3 3
Discount 4 4 4 3 3
Off-net Peak 4 4 4 3 4
Off-peak 4 4 4 3 4
Discount 4 4 4 3 4
Source: Operator websites (2012)
The 2012 RIA Uganda ICT Survey found that about 30% of Ugandan mobile subscribers have more than one SIM, as indicated in Figure 7 – a figure lower than the UCC’s 2011 estimate that more than 40% of subscribers had more than one SIM (UCC, 2011), but still a high proportion of users.
Even though on-net/off-net price differentials have largely disappeared, multiple SIM ownership has not

15
Understanding what is happening in ICT in Uganda
Figure 7: Single-SIM v. multi-SIM ownership in 2012 RIA ICT Survey countriesSource: RIA ICT Survey data 2011-12
It is not yet clear how the mandatory SIM registration exercise instituted by the UCC is going to affect total mobile subscriptions or multiple-SIM ownership. All of the operators have embarked on the SIM registration process with apparent enthusiasm, despite having to pay for the exercise using their own resources. It is likely that operators see the SIM registration exercise as an opportunity to maintain their shares of the market or even to make some inroads into the subscribers of competitors. Since the registration is at no cost to the user (apart from the cost of a photograph), it can be anticipated that most multiple-SIM holders will register all their SIMs.
The UCC has intimated that it will switch off all SIMs that are not registered by 1 March 2013 but, judging from experiences in Uganda’s neighbours Kenya and Tanzania who have had similar exercises fraught with extended deadlines, it remains to be seen how this exercise will conclude.
Prepaid tariff plans dominate mobile use in Uganda (as in other parts of Africa), as captured by Figure 8.
Ethiopia
Namibia
South Africa
Cameroon
Botswana
Kenya
Ghana
Nigeria
1 Active SIM More than 1
2.8%97.2%
7.2%92.8%
14.2%85.7%
22.6%77.4%
23.1%76.9%
24.9%75.1%
27.9%72.1%
27.9%72.1%
Uganda 30.1%
Rwanda 36.9%63.1%
69.9%
37.6%62.4%
Tanzania
There has been little dragging of feet from operators who have eagerly gone ahead with the registration of all SIMs

16
Evidence for ICT Policy Action
Figure 8: Prepaid v. postpaid mobile tariffs across RIA Survey countries Source: RIA ICT Survey data 2011-12
The 2012 RIA ICT Survey included questions to gauge price sensitivity, i.e. to determine how subscribers are likely to react to changes in tariffs In Uganda, 48.6% of users say a price decrease of 50% would lead to only a slight increase in their use of services. However, 27.1% of Ugandan users say they would double their phone use if prices decreased 50%, and 7.6% say they would more than double their phone use (see Table 10). It was found that 16.7% of respondents would not change their use if prices dropped 50%.
South Africa
Rwanda
Namibia
Ghana
Botswana
Uganda
Ethiopia
Cameroon
Postpaid Prepaid
87.5%12.5%
90.1%9.9%
91.8%8.2%
97.4%2.6%
97.4%2.6%
98.0%2.0%
98.4%1.6%
99.0%1.0%
Nigeria 99.0%
Tanzania 99.5%0.5%
1.0%
99.8%0.2%
Kenya
Most users would not double their phone use if prices decreased by 50%

17
Understanding what is happening in ICT in Uganda
Table 10: Predicted responses, in RIA ICT Survey countries, to 50% drop in mobile tariffs
Country Survey Unchanged phone use
Slight increase
Double my phone use
More than double my phone use
Uganda2012 16.7% 48.6% 27.1% 7.6%
2007-08 5.6% 89.8% 3.8% 0.8%
Kenya2012 17.9% 44.5% 31.1% 6.5%
2007-08 13.4% 45.8% 27.3% 13.5%
Tanzania2012 31.3% 52.8% 13% 2.9%
2007-08 27.9% 35.5% 23.7% 12.9%
Rwanda2012 24.5% 53.1% 21% 1.4%
2007-08 22.9% 40.8% 11.1% 25.1%
Ethiopia2012 10.7% 70.2% 16.7% 2.3%
2007-08 30.1% 45.2% 21.3% 3.4%
Ghana2012 22.8% 45.8% 24.9% 6.5%
2007-08 18.7% 49.2% 21.3% 10.9%
Cameroon2012 16.9% 32.6% 47.9% 2.7%
2007-08 14.3% 52.2% 27.1% 6.4%
Nigeria2012 15.9% 27.7% 48.4% 8%
2007-08 N/A N/A N/A N/A
Namibia2012 13.4% 48% 29.9% 8.7%
2007-08 20.6% 20.7% 26.7% 32%
South Africa2012 27.5% 33.5% 33.5% 5.5%
2007-08 27.6% 38.4% 18.5% 15.5%
Botswana2012 25.1% 30.8% 36.5% 7.6%
2007-08 31.8% 42.4% 21.7% 4%
Source: RIA ICT Survey data 2007-08, 2011-12
It is reasonable to assume that those who say their use would remain unchanged can comfortably afford the current tariffs, while those who say they would increase their use are currently constrained by lack of affordability. It can therefore be predicted that sharp price reductions would bring more use. However, for the operators, careful cost-benefit analysis would be required to determine whether or not the reductions in revenue caused by a price decrease would be more than offset by revenue increases through increased use.
Careful cost-benefit analysis is needed to determine whether or not price reductions would be offset by increased use

18
Evidence for ICT Policy Action
Internet/broadband
Uganda’s costs for internet/broadband bundles are summarised in Figure 9. The costs are still high compared to prices for similar capacity in high-income countries, despite the operationalisation of multiple submarine fibre-optic cables landing along the East African coast. The poor and uncompetitive backhaul infrastructure from land-locked Uganda to the undersea cables at the coast, as well as the lack of a critical mass of internet users within the country, partly explain the continuing high cost of internet access. Slow progress on the national backbone infrastructure also makes it difficult to cheaply distribute bandwidth across the country.
NITA-U has contracted a company to operate the national backbone on a commercial basis in order to bring more capacity to the market, and is planning to establish an alternative backhaul route via Tanzania’s main city Dar es Salaam. NITA-U is also trying to take advantage of economies of scale in the sector by aggregating bandwidth needs from all government departments and educational institutions and procuring from a single entity. NITA-U has invited offers for the supply of bulk bandwidth which, when combined with cost-based access over the national fibre backbone, could have a significant impact on the supply side of costing and pricing.
Figure 9: Monthly internet bundle prices (UGX)Source: Operator websites (2012)
Warid
10GB 3GB 1GB 500MB
140 000
35 00025 000
UTL 82 500145 000
42 500
Orange
MTN
Airtel
14 500
75 000125 000
37 50020 000
85 000150 000
45 00025 000
20 0000 40 000 60 000 80 000 100 000 120 000 140 000 160 000
85 000150 000
45 00025 000
Uganda’s internet prices remain high despite the operationalisation of multiple submarine fibre-optic cables

19
Understanding what is happening in ICT in Uganda
ICT access and useICT access and use continue to improve across Uganda as a result of falling prices (discussed in the previous section) and increased investment in infrastructure by different providers. Coverage is still dominated by mobile technologies while use tends towards individual access devices more than shared-access methods.
-P_LK��Ä_LK�SPUL�HUK�Ä_LK�TVIPSL�
Both fixed and mobile penetration continue to grow, as shown in Table 11.
Table 11: Ugandan telephony subscriptions and teledensity, 2009-11
Dec 2009 June 2010 Dec 2010 June 2011 Dec 2011
Fixed-line subscriptions 233 533 265 890 327 114 342 624 464 849
Mobile subscriptions 9 383 734 10 375 220 12 828 264 14 676 505 16 696 992
Teledensity (per 100 people) 31.4 41.4 45.6 52.1
Source: UBOS (2012)
Meanwhile, as shown in Figure 10, fixed-line growth is slow and the total number of fixed lines very low (when compared to that of mobile, which is discussed below).
Figure 10: Ugandan fixed-line subscriptions, 2001-11Source: UCC (2012)
200 000 300 000 500 000400 000100 0000
2001
2002
2003
2004
2005
2006
2007
2008
2009
2010
2011
56 149
59 472
65 793
82 495
100 777
129 863
165 788
168 481
233 533
327 114
464 849
Both mobile and fixed-line subscriptions continue to grow but at starkly different rates

20
Evidence for ICT Policy Action
Business customers concentrated around the capital city Kampala and in other urban areas are the drivers of the limited growth in fixed-line services, with a small contribution from shared public payphones using fixed connections. According to the 2012 RIA ICT Surveys across multiple countries, the proportions of individuals using shared public payphones in 2012, compared with the proportions identified in the 2008 RIA Survey, dropped in all survey countries except Cameroon and Ghana (Figure 11).
Figure 11: Use of a shared public payphone in previous 3 months Source: RIA ICT Survey data 2011-12 and 2007-08
In Uganda, the percentage of payphone users (mostly using payphones operated by umbrella operators connected to a mobile network) fell from 39.5% in the 2008 RIA ICT Survey to 14.8% in the 2012 Survey. This is presumably due to cheaper mobile handsets allowing more people to buy their own individual phones, and the availability of airtime in smaller denominations enabling people to buy airtime for single calls instead of using shared services for such calls. A user can now buy a basic mobile phone (with FM radio and torch) for under UGX30 000 (about US$10) and load airtime in denominations as low as UGX50 (about US$0.016) (MTN Uganda, n.d.2).
Tanzania
Namibia
Kenya
Rwanda
Botswana
Ethiopia
Ghana
Uganda
2007-08 2012
1.1%97.3%
1.3%14.5%
5.4%24.1%
5.7%73%
6.5%27.4%
9.6%14.7%
12.8%6%
14.8%39.5%
Nigeria21%
South Africa28.7%
42.2%
49.4%44.1%
Cameroon
Public payphone use has decreased substantially

21
Understanding what is happening in ICT in Uganda
Fixed-wireless technologies have become the preferred medium for providing fixed services across the country, as illustrated by Figure 12.
Figure 12: Fixed distribution technologies in UgandaSource: UCC (2012)
Fixed-wireless is the technology choice of niche providers like Smile Communications and i-Tel, which are trying to focus on shared public services (though the dwindling use of shared public services calls into question their business model). As the NBI becomes operational, providing better potential broadband output and backhaul capabilities, it will be important to track how the fixed sector evolves and which technologies fixed operators adopt for the last mile.
Mobile
Mobile voice services continue to dominate the telecommunications sector, with five main providers – MTN, Airtel, Orange, UTL, and Warid – competing for market share. During 2010-11, mobile voice services set a record for the highest number of new subscriptions in a financial year in Uganda with 4.37million new subscriptions (UCC, 2011). This was attributed by the UCC to intense competition in the form of promotional tariffs and declining base rates for voice services across operators (UCC, 2011). Presumably also helping to push up subscriber numbers were the downward trend in the cost of handsets and the increased penetration of mobile money.
At the end of December 2011, there were 16.7million Ugandan mobile subscriptions (Figure 13), raising the aggregate (fixed and mobile) teledensity to 52.1 per 100 people, according to the UCC.
CDMAFixed WiMAXWireline and othersGSM Fixed
12%3%
45%
40%
June 2011
11%2%
57%
30%
December 2011
Mobile voice services continue to dominate the tele-communications sector and raise the rate of teledensity
22
Evidence for ICT Policy Action
Figure 13: Ugandan mobile subscriptions, 2001-11Source: UCC (2012)
It must be noted that mobile’s contribution to the teledensity figure is based on the number of SIMs in use, as opposed to the actual number of mobile phone handsets. According to the 2012 RIA Uganda ICT Survey, only roughly 8million people actually own a mobile phone handset in Uganda, and of these people, 26.9% own at least two SIM cards. Amongst those who reported owning no handset, 10.2% reported owning at least one active SIM. Thus there are many people who do not own a handset but who still subscribe to a mobile network via use of their SIM in someone else’s handset.
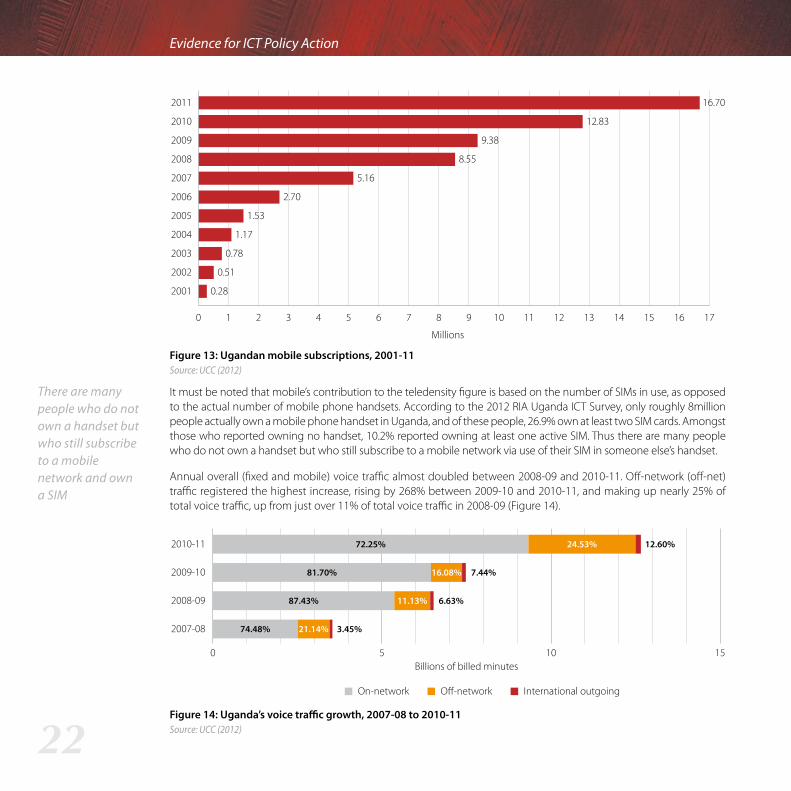
Annual overall (fixed and mobile) voice traffic almost doubled between 2008-09 and 2010-11. Off-network (off-net) traffic registered the highest increase, rising by 268% between 2009-10 and 2010-11, and making up nearly 25% of total voice traffic, up from just over 11% of total voice traffic in 2008-09 (Figure 14).
Figure 14: Uganda’s voice traffic growth, 2007-08 to 2010-11Source: UCC (2012)
2007-08
2008-09
2009-10
2010-11
On-network Off-network International outgoing
74.48%
87.43%
81.70%
72.25%
21.14%
11.13%
16.08%
24.53%
151050Billions of billed minutes
12.60%
7.44%
6.63%
3.45%
There are many people who do not own a handset but who still subscribe to a mobile network and own a SIM
7 13 171621 3 4 5 6 8 9 10 11 12 14 150
2001
2002
2003
2004
2005
2006
2007
2008
2009
2010
2011
0.28
0.51
0.78
1.17
1.53
2.70
5.16
8.55
9.38
12.83
16.70
Millions
23
Understanding what is happening in ICT in Uganda
This rise in off-net traffic reflects the aforementioned near-elimination of price differentials between on-net and off-net calls. At the same time, on-net traffic grew 44% year-on-year during 2010-11 supported by the entry of new operators (resulting in protective tariff packages geared towards keeping customers on-net), and international traffic grew by 62% due to decreases in international termination rates (UCC, 2012).
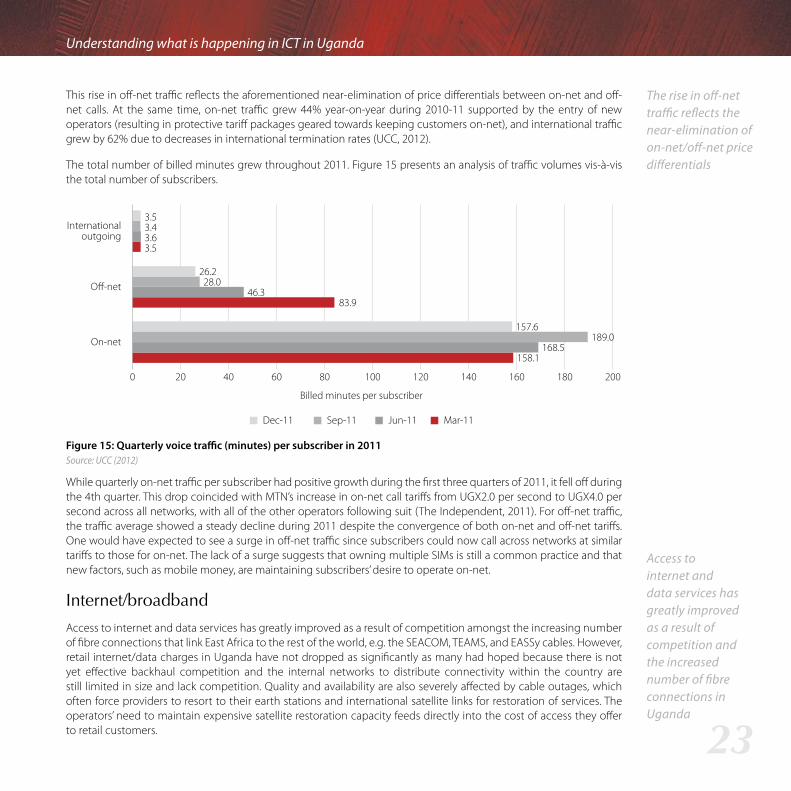
The total number of billed minutes grew throughout 2011. Figure 15 presents an analysis of traffic volumes vis-à-vis the total number of subscribers.
Figure 15: Quarterly voice traffic (minutes) per subscriber in 2011Source: UCC (2012)
While quarterly on-net traffic per subscriber had positive growth during the first three quarters of 2011, it fell off during the 4th quarter. This drop coincided with MTN’s increase in on-net call tariffs from UGX2.0 per second to UGX4.0 per second across all networks, with all of the other operators following suit (The Independent, 2011). For off-net traffic, the traffic average showed a steady decline during 2011 despite the convergence of both on-net and off-net tariffs. One would have expected to see a surge in off-net traffic since subscribers could now call across networks at similar tariffs to those for on-net. The lack of a surge suggests that owning multiple SIMs is still a common practice and that new factors, such as mobile money, are maintaining subscribers’ desire to operate on-net.
Internet/broadband
Access to internet and data services has greatly improved as a result of competition amongst the increasing number of fibre connections that link East Africa to the rest of the world, e.g. the SEACOM, TEAMS, and EASSy cables. However, retail internet/data charges in Uganda have not dropped as significantly as many had hoped because there is not yet effective backhaul competition and the internal networks to distribute connectivity within the country are still limited in size and lack competition. Quality and availability are also severely affected by cable outages, which often force providers to resort to their earth stations and international satellite links for restoration of services. The operators’ need to maintain expensive satellite restoration capacity feeds directly into the cost of access they offer to retail customers.
Dec-11 Sep-11 Jun-11 Mar-11
On-net157.6
189.0168.5
158.1
26.228.0
46.383.9
Off-net
200 40 60 80 100 120 140 160 180 200
3.53.43.63.5
Internationaloutgoing
Billed minutes per subscriber
The rise in off-net traffic reflects the near-elimination of on-net/off-net price differentials
Access to internet and data services has greatly improved as a result of competition and the increased number of fibre connections in Uganda

24
Evidence for ICT Policy Action
Infrastructure-focussed providers are only just starting to emerge with Eaton Towers (who bought Orange’s towers) and American Tower Corporation (a joint venture with MTN) managing mobile network tower infrastructure to complement the infrastructure of UMEME, the Ugandan national electricity utility that rents out its fibre. The company appointed by NITA-U to manage the national fibre backbone will also add to the national supply of internal broadband capacity. It is expected that with these efforts and the trend towards sharing infrastructure, the cost of connectivity both within Uganda and between Uganda and international destinations will decrease further.
The UCC estimates that there are currently 4.8million internet users (as of December 2011) across the country, predominantly accessing the internet via mobile phone handsets and mobile 3G and long-term evolution (LTE) modems. Figure 16 summarises the growth trends in both mobile and fixed internet connections, as well as the total amount of bandwidth procured by various providers to serve the country.
Figure 16: Fixed and mobile internet subscriptions as well as bandwidthSource: UCC (2012)
In line with mobile’s prevalence over fixed in voice service provision, mobile data connection growth has far outpaced that of fixed data connections in recent years, as shown in Figure 16. In terms of bandwidth, downlink capacity procured by providers is still much higher than uplink capacity, highlighting the dearth of local content and the fact that Ugandans are still predominantly consumers of content produced elsewhere in the world.
NITA-U has now embarked on implementation of e-government initiatives, including at the local government level. In addition to boosting direct use by government employees, these initiatives can be expected to increase the number of internet users significantly as more and more government services and information become available online. The other initiative by NITA-U that can be expected to have an effect on internet take-up is its ongoing incubation and promotion of IT-enabled services with specific focus on business process outsourcing (BPO).
Total bandwidth (mbps) Fixed internet subscriptions Mobile internet subscriptions
Dec-13 Jun-14 Dec-14 Jun-15 Dec-15
1 000 000
900 000
800 000
700 000
600 000
500 000
400 000
300 000
200 000
100 000
Fixe
d/m
obile
subs
crip
tions
5 000
10 000
15 000
20 000
25 000
0
Tota
l ban
dwid
th
18 887
15 739
7 727
5 146
31 508
510 000
610 000
850 200
977 500
27 59031 000 35 000
84 558 88 7862 050
0
Mobile internet connections far outnumber that of fixed
NITA-U has embarked on the implementation of e-government initiatives and is expected to have an effect on internet take-up

25
Understanding what is happening in ICT in Uganda
According to the 2012 RIA Uganda Survey findings, more people in Uganda are knowledgeable about the internet compared to 2008, but the gap between people knowledgeable about the internet and those who actually use it is still large (as shown in Table 12), pointing to a large potential market. While men and women are comparable in terms of their knowledge of the internet (29.7% v. 24.8%), more men than women are actual internet users (11.8% vs. 3.1%).
Table 12: Internet knowledge and use with gender breakdown
Country Survey
Individuals who know what the internet is
Individuals who use the internet
Men Women Men Women
Uganda2012 29.7% 24.8% 11.8% 3.1%
2008 9.4% 3.5% 3.7% 1.1%
Kenya2012 55.6% 35.9% 35.8% 20.5%
2008 39.9% 27.8% 21.1% 11.5%
Tanzania2012 26.7% 18.3% 3.4% 3.5%
2008 9.9% 8% 1.9% 2.3%
Rwanda2012 37.2% 35.6% 6.9% 5.2%
2008 6.4% 7.0% 1.8% 2.1%
South Africa2012 61.4% 43.2% 39.7% 28.6%
2008 56.2% 47.0% 20.4% 11.3%
Source: RIA ICT Survey data 2007-08, 2011-12 Note: Individuals included in the 2008 Survey were aged 16 years and older while the 2012 Survey included individuals aged 15 years and older.
Internet and data services are increasingly service segments through which operators seek to differentiate themselves and maintain their customer bases. Providers are placing various technologies on offer with a range of packages that are sometimes bundled together with voice services to exploit the increasing use of data-enabled devices (phones, tablets, phablets).
Other ICTs
Radio and television continue to play an important role in providing access to communication, as highlighted in Table 13 and Figures 17 and 18 below. In the 2012 RIA Uganda Survey, 12.9% of households reported owning a TV (Table 13), which tallies with the 13.4% that reported being linked to the electricity grid (also Table 13), pointing to the fact that access to TV is hampered by a lack of reliable electricity access.
There is still a large gap between men and women internet users
Access to grid electricity can hamper television access

26
Evidence for ICT Policy Action
Table 13: Household use: grid electricity, radio, TV, computer
Main electricity grid Radio receiver TV receiver Computer (desktop or laptop)
Uganda 13.4% 76.6% 12.9% 2.2%
Kenya 60.1% 80.6% 54.4% 12.7%
Tanzania 19.4% 63.1% 18.3% 1.6%
Rwanda 15.6% 72.4% 9.0% 2%
Ethiopia 18.1% 40.7% 10% 0.7%
Ghana 73% 71.8% 54.1% 8.5%
Cameroon 64.5% 33.9% 44.3% 8.6%
Nigeria 58.4% 69.5% 53% 6.6%
Namibia 41.8% 72% 40.6% 14.7%
South Africa 89.2% 62.3% 78.2% 24.5%
Botswana 60.1% 66.4% 59.4% 15.8%
Source: RIA ICT Survey data 2011-12
It was found that 82.3% of respondents listen to radio and 76.2% own a personal radio that they can use anytime. Figure 17 shows radio listening trends in 11 RIA Survey countries with some countries (Uganda, Kenya, Namibia, Ghana, South Africa, and Cameroon) exhibiting lower radio listening in 2012 than in 2008, while other RIA countries (Rwanda, Tanzania, Ethiopia, Botswana) have more radio listenership now than in 2008. A small number (1.7%) of Ugandans reported using their mobile phone to listen to radio – a percentage that can be expected to grow with the increased penetration of radio-enabled handsets.
Radio and television remain valuable ICT devices

27
Understanding what is happening in ICT in Uganda
Figure 17: Radio listeners, RIA ICT Survey countries, 2012 and 2008Source: RIA ICT Survey data 2011-12 and 2007-08
Television viewing increased between 2008 and 2012 in all but five RIA countries with only Tanzania showing a seemingly clear drop in TV viewing. Viewing remained at roughly unchanged levels in Uganda, Ghana, Cameroon, and Rwanda (Figure 18).
Figure 18: TV watchers, RIA ICT Survey countries, 2012 and 2008Source: RIA ICT Survey data 2011-12 and 2007-08
It was found that 39.7% of Ugandans watch television at home.
Cameroon
South Africa
Botswana
Ethiopia
Ghana
Namibia
Tanzania
Nigeria
Rwanda
Kenya
Uganda
61.9%
68.5%
55.3%
39%
87.7%
70.4%
65.1%
68.5%
83.6%
87.3%
30.4%
55.6%
56.2%
57.2%
64.6%
68.2%
70.8%
75.6%
77.1%
81.1%
82.3%
2007-082012
Rwanda
Uganda
Tanzania
Namibia
Ethiopia
Cameroon
Ghana
Nigeria
Botswana
Kenya
South Africa
12.9%
27.5%
34.9%
39.2%
19%
53.6%
57%
49.4%
56.8%
69.1%
12.3%
27.2%
31.5%
39.5%
40.3%
53%
57.9%
58.8%
59.8%
66.1%
77.7%
2007-082012
Television viewership increased between 2008 and 2012

28
Evidence for ICT Policy Action
Access to computers continues to be rare in Uganda with only 4.8% of people reporting any computer access at all in the 2012 RIA Survey (a lower level of access than six other RIA countries) and only 35.7% of those with computer access reporting access at home (Table 14).
Table 14: Individual computer access
Country15yrs+
that use a computer
Locations where a computer is accessed (multiple responses)
Work School, university Library At home Internet
caféA friend’s
place
South Africa 29.1% 40.2% 22.8% 6.1% 61.1% 29% 20.7%
Kenya 21.2% 36.8% 40.2% 16.9% 56% 68.8% 45.9%
Cameroon 15.1% 20.7% 33.4% 7.7% 38% 63.5% 35.9%
Namibia 13% 60.6% 36.7% 28.5% 73.1% 28.4% 45.5%
Ghana 10% 42.9% 44.5% 6.2% 72.6% 54.4% 24.9%
Nigeria 7.5% 45.9% 36.1% 4.5% 73.1% 61.8% 58.3%
Uganda 4.8% 45.5% 51.4% 25% 35.7% 57% 60.9%
Rwanda 3.5% 54.5% 35.3% 18.9% 59.4% 45.2% 25.1%
Ethiopia 2% 34.1% 48.4% 9.2% 23.9% 28.5% 5.3%
Tanzania 1.9% 41% 23.6% 8.5% 47.7% 65.8% 27.8%
Source: RIA ICT Survey data 2011-12
Emerging trends
Shared public payphones disappearing
As mentioned above, use of shared public payphones is dwindling in Uganda. Two developments appear to be pushing this trend. First, mobile phones are becoming cheaper, thus allowing more people to afford a handset. Second, increasing competition has forced operators to lower the cost of voice communication, to offer ever-smaller airtime denominations, and to charge users on a per-second basis. People can now load airtime for amounts as low as UGX50 to make a call as opposed to needing to use a shared public payphone. The falling tariffs have also reduced the price difference between making a call on a personal mobile (UGX240 for 60 seconds) and paying to use a shared public payphone (UGX200 for 50 seconds).
According to the 2012 RIA Uganda Survey, only 14.8% of respondents had used a public payphone in the past three months. Of this small number of users, 21.4% use public phones at least once a week while most (44.7%) use them roughly once a month. The primary reasons cited for use by payphone users are: not having a mobile handset (38%); seeing payphones as cheaper (21.4%); and having difficulty charging the battery of a mobile handset (20.3%). As public
The increased affordability of mobile phones and airtime have contributed to the low use of public payphones

29
Understanding what is happening in ICT in Uganda
payphone use declines, the entrepreneurs who operate public payphones (the operators who do so under an umbrella linked to a mobile network and account for 81.1% of all public payphone use) are having to diversify their product base by stocking airtime and mobile money. Use of shared public payphones thus appears to be gradually vanishing.
Internet access increasingly mobile
The growing availability of internet-enabled mobile devices is increasing the number of people with access to the internet in Uganda. Fixed-line internet subscriptions are going the way of fixed voice connections, with fixed-line internet numbers paling in significance against mobile internet subscriptions. Some of the mobile internet subscriptions are GSM modems used to provide access to laptops or fixed computers. Mobile operators have caught on to this trend and now offer mobile data plans that can last for as little as a day or even an hour (Warid Telecom, n.d.). And operators are beginning to differentiate between data plans meant for internet access via mobile phones and those meant for computers via GSM modem. Mobile internet access – especially now that even low-end handsets are increasingly data-enabled – is also forcing internet cafés to diversify services or go out of business. The 2012 RIA Uganda ICT Survey results in Figure 19 show the growing dominance of mobile internet compared to other internet access mediums available to households.
Figure 19: Types of household internet connections in RIA countries Source: RIA ICT Survey data 2011-12
Uganda
Kenya
Tanzania
Rwanda
Ethiopia
Ghana
Cameroon
Nigeria
Namibia
South Africa
Botswana
Using mobile phone Mobile modem (3G) Wireless broadband ADSLModem/ISDN dial-up
73.3%
71.5%
64.3%
76.4%
55.7%
68.9%
9.8%
63.4%
75.3%
56.4%
83.9%
42.2%
0.5%
54.8%
63.7%
10.3%
45.8%
2.9%
18.7%
4.9% 22.0%
16.6%
1.9%
59.8%
15.3%47.7%
34.8%
56.9%
65.0%
13.7%
26.4%
82.3%
31.8%
11.2%
21.5%
7.5%
16.3%
46.6%
69.4%
18.7%
10.6%
7.1%
45.2%
37.3%
4.9%
4.5%
7.6%
33.5% 3.2%
23.8%
8.3%
6.3%
2.4%
7.8%
Fixed-line internet subscriptions are going the way of fixed voice but the growing availability of internet-enabled mobile devices is increasing internet access

30
Evidence for ICT Policy Action
The trend towards mobile internet brings a number of challenges to Uganda’s ICT sector. First, the trend stretches the infrastructural capacity of operators: as more devices on mobile networks become data-enabled, operators are forced to invest more resources to keep up with growing demand and to provide appropriate QoS. Second, the trend towards mobile internet amplifies the online content gap, a gap which most of the developing world struggles with. There is a need to create new relevant content, and to ensure that the content is accessible by a wide range of devices with varying capabilities.
9PZL�VM�TVIPSL�ÄUHUJPHS�ZLY]PJLZ
Mobile money has had an adverse effect on elements of the traditional financial services industry (challenging traditional banking practices) while at the same time generating new service opportunities. For example, mobile money is now the primary method of sending money from one person or place to another and is increasingly popular as a means of settling monthly utility bills (power, water, cable TV) or paying school fees. Financial institutions used to generate money by charging fees to facilitate such transactions. However, on the plus side for the financial services industry, financial service providers are increasingly using the mobile phone as a channel to reach and serve customers (as discussed further in Section 5). Various stakeholders now consider the mobile phone as the only viable means to provide formalised financial services to people living in the base of the pyramid (BoP) i.e. households living below the poverty line. There are a number of product concepts that use the mobile money market to try to provide a formal financial service to such people.
Meanwhile, operators are exploiting their in-house data in order to offer airtime credit schemes – e.g. Warid’s Beerako, Airtel’s Malako, Orange’s Wetaase, or MTN’s Xtra Time – that enable their subscribers to access airtime (between UGX500 and UGX3 000) on credit from the operator. The subscriber is charged a fee (between 6% and 10%) for the airtime credit service, and the fee is immediately deducted in the form of airtime. The operator then recovers the remaining loan amount the next time the user loads airtime. Operators use their subscribers’ airtime purchase history to determine their credit worthiness for receipt of airtime credit.
Operators have come to increasingly realise that they possess valuable subscriber data that can be used for various commercial purposes. Operators at the forefront of use of customer data have started to venture into combining airtime purchase history with call detail records (CDRs) and mobile money transaction data to determine subscriber credit-worthiness for actual cash loans. (Airtel Kenya led the way in East Africa in this service offering when it partnered with Faulu Kenya for the Kopa Chapaa cash loan product (Faulu Kenya, n.d.), and then Kenya’s Safaricom and the Commercial Bank of Africa followed suit via the M-Shwari product (Safaricom, n.d.).) It is anticipated that such products will spread throughout East Africa as has been the case with other trends in mobile-telephony-based service provision.
The infrastructural capacity of operators will be challenged by increased internet use
Mobile money is now the primary method of sending money from one person or place to another
Access to customer data has enabled operators to develop creative ICT products

31
Understanding what is happening in ICT in Uganda
Mobile moneyProvision of mobile money services, coupled with reduced voice prices resulting from competition, is helping operators recruit new subscribers (UCC, 2011). All of the major operators currently have mobile money platforms to supplement their service offerings. Comparative information for these services is summarised in Table 15. The nature of mobile money services is such that operators require regulatory approval from both the UCC and the Bank of Uganda (BOU), the financial regulator. The dual-regulatory nature of mobile money creates challenges that did not previously exist (UNCTAD, 2012).
Table 15: Mobile money platforms in Uganda
MTN Airtel UTL Warid Orange2
Product name MTN Mobile Money Airtel Money M-Sente Warid Pesa Orange Money
Launch date March 2009 June 2009 March 2010 January 2012 February 2013
Bank partners Stanbic UgandaStandard Chartered
DFCU Bank Equity BankPride Microfinance & Postbank
Subscribers (July 2011)
2 004 723 145 180 232 544 N/A N/A
Source: RIA data, UCC (2011), BOU (2011) 2
All the countries covered in the 2012 RIA ICT Surveys except Ethiopia have mobile money services, as indicated in Figure 20. And, as also shown in Figure 20, in all RIA Survey countries except South Africa and Namibia, fewer than 50% of adults have access to bank accounts, reflecting the dearth of formal financial services.
2 Orange was the last of Uganda’s major mobile operators to launch a mobile money product (in February 2013), after the completion of this 2012 RIA SPR.
The coupling of mobile money services with reduced voice prices is attracting new subscribers

32
Evidence for ICT Policy Action
Figure 20: RIA Survey respondents’ (1) use of mobile money; and (2) possession of bank accountSource: RIA ICT Survey data 2011-12
In Kenya and Tanzania, mobile money use now far exceeds bank account use, while in Uganda the two are at comparable levels. The success of mobile money in East Africa highlights this service’s growing prominence as a channel for financial inclusion, particularly in rural areas. The success of mobile money also amplifies a key challenge faced by physical outlets of formal financial services: even where they exist, physical bank branches require potential users to walk long distances or meet high transport costs to access them. Mobile money, on the other hand, can increasingly be found even in remote rural areas, and even in these remote areas mobile money is typically supported by multiple agents representing multiple services.
Registration
Being a subscriber to a particular mobile operator does not automatically qualify one to be registered for that operator’s mobile money service. The subscriber needs to register by submitting a passport photograph, an authentic copy of her or his ID, and a signed mobile money registration form. Registration is part of the Know Your Customer (KYC) requirements stipulated by the financial regulator, the BOU, and occurs at designated operator service centres.
Ethiopia
Tanzania
Cameroon
Uganda
Rwanda
Ghana
Nigeria
Kenya
use mobile money have a bank account
3.7%
6.2%14.1%
10.8%0.4%
15.2%13.9%
16.3%3.3%
29.4%1.3%
30.5%0.5%
44.5%60.3%
Botswana 48.4%
Namibia 56.3%2.0%
10.5%
58.9%3.2%
South Africa
Uganda’s mobile money use is at a comparable level with bank account use

33
Understanding what is happening in ICT in Uganda
Mobile money registration has been slow because on the supply side, service centres are few and located in major trading centres, increasing the demands/costs for the applicant. Additionally, customer documentation needs to be transported back to the operators’ head offices for verification before mobile money accounts can be activated for each subscriber. Furthermore, there is no mechanism for informing the user once this process has been completed. On the demand side, the registration process requires subscriber initiative, patience, and expenditure (for the passport photo, ID copy, and transport to service centre) to accomplish. Hence, there are disincentives to the take-up of mobile money services.
Third-party mobile money agents could potentially provide an alternative avenue for the registration process, but given that the verification process is out of their hands, agents would not be able to respond to customer queries about a registration progress nor could they predict when they would receive payment for successful registrations. Thus most agents prefer to focus on their day-to-day business for which commission guidelines are clearly defined and predictable. All of this explains why most existing mobile subscribers are not yet registered for mobile money services (UNCTAD, 2012).
Part of operators’ enthusiasm for SIM registration is driven by their expectation that the registration will help them to more easily convert their mobile subscribers into registered mobile money users, helping operators to, inter alia, further limit users’ willingness to switch networks. Meanwhile, although the number of mobile money subscriptions is slowly growing, a substantial portion of these users are not actually using the service, requiring operators to invest in the creation of greater awareness and training in order to turn users into active mobile money customers (Ssonko, 2011).
Figure 21: MTN, Airtel, and UTL mobile money subscriptions, March 2010 to February 2011Source: BOU (2011)
Mar-14
Apr-14
May-14
Jun-14
Jul-14
Aug-14
Sep-14
Oct-14
Nov-14
Dec-14
Jan-15
Feb-15
MTN Mobile Money Airtel Money UTL M-Sente
791
856
919
973
1 028
1 095
1 181
1 264
1 337
1 403
1 482
1 554
2,0001,8000 200 400 600 800 1,000 1,200 1,400 1,600
Thousands
93
96
102
110
114
117
119
122
125
127
129
131
887
965
1 040
1 106
1 169
1 244
1 353
1 439
1 514
1 583
1 664
1 738
Logistical administration can cause delays in the mobile money registration process
Mobile money registration has become an incentive for operators since it withholds customers

34
Evidence for ICT Policy Action
Services
Mobile money is largely used for domestic transfers, as highlighted in Table 16, but operators are also preparing to provide international services in collaboration with network partnerships.
Table 16: Different mobile money services offered by providers
Types MTN Mobile Money Airtel Money UTL M-Sente
Mobile money transfers
Domestic transfers to both MTN users and users on other networks
International transfers with Western Union launching soon (a one-way receiving service into a mobile money wallet; cannot send out)
Domestic transfers only to other Airtel mobile money subscribers
Domestic transfers to both UTL mobile money subscribers and mobile money subscribers on other networks
Mobile payments
Airtime
School fees
DStv and StarTv pay-TV fees
National Water & Sewage Corporation (water bills)
Pay financial institutions (Finance Trust)
Bulk payments (WFP Karamoja)
Airtime
DStv pay-TV fees
National Water & Sewage Corporation (water bills)
Airtime
School fees
National Water & Sewage Corporation (water bills)
Mobile financial servicesNone Withdrawal via
Interswitch ATMsNone
Source: Operator websites and visits to agents
Fees
The fee structure for MTN Mobile Money has greatly influenced the mobile money fees charged by other operators, due to MTN’s dominance in the service (it accounts for over 80% of all registered mobile money users in Uganda). All operators offer free cash-in (converting cash into mobile money) transactions, and transfers to non-registered users are paid for by the sender (see Table 17).3 In all cases, these charges are automatically deducted by the platform. Charging registered users more for transfers to non-registered users is aimed at encouraging senders to convert non-registered receivers into registered customers.4
3 In the context of mobile money, a non-registered user could be a user who has not registered for mobile money or a user who is registered for mobile money on another network.4 For more information on mobile money payment scenarios, see Ndiwalana and Pitcaithly (2012).
MTN’s mobile money fee structure influences that of the sector

35
Understanding what is happening in ICT in Uganda
Table 17: MTN Uganda’s Mobile Money transaction fees and limits
Transactions Transaction thresholds (UGX) Service charges (UGX)
Cash-inRegistered user Non-registered user
500 to 4 000 000 Free N/A
Sending
Registered user’s charge for sending to another registered user
Registered user’s charge for sending to a non-registered user
500 to 5 000 400 800
5 000 to 30 000 800 1 600
30 001 to 60 000 800 2 000
60 001 to 125 000 800 3 700
125 001 to 250 000 800 7 200
250 001 to 500 000 800 10 000
500 001 to 1 000 000 800 19 000
1 000 001 to 2 000 000 800 36 000
2 000 001 to 4 000 000 800 64 000
Above 4 000 000 N/A N/A
Receiving
Registered user’s charge for withdrawing a payment from another registered user
Non-registered user’s charge for withdrawing a payment from a registered user
500 to 5 000 300 Free
5 000 to 30 000 700 Free
30 001 to 60 000 1 000 Free
60 001 to 125 000 1 600 Free
125 001 to 250 000 3 000 Free
250 001 to 500 000 5 000 Free
500 001 to 1 000 000 9 000 Free
1 000 001 to 2 000 000 17 200 Free
2 000 001 to 4 000 000 31 200 Free
Above 4 000 000 N/A N/A
Source: MTN Uganda (n.d.3)

36
Evidence for ICT Policy Action
Challenges
As mobile money use becomes more mainstream, operators are facing a number of challenges that hinder the spread of the service. One challenge is the operator processing of registrations. Until now, the mobile money sign-up process has been split into two steps – registration (e.g. at a service centre) and activation (at the head office) – creating a time-lag for the user between signup and getting to use the service (Tellez, 2011). This lag is necessary to move KYC documents from the service centre to the operator’s head office. Minimising this time lag is critical to improving the user experience. A response to this challenge is being provided by the current SIM registration process, which will negate the need for two-stage mobile money registration because the SIM registration process requires mobile operators to collect sufficient information to meet KYC requirements. Once customers successfully complete their SIM registration, mobile operators can then activate mobile money capability, lowering the registration threshold.
Another challenge is managing the agent liquidity necessary to meet user cash needs. Operators are now experimenting with a mobile money super-agent model, similar to what they already have for airtime, as a measure to address liquidity issues amongst mobile money agents. A challenge with the super-agent model is that it creates a hierarchy of agents who have to share commission from the same transaction, thereby decreasing agent incentive.
Network downtime is another challenge as it prevents users from accessing the mobile money platform when they need it. While operators are working to upgrade their infrastructure and improve QoS, it remains to be seen what QoS levels users will tolerate when there is money involved – as opposed to just making a call.
The time lag that exists in the user registration process for mobile money is a challenge

37
Understanding what is happening in ICT in Uganda
Telecom Regulatory Environment (TRE) assessmentAs part of this RIA Uganda ICT SPR, a Telecom Regulatory Environment (TRE) assessment was conducted, drawing on the TRE methodology developed by LIRNEasia (see LIRNEasia, 2008). A TRE assessment samples the perceptions of stakeholders involved with a national telecommunications sector in order to provide insight into the current status of the regulatory environment.
The RIA team in Uganda approached a wide range of stakeholders to seek their participation as respondents and directed them to an online survey. The stakeholders approached were from three categories:
category 1: stakeholders directly affected by telecommunications sector regulation, e.g. operators, industry associations, equipment suppliers, investors;
category 2: stakeholders who analyse the sector with a broader interest, e.g. financial institutions, equity research analysts, credit rating agencies, telecommunications consultants, law firms; and
category 3: stakeholders with an interest in improving the sector to help the public, e.g. academics, research organisations, journalists, telecommunications user groups, civil society, former members of regulatory and other government agencies, donors, current government employees from organisations related to the telecommunications sector (excluding those in the telecommunications regulatory and policy hierarchy, i.e. excluding anyone from the regulatory agency, policymaking body (Ministry or similar), the Minister, etc.).
As illustrated in Table 18, the TRE method examines seven regulatory dimensions: market entry, access to scarce resources, interconnection, tariff regulation, regulation of anti-competitive practices, USO, and QoS.

38
Evidence for ICT Policy Action
Table 18: The 7 regulatory dimensions covered in a TRE assessment
Regulatory dimension Aspects covered
Market entryTransparency of licensing. Applicants should know the terms, conditions, criteria and length of time needed to reach a decision on their application. Licence conditions. Exclusivity issues.
Access to scarce resources Timely, transparent and non-discriminatory access to spectrum allocation. Numbering and rights of way: frequency allocation, telephone number allocation, tower location rights.
Interconnection
Interconnection with a major operator should be ensured at any technically feasible point in the network. Quality of interconnection comparable to similar services offered by own network. Reasonable rates for interconnection. Unbundling of interconnection. Interconnection offered without delay. Sharing of incoming and outgoing international direct dialling (IDD) revenue. Payment for cost of interconnection links and switch interface. Payment for cost of technical disruption of interconnection.
Tariff regulation Regulation of tariffs charged from consumers.
Anti-competitive practices
Anti-competitive cross-subsidisation. Using information obtained from competitors with anti-competitive results. Not making technical information about essential facilities and commercially relevant information available to competitors on a timely basis. Excessive prices. Price discrimination and predatory low pricing. Refusal to deal with operators and other parties. Vertical restraints. Technical disruption of interconnection. Sharing of towers and facilities by parent company and subsidiaries in different segments of the market.
Universal service obligations (USO)
Administration of the universal service programme/fund in a transparent, non-discriminatory and competitively neutral manner and is not more burdensome than necessary for the kind of universal service defined by the policymakers.
Quality of service (QoS)The actual performance of a service with respect to what is promised, depending upon the network traffic control mechanisms. Specific criteria may be call quality (for mobile and fixed), connection speeds or throughput (for broadband).
Source: LIRNEasia (2008)
The seven TRE dimensions are surveyed in terms of three service sectors: fixed, mobile, and broadband. Within each of the three sectors, the TRE survey seeks stakeholders’ perceptions of each of the seven dimensions using a Likert scale of: highly ineffective (-2); ineffective (-1); neutral (0); effective (1); highly effective (2); or insufficient information to answer the question. (For the Uganda TRE exercise, all seven dimensions related to each sector appeared on the same page of the survey instrument, allowing the respondent to easily make comparisons across different dimensions. The survey instrument also included comment boxes to allow respondents to provide feedback that complemented their judgements.)

39
Understanding what is happening in ICT in Uganda
The RIA Uganda research team approached more than 90 potential respondents via a variety of online methods. Of the potential respondents, 36 completed the TRE survey: eight from category 1, 11 from category 2, and 17 from category 3. These 36 responses form the basis of the averages in Table 19 and the analysis that follows.
Table 19: Average perceptions of regulation across 7 dimensions in 3 sectors
Sector Regulatory dimension Average response
Fixed
Market entry Neutral (2.9)
Access to scarce resources Ineffective (1.7)
Interconnection Ineffective (2.4)
Tariff regulation Ineffective (2.3)
Regulation of anti-competitive practices Ineffective (2.0)
Universal service obligations (USO) Ineffective (1.8)
Quality of service (QoS) Ineffective (1.9)
Mobile
Market entry Neutral (3.4)
Access to scarce resources Ineffective (2.2)
Interconnection Neutral (2.9)
Tariff regulation Neutral (2.5)
Regulation of anti-competitive practices Ineffective (2.3)
Universal service obligations (USO) Ineffective (1.8)
Quality of service (QoS) Neutral (2.5)
Broadband
Market entry Neutral (3.6)
Access to scarce resources Ineffective (2.7)
Interconnection Ineffective (2.6)
Tariff regulation Ineffective (2.5)
Regulation of anti-competitive practices Ineffective (2.4)
Universal service obligations (USO) Ineffective (2.1)
Quality of service (QoS) Ineffective (2.6)
Source: RIA TRE assessment data 2011-12

40
Evidence for ICT Policy Action
Fixed
Overall, the perception of regulation of the fixed sector in Uganda is negative, with access to scarce resources perceived most negatively, followed by USO and QoS, as summarised in Figure 22.
Figure 22: Average responses for 7 dimensions of fixed sector regulationSource: RIA TRE assessment data 2011-12
Market entry is the most positively perceived dimension for the fixed sector. (This might partly stem from the UCC’s efforts to provide operators with information about requirements to be met in order to qualify for a licence, combined with the fact that there is no ceiling on the number of operators who can enter the market.)
-2 -1 0 1 2
Quality of service (QoS)
Universal service obligations (USO)
Anti-competitive practices
Tariff regulation
Interconnection
Allocation of scarce resources
Market entry
The perception of Uganda’s fixed sector regulation is negative with market entry being the least negative

41
Understanding what is happening in ICT in Uganda
Mobile
Overall, the perception of regulation of Uganda’s mobile sector is negative, with USO and access to scarce resources perceived as the most negative dimensions, as indicated in Figure 23.
Figure 23: Average responses for 7 dimensions of mobile sector regulation Source: RIA TRE assessment data 2011-12
Regulation of market entry has the most positive perception for the mobile sector (similar to this dimension’s rating for fixed). Despite this positive assessment, some respondents stated that they feel the large players have to some extent captured the regulator through committing of funds to the regulator’s coffers, resulting in a degree of regulatory neglect of small players.
The interconnection dimension receives a better rating for the mobile segment than for the other two segments. [However, at the same time, it must be noted that despite the UCC having instituted an interconnection rate to guide operators, there have been media reports of operators suing each other over unpaid IDD revenues (Mugabe, 2011)].
-2 -1 0 1 2
Quality of service (QoS)
Universal service obligations (USO)
Anti-competitive practices
Tariff regulation
Interconnection
Allocation of scarce resources
Market entry
Perceived regulation of the mobile sector’s market entry is positive

42
Evidence for ICT Policy Action
Broadband
Overall, perception of regulation of broadband – and of the value-added network service (VANS) providers reliant on broadband – is negative, with USO the most negative dimension, as shown in Figure 24.
Figure 24: Average responses for 7 dimensions of regulation of broadband and VANSSource: RIA TRE assessment data 2011-12
Anti-competitive practices, USO and QoS are the other negative dimensions for regulation of broadband and VANS operators. Uganda’s USO objectives do not clearly articulate what is expected of licensed operators when it comes to broadband and VANS. Comments from respondents indicate that once operators are licensed, the operators do not provide services in a regulated manner and customers are, to some extent, at the operators’ mercy.
In terms of QoS, regulation of the broadband sector is more positively perceived than regulation of the fixed sector, but less well-perceived than in the mobile sector.
-2 -1 0 1 2
Quality of service (QoS)
Universal service obligations (USO)
Anti-competitive practices
Tariff regulation
Interconnection
Allocation of scarce resources
Market entry
Uganda’s USO objectives do not clearly articulate what is expected of licensed operators

43
Understanding what is happening in ICT in Uganda
Historical comparison
Comparison with past Uganda TRE assessments reveals changing perceptions amongst respondents, as shown in Figure 25. For tariff regulation, the trend in perception is towards more positive stakeholder views, while for all of the other dimensions the trend is negative.
Figure 25: Trends in perception of TRE dimensionsSource: RIA TRE assessment data 2011-12
Improved perceptions of tariff regulation correlate with falling prices for services via increased competition amongst providers, particularly in the mobile sector. The negative trend for market entry might reflect the growing feeling amongst stakeholders (as reflected in their additional comments provided during the TRE exercise) that the large players have too much influence on regulation. Regarding the QoS dimension, as the prices of access devices fall, and more people acquire mobile handsets, TVs, radios, etc – with demand growing even in remote areas – such growth, coupled with falling service prices, has created tremendous strain on providers’ network QoS. At the same time, users are becoming more market-knowledgeable and demanding better QoS, as reflected in the negative perception trends in stakeholder perceptions of regulation of QoS. There is also evidence of increased stakeholder expectations regarding regulation of USO.
0-1 1-2
QoS
USO
Anti-competitive practices
Tariff regulation
Interconnection & facilities
Access to scarce resources
Market entry
2
2006 2009 2011
The trend in perception of tariff regulation points towards positive stakeholder views
Increasing stakeholder expectations affects the perception of QoS regulation

44
Evidence for ICT Policy Action
*YVZZ�JV\U[Y`�JVTWHYPZVU
In terms of overall TRE ratings, all of the 12 RIA countries assessed in the 2012 TRE exercise receive an overall score of “ineffective”, as seen in Figure 26.
Figure 26: Overall TRE assessments in RIA countries Source: RIA TRE assessment data 2011-12
Rwanda’s average score, while negative, is the least negative among the 12 countries, while Ethiopia’s is the most negative (i.e. Rwanda’s regulation scores best, and Ethiopia’s scores worst, among the 12 RIA countries assessed). When the 2006, 2009, and 2012 RIA TRE assessment data are considered across all RIA study countries, trends appear mixed, as highlighted in Figure 27.
Ethiopia
South Africa
Mozambique
Cameroon
Botswana
Uganda
Nigeria
Chana
Kenya
Tanzania
Namibia
Rwanda
Ineffective Effective
Uganda ranks in the bottom half of all TRE country rankings

45
Understanding what is happening in ICT in Uganda
Figure 27: TRE trends in RIA countriesSource: RIA TRE assessment data
For some countries, such as Namibia and Kenya, the TRE trends are positive (suggesting regulation is becoming more effective), while for other countries, such as Uganda and Ethiopia, the trends are negative (i.e. regulation is becoming less effective). In terms of the 2012 ratings of the seven different regulatory dimensions, regulation of market entry is seen as the least ineffective (i.e. the best-performing dimension) in four countries: Nigeria, Namibia, Uganda, and Kenya (see Figure 28).
2006 2009 2012
Ineffective Effective
Ethiopia
South Africa
Mozambique
Cameroon
Botswana
Uganda
Nigeria
Ghana
Kenya
Tanzania
Namibia
Rwanda
Uganda’s TRE perception shows its regulatory effectiveness decreasing

46
Evidence for ICT Policy Action
Figure 28: Perceived effectiveness of regulation of market entry in RIA countriesSource: RIA TRE assessment data 2011-12
Among the seven different regulatory dimensions, USO regulation receives the lowest scores across the 12 RIA countries assessed in 2012, as seen in Figure 29.
Figure 29: Perceived effectiveness of USO regulation in RIA countriesSource: RIA TRE assessment data 2011-12
Ethiopia
Cameroon
Mozambique
South Africa
Ghana
Botswana
Tanzania
Rwanda
Kenya
Uganda
Namibia
Nigeria
Ineffective Effective
South Africa
Botswana
Uganda
Mozambique
Nigeria
Kenya
Cameroon
Namibia
Ghana
Tanzania
Rwanda
Ethiopia
Ineffective Effective
Market entry is perceived as Uganda’s best regulated facet

47
Understanding what is happening in ICT in Uganda
ConclusionsIt is evident from the results of the 2012 RIA ICT Survey that Uganda’s telecommunications sector is continuing to expand, with key emerging trends including growing ownership of mobile handsets, growing mobile internet access, and growing mobile money use. The drop in prices for both handsets and services has had a positive effect on the growth of ICT access and utilisation. The contribution of the ICT sector to GDP has also increased significantly.
At the same time, however, Uganda continues to fall behind neighbouring countries in East Africa in certain respects. Prices, despite the drops experienced, remain comparatively high; internet penetration is limited; and use of the entire spectrum of services is still low when looked at across all segments of the population. The apparently high teledensity of 52.1 overstates the reality that emerges when levels of handset ownership and multiple-SIM ownership are factored in.
Overall perception of the regulatory environment is increasingly negative. While perceptions of regulation of market entry and tariffs show positive trends, there are strong offsetting concerns about regulation of QoS and USO. The regulatory transition based on a politically driven merger without a guiding policy or law inevitably created a degree of regulatory paralysis. The generally poor perception of the regulatory environment can be seen as having as much to do with this paralysis as with actual regulatory quality. Now that the law mandating convergence of telecommunications and broadcasting regulation is set to become effective in early 2013, the converged regulator UCC needs to seek to recover the time lost and re-stabilise the sector.
The entry of NITA-U as a player – assuming effective UCC coordination of its work – has the potential to introduce significant positive changes, starting with NITA-U’s initiatives to promote the use of IT in government and to grow IT-enabled services, especially BPO.
Mobile money has had a disruptive effect on the financial services sector by challenging the traditional banking industry while simultaneously opening up new opportunities for growth. Compared to the situation in neighbouring Kenya, mobile money in Uganda is still in its infancy and thus mobile money looks set to be the most significant emerging trend in the years to come in terms of the impact of ICT on human welfare and development in Uganda.
Uganda’s ICT market continues to expand and contribute to GDP significantly
NITA-U has the potential to introduce significant positive changes to the ICT sector

48
Evidence for ICT Policy Action
RecommendationsHow can ICT policy and regulation in Uganda be improved so as to ensure that a significant majority of Ugandans have access to affordable ICT services and that the ICT sector plays an even more important role in the economy? The sector’s current state points to several recommendations.
QoS and USO
Now that competition is maturing, the sector is stabilising in terms of its players, and consumers are becoming more informed, it is recommended that regulation shift from an emphasis on attracting investment to ensuring better QoS and coverage. This need is reflected in the views of TRE respondents who score the UCC’s performance positively on regulating market entry but negatively on management of both QoS and USO. There is a need for effective QoS penalties, and the UCC must develop new approaches to the sharing of benefits from the growing ICT sector by re-visiting USO targets and strategies.
Trade tariffs, taxes, and operator tariffs
Trade tariffs in Uganda remain among the highest in the East African region, certainly in comparison to Kenya and Tanzania. This is compounded by the fact that Uganda’s income per capita is among the lowest in the region. The high trade tariffs and domestic taxes must be re-examined at both policy and regulatory levels. At the policy level, there needs to be a departure from taxing inputs to taxing outputs with telecommunications treated as an input to business. For example, mobile phones and similar devices need to be re-categorised as computing devices so that taxes on these items can be eliminated (e.g. Kenya eliminated domestic taxes on mobile phones). Such measures would support the affordability of ICT services and yield more revenue for government in the medium- to long-term. Even in the short-term, it is likely that government will see increased tax revenues through the increased volumes and revenues of operators as the subscriber base continues to increase.
With regard to operator tariffs, the 2012 RIA Uganda ICT Survey’s findings on price sensitivity support the notion that lower pricing can lead to significantly increased use. At the regulatory level, the UCC needs to carry out regular analysis to ensure that operator tariffs become truly cost-based, particularly since the interconnection rate in Uganda remains amongst the highest in the region.
New services
Government, the UCC, and now NITA-U must re-position themselves so as to better promote the growth of new services in the market. In some service areas, policy and regulation are becoming increasingly multi-sector, requiring collaboration among different bodies in order to ensure effective provision. A good example is mobile money, where the BOU and the UCC need to work together with the aim of ensuring harmonious services based on a single licensing process. And as innovators seek to use the mobile platform for other services, new policy-regulatory entities will likely need to be drawn into a streamlined approach to regulate the mobile sector.
Uganda remains acutely short of policies and initiatives in support of mass ownership of connected devices, and short of coordinated efforts to exploit ICT sector opportunities. The national exploitation of ICT can no longer be
It is recommended that regulation shift its emphasis from attracting investment to ensuring better QoS and coverage
High trade tariffs and domestic taxes must be re-examined at both policy and regulatory levels
Policy and regulation are becoming increasingly multi-sector, requiring collaboration among different bodies

49
Understanding what is happening in ICT in Uganda
addressed solely by the MOICT and its associated entities. Ministries responsible for health, education, agriculture, and trade need to work with the MOICT to address matters of e-health, m-health, e-education, m-education, e-trade, m-commerce, and e-support services for agriculture. A recent report by the World Bank and the African Development Bank, entitled eTransform Africa, contains many lessons and strategies for Uganda to consider (World Bank, 2012). An entrepreneurial culture is developing around the mobile market and this culture needs to be harnessed and nurtured. An environment needs to be created in which operators are given incentives to open up their platforms to innovation allowing entrepreneurs to start new businesses around existing mobile systems. This will require the MOICT, the UCC, and NITA-U to jointly develop coordinated incentive strategies.
An entrepreneurial culture is developing around the mobile market and this culture needs to be harnessed and nurtured

50
Evidence for ICT Policy Action
Airtel Uganda (n.d.), website, available at: http://africa.airtel.com/wps/wcm/connect/africarevamp/Uganda (accessed 12 July 2012).
Balancing Act (2011), “Mutabazi issues polling day SMS rules”, available at: www.balancingact-africa.com/news/en/issue-no-542/telecoms/uganda-mutabazi-issu/en (accessed 12 July 2012).
Bank of Uganda (BOU) (2011), “Mobile money statistics for 2009-11”, non-public data provided to author for limited analysis purposes only.
Biryabarema, E. (2011), “MTN Uganda 2011 growth hit by inflation, competition – group CEO”, available at: http://af.reuters.com/article/ugandaNews/idAFL5E7JO2BI20110824 (accessed 22 September 2012).
Faulu Kenya (n.d.), “Introducing Kopa Chapaa with Faulu Kenya and Airtel Money”, available at: www.faulukenya.com/index.php?option=com_content&view=article&id=153&Itemid=140 (accessed 12 July 2012).
Government of Uganda (2011), National Information Security Strategy, available at: www.sicurezzacibernetica.it/it/[Uganda]%20National%20Cyber%20Security%20Strategy%20-%202011%20-%20EN.pdf (accessed 7 September 2012).
GSM Association (GSMA, 2011), Mobile Money for the Unbanked 2011: Annual Report, available at: www.gsma.com/mobilefordevelopment/wp-content/uploads/2013/04/mmureport98.pdf (accessed 22 September 2012).
Human Rights Network for Journalists-Uganda (HRNJ-Uganda) (2012), “Law requiring registration of SIM cards in Uganda a threat to privacy”, available at: www.ifex.org/uganda/2012/09/24/sim_card_registration (accessed 4 August 2012).
LIRNEasia (2008), Manual of Instructions for Conducting the Telecom Regulatory Environment (TRE) Assessment, available at: www.lirneasia.net/wp-content/uploads/2008/04/lirneasia_tremanual_v21.pdf (accessed 4 August 2012).
Ministry of Information and Communications Technology (MOICT) (2010), Transition from Internet Protocol Version 4 (IPv4) to Internet Protocol Version 6 (IPv6) Policy (Draft), December available at: www.nita.go.ug/uploads/IPv6_DRAFT_POLICY%20(1).pdf (accessed 7 September 2012).
Ministry of Information and Communications Technology (MOICT) (2011a), Information Management Services Policy: Draft V.8, February, available at: www.nita.go.ug/uploads/Draft_IMS_Policy.pdf (accessed 7 September 2012).
Ministry of Information and Communications Technology (MOICT) (2011b), National Information Security Strategy (NISS), March, available at: www.nita.go.ug/uploads/NISS.pdf (accessed 7 September 2012).
Ministry of Information and Communications Technology (MOICT) (2011c), Institutionalisation of Information and Communications Technology (ICT) Function in Ministries, Departments, Agencies/Local Governments (MDAs/LGs): Draft Final Report, March, Kampala.
Ministry of Information and Communications Technology (MOICT) (2012), Draft Telecommunications Policy 2012, August, Kampala.
Ministry of Works, Housing and Communications (2003), National Information and Communication Technology Policy, October, Kampala.
MTN Uganda (2011), “ATC and MTN Group announce the formation of new joint venture in Uganda”, available at: www.mtn.co.ug/About-MTN/News-Room/2011/December/American-Tower-Corporation---M.aspx (accessed 4 August 2012).
MTN Uganda (2012), “Interim results”, available at: www.mtn.com/Investors/Financials/Pages/interimresults.aspx (accessed 4 August 2012).
MTN Uganda (n.d.1), “MTN Xtra Time – terms and conditions”, available at: www.mtn.co.ug/MTN-Services/Promotions/MTN-Xtra-Time.aspx (accessed 4 August 2012).
MTN Uganda (n.d.2), “Airtime recharge”, available at: www.mtn.co.ug/MTN-Services/Airtime/Airtime-Recharge.aspx (accessed 4 August 2012).
MTN Uganda (n.d.3) “MTN Mobile Money” available at: www.mtn.co.ug/MTN-Services/Mobile-Banking/MTN-MobileMoney.aspx (accessed 4 August 2012).
Mugabe, D. (2011), “Uganda telecom in financial crisis”, available at: www.newvision.co.ug/D/8/12/758075 (accessed 12 July 2012).
References

51
Understanding what is happening in ICT in Uganda
National Information Technology Authority-Uganda (NITA-U, n.d.), “NBI/EGI project”, available at: www.nita.go.ug/index.php/projects/nbiegi-project (accessed 12 July 2012).
Ndiwalana, A. and Picaithly, L. (2012), “Are you getting your share? Revenue protection in mobile money”, available at: www.cgap.org/blog/are-you-getting-your-share-revenue-protection-mobile-money (accessed 10 December 2012).
Organisation for Economic Co-operation and Development (OECD) (2010), Revision of the Methodology for Constructing Telecommunication Price Baskets, available at: www.oecd.org/sti/broadband/48242089.pdf (accessed 10 December 2012).
Orange Uganda (n.d.1), “Internet Everywhere”, available at: www.orange.ug/mobile-plans/internet-everywhere.php (accessed 4 August 2012).
Orange Uganda (n.d.2), “Wetaase”, available at: www.orange.ug/mobile-plans/wetaase.php (accessed 4 August 2012).
Orange Uganda (n.d.3), “Mobile internet”, available at: www.orange.ug/mobile-plans/mobile-internet.php (accessed 4 August 2012).
Orange Uganda (n.d.4), “Orange phones”, available at: www.orange.ug/mobile-plans/orange-phones.php (accessed 4 August 2012).
Republic of Uganda (1977), Electronic Media Act 1997 (Cap. 104) 1977, Kampala.
Republic of Uganda (1997), Uganda Communications Act 1997, available at: www.itu.int/ITU-D/ict/webs/ucc/uca1997.pdf (accessed 10 December 2012).
Republic of Uganda (2000), Uganda Communications Act (Cap. 106), available at: www.researchictafrica.net/countries/uganda/Uganda%20Telecommunications%20Act.pdf (accessed 7 September 2012).
Republic of Uganda (2007), Regulation of Interception of Communications Bill, available at: www.parliament.go.ug/billtrack/bills/text/tapping_bill.pdf (accessed12 July 2012).
Republic of Uganda (2009), National Information Technology Authority Uganda Act 2009, available at: www.nita.go.ug/uploads/NITA-U%20Act%20(Act%20No.%204%20of%202009).pdf (accessed 7 September 2012).
Republic of Uganda (2010), Regulation of Interception of Communications Act 2010, available at: www.ulii.org/content/regulation-interception-communications-act-2010 (accessed 7 September 2012).
Republic of Uganda (2011), Regulation of Interception of Communications Instrument 2011, Kampala.
Republic of Uganda (2012), Uganda Communications Regulatory Authority Bill 2012, Kampala.
Research ICT Africa (RIA) (2012), Household and Small Business Access & Usage Survey, RIA Survey Methodology Brief, January, available at: www.researchictafrica.net/publications/Research_ICT_Africa_Policy_Briefs/2012_Stork_-_ICT_Survey_Methodology.pdf (accessed 10 December 2012).
Research ICT Africa (RIA) (n.d.), “Price Transparency Index”, available at: http://researchictafrica.net/prices/Fair_Mobile.php (accessed 10 December 2012).
Safaricom (n.d.), “Lainisha Maisha na M-Shwari”, available at: www.safaricom.co.ke/personal/m-pesa/m-shwari (accessed 12 December 2012).
Samarajiva, R., Dokeniya, A., Fernando, S., Manikkalingam, S. and Sanderatne1, A. (Eds.) (2005), Regulation and Investment: Sri Lanka Case, World Dialogue on Regulation for Network Economies, available at: www.ictregulationtoolkit.org/en/toolkit/docs/Document/3304 (accessed 12 July 2012).
Ssonko, G. W. (2011), Status of Mobile Money Services in Uganda: An Exploratory Study, Bank of Uganda, Kampala.
Sudi, D. (2012), “Uganda’s communications regulator wants to disconnect fake handsets”, 6 September, available at: www.humanipo.com/blog/1491/Ugandas-communications-regulator-wants-to-disconnect-fake-handsets (accessed 4 August 2012).
Tellez, C. (2011), “Barriers to customer activation: a case study from MTN Uganda”, available at: http://mmublog.org/blog/barriers-to-customer-activation-a-case-study-from-mtn-uganda (accessed 22 September 2012).
Tentena, P. (2012), “Uganda – country set to revise mobile interconnection fees downwards”, available at: http://allafrica.com/stories/201204100025.html (accessed 4 August 2012).

52
Evidence for ICT Policy Action
The Independent (2011), “MTN, Airtel raise call tariffs”, 10 September, available at: www.independent.co.ug/business/business-briefs/4604-mtn-airtel-raise-call-tariffs (accessed 4 August 2012).
Uganda Bureau of Statistics (UBOS) (2012), Statistical Abstract 2012, available at: www.ubos.org/onlinefiles/uploads/ubos/pdf%20documents/2012StatisticalAbstract.pdf (accessed 12 July 2012).
Uganda Communications Commission (UCC) (2009), Rural Communications Development Policy for Uganda, January, available at: www.researchictafrica.net/countries/uganda/Uganda%20Rural%20Communication%202009.pdf (accessed 10 December 2012).
Uganda Communications Commission (UCC) (2011), Post and Telecommunications Annual Market Review 2010/2011, available at: http://the UCC.co.ug/files/downloads/2010%2011%20Annual%20Post%20and%20Telecommunications%20Market%20Review%20141111.pdf (accessed 22 September 2012).
Uganda Communications Commission (UCC) (2012), 2011/12 Half Year (1H11/12) Post and Telecommunications Market Review, available at: www.ucc.co.ug/files/downloads/2011-12%20Half%20Year%20Market%20Performance%20Review%20New%20(1).pdf (accessed 22 September 2012).
Uganda Communications Commission (UCC) (n.d.), website, available at www.ucc.co.ug (accessed 10 December 2012).
UN Conference on Trade and Development (UNCTAD) (2012), Mobile Money for Business Development in the East African Community: A Comparative Study of Existing Platforms and Regulations, available at: http://unctad.org/en/PublicationsLibrary/dtlstict2012d2_en.pdf (accessed 10 December 2012).
Warid Telecom (n.d.), website, available at: www.waridtel.com (accessed 10 December 2012).
World Bank (2012), eTransform Africa: The Transformational Use of Information and Communication Technologies in Africa, available at: http://siteresources.worldbank.org/EXTINFORMATIONAND COMMUNICATIONANDTECHNOLOGIES/ Resources/ 282822-1346223280837/MainReport.pdf (accessed 20 December 2012).
World Economic Forum (WEF) (2011), “The Global Information Technology Report 2010-2011: Transformations 2.0”, available at: http://reports.weforum.org/wp-content/pdf/gitr-2011/wef-gitr-2010-2011.pdf (accessed 22 September 2012).

ISSN: 2310-1156