Embed Size (px)
Citation preview
1
Policy Interventions to Tackle the Obesogenic EnvironmentFocusing on adults of working age in Scotland

2
Policy Interventions to Tackle the Obesogenic Environment
Policy Interventions to Tackle the Obesogenic Environment Focusing on adults of working age in Scotland
John Mooney, Sally Haw and John Frank
Scottish Collaboration for Public Health Research and Policy
MRC Human Genetics Unit building
Western General Hospital
Crewe Road
Edinburgh EH4 2XU Scotland U.K.
Available on the internet at www.SCPHRP.ac.uk
ISBN: 978-0-9565655-7-0
Copyright ©Scottish Collaboration for Public Health Research and Policy 2011
This work was funded by the Medical Research Council and the Chief Scientist Office of the Scottish Government. Views expressed in this publication are those of the authors and do not necessarily reflect those of the Medical Research Council or the Chief Scientist Office of the Scottish Government.
John Mooney BSc, MPH, MFPH
Sally Haw BSc, HnMFPH
John Frank MD, CCFP, MSc, FRCP (C), FCAHS, FFPH
A report for the Early to Mid-Working Life Working Group of the Scottish Collaboration for Public Health Research and Policy (SCPHRP)

3
Acknowledgements
• MembersoftheWorkingLifesub-groupoftheScottishCollaborationforPublicHealthResearchandPolicy.
• DonnaCiliska,ScientificDirectorandSharonPeck-Reid,ResearchAssistant,NationalCollaboratingCentrefor(PublicHealth)MethodsandToolsatMcMasterUniversity,Canada.
• SamBainandCarolineRees,AdministratorsfortheScottishCollaborationforPublicHealthResearchandPolicy.
• HealthPromotionDepartmentatNHSHighlandforhostingpilotrunofFeasibilityScoringMethodsinNovember2010(chapter8).
3

4
Policy Interventions to Tackle the Obesogenic Environment
Table of contents
Executive Summary
Introduction
Physicalenvironment
Economicenvironment
Legislativeenvironment
Socioculturalenvironment
Overallapproachtoavailableevidence
Developmentofpolicyoptions
Chapter 1: Introduction and overview
1.1 Background
1.2 Conclusionsoffirstmeeting:Workstreams
1.3 Searchstrategyandinitialguidance
1.4 Structureandpurposeofthisreport
Chapter 2: Obesity in adults
2.1 Definingobesity
2.2 Obesityasapublichealthpriority
2.3 TheepidemiologyofobesityinScotland
2.4 Keydriversofobesity
2.5 Theobesogenicenvironment
2.6 Appraisingevidenceforobesityprevention
2.7 Towardsacoherentobesitystrategy
Chapter 3: The physical environment
3.1 Ecologicalmodelforphysicalenvironment
3.2 Nutritioninterventions(macro-level)
3.3 Nutritioninterventions(micro-level)
3.4 Physicalactivityinterventions(macro-level)
3.5 Physicalactivityinterventions(micro-level)
Chapter 4: Interventions to the economic environment
4.1 Introduction
4.2 Nutritioninterventions(macro-level)
4.3 NutritionInterventions(micro-level)
4.4 Physicalactivityinterventions(macro-level)
4.5 Physicalactivityinterventions(micro-level)
Chapter 5: Interventions in the legislative environment
5.1 Introduction
5.2 Nutritionintervention(macro-level)
5.3 Nutritionintervention(micro-level)
5.4 Physicalactivityinterventions(macro-level)
5.5 Physicalactivityinterventions(micro-level)
7
7
7
8
8
9
9
9
11
11
11
12
13
15
15
15
16
19
20
22
23
25
25
25
27
33
41
45
45
45
50
51
51
53
53
54
60
62
63
Page:
4
5
Page: 65
65
66
67
67
71
77
77
80
82
85
85
88
92
93
94
95
97
97
97
99
Chapter 6: Interventions in the sociocultural environment
6.1 Introduction
6.2 NutritionInterventions(macro-level)
6.3 Nutritioninterventions(micro-level)
6.4 Physicalactivityinterventions(macro-level)
6.5 Physicalactivityinterventions(micro-level)
Chapter 7: Current policy landscape in Scotland
7.1 Backgroundandoverview
7.2 BeyondForesightintheUKandScotland
7.3 TheroutemapforobesitypreventioninScotland
Chapter 8: Prioritising the way forward
8.1 Theportfoliomatrixandevidenceinformedpolicy
8.2 Portfolioimplementation
8.3 Obesityasa‘complexadaptivesystem’
8.4 Combiningpublichealthandeconomicperspectives
8.5 Historicalpublichealthparallels
8.6 Integrationwithotherpoliticalandhealthpriorities
8.7 Recommendationsfornextsteps
8.8 Limitationsofthisreview
8.9 Overallconclusion
References
Weblinkedreferencesarepresentedwithinthemaintextashyperlinkedfootnotesandallliteraturecitationsarelistedinthereferencesection.

6
Policy Interventions to Tackle the Obesogenic Environment
7
I. Introduction
ObesityhasbeenconfirmedasoneofScotland’smostseriouspublichealthproblemsandlevelshavebeenrisingsteadilyoverthelast10years,withmarkedincreasesinmenaged35–64yearsandinwomenaged35–44years.Whenincreasingpopulationobesityisviewedsimplyasadistortedenergybalance(towardsexcess),thesolutions,namelytoreduceenergyintakeandincreaseexpenditure,wouldappeartobeselfevident.Driverstowardsincrementalweightgainhowever,arenowcloselyassociatedwithalmosteveryaspectofmodernlivingandthescaleandcomplexityofthechallengesinvolvedshouldnotbeunderestimated.Thisreportpresentsabroadoverviewofthepublishedliteratureonobesitypreventioninadults,inaformatthatshouldhelpfacilitatediscussionaboutwhatarelikelytobethemosteffectivepolicyoptionsacrossthefourdomainsofthepolicyenvironmentinitsbroadestsense,thesebeing:physical,economic,legislativeandsociocultural.InaccordancewithSwinburnandEggers’ANGELO(analysisgridforenvironmentslinkedtoobesity)framework,theevidenceineachofthesedomainsisconsideredatthemacro-level(i.e.national/regional)andmicro-levels(local/community/institution/household).Theothersignificantdistinctiontobedrawninanydiscussionaroundpotentialsolutionstotheobesityepidemicistherelativeimportancegiventoenergyintakeversusenergyoutputormorespecifically,dietversusphysicalactivity.Sinceanyseriousattempttoaddresstheproblematasocietallevelneedstopayattentiontoboththeseaspects,bothnutritionandactivityinterventionshavebeenreviewedforeachofthefourANGELOdomains.Agrowingconsensusthattherecentrapidpopulationrisesinobesitycanlargelybeexplainedbyincreasedenergyintake,alsohighlightstheimportanceofgivingequivalentorgreaterattentiontonutritionalfactorswhendecidingonhowbesttotackletheepidemic.
II. Physical environment
ThegreateravailabilityoffastfoodoutletsinsociallydeprivedandinAfrican-AmericanneighbourhoodsintheUS(wheremuchoftherelevantresearchhasbeenconducted),hasbeenassociatedwithanincreasedlikelihoodofobesityinthesepopulations.Thisfindingdoesnotapplytothesameextentinrelativelydeprivedareas/predominantlyethnicminoritylocalitiesofUKtownsandcities.Additionally,physicalproximitytoaffordablefoodchoicesdoesnotappeartobeastrongdeterminantofahealthydietinUKsettingswherethishasbeenexamined.AnimprovinginternationalandUKresearchliteratureinthisareahoweverclearlydoesdemonstratearoleforlocalenvironmentaldeterminants,mainlyaroundaccesstoamenitiesandtheextentofneighbourhooddisorder.Alsoatthelocallevel,theclearestassociationsforexcessenergyintakeincommercialcateringoutletsincludingrestaurants,hasbeenforlargerportionsizesandenergydensefoods.
Workplaceenvironmentalinterventions,includingnutritionavailabilityandinformation,havebeenrobustlydemonstratedtoresultinsignificantmeanreductionsinbodymassindex(BMI)andbodyweightfortargetedgroupsofworkersacrossawiderangeofemploymentsectors.Perhapsunsurprisingly,andinkeepingwithecologicalmodels,multi-componentandmoreintensivelystructuredinterventionsareassociatedwiththebestoutcomes,althoughseparatingoutthecontributionsofvariousprogrammecomponentscanbeproblematic.Lowintensityenvironmentalinterventionsbythemselves(suchasnutritionsigns),havelimitedbenefitswithinworkplacesettings.
Consistentassociationshavenowbeendemonstratedinanumberofcountriesbetweenfeaturesoftheexternalbuiltenvironmentandthelikelihoodofundertakingregularphysicalactivity,aswellastherelativeprevalenceofobesityandoverweight.SincethemajorityofthisworkisbasedonUSandAustralianstudies,therearelegitimateconcernsaboutthetransferabilityofthesefindingstoaUK/Scottishcontext.Theevidencebaseonbuiltenvironmentfactorsisalsocharacterisedbyincreasinglysophisticatedmethodsofenquiryincludingnaturalexperiments,longitudinalmeasuresandstratificationbydominantpreferencesandbehaviours,allofwhichpointtowardsadegreeofpromiseforbuilt-environmentinterventions,infacilitatingpositivebehaviourchange.
Executive Summary
8
Policy Interventions to Tackle the Obesogenic Environment
ThereislimitedUKevidencethatenvironmentalsurroundingscaninfluenceactivetravel,butthisisnotparticularlysurprisinggiventhatbaselinelevelsofactivetravelintheUKarelowandlargelyconfinedtoself-selectedpopulationsub-groups.Internationalcomparisonshowever,withcountriesthathaveequallyhighlevelsofcarownershipandsimilarclimates(e.g.GermanyandHolland),givessomegroundsforoptimismthatactivetravelcouldbepromotedbybuiltenvironmentmodifications.Inthiscontext,earlyresultsfromtheevaluationsofsix“cyclingdemonstrationtowns”inEngland,whichhaveseensubstantialincreasesincyclingasameansoftravel,arealsogreatlyencouraging.Additionally,thefindingthatmuchoftheexistingpublishedevidencerelatestothecapacityofbuiltenvironmentinterventionstoimprovesafety,shouldnotbediscouragingtopolicymakers,inviewoftheclearimportanceofimprovedsafetyinencouragingwiderparticipationinactivetravel.
Simplemotivationalsignscanbeaneffectivemeansofpromotingphysicalactivityinpublicsettingssuchasshopsandpublictransporthubs,althoughlongtermsustainabilityofthedesiredbehaviourchangehasyettobedemonstrated.Structuralinterventionssuchasengineered‘stair-skip’featuresinbuildingscanalsoincreasestairuseandtheinitialemployee/publicresistancetotheseinterventionsappearstodeclineovertime.Thepotentialimpactofsuchverymarginalincreasesinenergyuseonpopulationweighthowever,areofcourseonlylikelytobesmallandthesekindofmeasuresarebestusedasjustonepartofamorecomprehensivemulti-componentstrategy(e.g.attheworkplaceorcommunitylevel).
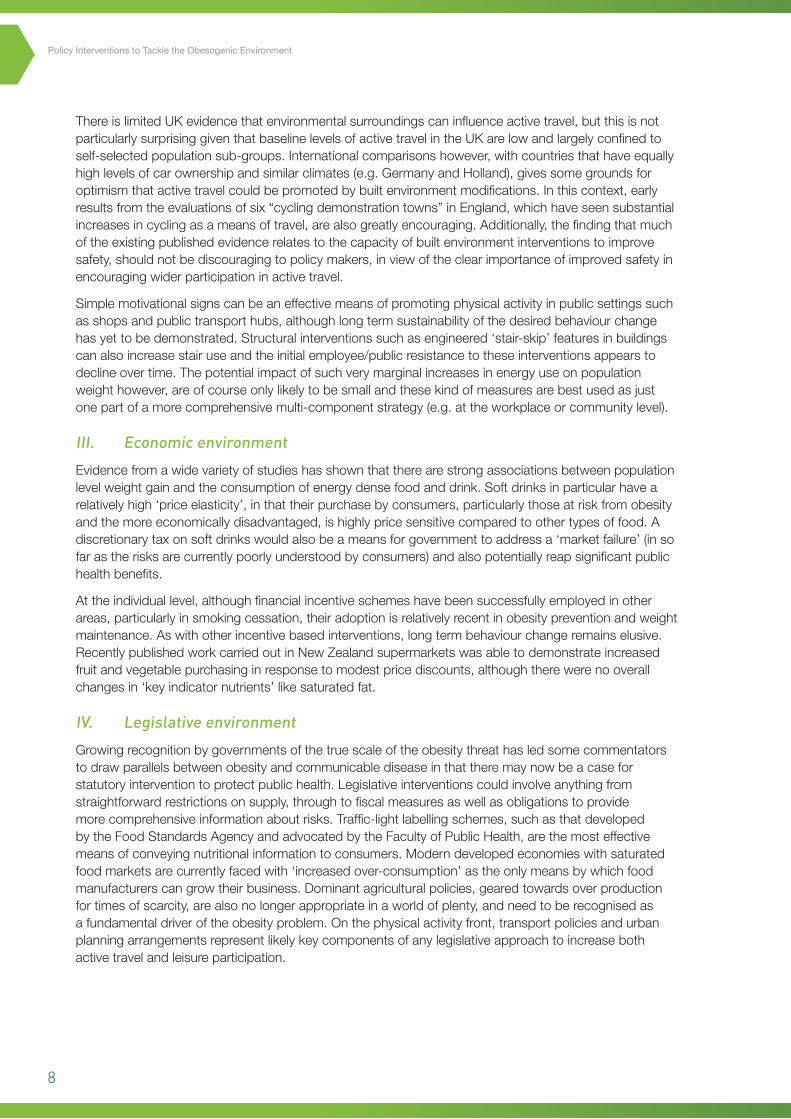
III. Economic environment
Evidencefromawidevarietyofstudieshasshownthattherearestrongassociationsbetweenpopulationlevelweightgainandtheconsumptionofenergydensefoodanddrink.Softdrinksinparticularhavearelativelyhigh‘priceelasticity’,inthattheirpurchasebyconsumers,particularlythoseatriskfromobesityandthemoreeconomicallydisadvantaged,ishighlypricesensitivecomparedtoothertypesoffood.Adiscretionarytaxonsoftdrinkswouldalsobeameansforgovernmenttoaddressa‘marketfailure’(insofarastherisksarecurrentlypoorlyunderstoodbyconsumers)andalsopotentiallyreapsignificantpublichealthbenefits.
Attheindividuallevel,althoughfinancialincentiveschemeshavebeensuccessfullyemployedinotherareas,particularlyinsmokingcessation,theiradoptionisrelativelyrecentinobesitypreventionandweightmaintenance.Aswithotherincentivebasedinterventions,longtermbehaviourchangeremainselusive.RecentlypublishedworkcarriedoutinNewZealandsupermarketswasabletodemonstrateincreasedfruitandvegetablepurchasinginresponsetomodestpricediscounts,althoughtherewerenooverallchangesin‘keyindicatornutrients’likesaturatedfat.
IV. Legislative environment
Growingrecognitionbygovernmentsofthetruescaleoftheobesitythreathasledsomecommentatorstodrawparallelsbetweenobesityandcommunicablediseaseinthattheremaynowbeacaseforstatutoryinterventiontoprotectpublichealth.Legislativeinterventionscouldinvolveanythingfromstraightforwardrestrictionsonsupply,throughtofiscalmeasuresaswellasobligationstoprovidemorecomprehensiveinformationaboutrisks.Traffic-lightlabellingschemes,suchasthatdevelopedbytheFoodStandardsAgencyandadvocatedbytheFacultyofPublicHealth,arethemosteffectivemeansofconveyingnutritionalinformationtoconsumers.Moderndevelopedeconomieswithsaturatedfoodmarketsarecurrentlyfacedwith‘increasedover-consumption’astheonlymeansbywhichfoodmanufacturerscangrowtheirbusiness.Dominantagriculturalpolicies,gearedtowardsoverproductionfortimesofscarcity,arealsonolongerappropriateinaworldofplenty,andneedtoberecognisedasafundamentaldriveroftheobesityproblem.Onthephysicalactivityfront,transportpoliciesandurbanplanningarrangementsrepresentlikelykeycomponentsofanylegislativeapproachtoincreasebothactivetravelandleisureparticipation.
9
V. Sociocultural environment
Massmediaisperhapsthemostuniversalreflectorandparticipantshaperofsocioculturalattitudesinmodernsociety.Theeffectivenessofmediacampaignsthemselveshowevertoencouragehealthybehavioursismodestatbest,althoughtheystillhavethepotentialtobringaboutmarginalpopulationhealthgainatthenationalorregionallevel.Largescalepublicparticipationeventsareaneffectivemeansofbeginningtochangepopulationattitudesandbehaviours,aswellasinfluencingindividualperceptionsofability.Individuallyfocusedactivityincentives(suchasprimarycarebasedexercisereferral),haveaverymixedevidencebaseandtheireffectivenessandwideruseislikelytodependonthedevelopmentofimprovedtargetingalongsidebetterevaluation.Personaltravelplanning,ontheotherhand(athouseholdlevel),hasbeenassociatedwithconsistentreductionsincardependenttravel,althoughtherearesignificantconcernsaboutthequalityoftheevidence.Theimpactofanyfurtherinvestmentinsuchschemesneedstoberobustlyevaluated.WorkplacebasedtravelplanshavealsobeenshowntobeacosteffectiveandfeasiblemeansofincreasingmoreactiveformsofcommutinginaUKsetting.
Thevastmajorityofmediacommunicationonnutritionisaimedatchildren,althoughtelevisionviewingingeneralislinkedtoobesityinanumberofways.UKbroadcastregulatorrestrictionsonjunkfoodadvertisingintroducedin2006,havecertainlybeeneffectiveinreducingexposureduringchildren’stelevisionhours,buttherehasundoubtedlybeensomemigrationofthesetypesofadvertstofamilyviewingtimes.Multi-componentnutritioninterventionshavealsohadsomesuccessinchangingworkplaceandinstitutionalfoodcultures.TheambitioushighprofilemediapublicisedbehaviourchangecampaigninEngland,Change4Life,isaimedprincipallyatfamiliesandhasevaluatedwelltodateonawarenessraisingoutcomes.Ongoingevaluationisintendedtolookforevidenceofanybenefitindirectoutcomessuchaspopulationhealthyweightmaintenance.
VI. Overall approach to available evidence
Sinceobesitypreventionandcontrolissucharapidlyevolvingfieldofenquiry,manyinterventionproposalsarecurrentlybasedonlyonstudiesofassociation,althoughincreasinglysophisticatedquasi-experimentalworkisnowbeingusedtorefinetheevidencebasearoundwhatmightworkthroughdeliberatedesignedinterventions.Bynecessitytherefore,thisrapidreviewofthepublishedliterature,drawsuponawidevarietyofstudyformats,dependingontheextentofcurrentprogressineachparticulararea.Severalcommentatorshavealsohighlightedtheneedforresearchersnottoberestrictedbyconventionalmodelsofdiseaseprevention,wherecausationneedstobefirmlyestablishedbeforepotentialinterventionsaretriedandtested.Theonecertaintyisthatobesityremainsahighlycomplexmultifacetedproblem,closelyentwinedwithmanyaspectsofmodernliving.Unravellingthecomponentsthataremostamenabletointerventionwillrequireasolutionorientatedapproachandareadinesstoconsiderunconventionalmulti-componentstrategies,withalltheadditionalchallengesthatthisrepresentsforrobustmonitoringandevaluation.
VII. Development of policy options
Thefollowingdocumentpresentsarelativelyselectivesummaryoftheevidenceavailableineachoftheaboveareasanddrawsonawiderangeofpublishedsourcesincludingsystematicreviewswherethesewereavailable.ItisintendedtofacilitatediscussionsamonglocaldecisionmakersandstakeholdersaboutwhatmightbethemostpracticableandrealisticenvironmentalandpolicyinterventionsthatwouldhavethegreatestchanceofsuccessinScotland.Chapter7presentsanoverviewofthecurrentpolicylandscapeinScotland,whilechapter8presentsthereviewfindingsinasummarytableformatanddescribesastructureddiscussionmethodforrefiningpotentialproposalstowardsimplementation.

10
Policy Interventions to Tackle the Obesogenic Environment
1

11
Chapter 1 – Introduction and overview11.1 Background
TheScottishCollaborationforPublicHealthResearchandPolicy(SCPHRP)wassetuptospecificallyidentifythebestevidenceavailableforpolicyinterventionstoaddressScotland’smajorpublichealthpriorities.SCPHRP’scoremandateisto:
• Identifykeyareasofopportunityfordevelopingnovelpublichealthinterventionsthatequitably addressmajorhealthproblemsinScotland,andmovethoseforward
• Fostercollaborationbetweengovernment,researchersandthepublichealthcommunityinScotlandtodevelopanationalprogrammeofinterventiondevelopment,large-scaleimplementationandrobustevaluation
• Buildcapacitywithinthepublichealthcommunityforcollaborativeresearchofthehighestquality,withmaximumimpactonScottishpolicies,programmesandpractice.
Specifically,theCollaborationseesitsownroleverymuchas‘brokers’betweenpublichealthdecisionmakersandresearchers,whootherwisedonotregularlyinteractinScotland(orelsewhere.)TheCollaboration’soverridingobjectiveistobuildrelationshipsacrossthisdividesothatnewpublichealthprogramsandpoliciesareproperlythoughtoutandpilottested,beforefullimplementation,andthenrobustlyevaluatedfortheireffectivenessandcostsasapartoffullrollout.SCPHRPhasfiveyearsofMedicalResearchCouncil(MRC)/theChiefScientistOffice(CSO)fundingtodemonstratethatsucha‘collaborative’approachcanachievethesegoals.
1.2 Conclusions of first meeting: Workstreams
TheinauguralworkshopsoftheCollaborationinearly2009identifiedfourmajorworkstreamsthatwouldconstitutealife-courseapproachtotacklingpublichealthproblemsinScotlandaccordingtokeylifestages:
• Earlylife-Preconceptionthroughthepre-andperi-natalperiods,totheprimaryschoolyears,whenstrongpredictorsoflifelonghealthtakeroot,butareexceptionallyamenabletochange
• Teenageandearlyadulthood-Whenculturallyinfluencedexternalcausesofillhealthpredominate,andarecurrentlytippingthebalancetowardsgreaterhealthinequalitiesinScotland(i.e.violence,suicideandrelatedmentalhealthproblems;smoking,drugandalcoholabuse;andriskysexualbehaviours)
• Earlytomid-workinglife-Whencareersuccess,workrelated-disabilityandfamilyfunctioning,andconsequentlymentalhealthandsocialissues,figurestronglyaskeyoutcomesforhealthyandproductiveadults,butarangeofchronicdiseaseriskfactorsalsotendtobecomefirmlyestablished,includingthecurrentpandemicofoverweight,withallofitsattendanthealthconsequences
• Laterlife-Especiallytheperiodbetweenages45and65,whensymptomaticchronicdiseasesandassociateddisabilitybegintoappear,typicallyinunequalwaysacrosssocioeconomicstrata,leadingtoquitedifferentialexperiencesofsenescence.
Chapter1
12
Policy Interventions to Tackle the Obesogenic Environment
Eachdedicatedworkgroupthendecidedonwhattheprioritytargetsforinterventionshouldbe.FortheEarlytoMid-WorkingLifegrouptherewasextensivediscussionaroundwhethertofocusatthewholepopulationlevelorwhethera‘settingsbased’approachthroughworkplaceinterventionswouldbemorepracticable,giventhetimeandresourceconstraintsinvolved.Thegroupdecidedtoincludebothlevelsofintervention,thetopicsprioritisedbeing:
• Interventionstotackleobesogenicaspectsoftheadultenvironment
• Interventionstoreducesickness/injuryabsenceandimprovehealthintheworkforce.
Thecurrentoverviewdealswiththefirstofthese,namely:‘obesogenicaspectsoftheenvironment’andidentifyingpotentialpoliciesorinterventionswhichmightbeeffectiveintacklingtheminaScottishcontext.
1.3 Search strategy and initial guidance
Thebroadall-encompassingquestionfortheinitialsearchwas:‘Arethereanyprovenorevaluatedpolicyinterventions,ormodificationstothebuiltenvironment,whichcanpromotephysicalactivityoractivetravel(e.g.walkingandcycling);reduceconsumptionofunhealthy(energydense)dietswhicharehighinfatandsugarorpromoteconsumptionofhealthier/lessenergydensefoodssuchasincreasedfruitandvegetables?’
AninitialscopingsearchwasconductedusingthefollowingMeSHtermsinPubMed:
Terms ((‘EnvironmentDesign’[Mesh]OR(‘NutritionalSciences’[Mesh]OR‘NutritionPolicy’[Mesh])AND‘Obesity/preventionandcontrol’[Mesh])OR‘Overweight/preventionandcontrol’[Mesh])
Limits Humans,Editorial,PracticeGuideline,Review,English,Adult(19–44years),MiddleAged(45–64years).Thisinitialsearchidentified144articlesintotal,116ofwhichwerereviews.
Thecomplexityandbroadnatureofinfluencesonobesityfromthesurroundingenvironmentcallsforamuchwiderperspectivethanwouldnormallybecoveredbytraditionalmedico-healthpublicationdatabases.Forthefullsearchamorecomprehensivelistoffullyexplodedterms(seeAppendixE1)wasperformedineachofthefollowingdatabases(whichwereidentifiedfromreviewsconductedbytheWHOInternationalObesityTaskForce[1]andtheNationalInstituteforClinicalExcellenceintheUK(physicalactivityfocus).
Databases
MEDLINE Sociologicalabstracts
EMBASE Planex*
CINAHL ICONDA*
PSYCHINFO Environline*
CampbellCollaboration
*Morerecentlydevelopeddatabases(unlikelytohavemanyarticlesofinterestbefore2000).
Inclusion
• Englishonly
• Human
• Adultworkinglife19to64yearsinclusive#
• Preventioninterventionscanbe:community,societal,infrastructural(e.g.builtenvironment)orlegislative(nationalorlocalgovernmentpolicy)
• Studytypes:reviews;(cluster)randomisedtrials;quasi-experimentalstudies;observationalandcross-sectionalstudies(includinglongitudinalcohortandfollow-upstudies)
• Timewindow:1990onwardsuntilSeptember2010(end)# Note:ForPubMedsearchestheagecategorieswererestrictedtoadult(19–44years)andmiddleaged
(45–64years).
1 Appendix E1 – available electronically through web-link: http://www.scphrp.ac.uk
13
Exclusions
• Individualbased(e.g.clinical/therapeutic)interventionsforobeseoroverweightpatients
• Rehabilitationprogramsormeasuresafterinjuryormedicalprocedures
• Nutritionmeasures/interventionsforindividualsorgroupswitheatingdisordersorotherseriousunderlyingillness.
Thissearchstrategyidentifiedatotalof78reviewlevelarticlesand49primarystudies.ReferencelistsandforwardcitationtrackingthroughWebofScienceidentifiedafurther34interventionspecificreports.Theremainingreferencesourceswereeditorials,policyframeworksandelectronicallyaccessedgreyliterature.Allreviewswhichmateriallycontributedtothisreportwillbesummarisedinaseparateappendix(E2)tobepublishedelectronicallyontheSCPHRPwebsite.
Notallidentifiedstudiesweresufficientlynovelorrelevantafterscrutinytobeincluded.
Thescanalsodrawsuponmanygovernmentdocuments,web-publishedmaterialandothergreyliteraturepromptedbycitationtrackingandconsultingoriginalsourcedocumentsanddata.
Othersources
• ConsultationwithestablishedUKexperts(PhillipInsall,NickCavill)
• Thirdsectororganisations(principallySUSTRANS)
• Localdedicatedresearchteams(SPARCOL)
• CollaborationwithapublichealthpolicyresearcheratNHSLothianHealthBoard
• Fourexpertinvitedreviewersforcommentsonthefirstcompletedraft.
1.4 Structure and purpose of this report
ThebreadthandcomplexityofallenvironmentalinfluencesandsocietaldriverswhichmightimpactonobesityandwhichweresetoutcomprehensivelyintheUKGovernment’sForesightReportonthesubject[2]providesomeinsightintopotentialtargetsforpreventativeinterventionsbutdonotreadilyleadtoawell-definedresearchquestion,orevenseriesofquestions.Thenatureoftheassociatedproblemsthatunderlyobesityarealsonotespeciallysuitableforclassicalrandomisedstudydesigns,whichconstitutethehigheststandardofscientificevidencefordecidingwhichinterventionsmightbethemosteffective.Thecurrentreporttherefore,isintendedprincipallytopresentasummaryofthebestevidenceavailablewithinaframeworkthatwehopewillbeofmostusetopolicymakers.Thankfully,thereareanumberofveryusefulecologicalmodelsthathelptoclarifyandhighlightpotentialenvironmentalandpolicyinterventions,someofwhichhavealreadybeenimplementedinotherpartsoftheworld(andwhicharediscussedinthecourseofthedocument).Intermsofmakinguseofavailableevidence,thescanfollowsapragmaticapproachandaimstopresentpotentialinterventionsinthecontextoftheirlikelypopulationimpactaswellasthestrengthofevidenceasitcurrentlystandsintheliterature(seesection2.7andtable2.4).
Chapter1

14
Policy Interventions to Tackle the Obesogenic Environment
2
15
2 Chapter 2 – Obesity in adults
2.1 Defining obesity
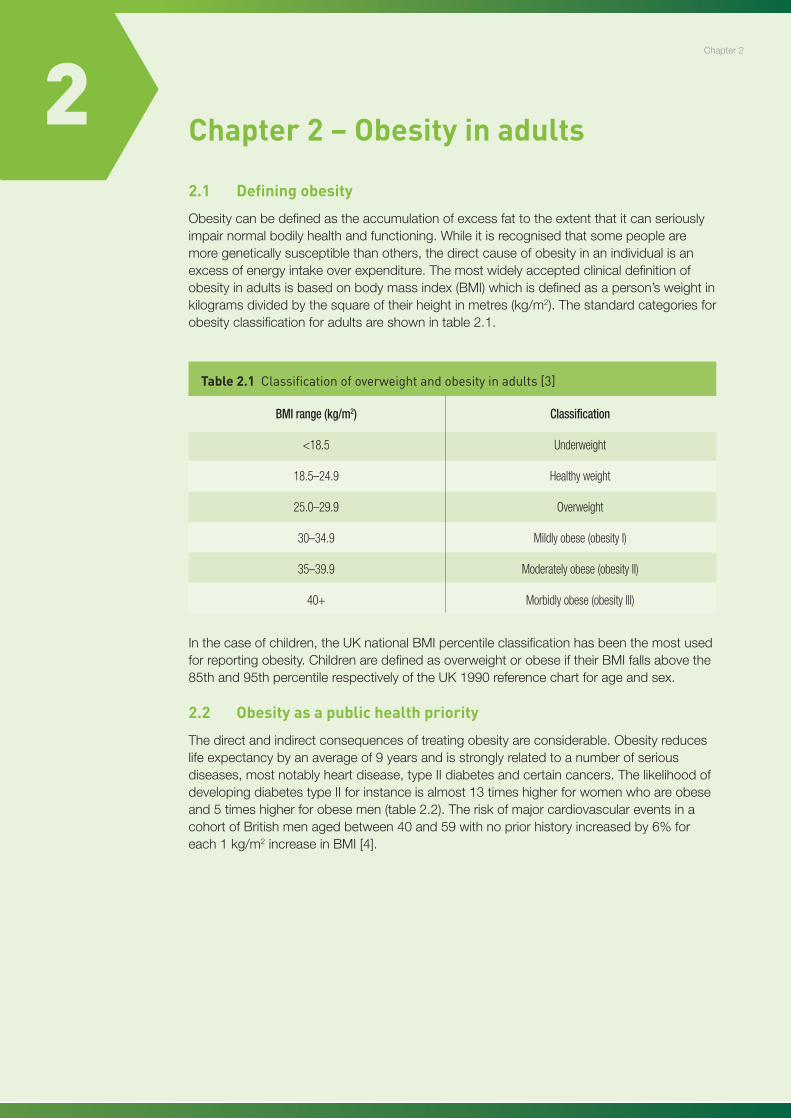
Obesitycanbedefinedastheaccumulationofexcessfattotheextentthatitcanseriouslyimpairnormalbodilyhealthandfunctioning.Whileitisrecognisedthatsomepeoplearemoregeneticallysusceptiblethanothers,thedirectcauseofobesityinanindividualisanexcessofenergyintakeoverexpenditure.Themostwidelyacceptedclinicaldefinitionofobesityinadultsisbasedonbodymassindex(BMI)whichisdefinedasaperson’sweightinkilogramsdividedbythesquareoftheirheightinmetres(kg/m2).Thestandardcategoriesforobesityclassificationforadultsareshownintable2.1.
Inthecaseofchildren,theUKnationalBMIpercentileclassificationhasbeenthemostusedforreportingobesity.ChildrenaredefinedasoverweightorobeseiftheirBMIfallsabovethe85thand95thpercentilerespectivelyoftheUK1990referencechartforageandsex.
2.2 Obesity as a public health priority
Thedirectandindirectconsequencesoftreatingobesityareconsiderable.Obesityreduceslifeexpectancybyanaverageof9yearsandisstronglyrelatedtoanumberofseriousdiseases,mostnotablyheartdisease,typeIIdiabetesandcertaincancers.ThelikelihoodofdevelopingdiabetestypeIIforinstanceisalmost13timeshigherforwomenwhoareobeseand5timeshigherforobesemen(table2.2).TheriskofmajorcardiovasculareventsinacohortofBritishmenagedbetween40and59withnopriorhistoryincreasedby6%foreach1kg/m2increaseinBMI[4].
Chapter2
BMI range (kg/m2)
<18.5
18.5–24.9
25.0–29.9
30–34.9
35–39.9
40+
Classification
Underweight
Healthy weight
Overweight
Mildly obese (obesity I)
Moderately obese (obesity II)
Morbidly obese (obesity III)
Table 2.1 Classification of overweight and obesity in adults [3]

16
Policy Interventions to Tackle the Obesogenic Environment
Inadditiontoincreasingtherisksofillhealth,obesitysignificantlyincreasestheriskofmortalityatanygivenage.Formidlifeadults(50to71yearsold),whohaveneversmoked,theallcausemortalityriskincreasesby20%to40%inoverweightpersonsandby200%to300%inthosewhoareobese[5].Thereisalsoalinkbetweenmortalityriskandthedurationofoverweight,withthosewhohavebeenoverweightforlongestbeingatthehighestrisk.Severelyobeseindividualsarelikelytodieonaverage11yearsearlier(13yearsforaseverelyobesemanbetween20and30yearsofage),thanthoseofahealthyweight.Thisriskiscomparableto,andinsomecasesworsethan,thereductioninlifeexpectancyfromsmoking.Extrapolationsinthegovernment’srecentForesightreport[2],suggestthatby2025fortheUKpopulationasawhole,somethingintheregionof40%ofadultscouldbeobese.
2.3 The epidemiology of obesity in Scotland
TheScottishPublicHealthObservatoryreportin2007[6]confirmedthestatusofobesityasoneofScotland’smostseriouspublichealthproblems(asisalsothecasefortherestoftheUK).Thereportsetsouthowobesitylevelsinbothadultsandchildrenhaverisensteadilyoverthelast10yearswithmarkedincreasesinmenaged35–64yearsandinwomenaged35–44years.Amongitskeyfindingsare:
• Theprevalenceofobesity(BMI>30kg/m2)inScotlandhasincreasedoverthepasttwodecades,reaching22%inmenand24%inwomenin2003,withmarkedincreasesin(workingage)menaged35–64yearsandinwomenaged35–44years
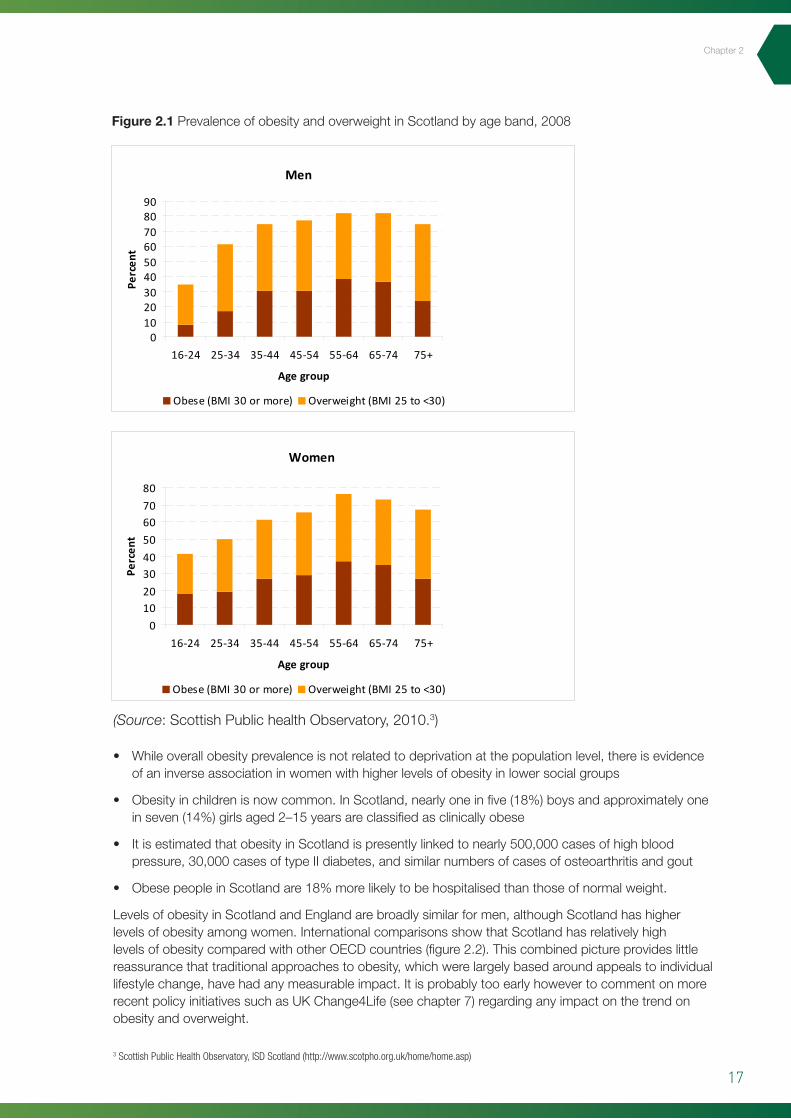
• Theprevalenceofobesityclearlyincreaseswithagethroughoutmostofthelife-courseinbothmenandwomen(figure2.1).
Disease
Type II diabetes
Hypertension
Myocardial infarction
Cancer of the colon
Angina
Gall bladder disease
Ovarian cancer
Osteoarthritis
Stroke
Relative risk for women
12.7
4.2
3.2
2.7
1.8
1.8
1.7
1.4
1.3
Relative risk for men
5.2
2.6
1.5
3.0
1.8
1.8
–
1.9
1.3
Table 2.2 Classification of overweight and obesity in adults [3]
(Source:NationalAuditOffice20012)
2 Tackling Obesity in England. National Audit Office 2001. http://www.nao.org.uk/publications/0001/tackling_obesity_in_england.aspx
17
Chapter2
3 Scottish Public Health Observatory, ISD Scotland (http://www.scotpho.org.uk/home/home.asp)
Figure 2.1 PrevalenceofobesityandoverweightinScotlandbyageband,2008
• Whileoverallobesityprevalenceisnotrelatedtodeprivationatthepopulationlevel,thereisevidenceofaninverseassociationinwomenwithhigherlevelsofobesityinlowersocialgroups
• Obesityinchildrenisnowcommon.InScotland,nearlyoneinfive(18%)boysandapproximatelyoneinseven(14%)girlsaged2–15yearsareclassifiedasclinicallyobese
• ItisestimatedthatobesityinScotlandispresentlylinkedtonearly500,000casesofhighbloodpressure,30,000casesoftypeIIdiabetes,andsimilarnumbersofcasesofosteoarthritisandgout
• ObesepeopleinScotlandare18%morelikelytobehospitalisedthanthoseofnormalweight.
LevelsofobesityinScotlandandEnglandarebroadlysimilarformen,althoughScotlandhashigherlevelsofobesityamongwomen.InternationalcomparisonsshowthatScotlandhasrelativelyhighlevelsofobesitycomparedwithotherOECDcountries(figure2.2).Thiscombinedpictureprovideslittlereassurancethattraditionalapproachestoobesity,whichwerelargelybasedaroundappealstoindividuallifestylechange,havehadanymeasurableimpact.ItisprobablytooearlyhowevertocommentonmorerecentpolicyinitiativessuchasUKChange4Life(seechapter7)regardinganyimpactonthetrendonobesityandoverweight.
16
Men
0102030405060708090
16-24 25-34 35-44 45-54 55-64 65-74 75+
Age group
Perc
ent
Obese (BMI 30 or more) Overweight (BMI 25 to <30)
Women
01020304050607080
16-24 25-34 35-44 45-54 55-64 65-74 75+
Age group
Perc
ent
Obese (BMI 30 or more) Overweight (BMI 25 to <30)
Figure 2.1 Prevalence of obesity and overweight in Scotland by age band, 20082
• While overall obesity prevalence is not related to deprivation at the population level, there
is evidence of an inverse association in women with higher levels of obesity in lower social
groups.
• Obesity in children is now common. In Scotland, nearly one in five (18%) boys and
approximately one in seven (14%) girls aged 2–15 years are classified as clinically obese.
• It is estimated that obesity in Scotland is presently linked to nearly 500,000 cases of high
blood pressure, 30,000 cases of type II diabetes, and similar numbers of cases of
osteoarthritis and gout.
• Obese people in Scotland are 18% more likely to be hospitalised than those of normal
weight.
2 Data source: Scottish Public Health Observatory, ISD Scotland (http://www.scotpho.org.uk/home/home.asp)
Formatted: Bulleted + Level: 1 +Aligned at: 0.63 cm + Tab after: 1.27cm + Indent at: 1.27 cm
(Source:ScottishPublichealthObservatory,2010.3)
18
Policy Interventions to Tackle the Obesogenic Environment
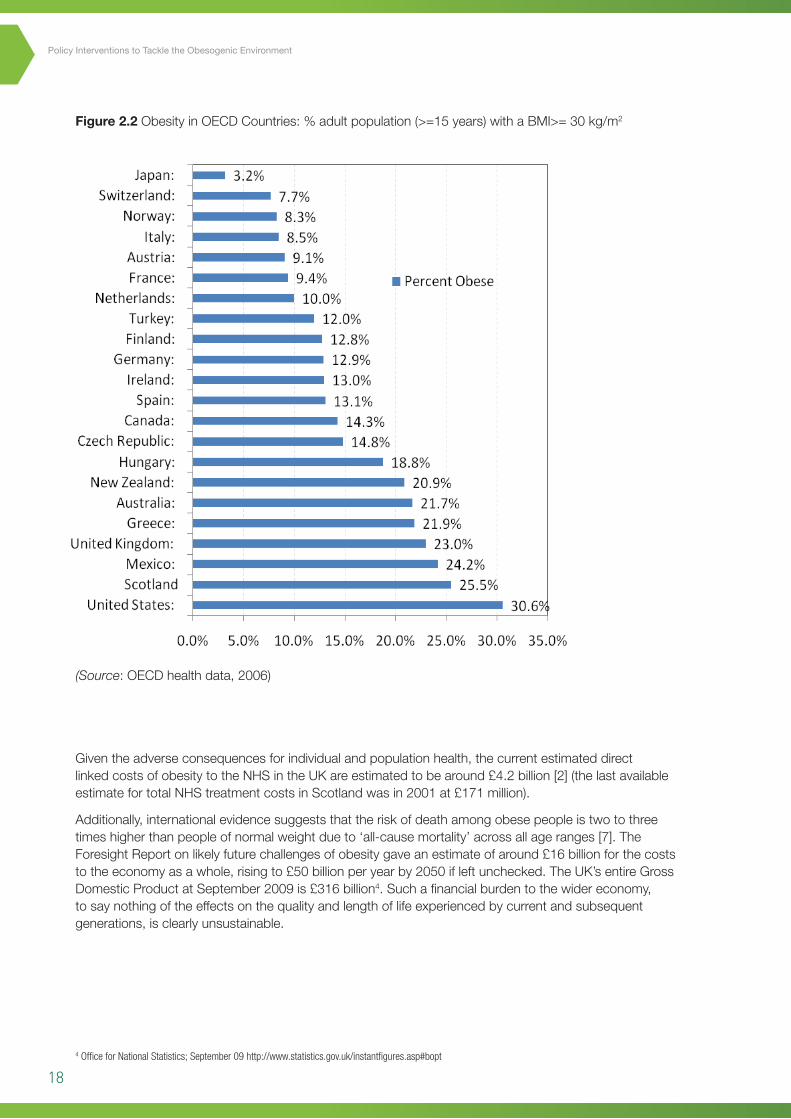
Figure 2.2 ObesityinOECDCountries:%adultpopulation(>=15years)withaBMI>=30kg/m2
(Source:OECDhealthdata,2006)
Giventheadverseconsequencesforindividualandpopulationhealth,thecurrentestimateddirectlinkedcostsofobesitytotheNHSintheUKareestimatedtobearound£4.2billion[2](thelastavailableestimatefortotalNHStreatmentcostsinScotlandwasin2001at£171million).
Additionally,internationalevidencesuggeststhattheriskofdeathamongobesepeopleistwotothreetimeshigherthanpeopleofnormalweightdueto‘all-causemortality’acrossallageranges[7].TheForesightReportonlikelyfuturechallengesofobesitygaveanestimateofaround£16billionforthecoststotheeconomyasawhole,risingto£50billionperyearby2050ifleftunchecked.TheUK’sentireGrossDomesticProductatSeptember2009is£316billion4.Suchafinancialburdentothewidereconomy,tosaynothingoftheeffectsonthequalityandlengthoflifeexperiencedbycurrentandsubsequentgenerations,isclearlyunsustainable.
4 Office for National Statistics; September 09 http://www.statistics.gov.uk/instantfigures.asp#bopt
17
Levels of obesity in Scotland and England are broadly similar for men, although Scotland has higher
levels of obesity among women. International comparisons show that Scotland has relatively high
levels of obesity compared with other OECD countries (figure 2.2). This combined picture provides
little reassurance that traditional approaches to obesity, which were largely based around appeals to
individual lifestyle change, have had any measurable impact. It is probably too early however to
comment on more recent policy initiatives such as UK Change4Life (see chapter 7) regarding any
impact on the trend on obesity and overweight.
Figure 2.2. Obesity in OECD Countries: % adult population (>=15 years) with a BMI>= 30 kg/m2
(Source: OECD health data, 2006.)
Given the adverse consequences for individual and population health, the current estimated direct
linked costs of obesity to the NHS in the UK are estimated to be around £4.2 billion [2] (the last
available estimate for total NHS treatment costs in Scotland was in 2001 at £171 million).
Additionally, international evidence suggests that the risk of death among obese people is two to
three times higher than people of normal weight due to ‘all-cause mortality’ across all age ranges
[7]. The Foresight Report on likely future challenges of obesity gave an estimate of around £16
19
2.4 Key drivers of obesity
Conceptually,thecausesofobesityattheindividuallevelareintuitivelyselfexplanatory.Weightgainandeventuallyobesityoccurwhenenergyintakefromfoodanddrinkisgreaterthanallenergyexpenditurethroughthebody’smetabolismandphysicalactivityoveraprolongedperiodoftime,resultingintheaccumulationofexcessbodyfat.Whilethereissomeevidencethatsomeindividualsmaybegeneticallymoresusceptibletodevelopingobesity,thesteeplyrisingprevalenceofobesityandoverweightinthepastthirtyyearscannotbegintobeaccountedforbyheritable/geneticfactors.
Indeedtheevolutionofcapacitytoefficientlystoreexcessfoodenergyintimesofscarcityhasnodoubtplayedapivotalroleinhumanevolutionarysuccess.Suchcapabilitieshoweverareclearlymaladaptiveinmodernwesternisedsocietieswhereenergydenserichfoodsareplentiful,affordableandheavilypromotedbysophisticatedcommercialinterests.Addtothistheriseofmotorisedtransport,sedentaryemploymentpatternsandthediminishingrequirementsforphysicaleffortinthehomeandatwork,anditishardlysurprisingthatratesofobesityandoverweightcontinuetoriseateverystageinthelife-course.
Animprovingunderstandingofcausalfactorshoweverhasnotledsofartothedevelopmentofanynotablysuccessfulsolutionsorpreventativestrategiesthathavedemonstratedanygreatpromiseinreversingtheunderlyingtrendtowardsanincreasinglyoverweightpopulation.TheproblemisalsonolongerconfinedtodevelopedeconomiessuchasEuropeandtheUS,sincesomeofthemostdramaticincreasesarecurrentlyoccurringindevelopingcountriesandinthenewlyemergenteconomiesofIndiaandChina[8,9].Inspiteofthenowwidespreadinternationalacknowledgementofthetruescaleoftheproblem,withmanygovernmentsmakingproclamationsabouttheneedforurgentaction,nocountryintheworldhasyetmanagedtosuccessfullyhaltorreversetherisingobesitytrend.
Theemphasistodateinmanycountries,includingtheUK,hasbeenquitestronglyfocusedonaspectsofindividualbehaviour,withoutaddressingthepowerfulunderlyingsocietaldriverswhichpermeateeveryaspectofmodernlife.TheForesightReport[2]forinstancereferstoa‘complexwebofsocietalandbiologicalfactorsthathaveinrecentdecades,exposedourinherenthumanvulnerabilitytoweightgain’.Thereportpresentedanobesitysystemsmap5,onwhichoveronehundredvariablesareidentifiedthatdirectlyorindirectlyinfluenceenergybalanceatthecentreofthediagram.ForsimplicitytheForesightmaphasbeendividedinto7cross-cuttingpredominantthemes:
• Biology:anindividual’sstartingpointreflectingtheinfluenceofgeneticsandbaselinephysicalhealthstatus,aswellasearlylifeprogrammingeffectsandinternalappetitecontrolmechanisms
• Activityenvironment:theinfluenceoftheenvironmentonanindividual’sactivitybehaviour,forexampleadecisiontocycletoworkmaybeinfluencedbyroadsafety,airpollutionortheprovisionofacycleshelterandshowersatwork
• Physicalactivity:thetype,frequencyandintensityofactivitiesanindividualcarriesout,suchascyclingvigorouslytoworkeveryday
• Societalinfluences:theimpactofsocietyonindividualbehaviour,forexampletheinfluenceofthemedia,education,peerpressureorculture
• Individualpsychology:forexampleaperson’sindividualpsychologicaldriveforparticularfoodsandconsumptionpatterns,orphysicalactivitypatternsorpreferences.Alsoincludesissuesaroundstresscopingskill,self-esteemandself-efficacy
• Foodenvironment:theinfluenceofthelocal,nationalandevenglobalfoodenvironmentonanindividual’sfoodchoices.Atthelocallevelforexample,adecisiontoeatmorefruitandvegetablesmaybeinfluencedbytheavailabilityandqualityoffruitandvegetablesnearthehome.Regionalandnationalinfluencescoverallarrangementsforfoodproductionanddistributionaswellastradeagreementsandincentiveswhichinfluencethem
• Foodconsumption:thequality,quantity(portionsizes)andfrequency(snackingpatterns)ofanindividual’sdiet.
5 The full obesity systems map (Figure 8.4 in Foresight Report): http://www.bis.gov.uk/assets/bispartners/foresight/docs/obesity/obesity_final_part5.pdf
Chapter2
20
Policy Interventions to Tackle the Obesogenic Environment
ThesystemsmapdevelopedintheForesightdocumentcertainlyillustratesthecomplexityofthetaskfacingpolicymakersintryingtodevelopsolutionstoincreasingobesityprevalence.InadditiontothelargelyindividuallyorientedbehaviouralmeasuresadoptedtodateintheUK(suchastheDepartmentofHealthinEngland’sChange4Lifecampaign6),policydevelopmentitselfisconstrainedbyagreatdiversityofanalysesastowhatmightbethemostcriticalleveragepoints.LangandRayner[10]havereferredtothissituationasa‘policycacophony’wherethe‘noise’ofcompetingproclamationsofwhereactionneedstobetaken,‘drownsoutthesymphonyofeffort’.Theyhighlightthatitistheinnateconservatismofmostgovernmentsthatdrivesthemtoresorttoindividualbehaviour-basedmodels,butthatwhatisactuallyrequiredisacomprehensivecoherentapproachlookingatallsectorsofsociety,whichisalsostronglyadvocatedbytheForesightteam.Encouragingly,policyinitiativeswhichwillbediscussedinsubsequentchapters(e.g.foodlabellinginsection5.2andcyclingdemonstrationtownsinsection5.4),couldhavebeenseen(untilrecentlyatleast),assignsthatthecaseformoreenvironmentallyorientatedinterventionsmaybestartingtobeheard.
2.5 The obesogenic environment
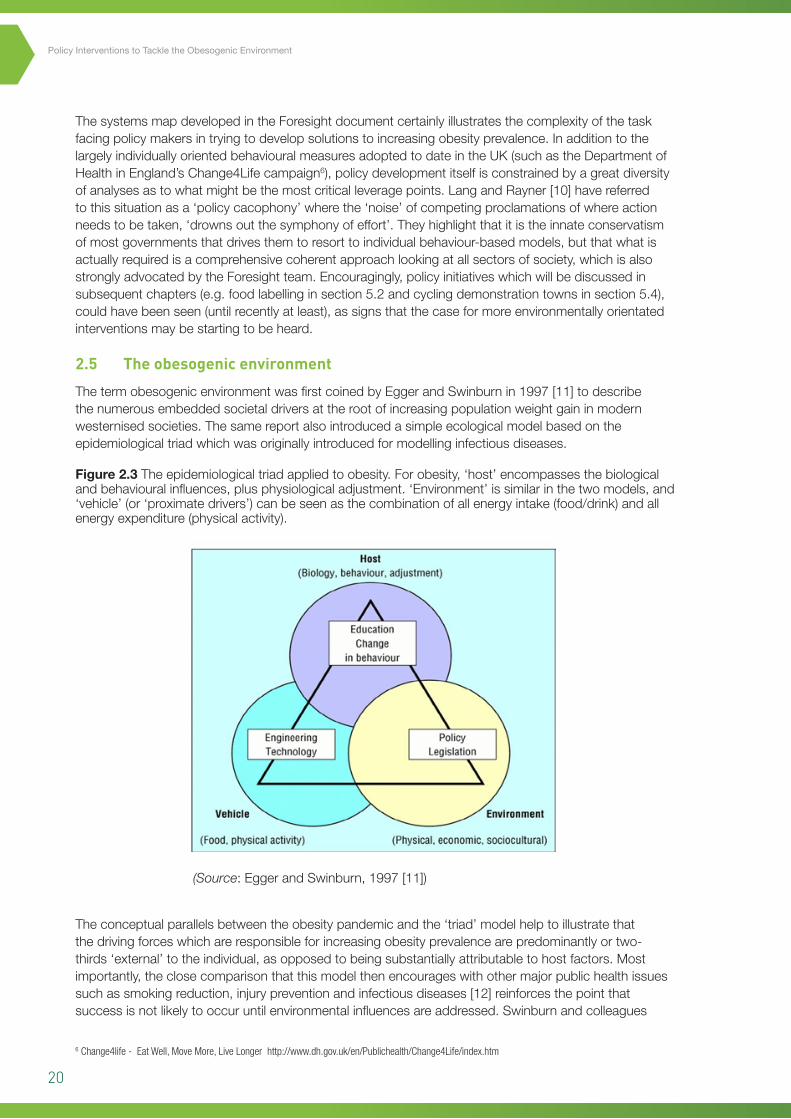
ThetermobesogenicenvironmentwasfirstcoinedbyEggerandSwinburnin1997[11]todescribethenumerousembeddedsocietaldriversattherootofincreasingpopulationweightgaininmodernwesternisedsocieties.Thesamereportalsointroducedasimpleecologicalmodelbasedontheepidemiologicaltriadwhichwasoriginallyintroducedformodellinginfectiousdiseases.
Theconceptualparallelsbetweentheobesitypandemicandthe‘triad’modelhelptoillustratethatthedrivingforceswhichareresponsibleforincreasingobesityprevalencearepredominantlyortwo-thirds‘external’totheindividual,asopposedtobeingsubstantiallyattributabletohostfactors.Mostimportantly,theclosecomparisonthatthismodelthenencourageswithothermajorpublichealthissuessuchassmokingreduction,injurypreventionandinfectiousdiseases[12]reinforcesthepointthatsuccessisnotlikelytooccuruntilenvironmentalinfluencesareaddressed.Swinburnandcolleagues
Figure 2.3 Theepidemiologicaltriadappliedtoobesity.Forobesity,‘host’encompassesthebiologicalandbehaviouralinfluences,plusphysiologicaladjustment.‘Environment’issimilarinthetwomodels,and‘vehicle’(or‘proximatedrivers’)canbeseenasthecombinationofallenergyintake(food/drink)andallenergyexpenditure(physicalactivity).
(Source:EggerandSwinburn,1997[11])
20
Lang and Rayner [10] have referred to this situation as a ‘policy cacophony’ where the ‘noise’ of
competing proclamations of where action needs to be taken, ‘drowns out the symphony of effort’.
They highlight that it is the innate conservatism of most governments that drives them to resort to
individual behaviour-based models, but that what is actually required is a comprehensive coherent
approach looking at all sectors of society, which is also strongly advocated by the Foresight team.
Encouragingly, more recent policy initiatives which will be discussed in subsequent chapters (e.g.
food labelling in section 5.2 and cycling demonstration towns in section 5.4), could be considered as
signs that the case for more environmentally orientated interventions may be starting to be heard.
2.5 The obesogenic environment
The term obesogenic environment was first coined by Egger and Swinburn in 1997 [11] to describe
the numerous embedded societal drivers at the root of increasing population weight gain in modern
westernised societies. The same report also introduced a simple ecological model based on the
epidemiological triad which was originally introduced for modelling infectious diseases.
Figure 2.3 The epidemiological triad applied to obesity. For obesity, ‘host’ encompasses the biological and behavioural influences, plus physiological adjustment. ‘Environment’ is similar in the two models, and ‘vehicle’ (or ‘proximate drivers’)
can be seen as the combination of all energy intake (food/drink) and all energy expenditure (physical activity). (Source: Egger and Swinburn, 1997)
The conceptual parallels between the obesity pandemic and the ‘triad’ model help to illustrate that
the driving forces which are responsible for increasing obesity prevalence are predominantly
‘environmental’, as opposed to arising from any individual pathologies or susceptibilities. Most
importantly, the close comparison that this model then encourages with other major public health
issues such as smoking reduction, injury prevention and infectious diseases [12] reinforces the point
6 Change4life - Eat Well, Move More, Live Longer http://www.dh.gov.uk/en/Publichealth/Change4Life/index.htm
21
Chapter2
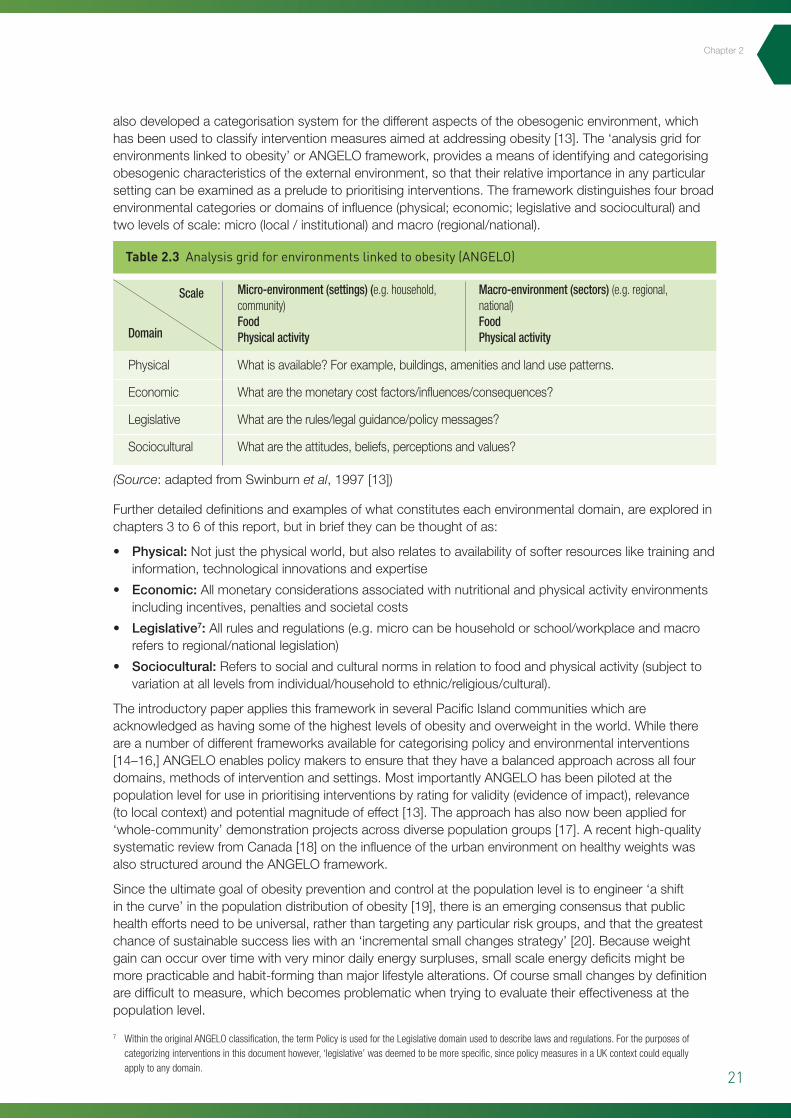
alsodevelopedacategorisationsystemforthedifferentaspectsoftheobesogenicenvironment,whichhasbeenusedtoclassifyinterventionmeasuresaimedataddressingobesity[13].The‘analysisgridforenvironmentslinkedtoobesity’orANGELOframework,providesameansofidentifyingandcategorisingobesogeniccharacteristicsoftheexternalenvironment,sothattheirrelativeimportanceinanyparticularsettingcanbeexaminedasapreludetoprioritisinginterventions.Theframeworkdistinguishesfourbroadenvironmentalcategoriesordomainsofinfluence(physical;economic;legislativeandsociocultural)andtwolevelsofscale:micro(local/institutional)andmacro(regional/national).
Furtherdetaileddefinitionsandexamplesofwhatconstituteseachenvironmentaldomain,areexploredinchapters3to6ofthisreport,butinbrieftheycanbethoughtofas:
• Physical:Notjustthephysicalworld,butalsorelatestoavailabilityofsofterresourcesliketrainingandinformation,technologicalinnovationsandexpertise
• Economic:Allmonetaryconsiderationsassociatedwithnutritionalandphysicalactivityenvironmentsincludingincentives,penaltiesandsocietalcosts
• Legislative7:Allrulesandregulations(e.g.microcanbehouseholdorschool/workplaceandmacroreferstoregional/nationallegislation)
• Sociocultural:Referstosocialandculturalnormsinrelationtofoodandphysicalactivity(subjecttovariationatalllevelsfromindividual/householdtoethnic/religious/cultural).
TheintroductorypaperappliesthisframeworkinseveralPacificIslandcommunitieswhichareacknowledgedashavingsomeofthehighestlevelsofobesityandoverweightintheworld.Whilethereareanumberofdifferentframeworksavailableforcategorisingpolicyandenvironmentalinterventions[14–16,]ANGELOenablespolicymakerstoensurethattheyhaveabalancedapproachacrossallfourdomains,methodsofinterventionandsettings.MostimportantlyANGELOhasbeenpilotedatthepopulationlevelforuseinprioritisinginterventionsbyratingforvalidity(evidenceofimpact),relevance(tolocalcontext)andpotentialmagnitudeofeffect[13].Theapproachhasalsonowbeenappliedfor‘whole-community’demonstrationprojectsacrossdiversepopulationgroups[17].Arecenthigh-qualitysystematicreviewfromCanada[18]ontheinfluenceoftheurbanenvironmentonhealthyweightswasalsostructuredaroundtheANGELOframework.
Sincetheultimategoalofobesitypreventionandcontrolatthepopulationlevelistoengineer‘ashiftinthecurve’inthepopulationdistributionofobesity[19],thereisanemergingconsensusthatpublichealtheffortsneedtobeuniversal,ratherthantargetinganyparticularriskgroups,andthatthegreatestchanceofsustainablesuccesslieswithan‘incrementalsmallchangesstrategy’[20].Becauseweightgaincanoccurovertimewithveryminordailyenergysurpluses,smallscaleenergydeficitsmightbemorepracticableandhabit-formingthanmajorlifestylealterations.Ofcoursesmallchangesbydefinitionaredifficulttomeasure,whichbecomesproblematicwhentryingtoevaluatetheireffectivenessatthepopulationlevel.
(Source:adaptedfromSwinburnet al,1997[13])
7 Within the original ANGELO classification, the term Policy is used for the Legislative domain used to describe laws and regulations. For the purposes of categorizing interventions in this document however, ‘legislative’ was deemed to be more specific, since policy measures in a UK context could equally apply to any domain.
Scale
Domain
Physical
Economic
Legislative
Sociocultural
Whatisavailable?Forexample,buildings,amenitiesandlandusepatterns.
Whatarethemonetarycostfactors/influences/consequences?
Whataretherules/legalguidance/policymessages?
Whataretheattitudes,beliefs,perceptionsandvalues?
Micro-environment (settings) (e.g. household, community) Food Physical activity
Macro-environment (sectors) (e.g. regional, national) Food Physical activity
Table 2.3 Analysis grid for environments linked to obesity (ANGELO)
22
Policy Interventions to Tackle the Obesogenic Environment
2.6 Appraising evidence for obesity prevention
Thequestionofhowbesttotackleobesityhasbeendescribedasaperfectillustrationofthemagnitudeofthemismatchthatisoftenseeninpublichealthbetweenthescaleofaproblemandtheadequacyofevidenceontheeffectivenessofinterventionstotackleit[21].Anincreasingsenseofurgencytoundertakesomeformofaction,cancompoundtheproblembyneglectingtoallowforproperconsiderationofhownewprogrammesshouldbeevaluated.Thoseinterventionswhichhavehighcapitalinvestmentcosts(e.g.changestotransportinfrastructure),orwhichinvolvechallengingvestedinterests(e.g.thefoodindustry)alsoneedtobeabletodemonstratestrongevidenceoflikelyeffectivenessiftheyaretobeimplemented[22].Theterm‘evidence-based’isitselfinonesenseproblematic,sinceitisgenerallyunderstoodtobeanalogoustotheevidence-basedmedicine(EBM)frameofreference.AnEBMperspectivestronglyweightsinternalvalidity(robustanswersinacontrolledenvironmentsuchasaclinicaltrial),overexternalvalidity(i.e.generalisabilityacrossdifferentpopulations/settingsandwhichtakesaccountofsocial,cultural,politicalandcommercialconsiderations).Manypublichealthexpertspointtotheoverwhelminginfluenceofthelatterintheirworkatthepopulationlevelandsuggestthattheoverridingquestionneedstobenot‘whatshouldwork?’butrather‘whatdoesworksustainably,undertheprevailingconditions?’.
Giventhatthefocusofthisreportisobesityprevention,therearethreefundamentalconsiderationswhicharecentraltothesearchforevidencewhicharesummedupverysuccinctlyinchapter2oftheUSIntstituteofMedicine’srecentreportentitled‘BridgingtheEvidenceGapinObesityPrevention[23]:Firstistheneedtodistinguishpreventionfromtreatmentinorderthatthepopulationlevelfocusismaintainedratherthantargetingthealreadyoverweight(atwhichpoint‘weightloss’risksbecomingthemainobjective).Second,theultimateaimofpreventionisareductionorstabilisationinpopulationBMIlevelswhichimpliesthattheabsenceofanincreaseorareducedrateofincreasecanbothbevalidmeasuresofsuccess;third,favourableimpactsonBMIoutcomesareachievedthrougheffectsonfourtypesofintermediateoutcomes:organisational;environmental;socio-cultural(includesprevailingbeliefsandvalues)andbehavioural.Byimplicationtherefore,manystrategiesaimedatobesitypreventionmaynotbeexpectedtohaveadirectimpactonBMI,butratheronpathwaysthatwillalterthecontextinwhicheating,physicalactivityandweightcontroloccur.Anyrestrictionontheconceptofasuccessfuloutcome,toeitherweight-maintenanceorBMImeasuresalone,isthereforelikelytooverlookmanypossibleinterventionmeasuresthatcouldcontributetoobesityprevention.
Followingtheabovelogic,thecurrentreportdrawsuponawiderangeofstudiesandtypesofinvestigation.Insomeareasofprevention,evidenceisrestrictedtoaetiologicalstudiesinwhichthefocusisattemptingtoquantifythecontributionofcertainbehavioursorenvironmentalcharacteristicstopopulationobesityandtherebydesignlogicalinterventions.Formoreadvancedareasofenquiry,itispossibletoreportonlarge-scaleprospectivestudiesandinterventiontrials,aswellasrobustinstitutionalstudieswithdefinedsub-populationssuchasthoseinworkplaces.Thedifficultyofmeasuringsomeofthecriticalintermediateoutcomes(suchassmallchangesinconsumptionoractivity)combinedwithaverybroadrangeofinvestigationmethodologies,meansthattraditionalhierarchiesbasedonstudydesign,suchasEBMmentionedabove,aregenerallytoobluntaninstrumenttoassessthelikelypotentialforobesityprevention.Theneedtoproceedonthebasisofanimperfectevidencebasealsocallsforaframeworkthatcanadequatelyaccomodatediversesourcesofevidence(inrelationtooutcomesbeingmeasured),aswellasscientificuncertainty.
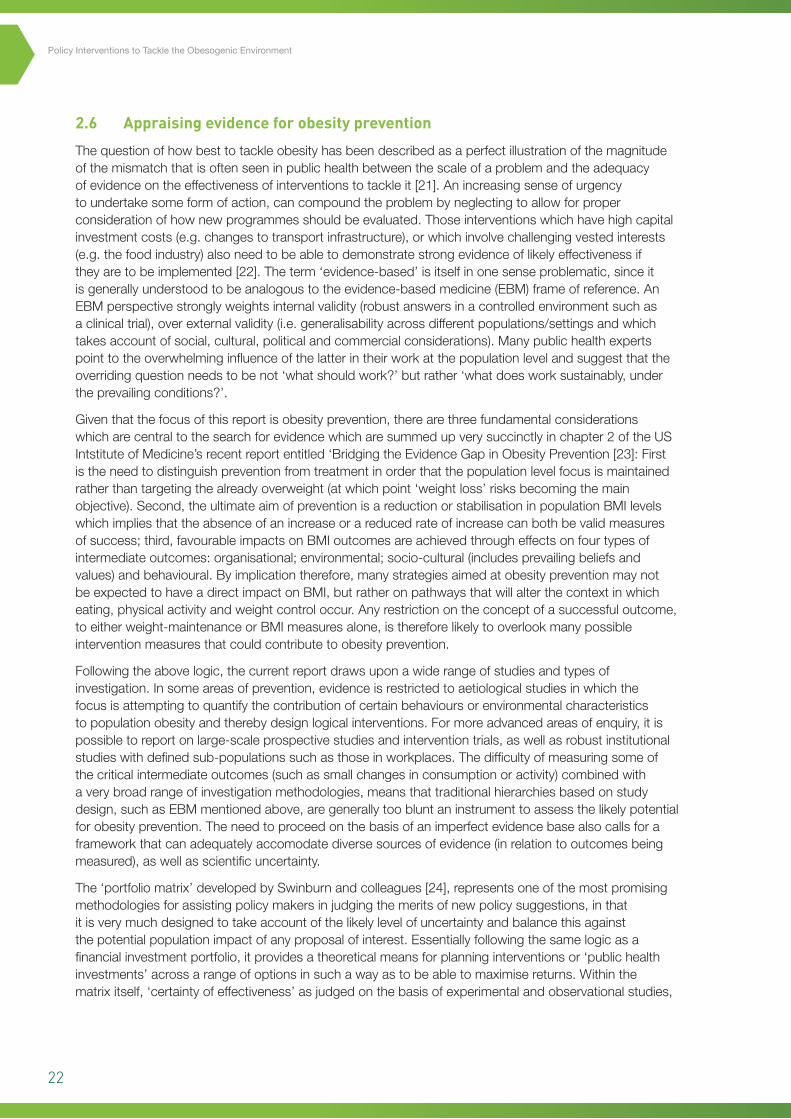
The‘portfoliomatrix’developedbySwinburnandcolleagues[24],representsoneofthemostpromisingmethodologiesforassistingpolicymakersinjudgingthemeritsofnewpolicysuggestions,inthatitisverymuchdesignedtotakeaccountofthelikelylevelofuncertaintyandbalancethisagainstthepotentialpopulationimpactofanyproposalofinterest.Essentiallyfollowingthesamelogicasafinancialinvestmentportfolio,itprovidesatheoreticalmeansforplanninginterventionsor‘publichealthinvestments’acrossarangeofoptionsinsuchawayastobeabletomaximisereturns.Withinthematrixitself,‘certaintyofeffectiveness’asjudgedonthebasisofexperimentalandobservationalstudies,
23
equatesto‘levelofrisk’andpotentialpopulationimpactisinterpretedasthepotentialscaleofreturnsorbenefitsovertime.Theapproachallowsforastraightforwardcross-tabulationwheretheendjudgementsaboutinterventionsarecategorisedonastepwisescalefrom‘mostpromising’to’leastpromising’(table2.4).Theuseoftheportfoliomatrixisdiscussedfurtherinchapter8,whereithasbeenusedtocategorisetheinterventionscoveredintheevidencereviewsectionsofthisreport.
2.7 Towards a coherent obesity strategy
Themostcomprehensive‘obesityprevention’manifestoproducedtodateatanationallevelisarguablytheUKGovernment’sHealthy Weight, Healthy LivesstrategyforEngland,8firstpublishedin2008.Thedocumentsetsoutfivepriorityareasforgovernmentactionbasedaroundreducingtheconsumptionofhighenergyfoods,incorporatingphysicalactivityintoeverydaylifeandafocusonearlyyears,withtargetedsupportforthosemostatrisk.Swedenhasalsodevelopedanactionplansettingoutaseriesofcostedproposals[25],althoughitismoreastatementofintentionthanasetofplannedinterventions.Thereisalsoanincreasinglysophisticatedbodyofevidencefromobservationalstudies,aroundthepotentialforaddressingenvironmentalfactorsthatcouldpotentiallycontributetoobesitypreventioneffortsbyclosingthesurplusenergygap[26].Anumberofrobuststudiesandreviewshavegonefurtherandlinkedsustainedpopulationweightbenefitswithdeliberateenvironmentalinterventions.Internationalcomparisonshavealsoshownthatevenrelativelyimpoverishedcountriescansubstantiallyimprovetheirpopulation’seatingbehaviours(e.g.Ghanaianimportcontrolsdiscussedinsection5.2)andthetakeupofopportunitiesforincreasingphysicalactivity(e.g.masspubliccyclinginColumbiadiscussedinsection6.4),wherethereisawilltocreatethem.
Thisreportwillpresenttheresultsofarapidliteraturereviewinaformatthatwehopewillbeausefulresourcefordecisionmakersandpolicyanalystsatalllevels.UsingtheANGELOframeworktogetherwiththeportfoliomatrixtocategorisepotentialinterventionsaccordingtosector,settingandnutrition/activityfocus,thereportwillsummarisethecurrentevidenceandprospectsforaseriesofenvironmentalandpolicyoptionsthatcouldbedirectedatobesitypreventioninScotland.Thelevelofscientificcertaintyassociatedwitheachpotentialintervention,willbetabulatedagainstitslikelypopulationimpact,basedonevidenceretrievedfrompublishedstudies,anditslikelytransferabilitytoaScottishcontext.
Certainty of effectiveness*
Potential population impact#
Low Moderate High
High
Moderate
Low
Promising
Lesspromising
Leastpromising
Verypromising
Promising
Lesspromising
Mostpromising
Verypromising
Promising
Table 2.4 Portfolio matrix for categorising potential interventions
*Certaintyofeffectiveness–judgedbythequalityoftheevidence,thestrengthoftheprogrammelogicaswellasthesensitivityanduncertaintyparametersinthemodellingofthepopulationimpact(adaptedfromSwinburnet al,2005[25]).
#Potentialpopulationimpacttakesintoaccountinterventionefficacy(impactunderidealconditions),combinedwith‘real-world’reachanduptakeandgenerallyreflectseffectivenessatthesocietallevel,weightedforrelativebaseline‘burdenofattributableillness’.
8 Healthy Weight, Healthy Lives: A Cross Government Strategy for England. Department of Health (2008); http://www.dh.gov.uk/en/Publicationsandstatistics/Publications/PublicationsPolicyAndGuidance/DH_082378
Chapter2

24
Policy Interventions to Tackle the Obesogenic Environment
3
25
Chapter3
Chapter3
3 Chapter 3 – The physical environment
3.1 Ecological model for physical environment
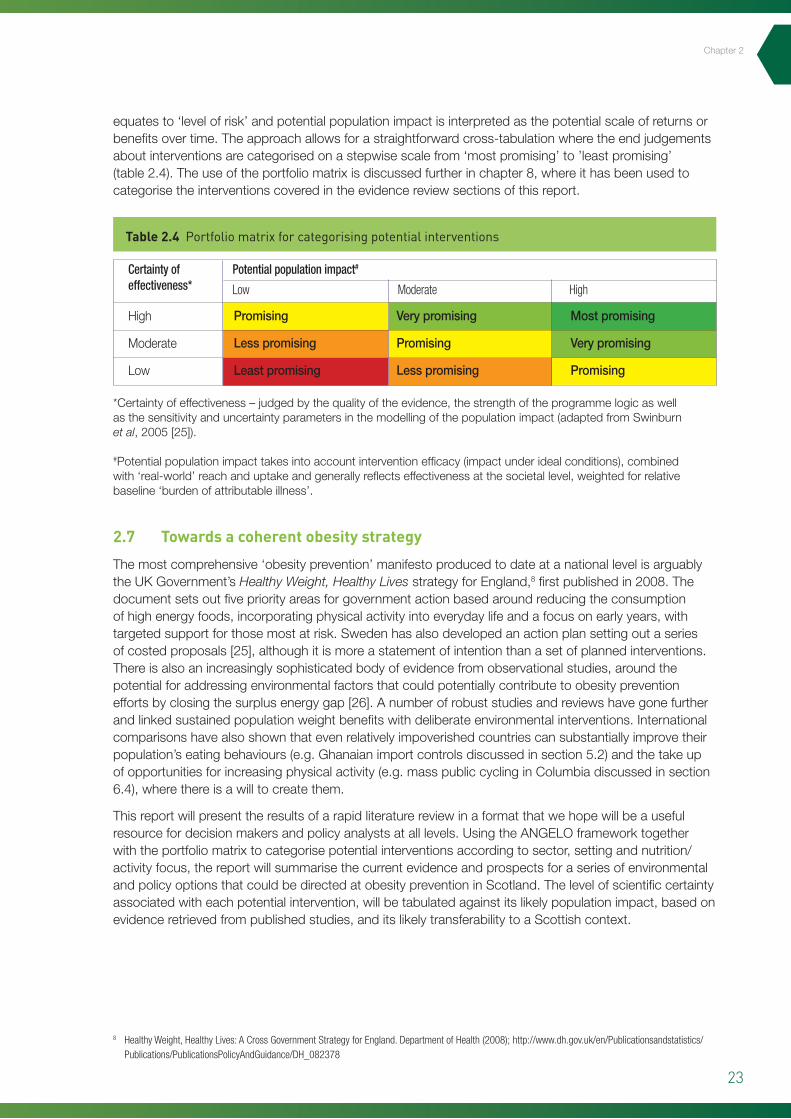
Thephysicalenvironmentinthisreviewwillbebroadlyinterpretedascoveringallresidentialandactivityspaceaswellastheconnectionsbetweenthesetwospheres.Foradultsthiswillincludehome,workandrecreationenvironments,aswellasthemeansoftravelbetweenthem.Onerelativelycomprehensiveecologicalmodelwhichillustratesthebasicinterrelationshipsthatconnectaspectsofthebuiltenvironmenttoobesity,isthatproducedbyPowellet alattheUniversityofIllinois(figure3.1):
3.2 Nutrition interventions (macro-level)
Featuresofphysicalsurroundingswhichaffectfoodpurchasingandconsumptionatthemacro-level,includeregionalandnationaldistributionofretailpremisesandothersectorlevelgroupingsofindustries,servicesorsupportinginfrastructure.EarlyobservationalresearchinthisareawasdominatedbyUS-basedstudies,whichshowedthatlowersocioeconomicgroupshadpooreraccesstosupermarketsandbyextensiontoaffordablehealthyfood.Moredeprivedareasalsohadincreasedconcentrationsofsmallergrocerystoresandnonchainsupermarkets,whichtraditionallyhaveapoorerrangeoffreshproduceandwhereitemsaregenerallymoreexpensive[27].PronouncedethnicandracialdisparitiesinaccesswerealsouncoveredintheUSstudies,withethnicminorityareashavingamuchreducedconcentrationofsupermarkets,whichinturnisassociatedwithanincreasedprevalenceofobesity[28].Follow-upinvestigationsof‘fooddesert’areasdemonstratedthatAfrican-Americanfruitandvegetableintakeshowedasignificantstepwiseincreasewitheachadditionalsupermarketinthelocalcensustract(e.g.fortwoormoresupermarketswithincensustrack,thelikelihoodofAfrican-Americansconsumingfruitandvegetableswasovertwo-foldhigherRR=2.18;95%CI:1.57to3.03)[29].Converselyneighbourhoodswithhigherlevelsofethnicityandsocialdeprivationalsohadhigherconcentrationsoffastfoodrestaurants[30].Inastatelevelcross-sectionalanalysis,Maddockfoundasignificantcorrelationbetweenthenumberofresidentsperfastfoodoutletandobesityprevalence(r=-0.53;P<0.001)[31].
Chapter3
Figure 3.1 Ecologicalmodelrelatingthephysicalenvironmenttophysicalactivity,dietandbodyweight,BMI(bodymassindex)9.
9 Reproduced with the permission of Lisa Powell et al, Bridging the Gap Program Office, Institute for Health Research and Policy, University of Illinois at Chicago http://www.impacteen.org/otherpapers.htm.
BMI(Bodyweightstatus)
IndividualFactors
SocialFactors
Genetics
SocioeconomicCharacteristics
FamilyandPeerInfluences
FoodConsumption(EnergyIntake)
PhysicalActivity(EnergyExpenditure)
OtherIndividualCharacteristics
EnvironmentalFactorsLifestyle/BehaviouralFactors
BuiltEnvironment
EconomicInfluences(costandaccess)
NeighbourhoodSafety(perceived/objective)
Transportationopportunities
BEHAVIORS
BEHAVIORS
26
Policy Interventions to Tackle the Obesogenic Environment
Inspiteofgovernmentdeclarationsandpolicyannouncementstothecontrary[32],attemptstoextrapolatethe‘fooddesert’hypothesistoaUKsettinghavefoundthesituationtobealotlessclearcut.AlthoughonereportfrominnerLondondiddemonstraterestrictedaccesstorecommendedfoodsinmoredeprivedareas[33],largerscalestudiesinothermajorcitiesdidnotfindanysignificantassociation.AFoodStandardsAgencycommissionedreportin2004,foundthatthevastmajorityofhouseholdsinamajorcityinthenortheastofEngland,didtheirfoodshoppingatlargesupermarketsandthatlocalretailprovisionwasnotakeydeterminantofdietquality[34].AmorerecentGlasgowbasedstudy[35],foundthatthemostdeprivedquintileofareashadthegreatestmeannumberoftotalfoodretailersper1,000residents,whilequintile1(leastdeprived)hadtheleast.Inrelationtotypesofoutlet,theinvestigatorsalsofoundnosignificantdifferencesbetweenthemeannumbersofbakers,fruitandvegetableshops,fishmongers,supermarketsordelicatessensper1,000residents.Theyalsonotedhowever,thatvariationwithintheircategoriesofpremisescouldnotberuledoutandthatfurtherworkwasongoingtocharacterisemorefullythenutritionalvalueoffoodsfromdifferenttypesofoutlet.
AlthoughthedensityoffastfoodoutletswasnotassociatedwithdeprivationinGlasgow[36],across-sectionalsurvey,whichfocusedontwelvefreshfruitandvegetableitemsin288foodstoresfromtencommunitiesacrossScotland,foundthatthefreshproduceinmoredeprivedareastendedtobeofalowerquality[37].Thesurveyalsoexaminedvariationbystoretypeandbyrural-urbanlocation,thesecondofwhichhasparticularrelevanceoutsideofScotland’scentralbeltandisoftenoverlookedinstudiesofthistype.Althoughtheoverallqualityoffruitandvegetableswashigh,therewasanotablevariabilitybystoretypeandlocationwiththebestqualityfoundinmediumsizedstores,storesinsmalltownsandinruralareas,aswellasthoseinmoreaffluentareas.Whilenotalldifferencesinqualitywerestatisticallysignificant,thepatternswereconsistentforthemajorityofthetwelveselectedfruitandvegetableitems[37].
Aquasi-experimentalstudyintheeastendofGlasgowsoughttoassesstheeffectsofnewlargescaleretailprovisiononthepurchasingfrequenciesoffruitandvegetables[38].Theauthorswerenotabletoreplicatefindingsfromanearlieruncontrolledstudyandtherewasnoevidenceforanetinterventioneffectonfruitandvegetableconsumption,althoughalowresponsetotheinitialquestionnaire(lessthan20%)andarelativelyhighbaselineconsumptionleveloffruitandvegetables,gaverisetodoubtsoverthecapacityofthesurveyinstrumenttodetectanincrease.Intriguingly,fromtheresultsongeneralhealthmeasures,therewasasignificantreductionintheprevalenceof‘fairtopoor’and‘poor’self-reportedpsychologicalhealthintheinterventiongroupasassessedbythestandardhealthsurveytoolGHQ-12.Ontheotherhand,regression-to-the-meanand'attentionor'learning'effectscannotberuledoutwiththisstudydesign.
Neighborhoodwalkability(highvslow)a
High
Low
Densityoffastfoodrestaurants(highvslow)b
Weight(kg) Waistcircumference(cm)
High Low High Low
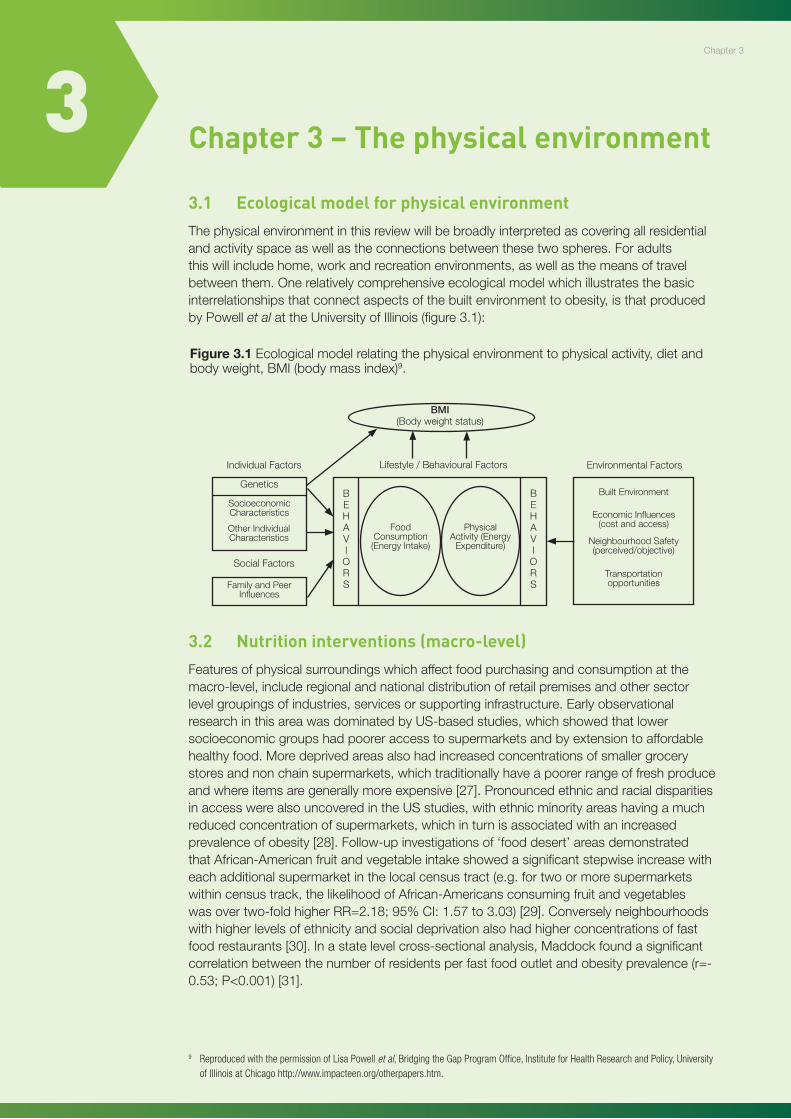
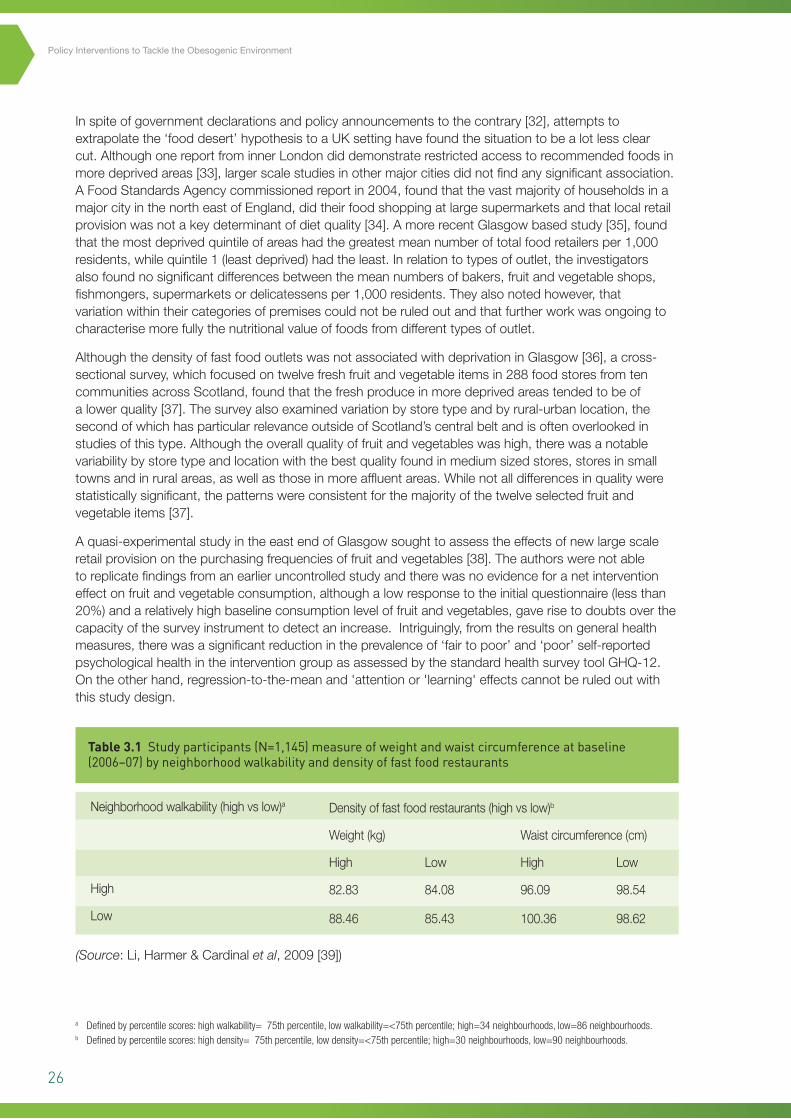
Table 3.1 Study participants (N=1,145) measure of weight and waist circumference at baseline (2006–07) by neighborhood walkability and density of fast food restaurants
82.83 84.08 96.09 98.54
88.46 85.43 100.36 98.62
(Source:Li,Harmer&Cardinalet al,2009[39])
a Defined by percentile scores: high walkability= 75th percentile, low walkability=<75th percentile; high=34 neighbourhoods, low=86 neighbourhoods.b Defined by percentile scores: high density= 75th percentile, low density=<75th percentile; high=30 neighbourhoods, low=90 neighbourhoods.
27
ReturningtoUS-basedevidence,arecenthighlypoweredfollow-upstudyreportedonactualweightchangesoverthecourseofoneyear,inrelationtobothfeaturesoftheneighbourhoodenvironmentandunderlyingbehaviouralpreferences[39].Specifically,amongpeoplewhoreportedfrequentvisitstofastfoodoutlets,residenceinaneighbourhoodwithahighdensityoffastfoodoutletswasassociatedwithasignificantincreaseinweight(mean=+1.4kg)andwaistcircumference(mean=+2.06cm)(table3.1).Whilethestrengthofevidenceisgreaterthanforcross-sectionalstudiesandservestohighlightthesubtleinterplaybetweenbehaviouralandenvironmentalfactors,thereisstillthepotentialforself-selection,wherethoseinclinedtowardslesshealthierbehavioursseekoutsurroundingsthatwillsupportthosechoices[40].Asimilarchickenandegg‘feedback’conundrumsurroundsthelikelytendencyofshopssellingunhealthyfoodstolocatethemselvesinmoredeprivedareas,ormodifytheirstockaccordingtolocaldemand[41].Thefollowingsectiononmicro-foodenvironments(3.3)picksuponsomeoftheseissues.
Summary
Nutritioninterventions(macro-level)
• HigherdensitiesoffastfoodoutletsinsociallydeprivedandinAfrican-AmericanneighbourhoodsintheUS,arenotseentothesameextentinrelativelydeprivedareas/predominantlyethnicminoritylocalitiesofUKtownsandcities.
• PhysicalproximitytoaffordablefoodchoicesdoesnotappeartobeastrongdeterminantofahealthydietinUKsettings,althoughthereissomeevidenceforScotlandthatlocalvariationsinthequalityofavailablefreshproducemayinfluencedietaryintake.
• AnimprovinginternationalandUKevidencebaseinthisareaclearlydemonstratesaninfluenceonspecifiedweightoutcomesoflocalenvironmentalcharacteristics,butonlyinsofarastheyfacilitateorexacerbateexistingpreferencesandbehaviours.
3.3 Nutrition interventions (micro-level)
Glanzet aldescribefourbroadsettingsintheirecologicalmodeloffoodavailabilityandchoices[42],thesebeing:(i)community,(ii)organisational,(iii)consumerand(iv)information‘nutritionenvironments’.Sinceconsumer(retail),communityandinformationaspectsarediscussedelsewhereinthisreport,thecurrentsectionwillfocusonwhattheycollectivelyrefertoasthe‘organisationalnutritionenvironment’whichencompasseshome,work,educationalsettingsandother‘definedenvironments’suchasrestaurantsandtakeaway/fastfoodvendors.Thefocushereisonthetypesoffoodanditsnutritionalvalueasopposedtothelocationanddensityofoutletsperheadofpopulation,whichwasdiscussedpreviouslyundermacro-levelfactorsin3.2.Theimportantinfluenceofportionsize(mainlyinrestaurants)hasalsobeenthesubjectofanumberofwellconductedstudies,thefindingsofwhichneedtobeconsidered.Inrelationtoadultobesitypreventionandmicro-foodenvironments,threeadditionalsubheadingsarehelpfultoorganisethemajorfindings,thesebeing:(i)restaurantsandfastfoodpremises;(ii)portionsizeandenergydensity;and(iii)educationalsettingsandworkplaces.
Chapter3
28
Policy Interventions to Tackle the Obesogenic Environment
i. Restaurants and fast food outlets
AlmostonethirdofallmealsconsumedbyBritishadultsareconsumedoutsidethehome[43],aproportionwhichhasbeenrisingsteadilyoverthelastthirtyyearsandissimilartothatseenintheUS[44].Whilefastfoodmealsareknowntobetypicallyhighinenergydensity,foodconsumedatfullservicerestaurantscanbeashighorhigherinfat,sugarandsalt.Consumernutritionenvironmentswithinrestaurantsandotherfoodcateringpremisesareobviouslysubjecttosubstantialvariability,dependingonthetypeofestablishmentandtargetcustomergroup,althoughgenerallyspeakingtheresearchinthisareaislimited.Partlyinrecognitionoftherestaurantknowledgegap,Saelensatalrecentlydevelopedanutritionalsurveillance/assessmenttoolforusewithcommercialcateringpremisesandusedittocharacterise217sitdownrestaurantsandfastfoodoutletsacrossseveralUSstatesin2004and2005[45].Thetwotypesofpremisesdifferedonmanynutritionenvironmentvariables,demonstratingthatthefrequentpracticeofnotconsideringthemseparatelycouldbeconcealingmeaningfulvariation.Fastfoodoutletsforinstancehadhealthierscoresonseveralitemsthansitdownrestaurants,includingtheavailabilityofhealthystartersormaindishsalads.Fastfoodoutletswerealsomorelikelytodisplaysignageprovidingnutritioninformationandpromotinghealthyoptions,butequally,weremorelikelytohavedisplayspromotingunhealthyeatingandovereating.Whilesitdownrestaurantsweresomewhatmorelikelytohavehealthierindividualitemoptions,fewerthan9%oftheirmaindishesand12%oftheirsaladmaindisheswereconsideredhealthyintheSaleanspilotstudy.Theauthorsalsohighlightedverylowratesofinformationprovisiononthenutritionalvalueofmenuitems.Thiscouldconceivablyexacerbateover-consumptioninrestaurantswherethereisevidencethatconsumersroutinelyunderestimateenergyandfatcontent,especiallyofstarterdishes[46].
ii. Portion size and energy density
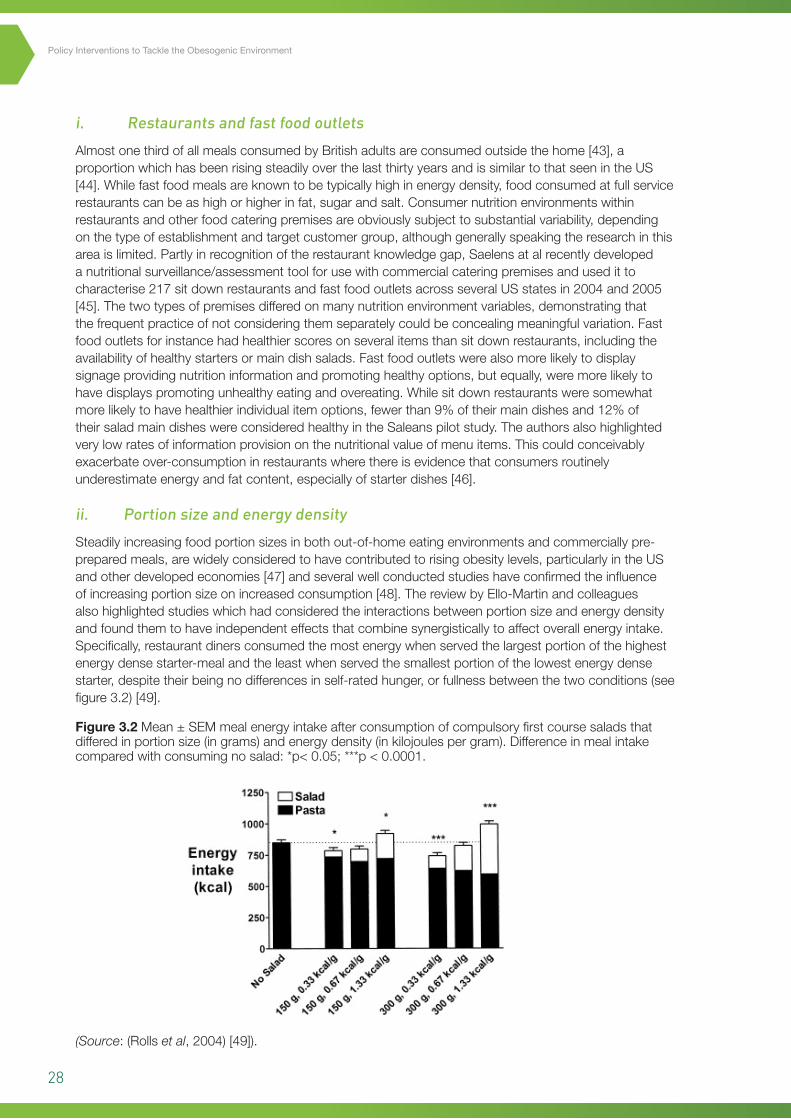
Steadilyincreasingfoodportionsizesinbothout-of-homeeatingenvironmentsandcommerciallypre-preparedmeals,arewidelyconsideredtohavecontributedtorisingobesitylevels,particularlyintheUSandotherdevelopedeconomies[47]andseveralwellconductedstudieshaveconfirmedtheinfluenceofincreasingportionsizeonincreasedconsumption[48].ThereviewbyEllo-Martinandcolleaguesalsohighlightedstudieswhichhadconsideredtheinteractionsbetweenportionsizeandenergydensityandfoundthemtohaveindependenteffectsthatcombinesynergisticallytoaffectoverallenergyintake.Specifically,restaurantdinersconsumedthemostenergywhenservedthelargestportionofthehighestenergydensestarter-mealandtheleastwhenservedthesmallestportionofthelowestenergydensestarter,despitetheirbeingnodifferencesinself-ratedhunger,orfullnessbetweenthetwoconditions(seefigure3.2)[49].
Figure 3.2 Mean±SEMmealenergyintakeafterconsumptionofcompulsoryfirstcoursesaladsthatdifferedinportionsize(ingrams)andenergydensity(inkilojoulespergram).Differenceinmealintakecomparedwithconsumingnosalad:*p<0.05;***p<0.0001.
31
Figure 3.2 Mean ± SEM meal energy intake after consumption of compulsory first course salads that differed in portion size (in grams) and energy density (in kilojoules per gram). Difference in meal intake compared with consuming no salad: *p< 0.05; ***p < 0.0001. (Rolls et al, 2004) [49].
The apparent independence of these influences with respect to fullness does, the authors suggest,
indicate that smaller size portions of less energy dense dishes need not affect satiety and could
present a useful means of reducing energy intake in restaurants. Steenhuis and Vermeer recently
confirmed the clear relationship between portion size and energy intake in a 2009 review across a
wide range of settings [50], but regretted that so far there have been relatively few intervention
studies to examine the effectiveness of reducing portion size. They cite a qualitative study of
consumer attitudes which found that the provision of a wider range of portion sizes and prices was
the most acceptable ‘facilitator’ of lower energy intake [51]. They also recognise however that the
effectors of larger portion sizes are integrated into many aspects of the food, consumer and
behavioural environments, as well as being underpinned by commercial imperatives and economic
considerations. As a result, their suggested model for implementing food portion interventions
employs a similar multi-level framework as the current report, covering individual, physical,
economic, legislative and sociocultural factors.
iii. Educational settings and workplaces
In spite of recent high profile one-offs such as the banning of trans fats in New York catering
establishments [52], the extent to which nutritional environments in commercial food premises are
subject to controls and restrictions is always going to be fairly limited within the current liberal
political climate. Thankfully, there are other major types of organisational setting where there is a
greater scope for providing a healthier range of options, the most notable and most researched
being schools (and other educational establishments) and workplaces. Environmental changes in
(Source:(Rollset al,2004)[49]).
29
Theapparentindependenceoftheseinfluenceswithrespecttofullnessdoes,theauthorssuggest,indicatethatsmallersizeportionsoflessenergydensedishesneednotaffectsatietyandcouldpresentausefulmeansofreducingenergyintakeinrestaurants.SteenhuisandVermeerrecentlyconfirmedtheclearrelationshipbetweenportionsizeandenergyintakeina2009reviewacrossawiderangeofsettings[50],butregrettedthatsofartherehavebeenrelativelyfewinterventionstudiestoexaminetheeffectivenessofreducingportionsize.Theyciteaqualitativestudyofconsumerattitudeswhichfoundthattheprovisionofawiderrangeofportionsizesandpriceswasthemostacceptable‘facilitator’oflowerenergyintake[51].Theyalsorecognisehoweverthattheeffectorsoflargerportionsizesareintegratedintomanyaspectsofthefood,consumerandbehaviouralenvironments,aswellasbeingunderpinnedbycommercialimperativesandeconomicconsiderations.Asaresult,theirsuggestedmodelforimplementingfoodportioninterventionsemploysasimilarmulti-levelframeworkasthecurrentreport,coveringindividual,physical,economic,legislativeandsocioculturalfactors.
iii. Educational settings and workplaces
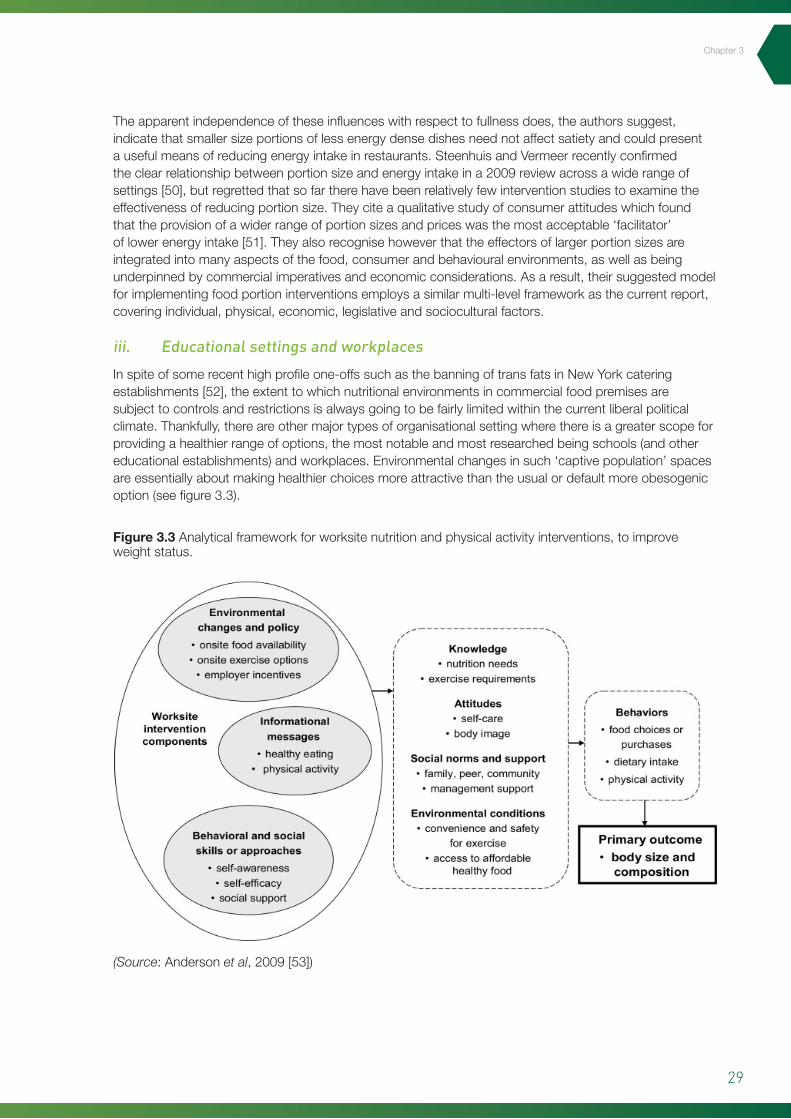
Inspiteofsomerecenthighprofileone-offssuchasthebanningoftransfatsinNewYorkcateringestablishments[52],theextenttowhichnutritionalenvironmentsincommercialfoodpremisesaresubjecttocontrolsandrestrictionsisalwaysgoingtobefairlylimitedwithinthecurrentliberalpoliticalclimate.Thankfully,thereareothermajortypesoforganisationalsettingwherethereisagreaterscopeforprovidingahealthierrangeofoptions,themostnotableandmostresearchedbeingschools(andothereducationalestablishments)andworkplaces.Environmentalchangesinsuch‘captivepopulation’spacesareessentiallyaboutmakinghealthierchoicesmoreattractivethantheusualordefaultmoreobesogenicoption(seefigure3.3).
(Source:Andersonet al,2009[53])
Figure 3.3 Analyticalframeworkforworksitenutritionandphysicalactivityinterventions,toimproveweightstatus.
32
such ‘captive population’ spaces are essentially about making healthier choices more attractive than
the usual or default obesogenic option (see figure 3.3).
Figure 3.3 Analytical framework for worksite nutrition and physical activity interventions, to improve weight status. (Source: Anderson et al, 2009 [53])
Greater control over ‘exposures’ also means of course that such environments are more amenable
to research orientated interventions. The two drawbacks from the point of view of this report are,
firstly, that evidence from schools is not likely to be easily transferable to adult settings and
secondly, that the vast majority of workplace studies are based in the US. In spite of these concerns,
the literature around such ‘contained interventions’ remains relatively robust, consisting of a
number of well conducted studies and, as such, it is important not to overlook.
In a comprehensive Canadian review of the evidence around urban environments and healthy
weight, 71 notable findings were described in relation to physical settings and food/diet/nutrition, of
which 58% dealt with school environments [18]. While the most useful positive findings related to
price and behavioural interventions (to be discussed in sections 4.2 and 6.4), straightforward
availability factors also exerted a significant effect on dietary quality. Specifically, there were adverse
negative associations between diet quality and the provision of á la carte menus, the availability of
snack vending machines and the availability of fried potatoes. A recent systematic review of
workplace dietary interventions by Ni Mhurchu and colleagues [54] found that workplace
interventions are associated with moderate improvements in dietary intake. They also noted that
there was currently a lack of well designed research studies that could reliably be used to inform
Chapter3
30
Policy Interventions to Tackle the Obesogenic Environment
Greatercontrolover‘exposures’alsomeansofcoursethatsuchenvironmentsaremoreamenabletoresearchorientatedinterventions.Thetwodrawbacksfromthepointofviewofthisreportare,firstly,thatevidencefromschoolsisnotlikelytobeeasilytransferabletoadultsettingsandsecondly,thatthevastmajorityofworkplacestudiesarebasedintheUS.Inspiteoftheseconcerns,theliteraturearoundsuch‘containedinterventions’remainsrelativelyrobust,consistingofanumberofwellconductedstudiesand,assuch,itisimportantnottooverlook.
InacomprehensiveCanadianreviewoftheevidencearoundurbanenvironmentsandhealthyweight,71notablefindingsweredescribedinrelationtophysicalsettingsandfood/diet/nutrition,ofwhich58%dealtwithschoolenvironments[18].Whilethemostusefulpositivefindingsrelatedtopriceandbehaviouralinterventions(tobediscussedinsections4.2and6.4),straightforwardavailabilityfactorsalsoexertedasignificanteffectondietaryquality.Specifically,therewereadversenegativeassociationsbetweendietqualityandtheprovisionofálacartemenus,theavailabilityofsnackvendingmachinesandtheavailabilityoffriedpotatoes.ArecentsystematicreviewofworkplacedietaryinterventionsbyNiMhurchuandcolleagues[54],foundthatworkplaceinterventionsareassociatedwithmoderateimprovementsindietaryintake.Theyalsonotedthattherewascurrentlyalackofwelldesignedresearchstudiesthatcouldreliablybeusedtoinformestimatesofeffectivenessandcosteffectiveness.Inparticular,thereisaneedtoaddresstheeconomic,policyandsocioculturalaspectsoftheworkenvironmentwhichimpactondiet.Workcanteensforinstance,whichincorporateanelementoffoodsubsidisation,offeranidealenvironmentinwhichtotestthepotentialofeconomicincentivestochangefoodpurchasingbehaviour[55].AseriesofstudiesbySimoneFrenchandcolleagueswhichfocusspecificallyonworkplacepriceincentivesisdiscussedinchapter4.Therehavealsobeenseveralotherrecenthighqualityreviewsspecificallydealingwithhealthinitiativesinaworkenvironmentsetting,twoofwhichfocusonobesityprevention[53,56]withthemostrecentadoptingabroad-basedhealthpromotionapproach[57].Inthefirstofthereviews,sevenseparatestudiesfundedbytheNationalHeartBloodandLungInstitute(NHBLI)intheUS,involvingatotalof114workplaces,werereviewedbyPrattet al[56].Thenutritionfocusedenvironmentalstrategiesincludedreducingportionsizesandmodifyingcafeteriarecipestolowerfatcontents.
Fromanobesitypreventionperspective,aparticularlypromisingfeatureofthedesignoftheNHBLIstudies,wastheirstatedprimaryoutcomemeasureofchangesinBMIorbodyweightaftertwoyearsofintervention.Theobservedchangesineitheroftheseindiceshowever,didnotrevealanyconsistentpatternofassociationinresponsetoenvironmentalinterventions.Theassumptionthatpeoplewillloseweightastheyincreasetheirconsumptionofhealthysnacksalsodependsofcourseonsubstitution,inthatthenewsnackchoiceisdirectlyreplacingamoreenergydenseoption.
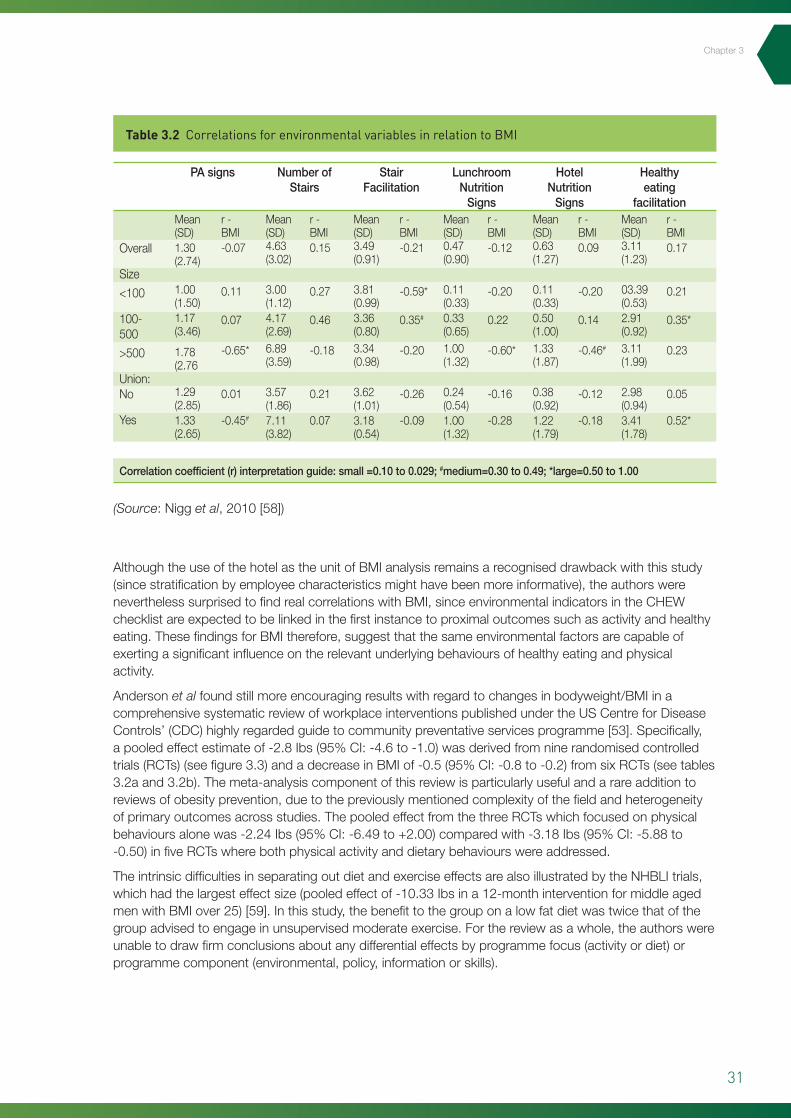
TheWork,WeightandWellness(3W)Studywasagrouprandomisedclinicaltrialofamulti-componentinterventionprogramconductedovertwoyearsat30hotelsites,including11,559employeesontheIslandofO’ahuinHawaii[58].Usingavalidatedenvironmentalchecklistforworkplacehealthpromotioncomponents(theCHEWprotocol10),therewerenooverallmediumorlargecorrelations(table3.2)withanyofthesixenvironmentalvariablesthathadbeenincluded(activitysigns,numberofstairs,stairfacilitation,lunchroomnutrition,hotelnutritionsignsandhealthyeatingprompts/posters).Stratificationbyhotelsizehowever,didrevealseveralsignificantcorrelations,thesebeingpositive(i.e.associatedwithincreasedBMI)inmedium-sizedhotelsfornumberofstairs,stairfacilitationandhealthyeatingvariables(table3.2).Negativecorrelations(i.e.associatedwithdecreasedBMI;0.50to1.00),wereonlynotedforstairfacilitationinsmall-sizedhotelsandlunchroomsignsinlarge-sizedhotels.Itisalsoworthbearinginmindthatthemultitudeoftestsinthisstudydoesraiseconcernsoverhowmanysignificantcorrelationsmightthemselveshavearisenbychance.
10 Checklist of Health Promotion Environments at Work (CHEW). http://www.drjamessallis.sdsu.edu/measures.html
31
Chapter3
AlthoughtheuseofthehotelastheunitofBMIanalysisremainsarecogniseddrawbackwiththisstudy(sincestratificationbyemployeecharacteristicsmighthavebeenmoreinformative),theauthorswereneverthelesssurprisedtofindrealcorrelationswithBMI,sinceenvironmentalindicatorsintheCHEWchecklistareexpectedtobelinkedinthefirstinstancetoproximaloutcomessuchasactivityandhealthyeating.ThesefindingsforBMItherefore,suggestthatthesameenvironmentalfactorsarecapableofexertingasignificantinfluenceontherelevantunderlyingbehavioursofhealthyeatingandphysicalactivity.
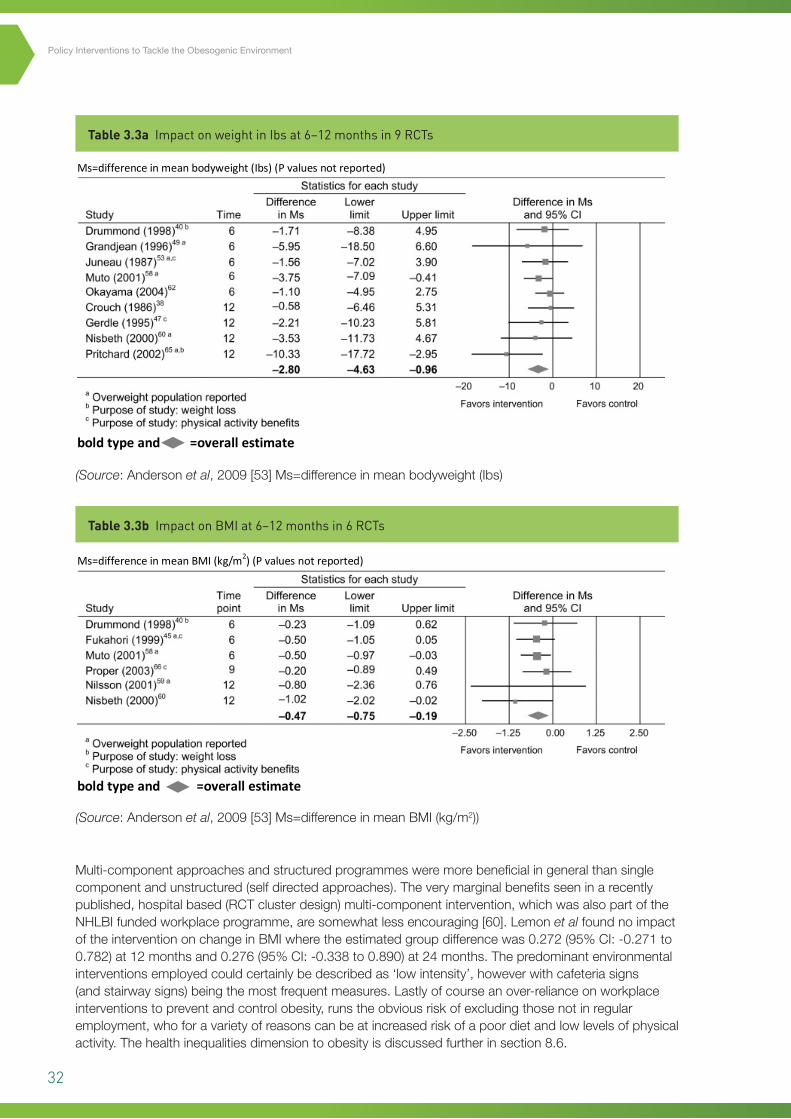
Andersonet alfoundstillmoreencouragingresultswithregardtochangesinbodyweight/BMIinacomprehensivesystematicreviewofworkplaceinterventionspublishedundertheUSCentreforDiseaseControls’(CDC)highlyregardedguidetocommunitypreventativeservicesprogramme[53].Specifically,apooledeffectestimateof-2.8Ibs(95%CI:-4.6to-1.0)wasderivedfromninerandomisedcontrolledtrials(RCTs)(seefigure3.3)andadecreaseinBMIof-0.5(95%CI:-0.8to-0.2)fromsixRCTs(seetables3.2aand3.2b).Themeta-analysiscomponentofthisreviewisparticularlyusefulandarareadditiontoreviewsofobesityprevention,duetothepreviouslymentionedcomplexityofthefieldandheterogeneityofprimaryoutcomesacrossstudies.ThepooledeffectfromthethreeRCTswhichfocusedonphysicalbehavioursalonewas-2.24Ibs(95%CI:-6.49to+2.00)comparedwith-3.18Ibs(95%CI:-5.88to-0.50)infiveRCTswherebothphysicalactivityanddietarybehaviourswereaddressed.
TheintrinsicdifficultiesinseparatingoutdietandexerciseeffectsarealsoillustratedbytheNHBLItrials,whichhadthelargesteffectsize(pooledeffectof-10.33Ibsina12-monthinterventionformiddleagedmenwithBMIover25)[59].Inthisstudy,thebenefittothegrouponalowfatdietwastwicethatofthegroupadvisedtoengageinunsupervisedmoderateexercise.Forthereviewasawhole,theauthorswereunabletodrawfirmconclusionsaboutanydifferentialeffectsbyprogrammefocus(activityordiet)orprogrammecomponent(environmental,policy,informationorskills).
Table 3.2 Correlations for environmental variables in relation to BMI
(Source:Nigget al,2010[58])
PAsigns
Overall
Size
<100
100-500
>500
Union:No
Yes
Mean(SD)1.30(2.74)
1.00(1.50)1.17(3.46)
1.78(2.76
1.29(2.85)1.33(2.65)
r-BMI-0.07
0.11
0.07
-0.65*
0.01
-0.45#
r-BMI0.15
0.27
0.46
-0.18
0.21
0.07
r-BMI-0.21
-0.59*
0.35#
-0.20
-0.26
-0.09
r-BMI-0.12
-0.20
0.22
-0.60*
-0.16
-0.28
r-BMI0.09
-0.20
0.14
-0.46#
-0.12
-0.18
r-BMI0.17
0.21
0.35*
0.23
0.05
0.52*
Mean(SD)4.63(3.02)
3.00(1.12)4.17(2.69)6.89(3.59)
3.57(1.86)7.11(3.82)
Mean(SD)3.49(0.91)
3.81(0.99)3.36(0.80)3.34(0.98)
3.62(1.01)3.18(0.54)
Mean(SD)0.47(0.90)
0.11(0.33)0.33(0.65)1.00(1.32)
0.24(0.54)1.00(1.32)
Mean(SD)0.63(1.27)
0.11(0.33)0.50(1.00)1.33(1.87)
0.38(0.92)1.22(1.79)
Mean(SD)3.11(1.23)
03.39(0.53)2.91(0.92)3.11(1.99)
2.98(0.94)3.41(1.78)
NumberofStairs
StairFacilitation
LunchroomNutritionSigns
HotelNutritionSigns
Healthyeating
facilitation
Correlationcoefficient(r)interpretationguide:small=0.10to0.029;#medium=0.30to0.49;*large=0.50to1.00
32
Policy Interventions to Tackle the Obesogenic Environment
Table 3.3a Impact on weight in Ibs at 6–12 months in 9 RCTs
Table 3.3b Impact on BMI at 6–12 months in 6 RCTs
(Source:Andersonet al,2009[53]Ms=differenceinmeanbodyweight(Ibs)
(Source:Andersonet al,2009[53]Ms=differenceinmeanBMI(kg/m2))
35
middle aged men with BMI over 25) [59]. In this study, the benefit to the group on a low fat diet was
twice that of the group advised to engage in unsupervised moderate exercise. For the review as a
whole, the authors were unable to draw firm conclusions about any differential effects by
programme focus (activity or diet) or programme component (environmental, policy, information or
skills).
Table 3.3a Impact on weight in Ibs at 6–12 months in 9 RCTs. (Source: Anderson et al, 2009 [53]) Ms=difference in mean bodyweight (Ibs) (P values not reported)
bold type and =overall estimate
Table 3.3b Impact on BMI at 6–12 months in 6 RCTs. (Source: Anderson et al, 2009 [53]) Ms=difference in mean BMI (kg/m2) (P values not reported)
bold type and =overall estimate
Multi-component approaches and structured programmes were more beneficial in general than
single component and unstructured (self directed approaches). The very marginal benefits seen in a
recently published, hospital-based (RCT cluster design) multi-component intervention, which was
also part of the NHLBI funded workplace programme, are somewhat less encouraging [60]. Lemon et
al found no impact of the intervention on change in BMI where the estimated group difference was
0.272 (95% CI: -0.271 to 0.782) at 12 months and 0.276 (95% CI: -0.338 to 0.890) at 24 months. The
Multi-componentapproachesandstructuredprogrammesweremorebeneficialingeneralthansinglecomponentandunstructured(selfdirectedapproaches).Theverymarginalbenefitsseeninarecentlypublished,hospitalbased(RCTclusterdesign)multi-componentintervention,whichwasalsopartoftheNHLBIfundedworkplaceprogramme,aresomewhatlessencouraging[60].Lemonet alfoundnoimpactoftheinterventiononchangeinBMIwheretheestimatedgroupdifferencewas0.272(95%CI:-0.271to0.782)at12monthsand0.276(95%CI:-0.338to0.890)at24months.Thepredominantenvironmentalinterventionsemployedcouldcertainlybedescribedas‘lowintensity’,howeverwithcafeteriasigns(andstairwaysigns)beingthemostfrequentmeasures.Lastlyofcourseanover-relianceonworkplaceinterventionstopreventandcontrolobesity,runstheobviousriskofexcludingthosenotinregularemployment,whoforavarietyofreasonscanbeatincreasedriskofapoordietandlowlevelsofphysicalactivity.Thehealthinequalitiesdimensiontoobesityisdiscussedfurtherinsection8.6.
33
Summary
Nutritioninterventions(micro-level)
• Theclearestassociationsforincreasedfoodenergyconsumptioninrestaurantsandothercateringoutletshavebeenforincreasesinservingportionsizeandenergydensity.
• Asastrategyforreducingoverallconsumption,consumersandrestaurantgoershaveexpressedconsistentpreferencesforawiderrangeofportionsizestobemadeavailable,althoughitdoesnotnecessarilyfollowthatthiswillresultinmorechoosingsmallerportions.
• Inspiteofvariablestudyquality,workplaceenvironmentalinterventions,includingincreasedhealthyfoodavailabilitywithinformation,havenowbeendemonstratedtoresultinsignificantmeanreductionsinBMIandbodyweightfortargetedgroupsofworkers,acrossawiderangeofemploymentsectors.
• Perhapsunsurprisingly,andinkeepingwithecologicalmodels,multi-componentandmoreintensivelystructuredinterventionsareassociatedwiththebestoutcomesintheworkplace,althoughsocioculturalaspectsremainunderresearched.
• Separatingoutthecontributionsofmultipleprogrammecomponentscanbehighlyproblematicandisalsolikelytobefurthercomplicatedbyindividualvariabilityinresponsivenesstodifferentmeasures.
• Lowintensityenvironmentalinterventionsbythemselves(e.g.informationnoticesonhealthyeating),havelimitedbenefitswithinworkplacesettings.
3.4 Physical activity interventions (macro-level)
Thewidespreadinternationalconsensus,thatincreasingpopulationlevelsofphysicalactivitywillrequiremorethanmerelyeducatingindividuals,hasstimulatedconsiderableresearchinterestinthecapacityofthebuiltenvironmenttoencourageactiveliving[61].Specifically,transportationinfrastructureswhichheavilyfavourprivatecartravel,landusezoningpolicieswhichintroduceprohibitiveseparationdistancesforwalkingandcycling,andaninequitabledistributionofwellmaintainedparksandrecreationfacilities,areallbelievedtocontributetoinadequatelevelsofphysicalactivityinmanyurbanareas[62].Thissectionwillbrieflyreviewthemajorcorrelationstudiesthathavehelpedclarifytherelativestrengthsoftheseenvironmentalassociations,includingtheextenttowhichtheymightapplyinScotland.Forthepurposesofthisreview,allcharacteristicsoftheexternalurbaninfrastructuresuchaslanduseandtransportationroutesareconsideredtobemacro-levelfeatures.Designfeatureswithinbuildings,campusesorlargeinstitutionssuchashospitalswillbeconsideredinturnasmicro-levelcharacteristics.Anadditionaldistinctionbetween‘leisurebased’or‘recreational’physicalactivityandphysicalactivitythatisintegraltodailyliving/working/travelhasalsoprovenusefulincategorisingthepublishedevidence.
Investigatingthepotentialenvironmentaldeterminantsofobesityisstillarelativelynewfield,withfewpublicationsbeforetheyear2000.Theoneaspectwhichcontinuestoimprove,fromanexposureassessmentperspective,isthedegreeofsophisticationwithwhichbuiltenvironmentmeasurementsaremade.Figure3.4showsthecontinuumofmethodsforassessmentpresentedbyBoothet alintheirwiderangingreview:
Chapter3
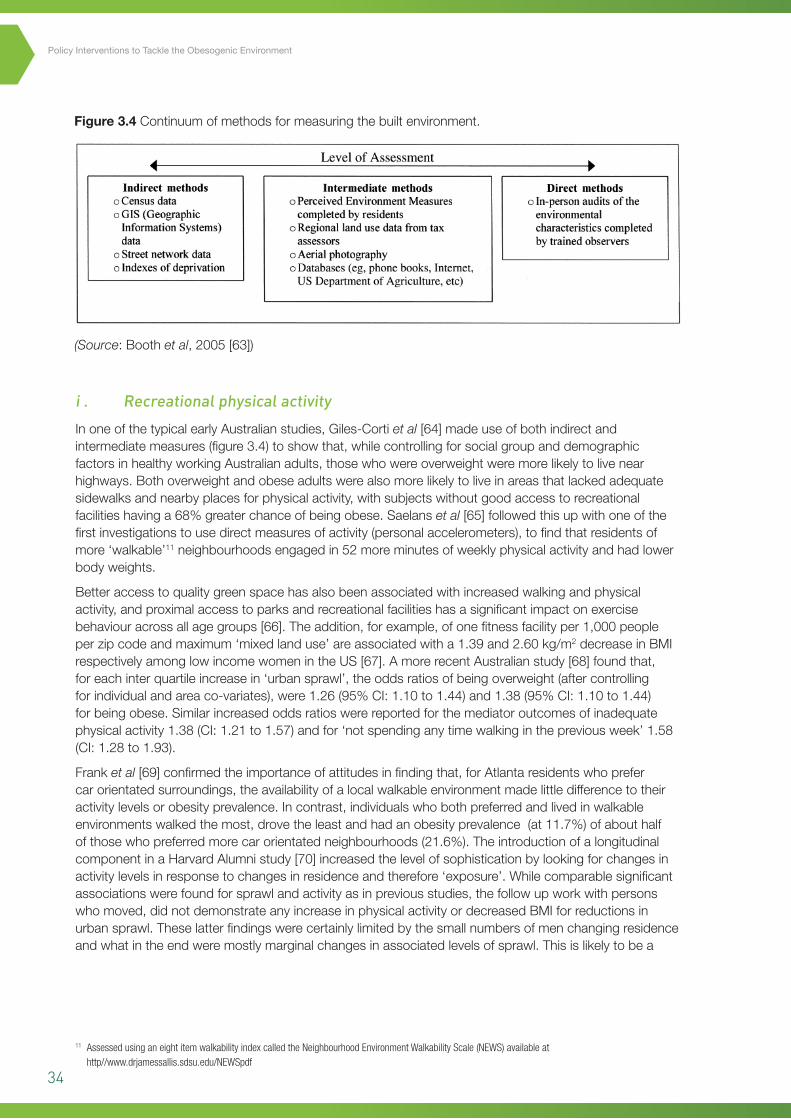
34
Policy Interventions to Tackle the Obesogenic Environment
(Source:Boothet al,2005[63])
Figure 3.4 Continuumofmethodsformeasuringthebuiltenvironment.
37
the extent to which they might apply in Scotland. For the purposes of this review, all characteristics
of the external urban infrastructure such as land use and transportation routes are considered to be
macro-level features. Design features within buildings, campuses or large institutions such as
hospitals will be considered in turn as micro-level characteristics. An additional distinction between
‘leisure based’ or ‘recreational’ physical activity and physical activity that is integral to daily
living/working/travel has also proven useful in categorising the published evidence.
Investigating the potential environmental determinants of obesity is still a relatively new field, with
few publications before the year 2000. The one aspect which continues to improve, from an
exposure-assessment perspective, is the degree of sophistication with which built environment
measurements are made. Figure 3.4 shows the continuum of methods for assessment presented by
Booth et al in their wide ranging review:
Figure 3.4 Continuum of methods for measuring the built environment. (Source: Booth et al, 2005 [63]). i . Recreational physical activity
In one of the typical early Australian studies, Giles-Corti et al [64] made use of both indirect and
intermediate measures (figure 3.4) to show that, while controlling for social group and demographic
factors in healthy working Australian adults, those who were overweight were more likely to live
near highways. Both overweight and obese adults were also more likely to live in areas that lacked
adequate sidewalks and nearby places for physical activity, with subjects without good access to
recreational facilities having a 68% greater chance of being obese. Saelans et al [65] followed this up
with one of the first investigations to use direct measures of activity (personal accelerometers) to
find that residents of more ‘walkable’9
9 Assessed using an eight item walkability index called the Neighbourhood Environment Walkability Scale (NEWS) available at http//www.drjamessallis.sdsu.edu/NEWSpdf
neighbourhoods engaged in 52 more minutes of weekly
physical activity and had lower body weights.
i . Recreational physical activity
InoneofthetypicalearlyAustralianstudies,Giles-Cortiet al[64]madeuseofbothindirectandintermediatemeasures(figure3.4)toshowthat,whilecontrollingforsocialgroupanddemographicfactorsinhealthyworkingAustralianadults,thosewhowereoverweightweremorelikelytolivenearhighways.Bothoverweightandobeseadultswerealsomorelikelytoliveinareasthatlackedadequatesidewalksandnearbyplacesforphysicalactivity,withsubjectswithoutgoodaccesstorecreationalfacilitieshavinga68%greaterchanceofbeingobese.Saelanset al[65]followedthisupwithoneofthefirstinvestigationstousedirectmeasuresofactivity(personalaccelerometers),tofindthatresidentsofmore‘walkable’11neighbourhoodsengagedin52moreminutesofweeklyphysicalactivityandhadlowerbodyweights.
Betteraccesstoqualitygreenspacehasalsobeenassociatedwithincreasedwalkingandphysicalactivity,andproximalaccesstoparksandrecreationalfacilitieshasasignificantimpactonexercisebehaviouracrossallagegroups[66].Theaddition,forexample,ofonefitnessfacilityper1,000peopleperzipcodeandmaximum‘mixedlanduse’areassociatedwitha1.39and2.60kg/m2decreaseinBMIrespectivelyamonglowincomewomenintheUS[67].AmorerecentAustralianstudy[68]foundthat,foreachinterquartileincreasein‘urbansprawl’,theoddsratiosofbeingoverweight(aftercontrollingforindividualandareaco-variates),were1.26(95%CI:1.10to1.44)and1.38(95%CI:1.10to1.44)forbeingobese.Similarincreasedoddsratioswerereportedforthemediatoroutcomesofinadequatephysicalactivity1.38(CI:1.21to1.57)andfor‘notspendinganytimewalkinginthepreviousweek’1.58(CI:1.28to1.93).
Franket al[69]confirmedtheimportanceofattitudesinfindingthat,forAtlantaresidentswhoprefercarorientatedsurroundings,theavailabilityofalocalwalkableenvironmentmadelittledifferencetotheiractivitylevelsorobesityprevalence.Incontrast,individualswhobothpreferredandlivedinwalkableenvironmentswalkedthemost,drovetheleastandhadanobesityprevalence(at11.7%)ofabouthalfofthosewhopreferredmorecarorientatedneighbourhoods(21.6%).TheintroductionofalongitudinalcomponentinaHarvardAlumnistudy[70]increasedthelevelofsophisticationbylookingforchangesinactivitylevelsinresponsetochangesinresidenceandtherefore‘exposure’.Whilecomparablesignificantassociationswerefoundforsprawlandactivityasinpreviousstudies,thefollowupworkwithpersonswhomoved,didnotdemonstrateanyincreaseinphysicalactivityordecreasedBMIforreductionsinurbansprawl.Theselatterfindingswerecertainlylimitedbythesmallnumbersofmenchangingresidenceandwhatintheendweremostlymarginalchangesinassociatedlevelsofsprawl.Thisislikelytobea
11 Assessed using an eight item walkability index called the Neighbourhood Environment Walkability Scale (NEWS) available at http//www.drjamessallis.sdsu.edu/NEWSpdf
35
Chapter3
reflection,theauthorsconcede,ofpeople’spreferencesformovingtocomparableareas,therebyalsoillustratingtheproblemofself-selection,whichremainamajorthreattovalidityinallstudiesofthistype.
Lastly,thePortlandneighbourhoodenvironmentstudydeservesfurthermention,sincejustastheylinkedfoodenvironmentfeatureswithbehaviourmediatedchangesinweightstatus,Liet alalsodidthesameforlocalwalkabilitycharacteristics[39].Specifically,highwalkabilityneighbourhoodswereassociatedwithdecreasesof1.2kginweight(P<0.05)and1.57cminwaistcircumference(P<0.05)amongresidentswhoincreasedtheirlevelsofvigorousphysicalactivityduringthe1-yearassessmentperiod.ThissubgroupspecificeffectcouldwellexplainthefindingsofauthorssuchasLovasiet al[71],whofoundthatindividualbuiltenvironmentcharacteristicswerenotsignificantlyassociatedwith‘walkingforexercise’,inanindependentpopulationsampleof1,608participants.
Whilethemanycorrelationstudiestodatereportfairlyconsistentphysicalactivityandweightbenefitsfromsupportivesurroundings[72],thefactthattheyhavepredominantlybeenundertakenintheUSandAustralia[62],presentsrealchallengesforgeneralisability,especiallywithregardtorelativelydenselypopulatedareaslikecentralScotland.Thisisparticularlyrelevantformeasurementconceptswhichhavearisensuchas‘walkability’and‘urbansprawl’,sincethesearefarmoreeasilyappliedtoUSandAustraliancitiesthantheirEuropeanorUKequivalents.Theotherkeyissuewithneighbourhoodandactivitystudiesisthatofself-selectionortheextenttowhichpeoplewhoarealreadypredisposedtogreaterlevelsofphysicalactivity,forexample,deliberatelychoosetoliveinareaswherethisisbettersupported.Atamorefundamentallevel,movingfromaetiologicalstudieswhichfocusoncausation,tointerventionproposalsaimedatobesityprevention,introducesanotherseriesofchallenges.Thenowacknowledgedextentoftheincreaseinphysicalactivitythatwouldberequiredtohaveanimpactonbodymass,raisessignificantquestionsaboutthefeasibilityofenvironmentalinterventionstoleadtofavourablechangesinpopulationweightstatus.Incorporatingmoreactivitydemandsintodailylivingmightbeonewaytoaddressthisdeficitandmeasurestoincreaseactiveliving(particularlyactivetravel)arediscussedinthenextsection.
Summary
Recreationalactivity
• Consistentassociationshavenowbeendemonstratedinanumberofcountriesbetweenfeaturesoftheexternalbuiltenvironmentandthelikelihoodofundertakingregularphysicalactivity,aswellastherelativeprevalenceofobesityandoverweight.
• SincethemajorityofthisworkisbasedonUSandAustralianstudies,thereareveryvalidconcernsaboutthetransferabilityofthesefindingstoaUK/Scottishcontext.
• Publishedreportsinthisareaarecharacterisedbyincreasinglysophisticatedmethodsofenquiry,includingnaturalexperiments,longitudinalstudydesignsandstratificationbydominantpreferencesandbehaviours.
• Anincreasingacknowledgementofthesecondaryroleforphysicalinactivity,comparedwithexcessenergyintake,asadriverofthemodernobesityepidemic,highlightstheneedtoavoidrelianceonactivitymeasuresalone(particularlyrecreationalmeasures),asameansoftacklingexcesspopulationweightgain.
36
Policy Interventions to Tackle the Obesogenic Environment
ii. Physical activity associated with ‘active living’
Oneofthefivekey’mostpromisingpolicyresponse‘optionsoftheUKGovernment’sForesightReportwastherecognitionthattheremaybesubstantialopportunitiesforincreasingphysicalactivitylevelsacrossthewholepopulationthroughsubtlebehaviourchangesineverydayliving,workingandtravelling.Thisrationaleisunderpinnedbyanumberofcharacteristicsofthecurrentobesityepidemic,bothintheUKandinternationally:firstly,fromanaetiologicalstandpoint,physicalactivitylevelsinrelationtoleisure(whileadmittedlybeinglargelybasedonselfreporting),havebeenrelativelystableincomparisontothedeclinesassociatedwithemploymentpatternsandtravelchoices[73].Secondly,majorlifestylechangestopreventorreduceexcessweightareoftennotrealisticforthemajorityofthepopulationandcrucially,evenwherethereareinitialhealthgains,theyareunlikelytobesustainable,withmostsubjectsregainingtheweightlostovertime[74].Lastly,themechanismofgradualweightgainovertimeisgenerallyattributabletoaverysmalldailyexcess,overmanyyears,inenergyintakeoverexpenditure[20].Thissituationhasledanumberofcommentatorstoconcludethatthepreventionoffurtherpopulationlevelincreasesinobesitycanmostusefullybetackledbyinterventionswhichproducemarginalrisesinenergyoutput(aswellasmarginalreductionsinenergyintake),therebyaddressingthe‘energygap’attherootofweightaccumulation[75].Someofthemoretechnologicallysophisticatedstudies(whichdirectlytrackenergyexpenditurelevels),havehighlightedthatthemagnitudeoftheenergygapissuchthatnothingotherthansubstantialchangesinintakeandexpenditure(e.g.decreasedintakeintheregionof400kcalperdayordailymoderatelyintenseexerciseof110minutesduration),wouldbesufficienttoclosethegaponsurplusenergyaccumulationandpreventfurtherweightgain[76].
Aswithleisurebasedphysicalactivity,betweencountryvariationsinbaselinelevelsofactivetravelcancauseproblemswhenconsideringthetransferabilityofpolicyandenvironmentalinterventions.Internationalstudieshowevercanbeextremelyinformativesincetheyallowformeaningfulcomparisonsbetweendiverseaspectsofurbandesignaspotentialdeterminantsofactivitylevels.InonerecentlypublishedScottishinvestigationOgilvieet al[77]examinedcorrelatesofactivetravelandphysicalactivityusinga14-itemneighbourhoodratingscaleandtheinternationallyvalidatedIPAQ12questionnaire[78].Apartfromaccesstolocalamenities,environmentalcharacteristicsprovedtohavealimitedinfluenceonactivetravelforthisrelativelydeprivedGlasgowpopulation.Theonlyotherstatisticallysignificantenvironmentalassociationwasaninverserelationshipbetween‘perceptionoftrafficvolume’andlikelihoodofphysicalactivity.Thisapparentlycounterintuitiveresulthasbeenreportedbyotherauthorsandhasbeenexplainedbythesuggestionthatmorefrequentcyclistsaremoreconsciousoftrafficvolumes[79].Figure3.5(fromOgilvieet al),illustratestheestimatedproportionofvarianceforbothactivetravelandphysicalactivityingeneral,explainedbyenvironmentalcorrelates.
12 International Physical Activity Questionnaire (IPAQ) http://www.ipaq.ki.se/ipaq.htm
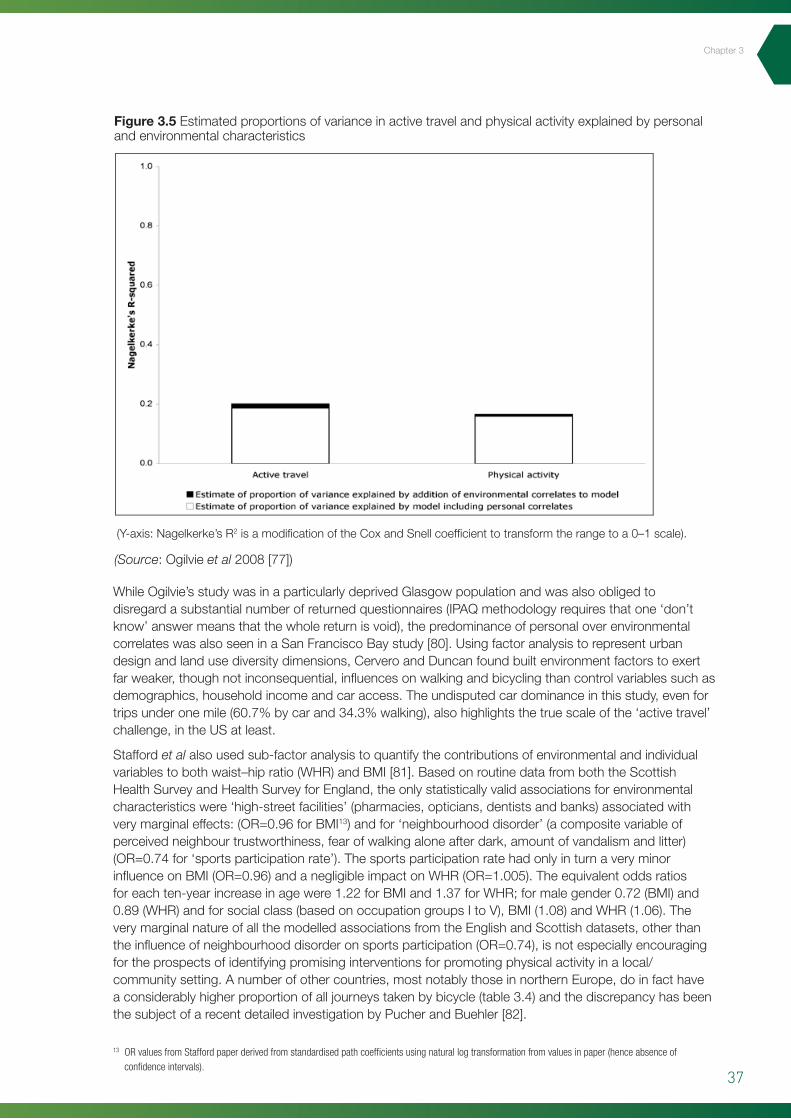
37
Chapter3
(Y-axis:Nagelkerke’sR2isamodificationoftheCoxandSnellcoefficienttotransformtherangetoa0–1scale).
Figure 3.5 Estimatedproportionsofvarianceinactivetravelandphysicalactivityexplainedbypersonalandenvironmentalcharacteristics
41
suggestion that more frequent cyclists are more conscious of traffic volumes [79]. Figure 3.5 (from
Ogilvie et al) illustrates the estimated proportion of variance for both active travel and physical
activity in general, explained by environmental correlates.
Figure 3.5 Estimated proportions of variance in active travel and physical activity explained by personal and environmental characteristics (Y-axis: Nagelkerke’s R2 is a modification of the Cox and Snell coefficient to transform the range to a 0–1 scale). While Ogilvie’s study was in a particularly deprived Glasgow population and was also obliged to
disregard a substantial number of returned questionnaires (IPAQ methodology requires that one
‘don’t know’ answer means that the whole return is void), the predominance of personal over
environmental correlates was also seen in a San Francisco Bay study [80]. Using factor analysis to
represent urban design and land use diversity dimensions, Cervero and Duncan found built
environment factors to exert far weaker, though not inconsequential, influences on walking and
bicycling than control variables such as demographics, household income and car access. The
undisputed car dominance in this study, even for trips under one mile (60.7% by car and 34.3%
walking), also highlights the true scale of the ‘active travel’ challenge, in the US at least.
Stafford et al also used sub-factor analysis to quantify the contributions of environmental and
individual variables to both waist–hip ratio (WHR) and BMI [81]. Based on routine data from both
the Scottish Health Survey and Health Survey for England, the only statistically valid associations for
environmental characteristics were ‘high-street facilities’ (pharmacies, opticians, dentists and banks)
WhileOgilvie’sstudywasinaparticularlydeprivedGlasgowpopulationandwasalsoobligedtodisregardasubstantialnumberofreturnedquestionnaires(IPAQmethodologyrequiresthatone‘don’tknow’answermeansthatthewholereturnisvoid),thepredominanceofpersonaloverenvironmentalcorrelateswasalsoseeninaSanFranciscoBaystudy[80].Usingfactoranalysistorepresenturbandesignandlandusediversitydimensions,CerveroandDuncanfoundbuiltenvironmentfactorstoexertfarweaker,thoughnotinconsequential,influencesonwalkingandbicyclingthancontrolvariablessuchasdemographics,householdincomeandcaraccess.Theundisputedcardominanceinthisstudy,evenfortripsunderonemile(60.7%bycarand34.3%walking),alsohighlightsthetruescaleofthe‘activetravel’challenge,intheUSatleast.
Staffordet alalsousedsub-factoranalysistoquantifythecontributionsofenvironmentalandindividualvariablestobothwaist–hipratio(WHR)andBMI[81].BasedonroutinedatafromboththeScottishHealthSurveyandHealthSurveyforEngland,theonlystatisticallyvalidassociationsforenvironmentalcharacteristicswere‘high-streetfacilities’(pharmacies,opticians,dentistsandbanks)associatedwithverymarginaleffects:(OR=0.96forBMI13)andfor‘neighbourhooddisorder’(acompositevariableofperceivedneighbourtrustworthiness,fearofwalkingaloneafterdark,amountofvandalismandlitter)(OR=0.74for‘sportsparticipationrate’).ThesportsparticipationratehadonlyinturnaveryminorinfluenceonBMI(OR=0.96)andanegligibleimpactonWHR(OR=1.005).Theequivalentoddsratiosforeachten-yearincreaseinagewere1.22forBMIand1.37forWHR;formalegender0.72(BMI)and0.89(WHR)andforsocialclass(basedonoccupationgroupsItoV),BMI(1.08)andWHR(1.06).TheverymarginalnatureofallthemodelledassociationsfromtheEnglishandScottishdatasets,otherthantheinfluenceofneighbourhooddisorderonsportsparticipation(OR=0.74),isnotespeciallyencouragingfortheprospectsofidentifyingpromisinginterventionsforpromotingphysicalactivityinalocal/communitysetting.Anumberofothercountries,mostnotablythoseinnorthernEurope,doinfacthaveaconsiderablyhigherproportionofalljourneystakenbybicycle(table3.4)andthediscrepancyhasbeenthesubjectofarecentdetailedinvestigationbyPucherandBuehler[82].
13 OR values from Stafford paper derived from standardised path coefficients using natural log transformation from values in paper (hence absence of confidence intervals).
(Source:Ogilvieet al2008[77])
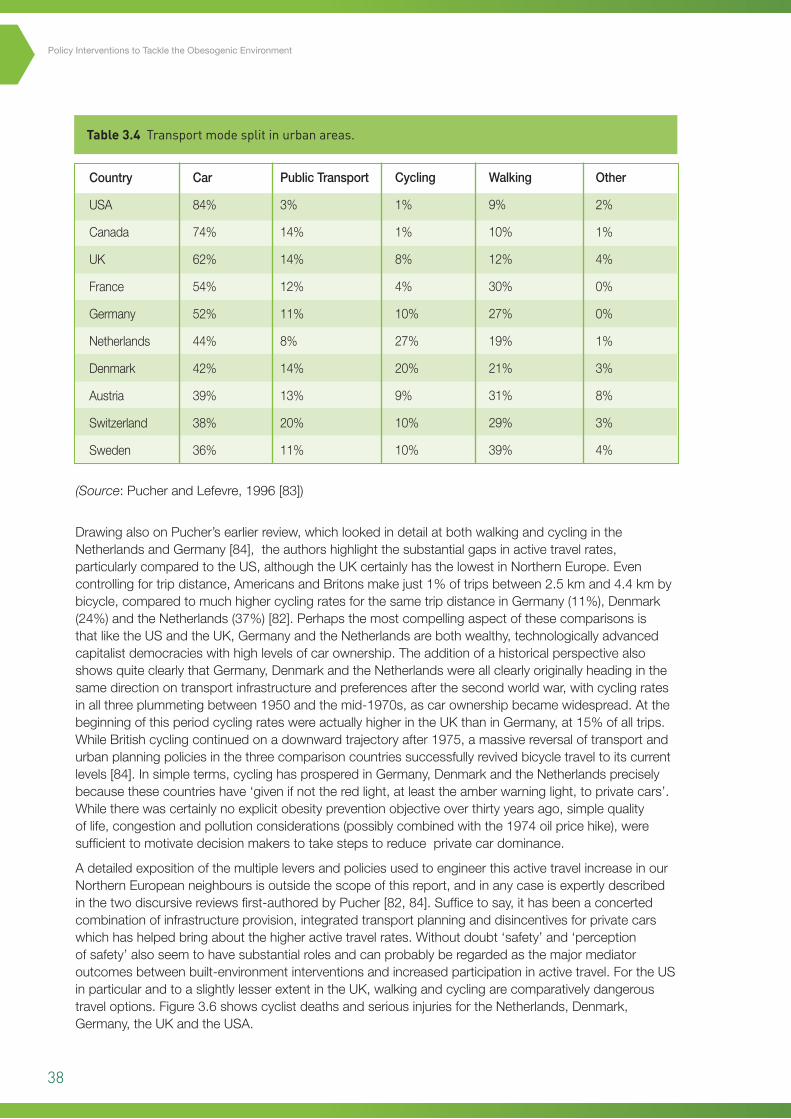
38
Policy Interventions to Tackle the Obesogenic Environment
Country
USA
Canada
UK
France
Germany
Netherlands
Denmark
Austria
Switzerland
Sweden
Car
84%
74%
62%
54%
52%
44%
42%
39%
38%
36%
PublicTransport
3%
14%
14%
12%
11%
8%
14%
13%
20%
11%
Cycling
1%
1%
8%
4%
10%
27%
20%
9%
10%
10%
Walking
9%
10%
12%
30%
27%
19%
21%
31%
29%
39%
Other
2%
1%
4%
0%
0%
1%
3%
8%
3%
4%
Table 3.4 Transport mode split in urban areas.
(Source:PucherandLefevre,1996[83])
DrawingalsoonPucher’searlierreview,whichlookedindetailatbothwalkingandcyclingintheNetherlandsandGermany[84],theauthorshighlightthesubstantialgapsinactivetravelrates,particularlycomparedtotheUS,althoughtheUKcertainlyhasthelowestinNorthernEurope.Evencontrollingfortripdistance,AmericansandBritonsmakejust1%oftripsbetween2.5kmand4.4kmbybicycle,comparedtomuchhighercyclingratesforthesametripdistanceinGermany(11%),Denmark(24%)andtheNetherlands(37%)[82].PerhapsthemostcompellingaspectofthesecomparisonsisthatliketheUSandtheUK,GermanyandtheNetherlandsarebothwealthy,technologicallyadvancedcapitalistdemocracieswithhighlevelsofcarownership.TheadditionofahistoricalperspectivealsoshowsquiteclearlythatGermany,DenmarkandtheNetherlandswereallclearlyoriginallyheadinginthesamedirectionontransportinfrastructureandpreferencesafterthesecondworldwar,withcyclingratesinallthreeplummetingbetween1950andthemid-1970s,ascarownershipbecamewidespread.AtthebeginningofthisperiodcyclingrateswereactuallyhigherintheUKthaninGermany,at15%ofalltrips.WhileBritishcyclingcontinuedonadownwardtrajectoryafter1975,amassivereversaloftransportandurbanplanningpoliciesinthethreecomparisoncountriessuccessfullyrevivedbicycletraveltoitscurrentlevels[84].Insimpleterms,cyclinghasprosperedinGermany,DenmarkandtheNetherlandspreciselybecausethesecountrieshave‘givenifnottheredlight,atleasttheamberwarninglight,toprivatecars’.Whiletherewascertainlynoexplicitobesitypreventionobjectiveoverthirtyyearsago,simplequalityoflife,congestionandpollutionconsiderations(possiblycombinedwiththe1974oilpricehike),weresufficienttomotivatedecisionmakerstotakestepstoreduceprivatecardominance.
AdetailedexpositionofthemultipleleversandpoliciesusedtoengineerthisactivetravelincreaseinourNorthernEuropeanneighboursisoutsidethescopeofthisreport,andinanycaseisexpertlydescribedinthetwodiscursivereviewsfirst-authoredbyPucher[82,84].Sufficetosay,ithasbeenaconcertedcombinationofinfrastructureprovision,integratedtransportplanninganddisincentivesforprivatecarswhichhashelpedbringaboutthehigheractivetravelrates.Withoutdoubt‘safety’and‘perceptionofsafety’alsoseemtohavesubstantialrolesandcanprobablyberegardedasthemajormediatoroutcomesbetweenbuilt-environmentinterventionsandincreasedparticipationinactivetravel.FortheUSinparticularandtoaslightlylesserextentintheUK,walkingandcyclingarecomparativelydangeroustraveloptions.Figure3.6showscyclistdeathsandseriousinjuriesfortheNetherlands,Denmark,Germany,theUKandtheUSA.
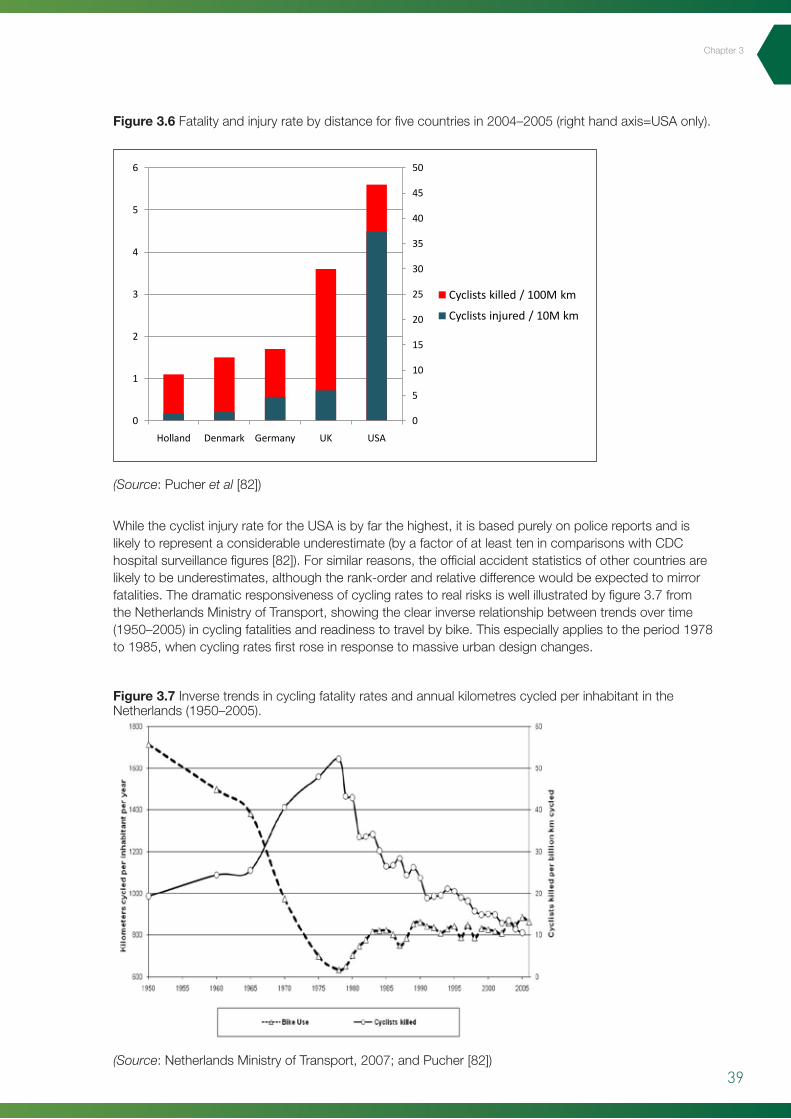
39
Chapter3
WhilethecyclistinjuryratefortheUSAisbyfarthehighest,itisbasedpurelyonpolicereportsandislikelytorepresentaconsiderableunderestimate(byafactorofatleasttenincomparisonswithCDChospitalsurveillancefigures[82]).Forsimilarreasons,theofficialaccidentstatisticsofothercountriesarelikelytobeunderestimates,althoughtherank-orderandrelativedifferencewouldbeexpectedtomirrorfatalities.Thedramaticresponsivenessofcyclingratestorealrisksiswellillustratedbyfigure3.7fromtheNetherlandsMinistryofTransport,showingtheclearinverserelationshipbetweentrendsovertime(1950–2005)incyclingfatalitiesandreadinesstotravelbybike.Thisespeciallyappliestotheperiod1978to1985,whencyclingratesfirstroseinresponsetomassiveurbandesignchanges.
Figure 3.6 Fatalityandinjuryratebydistanceforfivecountriesin2004–2005(righthandaxis=USAonly).
Figure 3.7 InversetrendsincyclingfatalityratesandannualkilometrescycledperinhabitantintheNetherlands(1950–2005).
(Source:Pucheret al[82])
(Source:NetherlandsMinistryofTransport,2007;andPucher[82])
44
While the cyclist injury rate for the USA is by far the highest, it is based purely on police reports and
is therefore a considerable underestimate (by a factor of at least ten in comparisons with CDC
hospital surveillance figures [82]). For similar reasons, the official accident statistics of other
countries are likely to be underestimates, although the rank-order and relative difference would be
expected to mirror fatalities. The dramatic responsiveness of cycling rates to real risks is well
illustrated by figure 3.7 from the Netherlands Ministry of Transport, showing the clear inverse
relationship between trends over time (1950–2005) in cycling fatalities and readiness to travel by
bike. This especially applies to the period 1978 to 1985, when cycling rates first rose in response to
massive urban design changes.
Figure 3.7 Inverse trends in cycling fatality rates and annual kilometres cycled per inhabitant in the Netherlands (1950–2005). (Source: Netherlands Ministry of Transport, 2007; and Pucher [82].)
Indeed, such is the current perceived levels of cycling safety in the Netherlands, that there is a high
participation across all age-groups, including women and the elderly. Cyclists also rarely wear safety
helmets or special visibility enhancements. Any reservation that this clear association between
cycling safety and uptake is unique to the Netherlands ought to be dispelled by recent developments
in New York, in the world’s ‘league leader’ country for cycling deaths. A US news article published in
Figure 3.6 Substitute
0
5
10
15
20
25
30
35
40
45
50
0
1
2
3
4
5
6
Holland Denmark Germany UK USA
Cyclists killed / 100M km
Cyclists injured / 10M km
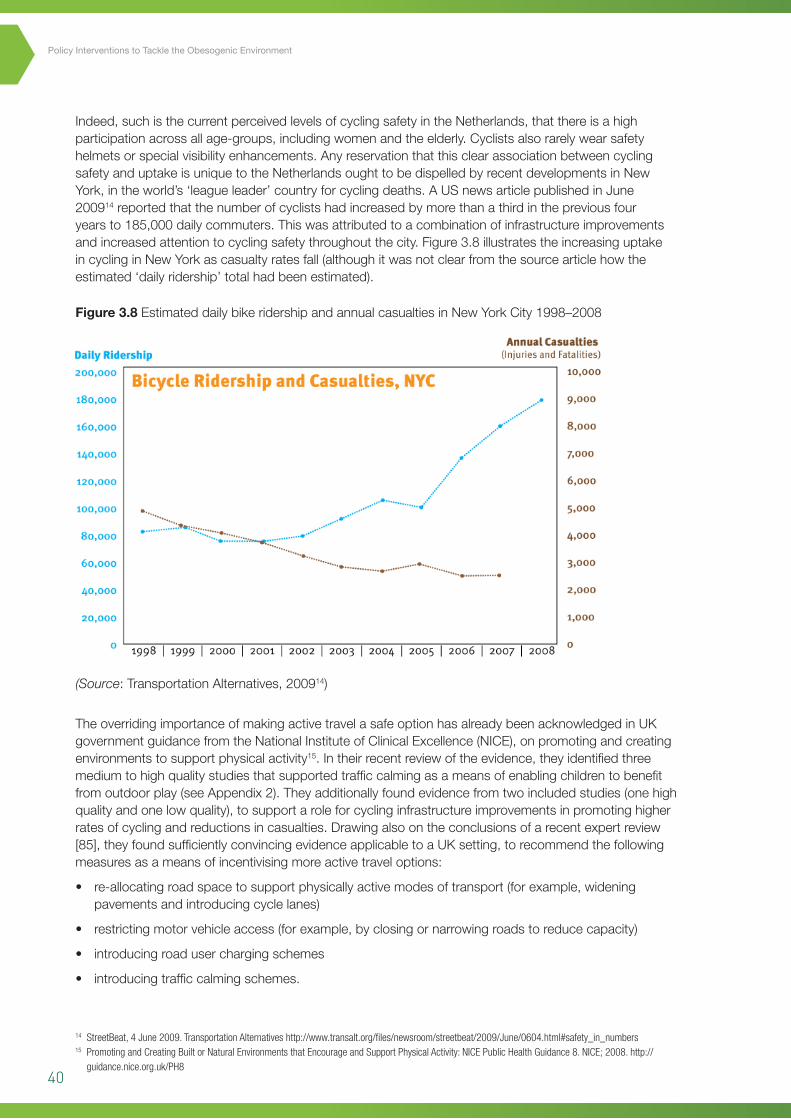
40
Policy Interventions to Tackle the Obesogenic Environment
Indeed,suchisthecurrentperceivedlevelsofcyclingsafetyintheNetherlands,thatthereisahighparticipationacrossallage-groups,includingwomenandtheelderly.Cyclistsalsorarelywearsafetyhelmetsorspecialvisibilityenhancements.AnyreservationthatthisclearassociationbetweencyclingsafetyanduptakeisuniquetotheNetherlandsoughttobedispelledbyrecentdevelopmentsinNewYork,intheworld’s‘leagueleader’countryforcyclingdeaths.AUSnewsarticlepublishedinJune200914reportedthatthenumberofcyclistshadincreasedbymorethanathirdinthepreviousfouryearsto185,000dailycommuters.Thiswasattributedtoacombinationofinfrastructureimprovementsandincreasedattentiontocyclingsafetythroughoutthecity.Figure3.8illustratestheincreasinguptakeincyclinginNewYorkascasualtyratesfall(althoughitwasnotclearfromthesourcearticlehowtheestimated‘dailyridership’totalhadbeenestimated).
TheoverridingimportanceofmakingactivetravelasafeoptionhasalreadybeenacknowledgedinUKgovernmentguidancefromtheNationalInstituteofClinicalExcellence(NICE),onpromotingandcreatingenvironmentstosupportphysicalactivity15.Intheirrecentreviewoftheevidence,theyidentifiedthreemediumtohighqualitystudiesthatsupportedtrafficcalmingasameansofenablingchildrentobenefitfromoutdoorplay(seeAppendix2).Theyadditionallyfoundevidencefromtwoincludedstudies(onehighqualityandonelowquality),tosupportaroleforcyclinginfrastructureimprovementsinpromotinghigherratesofcyclingandreductionsincasualties.Drawingalsoontheconclusionsofarecentexpertreview[85],theyfoundsufficientlyconvincingevidenceapplicabletoaUKsetting,torecommendthefollowingmeasuresasameansofincentivisingmoreactivetraveloptions:
• re-allocatingroadspacetosupportphysicallyactivemodesoftransport(forexample,wideningpavementsandintroducingcyclelanes)
• restrictingmotorvehicleaccess(forexample,byclosingornarrowingroadstoreducecapacity)
• introducingroaduserchargingschemes
• introducingtrafficcalmingschemes.
Figure 3.8 EstimateddailybikeridershipandannualcasualtiesinNewYorkCity1998–2008
45
June 200912 reported that the number of cyclists had increased by more than a third in the previous
four years to 185,000 daily commuters. This was attributed to a combination of infrastructure
improvements and increased attention to cycling safety throughout the city. Figure 3.8 illustrates the
increasing uptake in cycling in New York as casualty rates fall (although it was not clear from the
source article how the estimated ‘daily ridership’ total had been estimated).
Figure 3.8 Estimated daily bike ridership and annual casualties in New York City 1998–2008
The overriding importance of making active travel a safe option has already been acknowledged in
UK government guidance from the National Institute of Clinical Excellence (NICE), on promoting and
creating environments to support physical activity13
12 StreetBeat, 4 June 2009. Transportation Alternatives
. In their recent review of the evidence, they
identified three medium- to high-quality studies that supported traffic calming as a means of
enabling children to benefit from outdoor play (see Appendix 2). They additionally found evidence
from two included studies (one high-quality and one low-quality), to support a role for cycling
infrastructure improvements in promoting higher rates of cycling and reductions in casualties.
Drawing also on the conclusions of a recent expert review [85], they found sufficiently convincing
http://www.transalt.org/files/newsroom/streetbeat/2009/June/0604.html#safety_in_numbers 13 Promoting and Creating Built or Natural Environments that Encourage and Support Physical Activity: NICE Public Health Guidance 8. NICE; 2008. http://guidance.nice.org.uk/PH8
14 StreetBeat, 4 June 2009. Transportation Alternatives http://www.transalt.org/files/newsroom/streetbeat/2009/June/0604.html#safety_in_numbers15 Promoting and Creating Built or Natural Environments that Encourage and Support Physical Activity: NICE Public Health Guidance 8. NICE; 2008. http://
guidance.nice.org.uk/PH8
(Source:TransportationAlternatives,200914)
41
Chapter3
NICE’spredecessororganisation,theHealthDevelopmentAgency,hadalsocommissionedawide-rangingreviewentitledTransportInterventionsPromotingSafeCyclingandWalking[86].Theinitialbriefingwastwo-foldnamely:(i)whattransportinterventionsareeffectiveinincreasingactivetravel?;and(ii)whattransportinterventionsareeffectiveinincreasingthesafetyofwalkingandcycling?.Thefactthattheeventualtitlechoicefocusesprincipallyonthesafetyaspectisprobablyareflectionofasafetyengineeringdominatedliterature,whichtendstoemphasisethesafetyoutcomesoftransportinterventions,ratherthan‘modalswitching’ortheuptakeofactivetravel.Theauthorsalsonotedthatwhilevariablesintheurbanenvironmentdoinfluencewalkingandcycling,itremainsunclearwhichcharacteristicsofthebuiltenvironmentarethemostimportant.
Carownershipandindividualmotivationlevelscertainlyremainstrongconfoundingfactorsintherelationshipbetweentravelchoicesandfeaturesofthebuiltenvironment.Onactivetravelspecifically,thereviewlevelevidencewasinconclusiveontheeffectivenessofengineering/builtenvironmentmeasures(suchastrafficcalmingetc),inpromotingashiftawayfromcaruse,butdidfindthatthesemeasureswereeffectiveinreducingaccidents[86].Combiningthesefindingswiththealreadyestablishedimportanceofsafety,highlightedabove,atleastmakesacircumstantialcaseforproposingthatbuiltenvironmentimprovementswhichimproveactivetravelsafetyarealegitimatemeansofattemptingtoincreasetheuptakeofwalkingandcycling,althoughproperevaluationoftheirhealthenhancingeffectsisstillwarranted.
Summary
Activetravel
• LimitedevidenceforenvironmentalinfluencesonactivetravelisnotparticularlysurprisinginaUKsetting,wherebaselinelevelsarelowandlargelyconfinedtoselfselectedpopulationsub-groups.
• Internationalcomparisonswithcountriesthathaveequallyhighlevelsofcarownershipandsimilarclimates,givegroundsforoptimismthatactivetravelcouldbepromotedbybuilt-environmentmodifications,althoughsignificantinfrastructuralinvestmentwouldberequired.
• Thefindingthatmuchoftheexistingevidencebaserelatestothecapacityofbuiltenvironmentinterventionstoimprovesafety,shouldnotbediscouragingtopolicymakers,inthelightoftheclearimportanceofimprovedsafetyinencouragingwiderparticipationinactivetravel.
• Althoughanydirectimpactofincreasedactivetravelonobesityhasyettobedemonstrated,conservativeestimatesofgeneralhealthbenefitscorrespondwithahighcost-effectivenssinthemediumtolongterm(seesection5.4).
3.5 Physical activity interventions (micro-level)
i. Point of decision prompts
Physicalsurroundingswhicharerelevanttomicro-levelinterventionscanbethoughtofasincreasinginscalefromfirstly,thehomeorworksetting;secondly,theintermediate-scaleenvironmentofpubliclyaccessiblefacilities/buildings;andthirdly,theentirelocalcommunityorimmediateneighbourhood.Allthreeoftheselevelshavebeenestablishedashavinganimpactorinfluenceonlevelsofphysicalactivity,includingtheuseofspecificadaptations,designfeaturesorawarenessprompts.Awarenesscuesor‘point-of-decisionprompts’(PODPs),representthemoststraightforwardandleastcostlyoftheseadaptationstoimplement.ThusitisperhapsunsurprisingthatthegreatestquantityofpublishedevidenceisrelatedtoPODPs.PODPsaredefinedas:‘motivationalsignsplacedatornearstairwellsoratthebaseofelevatorsorescalatorstoencourageindividualstoincreasestairuse’[87].Usefully,theCDC’sGuidetoCommunityPreventativeServices,whichisoneofthemostrespectedinternationalreviewbodiesforpublichealthinterventions,veryrecentlyupdatedtheirreviewoftheeffectivenessofPODPstoincludeaseparateanalysisonstudieswhichhadcombinedsuchpromptswithothercomplementaryenvironmentalfeatures[88].TheCDCtaskforcewereable,onthebasisof13qualifyingstudies,to
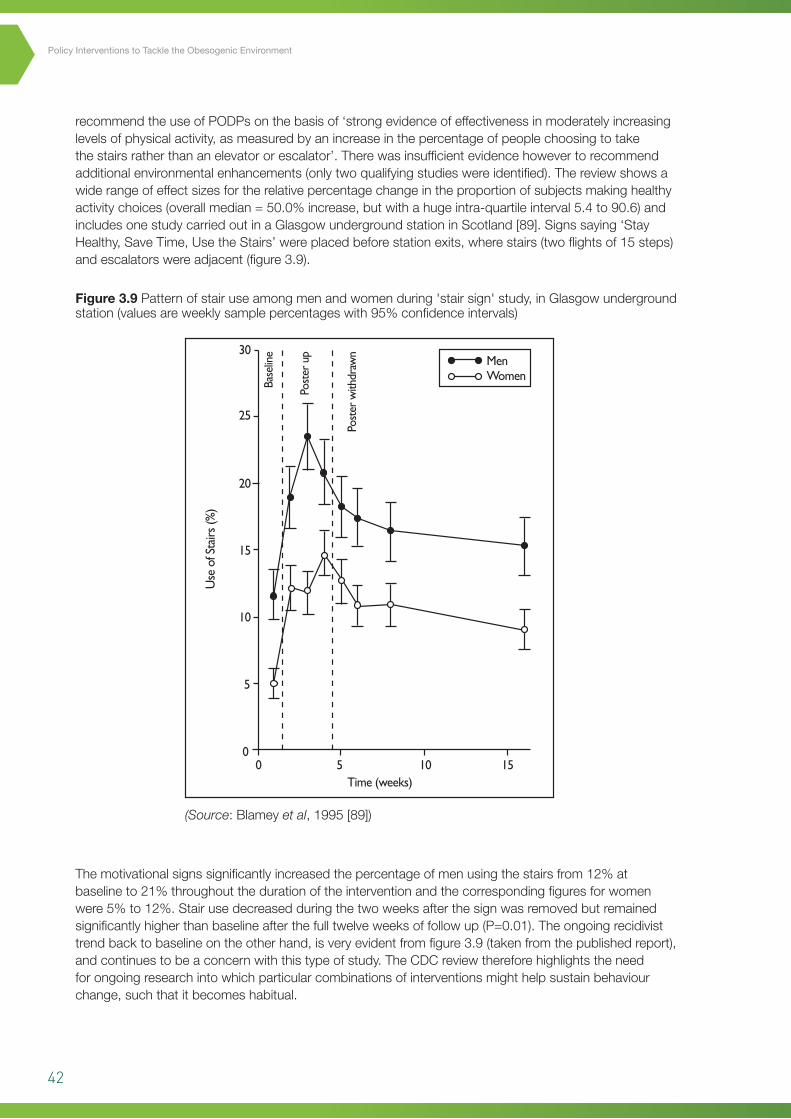
42
Policy Interventions to Tackle the Obesogenic Environment
recommendtheuseofPODPsonthebasisof‘strongevidenceofeffectivenessinmoderatelyincreasinglevelsofphysicalactivity,asmeasuredbyanincreaseinthepercentageofpeoplechoosingtotakethestairsratherthananelevatororescalator’.Therewasinsufficientevidencehowevertorecommendadditionalenvironmentalenhancements(onlytwoqualifyingstudieswereidentified).Thereviewshowsawiderangeofeffectsizesfortherelativepercentagechangeintheproportionofsubjectsmakinghealthyactivitychoices(overallmedian=50.0%increase,butwithahugeintra-quartileinterval5.4to90.6)andincludesonestudycarriedoutinaGlasgowundergroundstationinScotland[89].Signssaying‘StayHealthy,SaveTime,UsetheStairs’wereplacedbeforestationexits,wherestairs(twoflightsof15steps)andescalatorswereadjacent(figure3.9).
Themotivationalsignssignificantlyincreasedthepercentageofmenusingthestairsfrom12%atbaselineto21%throughoutthedurationoftheinterventionandthecorrespondingfiguresforwomenwere5%to12%.Stairusedecreasedduringthetwoweeksafterthesignwasremovedbutremainedsignificantlyhigherthanbaselineafterthefulltwelveweeksoffollowup(P=0.01).Theongoingrecidivisttrendbacktobaselineontheotherhand,isveryevidentfromfigure3.9(takenfromthepublishedreport),andcontinuestobeaconcernwiththistypeofstudy.TheCDCreviewthereforehighlightstheneedforongoingresearchintowhichparticularcombinationsofinterventionsmighthelpsustainbehaviourchange,suchthatitbecomeshabitual.
Figure 3.9 Patternofstairuseamongmenandwomenduring'stairsign'study,inGlasgowundergroundstation(valuesareweeklysamplepercentageswith95%confidenceintervals)
(Source:Blameyet al,1995[89])
5
30
25
20
15
10
0
Time (weeks)
MenWomen
Use
of S
tairs
(%)
Base
line
Post
er u
p
Post
er w
ithdr
awn
0 5 10 15
43
Chapter3
ii. Building design features
Aswellasmotivationalposters,anothertypeofinterventionwhichhasdemonstrablyincreasedstairuseisstructuralalterationstobuildings,inwhichforexampletheliftdoesnotstoponallfloors.MoresuitedtoaUSemployersetting,whereitisnotunusualforcompaniestooccupyanumberoffloorsinanofficeblock,thespecificexampleofthe‘stair-skip’design[90]probablyhaslimitedrelevancetotheUK,buttheprinciplesandtheprocessmayhaveimplicationsformodificationswhichhaveasimilarobjective(namelytoencourageactivityaspartofdailyroutine).Inanevaluationofthestair-skipdesign,NicollandZimringexploitedanaturalexperimentinwhichtheideawasimplementedintheCaliforniaDepartmentofTransportbuildinginLosAngeles[90].Describedmoreasa‘push’strategythat‘mandates’physicalactivitythroughstairusebyreducingaccesstoelevators,theauthorscontrasttheapproachwithmoretraditional‘pull’strategiessuchasPODPsdescribedabove.Sincethebuildinginquestionhadtwo‘circulationcores’itwasrelativelystraightforwardtosetupareal-timecontrolintheotherhalfofthebuilding.The‘skip-stop’elevatorsonlystoppedateverythirdfloorandwereadjacenttoanopenstaircase.Whileinterpretationoftheresultsishighlyproblematicduetoaverylowresponserate(17.4%),theopenskip-stopstairwasused33timesmorethantheenclosedfirestairinthecomparisonpartofthebuilding.Themostilluminatingfindingrelatedtotheattitudesofstudyparticipantstowardsthe‘skip-stop’stair,withtheproportionexpressingsatisfactionwiththearrangementincreasingfrom32.4%to47.5%(299participants).Thispositivechangeinattitudehasparallelswiththefindingsofotherstructuralandfiscalinterventions,mostnotablytheLondoncongestioncharge,whereinitialresistancedeclineswhenthebenefitsbecomeapparent16.
Summary
Physicalsurroundings
• Simplemotivationalsignscanbeaneffectivemeansofincreasingphysicalactivityinpublicsettingssuchasshopsandpublictransporthubs.
• Asinotherareasofhealthpromotion,thebestmeansofsustaininganypositivebehaviourchangecontinuestobeanareaofconsiderableuncertaintyandislikelytoremainanactiveresearchpriorityfortheforeseeablefuture.
• Structuralinterventionssuchasengineered‘stair-skip’measuresinbuildingscanalsoincreaseroutinedailyphysicalactivityandtheinitiallevelsofemployee/publicresistancetotheseinterventionsappeartodeclineovertime.
16 London’s Congestion Charge is a success. Institute of Environmental Management and Assessment News. Oct. 2003. http://www.iema.net/news/envnews?aid=4291

44
Policy Interventions to Tackle the Obesogenic Environment
4
45
Chapter5
4 Chapter 4 – Interventions to the economic environment 4.1 Introduction
Recentsuccessesinthedevelopedworldwithtobaccocontrol,usingacombinationofsalestaxesandenvironmentallegislation,havestimulatedthedebateonwhetherasimilarapproachmightbepossiblewithobesitypromotingfoodstuffs[91].Astheintroductoryquoteillustrates,taxationiscertainlybynomeansanovelideaandthereismuchrecentepidemiologicalevidencetosuggestthatitcouldbeausefulandeffectivemeansofaddressingtherelentlesspopulationrisesinobesityandoverweightinScotlandandtheUK.MaintainingtheANGELOframeworkstructure,thefollowingsectionontheeconomicdomainwillfirstconsidernationallyimposedfiscalmeasuresundermacro-levelinterventionsandlocal/institutional/sitespecificinterventionsunderthemicro-levelcategory.Thequalityofevidenceinbothoftheseareashasrecentlyadvancedconsiderably,althoughtheimplementationofeconomicleversandincentiveswillalwayspresentsignificantevaluationchallengesandthepotentialforunintendedconsequences[92].Researchfindingsonfiscalmeasurestopromote/incentivisephysicalactivity,althoughtheyaregenerallyrestrictedtoparticularriskgroups(suchastheelderly),arealsobrieflyreviewedattheendofthissection.
4.2 Nutrition interventions (macro-level)
Sugarsweetenedbeveragesaredrinkswhichcontainnaturallyderivedcaloricsweetenerssuchassucrose(tablesugar),highfructosecornsyrup,orfruitjuiceconcentrates.Althoughthedifferenttypesofdrinkgenerallycontaincomparablecaloriesgramforgram,theydohavedifferencesintheirrespectivemetabolicprofiles,whichareoutsidethescopeofthisreport.Thepast30yearshasseendramaticincreasesinsugaredbeverageconsumptioninmanypartsoftheworld,mostnotablyintheUS,wherepercapitaintakedoubledacrossallagegroupsbetween1977and2002[93].Althoughmostoftheevidenceforanassociationbetweensoftdrinksandweightgainisobservationalinnature,therehavealsobeenshorttermclinicaltrials,whichhavehelpedprogressunderstandingaboutthewayinwhichsugaredbeverageconsumptionmaybelinkedtoadiposity.Indeedtheextentandvolumeofcircumstantial,longitudinalandexperimentalevidencestronglylinkingthistypeofdrinktothecurrentobesitypandemic,makesacompellingcaseintheopinionofsomeexpertcommentatorsforsomeformofgovernmentintervention[93].Athree-levelrationalehasrecentlybeenputforwardbyKimandcolleaguesinsupportofadedicatedtaxonsoftdrinks/snackfooditems[94],theprincipalcomponentsofwhichare:
i. Agrowingbodyofevidence,includingprospectivestudies,linkinganincreasedconsumptionofhigh-energy/low-nutrientfoodanddrinkwithweightgainandotheradversehealtheffects
ii. Extensiveconfirmationfromaroundtheworldthatsugaredbeveragepurchasingbyconsumersisstronglysensitivetoprice
iii. Thedutyofgovernmenttoprotectconsumerswheremassivelevelsofinvestmentintheadvertisingandpromotionofunhealthyfoodanddrink,makeitdifficultforthepublictotakeproperlyinformeddecisionsabouthealthrisks.
Chapter4
‘Sugar, rum and tobacco are commodities which are nowhere necessities of life, which are become objects of almost universal consumption, and which are therefore extremely proper subjects of taxation.’
Adam Smith, The Wealth of Nations, 1776.
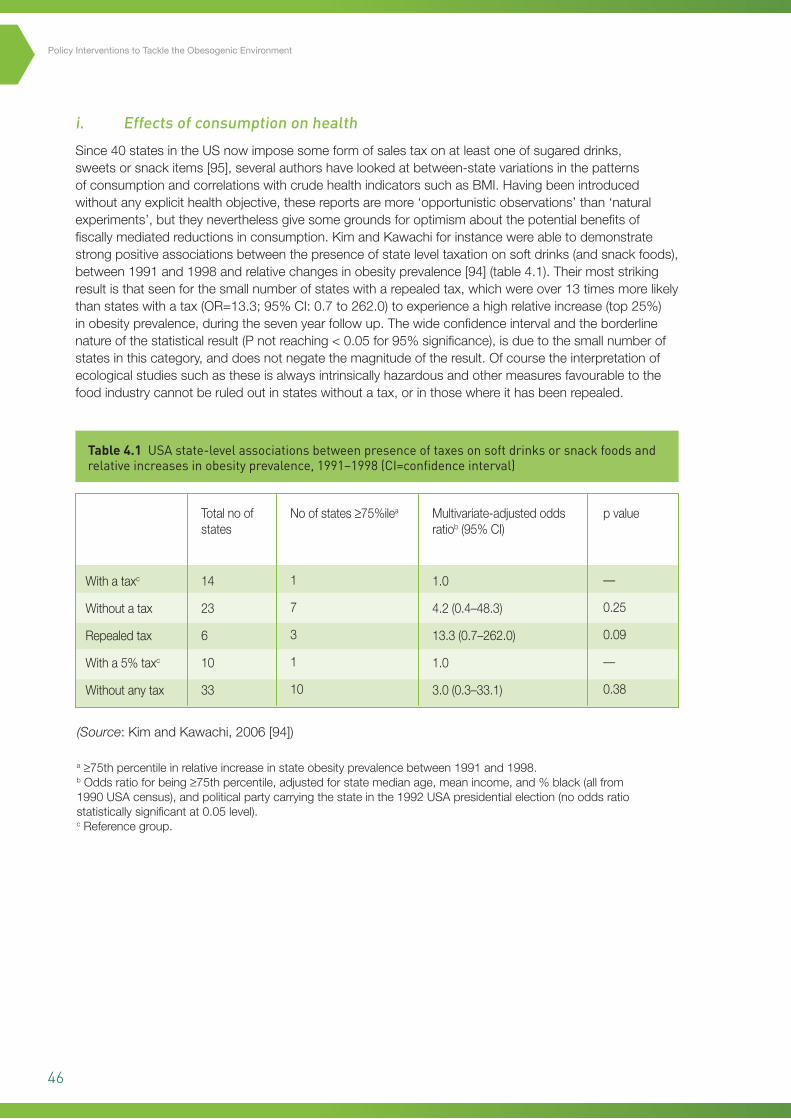
46
Policy Interventions to Tackle the Obesogenic Environment
i. Effects of consumption on health
Since40statesintheUSnowimposesomeformofsalestaxonatleastoneofsugareddrinks,sweetsorsnackitems[95],severalauthorshavelookedatbetween-statevariationsinthepatternsofconsumptionandcorrelationswithcrudehealthindicatorssuchasBMI.Havingbeenintroducedwithoutanyexplicithealthobjective,thesereportsaremore‘opportunisticobservations’than‘naturalexperiments’,buttheyneverthelessgivesomegroundsforoptimismaboutthepotentialbenefitsoffiscallymediatedreductionsinconsumption.KimandKawachiforinstancewereabletodemonstratestrongpositiveassociationsbetweenthepresenceofstateleveltaxationonsoftdrinks(andsnackfoods),between1991and1998andrelativechangesinobesityprevalence[94](table4.1).Theirmoststrikingresultisthatseenforthesmallnumberofstateswitharepealedtax,whichwereover13timesmorelikelythanstateswithatax(OR=13.3;95%CI:0.7to262.0)toexperienceahighrelativeincrease(top25%)inobesityprevalence,duringthesevenyearfollowup.Thewideconfidenceintervalandtheborderlinenatureofthestatisticalresult(Pnotreaching<0.05for95%significance),isduetothesmallnumberofstatesinthiscategory,anddoesnotnegatethemagnitudeoftheresult.Ofcoursetheinterpretationofecologicalstudiessuchastheseisalwaysintrinsicallyhazardousandothermeasuresfavourabletothefoodindustrycannotberuledoutinstateswithoutatax,orinthosewhereithasbeenrepealed.
Table 4.1 USA state-level associations between presence of taxes on soft drinks or snack foods and relative increases in obesity prevalence, 1991–1998 (CI=confidence interval)
(Source:KimandKawachi,2006[94])
a≥75thpercentileinrelativeincreaseinstateobesityprevalencebetween1991and1998.bOddsratioforbeing≥75thpercentile,adjustedforstatemedianage,meanincome,and%black(allfrom1990USAcensus),andpoliticalpartycarryingthestateinthe1992USApresidentialelection(nooddsratiostatisticallysignificantat0.05level).cReferencegroup.
Withataxc
Withoutatax
Repealedtax
Witha5%taxc
Withoutanytax
Totalnoofstates
14
23
6
10
33
Noofstates≥75%ilea
1
7
3
1
10
Multivariate-adjustedoddsratiob(95%CI)
1.0
4.2(0.4–48.3)
13.3(0.7–262.0)
1.0
3.0(0.3–33.1)
pvalue
—
0.25
0.09
—
0.38
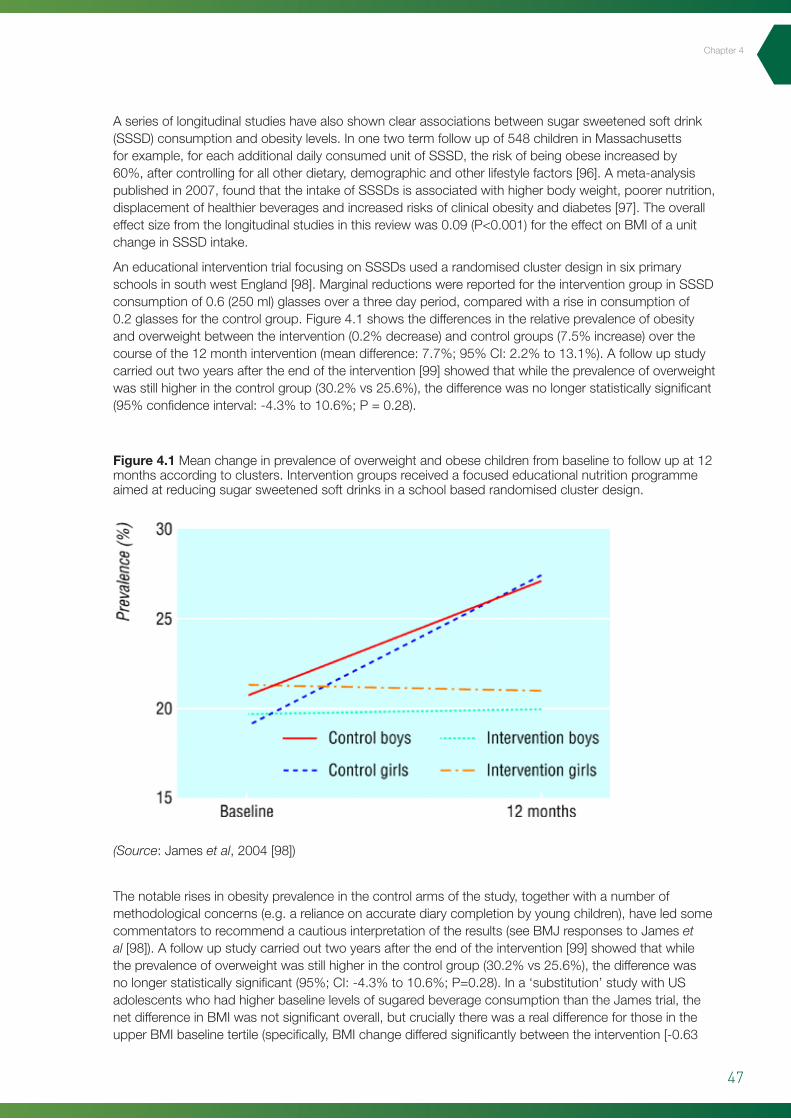
47
Chapter4
Aseriesoflongitudinalstudieshavealsoshownclearassociationsbetweensugarsweetenedsoftdrink(SSSD)consumptionandobesitylevels.Inonetwotermfollowupof548childreninMassachusettsforexample,foreachadditionaldailyconsumedunitofSSSD,theriskofbeingobeseincreasedby60%,aftercontrollingforallotherdietary,demographicandotherlifestylefactors[96].Ameta-analysispublishedin2007,foundthattheintakeofSSSDsisassociatedwithhigherbodyweight,poorernutrition,displacementofhealthierbeveragesandincreasedrisksofclinicalobesityanddiabetes[97].Theoveralleffectsizefromthelongitudinalstudiesinthisreviewwas0.09(P<0.001)fortheeffectonBMIofaunitchangeinSSSDintake.
AneducationalinterventiontrialfocusingonSSSDsusedarandomisedclusterdesigninsixprimaryschoolsinsouthwestEngland[98].MarginalreductionswerereportedfortheinterventiongroupinSSSDconsumptionof0.6(250ml)glassesoverathreedayperiod,comparedwithariseinconsumptionof0.2glassesforthecontrolgroup.Figure4.1showsthedifferencesintherelativeprevalenceofobesityandoverweightbetweentheintervention(0.2%decrease)andcontrolgroups(7.5%increase)overthecourseofthe12monthintervention(meandifference:7.7%;95%CI:2.2%to13.1%).Afollowupstudycarriedouttwoyearsaftertheendoftheintervention[99]showedthatwhiletheprevalenceofoverweightwasstillhigherinthecontrolgroup(30.2%vs25.6%),thedifferencewasnolongerstatisticallysignificant(95%confidenceinterval:-4.3%to10.6%;P=0.28).
Thenotablerisesinobesityprevalenceinthecontrolarmsofthestudy,togetherwithanumberofmethodologicalconcerns(e.g.arelianceonaccuratediarycompletionbyyoungchildren),haveledsomecommentatorstorecommendacautiousinterpretationoftheresults(seeBMJresponsestoJameset al[98]).Afollowupstudycarriedouttwoyearsaftertheendoftheintervention[99]showedthatwhiletheprevalenceofoverweightwasstillhigherinthecontrolgroup(30.2%vs25.6%),thedifferencewasnolongerstatisticallysignificant(95%;CI:-4.3%to10.6%;P=0.28).Ina‘substitution’studywithUSadolescentswhohadhigherbaselinelevelsofsugaredbeverageconsumptionthantheJamestrial,thenetdifferenceinBMIwasnotsignificantoverall,butcruciallytherewasarealdifferenceforthoseintheupperBMIbaselinetertile(specifically,BMIchangedifferedsignificantlybetweentheintervention[-0.63
Figure 4.1 Meanchangeinprevalenceofoverweightandobesechildrenfrombaselinetofollowupat12monthsaccordingtoclusters.Interventiongroupsreceivedafocusededucationalnutritionprogrammeaimedatreducingsugarsweetenedsoftdrinksinaschoolbasedrandomisedclusterdesign.
(Source:Jameset al,2004[98])
53
Figure 4.1 Mean change in prevalence of overweight and obese children from baseline to follow up at 12 months according to clusters. Intervention groups received a focused educational nutrition programme aimed at reducing sugar sweetened soft drinks in a school based randomised cluster
design. (Source: James et al, 2004 [98].)
The notable rises in obesity prevalence in the control arms of the study, together with a number of
methodological concerns (e.g. a reliance on accurate diary completion by young children), have led
some commentators to recommend a cautious interpretation of the results (see BMJ responses to
James at al [98]). A follow up study carried out two years after the end of the intervention [99]
showed that while the prevalence of overweight was still higher in the control group (30.2% vs
25.6%), the difference was no longer statistically significant (95%; CI: -4.3% to 10.6%; P=0.28). In a
‘substitution’ study with US adolescents who had higher baseline levels of sugared beverage
consumption than the James trial, the net difference in BMI was not significant overall, but crucially
there was a real difference for those in the upper BMI baseline tertile (specifically, BMI change
differed significantly between the intervention [-0.63 +- 0.23 kg/m2] and control [+0.12 +- 0.26
kg/m2] groups for those with a baseline BMI>=25.6 kg/m2, resulting in a net effect of -0.75 +- 0.34
kg/m2) [100]. Furthermore, the interaction between weight change and baseline BMI was not
attributable to baseline consumption of sugared sweetend beverages. Characterised by a diverse
cohort and a reassuringly high retention rate of 83%, this USA study by Ebbeling and colleagues
holds out the serious prospect of an intervention that by itself targets those most at risk, possibly
involving underlying increased susceptibilities unrelated to baseline consumption.
Since the extrapolation of findings from school and adolescent trials to working age adults is not
without risks, it is worth comparing these results with those obtained for SSSD consumption in one
of the largest ongoing US cohort studies [101]. The Nurses Health Study II is a large prospective
cohort of 116,671 female US nurses aged 24 to 44 years at study initiation in 1989, and who are
followed up by biennial mailed questionnaires. The questionnaire includes multiple lifestyle
48
Policy Interventions to Tackle the Obesogenic Environment
+-0.23kg/m2]andcontrol[+0.12+-0.26kg/m2]groupsforthosewithabaselineBMI>=25.6kg/m2,resultinginaneteffectof-0.75+-0.34kg/m2)[100].Furthermore,theinteractionbetweenweightchangeandbaselineBMIwasnotattributabletobaselineconsumptionofsugaredsweetendbeverages.Characterisedbyadiversecohortandareassuringlyhighretentionrateof83%,thisUSAstudybyEbbelingandcolleaguesholdsouttheseriousprospectofaninterventionthatbyitselftargetsthosemostatrisk,possiblyinvolvingunderlyingincreasedsusceptibilities,unrelatedtobaselineconsumption.
Sincetheextrapolationoffindingsfromschoolandadolescenttrialstoworkingageadultsisnotwithoutrisks,itisworthcomparingtheseresultswiththoseobtainedforSSSDconsumptioninoneofthelargestongoingUScohortstudies[101].TheNursesHealthStudyIIisalargeprospectivecohortof116,671femaleUSnursesaged24to44yearsatstudyinitiationin1989,andwhoarefollowedupbybiennialmailedquestionnaires.Thequestionnaireincludesmultiplelifestyleindicatorsincludingdietaryintake,physicalactivityandhealthstatusandgenerallyhasafollowupinexcessof90%foreach2-yearperiod.Anestedcohortof51,603womenforwhomcompletedietaryandbodyweightinformationwereavailablefor1991,1995and1999wereanalysedfortheincidenceoftypeIIdiabetesaccordingtopatternsofSSSDconsumption.Thestudy’smostelegantfeatureistheanalysisofsubgroupeffectsaccordingtochangesinconsumptionhabits.Weightgain,forinstance,overa4yearperiodwashighestamongwomenwhoincreasedtheirSSSDconsumptionfrom1orfewerdrinksperweekto1ormoredrinksperday(multivariate-adjustedmeans,4.69kgfor1991to1995and4.20kgfor1995to1999)andwassmallestamongwomenwhodecreasedtheirintake(1.34and0.15kgforthetwoperiods,respectively)afteradjustingforlifestyleanddietaryconfounders.TheauthorsproposethattheexcessivecaloriesandlargeamountsofrapidlyabsorbablesugarscouldexplainthelargerweightgainandincreasedriskoftypeIIdiabetes,associatedwiththehigherconsumptionofSSSDs.Nissinenaet alalsoreportedadirectcorrelationbetweenanincreaseintheconsumptionofsugarsweeteneddrinksfromchildhoodtoadulthoodandadultBMI17(ORforbeingoverweight=1.90;95%CI:1.38to2.61)inyoungFinnishwomen,butnotinmen[102].
ii. Price elasticity
Thegrowingcase,inmanycountries,forsupplementarytaxesonsugaredbeveragesonhealthgrounds,haspromptedresearcherstoexaminehowresponsivepurchase(i.e.presumedconsumption)mightbe,inrelationtopricechanges.Theeconomictermthatdescribesconsumersensitivitytothepriceofaparticularproductis‘priceelasticity’,whichisadimensionlessconstructdefinedasthepercentagechangeinpurchasedquantity(i.e.demand)associatedwitha1%changeinprice[103].Priceelasticityisdeterminedbyamultitudeoffactorsincludinghouseholdincome,availabilityofsubstitutes,consumerpreferencesetc.Whentherelativechangeinpurchasedquantityisbelowtherelativechangeinprice,demandissaidtobe‘inelastic’(numericallyexpressedasavaluebelow1.0).Changesindemandgreaterthantherelativepricechangehaveavaluegreaterthan1.0andarecalled‘elastic’.Theresultsofarecentcomprehensivereviewof160studiesontherelativepriceelasticitiesofmajorfoodstuffsareshownintable4.2.Priceelasticitiesforfoodsandnon-alcoholicbeveragesrangedfrom0.27to0.81(absolutevalues)withsoftdrinks(0.79;95%CI:0.33to1.24)beingsecondonlyto‘foodawayfromhome’(0.81;95%CI:0.23to1.76)forthehighestrelativepriceelasticityoftheitemsincluded.
17 Effect size in Nissenen et al: b=0.45; p=0.0001 i.e. BMI increased by 0.45 kg/m2 for every 10 unit increase in soft drink consumption per month.
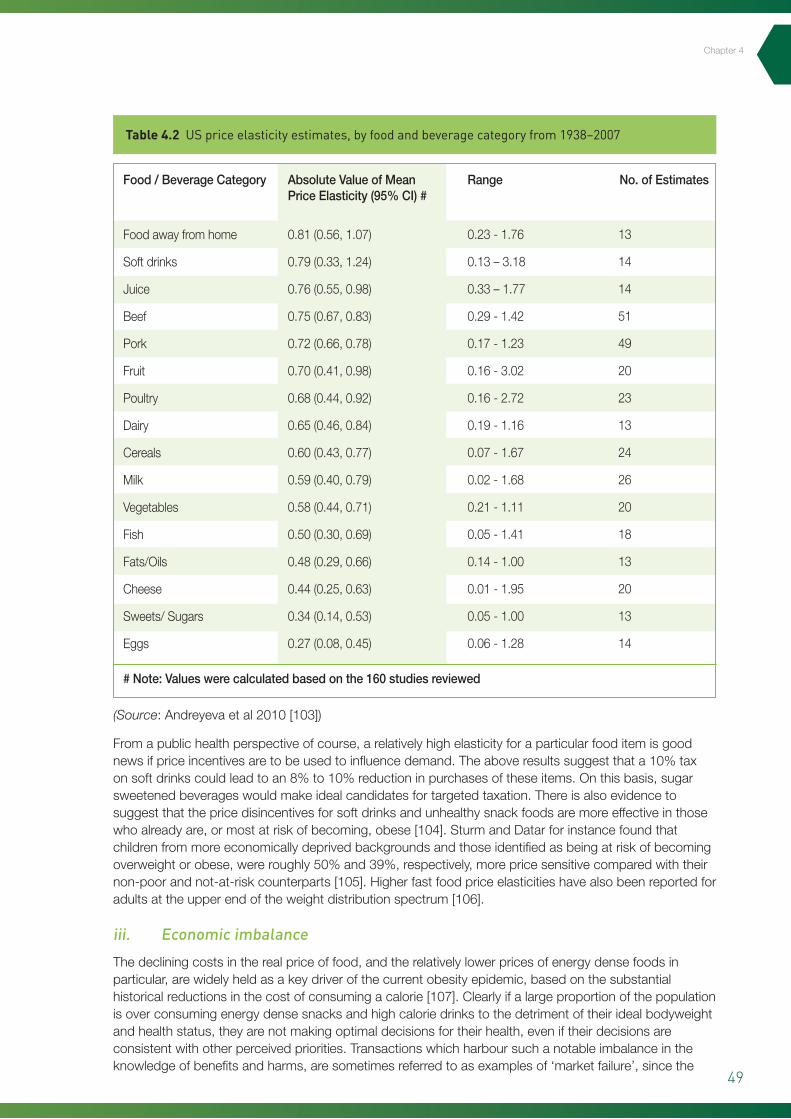
49
Table 4.2 US price elasticity estimates, by food and beverage category from 1938–2007
Fromapublichealthperspectiveofcourse,arelativelyhighelasticityforaparticularfooditemisgoodnewsifpriceincentivesaretobeusedtoinfluencedemand.Theaboveresultssuggestthata10%taxonsoftdrinkscouldleadtoan8%to10%reductioninpurchasesoftheseitems.Onthisbasis,sugarsweetenedbeverageswouldmakeidealcandidatesfortargetedtaxation.Thereisalsoevidencetosuggestthatthepricedisincentivesforsoftdrinksandunhealthysnackfoodsaremoreeffectiveinthosewhoalreadyare,ormostatriskofbecoming,obese[104].SturmandDatarforinstancefoundthatchildrenfrommoreeconomicallydeprivedbackgroundsandthoseidentifiedasbeingatriskofbecomingoverweightorobese,wereroughly50%and39%,respectively,morepricesensitivecomparedwiththeirnon-poorandnot-at-riskcounterparts[105].Higherfastfoodpriceelasticitieshavealsobeenreportedforadultsattheupperendoftheweightdistributionspectrum[106].
iii. Economic imbalance
Thedecliningcostsintherealpriceoffood,andtherelativelylowerpricesofenergydensefoodsinparticular,arewidelyheldasakeydriverofthecurrentobesityepidemic,basedonthesubstantialhistoricalreductionsinthecostofconsumingacalorie[107].Clearlyifalargeproportionofthepopulationisoverconsumingenergydensesnacksandhighcaloriedrinkstothedetrimentoftheiridealbodyweightandhealthstatus,theyarenotmakingoptimaldecisionsfortheirhealth,eveniftheirdecisionsareconsistentwithotherperceivedpriorities.Transactionswhichharboursuchanotableimbalanceintheknowledgeofbenefitsandharms,aresometimesreferredtoasexamplesof‘marketfailure’,sincethe
Foodawayfromhome
Softdrinks
Juice
Beef
Pork
Fruit
Poultry
Dairy
Cereals
Milk
Vegetables
Fish
Fats/Oils
Cheese
Sweets/Sugars
Eggs
Food/BeverageCategory AbsoluteValueofMeanPriceElasticity(95%CI)#
#Note:Valueswerecalculatedbasedonthe160studiesreviewed
Range No.ofEstimates
0.81(0.56,1.07)
0.79(0.33,1.24)
0.76(0.55,0.98)
0.75(0.67,0.83)
0.72(0.66,0.78)
0.70(0.41,0.98)
0.68(0.44,0.92)
0.65(0.46,0.84)
0.60(0.43,0.77)
0.59(0.40,0.79)
0.58(0.44,0.71)
0.50(0.30,0.69)
0.48(0.29,0.66)
0.44(0.25,0.63)
0.34(0.14,0.53)
0.27(0.08,0.45)
0.23-1.76
0.13–3.18
0.33–1.77
0.29-1.42
0.17-1.23
0.16-3.02
0.16-2.72
0.19-1.16
0.07-1.67
0.02-1.68
0.21-1.11
0.05-1.41
0.14-1.00
0.01-1.95
0.05-1.00
0.06-1.28
13
14
14
51
49
20
23
13
24
26
20
18
13
20
13
14
(Source:Andreyevaetal2010[103])
Chapter4
50
Policy Interventions to Tackle the Obesogenic Environment
bestinterestsofallpartiesisevidentlynotbeingserved.IntheopinionofeconomistJohnCawley,marketfailurerepresentstheonlylegitimateeconomicbasisforgovernmentimposedregulation[108].Whilemanywhoworkinpreventativehealthmightconsiderthatpublichealthgainshouldbetheguidingprincipleindecisionmaking,theeconomicrationalealsoneedstobekeptinmindsincethatcanoftenbethestartingpointforthemajorityofelectedofficialsandpolicymakers.ThethirdprincipleofKim’soriginalframeworkforjustifyingfiscalinterventions,namelythatgovernmentshouldseektoprotectconsumers,wheremassiveinvestmentinthepromotionofunhealthyproductsmakesitdifficultforthemtotakeproperlyinformeddecisions,couldyetthereforebethemostpersuasive.
Asameansoftryingtoinfluencefooddecisionstobemoreoptimal,intermsofconsumerhealth,priceincentiveshaveaveryrealadvantageovermoreinformationbasedmeasuressuchasfoodlabelling,inthattheyarestructuralanddonotrelyonanindividualconsumer’simperfectknowledgetomakegoodchoices[94].Ofcourse,priceincentivesarealreadymuchusedinfoodmarketingandarealmostalwaysaimedatencouraginghigherconsumption(e.g.buyonegetonefree,kingsize/megamealdeals).Cheap,mass-producedfoodandsoftdrinksarehighlyprofitableindustries,buttheirrealcostsinhealthtermsareusuallydeferredandfallonwidersociety,includingpubliclyfundedhealthcaresystems.Inthiscontext,governmentimposedstructuralinterventionssuchassalestaxesonsugaredbeverages,areaveryrationalmeansofredress,particularlysincethosewhoarethemostpricesensitivetendtobegroupswhoaremostatriskorleastempoweredtomakegoodinformedchoices(e.g.theyoungandtherelativelysocioeconomicallydeprived).PowellandChaloupka’srecentexcellentreviewoftheprospectsforsuchmeasures[104],concludedthatnontrivialpricinginterventionshavearealpotentialtorealisemeasurableeffectsonpopulationlevelweightoutcomes.Whilethebalanceoftheevidenceatthemomentsuggeststhatanyresultingbehaviourchangeattheindividuallevelwouldbemarginalatbest,theproposaliseasilyrecognisableasaclassicpreventionparadox[109],withsignificantpotentialforpopulationandsocietallevelgains,inspiteofsmalleffectsattheindividuallevel.Inaddition,smalldecreasesindailyorweeklyenergyintakearethemselvesrecognisedasaneffectivemeansofachievingfavourablechangesinbodyweightandreducedrisksfromobesityrelateddiseasessuchasdiabetes[20].Ofcoursetheextenttowhichgovernmentsandregulatorybodiesmightbeinclinedtoadoptsuchstructuralfiscalmeasureswillnecessarilyberelatedtotheirperspectiveondecidingforconsumerswhattheirprioritiesshouldbe.Chapter8ofthisreportintroducesaframeworkwhichstakeholdersandpolicymakerscouldusetoexploresomeofthemoreinvolvedconsiderationsaroundimplementation,suchasethicsandsustainability.
4.3 Nutrition Interventions (micro-level)
PossiblythemostconclusiveevidenceofthecapacityofworkplaceinterventionstoimpactontypesoffoodconsumedcomesfromFrenchet al’smultiplevendingmachineinterventionbasedinfourlargebusgarages,whichhasstrongsimilaritiestothegroups’previous‘changingindividual’spurchaseofsnacks’or‘CHIPS’studyoncollegecampussites[110].Increasesintheavailabilityofhealthysnacksby50%,combinedwithaveragepricereductionsof31%,resultedin10%to42%highersalesoftheseitems[111]acrossthegarages.Astheauthorsthemselvespointout,therelianceonaggregatedatawasamajorlimitationofthestudy,meaningthatitwasnotpossibletoknowifindividualschangedtheirvendingmachineusefrequencyortheirchoices.Indeedthelackofanysignificantdifferencesbetweentheinterventionandcontrolgroupsintheselfreportingsurveyarmoftheevaluation,servestoraisesignificantquestionsovertheinterpretationoftheresults.Thepictureisfurthercomplicatedbytheuseofthemachinesnotbeingrestrictedtobusdriversbutavailabletoallgaragestaff.Theincreasedpurchasescouldsimplybeareflectionofmoreattractivepricingtoallgarageusers,orevenexistingusersmakingmultiplepurchaseswhichwouldcertainlyexplainthemagnitudeoftheincreases.
ArecentlypublishedelaboraterandomisedtrialfromNewZealandbyNiMhurchuandcolleagues,impressivelydemonstrateshowthesamepriceincentiveprinciplesthatweresuccessfullyemployedinworkplaceenvironmentscanbetransferredtothemoregeneralfoodretailingsetupofthesupermarketchain[112].Thetrialinvolvedeightsupermarketsand1,104shopperswhowererandomlyassignedtooneoffourinterventions(12.5%discountsonhealthierfoods;tailorednutritionadviceonly;12.5%discountplusnutritionadviceandfourthly,acontrolarmwithnointervention),deliveredover6months.Althoughtherewasnosignificantdifferenceintheprimaryoutcomeofamountofsaturatedfatpurchased
51
Chapter4
at6months(orothernutrientsintheassessment),thoseassignedtoreceivepricediscountsonhealthierfoodsbought11%moreofthesefoodsat6months(meandifference=0.79kg/wk;95%CI:0.43to1.16;P<0.001)and5%moreat12months(meandifference=0.38kg/wk;95%CI:0.01to0.76;P=0.045).Thecomplicateddesignoftheinterventiontendstosupporttheauthors’viewsthatthesearelikelytobeconservativeestimatesofthepotentialforimprovedpurchasing,sinceexploitingthediscountsreliedonshoppersconsultingalargelistofeligibleproductssenttothembypost.ThedesignalsonecessitatedtheusebyshoppersofhandheldscannerswhichindigenousNewZealandersinparticular,didnotparticularlyfeelcomfortablewith(NiMhurchu,personalcommunication).Thesignificanceofthe12.5%discountisthatthiscorrespondstothecurrentrateofsalestaxinNewZealand,leadingtothepotentialrecommendationofremovingthischargefromfruitandvegetablesasameansofimprovingconsumption.Theresultant11%increaseinpurchasingat6monthscorrespondstoanalmostunitarypriceelasticityof1.0andishigherthananyoftheotheritemsgivenintable4.2.
Summary
Economicinterventions–nutrition(macroandmicro)
• Substantialincreasesintheworldwideconsumptionofhighenergyfoodsandsugaredbeverageshaveparalleledthecurrentinternationalobesityepidemic.
• Evidencefromawidevarietyofstudies,includingrandomisedtrials,haveshownstrongassociationsbetweenpopulationlevelweightgainandtheconsumptionofhighenergyfoodsanddrinks.
• Althoughthereremainsomemethodologicalconcernsaroundfooddiaryreportingandlongtermsustainability,restrictionandsubstitutionstudiesinchildrenandadolescentshavereportedrealdifferencesinweightoutcomes,withthosewhoaremostoverweightseeingthegreatestbenefits.
• Softdrinkshavearelativelyhigh‘priceelasticity’,inthattheirpurchasebyconsumers,particularlythoseatriskfromobesity,orfrommoreeconomicallydisadvantagedgroups,ismorepricesensitivecomparedwithothertypesoffoods.
• Softdrinktaxationfulfilsallthecriteriaforgovernmentstoaddressa‘marketfailure’andreapsignificantpublichealthbenefits.
• Consumerpurchasinglevelsofhealthyfoodssuchasfruitandvegetablescanbeenhancedbymodestpricereductions.
4.4 Physical activity interventions (macro-level)
Atthemacro-economiclevel,thecaseforinfrastructureinvestmentstosupportthesafetyandconvenienceofactivemodesoftravelhasbeencoveredinsomedetailpreviouslyinsection3.4.Chapter6furtherexploreshowmassmediacommunicationandlargescalepublicparticipationeventscanhelpchangeattitudesandencouragehigherparticipationratesinwalkingandcycling.Ofcourse,aswasalsohighlightedinchapter3,anincreasedprovisionofpublictransportcanalsoencouragetheuseofthesemoreactiveformsoftravel.Bythesametoken,increasingthecostsofprivatecartransport(e.g.parkingchargesetc),islikelytobeamajorcomponentofsuccessfulactivetravelpromotioninnorthernEuropeancountries(seesection3.4).
4.5 Physical activity interventions (micro-level)
Thedifficultyinchangingthesedentaryhabitsofpersonswhoarerelativelyinactive,bothattheindividualandpopulationlevel,oftenrelatestothefactthatexerciseisnotseen,atleastinitially,asintrinsicallyrewardingenoughtomakeitanattractiveoption.Oneobviousandimmediatewayofaddressingtheapparent‘lackofreward’istoprovidefinancialincentivesforthetargetgrouptoundertakethenewbehaviour.Asdiscussedintheprecedingsection,financialdisincentivesintheformofadditionaltaxesontobaccoandalcoholareaprovenmeansofreducingconsumption,buttheeffectofpositivefinancialincentivesremainslessclear[55].Noneofthe17trials,inarecentCochraneReviewoftheeffectof
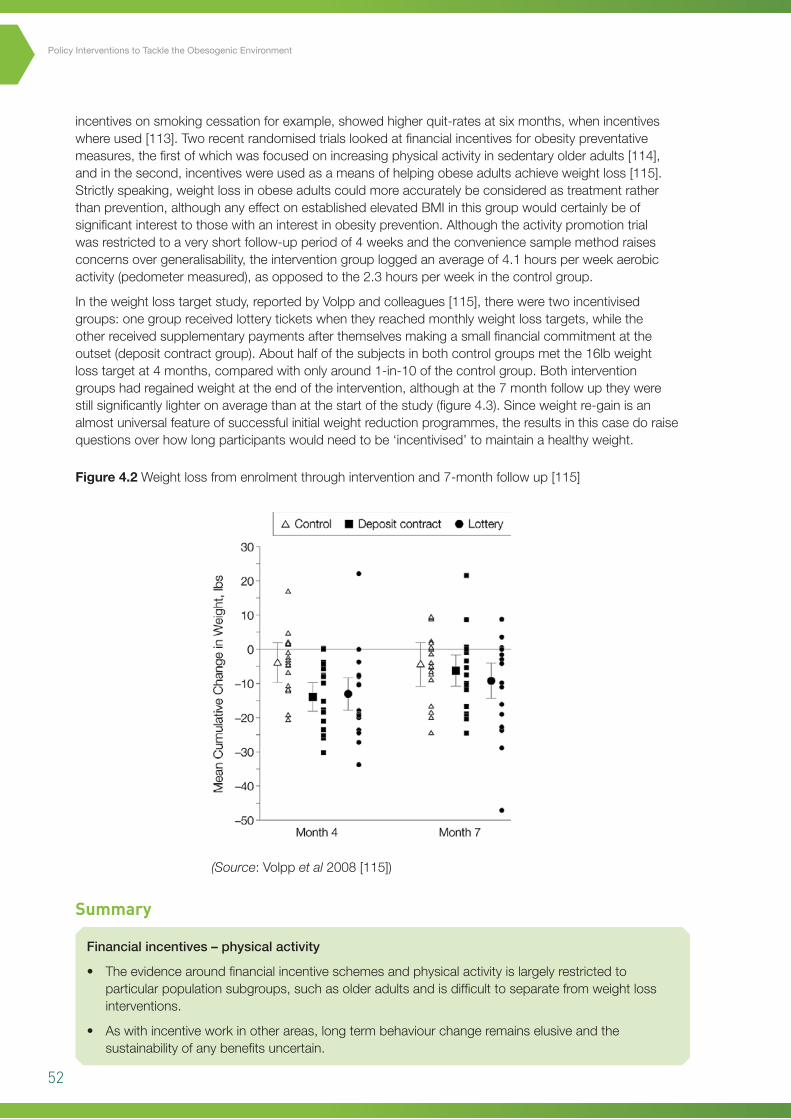
52
Policy Interventions to Tackle the Obesogenic Environment
5incentivesonsmokingcessationforexample,showedhigherquit-ratesatsixmonths,whenincentiveswhereused[113].Tworecentrandomisedtrialslookedatfinancialincentivesforobesitypreventativemeasures,thefirstofwhichwasfocusedonincreasingphysicalactivityinsedentaryolderadults[114],andinthesecond,incentiveswereusedasameansofhelpingobeseadultsachieveweightloss[115].Strictlyspeaking,weightlossinobeseadultscouldmoreaccuratelybeconsideredastreatmentratherthanprevention,althoughanyeffectonestablishedelevatedBMIinthisgroupwouldcertainlybeofsignificantinteresttothosewithaninterestinobesityprevention.Althoughtheactivitypromotiontrialwasrestrictedtoaveryshortfollow-upperiodof4weeksandtheconveniencesamplemethodraisesconcernsovergeneralisability,theinterventiongrouploggedanaverageof4.1hoursperweekaerobicactivity(pedometermeasured),asopposedtothe2.3hoursperweekinthecontrolgroup.
Intheweightlosstargetstudy,reportedbyVolppandcolleagues[115],thereweretwoincentivisedgroups:onegroupreceivedlotteryticketswhentheyreachedmonthlyweightlosstargets,whiletheotherreceivedsupplementarypaymentsafterthemselvesmakingasmallfinancialcommitmentattheoutset(depositcontractgroup).Abouthalfofthesubjectsinbothcontrolgroupsmetthe16lbweightlosstargetat4months,comparedwithonlyaround1-in-10ofthecontrolgroup.Bothinterventiongroupshadregainedweightattheendoftheintervention,althoughatthe7monthfollowuptheywerestillsignificantlylighteronaveragethanatthestartofthestudy(figure4.3).Sinceweightre-gainisanalmostuniversalfeatureofsuccessfulinitialweightreductionprogrammes,theresultsinthiscasedoraisequestionsoverhowlongparticipantswouldneedtobe‘incentivised’tomaintainahealthyweight.
Figure 4.2 Weightlossfromenrolmentthroughinterventionand7-monthfollowup[115]
60
Figure 4.3 Weight loss from enrolment through intervention and 7-month follow up [115]
SUMMARY Financial incentives – physical activity • The evidence around financial incentive schemes and physical activity is largely restricted to
particular population subgroups, such as older adults and is difficult to separate from weight loss
interventions.
• As with incentive work in other areas, long term behaviour change remains elusive and the
sustainability of any benefits remain uncertain.
Formatted: Bulleted + Level: 1 +Aligned at: 0 cm + Indent at: 0.63cm
Summary
Financialincentives–physicalactivity
• Theevidencearoundfinancialincentiveschemesandphysicalactivityislargelyrestrictedtoparticularpopulationsubgroups,suchasolderadultsandisdifficulttoseparatefromweightlossinterventions.
• Aswithincentiveworkinotherareas,longtermbehaviourchangeremainselusiveandthesustainabilityofanybenefitsuncertain.
(Source:Volppet al2008[115])
53
Chapter6
5 Chapter 5 – Interventions in the legislative environment
5.1 Introduction
TheoriginalANGELOframeworkforprioritisingobesityinterventionsdefinesthelegislative(policy)environmentas‘encompassingthesumtotalofrulesandregulationswhichdealwithallaspectsoffoodandphysicalactivity’[13].ArecentCanadiansystematicreviewwhichalsousedtheANGELOcategorisationframeworkwasnotabletoidentifyanymacro-levelstudiesinthelegislativedomain[18].Thisislikelytobemoreareflectionofthedearthofpublishableevaluationsmeetingpeerreviewqualitycriteria,ratherthananyabsenceofideasormotivationbygovernmentstoimplementsolutionstorisingpopulationlevelsofoverweightandobesity.IndeedtheUKGovernment’sHealthyWeight,HealthyLives(HWHL)document18canbeconsideredtohavegenuinelytakenupthechallengesetoutintheForesightReportandpresentsacross-governmentstrategyforEnglandwithfourmajorpriorityareasforaction(aschapterheadings):
1. Helpingpeoplemakehealthierchoices
2. Creatinganenvironmentthatpromoteshealthyweight
3. Effectiveservicesforthoseatrisk
4. Strengtheningdelivery(includingsurveillance).
Althoughthestrategyhasastrongchildfocus,thechapteroncreatinganenvironmentthatpromoteshealthyweighttouchesonmanyofthesameissuesasthisreport(e.g.foodlabellingatpointofsale,coveredinsection5.2andincreasingopportunitiesfordailyactivitydiscussedindetailinsection3.3).ThereissomepreliminaryevidencealsotosuggestthattheHWHLprogrammemaybehavingabeneficialimpact,althoughtheauthorsofaoneyearevaluationconcedethatitisearlydaysandsomeapparentlevellingoffinthepopulationprevalenceofobesitygivesnoroomforcomplacency19.TheSwedishMinistryofHealthalsorecentlysetoutacomprehensivesetofcostedpolicyproposalsacrossallsectorsofgovernment,aimedattacklingobesity[26],althoughtherehaveasyetbeennopublishedupdatesonimplementationorevaluationatthetimeofwriting.Across-governmentstrategyforScotlandhasalsobeenpublishedearlierthisyear.EntitledtheRouteMaptowardsHealthyWeight20,thestrategyadoptedtakesaleadfromtheForesightReportandspecificallyfocusesonobesityprevention.BoththeForesightReportandtheRouteMaparediscussedinmoredetailinchapter7.
Theevolutionofgovernments’perceptionsoftheobesityepidemic,awayfromwhatwasinitiallyalifestyleissue,towardsitslaterrecognitionasapublichealthproblemwithstrongculturalandeconomicdrivers,hadbeguntoinfluencethepolicyplanninglandscapearoundobesityprevention.Cruciallyfromalegislativeperspective,onceobesityisrecognisedasapublichealththreat,itbecomeslegitimatetoconsiderregulatorymeasuresthatmayimpactonthelivesofprivatecitizens,inananalogousmannertothewaythatthelawisusedfor
Chapter5
18 Healthy Weight, Healthy Lives: A Cross Government Strategy for England, Dept of Health; 2009: http://www.dh.gov.uk/en/Publicationsandstatistics/Publications/PublicationsPolicyAndGuidance/DH_082378
19 Healthy Weight, Healthy Lives: One Year On, Dept of Health; 2009: http://www.dh.gov.uk/en/Publicationsandstatistics/Publications/DH_097523
20 Preventing Overweight and Obesity in Scotland: A Route Map towards Healthy Weight. The Scottish Government; 2010. http://www.scotland.gov.uk/Publications/2010/02/17140721/
54
Policy Interventions to Tackle the Obesogenic Environment
thecontrolofcommunicablediseaseandrecentrestrictionsonsecondhandsmokinginpublicplacesarearelatedexample.Outrightsanctionsonbehaviourarenotfeasibleofcoursewitheitherdietorphysicalactivity,solegislativeinterventionsinthecaseofobesitypreventionneedtobedirectedatenvironmentalandstructuralenablers,suchasfinancialincentivesandtheimprovedavailabilityofhealthieralternativescombinedwithtargetedinformationapproaches.
5.2 Nutrition intervention (macro-level)
Atthemacro-levelofinfluence,thelegislativeenvironmentconcerningfoodreferstogovernmentfoodandnutritionpolicies,regulationsandlaws,andfoodindustrypracticesandstandards.Forthedevelopedwesternworldatleast,itisbecomingincreasinglyacceptedthatlegislationhasaroletoplayintacklingobesogenicaspectsofthenutritionenvironment[116].Legalsanctionscanpotentiallybeusedtocontrolcommercialfoodactivities,tomodifyphysicalandeconomicfactors(asdescribedinsections3and4),toregulatemediapractices(discussedinsection6)andtosupportinformedconsentbyrequiringtheprovisionofinformation.Thefourmacro-levellegislativeinterventionswhichhaveattractedthemostattentionandforwhichthereissomeevidencearoundtheirpotentialeffectivenessare:
(i) tradetariffs/restrictionsonspecificfooditemsoringredients
(ii) foodlabellingregulations
(iii) industrialandagriculturalpolicyframeworks
(iv)foodmarketingandadvertising(discussedinchapter6).
i. Trade tariffs/restrictions on specific food items or ingredients
Thepotentialforpricingcontrolsasameansofinfluencingpurchasingpatternshasalreadybeenexploredinrelationtosugaredbeverages(section4).Forcountrieswiththecapabilityandwillingnesstomakeuseofthem,tradetariffsandrestrictionscouldformthebasisofamuchbroader,proactiveapproachtoimprovepopulationdiets.Inprincipleforexample,traderestrictionscouldbeusedtoreducetheamountimported,orincreasethequalityofparticularfoodstuffs,dependingontheirrelative‘obesogenicity’.InthelightofFrenchandcolleagues’vending-machinestudiesdiscussedinchapter4,thereisalsothepossibilityofreducedimporttariffsforhealthierfoods,althoughtodatethishasnotbeenimplementedinanyknownjurisdiction[117].OneofthemostnotableexamplesofwheretraderegulationshaverecentlybeenusedtotryandreducesupplyatsourceistheattemptbythePacificIslandofFijitobanaparticulartypeofmeatimport(muttonflaps).Withover60%oftheadultpopulationeitheroverweightorobese,FijiistypicalamongPacificIslandcommunitiesinhavingamajorproblemwithchildhoodandadultobesity,aswellasepidemicleveldiabetes[118]andpoordietisacknowledgedtobeanimportantpartoftheexplanation.SincethePacificislandsnowimportmostoftheirfood,controllingwhatisavailableshouldinprinciplebestraightforwardandcheapfattymeatsfromNewZealandandAustraliawereanidentifiablecontributiontotheexcessivelyhighfatdietofFijians.Anattempttobanimportedmuttonflaps(seefigure5.1)in2000usingaprohibitionorderunderFairTradelegislation,hasonlybeenpartiallyeffective,sincewholecarcassescanstillbeimportedgivingimportersanotherrouteofentry.Themeasurewasalsochallengedasanunfairtraderestrictionsinceothersimilarlyhighfatmeatimportswerenottreatedsimilarly.Thecaseillustratesthecomplexityofusingtraderestrictionstocontrolfoodproducts.WhiletheWorldTradeOrganisation’sGATT21provisionsallowtrademeasurestobeadoptedthatare:‘necessarytoprotecthuman/animalhealth’,anysuchproposednewmeasuremustyetfulfilwhatisessentiallyaveryoneroustwostagetest,inwhichthetraderestrictingcountrymustbeabletodemonstratethat:
1. Thehealthmeasureisbotheffectiveandthatnolessrestrictivetrademeasure(s)couldbeusedtoachievethesamepublichealthpurpose
2. Theproposaldoesnotconstitutea‘disguisedrestriction’oninternationaltradeor‘arbitraryorunjustifiablediscrimination’.
21 General Agreement on Tariffs and Trade. World Trade Organization; 1994 http://www.wto.org/english/tratop_e/gatt_e/gatt_e.htm
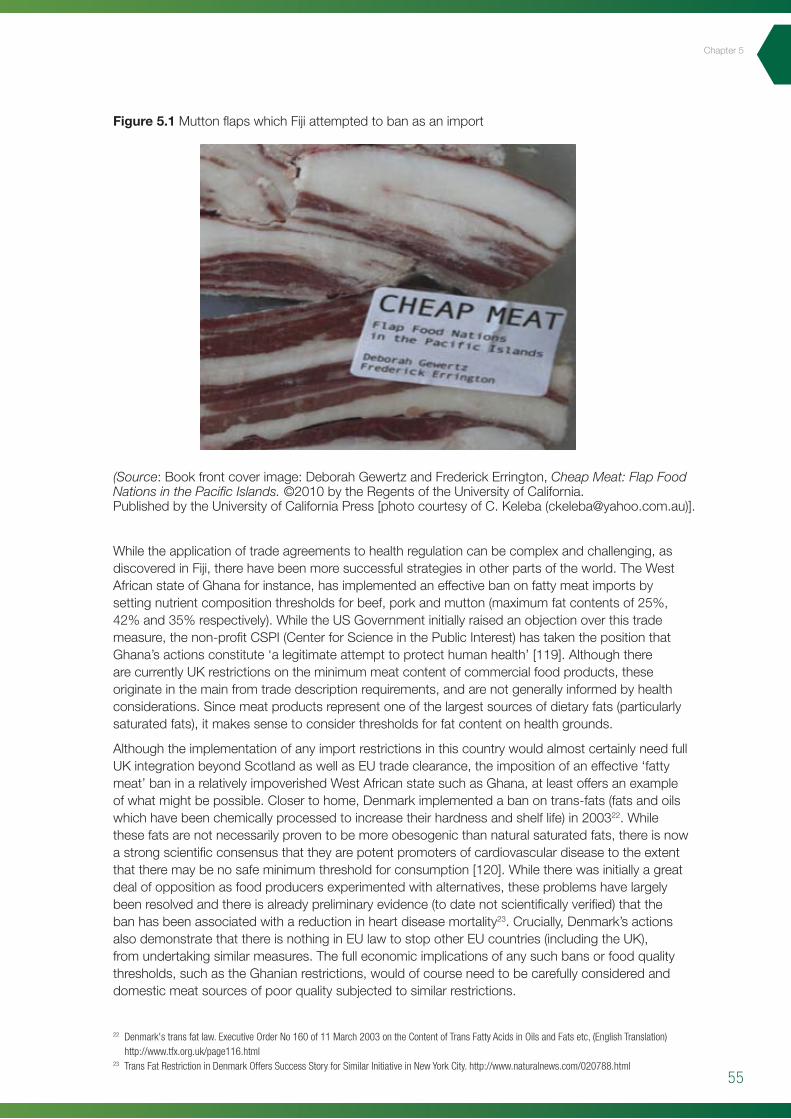
55
Chapter5
Figure 5.1 MuttonflapswhichFijiattemptedtobanasanimport
63
depending on their relative ‘obesogenicity’. In the light of French and colleagues’ vending-machine
studies discussed in chapter 4, there is also the possibility of reduced import tariffs for healthier
foods, although to date this has not been implemented in any known jurisdiction [117]. One of the
most notable examples of where trade regulations have recently been used to try and reduce supply
at source is the attempt by the Pacific Island of Fiji to ban a particular type of meat import (mutton
flaps). With over 60% of the adult population either overweight or obese, Fiji is typical among Pacific
Island communities in having a major problem with childhood and adult obesity, as well as epidemic
level diabetes [118] and poor diet is acknowledged to be an important part of the explanation. Since
the Pacific islands now import most of their food, controlling what is available should in principle be
straightforward and cheap fatty meats from New Zealand and Australia were an identifiable
contribution to the excessively high fat diet of Fijians. An attempt to ban imported mutton flaps (see
figure 5.1) in 2000 using a prohibition order under Fair Trade legislation, has only been partially
effective, since whole carcasses can still be imported giving importers another route of entry. The
measure was also challenged as an unfair trade restriction since other similarly high fat meat
imports were not treated similarly. The case illustrates the complexity of using trade restrictions to
control food products. While the World Trade Organisation’s GATT19
1. The health measure is both effective and that no less restrictive trade measure(s) could be
used to achieve the same public health purpose.
provisions allow trade
measures to be adopted that are: ‘necessary to protect human/animal health’, any such proposed
new measure must yet fulfil what is essentially a very onerous two stage test, in which the trade
restricting country must be able to demonstrate that:
2. The proposal does not constitute a ‘disguised restriction’ on international trade or ‘arbitrary
or unjustifiable discrimination’.
Figure 5.1 (Right) Mutton flaps which Fiji attempted to
ban as an import
While the application of trade agreements to health
regulation can be complex and challenging, as
discovered in Fiji, there have been more successful
strategies in other parts of the world. The West African
19 General Agreement on Tariffs and Trade. World Trade Organization; 1994 http://www.wto.org/english/tratop_e/gatt_e/gatt_e.htm
Whiletheapplicationoftradeagreementstohealthregulationcanbecomplexandchallenging,asdiscoveredinFiji,therehavebeenmoresuccessfulstrategiesinotherpartsoftheworld.TheWestAfricanstateofGhanaforinstance,hasimplementedaneffectivebanonfattymeatimportsbysettingnutrientcompositionthresholdsforbeef,porkandmutton(maximumfatcontentsof25%,42%and35%respectively).WhiletheUSGovernmentinitiallyraisedanobjectionoverthistrademeasure,thenon-profitCSPI(CenterforScienceinthePublicInterest)hastakenthepositionthatGhana’sactionsconstitute‘alegitimateattempttoprotecthumanhealth’[119].AlthoughtherearecurrentlyUKrestrictionsontheminimummeatcontentofcommercialfoodproducts,theseoriginateinthemainfromtradedescriptionrequirements,andarenotgenerallyinformedbyhealthconsiderations.Sincemeatproductsrepresentoneofthelargestsourcesofdietaryfats(particularlysaturatedfats),itmakessensetoconsiderthresholdsforfatcontentonhealthgrounds.
AlthoughtheimplementationofanyimportrestrictionsinthiscountrywouldalmostcertainlyneedfullUKintegrationbeyondScotlandaswellasEUtradeclearance,theimpositionofaneffective‘fattymeat’baninarelativelyimpoverishedWestAfricanstatesuchasGhana,atleastoffersanexampleofwhatmightbepossible.Closertohome,Denmarkimplementedabanontrans-fats(fatsandoilswhichhavebeenchemicallyprocessedtoincreasetheirhardnessandshelflife)in200322.Whilethesefatsarenotnecessarilyproventobemoreobesogenicthannaturalsaturatedfats,thereisnowastrongscientificconsensusthattheyarepotentpromotersofcardiovasculardiseasetotheextentthattheremaybenosafeminimumthresholdforconsumption[120].Whiletherewasinitiallyagreatdealofoppositionasfoodproducersexperimentedwithalternatives,theseproblemshavelargelybeenresolvedandthereisalreadypreliminaryevidence(todatenotscientificallyverified)thatthebanhasbeenassociatedwithareductioninheartdiseasemortality23.Crucially,Denmark’sactionsalsodemonstratethatthereisnothinginEUlawtostopotherEUcountries(includingtheUK),fromundertakingsimilarmeasures.Thefulleconomicimplicationsofanysuchbansorfoodqualitythresholds,suchastheGhanianrestrictions,wouldofcourseneedtobecarefullyconsideredanddomesticmeatsourcesofpoorqualitysubjectedtosimilarrestrictions.
22 Denmark's trans fat law. Executive Order No 160 of 11 March 2003 on the Content of Trans Fatty Acids in Oils and Fats etc, (English Translation) http://www.tfx.org.uk/page116.html
23 Trans Fat Restriction in Denmark Offers Success Story for Similar Initiative in New York City. http://www.naturalnews.com/020788.html
(Source:Bookfrontcoverimage:DeborahGewertzandFrederickErrington,Cheap Meat: Flap Food Nations in the Pacific Islands.©2010bytheRegentsoftheUniversityofCalifornia.PublishedbytheUniversityofCaliforniaPress[photocourtesyofC.Keleba([email protected])].
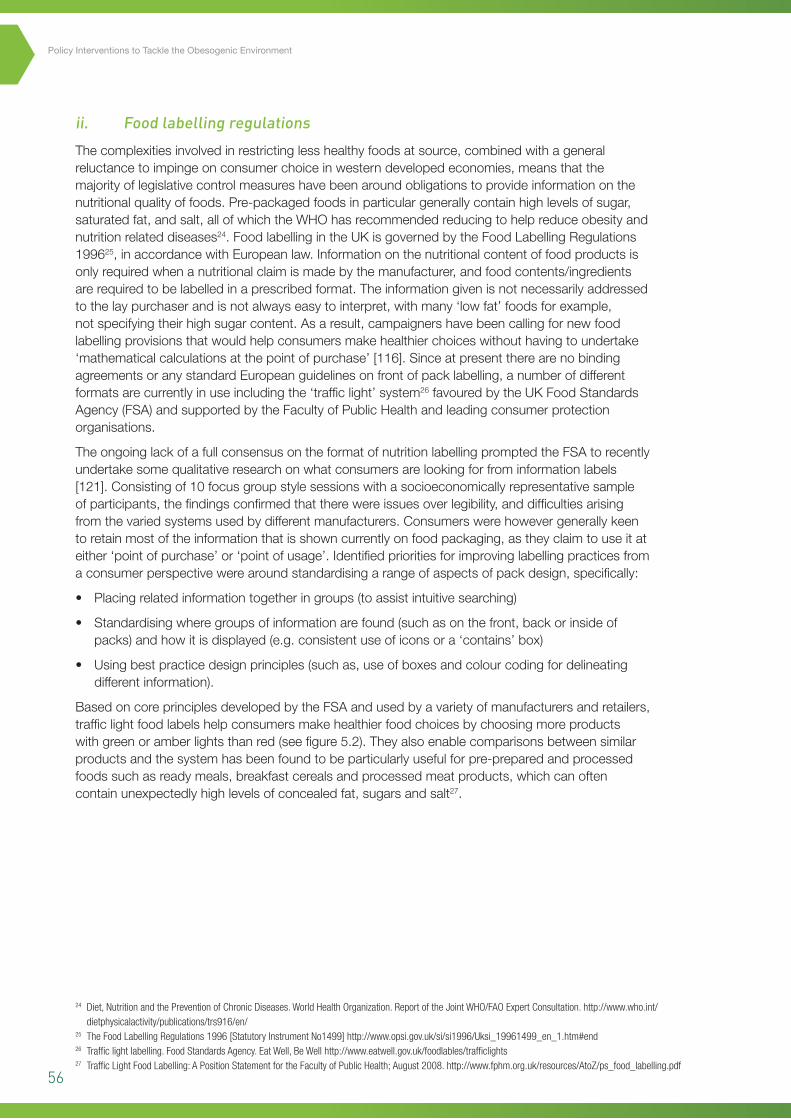
56
Policy Interventions to Tackle the Obesogenic Environment
ii. Food labelling regulations
Thecomplexitiesinvolvedinrestrictinglesshealthyfoodsatsource,combinedwithageneralreluctancetoimpingeonconsumerchoiceinwesterndevelopedeconomies,meansthatthemajorityoflegislativecontrolmeasureshavebeenaroundobligationstoprovideinformationonthenutritionalqualityoffoods.Pre-packagedfoodsinparticulargenerallycontainhighlevelsofsugar,saturatedfat,andsalt,allofwhichtheWHOhasrecommendedreducingtohelpreduceobesityandnutritionrelateddiseases24.FoodlabellingintheUKisgovernedbytheFoodLabellingRegulations199625,inaccordancewithEuropeanlaw.Informationonthenutritionalcontentoffoodproductsisonlyrequiredwhenanutritionalclaimismadebythemanufacturer,andfoodcontents/ingredientsarerequiredtobelabelledinaprescribedformat.Theinformationgivenisnotnecessarilyaddressedtothelaypurchaserandisnotalwayseasytointerpret,withmany‘lowfat’foodsforexample,notspecifyingtheirhighsugarcontent.Asaresult,campaignershavebeencallingfornewfoodlabellingprovisionsthatwouldhelpconsumersmakehealthierchoiceswithouthavingtoundertake‘mathematicalcalculationsatthepointofpurchase’[116].SinceatpresenttherearenobindingagreementsoranystandardEuropeanguidelinesonfrontofpacklabelling,anumberofdifferentformatsarecurrentlyinuseincludingthe‘trafficlight’system26favouredbytheUKFoodStandardsAgency(FSA)andsupportedbytheFacultyofPublicHealthandleadingconsumerprotectionorganisations.
TheongoinglackofafullconsensusontheformatofnutritionlabellingpromptedtheFSAtorecentlyundertakesomequalitativeresearchonwhatconsumersarelookingforfrominformationlabels[121].Consistingof10focusgroupstylesessionswithasocioeconomicallyrepresentativesampleofparticipants,thefindingsconfirmedthattherewereissuesoverlegibility,anddifficultiesarisingfromthevariedsystemsusedbydifferentmanufacturers.Consumerswerehowevergenerallykeentoretainmostoftheinformationthatisshowncurrentlyonfoodpackaging,astheyclaimtouseitateither‘pointofpurchase’or‘pointofusage’.Identifiedprioritiesforimprovinglabellingpracticesfromaconsumerperspectivewerearoundstandardisingarangeofaspectsofpackdesign,specifically:
• Placingrelatedinformationtogetheringroups(toassistintuitivesearching)
• Standardisingwheregroupsofinformationarefound(suchasonthefront,backorinsideofpacks)andhowitisdisplayed(e.g.consistentuseoficonsora‘contains’box)
• Usingbestpracticedesignprinciples(suchas,useofboxesandcolourcodingfordelineatingdifferentinformation).
BasedoncoreprinciplesdevelopedbytheFSAandusedbyavarietyofmanufacturersandretailers,trafficlightfoodlabelshelpconsumersmakehealthierfoodchoicesbychoosingmoreproductswithgreenoramberlightsthanred(seefigure5.2).Theyalsoenablecomparisonsbetweensimilarproductsandthesystemhasbeenfoundtobeparticularlyusefulforpre-preparedandprocessedfoodssuchasreadymeals,breakfastcerealsandprocessedmeatproducts,whichcanoftencontainunexpectedlyhighlevelsofconcealedfat,sugarsandsalt27.
24 Diet, Nutrition and the Prevention of Chronic Diseases. World Health Organization. Report of the Joint WHO/FAO Expert Consultation. http://www.who.int/dietphysicalactivity/publications/trs916/en/
25 The Food Labelling Regulations 1996 [Statutory Instrument No1499] http://www.opsi.gov.uk/si/si1996/Uksi_19961499_en_1.htm#end26 Traffic light labelling. Food Standards Agency. Eat Well, Be Well http://www.eatwell.gov.uk/foodlables/trafficlights27 Traffic Light Food Labelling: A Position Statement for the Faculty of Public Health; August 2008. http://www.fphm.org.uk/resources/AtoZ/ps_food_labelling.pdf
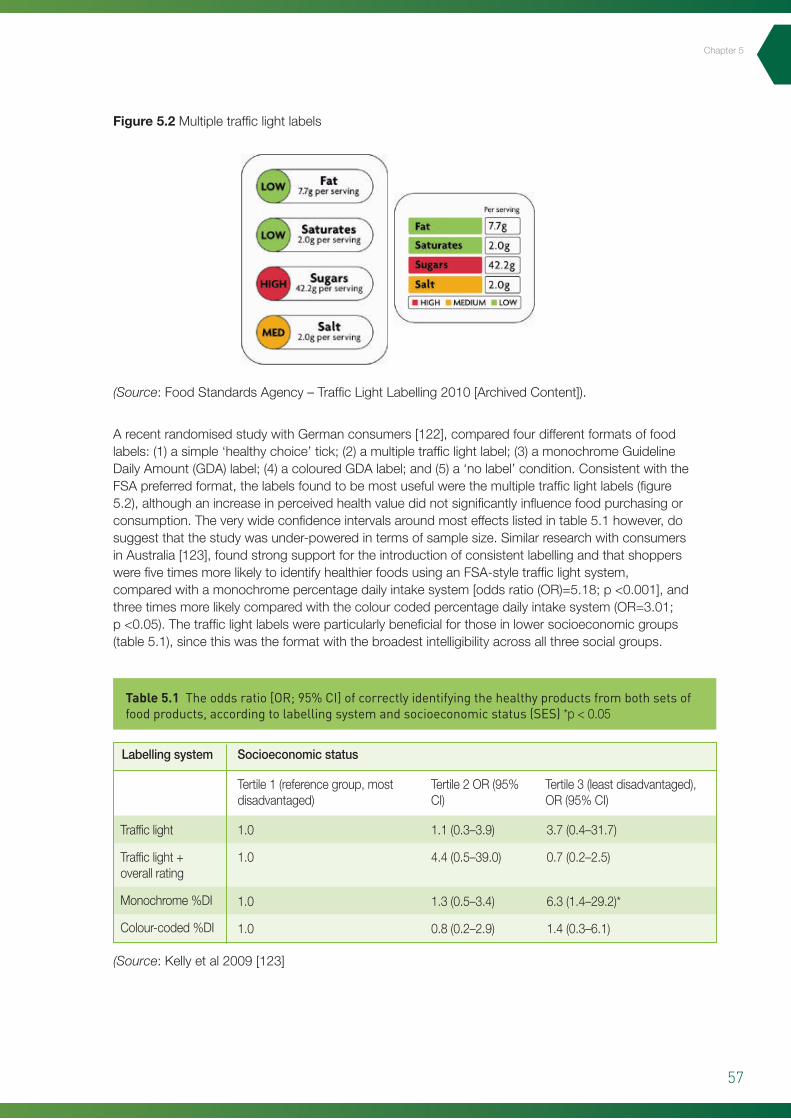
57
Chapter5
Figure 5.2 Multipletrafficlightlabels
ArecentrandomisedstudywithGermanconsumers[122],comparedfourdifferentformatsoffoodlabels:(1)asimple‘healthychoice’tick;(2)amultipletrafficlightlabel;(3)amonochromeGuidelineDailyAmount(GDA)label;(4)acolouredGDAlabel;and(5)a‘nolabel’condition.ConsistentwiththeFSApreferredformat,thelabelsfoundtobemostusefulwerethemultipletrafficlightlabels(figure5.2),althoughanincreaseinperceivedhealthvaluedidnotsignificantlyinfluencefoodpurchasingorconsumption.Theverywideconfidenceintervalsaroundmosteffectslistedintable5.1however,dosuggestthatthestudywasunder-poweredintermsofsamplesize.SimilarresearchwithconsumersinAustralia[123],foundstrongsupportfortheintroductionofconsistentlabellingandthatshopperswerefivetimesmorelikelytoidentifyhealthierfoodsusinganFSA-styletrafficlightsystem,comparedwithamonochromepercentagedailyintakesystem[oddsratio(OR)=5.18;p<0.001],andthreetimesmorelikelycomparedwiththecolourcodedpercentagedailyintakesystem(OR=3.01;p<0.05).Thetrafficlightlabelswereparticularlybeneficialforthoseinlowersocioeconomicgroups(table5.1),sincethiswastheformatwiththebroadestintelligibilityacrossallthreesocialgroups.
Table 5.1 The odds ratio [OR; 95% CI] of correctly identifying the healthy products from both sets of food products, according to labelling system and socioeconomic status (SES) *p<0.05
Trafficlight
Trafficlight+overallrating
Monochrome%DI
Colour-coded%DI
1.0
1.0
1.0
1.0
Tertile1(referencegroup,mostdisadvantaged)
Labellingsystem Socioeconomicstatus
Tertile2OR(95%CI)
Tertile3(leastdisadvantaged),OR(95%CI)
1.1(0.3–3.9)
4.4(0.5–39.0)
1.3(0.5–3.4)
0.8(0.2–2.9)
3.7(0.4–31.7)
0.7(0.2–2.5)
6.3(1.4–29.2)*
1.4(0.3–6.1)
(Source:Kellyetal2009[123]
(Source:FoodStandardsAgency–TrafficLightLabelling2010[ArchivedContent]).
58
Policy Interventions to Tackle the Obesogenic Environment
Fromapublichealthperspectiveofcourse,thecasefortrafficlightlabelswouldbemostsupportedbyevidenceofanimpactonpurchasingbehaviourtowardshealthierproducts,whichtodatehasbeenconfinedtoretailindustrysourcesandanecdotalreports[124].Arecentshort-termquasi-experimentalstudyinvolvingamajorUKretailer,andfocusingonsandwichesandreadymeals,soughttoexaminewhethertheintroductionoftrafficlightfoodlabellingwouldhaveanydiscernableeffectonpurchasing[125].Whilethereweresmallbutstatisticallysignificantincreasesinpurchasesoftheselectedreadymeals,therewasnochangeinsandwichsales.Morecritically,therewasnoassociationbetweenchangesinproductsalesandtherelativehealthmeritsoftheproducts.Whileitcouldbearguedthatthefourweekinterventionwastoolimitedindurationandthattheresultsmighthavebeenbetterhadamorecomprehensiverangeofproductsbeenincluded,thefindingsareneverthelessconsistentwiththeGermanandAustralianstudies[122,123]andwouldtendtosuggestthatprovidingmoreintelligiblehealthinformationaloneisnotaparticularlyeffectivemeansofinfluencingcustomerbehaviour.
Evidencethattrafficlightlabellingformatsencouragemanufacturerstoreformulateproducts,inorderthattheyqualifyformoreamberandgreensymbols,wasuntilrecentlyconfinedtoindustrysources[126].ArecentlypublishedpersuasivereportfromtheNetherlandshoweverwasabletodocumentfavourableproductmodifications(particularlywithregardtofibreandsalt)inresponsetoalabellingscheme[127].AneditorialinTheGrocer(amajortradepublicationforfoodmanufacturersandretailers),waslessencouragingandhighlightedthelackofameasurableinfluenceonpurchasingbehaviourasareasonforabandoningthetrafficlightschemealtogether28.Withouttheauthoritytomandatetheirpreferredmodel,theFSAinalllikelihoodhadnoalternativeotherthantoadoptapragmaticcoursewithmajorretailersandmanufacturersandacceptthatsomewouldusetheirownpreferredformat.AnEUParliamentproposalforaEuropeanwidemandatetointroducecompulsorytrafficlightlabellingwasalsodefeatedinJuneofthisyear,mainlyasaresultofintenselobbyingfromfoodcompanies29.Apublishedcosteffectivenessanalysisfromahealthcareperspectivehoweverfoundthatevenmodestchangesinbuyingbehaviourthatresultedfromtrafficlightstylelabellingwouldofferexcellentvalueformoney[128].
Sincethetrafficlightlabellingsystemisnowinternationallyacknowledgedasthe‘goldstandard’forpromotingsociallyequitableconsumerawareness(basedonstudieslikethosecitedabove),thedefeatofthepolicyhasbeendescribedasaretrogradestepbyconsumergroups30.Infairnesshowever,itshouldbepointedoutthatanumberofUKretailershaveinfactintroducedfrontofpacktrafficlightstylelabellingasstandard,includingseverallargesupermarketchains.Thenatureoftheevidencehighlightsalsothatfrontofpacklabellingisonlylikelytobeeffectiveininfluencingactualpurchasingbehaviour,ifintroducedaspartofapackageofinterventions,suchasthepricingandsocialmarketingstrategiesreferredtoinchapter4.
iii. Industrial and agricultural policy frameworks
Nutritionexpertsgenerallyagreethatminimallyprocessedfoodshelpprotectagainstobesitybyvirtueoftheirlowerenergycomparedtotheirmorerefinedandprocessedequivalents[48].Industryprofitmarginsontheotherhand,arefargreaterfromhighlyprocessed,commodityderivedproductssuchassnackfoodsandbeverageswhichareprimarilycomposedofrefinedstarch,concentratedsugarsandlowqualityfats.Thesecheapfoodstuffsaremadeevenmoreinexpensivebysubstantialagriculturalsubsidiesatthenationallevel(seenextparagraph).Obesitypreventionmessagestherefore,suchascallstoeatlessoften,eatsmallerportions,andavoidhighcaloriefoodsoflow-nutritionalquality,effectivelyunderminethefundamentalbusinessmodelofmostofthecommercialfoodindustry[129].Whilethereareenlightenedfoodcompanies,societycannotgenerallyexpect
28 So consumers ignore healthy-eating labels – and get slimmer anyway. The Grocer (Editorial) Nov 2009. http://www.thegrocer.co.uk/articles.aspx?page=articles&ID=204860
29 MEPs Reject Traffic Light Scheme for Food Products. The Parliament.com (EU); June 2010 http://www.theparliament.com/latest-news/article/newsarticle/meps-reject-traffic-light-scheme-for-food-products/
30 Industry Lobbying Sees EU Reject 'Traffic Light' Food Labelling. The Ecologist; 17 June 2010. http://www.theecologist.org/News/news_round_up/511976/industry_lobbying_sees_eu_reject_traffic_light_food_labelling.html
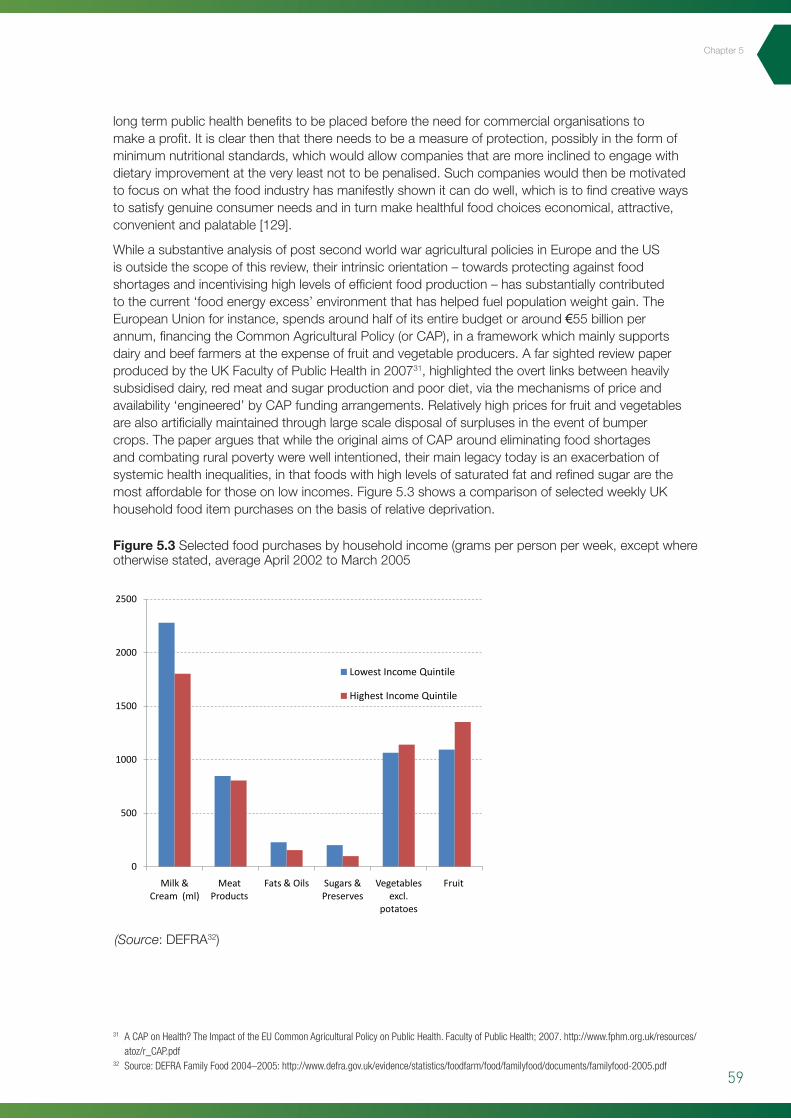
59
longtermpublichealthbenefitstobeplacedbeforetheneedforcommercialorganisationstomakeaprofit.Itisclearthenthatthereneedstobeameasureofprotection,possiblyintheformofminimumnutritionalstandards,whichwouldallowcompaniesthataremoreinclinedtoengagewithdietaryimprovementattheveryleastnottobepenalised.Suchcompanieswouldthenbemotivatedtofocusonwhatthefoodindustryhasmanifestlyshownitcandowell,whichistofindcreativewaystosatisfygenuineconsumerneedsandinturnmakehealthfulfoodchoiceseconomical,attractive,convenientandpalatable[129].
WhileasubstantiveanalysisofpostsecondworldwaragriculturalpoliciesinEuropeandtheUSisoutsidethescopeofthisreview,theirintrinsicorientation–towardsprotectingagainstfoodshortagesandincentivisinghighlevelsofefficientfoodproduction–hassubstantiallycontributedtothecurrent‘foodenergyexcess’environmentthathashelpedfuelpopulationweightgain.TheEuropeanUnionforinstance,spendsaroundhalfofitsentirebudgetoraround€55billionperannum,financingtheCommonAgriculturalPolicy(orCAP),inaframeworkwhichmainlysupportsdairyandbeeffarmersattheexpenseoffruitandvegetableproducers.AfarsightedreviewpaperproducedbytheUKFacultyofPublicHealthin200731,highlightedtheovertlinksbetweenheavilysubsidiseddairy,redmeatandsugarproductionandpoordiet,viathemechanismsofpriceandavailability‘engineered’byCAPfundingarrangements.Relativelyhighpricesforfruitandvegetablesarealsoartificiallymaintainedthroughlargescaledisposalofsurplusesintheeventofbumpercrops.ThepaperarguesthatwhiletheoriginalaimsofCAParoundeliminatingfoodshortagesandcombatingruralpovertywerewellintentioned,theirmainlegacytodayisanexacerbationofsystemichealthinequalities,inthatfoodswithhighlevelsofsaturatedfatandrefinedsugararethemostaffordableforthoseonlowincomes.Figure5.3showsacomparisonofselectedweeklyUKhouseholdfooditempurchasesonthebasisofrelativedeprivation.
Figure 5.3 Selectedfoodpurchasesbyhouseholdincome(gramsperpersonperweek,exceptwhereotherwisestated,averageApril2002toMarch2005
(Source:DEFRA32)
31 A CAP on Health? The Impact of the EU Common Agricultural Policy on Public Health. Faculty of Public Health; 2007. http://www.fphm.org.uk/resources/atoz/r_CAP.pdf
32 Source: DEFRA Family Food 2004–2005: http://www.defra.gov.uk/evidence/statistics/foodfarm/food/familyfood/documents/familyfood-2005.pdf
Chapter5
0
500
1000
1500
2000
2500
Milk & Cream (ml)
Meat Products
Fats & Oils Sugars & Preserves
Vegetables excl.
potatoes
Fruit
Lowest Income Quintile
Highest Income Quintile
60
Policy Interventions to Tackle the Obesogenic Environment
Thefacultydiscussionpaperarguesthatbyimplication,hundredsofthousandsofprematuredeathsacrosstheEUcouldbelinkedtotheadverseeffectsofCAPsubsidiesandthatthereisapressingneedforreformofthepolicy,ifdietsaretobegenuinelyimprovedandcontributelessovertlytopopulationweightgain.TheirsummaryrecommendationstoEUpolicymakerswere:
• reducesubsidiesforbeefwhileencouragingmoreleanbeefproduction
• reducesubsidiesfordairyproductsandconvertexcessdairyfatintoindustrialproductssuchasfuelandlubricants,ratherthanfoodproducts
• ensureonlylowfatdairyproductsaresubsidisedforthe‘notforprofit’sector
• increasetheproductionofmonounsaturatedandpolyunsaturatedvegetableoils
• makegreateruseofCAPsubsidiestoincentivisetheproductionoffruitandvegetables
• increasetheavailabilityoffruitandvegetablestothe‘notforprofit’sectorthroughsubsidies
• continuetoencouragecerealgrowerssectortoproducemoreunrefinedfoodforhumanconsumption.
Obviouslythesemeasuresneedtobeseenaspartofalongtermstrategyandsubstantialconsiderationwouldhavetobegiventowardsminimisingthedisruptiontoruraleconomies,ensuringfoodsafety,facilitatingsustainableproductionandpreventinganimalcruelty.ThemeansbywhichScotlandcouldbestinfluenceEU-widepolicywouldalsobequestionable,wereitnotforthefactthattherestoftheUKandallEUcountries(aswellastherestofthedevelopedworld)are,toagreaterorlesserdegree,seeingthesameadverseimpactsofagriculturalpoliciesdesignedaroundprioritiesthatwereoriginallysetinthemiddleofthelastcentury.Thefutilityofexhortingpopulationstoeatmorehealthily,whenthewholesystemofEUandworldfoodproductionisaimingsquarelyintheotherdirection,isdifficulttooverlook.Inordertobecredibletherefore,anygovernmentapproachtoobesitypreventionneedsattheveryleasttobemindfuloftheadverseeffectsofdominantagriculturalpolicies.Asasignificantfoodanddrinkexporter,Scotlandshouldbeabletocontributetotheinternationaldebatearoundreformingagribusinesstradeagreements.SomecommentatorsforinstancehavelookedatthecaseforreducingEUsubsidiesasameansofbringingtheEUmoreintolinewiththefreetradeprinciplesofGATT[130].
5.3 Nutrition intervention (micro-level)
Asoutlinedin5.2,tacklingtheobesogenicfoodenvironmentatthenationallevelwillnecessarilyinvolvesomefundamentalchallengestothewayfoodstuffsarecurrentlydistributedandsold.ThereisalsothequestionoftheextenttowhichScotlandwouldbeabletoactindependentlyoftheUKonsuchmatters,eveniftherewasastrongpoliticalwilltodoso.Justaswitheconomicinterventionshowever,thereiscertainlyscopeformicro-legislativeinterventionsinthemoreself-containedenvironmentsinwhichpeoplespendmuchoftheirdailylives,namelyeducationalestablishmentsandworkplaces.Cateringwithinthepublicsector,particularlyincountrieslikeScotland,wherepublicemployeesaccountforarelativelyhighproportionoftheworkforce,presentsaperfectopportunitytodemonstratethatitcanbepossibletoeathealthilyonamodestdiet.NHSassociatedinformationcampaignsonhealthyeatingwillalsocarrymorecredibilityifhospitalsitecanteensandeatingpremisesarerecognisedforgoodqualitybalancedmeals33.Commercialcateringpremises(hotels,restaurantsandtakeaways)arealsosignificantlyregulatedbylocalenvironmentalhealthdepartmentsandanexpandedconceptoffoodsafetytoincorporate‘obesogenicity’couldintheorybelocallyenforceable.ThisisanapproachwhichhasbeenusedsuccessfullyinNewYorkandCaliforniawhereallcateringestablishmentsarenowrequiredtodisplaycalorieinformationatthepointofsaleandthereareplanstoextendasimilarrequirementacrossthewholeoftheUS34.Thissectionwillsummarisetheprogressofsuchmicro-legislativeapproacheswheretheyhavebeenused,andexplorewhatmightbethebestoptionstotakeforwardinaScottishcontext.Sinceworkplacenutritioninterventionshavealreadybeendiscussedinchapter4,theemphasisherewillbeonthepotentialforactionaroundcommercialfoodcaterersandoutlets.
33 Hospital Restaurant Scoops National Healthy Eating Award. News release. Scottish Consumers Council; April 2007. http://www.healthylivingaward.co.uk/press%20releases/hairmyrespr.pdf
34 Calorie Data to Be Posted at Most Chains. The New York Times (Business); Mar 2010 http://www.nytimes.com/2010/03/24/business/24menu.html
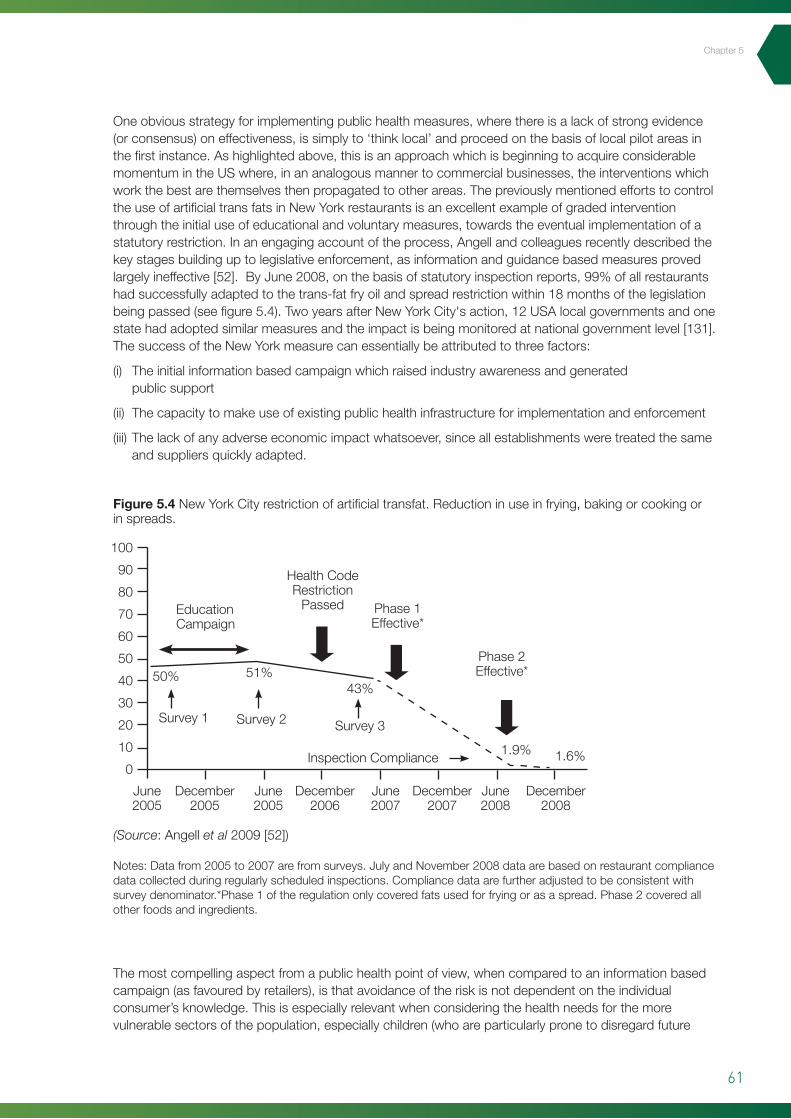
61
Chapter5
Oneobviousstrategyforimplementingpublichealthmeasures,wherethereisalackofstrongevidence(orconsensus)oneffectiveness,issimplyto‘thinklocal’andproceedonthebasisoflocalpilotareasinthefirstinstance.Ashighlightedabove,thisisanapproachwhichisbeginningtoacquireconsiderablemomentumintheUSwhere,inananalogousmannertocommercialbusinesses,theinterventionswhichworkthebestarethemselvesthenpropagatedtootherareas.ThepreviouslymentionedeffortstocontroltheuseofartificialtransfatsinNewYorkrestaurantsisanexcellentexampleofgradedinterventionthroughtheinitialuseofeducationalandvoluntarymeasures,towardstheeventualimplementationofastatutoryrestriction.Inanengagingaccountoftheprocess,Angellandcolleaguesrecentlydescribedthekeystagesbuildinguptolegislativeenforcement,asinformationandguidancebasedmeasuresprovedlargelyineffective[52].ByJune2008,onthebasisofstatutoryinspectionreports,99%ofallrestaurantshadsuccessfullyadaptedtothetrans-fatfryoilandspreadrestrictionwithin18monthsofthelegislationbeingpassed(seefigure5.4).TwoyearsafterNewYorkCity'saction,12USAlocalgovernmentsandonestatehadadoptedsimilarmeasuresandtheimpactisbeingmonitoredatnationalgovernmentlevel[131].ThesuccessoftheNewYorkmeasurecanessentiallybeattributedtothreefactors:
(i) Theinitialinformationbasedcampaignwhichraisedindustryawarenessandgeneratedpublicsupport
(ii) Thecapacitytomakeuseofexistingpublichealthinfrastructureforimplementationandenforcement
(iii)Thelackofanyadverseeconomicimpactwhatsoever,sinceallestablishmentsweretreatedthesameandsuppliersquicklyadapted.
Themostcompellingaspectfromapublichealthpointofview,whencomparedtoaninformationbasedcampaign(asfavouredbyretailers),isthatavoidanceoftheriskisnotdependentontheindividualconsumer’sknowledge.Thisisespeciallyrelevantwhenconsideringthehealthneedsforthemorevulnerablesectorsofthepopulation,especiallychildren(whoareparticularlypronetodisregardfuture
Figure 5.4 NewYorkCityrestrictionofartificialtransfat.Reductioninuseinfrying,bakingorcookingorinspreads.
Notes:Datafrom2005to2007arefromsurveys.JulyandNovember2008dataarebasedonrestaurantcompliancedatacollectedduringregularlyscheduledinspections.Compliancedataarefurtheradjustedtobeconsistentwithsurveydenominator.*Phase1oftheregulationonlycoveredfatsusedforfryingorasaspread.Phase2coveredallotherfoodsandingredients.
100
90
80
70
60
50
40
30
20
10
0
June2005
December2005
December2006
December2007
December2008
June2005
June2007
June2008
EducationCampaign
HealthCodeRestrictionPassed Phase1
Effective*
Phase2Effective*
Survey1 Survey2 Survey3
InspectionCompliance
50% 51%43%
1.9% 1.6%
(Source:Angellet al2009[52])
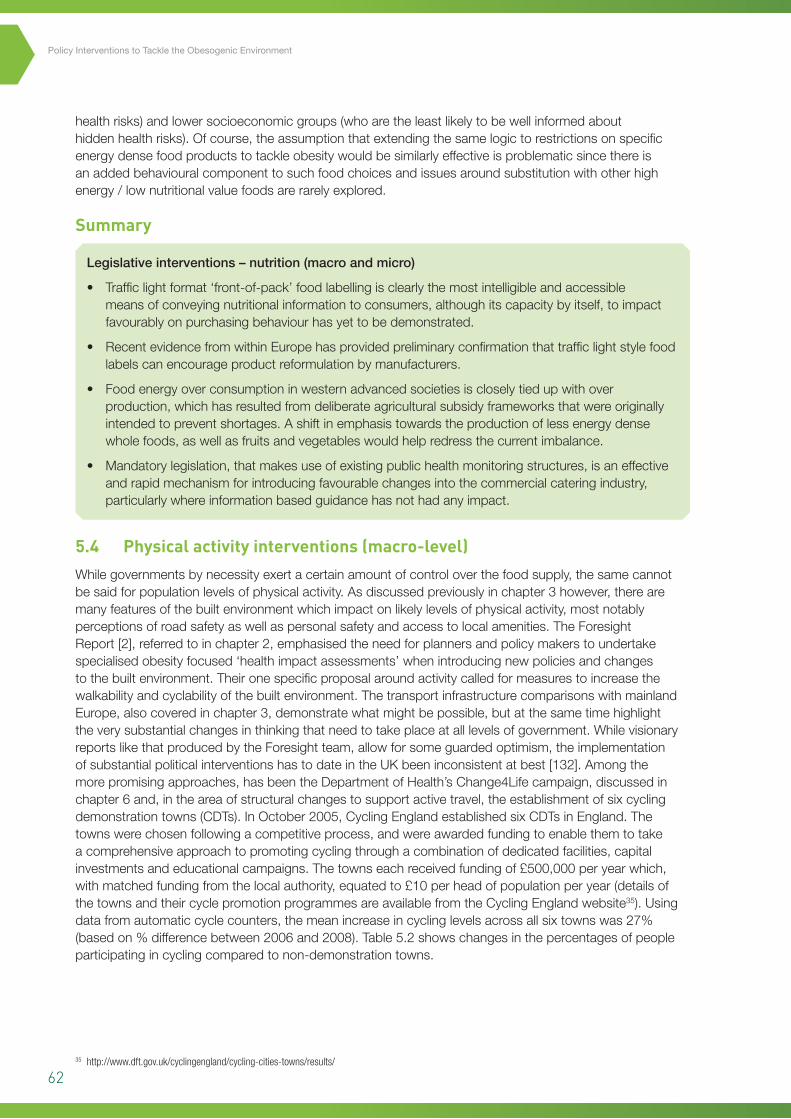
62
Policy Interventions to Tackle the Obesogenic Environment
healthrisks)andlowersocioeconomicgroups(whoaretheleastlikelytobewellinformedabouthiddenhealthrisks).Ofcourse,theassumptionthatextendingthesamelogictorestrictionsonspecificenergydensefoodproductstotackleobesitywouldbesimilarlyeffectiveisproblematicsincethereisanaddedbehaviouralcomponenttosuchfoodchoicesandissuesaroundsubstitutionwithotherhighenergy/lownutritionalvaluefoodsarerarelyexplored.
Summary
Legislativeinterventions–nutrition(macroandmicro)
• Trafficlightformat‘front-of-pack’foodlabellingisclearlythemostintelligibleandaccessiblemeansofconveyingnutritionalinformationtoconsumers,althoughitscapacitybyitself,toimpactfavourablyonpurchasingbehaviourhasyettobedemonstrated.
• RecentevidencefromwithinEuropehasprovidedpreliminaryconfirmationthattrafficlightstylefoodlabelscanencourageproductreformulationbymanufacturers.
• Foodenergyoverconsumptioninwesternadvancedsocietiesiscloselytiedupwithoverproduction,whichhasresultedfromdeliberateagriculturalsubsidyframeworksthatwereoriginallyintendedtopreventshortages.Ashiftinemphasistowardstheproductionoflessenergydensewholefoods,aswellasfruitsandvegetableswouldhelpredressthecurrentimbalance.
• Mandatorylegislation,thatmakesuseofexistingpublichealthmonitoringstructures,isaneffectiveandrapidmechanismforintroducingfavourablechangesintothecommercialcateringindustry,particularlywhereinformationbasedguidancehasnothadanyimpact.
5.4 Physical activity interventions (macro-level)
Whilegovernmentsbynecessityexertacertainamountofcontroloverthefoodsupply,thesamecannotbesaidforpopulationlevelsofphysicalactivity.Asdiscussedpreviouslyinchapter3however,therearemanyfeaturesofthebuiltenvironmentwhichimpactonlikelylevelsofphysicalactivity,mostnotablyperceptionsofroadsafetyaswellaspersonalsafetyandaccesstolocalamenities.TheForesightReport[2],referredtoinchapter2,emphasisedtheneedforplannersandpolicymakerstoundertakespecialisedobesityfocused‘healthimpactassessments’whenintroducingnewpoliciesandchangestothebuiltenvironment.Theironespecificproposalaroundactivitycalledformeasurestoincreasethewalkabilityandcyclabilityofthebuiltenvironment.ThetransportinfrastructurecomparisonswithmainlandEurope,alsocoveredinchapter3,demonstratewhatmightbepossible,butatthesametimehighlighttheverysubstantialchangesinthinkingthatneedtotakeplaceatalllevelsofgovernment.WhilevisionaryreportslikethatproducedbytheForesightteam,allowforsomeguardedoptimism,theimplementationofsubstantialpoliticalinterventionshastodateintheUKbeeninconsistentatbest[132].Amongthemorepromisingapproaches,hasbeentheDepartmentofHealth’sChange4Lifecampaign,discussedinchapter6and,intheareaofstructuralchangestosupportactivetravel,theestablishmentofsixcyclingdemonstrationtowns(CDTs).InOctober2005,CyclingEnglandestablishedsixCDTsinEngland.Thetownswerechosenfollowingacompetitiveprocess,andwereawardedfundingtoenablethemtotakeacomprehensiveapproachtopromotingcyclingthroughacombinationofdedicatedfacilities,capitalinvestmentsandeducationalcampaigns.Thetownseachreceivedfundingof£500,000peryearwhich,withmatchedfundingfromthelocalauthority,equatedto£10perheadofpopulationperyear(detailsofthetownsandtheircyclepromotionprogrammesareavailablefromtheCyclingEnglandwebsite35).Usingdatafromautomaticcyclecounters,themeanincreaseincyclinglevelsacrossallsixtownswas27%(basedon%differencebetween2006and2008).Table5.2showschangesinthepercentagesofpeopleparticipatingincyclingcomparedtonon-demonstrationtowns.
35 http://www.dft.gov.uk/cyclingengland/cycling-cities-towns/results/
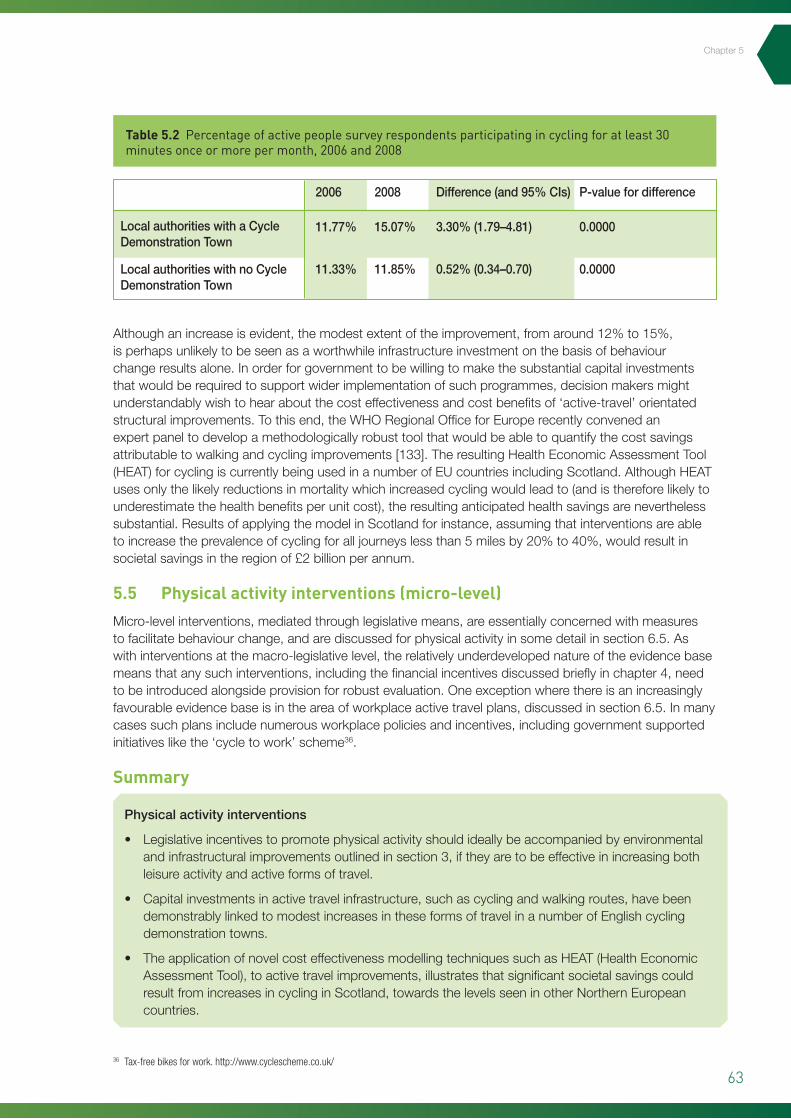
63
Chapter5
Althoughanincreaseisevident,themodestextentoftheimprovement,fromaround12%to15%,isperhapsunlikelytobeseenasaworthwhileinfrastructureinvestmentonthebasisofbehaviourchangeresultsalone.Inorderforgovernmenttobewillingtomakethesubstantialcapitalinvestmentsthatwouldberequiredtosupportwiderimplementationofsuchprogrammes,decisionmakersmightunderstandablywishtohearaboutthecosteffectivenessandcostbenefitsof‘active-travel’orientatedstructuralimprovements.Tothisend,theWHORegionalOfficeforEuroperecentlyconvenedanexpertpaneltodevelopamethodologicallyrobusttoolthatwouldbeabletoquantifythecostsavingsattributabletowalkingandcyclingimprovements[133].TheresultingHealthEconomicAssessmentTool(HEAT)forcyclingiscurrentlybeingusedinanumberofEUcountriesincludingScotland.AlthoughHEATusesonlythelikelyreductionsinmortalitywhichincreasedcyclingwouldleadto(andisthereforelikelytounderestimatethehealthbenefitsperunitcost),theresultinganticipatedhealthsavingsareneverthelesssubstantial.ResultsofapplyingthemodelinScotlandforinstance,assumingthatinterventionsareabletoincreasetheprevalenceofcyclingforalljourneyslessthan5milesby20%to40%,wouldresultinsocietalsavingsintheregionof£2billionperannum.
5.5 Physical activity interventions (micro-level)
Micro-levelinterventions,mediatedthroughlegislativemeans,areessentiallyconcernedwithmeasurestofacilitatebehaviourchange,andarediscussedforphysicalactivityinsomedetailinsection6.5.Aswithinterventionsatthemacro-legislativelevel,therelativelyunderdevelopednatureoftheevidencebasemeansthatanysuchinterventions,includingthefinancialincentivesdiscussedbrieflyinchapter4,needtobeintroducedalongsideprovisionforrobustevaluation.Oneexceptionwherethereisanincreasinglyfavourableevidencebaseisintheareaofworkplaceactivetravelplans,discussedinsection6.5.Inmanycasessuchplansincludenumerousworkplacepoliciesandincentives,includinggovernmentsupportedinitiativeslikethe‘cycletowork’scheme36.
Summary
Physicalactivityinterventions
• Legislativeincentivestopromotephysicalactivityshouldideallybeaccompaniedbyenvironmentalandinfrastructuralimprovementsoutlinedinsection3,iftheyaretobeeffectiveinincreasingbothleisureactivityandactiveformsoftravel.
• Capitalinvestmentsinactivetravelinfrastructure,suchascyclingandwalkingroutes,havebeendemonstrablylinkedtomodestincreasesintheseformsoftravelinanumberofEnglishcyclingdemonstrationtowns.
• TheapplicationofnovelcosteffectivenessmodellingtechniquessuchasHEAT(HealthEconomicAssessmentTool),toactivetravelimprovements,illustratesthatsignificantsocietalsavingscouldresultfromincreasesincyclinginScotland,towardsthelevelsseeninotherNorthernEuropeancountries.
Table 5.2 Percentage of active people survey respondents participating in cycling for at least 30 minutes once or more per month, 2006 and 2008
36 Tax-free bikes for work. http://www.cyclescheme.co.uk/
LocalauthoritieswithaCycleDemonstrationTown
LocalauthoritieswithnoCycleDemonstrationTown
2006
11.77%
11.33%
2008
15.07%
11.85%
Difference(and95%CIs)
3.30%(1.79–4.81)
0.52%(0.34–0.70)
P-valuefordifference
0.0000
0.0000

64
Policy Interventions to Tackle the Obesogenic Environment
6
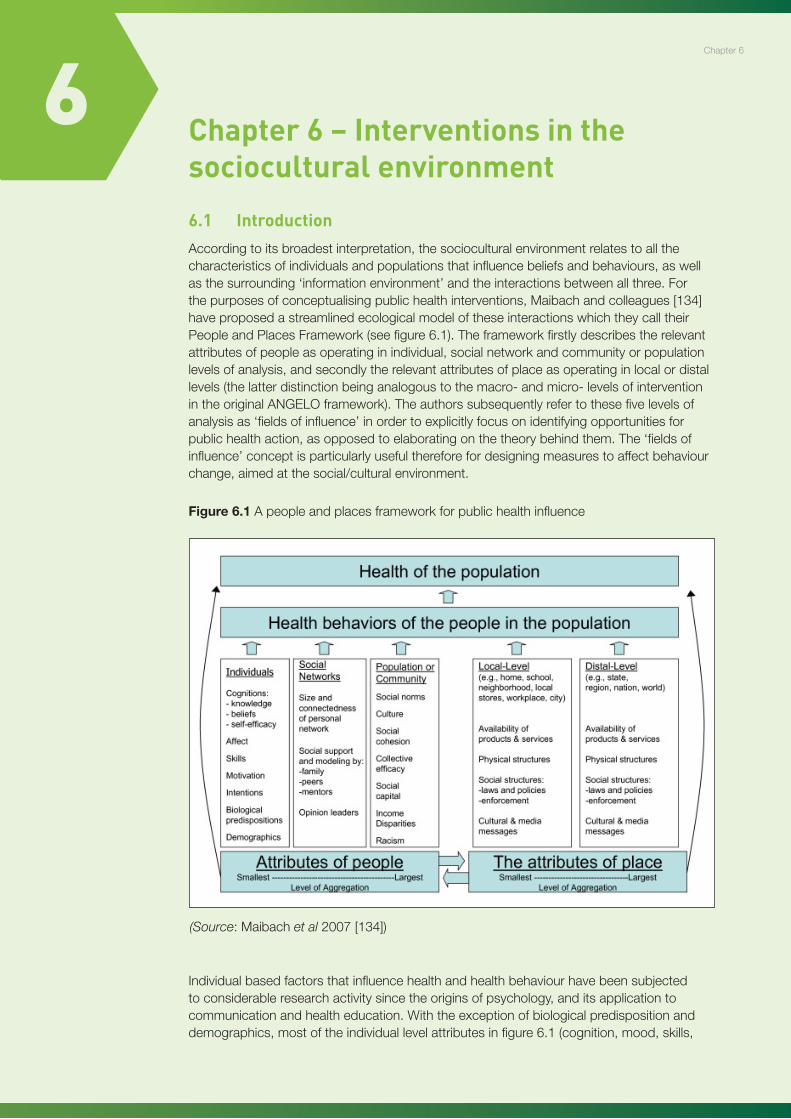
65
Chapter7
6 Chapter 6 – Interventions in the sociocultural environment
6.1 Introduction
Accordingtoitsbroadestinterpretation,thesocioculturalenvironmentrelatestoallthecharacteristicsofindividualsandpopulationsthatinfluencebeliefsandbehaviours,aswellasthesurrounding‘informationenvironment’andtheinteractionsbetweenallthree.Forthepurposesofconceptualisingpublichealthinterventions,Maibachandcolleagues[134]haveproposedastreamlinedecologicalmodeloftheseinteractionswhichtheycalltheirPeopleandPlacesFramework(seefigure6.1).Theframeworkfirstlydescribestherelevantattributesofpeopleasoperatinginindividual,socialnetworkandcommunityorpopulationlevelsofanalysis,andsecondlytherelevantattributesofplaceasoperatinginlocalordistallevels(thelatterdistinctionbeinganalogoustothemacro-andmicro-levelsofinterventionintheoriginalANGELOframework).Theauthorssubsequentlyrefertothesefivelevelsofanalysisas‘fieldsofinfluence’inordertoexplicitlyfocusonidentifyingopportunitiesforpublichealthaction,asopposedtoelaboratingonthetheorybehindthem.The‘fieldsofinfluence’conceptisparticularlyusefulthereforefordesigningmeasurestoaffectbehaviourchange,aimedatthesocial/culturalenvironment.
Individualbasedfactorsthatinfluencehealthandhealthbehaviourhavebeensubjectedtoconsiderableresearchactivitysincetheoriginsofpsychology,anditsapplicationtocommunicationandhealtheducation.Withtheexceptionofbiologicalpredispositionanddemographics,mostoftheindividuallevelattributesinfigure6.1(cognition,mood,skills,
Chapter6
Figure 6.1 Apeopleandplacesframeworkforpublichealthinfluence
76
Chapter 6: Interventions in the sociocultural environment
6.1 Introduction According to its broadest interpretation, the sociocultural environment relates to all the
characteristics of individuals and populations that influence beliefs and behaviours, as well as the
surrounding ‘information environment’ and the interactions between all three. For the purposes of
conceptualising public health interventions, Maibach and colleagues [134] have proposed a
streamlined ecological model of these interactions which they call their People and Places
Framework (see figure 6.1). The framework firstly describes the relevant attributes of people as
operating in individual, social network and community or population levels of analysis, and secondly
the relevant attributes of place as operating in local or distal levels (the latter distinction being
analogous to the macro- and micro- levels of intervention in the original ANGELO framework). The
authors subsequently refer to these five levels of analysis as ‘fields of influence’ in order to explicitly
focus on identifying opportunities for public health action, as opposed to elaborating on the theory
behind them. The ‘fields of influence’ concept is particularly useful therefore for designing measures
to affect behaviour change, aimed at the social/cultural environment.
Figure 6.1 A people and places framework for public health influence
Individual-based factors that influence health and health behaviour have been subjected to
considerable research activity since the origins of psychology, and its application to communication
(Source:Maibachet al2007[134])
66
Policy Interventions to Tackle the Obesogenic Environment
motivationandintention)havebeenshowntobeamenabletochangethroughexternalintervention.Thereisalsoanextensiveliteraturearoundtheinfluenceofsocialnetworksandhealth[135],themostrelevantattributesbeingthesizeandconnectednessofaperson’ssocialnetwork,thediversityoftiesandthedegreetowhichthevariousrelationsinasocialnetworkprovidesocialsupportandpositivemodelling.Themostsignificantdeterminantsofhealthbehaviourincommunitiesandlocalpopulationsremainperhapstheleastwellunderstood[134],althoughmuchattentionhasrecentlyfocusedoncollectiveresourcessuchassocialcapitalandcommunitycohesion.Theextentofsocioeconomicdisparityortheincomegapbetweenthemostaffluentandleastwell-off,hasofitselfanindependenteffectonhealthbehavioursandoutcomes[136].‘Place-based’fieldsofinfluencecanbesubdividedintofourfactors,threeofwhichhavealreadybeencoveredinpreviouschaptersofthisreport:
i. Availabilityofproductsandservices(Chapter3:Physicalenvironment(micro-level))
ii. Physicalstructures(Chapter3:Physicalenvironment(macro-level))
iii. Socialstructures/lawsandpolicies(Chapters4and5)
iv. Mediaandculturalmessages(Chapter6:Current).
Usingtheconventionadoptedinpreviouschapters,macro-levelfactors(e.g.masscommunication)willbeconsideredbeforeindividualormicro-levelinfluences.Ofcoursethepredominantculturalattitudestowardsobesityitselfaresubjecttosubstantialvariationthroughouttheworld,whichinevitablyinfluencesthepreferredapproachtoprevention.Certaincommerciallyengineeredcultural‘norms’suchastheassociationsforchildrenbetweenfastfoodandfun,orbetweenconfectionaryandinnocentpleasuresforadults,alsohighlightcertainstronglyembeddedculturalattitudeswhichneedtobeacknowledgedbypreventativestrategies,ifnotdirectlychallenged.
6.2 Nutrition Interventions (macro-level)
Althoughmassmediaisundoubtedlyasignificantreflectorandpotentialframe-setteroftheadultsocioculturalenvironment,thevastmajorityofpublishedevidenceinrelationtomediaandnutritionisheavilyfocusedaroundchildren.Researchhasalsoconfirmedthathoursspentviewingtelevisioncorrelatewithmeasuresofpoordiet,poorhealthandobesityamongbothchildrenandadults.Threeexplanationsforthishavebeenoffered[137]:
i televisionviewingisasedentaryactivitythatdisplacesmoreactivepursuits
ii televisionviewingisassociatedwithfrequentsnacking,pre-preparedmealsand/orfastfoodconsumption
iii televisionviewingincludesexposuretoadvertisementsforunhealthyfoodproducts.
Whileeachoftheseexplanationsissupportedbyobservationalstudies,therehasbeenashortageofempiricalresearchaimedatdisentanglingthemfromeachother.Theoneinterventiontodatehasbeenaprogressivebanintheschedulingofadvertisementsforfoodanddrinkthatishighinfat,sugarandsalt(HFSS)introducedbythebroadcastregulatorOFCOMafterextensiveconsultationin2006.ThephasedreductioninHFSSadvertisingbeganinApril2007withabanonHFSSadvertisementsinprogrammesaimedatchildrenaged4–9yearsandculminatedinabanonallHFSSadvertisingonchildren’schannelswiththeagegroupextendedtoincludethoseaged5–15years.Apreliminaryevaluationofthebannotedexpectedlevelsofreductionintheamountofadvertisingthatchildrensee,althoughtherehadbeensomemigrationofHFSSadvertisingtoprogrammeswatchedbybothadultsandchildren37.Inspiteofthesedrawbacks,theUK’sapproachhasreceivedinternationalcommendationandstatutorymeasureshavebeenclearlyshowntobemoreeffectivethanselfregulatoryregimes[138].
ArecentUSstudyhasprovidedadditionalretrospectivejustificationforthetargetingofcommercials,wheretheextentofexposuretocommercialtelevisionwassignificantlyassociatedwithBMIevenafteradjustmentforlevelsofexerciseandeatingwhilewatchingtelevision[139].Amulti-countrycomparisonbyGorisandcolleaguesusedanattributablefractionmodeltoestimatetherelativereductionsinchildobesitythatwouldresultfromahypotheticalcompleteabsenceoffoodadvertisingontelevision[140].
37 Update on Impact of Restrictions on Food and Drink Advertising to Children. OfCOM; 2008. http://stakeholders.ofcom.org.uk/market-data-research/tv-research/update/
67
Unsurprisinglyperhaps,thegreatestscopeforreductionswereforthecountrieswiththehighestdailyTVadvertisingexposuresuchastheUSandItaly(11.5and6.2minutesoftotaladvertexposureperdayrespectively).Ofcoursethewidespreaddistributionofpromotionalmaterialforunhealthyfoodinthemodernconsumerenvironment,meansthatassumptionsaboutreducedoverallmessageexposurearenecessarilycrude.Furthermore,extrapolatinganyimplicationsforadultobesitypreventionfromfamilyorientatedinterventions,involvesmakinganumberofsignificantassumptionsandcallsforacautiousinterpretation.
6.3 Nutrition interventions (micro-level)
Micro-levelinterventionsaroundtheculturalenvironmentandfoodhavealreadybeentoucheduponwhendescribingtheworksandcollegecanteenstudiesinchapters3and4,wherethemosteffectivelevertobringaboutimprovedpurchasingbehaviour,atleastintheshorttomediumterm,wasidentifiedaspricedifferentials.Thereareofcourseawholehostofstronglyembeddedculturalassociationsaroundlessthanhealthyfoodpractices,whichisparticularlythecaseforScotlandandoftenofmostrelevancewithinthefamilyorhomeenvironment.ThankfullythishasrecentlybeenthesubjectofacomprehensivereviewcommissionedbyNHSHealthScotlandandundertakenbytheFoodEthicsCouncil[141].Thereporttakesabroaddefinitionoffoodcultureas‘sharedpracticesandmeaningsrelatingtofood’,andmakingcomparisonswiththreeotherEuropeancountries(France,FinlandandGreece)examinestheculturallyspecificfactorsandattitudesthatinfluencedietarypracticesinScotland.Notablythereviewshowshowcertainpracticesandmeaningspeopleattachtofoodcanreflectandreinforcetheirmembershipofsocio-economicgroups,aswellasdirectlyaffectingtheirdietandhealth.Thereportalsoexploredthereasonsbehindgreatertendenciestowardsunhealthierpractices,suchasskippingbreakfastorrelianceontake-awaymealsandfoundthattimepressures(actualorperceived)wereoneofthehighestcitedfactors.Intermsofpreviouspolicyinterventionsandtheirrationale,theauthorshighlighthowtheculturalpracticeswhichunderpinmuchoftheScottishpopulation’sdietaryhabitsarerarelyunpackedmeaningthatinterventionmessagesandinitiativesmighthavelimitedrelevancetothetargetpopulation.CurrentnutritionrelatedpolicymeasuresinScotlandarediscussedinsection7.2.
Summary
Nutritionfocusedinterventions
• Thehighlyembeddednatureofobesogenicdriversinmodernsocietyisparticularlyevidentwithinthepredominantmediaandculturalmessageswhichassociateenergydensefoodswithpleasureandreward.
• Controlsonhighfat/highsugar(HFHS)foodadvertisingtochildrenmightbeoneinterventionthatcanhelpunpickthelargelyunchallengedpositiveassociationsthatthesefoodsgenerallyenjoy,althoughadvertisershaveshownthemselvestobeadeptatworkingaroundsuchrestrictions.
• Multi-componentnutritioninterventions,discussedinpreviouschapters,havehadsomesuccessinchangingworkplaceandinstitutionalfoodcultures.
• ThecomplexculturalcontextunderlyingmuchofScotland’spoordietaryhabitsandpracticesisrarelyexplored,whichcouldundermineeffortsatimprovement.
6.4 Physical activity interventions (macro-level)
Thevastmajorityofeffortsaroundfacilitatingbehaviourchangeatthemacro-levelarecentredonmoderatetolargescalemediacampaigns.AbromsandMaibachdescribetwofeaturesofeffectivepublichealthmediacampaigns[142]:theyfeaturewelldefinedmessagesandthosemessagesaredeliveredtotheirintendedaudienceswithsufficientreachandfrequencytobeseenorheardandremembered.Fromexistingreviewsofmassmediacampaigns,whichfocusforthemostpartonchangingindividualbehaviours,itisalsoclearthateffectsizesinwelldesignedstudiesaremodestatbest[142].Snyderand
Chapter6
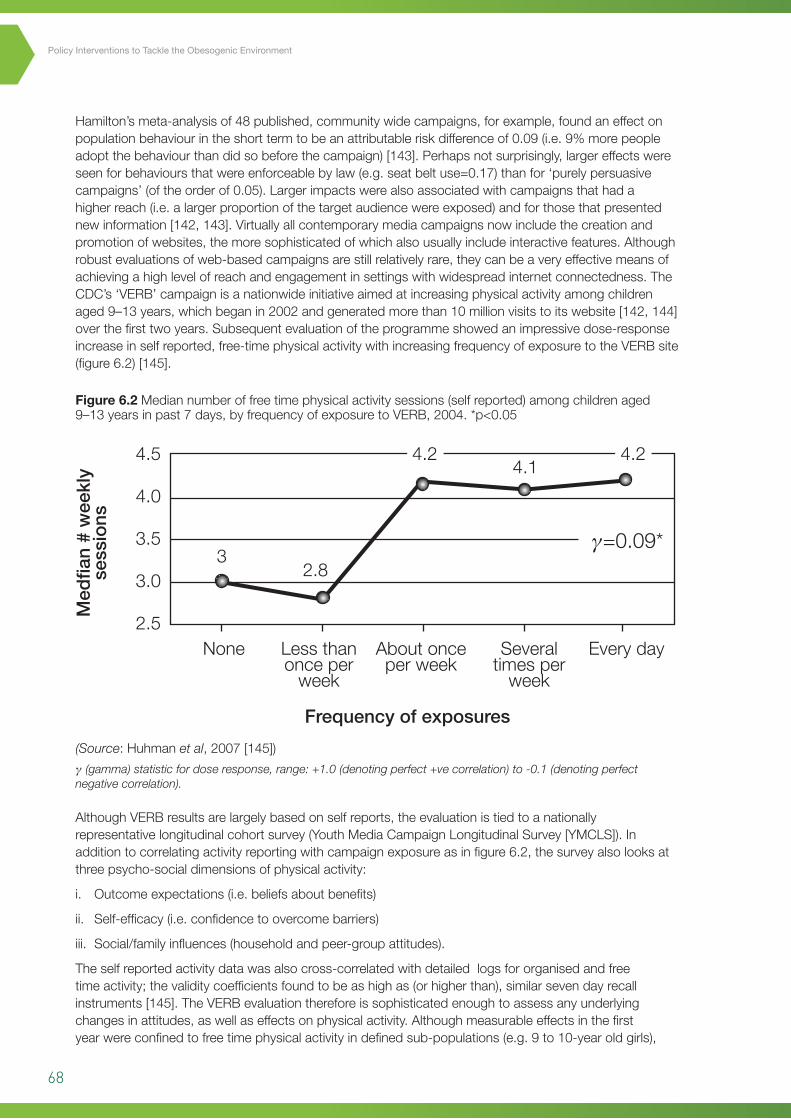
68
Policy Interventions to Tackle the Obesogenic Environment
Hamilton’smeta-analysisof48published,communitywidecampaigns,forexample,foundaneffectonpopulationbehaviourintheshorttermtobeanattributableriskdifferenceof0.09(i.e.9%morepeopleadoptthebehaviourthandidsobeforethecampaign)[143].Perhapsnotsurprisingly,largereffectswereseenforbehavioursthatwereenforceablebylaw(e.g.seatbeltuse=0.17)thanfor‘purelypersuasivecampaigns’(oftheorderof0.05).Largerimpactswerealsoassociatedwithcampaignsthathadahigherreach(i.e.alargerproportionofthetargetaudiencewereexposed)andforthosethatpresentednewinformation[142,143].Virtuallyallcontemporarymediacampaignsnowincludethecreationandpromotionofwebsites,themoresophisticatedofwhichalsousuallyincludeinteractivefeatures.Althoughrobustevaluationsofweb-basedcampaignsarestillrelativelyrare,theycanbeaveryeffectivemeansofachievingahighlevelofreachandengagementinsettingswithwidespreadinternetconnectedness.TheCDC’s‘VERB’campaignisanationwideinitiativeaimedatincreasingphysicalactivityamongchildrenaged9–13years,whichbeganin2002andgeneratedmorethan10millionvisitstoitswebsite[142,144]overthefirsttwoyears.Subsequentevaluationoftheprogrammeshowedanimpressivedose-responseincreaseinselfreported,free-timephysicalactivitywithincreasingfrequencyofexposuretotheVERBsite(figure6.2)[145].
AlthoughVERBresultsarelargelybasedonselfreports,theevaluationistiedtoanationallyrepresentativelongitudinalcohortsurvey(YouthMediaCampaignLongitudinalSurvey[YMCLS]).Inadditiontocorrelatingactivityreportingwithcampaignexposureasinfigure6.2,thesurveyalsolooksatthreepsycho-socialdimensionsofphysicalactivity:
i. Outcomeexpectations(i.e.beliefsaboutbenefits)
ii. Self-efficacy(i.e.confidencetoovercomebarriers)
iii. Social/familyinfluences(householdandpeer-groupattitudes).
Theselfreportedactivitydatawasalsocross-correlatedwithdetailedlogsfororganisedandfreetimeactivity;thevaliditycoefficientsfoundtobeashighas(orhigherthan),similarsevendayrecallinstruments[145].TheVERBevaluationthereforeissophisticatedenoughtoassessanyunderlyingchangesinattitudes,aswellaseffectsonphysicalactivity.Althoughmeasurableeffectsinthefirstyearwereconfinedtofreetimephysicalactivityindefinedsub-populations(e.g.9to10-yearoldgirls),
Figure 6.2 Mediannumberoffreetimephysicalactivitysessions(selfreported)amongchildrenaged9–13yearsinpast7days,byfrequencyofexposuretoVERB,2004.*p<0.05
(Source:Huhmanet al,2007[145])
γ (gamma) statistic for dose response, range: +1.0 (denoting perfect +ve correlation) to -0.1 (denoting perfect negative correlation).
4.5
4.0
3.5
3.0
2.5
γ=0.09*
4.1
2.83
None Lessthanonceperweek
Frequencyofexposures
Aboutonceperweek
Severaltimesperweek
Everyday
Medfian#weekly
sessions
4.2 4.2
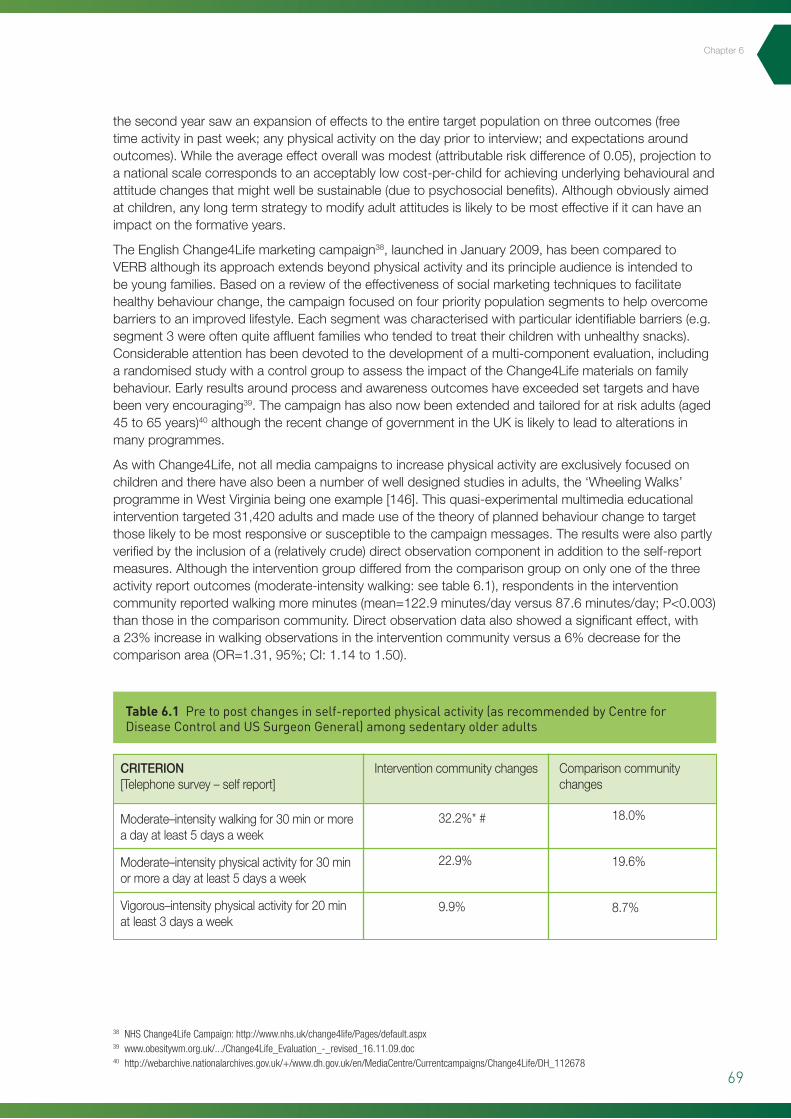
69
Chapter6
thesecondyearsawanexpansionofeffectstotheentiretargetpopulationonthreeoutcomes(freetimeactivityinpastweek;anyphysicalactivityonthedaypriortointerview;andexpectationsaroundoutcomes).Whiletheaverageeffectoverallwasmodest(attributableriskdifferenceof0.05),projectiontoanationalscalecorrespondstoanacceptablylowcost-per-childforachievingunderlyingbehaviouralandattitudechangesthatmightwellbesustainable(duetopsychosocialbenefits).Althoughobviouslyaimedatchildren,anylongtermstrategytomodifyadultattitudesislikelytobemosteffectiveifitcanhaveanimpactontheformativeyears.
TheEnglishChange4Lifemarketingcampaign38,launchedinJanuary2009,hasbeencomparedtoVERBalthoughitsapproachextendsbeyondphysicalactivityanditsprincipleaudienceisintendedtobeyoungfamilies.Basedonareviewoftheeffectivenessofsocialmarketingtechniquestofacilitatehealthybehaviourchange,thecampaignfocusedonfourprioritypopulationsegmentstohelpovercomebarrierstoanimprovedlifestyle.Eachsegmentwascharacterisedwithparticularidentifiablebarriers(e.g.segment3wereoftenquiteaffluentfamilieswhotendedtotreattheirchildrenwithunhealthysnacks).Considerableattentionhasbeendevotedtothedevelopmentofamulti-componentevaluation,includingarandomisedstudywithacontrolgrouptoassesstheimpactoftheChange4Lifematerialsonfamilybehaviour.Earlyresultsaroundprocessandawarenessoutcomeshaveexceededsettargetsandhavebeenveryencouraging39.Thecampaignhasalsonowbeenextendedandtailoredforatriskadults(aged45to65years)40althoughtherecentchangeofgovernmentintheUKislikelytoleadtoalterationsinmanyprogrammes.
AswithChange4Life,notallmediacampaignstoincreasephysicalactivityareexclusivelyfocusedonchildrenandtherehavealsobeenanumberofwelldesignedstudiesinadults,the‘WheelingWalks’programmeinWestVirginiabeingoneexample[146].Thisquasi-experimentalmultimediaeducationalinterventiontargeted31,420adultsandmadeuseofthetheoryofplannedbehaviourchangetotargetthoselikelytobemostresponsiveorsusceptibletothecampaignmessages.Theresultswerealsopartlyverifiedbytheinclusionofa(relativelycrude)directobservationcomponentinadditiontotheself-reportmeasures.Althoughtheinterventiongroupdifferedfromthecomparisongroupononlyoneofthethreeactivityreportoutcomes(moderate-intensitywalking:seetable6.1),respondentsintheinterventioncommunityreportedwalkingmoreminutes(mean=122.9minutes/dayversus87.6minutes/day;P<0.003)thanthoseinthecomparisoncommunity.Directobservationdataalsoshowedasignificanteffect,witha23%increaseinwalkingobservationsintheinterventioncommunityversusa6%decreaseforthecomparisonarea(OR=1.31,95%;CI:1.14to1.50).
Table 6.1 Pre to post changes in self-reported physical activity (as recommended by Centre for Disease Control and US Surgeon General) among sedentary older adults
38 NHS Change4Life Campaign: http://www.nhs.uk/change4life/Pages/default.aspx39 www.obesitywm.org.uk/.../Change4Life_Evaluation_-_revised_16.11.09.doc40 http://webarchive.nationalarchives.gov.uk/+/www.dh.gov.uk/en/MediaCentre/Currentcampaigns/Change4Life/DH_112678
CRITERION[Telephonesurvey–selfreport]
Moderate–intensitywalkingfor30minormoreadayatleast5daysaweek
Moderate–intensityphysicalactivityfor30minormoreadayatleast5daysaweek
Vigorous–intensityphysicalactivityfor20minatleast3daysaweek
Interventioncommunitychanges
32.2%*#
22.9%
9.9%
Comparisoncommunitychanges
18.0%
19.6%
8.7%
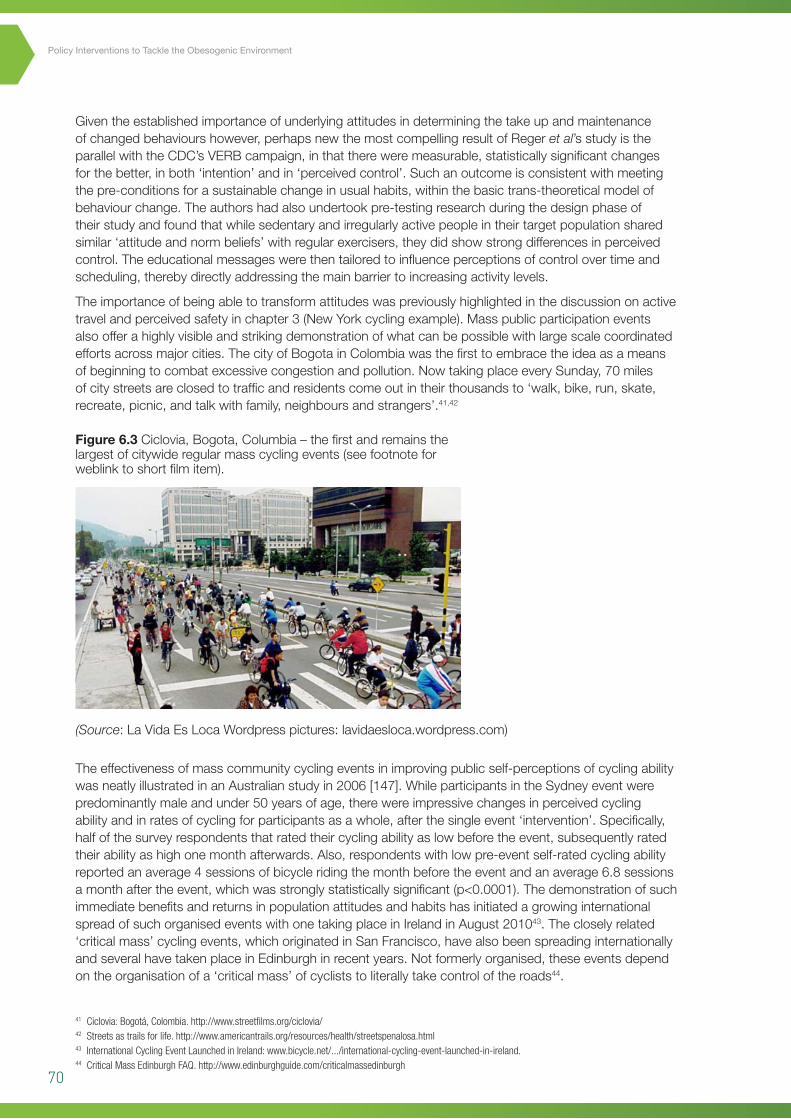
70
Policy Interventions to Tackle the Obesogenic Environment
Giventheestablishedimportanceofunderlyingattitudesindeterminingthetakeupandmaintenanceofchangedbehaviourshowever,perhapsnewthemostcompellingresultofRegeret al’sstudyistheparallelwiththeCDC’sVERBcampaign,inthatthereweremeasurable,statisticallysignificantchangesforthebetter,inboth‘intention’andin‘perceivedcontrol’.Suchanoutcomeisconsistentwithmeetingthepre-conditionsforasustainablechangeinusualhabits,withinthebasictrans-theoreticalmodelofbehaviourchange.Theauthorshadalsoundertookpre-testingresearchduringthedesignphaseoftheirstudyandfoundthatwhilesedentaryandirregularlyactivepeopleintheirtargetpopulationsharedsimilar‘attitudeandnormbeliefs’withregularexercisers,theydidshowstrongdifferencesinperceivedcontrol.Theeducationalmessageswerethentailoredtoinfluenceperceptionsofcontrolovertimeandscheduling,therebydirectlyaddressingthemainbarriertoincreasingactivitylevels.
Theimportanceofbeingabletotransformattitudeswaspreviouslyhighlightedinthediscussiononactivetravelandperceivedsafetyinchapter3(NewYorkcyclingexample).Masspublicparticipationeventsalsoofferahighlyvisibleandstrikingdemonstrationofwhatcanbepossiblewithlargescalecoordinatedeffortsacrossmajorcities.ThecityofBogotainColombiawasthefirsttoembracetheideaasameansofbeginningtocombatexcessivecongestionandpollution.NowtakingplaceeverySunday,70milesofcitystreetsareclosedtotrafficandresidentscomeoutintheirthousandsto‘walk,bike,run,skate,recreate,picnic,andtalkwithfamily,neighboursandstrangers’.41,42
Theeffectivenessofmasscommunitycyclingeventsinimprovingpublicself-perceptionsofcyclingabilitywasneatlyillustratedinanAustralianstudyin2006[147].WhileparticipantsintheSydneyeventwerepredominantlymaleandunder50yearsofage,therewereimpressivechangesinperceivedcyclingabilityandinratesofcyclingforparticipantsasawhole,afterthesingleevent‘intervention’.Specifically,halfofthesurveyrespondentsthatratedtheircyclingabilityaslowbeforetheevent,subsequentlyratedtheirabilityashighonemonthafterwards.Also,respondentswithlowpre-eventself-ratedcyclingabilityreportedanaverage4sessionsofbicycleridingthemonthbeforetheeventandanaverage6.8sessionsamonthaftertheevent,whichwasstronglystatisticallysignificant(p<0.0001).ThedemonstrationofsuchimmediatebenefitsandreturnsinpopulationattitudesandhabitshasinitiatedagrowinginternationalspreadofsuchorganisedeventswithonetakingplaceinIrelandinAugust201043.Thecloselyrelated‘criticalmass’cyclingevents,whichoriginatedinSanFrancisco,havealsobeenspreadinginternationallyandseveralhavetakenplaceinEdinburghinrecentyears.Notformerlyorganised,theseeventsdependontheorganisationofa‘criticalmass’ofcycliststoliterallytakecontroloftheroads44.
Figure 6.3 Ciclovia,Bogota,Columbia–thefirstandremainsthelargestofcitywideregularmasscyclingevents(seefootnoteforweblinktoshortfilmitem).
83
consistent with meeting the pre-conditions for a sustainable change in usual habits, within the basic
trans-theoretical model of behaviour change. The authors had also undertook pre-testing research
during the design phase of their study and found that while sedentary and irregularly active people
in their target population shared similar ‘attitude and norm beliefs’ with regular exercisers, they did
show strong differences in perceived control. The educational messages were then tailored to
influence perceptions of control over time and scheduling, thereby directly addressing the main
barrier to increasing activity levels.
The importance of being able to transform attitudes was previously highlighted in the discussion on
active travel and perceived safety in chapter 3 (New York cycling example). Mass public participation
events also offer a highly visible and striking demonstration of what can be possible with large scale
coordinated efforts across major cities. The city of Bogota in Colombia was the first to embrace the
idea as a means of beginning to combat excessive congestion and pollution. Now taking place every
Sunday, 70 miles of city streets are closed to traffic and residents come out in their thousands to
‘walk, bike, run, skate, recreate, picnic, and talk with family, neighbours and strangers’.39, 40
Figure 6.3 Ciclovia, Bogota, Columbia – the first and remains the largest of citywide regular mass cycling events (see footnote for weblink to short film item33).
The effectiveness of mass community cycling events in improving public self-perceptions of cycling
ability was neatly illustrated in an Australian study in 2006 [147]. While participants in the Sydney
event were predominantly male and under 50 years of age, there were impressive changes in
39 Ciclovia: Bogotá, Colombia. http://www.streetfilms.org/ciclovia/ 40 Streets as trails for life. http://www.americantrails.org/resources/health/streetspenalosa.html
41 Ciclovia: Bogotá, Colombia. http://www.streetfilms.org/ciclovia/42 Streets as trails for life. http://www.americantrails.org/resources/health/streetspenalosa.html43 International Cycling Event Launched in Ireland: www.bicycle.net/.../international-cycling-event-launched-in-ireland. 44 Critical Mass Edinburgh FAQ. http://www.edinburghguide.com/criticalmassedinburgh
(Source:LaVidaEsLocaWordpresspictures:lavidaesloca.wordpress.com)
71
Summary
Physicalactivityinterventions(macro-level)
• Althougheffectsizesinmassmediacampaignstoencouragehealthybehavioursaremodestatbest,theycan,becauseofscale,havethepotentialtoresultinsignificantpopulationhealthgainiftheycanhelpbringaboutsmallshiftsatthenationalorregionallevel.
• Largescalepublicparticipationeventsarebeingrecognisedasaneffectivemeansofbeginningtochangepopulationattitudesandbehaviours,aswellasindividualperceptionsofability.
6.5 Physical activity interventions (micro-level)
Inlookingtoinfluenceprevailingattitudestophysicalactivity,itmightbeexpectedthatinterventionswhicharecarriedoutincloseproximitytotheirtargetpopulation,shouldbebetterabletotailortheirapproachappropriately.Micro-levelinterventionsaroundactivitycouldinprinciplebetargetedattheindividual,householdorinstitutional/workplacelevel,allthreeofwhichwillbeconsideredinthecurrentsection.Specifically,themeritsoftherespectivepublishedevidencewillbesummarisedfor:
i. Primarycareexercisereferral
ii. Householdtargetedactivetravel
iii. Workplaceactivetravel‘culture’.
i. Primary care exercise referral
Sincethisreportpurposelydoesnotaddressobesitytreatment,individuallevelinterventionswerenotoriginallyconsideredaspartofitsoriginalbrief.Exercisereferralhowever,isalsocommonlyusedforobesityprevention(principallyinprimarycare,forpatientsathighriskofdevelopingobesityanditscomplications).Socalled‘exerciseonprescriptionschemes’havebeenconsideredbytheNationalInstituteofClinicalExcellence(NICE)whichpublishedabestpracticeguidancesummaryin200645.MindfuloftheequivocalnatureoftheevidenceNICE,recommendedthatreferralsshouldbeissuedonlyaspartofaformalresearchstudies.SubsequentinterpretationoftheguidancebyNHSHealthScotlandendorsedthisopinionandconcludedthatnewschemesshouldonlybesetupaspartofadesignatedevaluationprogramme46.ThemostrecentlypublishedsystematicreviewofexercisereferralschemesbyWilliamset al(seetable6.2)concludedthattheymayhaveamarginalimpactinincreasingphysicalactivityinsedentarypeople,thoughproblemswithtakeupandadherencemeantthat17referralswerenecessaryforeveryonepatientwhosuccessfullytookup‘moderateactivity’[148].Onecomplicationwasthelevelofvariationinfollowup,andalthoughthemajorityofstudiesreportedat10to12weeks,thisisprobablytoosoontobeabletoevaluatesustainedeffectiveness.Exceptionswereonestudythatreportedatfourmonthsandanotherattwoyears.
45 Four Commonly Used Methods to Increase Physical Activity. NICE Public Health Intervention Guidance No 2; 2006. http://www.nice.org.uk/nicemedia/pdf/PH002_physical_activity.pdf
46 NHS Health Scotland Interpretation of NICE PG002: Four commonly used methods to increase physical activity.. http://www.healthscotland.com/uploads/documents/8449-NICEPHIG2HScommentarySummary10Aug06.pdf
Chapter6
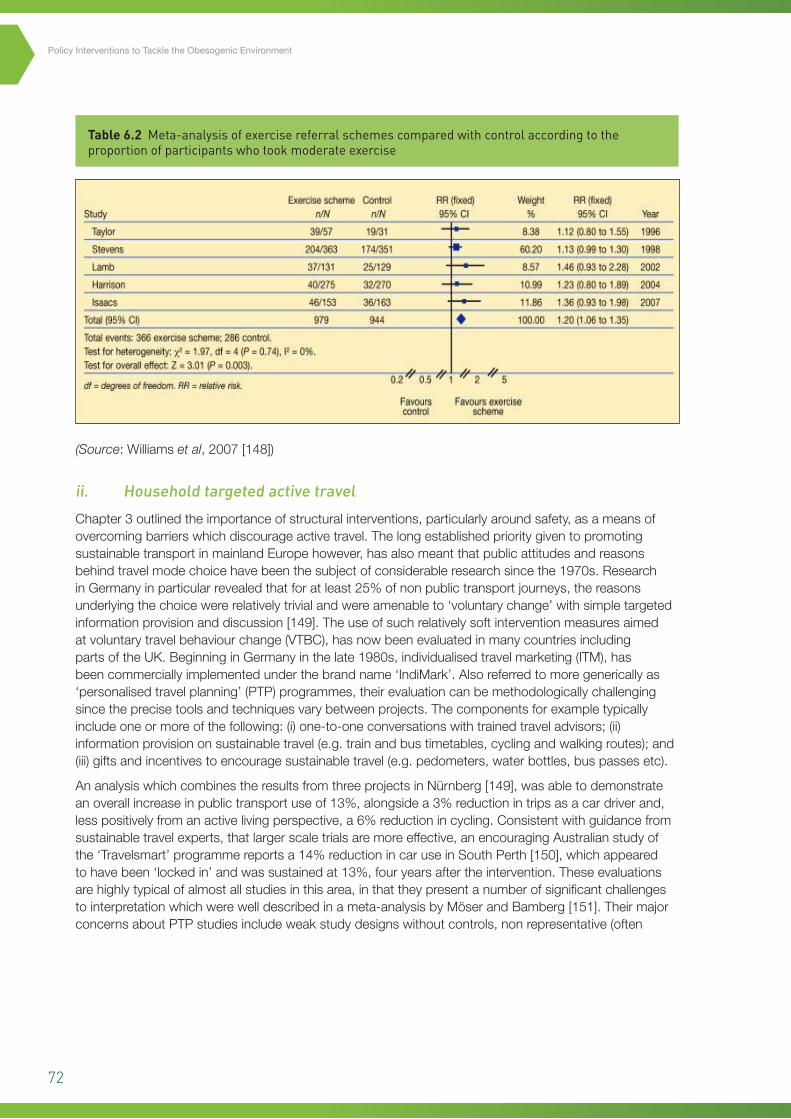
72
Policy Interventions to Tackle the Obesogenic Environment
Table 6.2 Meta-analysis of exercise referral schemes compared with control according to the proportion of participants who took moderate exercise
(Source:Williamset al,2007[148])
86
ii. Household targeted active travel
Chapter 3 outlined the importance of structural interventions, particularly around safety, as a means
of overcoming barriers which discourage active travel. The long established priority given to
promoting sustainable transport in mainland Europe however, has also meant that public attitudes
and reasons behind travel mode choice have been the subject of considerable research since the
1970s. Research in Germany in particular revealed that for at least 25% of non public transport
journeys, the reasons underlying the choice were relatively trivial and were amenable to ‘voluntary
change’ with simple targeted information provision and discussion [149]. The use of such relatively
soft intervention measures aimed at voluntary travel behaviour change (VTBC), has now been
evaluated in many countries including parts of the UK. Beginning in Germany in the late 1980s,
individualised travel marketing (ITM), has been commercially implemented under the brand name
‘IndiMark’. Also referred to more generically as ‘personalised travel planning’ (PTP) programmes,
their evaluation can be methodologically challenging since the precise tools and techniques vary
between projects. The components for example typically include one or more of the following: (i)
one-to-one conversations with trained travel advisors; (ii) information provision on sustainable
travel (e.g. train and bus timetables, cycling and walking routes); and (iii) gifts and incentives to
encourage sustainable travel (e.g. pedometers, water bottles, bus passes etc).
An analysis which combines the results from three projects in Nürnberg [149], was able to
demonstrate an overall increase in public transport use of 13%, alongside a 3% reduction in trips as a
car driver and, less positively from an active living perspective, a 6% reduction in cycling. Consistent
with guidance from sustainable travel experts, that larger-scale trials are more effective, an
encouraging Australian study of the ‘Travelsmart’ programme reports a 14% reduction in car use in
South Perth [150], which appeared to have been ‘locked in’ and was sustained at 13%, four years
after the intervention. These evaluations are highly typical of almost all studies in this area, in that
ii. Household targeted active travel
Chapter3outlinedtheimportanceofstructuralinterventions,particularlyaroundsafety,asameansofovercomingbarrierswhichdiscourageactivetravel.ThelongestablishedprioritygiventopromotingsustainabletransportinmainlandEuropehowever,hasalsomeantthatpublicattitudesandreasonsbehindtravelmodechoicehavebeenthesubjectofconsiderableresearchsincethe1970s.ResearchinGermanyinparticularrevealedthatforatleast25%ofnonpublictransportjourneys,thereasonsunderlyingthechoicewererelativelytrivialandwereamenableto‘voluntarychange’withsimpletargetedinformationprovisionanddiscussion[149].Theuseofsuchrelativelysoftinterventionmeasuresaimedatvoluntarytravelbehaviourchange(VTBC),hasnowbeenevaluatedinmanycountriesincludingpartsoftheUK.BeginninginGermanyinthelate1980s,individualisedtravelmarketing(ITM),hasbeencommerciallyimplementedunderthebrandname‘IndiMark’.Alsoreferredtomoregenericallyas‘personalisedtravelplanning’(PTP)programmes,theirevaluationcanbemethodologicallychallengingsincetheprecisetoolsandtechniquesvarybetweenprojects.Thecomponentsforexampletypicallyincludeoneormoreofthefollowing:(i)one-to-oneconversationswithtrainedtraveladvisors;(ii)informationprovisiononsustainabletravel(e.g.trainandbustimetables,cyclingandwalkingroutes);and(iii)giftsandincentivestoencouragesustainabletravel(e.g.pedometers,waterbottles,buspassesetc).
AnanalysiswhichcombinestheresultsfromthreeprojectsinNürnberg[149],wasabletodemonstrateanoverallincreaseinpublictransportuseof13%,alongsidea3%reductionintripsasacardriverand,lesspositivelyfromanactivelivingperspective,a6%reductionincycling.Consistentwithguidancefromsustainabletravelexperts,thatlargerscaletrialsaremoreeffective,anencouragingAustralianstudyofthe‘Travelsmart’programmereportsa14%reductionincaruseinSouthPerth[150],whichappearedtohavebeen‘lockedin’andwassustainedat13%,fouryearsaftertheintervention.Theseevaluationsarehighlytypicalofalmostallstudiesinthisarea,inthattheypresentanumberofsignificantchallengestointerpretationwhichwerewelldescribedinameta-analysisbyMöserandBamberg[151].TheirmajorconcernsaboutPTPstudiesincludeweakstudydesignswithoutcontrols,nonrepresentative(often
73
Chapter6
self-selected)populationsamplesandahighrelianceonselfreportingwiththeattendantriskof‘socialdesirability’bias.Consideringalsothatmostofthereportedstudiesarenotindependentevaluations,butinsteadoftenoriginatefromcommercialconsultanciessupplyingtheinterventions,thepotentialforpublicationbiaswasanadditionalcauseforconcern.
Havingdocumentedtheirreservationsabouttheavailableliterature,theauthorsofthereviewhadgatheredsufficientinformationtobeabletoderivepooledeffect-sizesfromatotalof141studies(seetable6.3).Althoughtherewasconsiderableheterogeneityamongtheincludedstudiesacrossthethreesettings(i.e.communitytravelplanning/awareness;worktravelplansandschooltravelplans),theincreasesinsustainabletravelchoiceswereallstronglysignificant(P<0.001)witheffectsizesoftheorderof0.10to0.15fortravel-planning,and0.24forworkplaceprogrammes.Translatingthesefindingsintomeaningfulimplicationsforplanningtravelprogrammes,theestimatedincreaseintheproportionoftripsoverallnottakenbycarwasfrom34%to39%47.Worktravelplansresultedinanestimatedincreasefrom35%to47%andforschoolstheoverallestimatedproportionnottravellingbycarincreasedfrom60%to64%.Althoughtheselikelybenefitsremainverymarginal,thereviewauthorsarestillcarefultocautionagainstthegeneralisabilityofthepooledresultsduetothestudydesignreservationshighlightedabove.
ArecentlypublishedevaluationofPTPprojectsineightareasofEngland[152],highlightedmanyofthesameconcernsoverstudydesignasMöserandBamberg.Theonereassuringaspectwasthattheresultsrange–a4%to13%reductionincardrivertrips–isinbroadagreementwiththelargerreviewandalsoconsistentwithresultsfromAustralianinvestigators[150].ThelargestincreasesintheEnglishstudieswerereportedforwalking,eventhoughmostinformationrequestswerearoundpublictransportandtherewerespecificcyclingpromotionsinseveralofthepilotsites.HavingbeeninvolvedinmanyPTPevaluationsintheUK,PeterBonsalloftheUniversityofLeedssharesfullythepreviouslycitedcriticismsaboutthestudyliterature[153]aswellasaddinghisownconcernsaroundthelackoflongtermfollowupandtheminimalconsiderationgiventolikelyeconomicimpact.Asawayforward,hesuggeststhatnewandongoingPTPschemessuchastheScottishGovernment’songoingSmarterChoices,SmarterPlacesinitiative48,oughttobemindfuloftheimportanceofcontinuingtoimprovetheevidencebaseandthatanysuchprojectsneedtosetasidesufficientresourcesforindependentevaluation(i.e.thatisnotundertakenin-housebythecontractedprovider(s)).Novelresearchstrategies,suchastravellersegmentationanalysis(whichlooksatthesocialdemographicsandlifestyleprofilesassociatedwithdifferentformsoftravel)[154]arealsolikelytobeofconsiderablebenefitinexpandingresearchers’understandingaroundthecomplexitiesoftravelchoice.
iii. Workplace active travel ‘culture’
Finally,giventheworkingagegroupfocusofthisreport,theresultsseenwithworkplacetravelplans(seetable6.3),areworthyofparticularmention.Ameanincreaseof12percentagepointsintheproportionofemployeesnotcomingtoworkbycar,incombinationwithreassuranceontheabsenceofbiasedreporting,isbyitselfanencouragingindicationofthepotentialforworkplacetravelplanstostimulatebehaviourchange[151].Oneparticularlysuccessfulcomponentofworktravelplanshasbeenthegovernment’sassistedbicyclepurchaseschemeinwhichemployeesreceiveassistancetobuyabiketaxfreeforthepurposesofcommuting.FortheUKasawholein2007,morethan10,000employeestookadvantageofthescheme49.Ofcoursetheextenttowhichbikepurchasestranslateintojourneyswillalsobeaffectedbymanyotherfactors,whichiswhyworkplaceactivetravelmeasuresneedtobemulti-componentandincorporateassistancewithinformationonroutes,dedicatedbikestoragefacilitiesandtheprovisionofshowersandchangingfacilities.
47 Translating effect sizes. The methodology is relatively complicated and outlined in the review. The author’s use the dimensionless Cohen’s h statistic to relate the effect size to the original proportion of the sample (between 0 and 1) whom were ‘not transformed’.
48 Smarter Choices, Smarter Places initiative: http://www.scotland.gov.uk/Topics/Transport/sustainable-transport/home-zones 49 Cycling To Work Saves 8,000 Tonnes Of Carbon Emissions http://www.planning-inspectorate.gov.uk/pins/publications/newsletter/issue_11/cycle_scheme.html
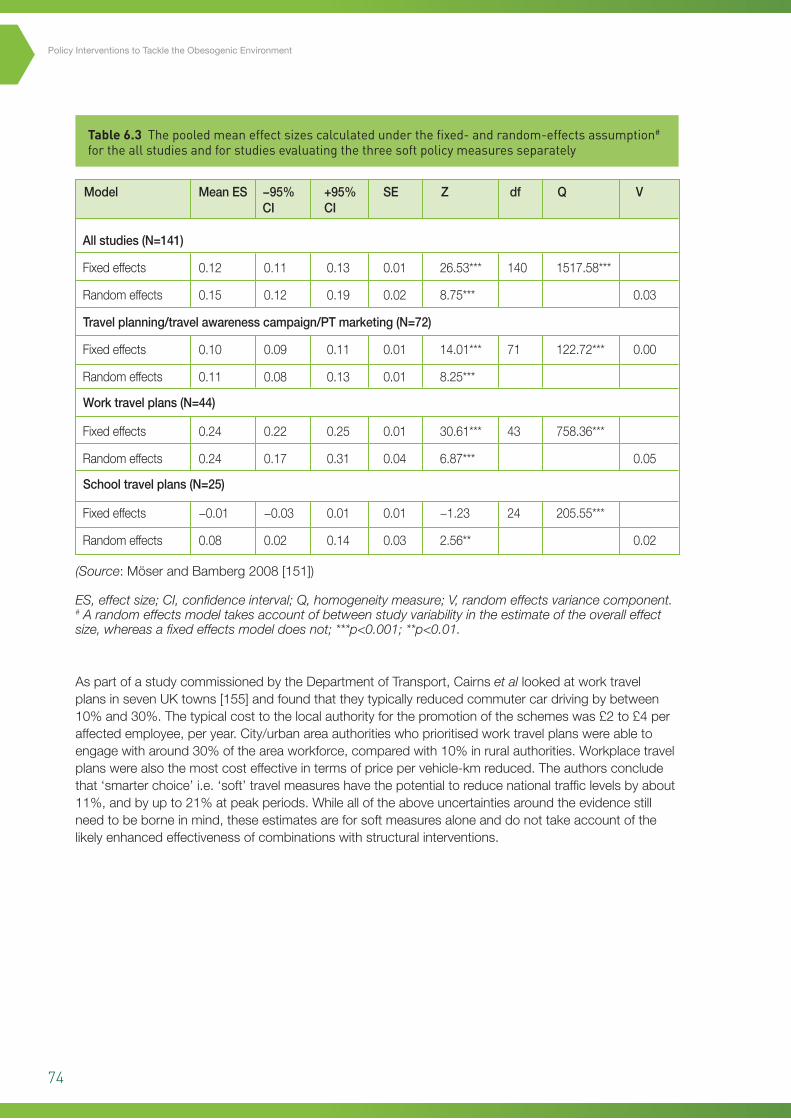
74
Policy Interventions to Tackle the Obesogenic Environment
Table 6.3 The pooled mean effect sizes calculated under the fixed- and random-effects assumption# for the all studies and for studies evaluating the three soft policy measures separately
AspartofastudycommissionedbytheDepartmentofTransport,Cairnset allookedatworktravelplansinsevenUKtowns[155]andfoundthattheytypicallyreducedcommutercardrivingbybetween10%and30%.Thetypicalcosttothelocalauthorityforthepromotionoftheschemeswas£2to£4peraffectedemployee,peryear.City/urbanareaauthoritieswhoprioritisedworktravelplanswereabletoengagewitharound30%oftheareaworkforce,comparedwith10%inruralauthorities.Workplacetravelplanswerealsothemostcosteffectiveintermsofpricepervehicle-kmreduced.Theauthorsconcludethat‘smarterchoice’i.e.‘soft’travelmeasureshavethepotentialtoreducenationaltrafficlevelsbyabout11%,andbyupto21%atpeakperiods.Whilealloftheaboveuncertaintiesaroundtheevidencestillneedtobeborneinmind,theseestimatesareforsoftmeasuresaloneanddonottakeaccountofthelikelyenhancedeffectivenessofcombinationswithstructuralinterventions.
Allstudies(N=141)
Fixedeffects
Randomeffects
Fixedeffects
Randomeffects
Fixedeffects
Randomeffects
Fixedeffects
Randomeffects
0.12
0.15
0.10
0.11
0.24
0.24
−0.01
0.08
0.11
0.12
0.09
0.08
0.22
0.17
−0.03
0.02
0.13
0.19
0.11
0.13
0.25
0.31
0.01
0.14
0.01
0.02
0.01
0.01
0.01
0.04
0.01
0.03
26.53***
8.75***
14.01***
8.25***
30.61***
6.87***
−1.23
2.56**
140
71
43
24
1517.58***
122.72***
758.36***
205.55***
0.03
0.00
0.05
0.02
Model MeanES −95%CI
+95%CI
SE Z df Q V
Travelplanning/travelawarenesscampaign/PTmarketing(N=72)
Worktravelplans(N=44)
Schooltravelplans(N=25)
(Source:MöserandBamberg2008[151])
ES, effect size; CI, confidence interval; Q, homogeneity measure; V, random effects variance component.# A random effects model takes account of between study variability in the estimate of the overall effect size, whereas a fixed effects model does not; ***p<0.001; **p<0.01.

75
Chapter6
Summary
Physicalactivityinterventions(micro-level)
• Individuallyfocusedactivityincentives(suchasprimarycarebasedexercisereferral),havebeenshowntobemarginallyeffectiveforpromotingphysicalactivityinpeoplewhoarelargelyinactive.Althoughtooresourceintensivetobeausefulmeansofobesitypreventioninthegeneralpopulation,theirmediumtolongertermeffectivenessinhigherriskgroups,wouldbeworthyoffurtherevaluation.
• Personaltravelplanning(athouseholdlevel),hasbeenassociatedwithveryconsistentreductionsincardependenttravel,althoughtherearesignificantconcernswiththequalityoftheevidencebase.Furtherpublicinvestmentinsuchprogrammesshouldmakeprovisionforindependentrobustevaluation.
• WorkplacetravelplanshavebeenshowntobecosteffectiveandfeasibleinaUKsetting,asameansofreducingtheproportionofcardependentjourneys.

76
Policy Interventions to Tackle the Obesogenic Environment
7

77
7 Chapter 7 – Current policy landscape in Scotland 7.1 Background and overview
TheForesightReport,TacklingObesities:FutureChoices[2],hasbeencitedanumberoftimesalreadyinthisreport.ForesightrepresentedthefirstcomprehensiverecognitionatUKGovernmentlevelthatmanyofthefeaturesofmodernliving,whichareattheheartoftheobesityepidemic,arebeyondthecontrolofindividuals.Theauthorsthereforeadvocatedtheneedforbroadreachingsocietalwidestrategiesiftherisingtrendsinthepopulationprevalenceofoverweightandobesityaretobestabilisedandeventuallyreversed.Asdescribedinchapter1,Foresightmadeuseofasystemsmappingapproachtoconceptualisethebiologicalandsocialcomplexityofobesity(seefigure7.1).Theoverallsystemsmapillustratesthecomplexityandinter-relationshipsbetweenthedifferentsocietaldriversofobesityandthatnosingledominantfactorisclearlyidentifiable.Inconsequence,ifrisingobesityistobeaddressedeffectively,thereisaneedfora‘whole-systems’approachwithacommitmenttolong-termsustainedinterventions.Additionally,becausemanyofthekeyleversofinfluencelieacrossandbeyondthejurisdictionofsinglegovernmentdepartments,theproblemcallsforcrossgovernmentsolutionsthatalsoengageotherkeystakeholdersfromindustry,tradeandagriculture.
Asisevidentfromthetitle,Foresightwaswrittenwithafutureorientationinmindandspecificallyadoptedanotional50yeartimescale.Sincemanyofthepossibilitiesforsocietalwideinterventionsarecriticallydependentontheprevailingpoliticalclimateandpublicattitudes,thelikelihoodofsuccessforashortlistedseriesofpolicyandenvironmentalmeasureswasconsideredagainstfourquitedifferentfuturescenarios.TheunderlyingtrendsandrationalebehindeachdevelopingscenarioaredescribedindetailinoneoftheForesightreportsaccompanyingpublications,VisualisingtheFuture:Scenariosto2050[156].Thefouralternativemajorsetsofdriversforfuturesocietalchangeare
i. Vocalconsumersdriveforbusinesstoleadchange
ii. Widersocialresponsibilitydriveslongtermpreparednessandadaptivebehaviouralchange
iii. Consensusandcollectiveactionsoughttodeliverflexibilityandreacttoissuesoftheday
iv. Shorttermvaluemaximisationandmarketslefttobalanceshiftsinresourcedistribution.
Chapter7

78
Policy Interventions to Tackle the Obesogenic Environment
Figure 7.1 Foresightsystemsmap[2]
92
Figure 7.1 Foresight systems map [2]
Seventeen short listed policy options, which were selected as examples of the range and depth of
responses that were generated from expert panels, were then imposed on each of the above
hypothetical future scenarios. Each intervention was assessed on the degree to which it might
impact on three aspects of the obesity epidemic: overall population prevalence of obesity;
socioeconomic differences in obesity prevalence and the prevalence of childhood obesity. Five of the
shortlisted actions were then deemed to be likely to have the ‘greatest average impact’ overall on
obesity across these three indicator areas:
• increasing walkability/cyclability of the built environment
• targeting health interventions for those at increased risk
• controlling the availability of/exposure to obesogenic foods and drinks
• increasing the responsibility of organisations for the health of their employees
• early life interventions at birth or in infancy
Crucially, the Foresight Report dismisses any suggestion of a magic bullet, either pharmaceutical or
policy led, to redress the obesity epidemic and also rejects options that focus on individual
behaviours (except for those that relate to early years intervention). Table 7.1 shows the
Formatted: Indent: Left: 0.75 cm,Hanging: 0.5 cm, Bulleted + Level: 1+ Aligned at: 1.27 cm + Indent at:1.9 cm
Seventeenshortlistedpolicyoptions,whichwereselectedasexamplesoftherangeanddepthofresponsesthatweregeneratedfromexpertpanels,werethenimposedoneachoftheabovehypotheticalfuturescenarios.Eachinterventionwasassessedonthedegreetowhichitmightimpactonthreeaspectsoftheobesityepidemic:overallpopulationprevalenceofobesity;socioeconomicdifferencesinobesityprevalenceandtheprevalenceofchildhoodobesity.Fiveoftheshortlistedactionswerethendeemedtobelikelytohavethe‘greatestaverageimpact’overallonobesityacrossthesethreeindicatorareas:
• increasingwalkability/cyclabilityofthebuiltenvironment
• targetinghealthinterventionsforthoseatincreasedrisk
• controllingtheavailabilityof/exposuretoobesogenicfoodsanddrinks
• increasingtheresponsibilityoforganisationsforthehealthoftheiremployees
• earlylifeinterventionsatbirthorininfancy.
Crucially,theForesightReportdismissesanysuggestionofamagicbullet,eitherpharmaceuticalorpolicyled,toredresstheobesityepidemicandalsorejectsoptionsthatfocusonindividualbehaviours(exceptforthosethatrelatetoearlyyearsintervention).Table7.1showsthecorrespondinggovernmentdepartmentswherethejurisdictionliesforeachofthesefiveinterventionareas.
Inrelationtothefiveidentifiedpriorityareasitisreassuringatleasttofindahighdegreeofconvergencewiththeinitialfindingsofthisreport.Withtheexceptionofearlylifeinterventions,whichwereoutsidethebriefofthecurrentreport,fourofthefiveoptionswouldclearlybeconsistentwiththerelativelyhighpromisepolicyandenvironmentalinterventionsidentifiedinthisdocument.Whilethe‘targetingofthoseatincreasedrisk’hastheleastobviouscorrespondingproposalwithintheprecedingchapters,thehigherpricesensitivityofthosemostatriskofobesitytoenergyrichfoodpurchases,representsagoodexampleofauniversallyappliedmeasurethattargetshigherriskgroupsbydefault(seesection4.2(ii)).

79
(i)Increasethe‘walkability’and‘cyclability’ofthebuiltenvironment.
Introducehealthasasignificantelementinallplanningprocedures50.
(ii)Targetinghealthinterventionsforthoseatincreasedrisk(dependentonabilitytoidentifythesegroupsandonlyifreinforcedbypublichealthinterventionsatthepopulationlevel).
(iii)Controllingtheavailabilityof/exposuretoobesogenicfoodsanddrinkse.g.foodlabellingstandards.
(iv)Increasingtheresponsibilityoforganisationsforthehealthoftheiremployees.
(iv)Earlylifeinterventionsatbirthorininfancy.
• Transport.
• Housingandregeneration.
• Builtenvironment.
Healthdirectoratesincluding:ChiefMedicalOfficerandPublicHealth;HealthcarePolicyandStrategy;PrimaryandCommunityCare;ChiefNursingOfficer.
Constitution,LawandCourts;RuralandEnvironment
DeptofWorkandPensions–thoughtrainingoftendelivered/organisedbyScottishagencies.
Children,youngpeopleandsocialcare.
Lifelonglearning.
Learning.
• DepartmentforTransport.
• Communitiesandlocalgovernment.
• DepartmentofHealth.
• DEFRA;DeptforConstitutionalAffairs(nowMinistryofJustice).
• FoodStandardsAgency
• LikelytorequireEUinvolvement(seenotebelow51)
• DepartmentofWorkandPensions.
• DepartmentforChildren,SchoolsandFamilies.
• DIUS(nowBIS):BusinessInnovationandSkills).
• FSA:FoodStandardsAgency.
Chapter7
Table 7.1 Foresight ‘highest likely impact options’ and the respective government departments/agencies in Scotland and the UK (adapted from Higgins 2010 [157])
[Shading denotes Scottish Government jurisdiction]
50 This option is not prioritised but in all bar scenario 4 is deemed to have a positive impact. It complements the walking and cycling proposal. 51 Food labelling overseen ultimately by EU Directive. http://www.reading.ac.uk/foodlaw/label.htm
Foresightpolicyrecommendations
Holyrooddirectorates Westminsterdepartments/governmentagencies
PerhapsthemostusefulanddirectlyrelevantaspectoftheForesightoutputswithrespecttothecurrentreporthowever,arethecharacteristicsthatdescribewhattheauthorsperceiveasanideal‘portfolioofinterventions’.Asoutlinedinchapter2,theultimateaimofthiscurrentreviewofevidencearoundobesitypreventionmeasuresistopresentamenuofoptionsthatwouldincludeabroadbalanceoflevelsofriskandlikelyreturns,justaswouldafinancialinvestmentportfolio[24].Anidealportfolioneedstobalancetheneedforshorttermactionagainstthedriveforlongertermsustainablechange.Toachievethisbalance,itisbesttoproceedwithamixofpopulationlevelandtargetedinterventionsandseekalignmentwithotherpolicyagendas,recognisingsynergiesandconflicts.Thepotentialforaligningobesitypreventionwithotherpublichealthandpoliticalpriorities,notablyclimatechangeandhealthinequalities,isdescribedinchapter8anddiscussedextensivelyintheForesightReportitself.
80
Policy Interventions to Tackle the Obesogenic Environment
7.2 Beyond Foresight in the UK and Scotlandi. NutritionThehugelychallengingagendasetoutbyForesight,todevelopgenuinelycrossgovernment,multi-levelresponsestotheobesityepidemic,hasgivenrisetoaseriesofkeypolicydocumentsfromboththeUKandthedevolvedScottishGovernment.Healthy Weight, Healthy Lives: A Cross-Government StrategyforEngland52,waspublishedin2008anddealtwithsomeofthespecificsofimplementinginterventionsinthefivepriorityareas.Thedocumenthadastrongfocusonearlychildhoodaswellastheprospectsforinvestmentinactivetravelprovisionandworkplacebasedinitiatives.Aoneyearpostlaunchevaluation53highlightedencouragingprogressinanumberofareas,particularlyinthecasestudyreportsofdemonstrationprojects,suchastheconveniencestorehealthyfoodavailabilityprogrammeinnortheastEngland(basedonamodeloriginallypilotedinScotland,whichisdescribedbelow).Theoneyearfollowupreportalsodescribedseveralexamplesofproductreformulationbymanufacturersandretailers,inwhichtherehavebeensubstantialreductionsinsugarlevelsandsaturatedfatinanumberofleadingbrands.Onphysicalactivitymeasures,earlyevaluationsofcyclingdemonstrationtowns(implementedaspartofHealthy Weight, Healthy Livespriorityactions),inEnglandandWaleshavebeenpromising(seesection5.4).
JustaswithHealthy Weight, Healthy LivestheequivalentobesitypreventionactionplanforScotland(Healthy Eating, Active Living)setoutanambitiouslife-coursebasedprogrammeofintendedactionsfor2008to2011.Manyoftheactionsoutlinedinthisplanarealreadyunderwayandhavebeenfavourablyevaluated.TheSchools(HealthPromotionandNutrition)(Scotland)Act200754forexample,buildsontheprogressofanearlierschoolsinitiative,HungryforSuccess,andseekstoimprovethestandardofschoolmealsaswellasincreasingtheiruptake.Localauthoritiesarealsoencouragedtoprovideschoolswithhealthysnacksanddrinks.Fortheadultpopulation,theScottishGrocersFederation’sHealthyLivingProgramme55hasdemonstratedthecapacityofimproved‘instorepresentation’toincreasethepurchasingoffruitandvegetablesinconveniencestores.Althoughthefindingshavenotyetbeensubjectedtoindependentpeerreview,preliminaryresultshavedemonstratedsignificantincreasesinthesalesoffreshfruitandvegetables,aswellasincreasesinself-reportedconsumption56.TheapparentsuccessoftheapproachhasledtotheadoptionofasimilarmodelinEngland(aspartoftheChange4Lifecampaign[seesection6.4]andanadditional£1.3millionfundingforexpansionfromtheScottishGovernment57.Theadditionalresourcesareintendedto:
• extendthecoverageoftheschemetoawiderrangeofretailers
• expandtherangeofproducebeyondfruitandvegetablestohealthieroptionssuchwholemealbreadandlowfatmilk
• createa‘goldstandard’forstoresalreadyparticipatingintheprogrammetoencouragethemtogofurtherinpromotinghealthierproduce.
Earlyin2010,theFoodsStandardsAgencyinScotlandissuedapolicyconsultationonmore‘upstream’interventionsthatwouldbealsobeconsistentwithForesight’sthirdrecommendationaroundrestrictingtheavailabilityofobesogenicfoodstuffs58.PartoftheAgency’sSaturatedFatandEnergyIntakeprogramme(SFEI),theconsultationrelatestothreespecificcomponents,advocatingvoluntarymeasuresbyfoodmanufacturersandretailersto:
• increaseaccessibilityofsmallerfoodportionsizes(see3.3(ii))
• encouragethepromotionandincreaseduptakeofhealthieroptions
• reducethesaturatedfatandenergycontentofpopularfoodsbyreformulationmeasures.
52 Healthy Weight, Healthy Lives. Dept of Health (Cross Government Obesity Unit); 2008. http://www.dh.gov.uk/prod_consum_dh/groups/dh_digitalassets/documents/digitalasset/dh_084024.pdf
53 Healthy Weight, Healthy Lives: One Year On. Dept of Health (Cross Government Obesity Unit); 2009. http://www.dh.gov.uk/prod_consum_dh/groups/dh_digitalassets/documents/digitalasset/dh_097623.pdf
54 Schools (Health Promotion and Nutrition) (Scotland) Act 2007http://www.ltscotland.org.uk/healthpromotingschools/practitioners/nationalguidance/scottishact2007.asp55 Scottish Grocers Healthy Living Plan: Evaluation http://www.communityfoodandhealth.org.uk/fileuploads/sgfhealthylivingevaluationreport-7313.pdf56 The Healthy Living Programme. Information leaflet. Scottish Grocers Federation; 2007 http://scottishshop.org.uk/wp-content/uploads/2009/09/Healthy-living-2leaflet.pdf57 Promoting Healthy Food Choices. News Release. The Scottish Government. http://www.scotland.gov.uk/News/Releases/2010/02/2617003058 Draft Recommendations on the Promotion of Lower Fat Products Including Dairy Products, Meat Products and Portion Size Availability. SFEI Programme: Consultation
Summary, launched Dec 2009. http://www.food.gov.uk/multimedia/pdfs/consultation/promolowfatprodssatfatreduct.pdf
81
Chapter7
Theconsultationalsogoesasfarastostipulatelegallybindinglimitstothefatcontentofsausages(e.g.recommendation7stipulatesthatbytheendof2012,totalfatlevelsshouldbereducedby5%comparedtothelevelin2008).Suchmeasureshaveechoesofthemaximumfatcontentlimitsdiscussedinsection5.2(i),thatweresuccessfullyintroducedinGhana.CertainfoodstuffswhichaccountforsubstantialdietarycontributionsintheUK,alsocurrentlyhaveminimumfatthresholdsbydefinition,cheddarcheeseandicecreambeingthetwomostnotableexamples.Asaresult,thesecondpartoftheFSAconsultationfocusesonthelikelyimplications,includingdevelopmentcoststhatwouldbeassociatedwithamendingthecompositionallegislationforicecreamandcheddarcheese.UndercurrentfoodlabellingregulationsintheUK59forexample,productsdescribedasicecreamarerequiredtocontainatleast5%fatand2.5%milkprotein.Incontrast,theequivalentEuropeanregulations58havenominimumfatormilkproteincontent,whichhasledtocallsfrommanufacturersandsupplierstotheUKmarketfortheregulationtobebroughtintolinewiththerestofEurope61.Lowerfaticecreamproductscouldthenretaintheirproductdescriptionsandavoidconsumerconfusion.
Similar‘compositional’considerationscurrentlyapplytocheddarcheesewheretheamountofmilkfatexpressedasapercentageofthedrycheeseisstipulatedtobenotlessthan48%.TherealignmentofUKregulationswiththeinternationalCODEXstandardforcheddarwouldallowcheeseswithmilkfatcontentsfrom22%to47%toretainthe‘cheddar’productlabel,providinginformationwasincludedonthemodificationsmade.Whilethesemodificationstocompositionallegislationremainpending,theplanningprocessisobviouslyatanadvancedstageandtheFSA’scloseworkingwithmanufacturers,appearstofinallybepayingoffintheformofthedevelopmentofhealthieroptionsforconsumers.InanindependentreviewoftheScottishDietActionPlanin200662,effectiveengagementwiththefoodindustrywasidentifiedasproblematic.Theclosecollaborationwithmanufacturersinthereformulationofcompositionalstandardstherefore,canreasonablyberegardedasanindicatorofprogressinwhathasbeenadifficultarea.
ii. Physical activity/active travel
Unlikefoodlegislation,planningisoneofthepowersdevolvedfromtheUKParliamenttotheScottishGovernmentandanewScottishPlanningPolicy63waspublishedearlyin2010,whichreplaced17separateplanningpolicies.Atotalof37supplementaryPlanningAdviceNotes(PANs)werealsostillinplaceatthebeginningof2010,althoughsomerationalisationoftheseislikelyandongoing.Officialplanningpolicyguidanceiscriticalbecauseitsetstheparameterswithinwhichdecisionsaremadebylocalcouncilplanningofficersandplanningcommitteesacrossthecountry.AmongthefewreferencestohealthinthenewScottishPlanningPolicysetupareguidelineaspirationsaroundactivetravelnetworksandaccesstogreenspaces:
‘Developmentplansshouldpromoteapatternofdevelopmentwhichreducestheneedtotravelandencouragesactivetravelandtravelbypublictransport,takingintoaccountthelikelyavailabilityofpublictransportinruralareas...’(pp16)
‘Theplanningsystemhasaroleinhelpingtocreateanenvironmentwherephysicalwellbeingisimprovedandactivitymadeeasier...Accesstogoodqualityopenspacescanencouragepeopletobephysicallyactiveandaidhealthandwellbeing.’(pp30)
59 Food Labelling Regulations, 1996 (UK). http://www.opsi.gov.uk/si/si1996/uksi_19961499_en_1.htm 60 Euroglaces Code of Practice for Edible Ices. http://euroglaces.eu/en/upload/docs/Edible%20ices%20codes/English%20-%20Code%20for%20Edible%20
Ices%202006.pdf61 New Ice Cream Definition Would Boost Reformulation Work. Food Manufacturer.co.uk; March 2010 http://www.foodmanufacture.co.uk/Regulation/New-ice-
cream-definition-would-boost-reformulation-work62 Review of the Scottish Diet Action Plan Progress and Impacts 1996–2005 http://www.healthscotland.com/uploads/documents/3158-SDAP_Review_
Report_Full.pdf63 Scottish Planning Policy. The Scottish Government; February 2010 http://www.scotland.gov.uk/Resource/Doc/300760/0093908.pdf

82
Policy Interventions to Tackle the Obesogenic Environment
Thesectionontransportplanningalsonotesthatgreenhousegasemissionsneedtobereducedtomeetclimatechangetargetsandoneofthemeansbywhichthiscanbeachievedistoprioritiseotherformsoftravel(particularlyactivetravel),overmotorisedvehicles,forexample:
‘Theaimisforurbanareastobemademoreattractiveandsaferforpedestriansandcyclists,includingpeoplewithmobilitydifficulties.Cycleroutesand,whererelevant,cycleparkingandstorageshouldbesafeguardedandenhancedwhereverpossible...’(pp34)
AnumberofthesupplementaryPANsalsoreiterateacommitmenttoopenspaceprovisionandactivetravelconsiderations.PlanningforTransport(PAN75),forexamplehighlightsinfrastructureprovisionforprivatecaralternativesasakeycomponentofsustainabledesign.PAN65(PlanningandOpenSpaces)describesopenspaceprovisionasakeycriterionofneighbourhoodqualityandmeansofencouragingactivelifestyles.Othersupportivelegislationforactivetravelinvestmentincludesclimatechangetargetsforthereductionofgreenhousegasemissions64andstrategicenvironmentalassessment(SEA)65basedonanEUDirectiveandwithwhichallpublicsectorpoliciesneedtobecompliantwith.WhileSEAguidanceinprincipleimpliesthatthehumanhealthimpactsofallstatutorypoliciesneedtobeexplicitlyconsidered,theextenttowhichthisisadheredtoinpracticeremainsuncertain.Thismaybeduetoalackofconsensusonthedefinitionandscopeoftheterm‘humanhealthimpact’,whichcansometimesbeinterpretedquitenarrowlyaroundthebiomedical/traditionalhealthprotectionmodelofhealthhazards.
Giventhepotentialfora‘restrictedinterpretation’ofhealthcommitmentsoutlinedinplanninglegislationabove,itispossibletotakesomemeasureofreassurancefromthepublicationearlierthisyearoftheScottishGovernment’sCyclingActionPlanforScotland66.ThisplansetsoutanumberofstrongcommitmentsaroundprovisionforanimprovedcyclinginfrastructureinScotland.Theoverallstatedobjectiveoftheplanistoachieve10%ofalljourneysbybikeby2020,throughexpandingcyclenetworksacrossthecountryandenhancingdeliveryofcycletraininginschools.Theplanintendstodeliver:
• £2.5millioninvestmentincyclinginfrastructure,suchasnewpaths
• A£150,000trialloansupportschemein2010–11tohelpbusinessimproveworkplacecyclingfacilities
• £500,000toGlasgowCityCouncilforitsConnect2project,allowingcycliststotravelbetweenthecitycentre,theClyderiversidepromenades,KelvingroveParkandthewestendfreeoftraffic
• £300,000onchildcycletraining.
7.3 The route map for obesity prevention in Scotland
WhiletherehavebeenanumberofpolicyresponsesinScotlandthatareconsistentwithForesight’saspirationsfortacklingobesity,themostdirectlyinfluencedScottishGovernmentpublicationisclearlytheRoute Map Towards Healthy WeightpublishedinMarch201067.Thedocument’soverriding‘missionstatement’sumsuptheprincipleconclusionofForesight:
‘Whatisrequiredinthelongtermistransformationalchangeinsocietytoaddressthethreattoindividualandcollectivewellbeingposedbyweightgainandobesity.Thetypesofchangesweneedtomakeareanalogousintermsofscaleandcomplexity,tothoserequiredtomitigateandadapttoclimatechange.’
TheRouteMapalsodoesnotshirkfromambitiousobjectives,statingthefollowingaspirationatthebeginningofchapter3:‘forthemajorityofScotland’spopulationtobeinthenormalweightrange(i.e.BMI18.5to25)’.Notablyhowever,thereisnotimetablegivenwithinwhichthismightbeachieved.AlsoliketheForesightReport,theRouteMapisnotintendedtobeaprescriptivepolicydocumentbutinsteadit‘aimstosetoutthefuturedirectionofnationalandlocalgovernmentdecisionmaking’.RouteMapalsoeffectivelygoesonestagefurtherthanForesightinthatitattemptstotranslatefourofthefiveForesightpriorityareasintospecificideasforpolicymakers.Thefourcategoriesofpreventativeactiondescribedinsection6forinstanceareclearlyrecognisablefromtheForesightshortlistabove:
64 The Climate Change (Scotland) Act 2009 http://www.opsi.gov.uk/legislation/scotland/acts2009/pdf/asp_20090012_en.pdf65 The Environmental Assessment (Scotland) Act 2005 http://www.opsi.gov.uk/legislation/scotland/acts2005/pdf/asp_20050015_en.pdf66 Cycling Action Plan for Scotland. Scottish Government; 2010. http://www.cyclingactionplanforscotland.org/67 Preventing Overweight and Obesity in Scotland. A Route Map Towards Healthy Weight. Scottish Government; 2010. http://www.scotland.gov.uk/Publications/2010/02/17140721/19
83
• Energyconsumption–controllingexposureto,demandforandconsumptionofexcessivequantitiesofhighcalorificfoodsanddrinks
• Energyexpenditure–increasingopportunitiesforanduptakeofwalking,cyclingandotherphysicalactivityinourdailylivesandminimisingsedentarybehaviour
• Earlyyears–establishinglifelonghabitsandskillsforpositivehealthbehaviourthroughearlylifeinterventions
• Workinglives–increasingtheresponsibilityoforganisationsforthehealthandwellbeingoftheiremployees.
Chapters4and5oftheRouteMaprespectivelysummarisethescaleofthechallengeaheadandthecurrentandongoingactionsthatarealreadyplannedorunderway.Thecombinationofactivitiescurrentlyinplaceservestodemonstratethatthereisnoover-relianceonanyoneparticularpolicyarea.Notablesuccessestodatehavebeenthe‘HungryforSuccess’schoolnutritioncampaign,whichsoughttoimprovenutritionalstandardsandincreasetheuptakeofschoolmealsbytacklingthesocialstigmaaroundreceiptoffreemeals68.
Intermsofintendedactions,theRouteMapdescribesafairlyextensiveportfolioofpossibleinterventionsthatarebeingconsidered,anumberofwhichcorrespondcloselytotheactionareasthatwouldbewellsupportedbytheevidencereviewthatmakesupthebulkofthisreport.Specific‘energyin’/nutritionrelatedexamplesinclude:
• Providingahigherproportionoflessenergydensefoodsaswellassmallerportionsizes(throughworkingwithmanufacturersandretailers)(pp17)
• Reservingtheoptionofstatutorymeasurestoimproveproductformulationsandportionsizesintheeventofunsatisfactoryprogresswithvoluntarymeasures(pp18)
• Supportmeasuresforcommunicatingthe‘energydensity’ofproductsinaneasilyintelligiblewayforconsumerswhomaybelesshealthliterate(pp19).
Onphysicalactivity/‘energyout’measures,thereisastatedundertakingtocreateenvironmentsthatmakewalkingandcycling‘partofeverydaylifeforeveryone’,throughaspectsofexistingtransportandplanningpolicies,forexample:
• DeliveringtheCyclingActionPlan(describedabove)withitsambitionthat10%ofalljourneysaremadebybikeby2020(pp20)
• WorkingwithArchitectureandDesignScotlandtoinvestigatethepotentialfor‘activetravel’featuresandfacilitiesinnewandrefurbishedbuildings(pp21)
• Reducingcommunitycrimeanddisordertoincreasesafetyandtheperceptionofsafetythathasbeenhighlightedasanimportantconsiderationintravelandrecreationchoices(seesection3.3(ii))(pp21).
TheserepresentonlyafewselectedexamplesofpossibleactionsthatarewithinthecurrentremitoftheScottishParliamentandthatcouldpotentiallycontributetoagenuinelycomprehensivecross-governmentapproachofthesortthathasbeenadvocatedintheUKGovernmentcommissionedForesightreportonobesity.TheRouteMapgivesmanyotherexamplesofinterventionsthatwouldbeconsistentwithoneofmoreofthefourForesight-derivedpriorityactionareasandthatcorrespondto‘moderatetohighpromise’categoriesofevidencepresentedhere.Itisintendedthatthecurrentreport’ssummaryoftheinternationalevidencebase,alongwiththepriorityrankingexercisedescribedinchapter8,willhelpinformtheeventualbalancedportfolioofproposedactionsthatwouldhavethebestprospectofmakingasustainableimpactontherisingprevalenceofoverweightandobesityinScotland.
68 Hungry for Success – A Whole School Approach to School Meals in Scotland: Final Report of the Expert Panel on School Meals. November 2002. http://www.scotland.gov.uk/Publications/2003/02/16273/17566
Chapter7

84
Policy Interventions to Tackle the Obesogenic Environment
8

85
Chapter11
8 Chapter 8 – Prioritising the way forward 8.1 The portfolio matrix and evidence informed policy
Theportfoliomatrixforcategorisingobesitypreventionmeasures,introducedinsection2.6,presentedaframeworkfordecisionmakingthatshouldinprinciplehelppolicymakersdevelopabalancedprogrammeofinterventionproposalsacrossallfourANGELOdomains(i.e.physical,economic,legislativeandsocio-cultural).Althoughoriginallydevelopedasagenerichealthpromotiontemplate,theportfolioapproachisideallysuitedtoobesitybecauseofitsdiverseandrapidlyevolvingevidencebase,togetherwiththecapacityofthematrixframeworktoaccommodatescientificuncertainty.Theportfolioapproachalsoprovidesarationalefortakingarelativelybroadandinclusiveapproachtoevidencefindingandappraisalthatishighlyappropriateforcomplexembeddedpublichealthproblemssuchasobesity.Aswasalsohighlightedinchapter2,traditionalappraisalcriteriaforpublishedevidencetendtofocusonaspectsofstudydesignwhichcanbeverylimitingoutsideofanexperimentaltypesetting.Forthisreason,severalcommentatorshavehighlightedtheneedtoconsideranevidence-informedapproachtoobesitypreventionasopposedtoanevidence-basedapproachandarecentUSInstituteofMedicinepublicationondecisionmakinginobesitypreventionsetsoutadetailediterativeprocessforworkingwithadevelopingevidencebase(TheLEADFramework:Kumanyikaet al2010[158]).TheIOMframeworkemphasisesthevalueoflearningfromongoingpoliciesandpracticesandretainingtheflexibilitytoincorporateimprovementsbasedonanyinsightsgained.
Regardingtheuseoftheportfoliomatrixtocategoriseinterventionshighlightedinpreviouschapters,thefollowingassessmentcriteriafor‘levelofscientificcertainty’and‘potentialpopulationimpact’(tables8.1(a)and8.1(b)),werearrivedatusingthecombinedguidanceofseveralpublishedtemplatesfortranslatingevidenceaboutcomplexpublichealthinterventionsintopractice[24,158,159,160].Akeyprincipleinrelationtothistypeofappraisalistheneedtobeconsciousofthelimitationsofconventionalstudydesigncriteria,alongsidetheimportantcontributionthatobservationalandqualitativeworkcanbring,particularlywithregardtotransferabilityandcontext.
Chapter8

86
Policy Interventions to Tackle the Obesogenic Environment
Table 8.1(a) Portfolio criteria for evaluating level of certainty
Table 8.1(b) Portfolio criteria for evaluating likely population impact
Usingtheseguidancenotes,itispossibletoallocateamatrixpositionforanyproposedinterventiononthebasisoftheinformationavailable.InthefollowingexampletheeconomicandthelegislativedomainsoftheANGELOframeworkhavebeencombinedinonetable.Forconvenience,thecolourcodedtemplatefromchapter2isalsoreproducedbelow.InthiswayitispossibletoassembleacomprehensiveportfolioofinterventionsinthemanneradvocatedbytheForesightteam[2]andbytheWHO[1].
Certainty of effectiveness*
Potential population impact#
Low Moderate High
High
Moderate
Low
Promising
Lesspromising
Leastpromising
Verypromising
Promising
Lesspromising
Mostpromising
Verypromising
Promising
Table 2.4 Portfolio matrix for categorising potential interventions (reproduced as previous)
*Certaintyofeffectiveness–judgedbythequalityoftheevidence,thestrengthoftheprogrammelogicaswellasthesensitivityanduncertaintyparametersinthemodellingofthepopulationimpact(adaptedfromSwinburnet al,2005).
#Potentialpopulationimpacttakesintoaccountinterventionefficacy(impactunderidealconditions),combinedwith‘real-world’reachanduptakeandgenerallyreflectseffectivenessatthesocietallevel,weightedforrelativebaseline‘burdenofattributableillness’.
Levelofcertainty
High
Moderate
Low
Likelyimpact
High
Moderate
Low
Supportinglevelofevidence
Robustcredibleresearchevidence(e.g.:usingconventionalappraisalcriteriabasedonthequalityofstudies),combinedwithconvincingevidenceoftransferabilitytoaUKorScottishsetting(mostlikelytobederivedfromobservationalorqualitativestudies).
Consistentassociationscorroboratedbydifferenttypesofstudydesignalongwithestablishedplausibilityandlowriskofbiasedinterpretation.
Inconsistentreportsand/orquestionableobjectivitybasedonthetypeofinformationsourceorpoorstudyquality/highriskofbias
Supportinglevelofevidence
EvidenceofeffectivenessatpopulationlevelinUKorcomparablecountrywith“effectsize”>=0.05(atleast5%changeinaprimaryoutcomelinkedtohealthyweight).
Effectivenessdemonstratedincommunity/institutionalsettingsandlikelytobetransferabletotheUK/Scotland.
Inconsistentorcontradictoryevidenceofpopulationeffectivenesse.g.confinedtosmallnumbers/subgroupsorwherespecificpre-conditionsapply.
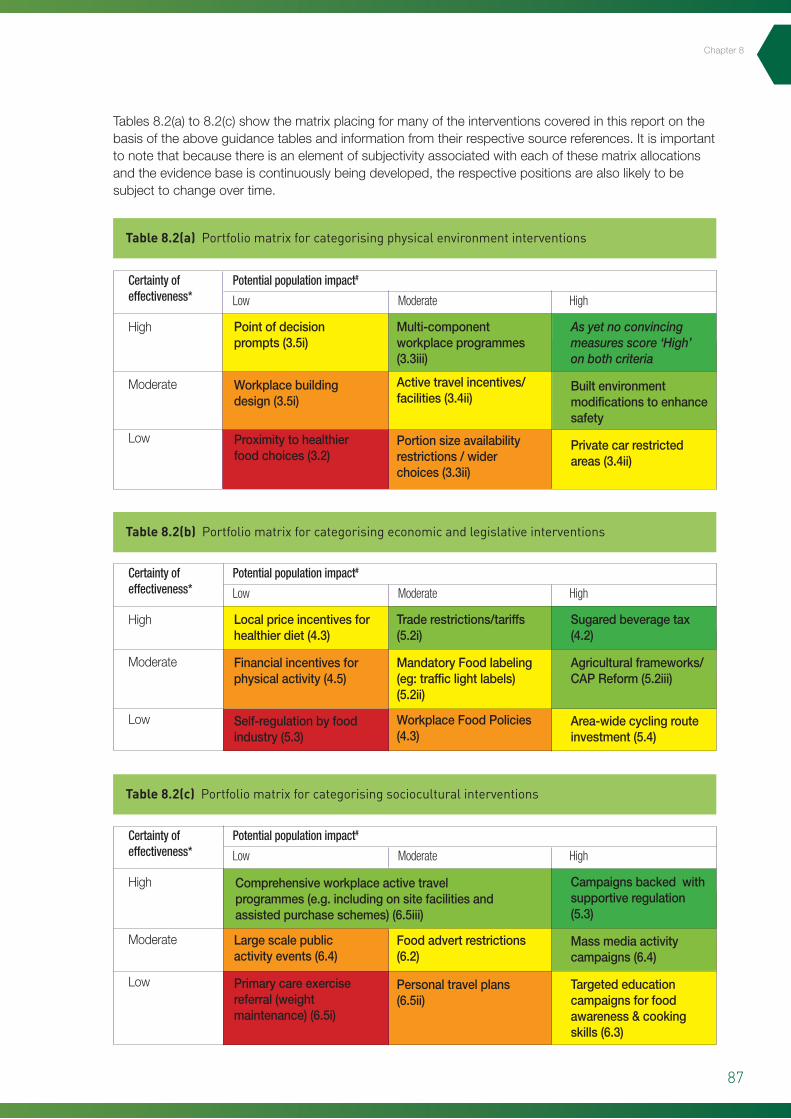
87
Table 8.2(a) Portfolio matrix for categorising physical environment interventions
Table 8.2(b) Portfolio matrix for categorising economic and legislative interventions
Table 8.2(c) Portfolio matrix for categorising sociocultural interventions
Tables8.2(a)to8.2(c)showthematrixplacingformanyoftheinterventionscoveredinthisreportonthebasisoftheaboveguidancetablesandinformationfromtheirrespectivesourcereferences.Itisimportanttonotethatbecausethereisanelementofsubjectivityassociatedwitheachofthesematrixallocationsandtheevidencebaseiscontinuouslybeingdeveloped,therespectivepositionsarealsolikelytobesubjecttochangeovertime.
Certainty of effectiveness*
Certainty of effectiveness*
Certainty of effectiveness*
Potential population impact#
Potential population impact#
Potential population impact#
Low
Low
Low
Moderate
Moderate
Moderate
High
High
High
High
Moderate
Low
High
Moderate
Low
High
Moderate
Low
Pointofdecisionprompts(3.5i)
Workplacebuildingdesign(3.5i)
Proximitytohealthierfoodchoices(3.2)
Localpriceincentivesforhealthierdiet(4.3)
Financialincentivesforphysicalactivity(4.5)
Self-regulationbyfoodindustry(5.3)
Largescalepublicactivityevents(6.4)
Primarycareexercisereferral(weightmaintenance)(6.5i)
Multi-componentworkplaceprogrammes(3.3iii)
Activetravelincentives/facilities(3.4ii)
Portionsizeavailabilityrestrictions/widerchoices(3.3ii)
Traderestrictions/tariffs(5.2i)
MandatoryFoodlabeling(eg:trafficlightlabels)(5.2ii)
WorkplaceFoodPolicies(4.3)
Foodadvertrestrictions(6.2)
Personaltravelplans(6.5ii)
As yet no convincing measures score ‘High’ on both criteria
Builtenvironmentmodificationstoenhancesafety
Privatecarrestrictedareas(3.4ii)
Sugaredbeveragetax(4.2)
Agriculturalframeworks/CAPReform(5.2iii)
Area-widecyclingrouteinvestment(5.4)
Campaignsbackedwithsupportiveregulation(5.3)
Massmediaactivitycampaigns(6.4)
Targetededucationcampaignsforfoodawareness&cookingskills(6.3)
Comprehensiveworkplaceactivetravelprogrammes(e.g.includingonsitefacilitiesandassistedpurchaseschemes)(6.5iii)
Chapter8
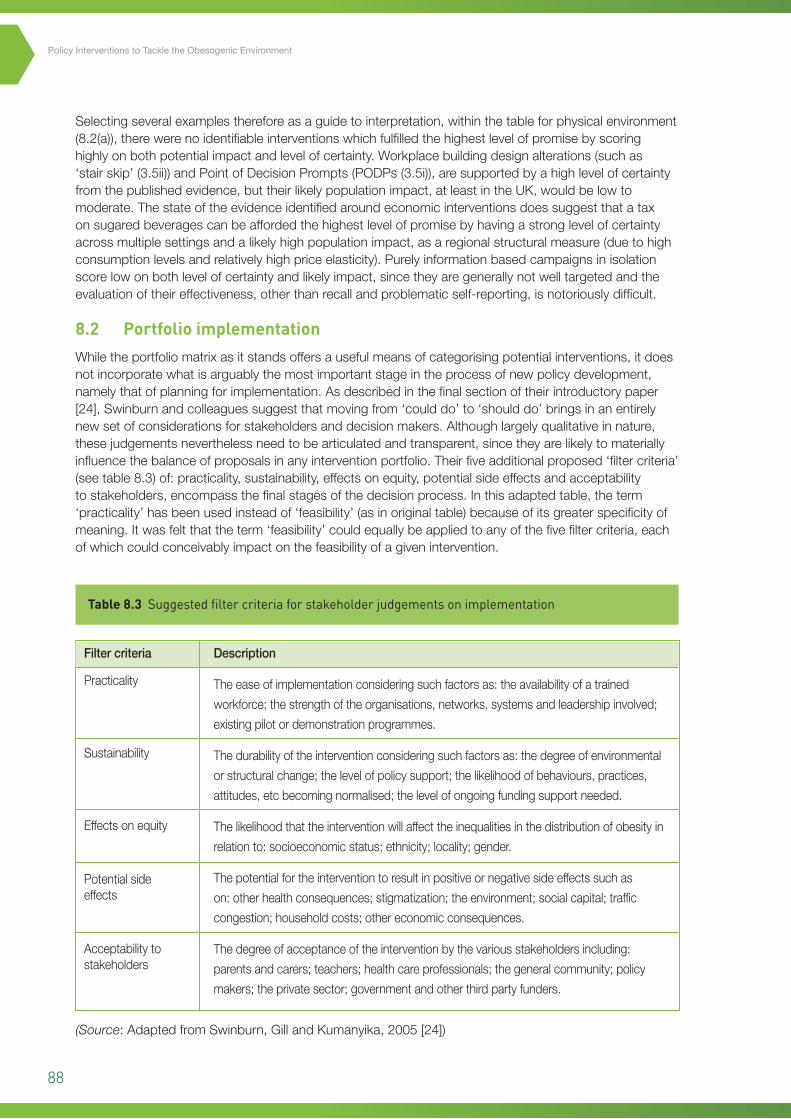
88
Policy Interventions to Tackle the Obesogenic Environment
Selectingseveralexamplesthereforeasaguidetointerpretation,withinthetableforphysicalenvironment(8.2(a)),therewerenoidentifiableinterventionswhichfulfilledthehighestlevelofpromisebyscoringhighlyonbothpotentialimpactandlevelofcertainty.Workplacebuildingdesignalterations(suchas‘stairskip’(3.5ii))andPointofDecisionPrompts(PODPs(3.5i)),aresupportedbyahighlevelofcertaintyfromthepublishedevidence,buttheirlikelypopulationimpact,atleastintheUK,wouldbelowtomoderate.Thestateoftheevidenceidentifiedaroundeconomicinterventionsdoessuggestthatataxonsugaredbeveragescanbeaffordedthehighestlevelofpromisebyhavingastronglevelofcertaintyacrossmultiplesettingsandalikelyhighpopulationimpact,asaregionalstructuralmeasure(duetohighconsumptionlevelsandrelativelyhighpriceelasticity).Purelyinformationbasedcampaignsinisolationscorelowonbothlevelofcertaintyandlikelyimpact,sincetheyaregenerallynotwelltargetedandtheevaluationoftheireffectiveness,otherthanrecallandproblematicself-reporting,isnotoriouslydifficult.
8.2 Portfolio implementation
Whiletheportfoliomatrixasitstandsoffersausefulmeansofcategorisingpotentialinterventions,itdoesnotincorporatewhatisarguablythemostimportantstageintheprocessofnewpolicydevelopment,namelythatofplanningforimplementation.Asdescribedinthefinalsectionoftheirintroductorypaper[24],Swinburnandcolleaguessuggestthatmovingfrom‘coulddo’to‘shoulddo’bringsinanentirelynewsetofconsiderationsforstakeholdersanddecisionmakers.Althoughlargelyqualitativeinnature,thesejudgementsneverthelessneedtobearticulatedandtransparent,sincetheyarelikelytomateriallyinfluencethebalanceofproposalsinanyinterventionportfolio.Theirfiveadditionalproposed‘filtercriteria’(seetable8.3)of:practicality,sustainability,effectsonequity,potentialsideeffectsandacceptabilitytostakeholders,encompassthefinalstagesofthedecisionprocess.Inthisadaptedtable,theterm‘practicality’hasbeenusedinsteadof‘feasibility’(asinoriginaltable)becauseofitsgreaterspecificityofmeaning.Itwasfeltthattheterm‘feasibility’couldequallybeappliedtoanyofthefivefiltercriteria,eachofwhichcouldconceivablyimpactonthefeasibilityofagivenintervention.
Table 8.3 Suggested filter criteria for stakeholder judgements on implementation
Filtercriteria
Practicality
Sustainability
Effectsonequity
Potentialsideeffects
Acceptabilitytostakeholders
Description
Theeaseofimplementationconsideringsuchfactorsas:theavailabilityofatrained
workforce;thestrengthoftheorganisations,networks,systemsandleadershipinvolved;
existingpilotordemonstrationprogrammes.
Thedurabilityoftheinterventionconsideringsuchfactorsas:thedegreeofenvironmental
orstructuralchange;thelevelofpolicysupport;thelikelihoodofbehaviours,practices,
attitudes,etcbecomingnormalised;thelevelofongoingfundingsupportneeded.
Thelikelihoodthattheinterventionwillaffecttheinequalitiesinthedistributionofobesityin
relationto:socioeconomicstatus;ethnicity;locality;gender.
Thepotentialfortheinterventiontoresultinpositiveornegativesideeffectssuchas
on:otherhealthconsequences;stigmatization;theenvironment;socialcapital;traffic
congestion;householdcosts;othereconomicconsequences.
Thedegreeofacceptanceoftheinterventionbythevariousstakeholdersincluding:
parentsandcarers;teachers;healthcareprofessionals;thegeneralcommunity;policy
makers;theprivatesector;governmentandotherthirdpartyfunders.
(Source:AdaptedfromSwinburn,GillandKumanyika,2005[24])
89
Crucially,theseadditionalfilterscouldserveasausefulbasisforconstructivediscussionsaroundthemeritsandfeasibilityofindividualproposals.Thesameapproachhasbeensuccessfullyemployedtocombinetechnical/researchoutputswithcontextual/realworldconsiderations,inthefieldsofmentalhealthandcancerprevention[24].TheyalsorepresentanimportantconceptuallinkwiththeANGELOframework,throughtheexplicitacknowledgementthatnocomplexpublichealthinterventioncanbeimplementedwithoutconsiderationofitswiderpolitical,economic,environmentalandsocialcontext.Thehighlycontextdependentnatureoftheseconsiderationshowever,meansthatthetransferabilityofeven‘wellevidenced’interventionsthathavenotyetbeentestedinaScotland/UKsettingcouldwellbelimited.Inpracticetherefore,assigningadefinitiveplacingtointerventionproposalswithinthegridbecomesarelativelycomplexundertaking.Thefactthatsuchataskisnolongermerelyaresearchbasedexercise,underlinesaneedforthewidestpossiblestakeholderinvolvementinworkingthroughthefivefiltercriteriaintable8.3,inordertoarriveataproperlyinformedassessmentofimplementationfeasibility.Suchabroad‘stakeholdergroup’wouldideallyincludefrontlinepractitionersandrepresentativesofthetargetpopulation,aswellaspolicymakers,withinputfrompublichealthprofessionalsandgovernment.Providedwithashortlistofrelativelyhighpromiseinterventions,discussiongroupscouldthenbeaskedtoallocate‘feasibilityscores’foreachofthefivecriteriaintable8.3,usinga5pointlikertscaleasfollows:
1. Notatallfeasibleinproposedsetting
2. Significantdoubtsaboutfeasibility
3. Feasibleandshouldbepossibletoimplementinproposedsetting
4. Feasibleandeasytoimplementinproposedsetting
5. Highlyfeasiblewithnopracticalproblemsinmostsettings.
Havingdiscussedandscoredeachofthefivecriteria,anoverallaverage‘easeofimplementation’score’couldbederivedforeachproposedintervention.Interventionswitharelativelyrobustevidencebaseandaclearfavourableconsensusoneaseofimplementationwouldrepresentstrongprospectsforinvestment.Therewillinevitablybesomeproposalswhich,despitemeetinganacceptableeffectivenessthreshold,aresimplynotfeasible(e.g.inScotland)atthepresenttime.Inordertofurtherillustratetheprocess,tables8.4aand8.4b,outlinehypotheticalstakeholdercommentsagainsteachofthefiltercriteriafortwointerventions:
• Transportinfrastructureinvestmentprogrammetoimproveactivetravelsafety(anactivityrelatedphysicalenvironmentmeasure:Section3.4)
• Astatutorilyimposedlimitonportionsizesinrestaurants(e.g.byweightortotalcaloriecontent:Section3.3)[Note:notdescribedinreviewasalegislativeinterventioninsection5,sincedealtwithonlyasan‘availability’issueandnostudieswereidentifiedthatmadeuseofstatutorylimits].
Chapter8
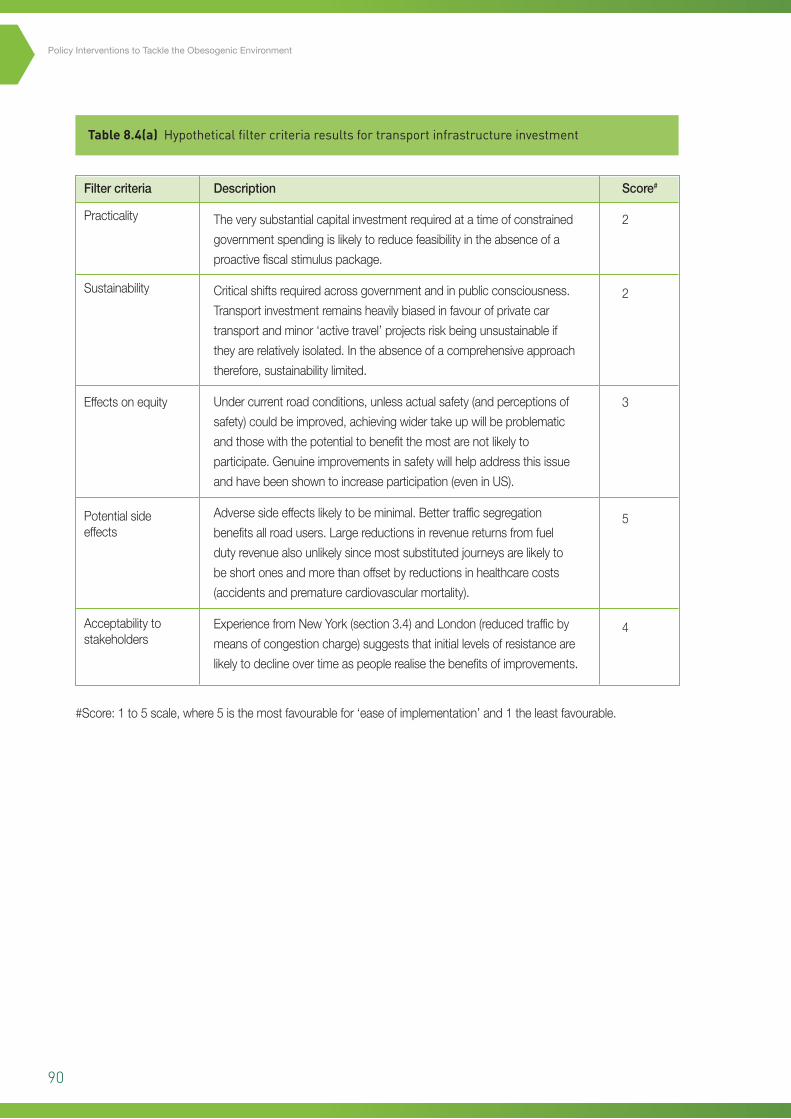
90
Policy Interventions to Tackle the Obesogenic Environment
Table 8.4(a) Hypothetical filter criteria results for transport infrastructure investment
Filtercriteria
Practicality
Sustainability
Effectsonequity
Potentialsideeffects
Acceptabilitytostakeholders
Description
Theverysubstantialcapitalinvestmentrequiredatatimeofconstrained
governmentspendingislikelytoreducefeasibilityintheabsenceofa
proactivefiscalstimuluspackage.
Criticalshiftsrequiredacrossgovernmentandinpublicconsciousness.
Transportinvestmentremainsheavilybiasedinfavourofprivatecar
transportandminor‘activetravel’projectsriskbeingunsustainableif
theyarerelativelyisolated.Intheabsenceofacomprehensiveapproach
therefore,sustainabilitylimited.
Undercurrentroadconditions,unlessactualsafety(andperceptionsof
safety)couldbeimproved,achievingwidertakeupwillbeproblematic
andthosewiththepotentialtobenefitthemostarenotlikelyto
participate.Genuineimprovementsinsafetywillhelpaddressthisissue
andhavebeenshowntoincreaseparticipation(eveninUS).
Adversesideeffectslikelytobeminimal.Bettertrafficsegregation
benefitsallroadusers.Largereductionsinrevenuereturnsfromfuel
dutyrevenuealsounlikelysincemostsubstitutedjourneysarelikelyto
beshortonesandmorethanoffsetbyreductionsinhealthcarecosts
(accidentsandprematurecardiovascularmortality).
ExperiencefromNewYork(section3.4)andLondon(reducedtrafficby
meansofcongestioncharge)suggeststhatinitiallevelsofresistanceare
likelytodeclineovertimeaspeoplerealisethebenefitsofimprovements.
Score#
2
2
3
5
4
#Score:1to5scale,where5isthemostfavourablefor‘easeofimplementation’and1theleastfavourable.
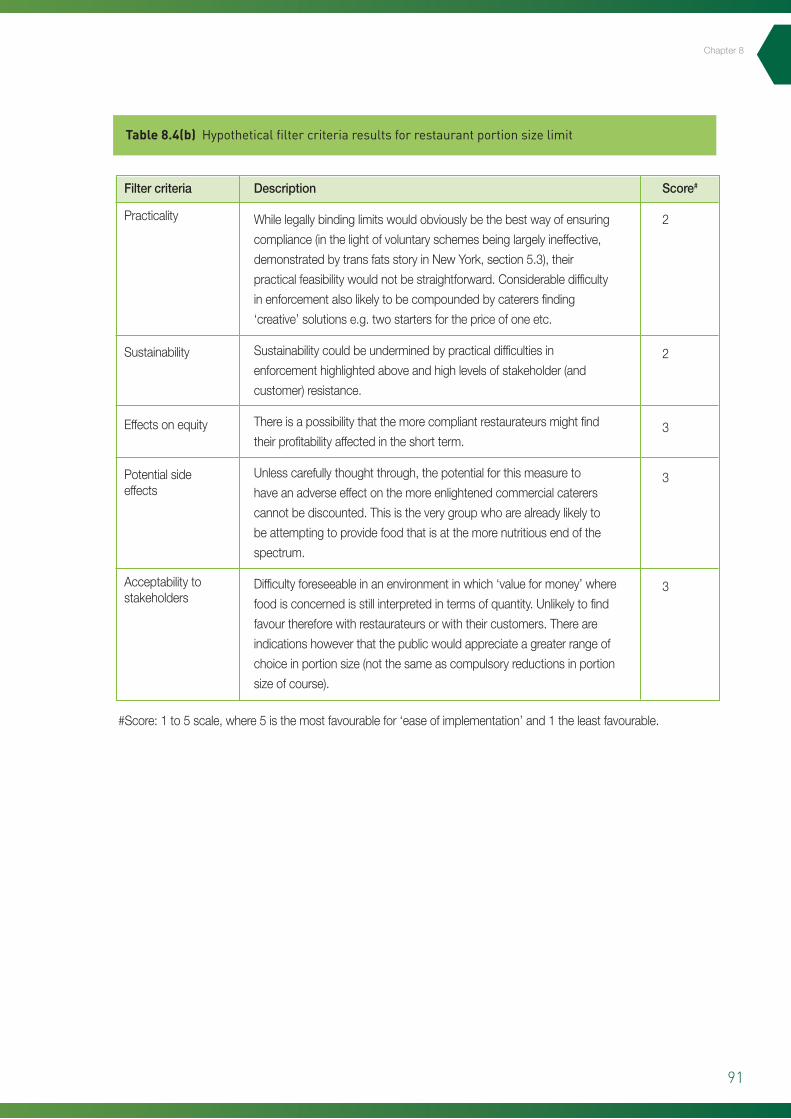
91
Chapter8
Table 8.4(b) Hypothetical filter criteria results for restaurant portion size limit
Filtercriteria
Practicality
Sustainability
Effectsonequity
Potentialsideeffects
Acceptabilitytostakeholders
Description
Whilelegallybindinglimitswouldobviouslybethebestwayofensuring
compliance(inthelightofvoluntaryschemesbeinglargelyineffective,
demonstratedbytransfatsstoryinNewYork,section5.3),their
practicalfeasibilitywouldnotbestraightforward.Considerabledifficulty
inenforcementalsolikelytobecompoundedbycaterersfinding
‘creative’solutionse.g.twostartersforthepriceofoneetc.
Sustainabilitycouldbeunderminedbypracticaldifficultiesin
enforcementhighlightedaboveandhighlevelsofstakeholder(and
customer)resistance.
Thereisapossibilitythatthemorecompliantrestaurateursmightfind
theirprofitabilityaffectedintheshortterm.
Unlesscarefullythoughtthrough,thepotentialforthismeasureto
haveanadverseeffectonthemoreenlightenedcommercialcaterers
cannotbediscounted.Thisistheverygroupwhoarealreadylikelyto
beattemptingtoprovidefoodthatisatthemorenutritiousendofthe
spectrum.
Difficultyforeseeableinanenvironmentinwhich‘valueformoney’where
foodisconcernedisstillinterpretedintermsofquantity.Unlikelytofind
favourthereforewithrestaurateursorwiththeircustomers.Thereare
indicationshoweverthatthepublicwouldappreciateagreaterrangeof
choiceinportionsize(notthesameascompulsoryreductionsinportion
sizeofcourse).
Score#
2
2
3
3
3
#Score:1to5scale,where5isthemostfavourablefor‘easeofimplementation’and1theleastfavourable.
92
Policy Interventions to Tackle the Obesogenic Environment
Withoutanyclaimtobecomprehensive,Tables8.4(a)and8.4(b)atleastservetoillustratesomeofthecomplexitiesinvolvedinassessingtheeaseofimplementationacrossSwinburnandcolleagues’fivecriteria.Thedegreeofsubjectivityandscopeforinfluencebyindividualvalues,prioritiesandprejudicesisalsoreadilyapparentandunderlinesthechallengethatthemanagedconsensusprocesswillinvolve.Ifmanagedwell,however,theresultshouldbeawellbalancedportfolioofrealisticoptionswithclearindicationsonhowstraightforwardeachproposalwouldbetoimplementalongsideitslikelychancesofleadingtoadesirableoutcomeinScotlandatthepresenttime.
8.3 Obesity as a ‘complex adaptive system’
Asameansofaddressingthehighlevelofcomplexityandtheresultsofapplyingmultipleadditionalfiltercriteriaoutlinedintable8.1,themodernobesityepidemichasitselfbeendescribedasexhibitingallthefeaturesofa‘complexadaptivesystem’(CAS).ACASisdefinedasbeing‘composedofmanyheterogeneouspiecesinteractingwitheachotherinsubtleornon-linearwaysthatstronglyinfluencetheoverallbehaviourofthesystem’.ThethreecharacteristicsoftheobesityepidemicwhichmimicaCASare[14]:
• Avastrangeinthelevelsofscalethatisrelevant(e.g.rangingfrommolecular/genetictosocietalandglobal)
• Awidediversityof‘actors’rangingfromsmalllocalretailoutletstomultinationalcorporationsandworldtradeorganisations
• Themultiplicityofmechanismsandprocessesatwork(fromneuronalrewardpathwaysforsatietytothe‘spreading’ofbehavioursinsocialnetworks,andinfluencesfromthebuiltenvironment,aswellaseconomicfactors).
Furthermore,evenwheremechanismsofeffectareclear(e.g.theapparentassociationbetweenaccesstogreenspaceandpropensityforphysicalexercise,leadingtoeffectsonBMIasoutlinedinthePortland/Oregonstudiesreviewedinchapter3),thelinkagesandfeedbackbetweenthesemechanismsarenotnecessarilywellstudiedorwellunderstood.Hammond[14]eloquentlydescribesfivegeneralfeaturesofaCASwhichcouldhaveimportantimplicationsforanti-obesityinterventions,whichare(i)individualityof‘actors’(whichcanbepeople,largersocialunits,governmentsetc);(ii)‘actor’heterogeneityateachlevel(e.g.ingoals,rules,adaptiverepertoire,andconstraints);(iii)complexinterdependence;(iv)emergence:CASsareoftencharacterisedbyemergentunexpectedphenomena(e.g.patternsofcollectivebehaviourthatforminthesystemasawhole);and(v)tipping:CASscanalsoexhibitthephenomenonof‘tipping’inwhichintrinsicnon-linearitycanmeanthatsmallchangesresultinmassivelydisproportionatesystemoverhaul,orrecalibrationtoanew‘equilibrium’.
Consideringobesityasacomplexadaptivesystemhelpstounderlinetwobasicprinciplesaboutplanninginterventions,thesebeing:
• thatsinglecomponentinterventionsbythemselvesareunlikelytosucceed
• itisimportantnottooverlookthecumulativeeffectsofanumberofsmallchanges.
Singlecomponentinterventionsareunlikelytohaveameasurableimpact,particularlyonweightoutcomes,firstlybecauseofthealmostuniversallysmalleffectsizesseenthroughoutthisreport,andsecondly,fromthetendencyofcomplexsystemstopreserve‘equilibrium’(individualsforexamplemaycompensateformorephysicalactivitybyincreasingtheirfoodintake[161]).Withregardto‘smallchanges’,ajointtaskforcereportledbytheAmericanSocietyforNutrition,advocatedasocietalapproachtotacklingobesitybasedonincrementalsmallchangesinbothdietandphysicalactivity.FirstproposedbyHillandcolleagues[20],the‘smallchanges’approachisbasedontheprinciplethatsmallchangesinhabitarelikelytobemoresustainablethanmajorlifestylechanges.Italsoarisesfromthe
93
Chapter8
observationthatweightgainthroughouttheadultlife-courseismediatedbyverymarginalimbalancesinenergyintakeandexpenditure.Thespecialtaskforcereportcitesanumberofexampleswheresmallchangeinterventionshaveproventobesuccessfulinchangingweightoutcomesandinalteringenvironmentaldeterminants.Theexamplescoverseveralinterventionsalreadydiscussedindetailinthisreport,includingreductionsinportionsizes(section3.3),replacinghelpingsofsugarsweetenedbeverageswithsugarfreealternatives(section4.2)andsimplepointofdecisionprompts(PODPs)forincreasingstairuse(section3.5).
Amultiplesmallchangesprogrammethereforeadherestobothoftheaboveprinciplesindealingwithacomplexadaptivesystem.Theobjectivesofsuchaprogrammewouldbefirsttostabiliseobesityratesbyreducingorhaltingtheriseinprevalencebeforefocusinginturnonreducingtheabsoluteprevalenceofobesity.Thebasicunderlyinglogicissimplythatiftheobesityepidemichasbeencausedbythegradualconcurrenceofmanydifferentdriversateveryscaleinthemodernworldbeing‘ratcheted’inonedirection[16,26],thenitshouldbepossibletounpicktheprocessbymultiplesmallratchetsintheoppositedirection.Giventheproblemsthatcanarisefromtryingtoengagedifferentstakeholderswhocanbefarapartintheirimmediateobjectives,Hills’sreportfortheUSNutritionTaskForceenvisagesthatthesmallchangesapproachcouldprovideacommonfocusforallstakeholderstobothcoordinatetheiractions,whilstmakingtheirowndistinctcontribution[20].Thefactthatbydefinitionthechangesdonotneedtobemassive,shouldalsohelpmitigateresistancefromvestedinterests,whichcanbeamajorstumblingblockasillustratedbytheeffortsaroundtradetariffsandfoodlabellinginsection5.2.Inthemostoptimisticscenariooutlinedinthereport,theauthorsuggeststhattheeffectofmultiplecoordinatedsmallchangesoperatingintherightdirection,mightbesufficienttopushmodernsocietiestoanew‘tippingpoint’wherethepossibilityofreversingobesitytrendscouldfinallybearealprospect.Thiswouldofcourseonlyberealisticwhenamajorityofthesubtleobesogenicpolicyandenvironmentaldrivershaveswitchedinasufficientlycomplimentaryandconvergentmannerthattheyeffectivelyre-inforceeachotherandbringaboutaseismicshiftintheoveralldirectionoftravel.
8.4 Combining public health and economic perspectives
Whilethehealthbenefitsfromtacklingobesityshouldmakeasufficientcaseintheirownrighttopersuadepolicymakersthatpreventionmeasureswouldmakeworthwhileinvestments,itshouldalsobeborneinmindthatallgovernmentscontinuallyfaceawidevarietyofdemandsandproposalsthatcallupontheirattentionandresourcesatanyonetime.Withchapter4ofthisreportalreadydevotedtotheeconomicenvironmentandalmosteverypotentialinterventionhavingsomecostimplicationsfromsomestakeholder’sperspective,itisclearthattheeconomiccaseforobesitypreventionmustbeset alongsidethepublichealthrationale,especiallyundertheconditionstimesofconstrainedpublicexpenditure,whichboththegovernmentsofScotland67andtheUKarelikelytobeoperatingunderfortheforeseeablefuture.Onehighlyarticulateaccountofdrawingtogetherpublichealthandeconomicperspectives,wasarecentdiscursivereviewbyBleichandSturmonpolicysolutionstoincreasephysicalactivityintheUS[162].Inclassicaleconomicsforinstance,neitherhealthcompromisingbehavioursnortheiradverseoutcomeslikeobesity,arethemselvesajustificationforgovernmentintervention.Similarly,anyhealthriskbyitselfisnotviewedbyeconomicsasaproblem,unlessithasarisenasaconsequenceofmarketfailuretooptimisetheallocationofresources.Generallyspeaking,therearethreebroadtypesofsituationwheremarketsfailtooptimallyallocateresources:publicgoods(oncetheyarefreelyavailable,nobodyhasanincentivetopayforthem),externalities(sideeffectsarisingfromproductionorconsumptionofagood,butnotincludeintheprice)andinformationasymmetry(whereonepartyisnotfullyawareofthelikelybenefitsorrisks).
67 Scotland’ Public Finances: Preparing for the Future. Audit Scotland; November 2009. http://www.audit-scotland.gov.uk/docs/central/2009/nr_091105_scottish_public_finances.pdf
94
Policy Interventions to Tackle the Obesogenic Environment
Marketfailuresarisingfrompublicgoodsandexternalitiesaremoreapplicabletophysicalactivity,whilethosearisingfrominformationimbalancearemorelikelytoberelatedtofood[162].Theeconomiccaseforinterventionisusuallyapparentfromanexaminationofwheremarketfailurearises.Examplescoveredinthisreportinclude:
• Thesupplementarytaxonsugaredbeveragesinchapter4(tocountertheinformationimbalanceforconsumersregardingtherisk)
• Measurestoincreasepedestriansafetytoreducetheexternalitiesofdriving(section3.4)
• Increasedavailabilityofsaferecreationspace(increasingthesupplyofpublicgoods)(section3.4).
Inthisway,instancesofmarketfailureapplytoalmostallenvironmentaldriversforobesity,sincepeopleareoftennotfullyinformedaboutlongtermrisksoralternatives,andtheobesogenicbehaviourbecomeseffectivelythelineofleastresistance.Theeconomiccasetherefore,isusuallycomplementarytotraditionalpublichealthevidenceofeffectiveness,particularlywhenactualchoicesandbehavioursaremorecloselyalignedwithanindividual’sownpreferredoutcomes(e.g.goodhealthandhealthyweight).
8.5 Historical public health parallels
Thesearchforhistoricalparallelscanoftenbeausefulsourceoffreshinsightsintocurrentproblemsthathavesimilaritieswiththe‘insurmountable’issuesofthepast.Victorianpublichealthmeasures(i.e.hygiene)forexample,althoughbasedonanincompletebiologicalunderstandingoftheinfectiousaetiologyofmuchprevalentdiseaseatthattime,amountedtoacombinationofsubstantialinfrastructuralinvestmentstodevelopgoodsanitation,aswellaslargescaleinformationcampaignstochangepersonalhabits,evenincludingproscribingofsomeofthosehabits(e.g.spittinginthestreet)[163].ThiswasatimebeforemodernpublichealthdivergedintowhatRaynerlabelsasitstwoconstituent‘rulingorthodoxies’,namelythebiomedicalmodelversusthehealthychoicesmodel.Manynowconsiderthis‘split’tohavebeenadetrimentalstepandtherehasbeenastrongcasemadeforareturntoamore‘ecological’orwholesystemperspective,whichgenuinelyreflectsthedegreeofcomplexityassociatedwithmulti-factorialpublichealthissueslikeobesity[163].Inresponse,thereisnowavarietyofpublishedecological/wholesystemsmodelsdealingspecificallywiththeobesogenicenvironment,themostcomprehensiveofwhichisthatproducedaspartoftheUKGovernment’scommissionedForesightReportdiscussedinchapter7.
Aboveall,ecologicalmodelsemphasisethecomplicatedinterplaybetweendifferentdriversacrossallofthefourmajordomainsoftheANGELOframework.TheymayalsohelptofacilitateareturntothepracticalsolutionorientatedmeasuresthatcharacterisedtheVictorianapproach.Inspiteofanincompleteunderstandingofcontemporarycommondiseasesandthemassivescaleofthechallenge,theydevotedverysignificanteffortsandresourcestowardscombatingwhatwasinmanyrespectsa‘toxicenvironment’withregardtoinfectiouspathogens.Theoneadvantagethattheydidhavewhencomparedtothecurrentobesityepidemic,waswidespreadpublicconcerndrivenbytherapiditywithwhichcholera,typhoidandsimilarepidemicsdeveloped,combinedwithastrongenoughpoliticalwilltoimplementstructuralinterventions.Thepoliticalpressure,incontrast,forgovernmentstoactonobesitypreventionislargelyprofessionallyled[164],eventhoughmainstreammediamaintainsarelativelyhighprofileforthecrisis.Victorianinfectiousdiseaseoutbreaksexertedavisiblylethalandrapideffectonmortality,asopposedtothe‘slowburn’25-yeartimeframeofexcessmortalityattributabletoobesity.Ironically,forbothmodernchronicobesity-relateddiseaseandtheVictorianinfectiousdiseaseepidemics,nosectorofsocietywasimmune.Amoreappropriatepublichealthanalogytherefore,isprobablytobaccosmoking,whereincreasinglycompellingscientificevidencepromptedaprofessionallyledcampaignthateventuallychangedpublicattitudesenoughtosupportmeasures,suchasbansonpublicareasmokingwhichwouldhaveseemeddraconian,eventenyearspreviously.Althoughtobaccoiscertainlydifferent,insofarasthereisnosuchthingasa‘healthysmoke’,andinvoluntaryexposure(i.e.forcedconsumption)ofobesogenicfoodisrare,therearestrongsimilaritiesinthecurrentattitudeanddefencesofthefoodindustrytocallsforstructuralcontrols[165,166].
95
Chapter8
8.6 Integration with other political and health priorities
Advocatesforpublichealthactiononobesitypreventioncancertainlytakesomeencouragementfromthe‘tobaccojourney’,inthatprofessionallyledattemptstoaltertheculturearoundsmokingeventuallydeliveredontheirpromise,intheformofeffectivetaxesandagreatlydiminishedsocialacceptabilityofsmoking.Makingthecase,however,thatsomedietaryconstituentsareintrinsicallybad,orthatcertainseeminglyharmlessleisuretimepursuits(suchasintensiveTVwatching)shouldbeavoidedorminimised,ismuchlesslikelytobegratefullyreceivedandactedupon.Takingaccountofsuchconsiderations,combinedwithanestablishedreluctanceofthegeneralpublictobetoldwhattodobyhealthservicesandgovernment,itishardlysurprisingthatcallsforlargescaleactionstotackleobesitydriversarelargelyrestrictedtohealthandotherprofessionals,whoarecontinuallyconfrontedwiththeconsequences[164].Inlobbyingtermsfromapolitician’spointofview,thismakesforarelativelysmallconstituencyandonethatisunlikelytoreceiveagreatdealofattentioninthefaceofsomanyotherpressingprioritiesandresponsibilities.Giventheverybroadscopeofobesitydriversandtheirhighdegreeof‘sharedpathology’orcommonunderlyingcauses(e.g.over-consumption)withseveralothermajorpublichealthproblems,thereisplentyofscopeforcombiningactionstomitigateobesitywithotherhighprofilecampaignsinthepolitical/publicarena.Themostnotableofthesetwotargetsarehealthinequalities[167]andclimatechange[168].
i. Health inequalities
Forawidevarietyofreasons,sectionsofthepopulationwhoexperiencerelativelyhigherlevelsofsocioeconomicdeprivationarenotaswellequippedtodealwiththenegativepressuresonhealthstatusexertedbymanyobesitydrivers.FromEnglishpopulationdataatleast,thesteepincreasesinchildobesitythroughtheearly2000s(whichwerealsoseeninScotland),wereclearlymoremarkedinchildrenfromlowerincomefamilies.Interestinglyinoneparticularlywellpoweredstudybasedontwonationalsurveysources[169],therewasastrongerassociationforincomethanforsocialclassitself,leadingtheauthorstospeculateonthelikelyimportanceofbudgetaryconstraintsasabarriertoahealthyhouseholddiet.Amajorinternationalsystematicreviewpublishedin1999,basedpurelyonlongitudinalstudies,alsofoundastrongandconsistentassociationbetweenchildhoodsocioeconomicstatusandincreasedobesityinadulthood[170].TherelativeabsenceofanysocialgradientforadultobesityinScotland(exceptforthemarginallyincreasedriskforwomeninlowersocialclassesandaslightinverseriskformen[seesection2.3]),maysuggestthatthereachoftheepidemicissouniversalthatallgroupsaresimilarlyaffectedbyadulthood.AlthoughtheepidemiologyofobesityinScotland(chapter2)isnotprofoundlysociallypatterned,itonlyrequiresacursoryconsiderationofthefourANGELOdomainstobegintoappreciatetheincreasedchallengesthatarelikelytoariseinassociationwithsocialdeprivation.Table8.3summarisestheselikelyadditionalbarriersand,aswithpreviousillustrativetablesinthischapter,itdoesnotsetouttobeexhaustive.Mitigationstrategiesthathavealreadybeendiscussedarealsoincludedforeachexample.Althoughthesocietywideprevalenceofobesitymayrenderasociallytargetedpreventionprogrammeineffective,therearestrongsocioeconomicexacerbatingfactorsacrossallfourANGELOinterventiondomainsthatcouldconceivablybeaddressedbywellevidencedinterventionsdiscussedpreviouslyinthisreport.
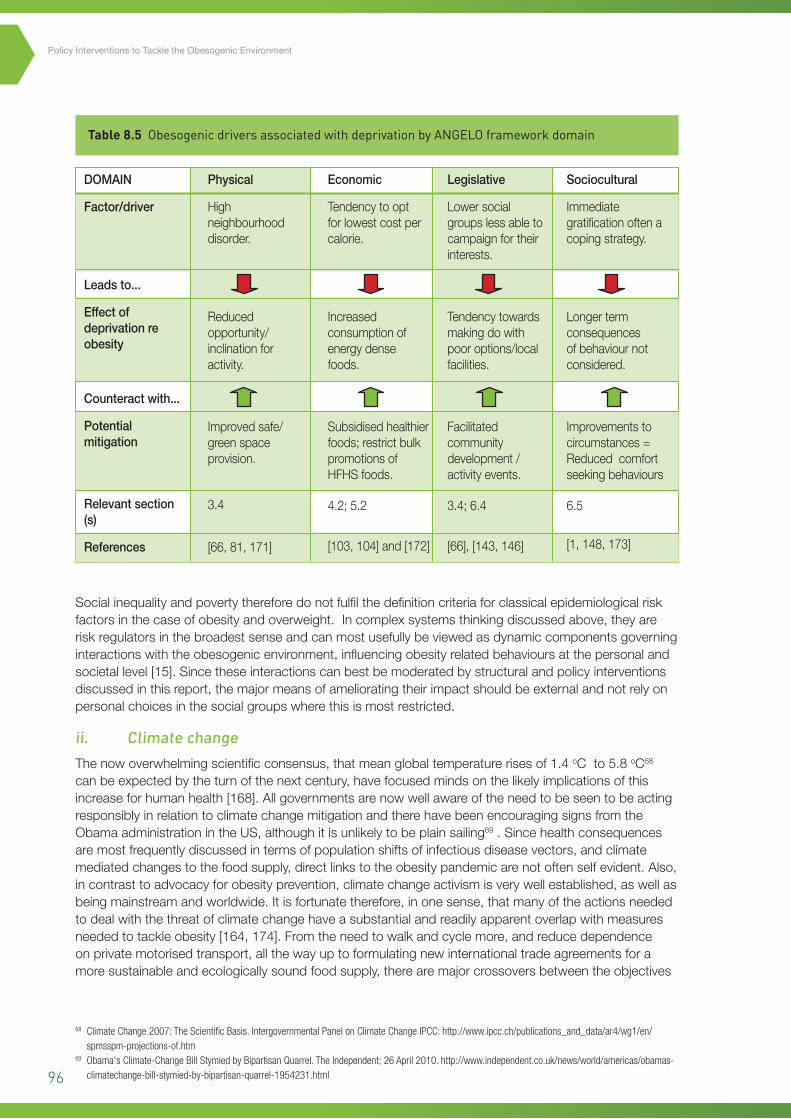
96
Policy Interventions to Tackle the Obesogenic Environment
Table 8.5 Obesogenic drivers associated with deprivation by ANGELO framework domain
Socialinequalityandpovertythereforedonotfulfilthedefinitioncriteriaforclassicalepidemiologicalriskfactorsinthecaseofobesityandoverweight.Incomplexsystemsthinkingdiscussedabove,theyareriskregulatorsinthebroadestsenseandcanmostusefullybeviewedasdynamiccomponentsgoverninginteractionswiththeobesogenicenvironment,influencingobesityrelatedbehavioursatthepersonalandsocietallevel[15].Sincetheseinteractionscanbestbemoderatedbystructuralandpolicyinterventionsdiscussedinthisreport,themajormeansofamelioratingtheirimpactshouldbeexternalandnotrelyonpersonalchoicesinthesocialgroupswherethisismostrestricted.
ii. Climate change
Thenowoverwhelmingscientificconsensus,thatmeanglobaltemperaturerisesof1.4oCto5.8oC68canbeexpectedbytheturnofthenextcentury,havefocusedmindsonthelikelyimplicationsofthisincreaseforhumanhealth[168].AllgovernmentsarenowwellawareoftheneedtobeseentobeactingresponsiblyinrelationtoclimatechangemitigationandtherehavebeenencouragingsignsfromtheObamaadministrationintheUS,althoughitisunlikelytobeplainsailing69.Sincehealthconsequencesaremostfrequentlydiscussedintermsofpopulationshiftsofinfectiousdiseasevectors,andclimatemediatedchangestothefoodsupply,directlinkstotheobesitypandemicarenotoftenselfevident.Also,incontrasttoadvocacyforobesityprevention,climatechangeactivismisverywellestablished,aswellasbeingmainstreamandworldwide.Itisfortunatetherefore,inonesense,thatmanyoftheactionsneededtodealwiththethreatofclimatechangehaveasubstantialandreadilyapparentoverlapwithmeasuresneededtotackleobesity[164,174].Fromtheneedtowalkandcyclemore,andreducedependenceonprivatemotorisedtransport,allthewayuptoformulatingnewinternationaltradeagreementsforamoresustainableandecologicallysoundfoodsupply,therearemajorcrossoversbetweentheobjectives
68 Climate Change 2007: The Scientific Basis. Intergovernmental Panel on Climate Change IPCC: http://www.ipcc.ch/publications_and_data/ar4/wg1/en/spmsspm-projections-of.htm
69 Obama's Climate-Change Bill Stymied by Bipartisan Quarrel. The Independent; 26 April 2010. http://www.independent.co.uk/news/world/americas/obamas-climatechange-bill-stymied-by-bipartisan-quarrel-1954231.html
DOMAIN
Factor/driver
Leadsto...
Effectofdeprivationreobesity
Counteractwith...
Potentialmitigation
Relevantsection(s)
References
Physical
Highneighbourhooddisorder.
Reducedopportunity/inclinationforactivity.
Improvedsafe/greenspaceprovision.
3.4
[66,81,171]
Economic
Tendencytooptforlowestcostpercalorie.
Increasedconsumptionofenergydensefoods.
Subsidisedhealthierfoods;restrictbulkpromotionsofHFHSfoods.
4.2;5.2
[103,104]and[172]
Legislative
Lowersocialgroupslessabletocampaignfortheirinterests.
Tendencytowardsmakingdowithpooroptions/localfacilities.
Facilitatedcommunitydevelopment/activityevents.
3.4;6.4
[66],[143,146]
Sociocultural
Immediategratificationoftenacopingstrategy.
Longertermconsequencesofbehaviournotconsidered.
Improvementstocircumstances=Reducedcomfortseekingbehaviours
6.5
[1,148,173]
97
Chapter8
ofbothmajoragendas.Interventionswhichpromotehealthyeatingorphysicalactivity,butwhichareenactedforotherreasons,couldbeconsidered‘stealthinterventions’.
Environmentalsustainability,liketheobesityepidemic,hasallthefeaturesofacomplexsystemsproblem,althoughpublicappreciationofcomplexityinthecaseofthelatterremainsrelativelylimited[172].Sincemanyofthesocietalchangesforbothproblemshavesubstantialoverlaps,itshouldbefeasibletodovetailobesitypreventioneffortsintotheenvironmentalsustainabilityagenda,wherethereisalreadywidespreadpublicengagement.Huangelegantlydescribesasix-phasestrategyforconvergingeffortsinthesethetwoareas[15,174]:
i. Framingobesityasacomplexsystemsissueinboththescientificandpublicspheres
ii. Emphasisingcrosslevelandcrossdisciplinaryhypothesesattheoutsetofresearch
iii. Investinginthetestingandevaluationofupstreaminterventions
iv. Increasingthecapacitytoconductmulti-levelresearchandpolicytranslation,bybuildingcoalitionsandtraininganewgenerationofmultilevelscientistsandpractitioners
v. Developingandapplyingsystems-sciencemethodologiestotheobesityproblem
vi. Cultivatingaglobalperspective.
Thecalltoincreasecapacityforresearchinmulti-levelinterventions,isareflectiononthecurrentabsenceofanyrealevidencebaseintheeffectiveuseofthistypeofmodellingforobesityorpublichealthproblemsingeneral.Forwardlookingdocuments,suchastheForesightReportandtheScottishGovernment’srecentlypublishedRouteMapforObesityPrevention70haveclearlygraspedtheneedforawholesystemsapproach.Itishopedthatthisdocument,incombinationwiththeambitiousscopeoftheRouteMap,canbethebeginningofagenuinelybalancedprogrammeofinterventionsthatareabletotarget alltherelevantdomainsandmajordriversatthecoreoftheobesityepidemic.
8.7 Recommendations for next steps
Baseduponthediscussionframeworksandadditionalbroaderrangingconsiderationssetoutinthischapter,itisclearthatanymanagedconsensusprocessneedstobeabletodrawuponabroadandwiderangingmixofexpertiseandexperiencetoderiveapracticableportfolioofpotentialpolicyinterventionstotackleobesity.Inorderforanysuchdiscussionstobemaximallyproductive,thepanelorgroupswouldbenefitfromhavingreadyaccessto:
• AsummaryportfoliomatrixwitheachrecommendationcategorisedbyANGELOdomainanditsrespectivelevelofevidence(followingtheformatoutlinedforcomplexpublichealthinterventionsbySIGN/NICE)
• Anestimateofthepotentialpopulationimpact(e.g.inScotland)ofeachproposedintervention
• Briefguidancenotesforeachstakeholdertoassignfeasibilityscoresaccordingtothe‘thirdaxis’filtercriteriaofpracticality,sustainability,effectsonequity,potentialsideeffectsandacceptabilitytostakeholders.
8.8 Limitations of this review
Sincethereareveryfewaspectsofmodernlivingthatarenotrelatedinsomewaytorisingobesityprevalence,itisvirtuallyimpossibletopresentacomprehensivelistofcontributoryfactorsorpotentialtargetsforintervention.Whilethepublishedscientificliteraturearoundobesityisalsovastandvoluminous,thedifficultiesassociatedwithinvestigatingobesitymeanthatprogressisatdifferentstagesindifferentareasandthequalityofstudiescanbehighlyvariable.Thisreviewsetsouttocategoriseenvironmentalandpolicyinterventionsinsuchawaythattakesaccountoftheirrelativestrengthofevidenceandpotentialpopulationimpact.Itdoessobymakinguseoftwopreviouslyvalidated
70 Preventing Overweight and Obesity in Scotland: A Route Map Towards Healthy Weight. The Scottish Government; 2010. http://openscotland.net/Publications/2010/02/17140721/0
98
Policy Interventions to Tackle the Obesogenic Environment
frameworks,namelytheANGELOsystem(analysisgridforenvironmentslinkedtoobesity)andtheportfoliomatrixforcomplexpublichealthinterventions.Noclassificationsystemwilleverprovideaperfectfitforamulti-dimesionalproblemsuchasobesityandthereareinevitableareasofoverlapanduncertaintywithintheapproachaspresentedinthisreview.Thecapacityofthesystemtoaccommodateuncertaintyandrevisionswhereappropriatehowever,meansthatitcanprovidetherawmaterialforbuildingacomprehensiveinterventionstrategybasedonthecurrentstateoftheevidencebase.Thecriticalphaseofanysetofproposedinterventionsisofcourse‘real-world’implementationandjudgementsaroundpracticality,sustainability,effectsonequity,potentialsideeffectsandtheacceptabilitytostakeholderscanonlybemadewiththeinputfromabroadrangeofrelevantexperienceandexpertise.Thetemplatescoringsystemforthesemoresubjectivediscussionsdoesnotsetouttobeadefinitivequantitativetool,butratherservesasafocusfordecidingontheimplementationfeasibilityofanyspecifiedintervention.
8.9 Overall conclusion
ForthereasonsgivenintheabovechapteritwouldbeinappropriatetoattempttodescribeadefinitivelistofpolicyoptionsthatshouldbeimplementedinordertotacklerisingobesityprevalenceinScotland.Drawingonthefullreporthowever,anumberofgeneralisationscanclearlybederivedthatcouldbeusedtoinformthenextstageintheprocess:
1. Policyoptionstotackletheobesogenicenvironmentarecharacterisedbyanenormousdiversityofapproachesanddrawuponahighlyvariableevidencebasefromobservationalassociationstorandomisedtrials
2. Conventionalcategoriesofevidenceforhealth-careinterventions,basedonhierachicalclassificationsofstudydesign(withrandomisedtrialsbeingthegoldstandard),areofteninsufficienttoaccommodatecomplexembeddedpublichealthissueslikeobesity,wherequestionsoftransferabilityandcontextarecriticalcomponentstothefeasibilityofanyintervention
3. TheavailabilityofvalidatedpolicyframeworkssuchasANGELOandSwinburnandcolleagues’portfoiliomatrix,offersdecisionmakersasystematicmeansofsummarisingpolicyandenvironmentaloptionsalongsideadecisionmakingframeworkthattakesaccountofscientificuncertainty
4. A‘portfolioapproach’alsohelpspromotetheconceptthatanyseriousattempttotackleobesitywillneedtobebasedonamulti-componentapproachthatcanaddressthepowerfulsocial,economicandenvironmentaldriverswhichsustaintheepidemic.Thesuccessofmulti-componenentworkplaceinterventionsprovidesencouragingevidencethatconcertedprogrammesofactioncanresultinrealbenefits
5. Inspiteoftheenormityofthechallengethatobesitypresents,itsharessubstantialcommonalitywithothermajorpublichealthproblemsofourtimesuchasclimatechangeandhealthandsocialinequalities.Implementingevidenceinformedsolutionstorisingobesityisthereforeaquestionofintegratingthetaskcloselywiththeothersubstantialchallengesfacingmodernsociety
6. Ultimatelytherefore,thedecisionsabouthowbesttoprioritisepolicyinterventionoptionstotackleobesitywillneedtobecarefullyappraisedfortheirfeasibilityatalocalandregionallevelalongsidetheircapacitytoachieve‘win-wins’forsocietiesothermajorchallenges.Thepotentialforhighlevelgainsshouldhaveastrongappealforstakeholdersatthenationallevelaswellasenhancingsustainabilitywithminimaladverseimpactsontargetpopulations.
99
References
1. WHO.Interventionondietandphysicalactivity:whatworks–asummaryreport;2009.
2. Foresight:tacklingobesities–futurechoices.Secondedition.London:GovernmentOfficeforScience;2009.
3. NICE.Obesity:theprevention,identification,assessmentandmanagementofoverweightandobesityinadultsandchildren.London:NHS;2006.
4. EmbersonJR,WhincupPH,MorrisRW,WannametheeSG,ShaperAG.Lifestyleandcardiovasculardiseaseinmiddle-agedBritishmen:theeffectofadjustingforwithin-personvariation.EurHeartJ.2005;26:1774–1782.
5. AdamsKF,SchatzkinA,HarrisTB,KipnisV,MouwT,Ballard-BarbashR,HollenbeckA,LeitzmannMF.Overweight,obesity,andmortalityinalargeprospectivecohortofpersons50to71yearsold.NEnglJMed.2006;355:763–778.
6. ScotPHO.ObesityinScotland:anepidemiologybriefing.Edinburgh:ISD;2007.
7. RingbackWeitoftG,EliassonM,RosenM.Underweight,overweightandobesityasriskfactorsformortalityandhospitalization.ScandJPublicHealth.2008;36:169–176.
8. JamesWPT.Thefundamentaldriversoftheobesityepidemic.ObesRev.2008;9:6–13.
9. ZargarAH,MasoodiSR,LawayBA,KhanAK,WaniAI,BashirMI,AkhtarS:Prevalenceofobesityinadults-anepidemiologicalstudyfromKashmirValleyofIndianSubcontinent.JAssocPhysiciansIndia2000,48:1170-1174
10. LangT,RaynerG.Overcomingpolicycacophonyonobesity:anecologicalpublichealthframeworkforpolicymakers.ObesRev.2007;8:165–181.
11. EggerG,SwinburnB.An'ecological'approachtotheobesitypandemic.BMJ.1997;315:477–480.
12. ScholthofKB.Thediseasetriangle:pathogens,theenvironmentandsociety.NatRevMicrobiol.2007;5:152–156.
13. SwinburnB,EggerG,RazaF.Dissectingobesogenicenvironments:thedevelopmentandapplicationofaframeworkforidentifyingandprioritizingenvironmentalinterventionsforobesity.PrevMed.1999;29:563–570.
14. HammondRA:Complexsystemsmodellingforobesityresearch.PrevChronicDis.2009;6:http://www.cdc.gov/pcd/issues/2009/jul/2009_0017.htm.
15. HuangTT,DrewnosksiA,KumanyikaS,GlassTA.Asystems-orientedmultilevelframeworkforaddressingobesityinthe21stcentury.PrevChronicDis.2009;6:A82.
16. SmithD,CummingsS.Obesecities:HowOurEnvironmentShapesOverwieght.GeographyCompass.2009;3:518–535.
17. SimmonsA,MavoaHM,BellAC,DeCourtenM,SchaafD,SchultzJ,SwinburnBA.CreatingcommunityactionplansforobesitypreventionusingtheANGELO(analysisgridforelementslinkedtoobesity)framework.HealthPromotInt.2009;24:311–324.
18. RaineK,SpenceJC,ChurchJ,BouléN,SlaterL,MarkoJ,GibbonsK,HemphillE.Stateoftheevidence:reviewonurbanhealthandhealthyweights.Ottawa:CanadianInstituteforHealthInformation(CIHI);2008.
100
Policy Interventions to Tackle the Obesogenic Environment
19. CohenDA,ScribnerRA,FarleyTA.Astructuralmodelofhealthbehavior:apragmaticapproachtoexplainandinfluencehealthbehaviorsatthepopulationlevel.PrevMed.2000;30:146–154.
20. HillJO.Canasmallchangesapproachhelpaddresstheobesityepidemic?AreportoftheJointTaskForceoftheAmericanSocietyforNutrition,InstituteofFoodTechnologistsandInternationalFoodInformationCouncil.AmJClinNutr.2009;89:477–484.
21. RychetnikL,HaweP,WatersE,BarrattA,FrommerM.Aglossaryforevidencebasedpublichealth.JEpidemiolCommunityHealth.2004;58:538–545.
22. JainA.Fightingobesity.BMJ.2004;328:1327–1328.
23. KamanyikaSK,ParkerL,SimLJ(Eds).Obesitypreventionstrategiesinconceptandpractice.Ch2in:Bridgingtheevidencegapinobesityprevention:Aframeworktoinformdecsionmaking.InstituteofMedicine;NationalAcademiesPress,2010.
24. SwinburnB,GillT,KumanyikaS.Obesityprevention:aproposedframeworkfortranslatingevidenceintoaction.ObesRev.2005;6:23–33.
25. NIPH.Healthydietaryhabitsandincreasedphysicalactivity.UppsalaandStockholm:SwedishGovernmentNationalInstituteofPublicHealth;2005.
26. HillJO,Wyatt,HR,ReedGW,PetersJC.Obesityandtheenvironment:wheredowegofromhere?Science2003;299:853-855.
27. PowellLM,SlaterS,MirtchevaD,BaoY,ChaloupkaFJ.FoodstoreavailabilityandneighborhoodcharacteristicsintheUnitedStates.PrevMed.2007;44:189–195.
28. MorlandK,DiezRouxAV,WingS.Supermarkets,otherfoodstoresandobesity:theatherosclerosisriskincommunitiesstudy.AmJPrevMed.2006;30:333–339.
29. MorlandK,WingS,RouxAD.Thecontextualeffectofthelocalfoodenvironmentonresidents'diets:theatherosclerosisriskincommunitiesstudy.AmJPubHealth.2002;92:1761–1767.
30. MorlandK,WingS,DiezRouxA,PooleC.Neighborhoodcharacteristicsassociatedwiththelocationoffoodstoresandfoodserviceplaces.AmJPrevMed.2002;22:23–29.
31. MaddockJ.Therelationshipbetweenobesityandtheprevalenceoffastfoodrestaurants:state-levelanalysis.AmJHealthPromot.2004;19:137–143.
32. CumminsS,MacintyreS.'Fooddeserts'–evidenceandassumptioninhealthpolicymaking.BMJ.2002;325:436–438.
33. MooneyC.CostandavailabilityofhealthyfoodchoicesinaLondonhealthdistrict.JHumNutrDiet.1990;3:111–120.
34. WhiteM,BuntingJ,MathersJ,WilliamsL,AdamsonA,RaybouldS.Do'fooddeserts'exist?Amulti-level,geographicalanalysisoftherelationshipbetweenretailfoodaccess,socio-economicpositionanddietaryintake.Newcastle:FinalReporttotheFoodStandardsAgency;2004.
35. MacdonaldL,EllawayA,MacintyreS.ThefoodretailenvironmentandareadeprivationinGlasgowcity,UK.IntJBehavNutrPhysAct.2009;6:7.
36. MacintyreS,McKayL,CumminsS,BurnsC.Out-of-homefoodoutletsandareadeprivation:casestudyinGlasgow,UK.IntJBehavNutrPhysAct.2005;2:16.
37. CumminsS,SmithDM,TaylorM,DawsonJ,MarshallD,SparksL,AndersonAS:Variationsinfreshfruitandvegetablequalitybystoretype,urban-ruralsettingandneighbourhooddeprivationinScotland.PublicHealthNutrition2009,12:2044-2050.
101
38. CumminsS,PetticrewM,HigginsC,FindlayA,SparksL.Largescalefoodretailingasaninterventionfordietandhealth:quasi-experimentalevaluationofanaturalexperiment.JEpidemiolCommunityHealth.2005;59:1035–1040.
39. LiF,HarmerP,CardinalBJ,BosworthM,Johnson-SheltonD,MooreJM,AcockA,VongjaturapatN.Builtenvironmentand1-yearchangeinweightandwaistcircumferenceinmiddle-agedandolderadults:portlandneighborhoodenvironmentandhealthstudy.AmJEpidemiol.2009;169:401–408.
40. MichaelYL,YenIH.Invitedcommentary:builtenvironmentandobesityamongolderadults–canneighborhood-levelpolicyinterventionsmakeadifference?AmJEpidemiol.2009;169:409–412;discussion413–404.
41. CumminsS,MacintyreS.Foodenvironmentsandobesity–neighbourhoodornation?IntJEpidemiol.2006;35:100–104.
42. GlanzK,SallisJF,SaelensBE,FrankLD.Healthynutritionenvironments:conceptsandmeasures.AmJHealthPromo.2005;19:330–333,ii.
43. KearneyJM,HulshofKF,GibneyMJ.Eatingpatterns–temporaldistribution,converginganddivergingfoods,mealseateninsideandoutsideofthehome:implicationsfordevelopingFBDG.PublicHealthNutr.2001;4:693–698.
44. StoryM,KaphingstKM,Robinson-O'BrienR,GlanzK.Creatinghealthyfoodandeatingenvironments:policyandenvironmentalapproaches.AnnuRevPublicHealth.2008;29:253–272.
45. SaelensBE,GlanzK,SallisJF,FrankLD.Nutritionenvironmentmeasuresstudyinrestaurants(NEMS–R):developmentandevaluation.AmJPrevMed.2007;32:273–281.
46. BurtonS,CreyerEH,KeesJ,HugginsK.Attackingtheobesityepidemic:thepotentialhealthbenefitsofprovidingnutritioninformationinrestaurants.AmJPublicHealth.2006;96:1669–1675.
47. HillJO,PetersJC.Environmentalcontributionstotheobesityepidemic.Science.1998;280:1371–1374.
48. Ello-MartinJA,LedikweJH,RollsBJ.Theinfluenceoffoodportionsizeandenergydensityonenergyintake:implicationsforweightmanagement.AmJClinNutr.2005;82:236S–241S.
49. RollsBJ,RoeLS,MeengsJS.Saladandsatiety:energydensityandportionsizeofafirst-coursesaladaffectenergyintakeatlunch.JAmDietAssoc.2004;104:1570–1576.
50. SteenhuisIH,VermeerWM.Portionsize:reviewandframeworkforinterventions.IntJBehavNutrPhysAct.2009;6:58.
51. VermeerWM,SteenhuisIHM,SeidellJC.Fromthepoint-of-purchaseperspective:aqualitativestudyofthefeasibilityofinterventionsaimedatportion-size.HealthPolicy.2009;90:73–80.
52. AngellSY,SilverLD,GoldsteinGP,JohnsonCM,DeitcherDR,FriedenTR,BassettMT.Cholesterolcontrolbeyondtheclinic:NewYorkCity'stransfatrestriction.AnnInternMed.2009;151:129–134.
53. AndersonLM,QuinnTA,GlanzK,RamirezG,KahwatiLC,JohnsonDB,BuchananLR,ArcherWR,ChattopadhyayS,KalraGP,KatzDL.Theeffectivenessofworksitenutritionandphysicalactivityinterventionsforcontrollingemployeeoverweightandobesity:asystematicreview.AmJPrevMed.2009;37:340–357.
54. NiMhurchuC,AstonL,JebbS.Effectsofworksitehealthpromotioninterventionsonemployeediets:asystematicreview.BMCPublicHealth.2010;10:62.
55. MarteauTM,AshcroftRE,OliverA.Usingfinancialincentivestoachievehealthybehaviour.BMJ.2009;338:b1415-.
102
Policy Interventions to Tackle the Obesogenic Environment
56. PrattCA,LemonSC,FernandezID,GoetzelR,BeresfordSA,FrenchSA,StevensVJ,VogtTM,WebberLS.Designcharacteristicsofworksiteenvironmentalinterventionsforobesityprevention[ast].Obesity.2007;15:2171–2180.
57. SolerRE,LeeksKD,RaziS,HopkinsDP,GriffithM,AtenA,ChattopadhyaySK,SmithSC,HabartaN,GoetzelRZet al.Asystematicreviewofselectedinterventionsforworksitehealthpromotion:theassessmentofhealthriskswithfeedback.AmJPrevMed.2010;38:S237–S262.
58. NiggCR,AlbrightC,WilliamsR,NicholsC,RendaG,StevensVJ,VogtTM.Arephysicalactivityandnutritionindicatorsofthechecklistofhealthpromotionenvironmentsatworksites(CHEW)associatedwithemployeeobesityamonghotelworkers?JOccupEnvirMed.2010;52:S4–S710.1097/JOM.1090b1013e3181c1078a1093a.
59. PritchardJE,NowsonCA,BillingtonT,WarkJD.Benefitsofayearlongworkplaceweightlossprogramoncardiovascularriskfactors.NutritionandDietetics.2002;59:87–96.
60. LemonSC,PrattCA.Worksiteenvironmentalinterventionsforobesitycontrol:anoverview.JOccupEnvirMed.2010;52:S1–S310.1097/JOM.1090b1013e3181c8527e.
61. KumanyikaS,JefferyRW,MorabiaA,RitenbaughC,AntipatisVJ.Obesityprevention:thecaseforaction.IntJObesRelatMetabDisord.2002;26:425–436.
62. SchillingJM,Giles-CortiB,SallisJF.Connectingactivelivingresearchandpublicpolicy:transdisciplinaryresearchandpolicyinterventionstoincreasephysicalactivity.JPubHealthPolicy.2009;30:S1–S15.
63. BoothKM,PinkstonMM,PostonWSC.Obesityandthebuiltenvironment.JAmDietAssoc.2005;105:110–117.
64. Giles-CortiB,MacintyreS,ClarksonJP,PikoraT,DonovanRJ.EnvironmentalandlifestylefactorsassociatedwithoverweightandobesityinPerth,Australia.AmJHealthPromot.2003;18:93–102.
65. SaelensBE,SallisJF,BlackJB,ChenD.Neighborhood-baseddifferencesinphysicalactivity:anenvironmentscaleevaluation.AmJPublicHealth.2003;93:1552–1558.
66. BlackJL,MacinkoJ.Neighborhoodsandobesity.NutrRev.2008;66:2–20.
67. MobleyLR,RootED,FinkelsteinEA,KhavjouO,FarrisRP,WillJC.Environment,obesity,andcardiovasculardiseaseriskinlow-incomewomen.AmJPrevMed.2006;30:327–332.
68. GardenFL,JalaludinBB.Impactofurbansprawlonoverweight,obesity,andphysicalactivityinSydney,Australia.JournalofUrbanHealth:BulletinoftheNewYorkAcademyofMedicine.2009;86:19–30.
69. FrankLD,SaelensBE,PowellKE,ChapmanJE.Steppingtowardscausation:dobuiltenvironmentsorneighborhoodandtravelpreferencesexplainphysicalactivity,driving,andobesity?SocSciMed.2007;65:1898–1914.
70. LeeIM,EwingR,SessoHD.Thebuiltenvironmentandphysicalactivitylevels:theharvardalumnihealthstudy.AmJPrevMed.2009;37:293–298.
71. LovasiG,MoudonA,PearsonA,HurvitzP,LarsonE,SiscovickD,BerkeE,LumleyT,PsatyB.Usingbuiltenvironmentcharacteristicstopredictwalkingforexercise.IntJHealthGeographics.2008;7:10.
72. SallisJF,BowlesHR,BaumanA,AinsworthBE,BullFC,CraigCL,SjöströmM,DeBourdeaudhuijI,LefevreJ,MatsudoVet al.Neighborhoodenvironmentsandphysicalactivityamongadultsin11countries.AmJPrevMed.2009;36:484–490.
103
73. BrownsonRC,BoehmerTK,LukeDA.DecliningratesofphysicalactivityintheUnitedStates:whatarethecontributors?AnnRevPublicHealth.2005;26:421–443.
74. ForeytJ,GoodrickK.Theultimatetriumphofobesity.TheLancet.1995;346:134–135.
75. HillJO,PetersJC,WyattHR.Usingtheenergygaptoaddressobesity:acommentary.JAmDieteticAss.2009;109:1848–1853.
76. SwinburnBA,SacksG,LoSK,WesterterpKR,RushEC,RosenbaumM,LukeA,SchoellerDA,DeLanyJP,ButteNF,RavussinE.Estimatingthechangesinenergyfluxthatcharacterizetheriseinobesityprevalence.AmJClinNutr.2009;89:1723–1728.
77. OgilvieD,MitchellR,MutrieN,PetticrewM,PlattS.Personalandenvironmentalcorrelatesofactivetravelandphysicalactivityinadeprivedurbanpopulation.IntJBehavNutrPhysAct.2008;5:43.
78. CraigCL,MarshallAL,SjostromM,BaumanAE,BoothML,AinsworthBE,PrattM,EkelundULF,YngveA,SallisJF,OjaP.Internationalphysicalactivityquestionnaire:12-countryreliabilityandvalidity.MedSciSportsExerc.2003;35:1381–1395.
79. TitzeS,StroneggerWJ,JanschitzS,OjaP.Environmental,social,andpersonalcorrelatesofcyclingfortransportationinastudentpopulation.JPhysActHealth.2007;4:66–79.
80. CerveroR,DuncanM.Walking,bicycling,andurbanlandscapes:evidencefromtheSanFranciscoBayarea.AmJPublicHealth.2003;93:1478–1483.
81. StaffordM,CumminsS,EllawayA,SackerA,WigginsRD,MacintyreS.Pathwaystoobesity:Identifyinglocal,modifiabledeterminantsofphysicalactivityanddiet.SocSciMed.2007;65:1882–1897.
82. PucherJ,BuehlerR.Makingcyclingirresistible:lessonsfromtheNetherlands,DenmarkandGermany.TransportReviews.2008;28:495–528.
83. PucherJ,LefevreC.TheurbantransportationcrisisinEuropeandNorthAmerica.London:MacMillanPress;1996.
84. PucherJ,DijkstraL.Promotingsafewalkingandcyclingtoimprovepublichealth:lessonsfromtheNetherlandsandGermany.AmJPublicHealth.2003;93:1509–1516.
85. BaumanAE,BullFC.Environmentalcorrelatesofphysicalactivityandwalkinginadultsandchildren:areviewofreviews.London:NICE;2007.
86. KilloranA,DoyleN,WallerS,WohlgemuthC,CrombieH.Transportinterventionspromotingsafecyclingandwalking:evidencebriefing.NICE;2006.
87. CDCCPS.Recommendationforuseofpoint-of-decisionpromptstoincreasestairuseincommunities.AmJPrevMed.2010;38:S290–S291.
88. SolerRE,LeeksKD,BuchananLR,BrownsonRC,HeathGW,HopkinsDH.Point-of-decisionpromptstoincreasestairuse:asystematicreviewupdate.AmJPrevMed.2010;38:S292–S300.
89. BlameyA,MutrieN,AitchisonT.Healthpromotionbyencourageduseofstairs.1995;311:289–290.
90. NicollG,ZimringC.Effectofinnovativebuildingdesignonphysicalactivity.JPublicHealthPolicy.2009;30:S111–S123.
91. LeicesterA,WindmeijerF.Thefattax:economicincentivestoreduceobesity.TheInstituteforFiscalStudies,Briefingnoteno49;2004.
92. BrownellKD,FriedenTR.Ouncesofprevention–thepublicpolicycasefortaxesonsugaredbeverages.NEnglJMed.2009;360:1805–1808.
104
Policy Interventions to Tackle the Obesogenic Environment
93. BrownellKD,FarleyT,WillettWC,PopkinBM,ChaloupkaFJ,ThompsonJW,LudwigDS.Thepublichealthandeconomicbenefitsoftaxingsugar-sweetenedbeverages.NEnglJMed.2009;361:1599–1605.
94. KimD,KawachiI.Foodtaxationandpricingstrategiesto'thinout'theobesityepidemic.AmJPrevMed.2006;30:430–437.
95. ChriquiJF,ShelbySE,BatesH,KowalczykS,ChaloupkaFJ.Statesalestaxratesforsoftdrinksandsnackssoldthroughgrocerystoresandvendingmachines,2007.JPublicHealthPolicy.2008;29:226–249.
96. LudwigDS,PetersonKE,GortmakerSL.Relationbetweenconsumptionofsugar-sweeteneddrinksandchildhoodobesity:aprospective,observationalanalysis.TheLancet.2001;357:505–508.
97. VartanianLR,SchwartzMB,BrownellKD.Effectsofsoftdrinkconsumptiononnutritionandhealth:asystematicreviewandmeta-analysis.AmJPublicHealth.2007;97:667–675.
98. JamesJ,ThomasP,CavanD,KerrD.Preventingchildhoodobesitybyreducingconsumptionofcarbonateddrinks:clusterrandomisedcontrolledtrial.Vol.328.pp.1237–;2004:1237–.
99. JamesJ,ThomasP,KerrD.Preventingchildhoodobesity:twoyearfollow-upresultsfromtheChristchurchobesitypreventionprogrammeinschools(CHOPPS).BMJ.2007;335:762–.
100.EbbelingCB,FeldmanHA,OsganianSK,ChomitzVR,EllenbogenSJ,LudwigDS.Effectsofdecreasingsugar-sweetenedbeverageconsumptiononbodyweightinadolescents:arandomized,controlledpilotstudy.Pediatrics.2006;117:673–680.
101.SchulzeMB,MansonJE,LudwigDS,ColditzGA,StampferMJ,WillettWC,HuFB.Sugar-sweetenedbeverages,weightgainandincidenceoftype2diabetesinyoungandmiddle-agedwomen.JAMA.2004;292:927–934.
102.NissinenaK,MikkiläV,MännistöS,Lahti-KoskiaM,RäsänenaL,ViikariaJandRaitakariOT.Sweetsandsugar-sweetenedsoftdrinkintakeinchildhoodinrelationtoadultBMIandoverweight.Thecardiovascularriskinyoungfinnsstudy.PublicHealthNutrition.2009;12:2018–2026.
103.AndreyevaT,LongMW,BrownellKD.Theimpactoffoodpricesonconsumption:asystematicreviewofresearchonthepriceelasticityofdemandforfood.AmJPublicHealth.2010;100:216–222.
104.PowellLM,ChaloupkaFJ.Foodpricesandobesity:evidenceandpolicyimplicationsfortaxesandsubsidies.MilbankQuarterly.2009;87:229–257.
105.SturmR,DatarA.Bodymassindexinelementaryschoolchildren,metropolitanareafoodpricesandfoodoutletdensity.PublicHealth.2005;119:1059–1068.
106.ChouS-Y,GrossmanM,SafferH.Aneconomicanalysisofadultobesity:resultsfromthebehavioralriskfactorsurveillancesystem.JHealthEconomics.2004;23:565–587.
107.CutlerDM,GlaeserEL,ShapiroJM.Whyhaveamericansbecomemoreobese?JEconomPerspectives.2003;17:93–118.
108.CawleyJ.Aneconomicframeworkforunderstandingphysicalactivityandeatingbehaviors.AmJPrevMed.2004;27:117–125.
109.Gunning-SchepersLJ.Roamingthroughmethodology.V.Thepreventionparadox:fewwithahighriskversusmanywithamoderaterisk.NedTijdschrGeneeskd.1998;142:1870–1873.
110.FrenchSA,JefferyRW,StoryM,BreitlowKK,BaxterJS,HannanP,SnyderMP.Pricingandpromotioneffectsonlow-fatvendingsnackpurchases:theCHIPSstudy.AmJPublicHealth.2001;91:112–117.
105
111.FrenchSA,HannanPJ,HarnackLJ,MitchellNR,ToomeyTL,GerlachA.Pricingandavailabilityinterventioninvendingmachinesatfourbusgarages.JOccupEnvironMed.2010;52:S29–S3310.1097/JOM.1090b1013e3181c1095c1476.
112.NiMhurchuC,BlakelyT,JiangY,EylesHC,RodgersA.Effectsofpricediscountsandtailorednutritioneducationonsupermarketpurchases:arandomizedcontrolledtrial.InAmJClinicalNutrition.91:736–747;2010:736–747.
113.CahillK,PereraR.Competitionsandincentivesforsmokingcessation.CochraneDatabaseSystRev;2008:CD004307.
114.FinkelsteinEA,BrownDS,BrownDR,BuchnerDM.Arandomizedstudyoffinancialincentivestoincreasephysicalactivityamongsedentaryolderadults.PrevMed.2008;47:182–187.
115.VolppKG,JohnLK,TroxelAB,NortonL,FassbenderJ,LoewensteinG.Financialincentive-basedapproachesforweightloss:arandomizedtrial.JAMA.2008;300:2631–2637.
116.MartinR.TheroleoflawinthecontrolofobesityinEngland:lookingatthecontributionoflawtoahealthyfoodculture.AustNewZealandHealthPolicy.2008;5:21.
117.ClarkeD,McKenzieT.Legislativeinterventionstopreventanddecreaseobesityinpacificislandcountries.WHOWesternPacificRegionalOffice.WHOed.;2007.
118.CollaborationAPCS.TheburdenofoverweightandobesityintheAsia-Pacificregion(AsiaPacificCohortStudiesCollaboration).ObesRev.2007;8:191–196.
119.JacobsonMF.ReviewrequesttoUSAmbassor'sOfficeregardingUSobjectionsraisedin2003reportonforeigntradebarriersPublicLetteredition.Washington:CenterforScienceinthePublicInterest;2004.
120.KummerowFA.Thenegativeeffectsofhydrogenatedtransfatsandwhattodoaboutthem.Atherosclerosis.2009;205:458–465.
121.FSA.Foodlabellingrequirementsqualitativeresearch–finalreport.London;2006.
122.BorgmeierI,WestenhoeferJ.Impactofdifferentfoodlabelformatsonhealthinessevaluationandfoodchoiceofconsumers:arandomized-controlledstudy.BMCPublicHealth.2009;9:184.
123.KellyB,HughesC,ChapmanK,LouieJC-Y,DixonH,CrawfordJ,KingL,DaubeM,SlevinT.Consumertestingoftheacceptabilityandeffectivenessoffront-of-packfoodlabellingsystemsfortheAustraliangrocerymarket.HealthPromotionInt.2009;24:120–129.
124.GrunertK,WillsJ.AreviewofEuropeanresearchonconsumerresponsetonutritioninformationonfoodlabels.JPublicHealth.2007;15:385–399.
125.SacksG,RaynerM,SwinburnB:Impactoffront-of-pack'traffic-light'nutritionlabellingonconsumerfoodpurchasesintheUK.HealthPromotionInt.2009;dap032.
126.HignettR.Frontofpacknutritionlabelling:theUKexperience(inclSainsburys'inhousetrial).FoodStandardsAgency;2008.
127.VythE,SteenhuisI,RoodenburgA,BrugJ,SeidellJ:Front-of-packnutritionlabelstimulateshealthierproductdevelopment:aquantitativeanalysis.IntJBehavNut&PhyAct.2010,7:65.
128.SacksG,VeermanJL,MoodieM,SwinburnB:`Traffic-light'nutritionlabellingand`junk-food'tax:amodelledcomparisonofcost-effectivenessforobesityprevention.IntJObes2010.doi:10.1038/ijo.2010.228
106
Policy Interventions to Tackle the Obesogenic Environment
129.LudwigDS,NestleM.Canthefoodindustryplayaconstructiveroleintheobesityepidemic?JAMA.2008;300:1808–1811.
130.WeyerbrockS.ReformoftheEuropeanUnion'sCommonAgriculturalPolicy:howtoreachGATT-compatibility?EuropeanEconomicReview.1998;42:375–411.
131.GerberdingJL.Saferfatsforhealthierhearts:thecaseforeliminatingdietaryartificialtransfatintake.AnnInternMed.2009;151:137–138.
132.PoobalanA,AucottL,AhmedS,SmithWC.AnalysisoftheUKrecommendationsonobesitybasedonaproposedimplementationframework.BMCPublicHealth.2010;10:17.
133.KahlmeierS,RacioppiF,CavillN,RutterH,PekkaO.'Healthinallpolicies'inpractice:guidanceandtoolstoquantifyingthehealtheffectsofcyclingandwalking.JPhysicalActivityHealth.2010;7:S120–S125.
134.MaibachE,AbromsL,MarositsM.Communicationandmarketingastoolstocultivatethepublic'shealth:aproposed'peopleandplaces'framework.BMCPublicHealth.2007;7:88.
135.SteptoeA,RouxAVD.Happiness,socialnetworks,andhealth.BMJ.2008;337:a2781–.
136.ZimmermanFJ,BellJF.Incomeinequalityandphysicalandmentalhealth:testingassociationsconsistentwithproposedcausalpathways.JEpidemiolCommunityHealth.2006;60:513–521.
137.LivingstoneS.Acommentaryontheresearchevidenceregardingtheeffectsoffoodpromotiononchildren.London:OFCOM;2004.
138.MehtaK.Statutoryrestrictionsonunhealthyfoodmarketingtochildren:thedebatecontinues.PublicHealthNutrition.2010;13:1001–1002.
139.ZimmermanFJ,BellJF.Associationsoftelevisioncontenttypeandobesityinchildren.AmJPublicHealth.2010;100:334–340.
140.GorisJM,PetersenS,StamatakisE,VeermanJL.Televisionfoodadvertisingandtheprevalenceofchildhoodoverweightandobesity:amulticountrycomparison.PublicHealthNutrition.2010;13:1003–1012.
141.FitzpatrickI,MacmillanT,HawkesC,AndersonAS,DowlerE.UnderstandingfoodcultureinScotlandanditscomparisoninaninternationalcontext:implicationsforpolicydevelopment.NHSHealthScotland;2010.
142.AbromsLC,MaibachEW.Theeffectivenessofmasscommunicationtochangepublicbehavior.AnnuRevPublicHealth.2008;29:219–234.
143.SnyderLB,HamiltonMA,MitchellEW,Kiwanuka-TondoJ,Fleming-MiliciF,ProctorD.Ameta-analysisoftheeffectofmediatedhealthcommunicationcampaignsonbehaviorchangeintheUnitedStates.JHealthCommun.2004;9Suppl1:71–96.
144.WongF,HuhmanM,HeitzlerC,AsburyL,Bretthauer-MuellerR,McCarthyS,LondeP.VERB-asocialmarketingcampaigntoincreasephysicalactivityamongyouth.PrevChronicDis.2004;1:A10.
145.HuhmanME,PotterLD,DukeJC,JudkinsDR,HeitzlerCD,WongFL.Evaluationofanationalphysicalactivityinterventionforchildren:VERB(TM)campaign,2002–2004.AmJPrevMed.2007;32:38–43.
146.RegerB,CooperL,Booth-ButterfieldS,SmithH,BaumanA,WootanM,MiddlestadtS,MarcusB,GreerF.Wheelingwalks:acommunitycampaignusingpaidmediatoencouragewalkingamongsedentaryolderadults.PrevMed.2002;35:285–292.
107
147.BowlesH,RisselC,BaumanA.Masscommunitycyclingevents:whoparticipatesandistheirbehaviourinfluencedbyparticipation?IntJBehavNutritionPhysicalActivity.2006;3:39.
148.WilliamsNH,HendryM,FranceB,LewisR,WilkinsonC.Effectivenessofexercise-referralschemestopromotephysicalactivityinadults:systematicreview.BrJGenPract.2007;57:979–986.
149.BrögW,ErlE,KerI,RyleJ,WallR.Evaluationofvoluntarytravelbehaviourchange:Experiencesfromthreecontinents.TransportPolicy.2009;16:281–292.
150.James,B.TravelSmartlarge-scalecost-effectivemobilitymanagement.ExperiencefromPerth,WesternAustralia.London,ROYAUME-UNI:Telford;2002.
151.MöserG,BambergS.Theeffectivenessofsofttransportpolicymeasures:acriticalassessmentandmeta-analysisofempiricalevidence.JEnvironPsychol.2008;28:10–26.
152.ChatterjeeK.Acomparativeevaluationoflarge-scalepersonaltravelplanningprojectsinEngland.TransportPolicy.2009;16:293–305.
153.BonsallP.Doweknowwhetherpersonaltravelplanningreallyworks?TransportPolicy.2009;16:306–314.
154.DianaM,PronelloC.Travelersegmentationstrategywithnominalvariablesthroughcorrespondenceanalysis.TransportPolicy.2010;17:183–190.
155.CairnsS,SlomanL,NewsonC,AnableJ,KirkbrideA,GoodwinP.Smarterchoices:assessingthepotentialtoachievetrafficreductionusing'softmeasures'.TransportReviews:ATransnationalTransdisciplinaryJournal.2008;28:593–618.
156.ChipperfieldT,O'BrienR,BoldersonT,EidinowE,ShafnerL,ParryV.Tacklingobesities:futurechoices–visualisingthefuture:scenariosto2050.Foresighted.London;2008.
157.HigginsM.MappingPublicHealthPolicyDriversinScotland:walkability,cyclabilityandScottishspatialplanningpolicy.MScPublicHealthResearchdissertation,UniversityofEdinburgh,submittedOctober2010.
158.KamanyikaSK,ParkerL,SimLJ(Eds).TheLEADFrameworkforobesitypreventiondecisionmaking.Ch1in:Bridgingtheevidencegapinobesityprevention:Aframeworktoinformdecsionmaking.InstituteofMedicine;NationalAcademiesPress,2010.
159.RychetnikL,FrommerM,HaweP,ShiellA.Criteriaforevaluatingevidenceonpublichealthinterventions.JEpidemiolCommunityHealth.2002;56:119–127.
160.WeightmanA,EllisS,CullumA,SanderL,TurleyR.Gradingevidenceandrecommendationsforpublichealthinterventions:developingandpilotingaframework.NHSHealthDevelopmentAgency.London;2005.
161.AlbarracinD,WangW,LeeperJ.Immediateincreaseinfoodintakefollowingexercisemessages.Obesity(SilverSpring).2009;17:1451–1452.
162.BleichSN,SturmR.Developingpolicysolutionsforamoreactivenation:Integratingeconomicandpublichealthperspectives.PrevMed.2009;49:306–308.
163.RaynerG.Conventionalandecologicalpublichealth.PublicHealth.2009;123:587–591.
164.SwinburnB.Obesityprevention:theroleofpolicies,lawsandregulations.AustraliaandNewZealandHealthPolicy.2008;5:12.
165.BrownellKD,WarnerKE.Theperilsofignoringhistory:bigtobaccoplayeddirtyandmillionsdied:howsimilarisbigfood?MilbankQuarterly.2009;87:259–294.
108
Policy Interventions to Tackle the Obesogenic Environment
166.ChopraM,Darnton-HillI.Tobaccoandobesityepidemics:notsodifferentafterall?BMJ.2004;328:1558–1560.
167.LawC,PowerC,GrahamH,MerrickD.Obesityandhealthinequalities.ObesityReviews.2007;8:19–22.
168.McMichaelAJ,WoodruffRE,HalesS.Climatechangeandhumanhealth:presentandfuturerisks.TheLancet.2006;367:859–869.
169.StamatakisE,PrimatestaP,ChinnS,RonaR,FalaschetiE.Overweightandobesitytrendsfrom1974to2003inEnglishchildren:whatistheroleofsocioeconomicfactors?ArchDisChild.2005;90:999–1004.
170.ParsonsTJ,PowerC,LoganS,SummerbellCD.Childhoodpredictorsofadultobesity:asystematicreview.IntJObesRelatMetabDisord.1999;23Suppl8:S1–107.
171.SaelensBE,SallisJF,FrankLD.Environmentalcorrelatesofwalkingandcycling:findingsfromthetransportation,urbandesign,andplanningliteratures.AnnBehavMed.2003;25:80–91.
172.BirtC.ACAPonHealth.FacultyofPublicHealth;1997.
173.YamamotoJ,YamamotoB,Yamamoto.Adolescentfastfoodandrestaurantorderingbehaviorwithandwithoutcalorieandfatcontentmenuinformation.JAdolHealth.2005;37:397–402.
174.HuangTT.Solution-orientedresearchconvergingeffortsofpromotingenvironmentalsustainabilityandobesityprevention.AmJPrevMed.2009;36:S60-62.

109

110
Policy Interventions to Tackle the Obesogenic Environment