Embed Size (px)
Citation preview

The world’s leading sustainability consultancy
Policy Implementation in British Columbia, Canada
Leslie Bol (ERM)
IAIA Symposium November 14, 2017
The business of sustainability
Objectives of Research and Analysis
• Extent of provincial policy incorporation into environmental assessments
• Steps of the mitigation hierarchy prioritized for species at risk
• Avoidance type for species at risk

The business of sustainability
Mitigation Hierarchy Location
Means Timing
Avoid
Minimize
Restore On-Site
Offset
The business of sustainability
Species at Risk in Canada
• Committee on the Status of Endangered Wildlife in Canada (COSEWIC)
• Species added to Schedule 1 of Species at Risk Act (SARA)
• Critical habitat identified for Threatened and Endangered species

The business of sustainability
Best Case Scenario Mitigation Hierarchy
0 20 40 60 80 100
Offsetting
On-Site Restoration
Minimization
Avoidance
Percent

The business of sustainability
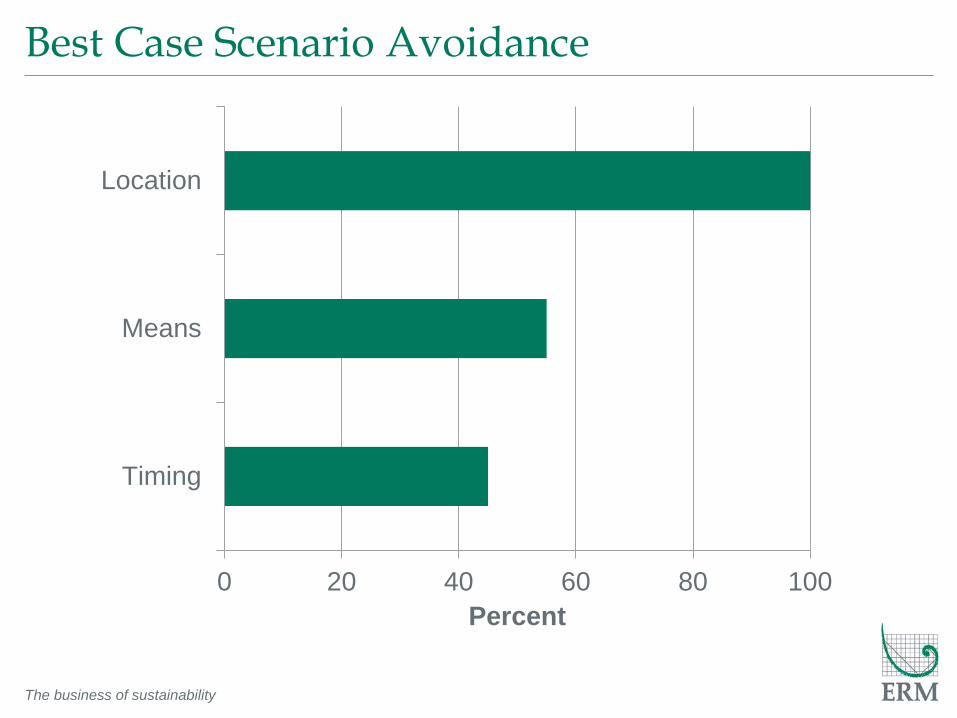
Best Case Scenario Avoidance
0 20 40 60 80 100
Timing
Means
Location
Percent

The business of sustainability
Methods – Policy Integration
• Reviewed publically available projects from BC Environmental Assessment Office (EAO)
• Determined percentage of EAO documents with policy citation
• Reviewed proponent documents for species at risk
• Determined percentage of proponent documents with policy citation

The business of sustainability
Methods – Adherence to Mitigation Hierarchy
• Did not further consider species without project interaction or residual effect
• Categorized mitigation according to hierarchy for: • Species specific mitigation (e.g. olive-sided
flycatcher) • Group specific mitigation (e.g. migratory birds) • Generic mitigation (e.g. restoration on-site through
reclamation)
• Determined percentage of application of each mitigation step

The business of sustainability
Sample Sizes
• 60 EAO documents (28 projects)
• 54 proponent documents (17 projects)
• 24 threatened and endangered species (1 amphibian, 2 plants, 5 fish, 7 mammals, 9 birds)

The business of sustainability
Percent of Documents with Policy Citation
37 35
42
33 33
41
0
57
33
100
0102030405060708090
100
Total 2014 2015 2016 2017
Perc
ent
EAO Documents (n = 60) Proponent Documents (n = 17)

The business of sustainability
Percent of EAO Documents with Citations
44 43
26
0
10
20
30
40
50
60
70
80
90
100
ApplicationInformation
Requirements (n=16)
Assessment Report(n=21)
Certificate Table ofConditions (n=23)
Perc
ent
EAO Document Type

The business of sustainability
Percent of Proponent Chapters with Citations
10
0
30
22
41
0
10
20
30
40
50
60
70
80
90
100
Vegetation(n=10)
Fish (n=7) Wildlife(n=37)
TotalChapters
(n=54)
OverallApplication
(n=17)
Perc
ent
Species at Risk Group

The business of sustainability
Best Case Scenario Mitigation Hierarchy
0 20 40 60 80 100
Offsetting
On-Site Restoration
Minimization
Avoidance
Percent
The business of sustainability
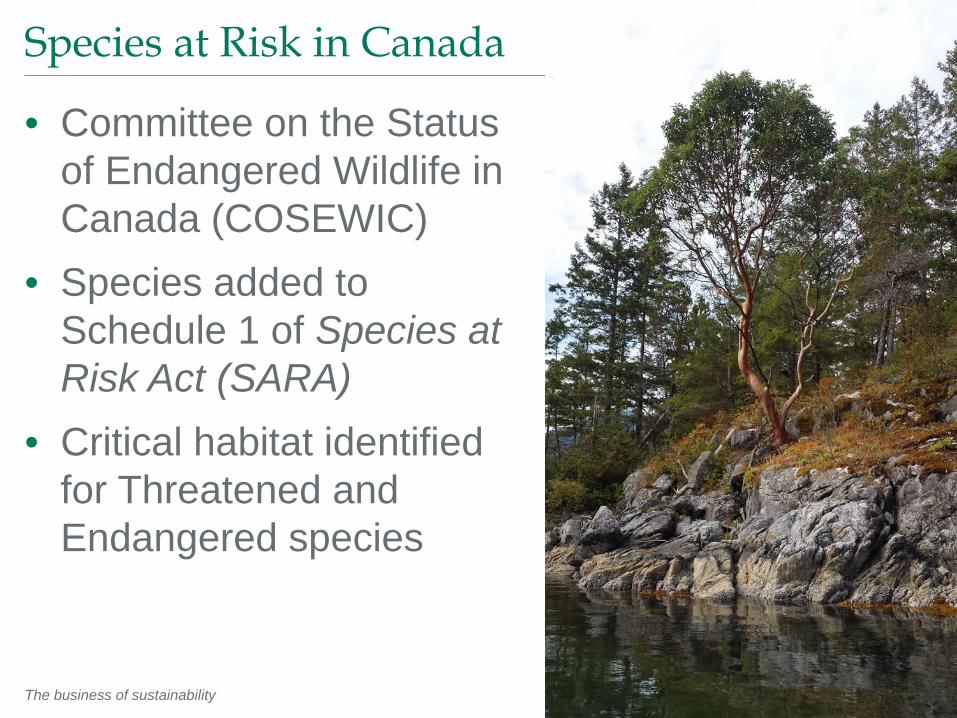
Adherence to Mitigation Hierarchy
0 20 40 60 80 100
OFFSETTING
RESTORATION ON-SITE
MINIMIZATION
AVOIDANCE
Percent Application of Mitigation per Species at Risk
Generic Species/Group Specific
The business of sustainability
Best Case Scenario Avoidance
0 20 40 60 80 100
Timing
Means
Location
Percent

The business of sustainability
Prevalence of Avoidance Types
0 20 40 60 80 100
TIMING
MEANS
DESIGN
LOCATION
Percent Application of Avoidance Mitigation per Species at Risk
Generic Species/Group Specific

The business of sustainability
Mitigation Hierarchy According to Group
0 20 40 60 80 100
Offsetting
On-site Restoration
Minimization
Avoidance
Percent Application of Mitigation
Raptors (n=5) Migratory Birds (n=20) Mammals (n=18) Fish (n=3)

The business of sustainability
Avoidance According to Group
0 20 40 60 80 100
Timing
Means
Location
Percent Application of Avoidance
Raptors (n=5) Migratory Birds (n=20) Mammals (n=18) Fish (n=3)

The business of sustainability
Mitigation Hierarchy According to Status
0 20 40 60 80 100
Offsetting
On-site Restoration
Minimization
Avoidance
Percent Application of Mitigation
Endangered (Schedule 1) Threatened (Schedule 1) Endangered (COSEWIC)
The business of sustainability
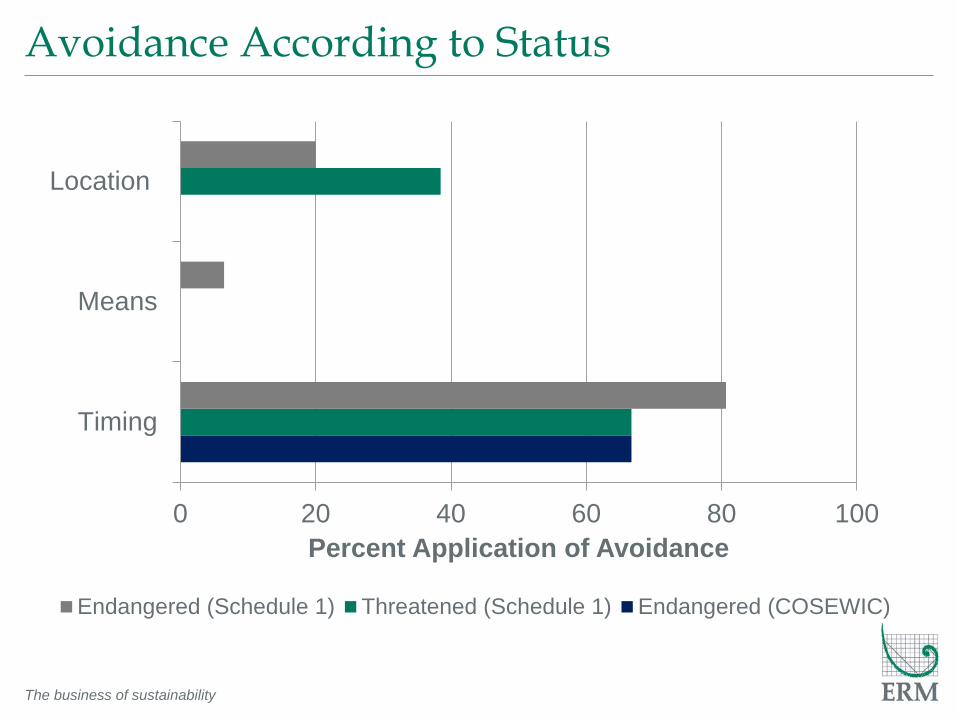
Avoidance According to Status
0 20 40 60 80 100
Timing
Means
Location
Percent Application of Avoidance
Endangered (Schedule 1) Threatened (Schedule 1) Endangered (COSEWIC)

The business of sustainability
Conclusions
• Policy incorporation <50%
• Minimization prioritized over avoidance
• Avoidance is primarily timing and not spatial
• Increasing expectation of spatial avoidance as priority would benefit species at risk