Embed Size (px)
Citation preview

THE BELGIAN ELECTRICITY LANDSCAPE IN THE CONTEXT OF THE NUCLEAR PHASE-OUTCLIMACTCommissioned by the Heinrich-Böll-Stiftung European Union
POLICY BRIEF – MARCH 2017

TABLE OF CONTENT
Executive summary 3
I. The Belgian energy transition in a global and European context 4
A. The European context and its implications for Belgium 4
B. Where is Belgium starting from in the power sector? 5
II. The cost of RES-based electricity is coming down faster than expected 7
III. The electricity system can handle RES integration at bearable costs 10
A. RES integration will require system adaptations, but at a bearable cost 10
B. Although challenging, the nuclear phase-out is feasible 12
C. High RES doesn’t lead to higher electricity system costs in the long term 15
IV. The drawbacks of the existing nuclear plants 16
A. Prolonging existing nuclear capacity is technically cheaper, but not by much 16
B. The phase-out only slightly pushes back emissions reductions 17
C. The existing ageing nuclear plants have a series of significant issues 18
Key conclusions 21
Cover picture: http://bit.ly/2nmP2Wp - photogreuhphies

3
EXECUTIVE SUMMARY
This policy brief examines the challenges of the Belgian electricity system in the context of the energy tran-sition, a sector that is set to decarbonise while phasing out the existing nuclear capacity between 2022 and 2025. The objective is to bring various fact-based insights together to support the best alternatives for the future of the Belgian electricity sector.
Various global trends have kicked off a fundamental energy transition. This includes climate change and other environmental issues, geopolitical issues, various innovation trends and digitalisation. All have strong implica-tions for the energy sector and should get stronger in the future.
Energy efficiency is essential for a sustainable transition and is the basis to a more cost-effective transition. The most sustainable and cheapest kilowatt-hour is the one which is not consumed. The latest adequacy report writ-ten by ELIA used as a base case the assumption that electricity consumption will remain flat in the future, assuming that, while population and GDP will grow and certain sectors will start electrifying, increasingly efficient energy use can stabilise electricity use. While crucial, this topic will not be further explored in this paper, which is more focused on supply issues.
Electricity is at the heart of this transition, as it has the potential to become carbon-free and can support other sectors’ decarbonisation based on today’s technologies as the various energy consuming sectors electrify.
Historical trends show that while the price of RES-based electricity is consistently coming down and is projected to continue to do so in the future, new nuclear power plants see significantly higher costs than often es-timated. The stand-alone cost of the latest European wind and solar projects are already below the recent agreement for the new nuclear power plant in the UK (Hinkley Point).
The full picture requires looking at total system costs. Weather-driven (or variable/intermittent) RES leads to an increased need for flexibility in the system (that can come in the form of demand-side flexibility, storage, interconnection, or back-up plants), which leads to certain integration costs. Several studies have shown that total system costs can be similar or lower for a largely RES-based power system than for one based on fossil fuels and new nuclear plants.
Power emissions currently represent 10 % of total emissions. While they would temporarily increase with the nuclear phase-out, Belgium can fare well economically while reducing total GHG emissions and keeping to the agreed nuclear phase-out. The phase-out will lead to less reductions in GHG emissions by 2030 due to the higher use of gas, but RES is set to replace this gas-based electricity production over time.
While being a low-carbon source of electricity, nuclear has other significant issues which need to be scruti-nised and considered in the full picture, among others: safety issues, waste management, decommissioning, limited flexibility and security of the supply from ageing plants (at a 50 % load factor in 2015) and/or system resilience in case of a large dependency on a single production source. Continued operation of the ageing existing nuclear fleet be-yond 2025 could exacerbate most of these issues.
On top of that, while energy policy is part of national jurisdiction, it has aspects which are cross-border in na-ture, and that is particularly the case for the risks related to nuclear energy. Safety implications cross boundaries and it is important to ensure sufficient communication on this issue between countries.1
This policy brief concludes with a series of recommendations in support of a coherent Belgian energy vision.
1 This is already supported by the Euratom treaty, the Paris Convention and the complementary convention of Brussels on the civil responsibility in the context of nuclear energy, concluded in the framework of the OECD.

4
I. THE BELGIAN ENERGY TRANSITION IN A GLOBAL AND EUROPEAN CONTEXT
A. THE EUROPEAN CONTEXT AND ITS IMPLICATIONS FOR BELGIUM
Heads of state and government have delivered a strong message at the COP21. They agreed to hold the global average temperature rise well below 2° C above pre-industrial levels and to pursue efforts to limit this temperature increase to 1.5° C. This means that world-wide greenhouse gas (GHG) emissions need to come close to zero, or even become negative during the second half of the century. To reach such an objective, the EU and its member states have already committed to reduc-ing GHG emissions by 80% to 95% in 2050 compared to 1990 levels. Latest scientific evidence shows that global warming may be faster than expected and that the high-end of the range may not be sufficient. A detailed IPCC report is due in 2018 on this issue.
Although reaching such a level of GHG emissions re-ductions is a challenge, several studies have highlighted a series of technical and economic options for the world to overcome it. For Belgium, the study ‘Scenarios for a low-carbon Belgium by 2050’2 demonstrates that it is technically feasible with technologies that mostly exist today, and without having to reduce industrial produc-tion levels. Several pathways can be taken, based on various technological choices and behaviour changes.
The recent clean-energy package of the European Commission3 is reinforcing some of the existing trends, with, for example, the following elements:
A proposal for an Energy Efficiency Directive, providing for a binding 30% energy efficiency target for 2030 at the EU level and a requirement that each Member State set indicative national energy efficiency contributions towards the Union’s 2030 target. (What this really means is still not completely clear, since the
Communication simply proposes ‘an ambitious en-ergy efficiency target of 30%’. Because of the way the Commission traditionally assesses energy efficiency – based on projections of future energy use, not on what the EU is actually using – it could imply very different real-world impacts. Whether the target refers to final or primary energy also makes a difference);
Proposals for a revised Electricity Directive and Regulation, to include measures encouraging consum-ers to take a more active role in the energy transition, as well as provisions to reward flexibility for genera-tion, demand-response and storage;
In terms of governance, Member States will be required to provide Integrated National Energy and Climate plans for 2021 to 2030, including planning and reporting on measures under the Energy Efficiency Directive (EED) and the Energy Performance of Buildings Directive (EPBD), including national renovation strate-gies; and
The package also includes a Proposal for a revised Renewable Energy Directive, including how to reach the target of at least 27% renewable energy in 2030.
This policy brief focuses on the power sector as it is a pivotal sector to get right during the transition, with other sectors relying on it for decarbonisation through electrification. Indeed, as illustrated in Figure 1, a suc-cessful decarbonisation of the economy requires high levels of demand reduction, energy efficiency and high levels of electrification of demand. With the increased importance of electricity in the mix, elec-tricity will need to be ~100% carbon free.
In the case of Belgium, the ageing nuclear power pro-duction park, the underutilised gas fleet and the increase in renewable power production are setting the scene for key energy choices.
This brief aims at feeding the ongoing debate with fact-based elements, supporting decision-makers to move towards a clearer vision for our future power system.
2 Climact/ Vito (2013): Scenarios for a low Carbon Belgium by 2050. Climate Change Section of the Federal Public Service Health, Food Chain Safety and Environment, URL: http://www.climatechange.be/2050/en-be/scenario-analysis/
3 European Commission (2016): Clean Energy for All Europeans – Unlocking Europe’s Growth Potential, URL: http://europa.eu/rapid/press-release_IP-16-4009_en.htm

5
4 Based on: Climact/ Vito (2013): Scenarios for a low Carbon Belgium by 2050. Climate Change Section of the Federal Public Service Health, Food Chain Safety and Environment, URL: http://www.climatechange.be/2050/index.php/download_file/view/63/149/
5 Febeg Empowering Society (2015): Annual Report 2015, URL: https://www.febeg.be/sites/default/files/febeg_annual_report_2015_nl.pdf
6 SPF Economie (2016): Observatoire de l’Energie: Chiffres clés 2014, URL: http://statbel.fgov.be/fr/modules/publications/general/observatoire_de_l_energie_-_chiffres-cle_2014.jsp
Figure 1: Illustration of the importance of both the energy efficiency and electrification trends
B. WHERE IS BELGIUM STARTING FROM IN THE POWER SECTOR?
In 2015, nuclear and gas both contributed about 38% each to Belgian indigenous electricity production, and RES (Renewable Energy Sources) and waste most of the remaining 24%5. Nuclear has historically provided ~50% of Belgian electricity production6, but this share went down in 2015 due to various technical and security issues. Recent years have seen significant fluc-tuations in the nuclear electricity production, and this uncertainty is likely to increase with their ageing.
With lower production from nuclear, Belgium produced only 65 TWh in 2015, ~30% below its 2010 production level. Consumption has decreased as well, but only by ~5% compared to 2010, leading to a significant increase in imports. Belgium went from be-ing a net exporter to importing 21 of the 85 TWh it consumed in 2015 (~25%). This is also due to market dynamics leading to much lower capacity factors for gas power plants, which currently come very late in the merit-order. With lower profitability, several gas plants have decided to stop operating.
A complete nuclear phase-out is planned between 2022 and 2025, with almost 6 GW scheduled to be re-tired. There is currently a vivid debate as to how to deal with this nuclear phase-out, which will logically lead to important shifts in the amount of electricity produced. This debate is not purely national; neighbouring coun-tries and even cities are arguing that the risks they are facing also need to be taken into account in the con-text of these ageing nuclear power plants. Some large industry consumers argue for the extended use of existing nuclear capacity, stressing the impact on com-petitiveness and energy security.
Renewable energy alternatives are indeed still de-pendent on direct government subsidies, although other electricity production facilities have also received and still are receiving support, which is not always as visible as for RES (e.g. state support for nuclear guarantees, or subsidizing gas plants to keep them running). These vari-ous subsidies must be put in perspective with the impacts these deployments can have on the Belgian economy and public finances, which will be different for each en-ergy source based on the underlying local industry.
Source: Climact, 20174

6
Non-economic barriers also have an important impact on RES deployment in Belgium and abroad. Typically, the NIMBY effect has significantly limited the deployment of onshore wind in recent years. There is also a lack of confidence in the stability of subsidies and potential taxes, since regional governments adapted part of the legislation over time, impacting the confi-dence of investors.
An ‘energy pact’ between the various Belgian stakeholders and governing entities has been an-nounced for 2017. Belgium’s institutional complexity makes decision making even harder than in other coun-tries. Energy jurisdiction7 is shared between the federal and the regional entities8:
The Federal Government is in charge of, among others, nuclear electricity production, offshore wind production, securing electricity supply (including the strategic reserve), some energy storage facilities, and the transmission networks.
The key responsibilities of the Regions cover other RES production, energy efficiency and distribu-tion networks.
Electricity Market design falls within the ambit of both federal and regional jurisdictions.9
Different visions on our energy future across these entities compete and need to negotiate on certain as-pects, such as sharing the burden of GHG reductions, resulting revenues from the ETS, and sharing Belgium’s 2020 mandatory RES Target and Belgium’s contribution to the EU 2030 RES Target.
Altogether, the technical, economic and political challenges and the related uncertainty make it cur-rently difficult for key stakeholders to take decisions in a sector where a long-term perspective is essential.
The following pages highlight some of the key el-ements to be taken into account to make adequate choices in terms of power sector policies:
Section II focuses on the latest cost develop-ments, comparing the stand-alone cost of RES-based electricity and other options;
Section III then looks at system implications, to capture full system costs implications;
Section IV focuses on specific nuclear issues such as costs, emission reductions and security issues;
The brief concludes with a series of recom-mendations, aiming to help decision makers moving towards a clearer energy policy.
7 Jurisdiction over transport is also split between federal and regional levels, slowing down Energy Efficiency improvements.8 Cf. SPF Economie, P.M.E., Classes moyennes et Energie, URL: http://economie.fgov.be/fr/consommateurs/Energie/Politique_
energetique/Contexte_Belge/concertation_Etat_Regions_matiere_energie/#.WHUJofkrKUm9 Indeed, the inclusion of distribution networks and renewables in the market design makes a direct link to regional competences.

7
10 The levelised cost of electricity (LCOE) is the total cost of electricity for a power generation asset averaged over its lifetime. It includes all costs related to its installation and operation (capital costs, operating and maintenance costs, fuel costs and dismantling costs).
11 Based on the new electricity price projections, the top up (or subsidies) which the UK will pay has increased massively: the British National Audit Office estimated that the value of future top-up payments have increased from EUR 7 billion in October 2013 when the strike price was agreed, to EUR 35 billion in March 2016. Cf. BBC (2016): Reality Check: How much would Hinkley C Cost Bill Payers?, URL: http://www.bbc.com/news/uk-36925580
12 IEA/ NEA (2015): Technology Roadmap – Nuclear Energy, URL: https://www.iea.org/media/freepublications/technologyroadmaps/TechnologyRoadmapNuclearEnergy.pdf
13 Based on: IEA-NEA (2015): Projected Costs of Generating Electricity/ Fraunhofer ISE (2013): Levelized Cost of Electricity Renewable Energy Technology / 3E (2016): Crucial Energy Choices in Belgium – An Investigation of the Options.
Figure 2: LCOE comparison of the main electricity production options
II. THE COST OF RES-BASED ELECTRICITY IS COMING DOWN FASTER THAN EXPECTED
This section focuses on stand-alone production costs, excluding system costs; the next section will look at system implications in order to understand the implications and costs of a potential shift to variable decentralised production on the system.
We have taken a detailed look at recent projects that have been awarded in Europe and at other cost estimates, with a focus on nuclear and RES-based electricity production. Figure 2 compares an IEA 2015 report on LCOE10 estimates for Belgium, the 2016 3E update of the report ‘Crucial energy choices report in Belgium’, and a few key comparison points from recent RES projects in Belgium and the rest of Europe.
For nuclear, the UK figure is about 50% higher than the estimate from the IEA for new nuclear in Belgium. After a long decision-making process, the UK govern-
ment has reached a final agreement with EDF for the construction of a new nuclear reactor at Hinkley Point. This contract guarantees EDF a fixed price for the nu-clear electricity it produces for 35 years at a strike price of GBP 92.50 or EUR ~116 per MWh. This year, the electricity market price has been hovering below the 50 EUR/MWh line much of the year, leading to es-timates for the required subsidies on the order of EUR 35 billion.11
On the other hand, the IEA figure is not based on historical projects, but assumes cost reductions for ‘a generic, Nth-of-a-kind generation III nuclear plant’. These reductions still need to be confirmed by reality, as pointed out by the IEA 2015 Nuclear Technology Roadmap.12 Both historical trends and recent market developments point to higher costs.
Two plants are currently being built in Europe, but no specific LCOE exists for these, which is why Figure 2 includes the Hinkley Point strike price as the latest cost estimate for nuclear plant projects in Europe. It is still interesting to look at the significant cost overruns, which the other two plants are both facing:
Source: Climact, 201713

8
The construction of the Olkiluoto Nuclear Power Plant in Finland began in 2005, with the start of com-mercial operation planned for 2010, but has now been pushed back several times. As of January 2016, the es-timated start year is 2018. Latest full investment costs were estimated by Areva to be at EUR ~8.5 billion, al-most 3 times higher than the EUR ~3 billion planned investment amount.14
Costs for the nuclear power plant being con-structed in France, in Flamanville have also been revised several times. The overnight capital cost or construction cost was expected to be EUR 3.55 billion (in 2008 Euros), and power from it at 46 EUR/MWh. Series production costs were projected at about 20% less. In September 2015, the delivery was moved to late 2018, 6 years be-hind the original schedule, and the cost estimates have increased from EUR 3.55 billion to EUR 10.5 billion.15
Clearly, nuclear overnight costs are often higher than initially expected. Much of these can be explained by the project complexity, the regulatory issues, and the financing costs incurred by delays. There are claims for new, smaller-scale nuclear production alternatives (which are also claimed to be cheaper), but there is concern about their ability to guarantee safety stand-ards as larger facilities do.
Some experts suggest that these overruns and higher cost estimates are related to the build-out of new gener-ations of nuclear fleets, and that costs should stabilise lower in the medium term. However, the historical trend shows an increase in nuclear costs and no sign of cost reductions (see Figure 3 for a representation of this trend from Farmer et al. (2015) – the red cross represents the agreed price for Hinkley Point, which is scheduled to come online in 2023). The world nuclear association highlights how the cost of new nuclear fa-cilities has been rising since the 60’s in Europe, from USD 1,500/kW in the early 60s to above USD 5,000/kW in 2010.16 This trend seems unlikely to change with increased design complexity and higher security re-quirements, due to both the Fukushima incident and the higher terrorist threat.
Figure 3: A comparison of long-term historical price trends for coal, nuclear power and solar photovoltaic modules
On the other hand, as Figure 3 illustrates for solar, RES alternatives continue their rapid cost reduc-tions. This has been particularly striking for offshore wind and solar PV:
The latest offshore wind auctions in The Netherlands and Denmark were won for 54.5 EUR/MWh (Borssele III and IV, NL) and 49.9 EUR/MWh (Kriegers Flak, DK). This is lower than the cost of tra-ditional fossil fuel production, which is estimated by the IEA between ~78 EUR/MWh for the most efficient coal plants (ultra-supercritical) and ~97 EUR/MWh for Combined Cycle Gas Turbine, or CCGT plants (see Figure 2 for their detailed assumptions). It is also much lower than the latest agreements for offshore wind in Belgium, and several factors explain this difference: first of all, lower park density, larger projects, later agreed tim-ing of delivery and better sea floor, all of these leading to lower capex and opex in The Netherlands. Additionally, development costs for the Dutch parks are much lower for companies, as are the risk profiles (all permitting pro-cedures are taken care of by the authorities), leading to much lower financing costs, a key component of LCOE that can represent up to 50%. Many of these differences can be resolved for Belgium, which could lead to lower costs for future concessions.
14 IEA/ NEA (2015): Technology Roadmap – Nuclear Energy, URL: https://www.iea.org/media/freepublications/technologyroadmaps/TechnologyRoadmapNuclearEnergy.pdf
15 World Nuclear Association (2017): Nuclear Power in France, URL: http://www.world-nuclear.org/information-library/country-profiles/countries-a-f/france.aspx
16 World Nuclear Association (2017): The Economics of Nuclear Power, URL: http://www.world-nuclear.org/information-library/economic-aspects/economics-of-nuclear-power.aspx
17 Farmer and Lafond (2016): How Predictable is Technological Progress?, Research Policy 45, p.647–665.
Source: Farmer and Lafond, 201617

9
18 All support schemes have recently been reviewed and are different for each region. The support is the most attractive for Brussels (up to EUR 240/MWh for 10 years). The Walloon region has deeply revised its support schemes in 2011: it is now calibrated to offer a 7% return on investment and is reviewed every 6 months. Flanders has stopped its support to new solar PV installations, suggesting the price decrease is sufficient for independent operation. Furthermore, Flanders has introduced a ‘prosumer’ tax for PV panel owners.
19 Sandbag and Agora Energiewende (2016): Energy transition in the power sector in Europe: State of Affairs in 2016, URL: https://sandbag.org.uk/project/energy-transition-2016/
20 This share has artificially increased in 2015 due to the particularly low indigenous production. Intermittent RES production only represents 10% of power consumption.
The cost of Solar PV has come down to ~100 EUR/MWh in Belgium for large installations, so it is already lower than the Hinkley Point nuclear figure on a stand-alone basis (excluding additional electricity sys-tem costs). In line with the lower costs, subsidies in the various Belgian regions are limited to the first 10 year of the 25 years of lifetime and are being reduced steadily to limit return to the investors.18
All this means the dynamics in the electricity market are likely to shift faster than planned to RES-based production, and the constraining factor in the future may become the speed of deployment of the net-
work, or other flexibility-enhancing options. Germany has seen large RES deployment in the last few years and produced 32% of its electricity based on RES in 2016 (18% of which intermittent), exporting almost 10% of its production,19 and it is now seeing some constraints to bringing electricity from offshore wind farms in the Baltic sea to the south of Germany, as the planned grid extension is taking longer than expected. With 13% of electricity production from wind and solar in 2015,20 Belgium is progressively building out its infrastructure to cater for these developments, but these costs are bearable, as the next section will show.
10
III. THE ELECTRICITY SYSTEM CAN HANDLE RES INTEGRATION AT BEARABLE COSTS
This chapter looks at the implications of variable RES on the electricity system: first, the system issues are quickly defined, then existing cost estimates are high-lighted from a wide literature research, with a particular focus on the recent study by the KU Leuven.21 This study computes the overall integration costs for variable or intermittent RES (or IRES) in Belgium towards 2030, ranging between EUR 9 and EUR 25/MWh
IRES. This cost
is explained by the rather flexible Belgian system in 2030, with a strong natural-gas component and with relatively strong connections to neighbouring countries.
The ELIA adequacy study recently finalised high-lights that the nuclear phase-out can be handled by the system as long as existing gas capacity is either main-tained or replaced over the next 10 years. With the key concern of the nuclear phase-out, the study shows that while the challenges are real, it is possible to ensure sys-tem adequacy. It requires a structural block of at least 4 GW (which could consist of the existing gas plants), along with several key developments, such as stabilizing electricity demand through continued energy efficiency while electrifying demand and stable RES deployment. Key choices are required in terms of the amount of im-ports Belgium is ready to accept, as some scenarios lead to imports of up to 45% if coal production abroad re-mains cheaper than Belgian gas production.
Finally, a short section illustrates one of the most complete studies on system implications, with up to 100% variable RES penetrations in France by 2050, showing that total system costs are not higher with large RES penetration.
A. RES INTEGRATION WILL REQUIRE SYSTEM ADAPTATIONS, BUT AT A BEARABLE COST
While it is clear that weather-driven renewables (wind and solar) are key to the decarbonisation of the power system, they still need alternatives for security of supply (storage, DSM, back-up plants or imports). The introduction of variable renewable energy sources in the generation mix has a series of effects on the system.
From a technical point of view, these system effects will largely depend on the existing infrastructure: inter-nal grid strength, interconnections, a good geographical spread of power demand and variable capacities as well as a good balance between wind and solar, and flexibility of dispatchable generation capacities. While these parameters are strongly country-specific, vari-ous countries (e.g. Denmark, Germany, UK, Spain and Portugal) have demonstrated that large penetration rates for wind and solar can be handled properly.
From an economic point of view, system effects lead to three additional costs (i.e. integration costs): grid-re-lated costs, balancing costs and utilisation (or back-up) costs: 22, 23, 24
1. Grid-related costs are related to transmission and distribution infrastructure reinforcement, as well as specific connections (e.g. connecting offshore wind farms to the grid) and cross-border interconnections. There is also an increase in transmission losses due to increased transport of electricity. Literature esti-mates lie in a range from 1-9 EUR per intermittent or weather-driven MWh (or EUR/MWh
IRES), depending on
technology, geographical spread and penetration lev-el. A Belgium-specific study24 estimates the cost in the same range, from 1.6-9 EUR/MWh
IRES for both trans-
mission and distribution. Grid-related costs may reach higher value for offshore wind, where connection costs can be significant, depending on the topology.
21 KU Leuven: Determining the Impact of Renewable Energy on Balancing Costs, Back up Costs, Grid Costs and Subsidies, URL: http://www.creg.info/pdf/ARCC/161019-KULeuven.pdf
22 These costs are usually assigned to variable RES but they are also related to a larger range of system evolution, so the best way to look at these additional costs is to assess total energy system costs of different scenarios.
23 OECD/NEA (2012): Nuclear Energy and Renewables: System Effects in Low-carbon Electricity Systems, URL: https://www.oecd-nea.org/ndd/pubs/2012/7056-system-effects.pdf
24 Agora Energiewende (2016): The Integration Costs of Wind and Solar Power, URL: https://www.agora-energiewende.de/fileadmin/Projekte/2014/integrationskosten-wind-pv/Pescia_Redl_Presentation_Integration_Cost_Wind_and_Solar_11022016.pdf

11
25 Balance Responsible Party is tasked with maintaining the quarter-hourly balance between all grid user injections and offtakes for which it is responsible.
26 EDF/R&D (2016): Technical and Economic Analysis of the European Electricity System with 60 % RES, URL: http://www.energypost.eu/wp-content/uploads/2015/06/EDF-study-for-download-on-EP.pdf
27 KU Leuven (2016): Determining the Impact of Renewable Energy on Balancing Costs, Back up Costs, Grid Costs and Subsidies, URL: http://www.creg.info/pdf/ARCC/161019-KULeuven.pdf
System integration costs Cost value
Back-up costs 3 - 8 €/MWhIRES
Balancing costs 2 – 5 €/MWhIRES
Grid costs 1.6 – 2.2 €/MWhIRES (transmission excluding interconnection and internal reinforcement)
2.4 – 3.1 €/MWhIRES (transmission including interconnection and internal reinforcement)
2.5 – 9 €/MWhIRES (distribution)
Figure 4: Overview of Intermittent-RES integration costs for Belgium towards 2030
2. Balancing costs are the costs incurred in balanc-ing deviations of actual generation from the forecasted generation. In our AC systems, supply and demand have to be balanced to ensure grid frequency stability (50Hz). This cost is well identified since it appears as the im-balance charge that BRPs25 have to pay to the system operator (Elia) for deviating from a submitted schedule. Since weather-driven generation technologies are sub-ject to forecast errors, it increases the need for balancing reserves. Once again, these costs depend on penetra-tion levels. A review of existing studies has shown that balancing costs for wind are estimated to lie in a range from 1-7 EUR/MWh
IRES for penetration levels up to 30%.
In Belgium, these same balancing costs were estimated by KULeuven in a range from 2-5 EUR/MWh
IRES, in a
2030 scenario where nuclear has mainly been replaced by gas.
Interestingly, in Germany, where RES accounted for 30% of power generation in 2016, RES development only had a minor impact when comparing to other factors such as balancing market design: balancing costs de-creased by 50% between 2008 and 2015, while wind and solar capacities tripled up to 80 GW over the same period.
3. Utilisation effect or Back-up costs (including adequacy) represents the impact of RES production on existing conventional power plants. Basically, the increase in their specific production costs due to the re-duction of their full load hours. For this reason, this cost component is also called the ‘capacity factor effect’.
This component is the most controversial. It also re-flects the long-term impact for providing the residual (flexible) system and the impact associated with the
low contribution to generation adequacy of variable RES. A system with high penetration of intermittent re-newables needs to shift from a rigid baseload generation mix to more medium- and peak-load generation. These back-up costs represent the opportunity cost of having a cheaper generation mix for the residual system. They are the most difficult to estimate, since each new capacity has an impact on other capacities’ utilisation rates. NEA and IEA estimates lie in a range of 4-9 EUR/MWh
IRES for
wind and 4-24 EUR/MWhIRES
for solar. For Belgium, the recent KULeuven estimates lie in a range from 3-8 EUR/MWh
IRES.
Summing up these estimates leads to a relatively wide range of 9 to 25 EUR/MWhIRES by 2030, depend-ing on the penetration levels of solar and wind. These additional costs need to be assessed in light of the rapid decrease in the cost of these technologies, as shown in the previous section. For example, with offshore wind coming down towards a range of 50-70 EUR/MWh, ex-cluding grid-related costs, adding 9-25 EUR/MWh
IRES
still leaves it well below the cost of Hinkley Point (~116 EUR/MWh).
A study by EDF26 also looked at the cost impact of variable RES on the system by showing how the elec-tricity market value for wind and solar decreases with higher penetration level, particularly for solar. Their conclusions show that with larger penetrations, a mix of 15% solar and 35% wind could limit this additional cost to ~15 -20 EUR/MWh. Again, RES already compare favourably to new nuclear plants, and if current cost trends for RES continue their decrease this could be-come a relatively minor impact in the medium to long term as the next section will show.
Source: KU LEUVEN, 201627

12
With all these cost figures in mind, where is Belgium heading in terms of these variable RES penetrations? Figure 5 shows a possible evolution of the Belgian elec-tricity production mix in a low-carbon scenario (-80% GHG in 2050 vs 1990).
In 2015, shares of variable RES in Belgian elec-tricity production were 8.2% for wind and 4.6% for solar.
In 2030, they rise to ~30%, with a lower share for solar (5 to 10%) compared to wind (20 to 25%).
By 2050, this share of variable RES further rises to ~55% in this 100% RES scenario.
This scenario assumes that there are sufficient profitable gas plants in Belgium to produce the bulk of production required in 2025 to deal with the nuclear phase-out (see more details in the following section on the ELIA study).
The rest of the production is shared between CHP (mostly industrial), biomass plants where limited growth is assumed, and geothermal. Geothermal is currently the most uncertain contribution to this sce-nario, as it still requires significant cost reductions to be cost-effective in Belgium.
B. ALTHOUGH CHALLENGING, THE NUCLEAR PHASE-OUT IS FEASIBLE
The previous section clarified the techno-economic implications of variable RES on the system based on a wide range of studies. It is also useful to turn to the recent ELIA adequacy study28 which looks at the chal-lenges and the implications of the nuclear phase-out on the system over the next 10 years, from 2017 to 2027.
Figure 6: Definition of the ‘structural block’, on top of other options
28 Elia (2016): Etude de l’adéquation et estimation du besoin de flexibilité du système belge – période 2017-2027, URL: http://www.elia.be/fr/a-propos-elia/newsroom/news/2016/20-04-2016-etude-adequation-flexibilite-systeme-electrique-belge
29 Ibid.
Figure 5: Electricity production by source in the CORE low-carbon scenario
Source: Climact, 2017
Source: Elia, 201629

13
Figure 7: Structural block required in MW in the base scenario (left side) and capacity of the structural block in 2017 (right side)
29 Ibid.30 Federal Planning Bureau (2017): Cost-benefit analysis of policy scenarios on an adequate future Belgian power system, URL:
http://www.plan.be/admin/uploaded/201702231020450.CBA_2017.pdf
Taking a series of assumptions on the development of electricity demand (assumed flat from 2017 to 2030) and the deployment of various electricity production alterna-tives, the study defines the need for a ‘structural block’ which is defined as flexible capacity complementing the 5 blocks illustrated in Figure 6. This structural block is currently composed of gas-fired power plants and the strategic reserve (including gas power plants and DSM), but as pointed out by the Federal Planning Bureau in its recent study,30 the future structural block could include additional renewables capacities combined with storage and gas power plants.
Figure 7 (left) shows how the size of this ‘structur-al block’ evolves over time, reaching a maximum of 4 GW in 2025 after the complete nuclear phase-out. This can be compared to the structural block available today of 4.2 GW (Figure 7, right side).
Essentially, this means that the nuclear phase-out is currently not a system adequacy issue: existing gas capacity is sufficient to cover the requirements in 2025, when all nuclear plants will be closed down.
However, many assumptions need to be well under-stood to clarify this conclusion. The following paragraphs highlight some of the key assumptions.
First of all, it is important to note that the current structural block is mainly composed of gas-fired power plants (CCGT/OCGT), of which some will be at the end of their life by 2027. Also, under current market condi-tions, the Belgian gas fleet is pushed out of the market as coal-based production is cheaper than gas and some
of the neighbouring gas-based capacity is more effi-cient. This means the nuclear phase-out could lead to significantly increasing our levels of imports. ELIA estimates that we would need to import up to 40 TWh, or almost half Belgian consumption, assuming it stabilises at 85 TWh. The situation improves some-what if gas-plants become more competitive and come earlier than coal in the merit-order (for example with a higher carbon price): imports reduce to 22-29 TWh, or 25 to 29%, which is close to 2015 import levels.
In this case, Belgian security of supply would largely rely on imports and on subsequently available generation capacities in the neighbouring countries. Depending on the installed capacity in the neighbouring countries, the structural block needed could increase to 8 GW. The acceptable level of reliance on the generation capacity in neighbouring countries is essentially a societal choice which should be based upon a number of considerations (economic, political, practical, strategic…). One of the most important considerations is certainly to which extent there is a risk of shortages should demand exceed production in different countries at once as this may lead to self-preser-vation through export restrictions to avoid black-outs on the domestic networks of the respective countries. The lower the structural reliance on imported power, the lower the likelihood to end up in this specific situation.
The numbers above also show that existing gas plants are not competitive in today’s market conditions and their owners could decide to close them down before they become critically needed with the nuclear phase-out. Therefore, if Belgium wants this capacity to remain available in the country, some alternative needs to be
Source: Elia, 201629
Strategic reserveTurbojetsCCGT/OCGT
Cap
acit
y of
str
uctu
ral b
loc
(in
MW
)

14
put in place: fixing the ETS, setting a proper carbon price like the UK has, or a mechanism in the form of a capac-ity market or strategic reserve. The CREG suggests not to rush into a decision on this issue to avoid distorting the market, and instead to give the market the opportunity to develop innovative solutions.32 Clearly, the nuclear phase-out will give more space to the market, which leads some stakeholders to suggest a phase-out earlier than planned would help the market exploit its flexibility po-tential more effectively.
It is also interesting to note that half of the struc-tural block will be barely used in 2027. The fourth and last GW would only be used about 15 hours a year, and only helps to bring the LOLE33 from 15 hours of loss of load expected over the year to the 3 hours used as the standard for adequacy calculations in Europe. This last trench is needed, however, since these few hours of structural deficit would imply significant volumes of non-delivered energy. Alternatives like as higher de-mand response for these moments could be explored. The CREG commented on the ELIA study and sug-gested that alternatives to CCGT/OCGTs, like higher DSM, should be pursued further.34
Building on the ELIA adequacy study, a recent study from the Federal Planning Bureau35 is assessing the costs and benefits of different policy scenarios to fulfil the required structural block by 2027. The paper compares a structural block filled on the one hand with 100% gas-fired power plants and on the other hand, with renewables, storage (including electric vehicles) and gas. The cost-benefit analysis of the different sce-
narios is performed in a societal macro-economic perspective, including impact on the employment and on the national energy trade balance.
The report finds out that a decentralized structural block (based on more renewables and storage) has an overall positive effect on the economy as it generates more positive impacts in terms of producer surplus (which more than compensates the decrease in con-sumer surplus), CO
2 emissions, employment and energy
trade deficit. In these decentralized scenarios, some gas power plants would still be needed to ensure the security of supply criteria (a maximum of 3h of LOLE).
Nonetheless, the decentralized scenario would im-ply a decrease in consumer surplus (because of a higher wholesale price of electricity) and significantly higher investments (up to 2.5 times compared to a structural block filled with 100% gas).
Finally, this study points out that building more new gas capacity in order to significantly reduce our import needs and become a net exporter, would bring further benefits for Belgium: positive economic impact through lower wholesale power prices, a reduced energy trade deficit, as well as job creation. This sensitivity scenario has been assessed with a carbon price of 57.45€/tCO2. This policy option would require additional investments and would logically increase Belgium’s direct power sector emissions, but decrease indirect emissions from electricity imports from neighbouring countries (some of which are still producing electricity from coal power plants, such as Germany and UK).
31 Ibid.32 Leaving the market to work out where to develop such capacity could work, but it is likely to lead to higher imports.33 Loss of Load Expectation. 34 CREG (2016): Note relative à l’étude d’Elia portant sur le besoin d’« adequacy » et de flexibilité dans le système électrique belge
pour la période 2017-2027, URL: http://www.creg.info/pdf/Diversen/Z1532NL.pdf35 Federal Planning Bureau (2017): Cost-benefit analysis of a selection of policy scenarios on an adequate future Belgian power system.
Figure 8: Characteristics of major blocks of the structural block in 2027 in the base scenario
> 15 hours of average use per year> 50% probability of being used> Only needed one week per year
if it is used
TOTA
L st
ruct
ural
blo
c =
400
0 M
W
> Between 500 and 2000 hours of average use per year
> Capacity necessary for long periods (several days or weeks)
> Not only needed in the winter
> 200 hours of average use per year> Used at least once a year> Only needed in the winter
Source: Elia, 201631
15
36 Artelys (2015): Un mix électrique 100% renouvelable? Analyses et optimisations. ADEME, URL: http://www.ademe.fr/mix-electrique-100-renouvelable-analyses-optimisations
37 Ibid.
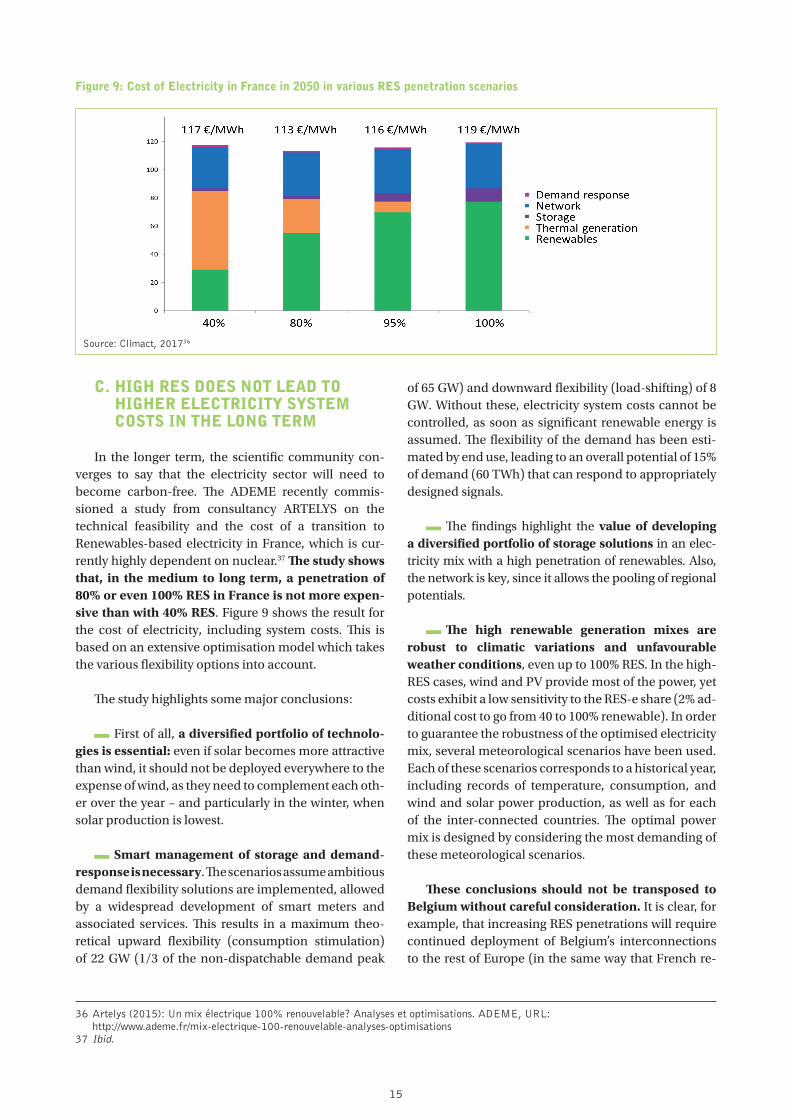
Figure 9: Cost of Electricity in France in 2050 in various RES penetration scenarios
C. HIGH RES DOES NOT LEAD TO HIGHER ELECTRICITY SYSTEM COSTS IN THE LONG TERM
In the longer term, the scientific community con-verges to say that the electricity sector will need to become carbon-free. The ADEME recently commis-sioned a study from consultancy ARTELYS on the technical feasibility and the cost of a transition to Renewables-based electricity in France, which is cur-rently highly dependent on nuclear.37 The study shows that, in the medium to long term, a penetration of 80% or even 100% RES in France is not more expen-sive than with 40% RES. Figure 9 shows the result for the cost of electricity, including system costs. This is based on an extensive optimisation model which takes the various flexibility options into account.
The study highlights some major conclusions:
First of all, a diversified portfolio of technolo-gies is essential: even if solar becomes more attractive than wind, it should not be deployed everywhere to the expense of wind, as they need to complement each oth-er over the year – and particularly in the winter, when solar production is lowest.
Smart management of storage and demand-response is necessary. The scenarios assume ambitious demand flexibility solutions are implemented, allowed by a widespread development of smart meters and associated services. This results in a maximum theo-retical upward flexibility (consumption stimulation) of 22 GW (1/3 of the non-dispatchable demand peak
of 65 GW) and downward flexibility (load-shifting) of 8 GW. Without these, electricity system costs cannot be controlled, as soon as significant renewable energy is assumed. The flexibility of the demand has been esti-mated by end use, leading to an overall potential of 15% of demand (60 TWh) that can respond to appropriately designed signals.
The findings highlight the value of developing a diversified portfolio of storage solutions in an elec-tricity mix with a high penetration of renewables. Also, the network is key, since it allows the pooling of regional potentials.
The high renewable generation mixes are robust to climatic variations and unfavourable weather conditions, even up to 100% RES. In the high-RES cases, wind and PV provide most of the power, yet costs exhibit a low sensitivity to the RES-e share (2% ad-ditional cost to go from 40 to 100% renewable). In order to guarantee the robustness of the optimised electricity mix, several meteorological scenarios have been used. Each of these scenarios corresponds to a historical year, including records of temperature, consumption, and wind and solar power production, as well as for each of the inter-connected countries. The optimal power mix is designed by considering the most demanding of these meteorological scenarios.
These conclusions should not be transposed to Belgium without careful consideration. It is clear, for example, that increasing RES penetrations will require continued deployment of Belgium’s interconnections to the rest of Europe (in the same way that French re-
Source: Climact, 201736

16
gions need to be more interconnected) to ensure taking advantage of the geographical spread of variable RES production, as well as the sharing of back-up capacity. A strong increase of this interconnection is already part of ELIA’s plans for the next few years, as illustrated in Figure 10.
This also highlights the need for further regional cooperation across Europe. There is a broad consen-sus that a more coordinated European approach is crucial for a more climate-friendly, affordable, and secure energy system for the EU. This approach is reflected in the vision of the Energy Union, which ex-plicitly promotes regional cooperation in order to open up the ‘black box’ of national energy policy-making and to bridge gaps between the EU and national levels.38
Figure 10: Maximum commercial exchange capacity assumed in 2027 in the ELIA adequacy study (in MW)
IV. THE DRAWBACKS OF THE EXISTING NUCLEAR PLANTS
One of the key issues where most stakeholders disa-gree is the pace of the nuclear phase-out. This section therefore focuses on the advantages and drawbacks of the current timing of the phase-out of the 6 GW of ex-isting nuclear capacity. It shows that while prolonging part of the nuclear capacity further than 2025 would technically be cheaper and lead to lower emissions, the cost difference may not be sufficient to justify pro-longing the nuclear risk from nuclear plants built in the 1970s, as well as increasing radioactive waste pro-duction, and this cost does not cover the full liability of a major nuclear accident which is covered by the state.
For some, new nuclear capacity would also be an at-tractive alternative. However, as shown in the sections above, evidence is strong to show that building new nu-clear is likely to be more expensive, and it locks us in for longer with longer-term production of nuclear waste, along with the risk of a nuclear incident.
A. PROLONGING EXISTING NUCLEAR CAPACITY IS TECHNICALLY CHEAPER, BUT NOT BY MUCH
There is little doubt that, in terms of simple electrici-ty production costs, extending existing nuclear plants is the cheapest short-term alternative. These plants have been subsidised in the past and are now completely amortised, and their fuel costs are much lower than fossil fuels. Estimates of their electricity production costs lie in the range of 20-30 EUR/MWh, significant-ly below any of the alternatives for new capacity. The scenarios recently produced with the Times model by EnergyVille40 illustrate this in Figure 11, where an ex-tension of 2 GW of existing nuclear capacity would lead to a lower electricity cost increase in 2030.
38 Ecofys (2015): Driving Regional Cooperation Forward in the 2030 Renewable Energy Framework. Heinrich-Böll-Stiftung European Union, URL: https://eu.boell.org/en/2015/09/14/driving-regional-cooperation-forward-2030-renewable-energy-framework
39 Elia (2016): Etude de l’adéquation et estimation du besoin de flexibilité du système électrique belge, URL: http://www.elia.be/en/about-elia/newsroom/news/2016/20-04-2016-Adequacy-study-flexibility-Belgian-electricity-system
40 EvergyVille for Febeliec: Energy Transition in Belgium- Choices and costs, URL: http://www.febeliec.be/web/press%20_%20media%202017/1011306087/list1187970172/f1.html Translating these figures into concrete numbers: EUR 6.1 billion for an electricity consumption of 87 TWh means the electricity costs ~70 EUR/MWh, which is roughly in line with the cost of CCGT production. Extending 2 GW of nuclear produces 15 TWh, assuming a capacity factor of 85%. With a cost assumption of 30 EUR/MWh, it leads to a delta of 40 EUR/MWh, or EUR ~600 million for these 15 TWh, which is indeed roughly the delta between the two scenarios.
Simultaneous import
maximal 6500 MW
Source: Elia, 201639

17
Figure 11: Total cost of electricity supply in Belgium in 5 scenarios from the EnergyVille study30
41 Based on: EnergyVille/Febeliec (2017): Energy Transition in Belgium – Choices and Costs, URL: http://www.febeliec.be/web/press%20_%20media%202017/1011306087/list1187970172/f1.html
42 It is interesting to keep in mind that the 2016 wholesale electricity market prices in the region hovered between 15 and 35 EUR/MWh most of the year, being only higher in the winter (cf. www.epexspot.com). Today, the wholesale price only represents about 1/3 of the electricity bill of consumers.
43 Febeg reports 12.15 MtCO2e for the power sector, and SPF Environment reports 118 MtCO2e for Belgium.
But these conclusions need to be set into the right perspective:
As pointed out by Febeliec, the main conclu-sion from the EnergyVille scenarios is that the costs of electricity should significantly increase in the next 10 to 15 years. All scenarios show a tripling by 2030, as illus-trated in Figure 11, reaching a cost of ~70 EUR/MWh.
Concretely, this highlights that the current cost of electricity is not sustainable and reflects underinvest-ment. In 2016, the results account for EUR 1.7 billion for a demand of 84.5 TWh, which translates to 20 EUR/MWh.42 As described in Chapter II, the cost of any new capacity is mostly above 70 EUR/MWh. So clearly, current costs can-not sustain the simple replacement of the existing ageing asset, let alone a proper energy transition.
Additionally, recent years have shown that the ageing nuclear capacity is not as reliable as this 2 GW ex-tension scenario may assume based a capacity factor of 85%, and more nuclear incidents would further increase the cost. These figures also fail to capture the limited liability which companies running nuclear plants are as-suming (more details in section C.3 below).
Lastly, these numbers are cost figures, not the actual price for consumers which has been around ~220 EUR/MWh for the average household the last few years. Clearly, other costs, such as historical network tariffs as well as taxes, are driving the consumer prices more than just the costs identified in the study.
B. THE PHASE-OUT ONLY SLIGHTLY PUSHES BACK EMISSIONS REDUCTIONS
Clearly, the nuclear phase-out will come at a cost to GHG emission reductions in the short-term. With 12 MtCO2e, the power sector produced ~10% of Belgian emissions in 2015.43 The nuclear phase-out will logi-cally lead to an increase as gas-based power capacity will partly be needed to compensate reduced produc-tion. However, this effect would be temporary as other low-carbon alternatives increase their share in the fol-lowing two decades. Pushing back the phase-out would be advantageous in terms of cumulative emissions, but ultimately this nuclear capacity will need to be taken off the grid, and low-carbon capacity will be required to replace it in all cases.
Source: Climact, 201741

18
In the CORE low-carbon scenario, the nuclear phase-out leads to an increase of about 3% in the total GHG emissions over the phase-out period (see Figure 12). In this scenario, the phase-out is accompanied by a larger reduction in other GHG emitting sectors than in the REFERENCE scenario. The CORE scenario in-cludes low-carbon measures and actions (e.g., higher energy efficiency), a carbon price with an adequate ac-companying fiscal policy and a global climate change mitigation policy.
Figure 12 also shows that low-carbon policies, if well managed, do not need to have a negative impact on the economy. On the contrary, the modelling from the Federal Planning Bureau shows that they can lead to a slightly higher GDP in 2030 for Belgium than in the REFERENCE scenario. The study shows that it is pos-sible to achieve economic growth while addressing climate change through profound economic and so-cietal transformations, including the planned nuclear phase-out. Households and firms invest a larger part of their revenues in energy efficiency and low-carbon in-frastructures instead of purchasing energy.
C. THE EXISTING AGEING NUCLEAR PLANTS HAVE A SERIES OF SIGNIFICANT ISSUES
1. THE RISK OF LOCK-IN
The lock-in concept refers to a situation where the existing technologies lead to inertia and tend to block the system from moving towards another situation, even if the latest is more desirable.
The lock-in concept applies quite well to the current situation in Belgium, where the temptation to extract value from well amortised power plants may lead to higher risks for the system and prevent the emergence of new technologies or even the profitability of existing ones (like gas plants).
The lock-in may also apply for subsidies: RES costs are coming down rapidly, and they don’t lock us into a high-cost future as new nuclear would. Their lifetime is lower than alternative power plants and the subsidies run for a shorter amount of time (e.g., 10 years for solar PV and 19 years for the offshore wind parks). The pre-viously mentioned Hinkley Point nuclear power plant will lock the UK government in for 35 years of subsidies and the IEA cost estimates assume a lifetime of 60 years.
44 Climact (2016): Macroeconomic Impacts of the low Carbon Transition in Belgium, URL: http://www.klimaat.be/files/9614/8006/1207/macro_low_carbon_report_FINAL.pdf
Figure 12: GDP and CO2 emissions evolution in Belgium for the CORE and REF scenarios, HERMES model
Source: Climact and Federal Planning Bureau, 201644

19
As mentioned before, prolonging nuclear power plants may affect the energy transition by maintaining an overcapacity of rigid baseload power generation. This situation, resulting in low electricity market pric-es, leads to low investments into the key elements of the energy transition (medium- and peak-load power plants, flexibility solutions and grid development). Delaying the transition will also have a socio-econom-ic impact. Countries more advanced in their energy transition, like Denmark, are quickly taking the lead in developing the relevant skills and creating jobs related to the RES industry and services.
Finally, nuclear technology clearly locks future gen-erations (or civilisations) in by leaving them nuclear waste management for centuries, just to secure a few decades of our energy production.
2. THE UNCERTAINTY OF NUCLEAR WASTE DISPOSAL
The various nuclear wastes are classified in three main categories (A,B and C), depending on their activity lev-el and their lifetime.
Figure 13: Nuclear waste categories
The most problematic high-activity nuclear waste (C-category, includes used nuclear fuel), represents 4500 m³ of waste in Belgium, produced over the last 100 years.46 This volume is small compared to the amount of energy produced, but it still requires adequate treat-ment and disposal solutions in the very long term. A significant amount of money for R&D has been spent without yet finding a convincing solution. Various countries are facing a similar challenge and are looking for permanent storage facilities for the most problem-atic nuclear waste.47
Finland launched the construction of the first permanent storage facility in a 420m-deep granite layer in Onkalo, for an estimated cost of EUR 3.5 billion.
France is studying a similar project for an esti-mated cost of EUR 20-25 billion in Bure.
Germany is looking for a permanent storage fa-cility and is facing significant public opposition for its project in Gorleben. Sunk R&D costs are about EUR 1.6 billion. At least EUR 2 billion more is needed for research.
In the US, President Trump mentioned his intention to reactivate the Yucca Mountain storage fa-cility, stopped by Obama’s administration because of geological problems. Current cost of this ongoing pro-ject: EUR 15 billion.
Public opinion is still not convinced that nuclear waste management is under control. As shown in Germany, the local population often struggles against waste storage facilities in their region.
For Belgium, B&C-type of nuclear waste (long-life-time or high-activity) are still waiting for an underground storage solution, probably in 200m-deep clay layers near Boom or Ypres. National organism ONDRAF is in charge of this, and the Belgian Government needs to make some choices. The cost for this deep-burying so-lution is estimated up to EUR 3.2 billion and additional EUR 360 million for R&D.
45 Based on : Forum Nucléaire (2017): Qu’en est-il de nos déchets nucléaires?, URL: www.forumnucleaire.be/theme/déchets-nucléaires/quen-est-il-de-nos-déchets-nucléaires.
46 Ibid. 47 L’Écho: (2016): Le coût de l’enfouissement des déchets nucléaires risque de s’alourdir, URL: http://www.lecho.be/dossier/nucleaire/
Le-cout-de-l-enfouissement-des-dechets-nucleaires-risque-de-s-alourdir/9834626?ckc=1&ts=1489165030
Source: Climact, 201745
Dur
abili
tysh
ort
lifet
ime/
long
life
tim
e
Level of activitylow – intermediate – high
20
3. THE RISK OF MAJOR NUCLEAR ACCIDENTS
The debate around nuclear security is polarised because the probability of a major accident is statisti-cally low, while consequences may be extremely severe. Recent terrorist attacks have added a new dimension to the risk of major issues.
At least two major nuclear incidents have occurred in civilian nuclear history. Decades later, costs are still not easily estimated as they have led to massive damag-es to health, land use as well as pain and psychological impacts. Costs estimates include:48
Direct damage caused by the accident;
• Expenditures related to: • Actions to seal off the reactor and mitigate the
consequences in the exclusion zone • Resettlement of people and related construc-
tion of new housing and infrastructure • Social protection and health care provided to
the affected population • Research on environment, health and produc-
tion of clean food • Radiation monitoring of the environment • Radioecological improvement of settlements
and disposal of radioactive waste;
Indirect losses related to the opportunity cost of removing agricultural land and forests from use and the closure of agricultural and industrial facilities; and
Opportunity costs.
In 1986, the infamous disaster at the Chernobyl nu-clear power plants was likely caused by human error.
After 30 years, the cost of the Chernobyl disaster is esti-mated at hundreds of billions of dollars – up to EUR 435 billion, of which EUR 235 billion was for Belarus only.49 The problem is still not completely solved, even with the recent massive sarcophagus that was placed on top of the reactor.
In 2011, the Fukushima nuclear power plant, op-erated by Tepco, suffered the worst nuclear accident since Chernobyl, when three cores melted down after a Tsunami. Fukushima disaster cost is already estimated at more than EUR ~160 billion (~5% of Japan GDP). This estimate includes decontamination costs (EUR 40 bil-lion), compensation payments (EUR ~60 billion), as well as plant decommissioning, radioactive water treatment and the building of interim storage facilities.50 Still, these estimates will hardly account for all the indirect costs in-duced by such a disaster.
Not surprisingly, these nuclear incidents are in the top ranking of the costliest disasters worldwide.
To this respect, the question of financial liability is central, since nuclear power plants (NPP) are mostly operated by private entities which cannot realistical-ly insure the risk of a nuclear accident. In the US, the Price-Anderson Act defines financial liability and in-cludes a solidarity mechanism between NPP operators. In Belgium, under the new law on civil liability in the field of nuclear energy, NPP operators are liable for a maximum of EUR 1.2 billion. Nevertheless, this amount may be reduced by Royal Decree to EUR 70 million for some NPPs.51 Realistically, damages in excess of this cap would need to be covered by public funds.52 Insuring such a major risk is difficult and would be ex-tremely costly.
48 International Atomic Energy Agency (2006): Chernobyl’s Legacy: Health, Environmental and Socio-economic Impacts. 49 Belarus Foreign Ministry (2009): Chernobyl Disaster of April 2009. 50 Japan Times (2016): Cost of Fukushima disaster expected to soar to ¥20 trillion, URL: http://www.japantimes.co.jp/
news/2016/11/28/national/cost-fukushima-disaster-expected-soar-%C2%A520-trillion/#.WMKb8nqleZR51 Article 7 of the law of 22 July 1985 on civil liability in the field of nuclear energy, as last amended by the law of 7 December 2016.
Consolidated, URL: http://www.jurion.fanc.fgov.be/jurdb-consult/plainWettekstServlet?wettekstId=910&lang=fr52 Ibid, Article 19.

21
KEY CONCLUSIONS
The drivers for the energy transition are in place. Political consensus was clarified with the global agree-ment at COP21, and targets are being set at all levels to support the transition. This policy brief looks at the implications of this transition on the Belgian electricity landscape in the context of the nuclear phase-out.
This leads to a few key conclusions:
1. We are at the cross-roads of the energy transi-tion:
As illustrated, RES-based technologies continue to decrease in cost rapidly. At the same time, the system implications are much better understood and technical solutions available at bearable costs.
Recent projects and historical trends tell us that a stable RES-based transition, accompanied by par-allel development of flexibility solutions, is likely the most attractive solution with regard to the related costs and risks.
Therefore, giving a clear sign that the nuclear phase-out is going through the way it is planned will be an effective way to give direction to the market. In Germany, a long political insecurity about the nucle-ar phase-out has been finally remedied by a binding government decision in 2011, which received cross-party support. As a consequence, investor security in alternative and sustainable energy sources increased dramatically and eventually fostered the German en-ergy transition.
2. The ELIA study highlights that capacity available today is sufficient to allow for the nuclear phase-out. The next eight years can serve to continue the energy transition, continuing with no-regret deployments that are well highlighted in the assumptions used in the ELIA study. Here are some of the key ones:
Energy efficiency: increased investments in en-ergy efficiency are required to continue stabilizing or reduce electricity consumption. Currently, electricity is mostly consumed by industry and lighting and appli-ances. They both require specific efficiency programmes that can in many cases lead to positive returns.
Increasing demand and supply flexibility op-tions no doubt are part of the solutions for the future. As the CREG highlights, this can help in avoiding some of the least-utilised gas back-up plants.
Continuing with a stable RES deployment: costs of RES have sufficiently come down for wind and solar PV. Support schemes are still required in the next few years to bridge the gap to full profitability for these new energy sources; but most importantly, financ-ing costs can represent up to 50% of the cost of these technologies if they are not properly framed by public authorities.53
Building-up interconnections to neighbour-ing countries is required both for market integration as well as for RES balancing. Care must be given, how-ever, to clarify who these interconnections will benefit. Building interconnection capacity so that French pow-er can be delivered to Holland or Germany is not an attractive business case for Belgium if there is no ade-quate reward. The next point describes the importance of proper EU integration.
3. EU integration and cooperation needs to be or-ganised properly
From a technical point of view, various stud-ies (including the ones from Artelys and from the KULeuven described above, see footnotes 20 and 28) have found that a competitive energy system, including a high level of intermittent RES, may be achieved thanks to higher cooperation between countries. But this co-operation should be managed properly between member states and might require clearer competence-sharing at the European and member state levels, including DSOs and TSOs.
While most of technical experts currently agree that more cross-border interconnections are required to facilitate RES integration and allow a lower-cost en-ergy system, the value added by such infrastructure is to be shared between cooperating stakeholders. To date, allocating mechanisms remain unclear and market coupling is costly. Further opening of support schemes might trigger concrete and mutually beneficial renewa-bles cooperation across borders in the EU.
53 Cf. IRENA (2016): Innovation Outlook: Offshore Wind, p. 65, URL: http://www.irena.org/menu/index.aspx?mnu=Subcat&PriMenuID=36&CatID=141&SubcatID=2742

22
Energy security and Energy sovereignty: each member state is sovereign for its own energy mix and there is not a strong enough solidarity mechanism nor any obligation in that respect. This is a clear barrier to cost-efficient transition, since it is difficult for a coun-try like Belgium to rely extensively on its neighbours in the long-term. An adequate solidarity mechanism among EU member states could be established in the current legislative proposals of the ‘Clean Energy for All Europeans’ package.
4. Setting an adequate price on carbon for the power sector in Belgium and in neighbouring countries
Competitiveness of gas plants is a great con-cern, as it not only could lead to shut-downs of the required capacity, it could also lead to much larger imports after the nuclear phase-out if coal remains a cheaper alternative (up to 50% of consumption based on the ELIA study).
Belgium has gas power plants that could be lev-eraged to support the nuclear phase-out. These power plants are currently under-utilised and closing because of overcapacity in the baseload electricity market and the low competitiveness of gas when compared to lignite. Even when a large part of the Belgian nuclear power plants was shut down in recent years after a se-ries of incidents, imports from France and Germany were cheaper than local gas plants.
In this context, a sufficient carbon price would push gas into a better position in the merit-order. This may be one of the cheapest and most efficient way to prepare the Belgian nuclear phase-out. A carbon price of EUR ~40 per tCO
2 by 2030 would have an impact of
EUR ~32 per MWh on German coal-based electricity generation, and roughly only half of that on gas.54 The UK decided to go ahead internally and put their own internal carbon price, which recently doubled to EUR 30 per tCO
2, and led to a near-complete hard coal-gas
switching.
This should ideally be achieved at the European level through efficient ETS reform. However, even if the ETS reforms voted in by the European Parliament‘s environment committee in December 2016 were adopt-ed by the Parliament and the Council, it is unlikely that this would raise the carbon price by much, unless the structural oversupply of credits is eradicated.55
This has led Belgium to address the issue with a strategic gas reserve, likely not the best solution. Reducing European over-capacity with lower coal and nuclear production seems a required first step before looking at giving more subsidies to fossil fuel production. In this respect, coal phase-out legislation is currently being discussed in several EU member states for different time horizons.
5. In the long term, the ADEME study56 suggests that in France variable RES can be handled at reasonable cost by the system. There is some proof to suggest that this is simi-lar in Belgium. A logical next step would be a feasibility study for Belgium, looking in more detail at alterna-tives to enhance flexibility in the electricity system. This would complement the ELIA study with a better under-standing of the alternatives to simple gas back-up and a longer-term perspective. This would be one, but cer-tainly not the only, important next step to continue giving direction to the Belgian energy transition.
54 Ecofys (2015): International Comparison of Fossil Power Efficiency and CO2 Intensity – Update 2015. Mitsubishi Research Institute, URL: www.ecofys.com/files/files/intern.-comparison-of-fossil-power-efficiency-and-co2-intensity-2015_02.pdf
55 Farmer and Lafond (2016): How predictable is technological progress?, Research Policy 45, p. 647–665.56 Artelys (2015): Un mix électrique 100% renouvelable? Analyses et optimisations. ADEME, URL:
http://www.ademe.fr/mix-electrique-100-renouvelable-analyses-optimisations

23

15 Rue d’Arlon, B-1050 Brussels, Belgium T +32 2 743 41 00 F +32 2 743 41 09 E [email protected] W eu.boell.org