Embed Size (px)
Citation preview

1750 Massachusetts Avenue, NW | Washington, DC 20036-1903 USA | 202.328.9000 Tel | 202.328.5432 Fax | www.piie.com
POLICY BRIEF
PB 16-18 Uneven Progress on Sovereign Wealth Fund Transparency and Accountability
Sarah E. Stone and Edwin M. TrumanOctober 2016
Sarah E. Stone is a junior economics and English major at Williams College. She was an intern at the Peterson Institute for International Economics during the summer of 2016. Edwin M. Truman became a senior fellow in 2001 and is now a nonresident senior fellow. He served as assistant secretary of the US Treasury for International Affairs from December 1998 to January 2001, and returned as counselor to the secretary (March–May 2009). He directed the Division of International Finance of the Board of Governors of the Federal Reserve System from 1977 to 1998. He is the author or coauthor of Sovereign Wealth Funds: Threat or Salvation? (2010), as well as several other pieces on sovereign wealth funds.
Authors’ Note: We thank the Sovereign Wealth Center for their assistance in providing some of the estimates in table 1, Adam Robbins of the International Forum of Sovereign Wealth Funds for his advice, and our colleagues Jeremie Cohen-Setton, Joseph Gagnon, Zixuan Huang, Nicholas Lardy, Sebastian Röing, and Steve Weisman for their advice and encouragement. We also thank Madona Devasahayam for her patience and dedication to this Policy Brief. In preparing the 2015 scoreboard, the earlier scoreboard results were checked and scores were marked down on elements where there is no current evidence that the fund in question satis-fies them. The results of all four scoreboards, including the adjusted versions of the 2007, 2009, and 2012 scoreboards, are available at www.piie.com. This Policy Brief uses the adjusted scoreboards for tracking progress on SWF transparency and accountability.
© Peterson Institute for International Economics. All rights reserved.
Sovereign wealth funds (SWFs) burst onto the international financial scene a decade ago. They are government-controlled
funds that generally are invested in whole or in part outside their home country. SWFs attract political and financial attention because of their substantial size. The funds often are controlled by governments that are not major partici-pants in international finance or in the construction of the associated web of standards and behavioral conventions. In many cases, funds’ operations are substantially opaque. Such opacity, along with their size, give rise to suspicions about the motives behind their investments and their potential to contribute to economic, financial, or political disruption.
In fact, SWFs, in form if not in name, have been around for decades. They are a feature of government finance in many countries, in some cases much like government pension funds. The explosive growth of foreign exchange reserves during the 2000s provided the financial raw material for the establish-ment and expansion of these funds. However, some funds are financed from fiscal surpluses or are loosely tied to long-term pension plans. Others operate as stabilization funds.
In 2007, in response to the varied concerns about SWFs, one of us wrote a Peterson Institute Policy Brief on this issue (Truman 2007a), which inspired the development of a prototype scoreboard for sovereign wealth funds as a device to examine and promote the transparency and account-ability of SWFs within and outside their countries (Truman 2007b). The first full scoreboard for 2007 was released in April 2008 (Truman 2008); the second for 2009 in Truman (2010); and the third for 2012 in Bagnall and Truman (2013). This Policy Brief updates and expands on that work, presenting the fourth SWF scoreboard.1 The purpose is to
1. In preparing the 2015 scoreboard, the earlier scoreboard resultswere checked and scores were marked down on elements wherethere is no current evidence that the fund in question satisfiesthem. It is possible that scoring was too generous in the past,and it is also possible that the fund in question no longer pro-vides public information on a certain element. The first possibilitywould be an error in consistency in applying the criteria. Thesecond possibility suggests that the fund should be penalizedin a later scoreboard for its failure to continue to provide thisinformation. Alternatively, the fund’s previous score could be re-duced. Our rationale in choosing the alternative approach is thatif a fund does not satisfy an element now, it should not receivecredit on that element for past performance. Therefore, as partof this edition, scores were adjusted in all past scoreboards, 2012,2009, and 2007. In addition, to take account of the modificationin the elements between the first and second scoreboards, fundsscored in 2007 now receive credit for scores on four elementsfrom the 2009 scoreboard that were not included in the 2007edition: (2) legal framework, (10) role of the governing body, (13)

2
Number PB16-18 October 2016
assess the progress that has been made by the countries with these funds and by their managements with respect to trans-parency and accountability. It also assesses the role of the International Forum of Sovereign Wealth Funds (IFSWF) in promoting the transparency and accountability of SWFs.
The Policy Brief draws three major conclusions. First, the 60 SWFs that are scored in this edition of the scoreboard record substantial differences. Some have high scores; others have low scores. Even funds within the same country have very different scores. Most important, a large number of funds fall short of what the citizens of their countries or the international community should expect with regard to their transparency and accountability. Second, the previous point notwithstanding, the scores of many funds have substantially improved over the past decade. This demonstrates that prog-ress not only is possible but also is happening. Third, the IFSWF has been instrumental in promoting transparency and accountability of SWFs, and member funds generally score higher than nonmember funds. But only 32 (actu-ally 31) of the 60 funds that are scored in this edition are members of the IFSWF.2 The Forum can do a lot more not only to increase its membership but also to improve the transparency of its current members.
internal ethical standards, and (30) risk management strategy (see Truman 2010, appendix 5A, and tables 4 and 7 below). Four elements in the 2007 scoreboard were dropped. (This treatment biases the 2007 scores upward slightly.) The results of all four scoreboards, including the adjusted versions of the 2007, 2009, and 2012 scoreboards, are available at www.piie.com. This Policy Brief uses the adjusted scoreboards for tracking progress on SWF transparency and accountability.
2. Norway’s Government Pension Fund–Global has withdrawn from IFSWF membership, but it is treated as a member, making a total of 32.
EVOLUTION OF SWFS
SWFs have many origins, take many forms, and have many objectives. What they have in common is that they are established by governments for the welfare of their citi-zens. Differences in political philosophies and government structures mean that links between a particular fund and its citizens are often difficult to discern. In some cases, such as the Alaska Permanent Fund, the linkage is clear. In funds established by royal decree, for example, the linkage may be less clear. In all cases, however, the governments involved attest, at least implicitly, that in administering their SWFs, they act in the interest of their citizens in the short, medium, and long runs.
Angela Cummine (2016) makes a provocative case for codifying the links between citizens’ wealth, particularly in terms of the natural resources of an economy, and citizens’ control over that wealth, via the establishment of the legal case for ownership, promotion of accountability and disclo-sure, and influence over the investments of the fund and the distribution of benefits. She buttresses her political case by drawing on the economics and finance literature. One does not have to completely accept Cummine’s argument to agree that the transparency and accountability of SWFs are crucial to their political acceptance at home and abroad.
In 2007, the term “sovereign wealth fund” was not in common parlance, though Andrew Rozanov (2005) had coined it two years before. In the intervening years, the number of SWFs has proliferated. Building on a prototype presented in 2007 (Truman 2007b), the first full SWF score-board for 2007 (Truman 2008) identified 44 nonpension SWFs and scored 37 of them from 31 countries.3 The second scoreboard in Truman (2010) scored 44, and the third score-board published in Bagnall and Truman (2013) scored 49.
In this fourth edition of the scoreboard, we identify 73 nonpension SWFs in table 1 and score 60 of them from 43 countries (table 2).4 Table 1 presents each of the 73 funds’
3. In the fi rst scoreboard, three pension reserve funds (of Australia, New Zealand, and Ireland) were included among the 10 government pension funds. Subsequently, following the defi ni-tion adopted by the International Working Group of SWFs (IWG 2008, 3), these funds have been classifi ed as regular SWFs. See footnote 4.
4. This Policy Brief employs the definition of an SWF adopted by the International Working Group of SWFs (IWG 2008, 3), and, we have adjusted the information presented in previous SWF scoreboards to be consistent with this treatment. That definition includes government pension reserve funds as SWFs. These funds are not directly linked to the financing of social security systems but are expected to be used for that purpose in the future. The definition does not include other forms of govern-ment pension funds. However, some information on such funds is reported in some of the tables that follow for comparison pur-poses. The IWG agreed: “SWFs are special purpose investment funds or arrangements that are owned by the general govern-ment. Created by the general government for macroeconomic
The 60 SWFs scored in this edition of the scoreboard record substantial differences. A large
number of them fall short of what the citizens of their countries
or the international community should expect with regard to their transparency and accountability.

3
Number PB16-18 October 2016
1
Table 1 Total SWF assets under management (billions of US dollars)
Country Fund name
Total
assets
Foreign
assets
Nonpension SWFs
Norway Government Pension Fund–Global 888 888
China China Investment Corporation 810 196
United Arab Emirates Abu Dhabi Investment Authoritye 700 700
Kuwait Kuwait Investment Authoritye 566 342
Hong Kong Exchange Fund 459 459
Singapore GIC Private Ltd.e,f 344 327
Singapore Temasek Holdings 250 175
Qatar Qatar Investment Authoritye 242 242
United Arab Emirates Investment Corporation of Dubaif 194 194
France Caisse des Dépôts et Consignationsf 163 25
United Arab Emirates Abu Dhabi Investment Councile 111 111
Russia National Welfare and Reserve Fund 110 110
Korea Korea Investment Corporation 92 92
Australia Future Fund 90 63
Saudi Arabia Public Investment Funde,n 88 44
United Arab Emirates, Abu Dhabi International Petroleum Investment Companye 68 68
Libya Libyan Investment Authority 67 67
United Arab Emirates, Abu Dhabi Mubadala Development Companyf 67 27
Malaysia Permodalan Nasional Berhade,n 64 21
Iran National Development Fund of Irane 63 20
Kazakhstan National Fund of the Republic of Kazakhstann 63 30
Australia Queensland Investment Corporationf,n 57 6
United States Alaska Permanent Fund Corporation 55 19
Argentina Sustainability Guarantee Funde,n 51 0
Algeria Revenue Regulation Fundf 50 0
Kazakhstan Samruk-Kazyna JSCf 50 50
France BPIFrance Investissement 44 0
Brunei Brunei Investment Agencye 40 40
Australia Victorian Funds Management Corporationn 39 12
Azerbaijan State Oil Fund of the Republic of Azerbaijan 34 34
Oman State General Reserve Funde 34 34
United States Texas Permanent School Fundf 34 11
United Arab Emirates Dubai Holdingf 22 11
New Zealand New Zealand Superannuation Fund 21 18
Malaysia Khazanah Nasional Berhad 20 9
United Arab Emirates Istithmar Worlde 20 13
United States New Mexico State Investment Councilf 20 3
Canada Alberta Heritage Savings Trust Fundf 18 8
Timor-Leste Petroleum Fund of Timor-Leste 17 17
United Arab Emirates Emirates Investment Authoritye,n 17 9
United States (Texas) Permanent University Fundf 17 6
Chile Economic and Social Stabilization Fund 15 14
Bahrain Bahrain Mumtalakat Holding Companyf 11 6
Russia Russian Direct Investment Fund 10 0
Chile Pension Reserve Fund 9 9
Ireland Ireland Strategic Investment Fundf 9 2
Peru Fiscal Stabilization Fund 8 8
(table continues)

4
Number PB16-18 October 2016
2
Table 1 Total SWF assets under management (billions of US dollars) (continued)
Country Fund name
Total
assets
Foreign
assets
Nonpension SWFs
United States Permanent Wyoming Mineral Trust Fundf 7 2
Botswana Pula Funde 6 6
Italy Fondo Strategico Italiano 6 0
Mexico Budgetary Income Stabilization Funde 6 6
Trinidad and Tobago Heritage and Stabilization Fund 6 6
Angola Fundo Soberano de Angola 5 4
Brazil Sovereign Fund of Brazile 5 5
United States North Dakota Legacy Fundf 4 1
United States Alabama Trust Fundf 3 1
Vietnam State Capital Investment Corporationf 3 3
Kazakhstan National Investment Corporatione 2 1
Panama Fondo de Ahorro de Panamán 1.4 1.4
United Arab Emirates Ras al Khaimah Investment Authoritye,n 1 1
Palestine Palestine Investment Fund 0.8 0.1
Nigeria Nigeria Sovereign Investment Authority 0.6 0.6
Ghana Ghana Petroleum Fundse 0.5 0.5
Kiribati Revenue Equalization Reserve Funde 0.5 0.5
Morocco Moroccan Fund for Tourism Developmente 0.5 0.25
Venezuela Macroeconomic Stabilization Funde 0.5 0.5
Indonesia Government Investment Unite, n 0.4 0.2
Mauritania National Fund for Hydrocarbon Reservese,n 0.4 0.4
Gabon Sovereign Fund of the Gabonese Republice,n 0.3 0.3
Mongolia Fiscal Stability Funde,n 0.3 0.3
Equatorial Guinea Fund For Future Generationse 0.1 0.1
Rwanda Agaciro Development Fund 0.04 0.04
Mexico Fondo Mexicano del Petroléo para la Estabilización y el Desarrolloe
0 0
Subtotal 6,281 4,581
Government pension funds
Japan Government Pension Investment Fund 1,306 438
Netherlands Stichting Pensioenfonds ABP 361 310
United States California Public Employees’ Retirement Systemfp 302 219
Canada Canada Pension Plan Investment Board 279 226
China National Council for Social Security Fund 292 17
Canada Caisse de dépôt et placement du Quebec 248 134
Canada Ontario Teachers’ Pension Plan 171 96
France Fonds de réserve pour les retraitesfp 33 26
Thailand Government Pension Fund 21 16
Subtotal 3,013 1,482
Total 9,294 6,063
SWF = sovereign wealth funde = Estimate of total assets and foreign asssetsf = Estimate of foreign assets (stabilization and similar funds 100 percent, holding companies 50 percent, US states 33 percent [aproximately Alaska’s share], and other information).fp = Estimate based on information on the fundn = Not included in SWF scoreboard
Note: The data are for 2016 or most recent available.
Sources: SWF websites and an average of estimates from the Sovereign Wealth Fund Institute website, www.swfin-stitute.org/sovereign-wealth-fund-rankings; OMFIF (2016); and Sovereign Wealth Center, www.sovereignwealth-center.com.

5
Number PB16-18 October 2016
total assets under management and the size of each one’s foreign assets. We include the latter because much of the international attention on SWFs focuses on their cross-border investments. For a number of funds, the size and, more often, the share of foreign assets in the total are esti-mates. With that caveat, the share of foreign assets in the SWF compilation in table 1 is 73 percent compared with 86 percent three years ago (Bagnall and Truman 2013).5 In quantitative terms, most of the difference is accounted for by the China Investment Corporation (CIC). Despite the media attention to its overseas investments, the value of the CIC’s foreign investments is only 24 percent of the total. They have grown only 5 percent to $196 billion over the past three years, while CIC’s domestic assets have doubled to $614 billion. In the case of the National Fund of the Republic of Kazakhstan, which is being drained, less than
purposes, SWFs hold, manage, or administer assets to achieve financial objectives, and employ a set of investment strategies that include investing in foreign financial assets.” The IWG noted that “general government includes both central government and subnational government.” It added, “SWFs are commonly established out of balance of payments surpluses, official foreign currency operations, the proceeds of privatizations, fiscal sur-pluses, and/or receipts resulting from commodity exports.” This language on the financial resources used to establish and expand SWFs is also found in the International Monetary Fund’s (IMF) Sixth Balance of Payments and International Investment Position Manual (IMF 2009).
5. One percentage point of the decline is because we have included in this compilation some funds that invest only domesti-cally because some of them are members of the International Forum of Sovereign Wealth Funds (IFSWF). Some part of the decline also may reflect more accurate estimates.
half its assets are now invested internationally, compared with about 85 percent three years ago.
In contrast, the share of foreign assets in the comparator group of government pension funds has increased over the past three years, from 37 to 49 percent. This shift is largely due to a change in strategy by Japan’s very large Government Pension Investment Fund, which has shifted its foreign asset share from 23 percent three years ago to 34 percent (to reach its stated target of 40 percent). But the Japanese fund is not alone in shifting into foreign assets. The share of foreign assets for three Canadian GPFs combined has moved from 50 percent three years ago to 65 percent (table 1).6
Our list of SWFs might be longer. The Sovereign Wealth Fund Institute (SWFI) lists 79 SWFs,7 while the Official Monetary and Financial Institutions Forum (OMFIF 2016) identifies 85 sovereign funds.8 The assets under management by SWFs have increased substantially since 2007, but not to the extent that many observers once predicted; see Bagnall and Truman (2013, 2). As shown in figure 1, based on the
6. The appreciation of the US dollar distorts these data to some degree. From the end of March 2013 to the end of March 2016, the Canadian dollar declined 22 percent against the US dollar, and the yen declined 16 percent.
7. See SWFI website, www.swfinstitute.org/sovereign-wealth-fund-rankings/.
8. The OMFIF text says that it lists 86 sovereign funds, but the count is only 85. On the other hand, it lists China’s National Council for Social Security Fund as a sovereign fund, but we score it as a pension fund, and it lists the Exchange Fund of the Hong Kong Monetary Authority as a central bank. We treat the Exchange Fund, which is managed by the Hong Kong Monetary Authority, as an SWF.
0
1,000
2,000
3,000
4,000
5,000
6,000
7,000
8,000Se
ptem
berDece
mber
Mar
chJu
neSe
ptem
berDece
mber
Mar
chJu
neSe
ptem
berDece
mber
Mar
chJu
neSe
ptem
berDece
mber
Mar
chJu
neSe
ptem
berDece
mber
Mar
chJu
neSe
ptem
berDece
mber
Mar
chJu
neSe
ptem
berDece
mber
Mar
chJu
neSe
ptem
berDece
mber
Mar
chJu
neSe
ptem
berDece
mber
Mar
chJu
ne
SWFI dataSWFs scored
billions of US dollars
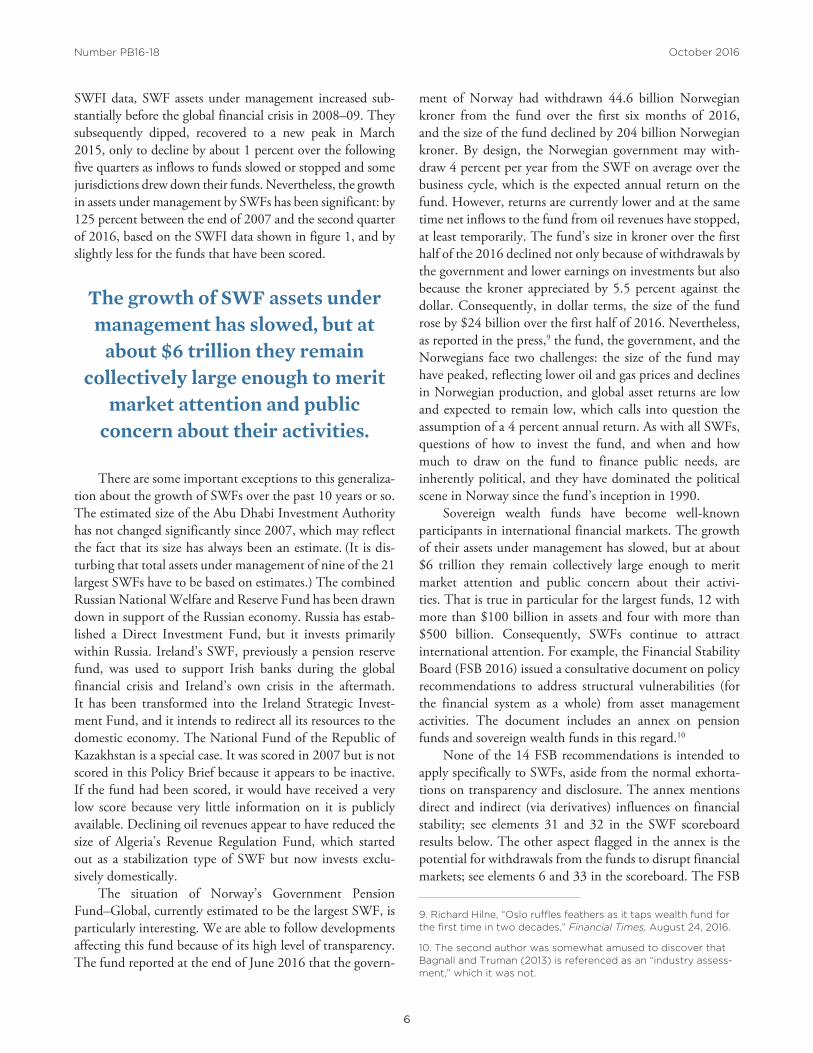
Figure 1 SWF assets under management, September 2007 to June 2016
Sources: Sovereign Wealth Fund Institute; table 1; Truman (2008, 2010); and Bagnall and Truman (2013).
2007 2008 2009 2010 2011 2012 2013 2014 2015 2016
6
Number PB16-18 October 2016
SWFI data, SWF assets under management increased sub-stantially before the global financial crisis in 2008–09. They subsequently dipped, recovered to a new peak in March 2015, only to decline by about 1 percent over the following five quarters as inflows to funds slowed or stopped and some jurisdictions drew down their funds. Nevertheless, the growth in assets under management by SWFs has been significant: by 125 percent between the end of 2007 and the second quarter of 2016, based on the SWFI data shown in figure 1, and by slightly less for the funds that have been scored.
There are some important exceptions to this generaliza-tion about the growth of SWFs over the past 10 years or so. The estimated size of the Abu Dhabi Investment Authority has not changed significantly since 2007, which may reflect the fact that its size has always been an estimate. (It is dis-turbing that total assets under management of nine of the 21 largest SWFs have to be based on estimates.) The combined Russian National Welfare and Reserve Fund has been drawn down in support of the Russian economy. Russia has estab-lished a Direct Investment Fund, but it invests primarily within Russia. Ireland’s SWF, previously a pension reserve fund, was used to support Irish banks during the global financial crisis and Ireland’s own crisis in the aftermath. It has been transformed into the Ireland Strategic Invest-ment Fund, and it intends to redirect all its resources to the domestic economy. The National Fund of the Republic of Kazakhstan is a special case. It was scored in 2007 but is not scored in this Policy Brief because it appears to be inactive. If the fund had been scored, it would have received a very low score because very little information on it is publicly available. Declining oil revenues appear to have reduced the size of Algeria’s Revenue Regulation Fund, which started out as a stabilization type of SWF but now invests exclu-sively domestically.
The situation of Norway’s Government Pension Fund–Global, currently estimated to be the largest SWF, is particularly interesting. We are able to follow developments affecting this fund because of its high level of transparency. The fund reported at the end of June 2016 that the govern-
ment of Norway had withdrawn 44.6 billion Norwegian kroner from the fund over the first six months of 2016, and the size of the fund declined by 204 billion Norwegian kroner. By design, the Norwegian government may with-draw 4 percent per year from the SWF on average over the business cycle, which is the expected annual return on the fund. However, returns are currently lower and at the same time net inflows to the fund from oil revenues have stopped, at least temporarily. The fund’s size in kroner over the first half of the 2016 declined not only because of withdrawals by the government and lower earnings on investments but also because the kroner appreciated by 5.5 percent against the dollar. Consequently, in dollar terms, the size of the fund rose by $24 billion over the first half of 2016. Nevertheless, as reported in the press,9 the fund, the government, and the Norwegians face two challenges: the size of the fund may have peaked, reflecting lower oil and gas prices and declines in Norwegian production, and global asset returns are low and expected to remain low, which calls into question the assumption of a 4 percent annual return. As with all SWFs, questions of how to invest the fund, and when and how much to draw on the fund to finance public needs, are inherently political, and they have dominated the political scene in Norway since the fund’s inception in 1990.
Sovereign wealth funds have become well-known participants in international financial markets. The growth of their assets under management has slowed, but at about $6 trillion they remain collectively large enough to merit market attention and public concern about their activi-ties. That is true in particular for the largest funds, 12 with more than $100 billion in assets and four with more than $500 billion. Consequently, SWFs continue to attract international attention. For example, the Financial Stability Board (FSB 2016) issued a consultative document on policy recommendations to address structural vulnerabilities (for the financial system as a whole) from asset management activities. The document includes an annex on pension funds and sovereign wealth funds in this regard.10
None of the 14 FSB recommendations is intended to apply specifically to SWFs, aside from the normal exhorta-tions on transparency and disclosure. The annex mentions direct and indirect (via derivatives) influences on financial stability; see elements 31 and 32 in the SWF scoreboard results below. The other aspect flagged in the annex is the potential for withdrawals from the funds to disrupt financial markets; see elements 6 and 33 in the scoreboard. The FSB
9. Richard Hilne, “Oslo ruffl es feathers as it taps wealth fund for the fi rst time in two decades,” Financial Times, August 24, 2016.
10. The second author was somewhat amused to discover that Bagnall and Truman (2013) is referenced as an “industry assess-ment,” which it was not.
The growth of SWF assets under management has slowed, but at
about $6 trillion they remain collectively large enough to merit
market attention and public concern about their activities.

7
Number PB16-18 October 2016
(2016, 39) states that it plans to return to pension funds and SWFs when it revisits its methodologies for identifying nonbank, noninsurance global systemically important finan-cial institutions (NBNI G-SIFI). Whether their government owners or managers are concerned or flattered by this high-level attention, a subset of SWFs have become important players on the global financial stage. Their transparency and accountability are important tools for assessing the possible risks that they pose to the stability of the global financial system. The next section assesses SWF transparency and accountability based on the 2015 SWF scoreboard.
2015 SWF SCOREBOARD
Before turning to the 2015 scoreboard results, a reminder: The motivation behind the SWF scoreboard is not that ev-ery SWF should score 100 percent on every element and, thus, on the overall scoreboard. The scoreboard is intended to provide a benchmark, not to define perfection. The cir-cumstances, environment, and national cultures surrounding each fund are different. It is unreasonable to expect that one size would fit all. Some of the elements in the scoreboard apply more precisely to some SWFs and less to others.
In this fourth SWF scoreboard, 60 SWFs and 9 gov-ernment pension funds (GPFs) are scored for a total of 69 funds. As in the past scoreboards, GPFs are included because they are a natural point of comparison for SWFs: They, too, are government-controlled entities invested on behalf of the country’s citizens for their future benefit. See Bagnall and Truman (2013, appendix A) for details on the 33 elements in the scoreboard.
Scores are based on publicly available information, such as summaries and annual reports on the funds’ websites or from their ministries of finance. We also drew on the self-assessment reports that most members of the IFSWF have posted on the Forum’s website. Most of the information used in this edition of the scoreboard is from 2015—hence its date—because funds tend not to release their annual reports for a given year, for example, until the second half of the following year, at the earliest.
The 2015 edition of the scoreboard includes 15 new funds (indicated by an asterisk in table 2). All members of the IFSWF are scored as in the past and there are eight new members of the Forum since 2012; two of them were scored previously before they joined the Forum. Three US funds are added to examine more broadly the transparency and accountability of SWFs in the United States. Likewise, two new funds from the United Arab Emirates (UAE) bring that country’s total to seven. To add perspective on devel-oping countries’ SWFs, Peru’s Fiscal Stabilization Fund and the Fondo Mexicano del Petroléo para la Estabilización y el Desarrollo are now included.
Though the SWF scoreboard has historically included
funds that have at least some foreign assets, a few exceptions are included in this edition. Italy’s Fondo Strategico Italiano and the new Russian Direct Investment Fund, which primarily invest domestically, are included because they are members of the IFSWF. France’s BPIFrance Investissement is scored because it provides a point of comparison for Italy’s
fund. France’s Caisse des Dépôts et Consignations was added for comparison purposes and because, founded in 1816, it is said to be the oldest SWF in the world.11
Four funds that were included in the previous three score-boards were dropped from the 2015 scoreboard: the National Fund of the Republic of Kazakhstan, São Tomé & Principe’s National Oil Account, the Oil Revenue Stabilization Account of Sudan/South Sudan, and Venezuela’s National Development Fund. Both the Venezuela and Kazakhstan funds were eliminated because they appear to be rapidly emptying, and there is little available information on them. As mentioned above, in the Kazakh fund’s case, the drop in oil prices has caused the government to withdraw a large portion of the fund. In addition, we were unable to find any public information about the funds from Sudan/South Sudan and São Tomé & Principe. We speculate that the civil war in Sudan has prevented the fund from operating in recent years, if it has any assets left.12
11. As can be seen from table 1, a few other funds could have been added as well. The principal fund of any size is Saudi Arabia’s Public Investment Fund, which we wanted to include but on which there is no information. In other words, it would have received a zero on the SWF scoreboard. The other large funds are Australia’s Queensland Investment Corporation and the Victorian Funds Management Corporation, but until recently they invested only domestically.
12. In addition, for the 2015 scoreboard the names of several SWFs have changed: Ireland’s National Pension Reserve Fund was replaced by Ireland Strategic Investment Fund, Mexico’s Oil Income Stabilization Fund was replaced by Budgetary Income Stabilization Fund, Singapore’s Government of Singapore Investment Corporation was replaced by GIC Private Ltd., and Dubai International Capital was replaced by its parent Dubai Holding.
The range of these results emphasizes the fact that
generalizations about the transparency and accountability
of SWFs as a group are unfounded; the 2015 SWF
scoreboard again demonstrates that funds differ widely.

8
Number PB16-18 October 2016
Table 2 2015 SWF scoreboard
Country Fund name Score
Nonpension SWFs
Norway Government Pension Fund—Global 98
New Zealand New Zealand Superannuation Fund 94
United States Permanent Wyoming Mineral Trust Fund 93
Azerbaijan State Oil Fund of the Republic of Azerbaijan 92
Canada Alberta Heritage Savings Trust Fund 91
Chile Economic and Social Stabilization Fund 91
Chile Pension Reserve Fund 88
Timor-Leste Petroleum Fund of Timor-Leste 88
United States Alaska Permanent Fund Corporation 88
Australia Future Fund 87
United States New Mexico State Investment Council 84
Ireland Ireland Strategic Investment Fund 82
United States Alabama Trust Fund 82
Trinidad and Tobago Heritage and Stabilization Fund 81
Korea Korea Investment Corporation 78
Palestine Palestine Investment Fund* 77
Nigeria Nigeria Sovereign Investment Authority 76
Singapore Temasek Holdings 76
United States Texas Permanent School Fund* 73
China China Investment Corporation 70
United States (Texas) Permanent University Fund* 70
France Caisse des Dépôts et Consignations* 68
Hong Kong Exchange Fund 68
Kuwait Kuwait Investment Authority 68
Mexico Budgetary Income Stabilization Fund 68
United Arab Emirates Mubadala Development Company 68
Angola Fundo Soberano de Angola 67
Italy Fondo Strategico Italiano* 67
France BPIFrance Investissement* 65
United States North Dakota Legacy Fund* 64
Malaysia Khazanah Nasional Berhad 61
Singapore GIC Private Ltd. 61
Brazil Sovereign Fund of Brazil 60
Botswana Pula Fund 59
United Arab Emirates Dubai Holding 59
United Arab Emirates Abu Dhabi Investment Authority 58
Rwanda Agaciro Development Fund* 57
United Arab Emirates Investment Corporation of Dubai 55
United Arab Emirates International Petroleum Investment Company 55
Bahrain Bahrain Mumtalakat Holding Company 52
Oman State General Reserve Fund 52
Russia National Welfare and Reserve Fund 49
Iran National Development Fund of Iran 48
Kazakhstan National Investment Corporation* 48
Mexico Fondo Mexicano del Petroléo para la Estabilización y el Desarrollo*
48
(table continues)

9
Number PB16-18 October 2016
The Results
The 60 nonpension sovereign wealth funds received an average score of 62 percent in this edition of the SWF score-board (see table 2).13 The median is 62.5. The range of scores was 87, distributed between 11 (Equatorial Guinea’s Fund for Future Generations) and 98 (Norway’s Government Pension Fund–Global), with a standard deviation of 20.5 percentage points. The range of these results emphasizes the fact that generalizations about the transparency and account-ability of SWFs as a group are unfounded; the 2015 SWF scoreboard again demonstrates that funds differ widely.
13. The scores on the 33 elements, which range from zero to one in one-quarter increments, are summed and scaled to 100.
The government pension funds scored an average of 87 with a standard deviation of 10 percentage points. The GPFs’ higher average score reflects the fact that the insti-tutions operating them are more firmly established in law and practice based on national and international standards. Moreover, the citizens of GPF countries have concrete expectations of benefiting from the funds, in the form of pensions, within their lifetimes. Although the GPFs score higher than SWFs on average, the 10 highest-scoring SWFs have scores as high as the GPF average or higher. In China’s case, its GPF, the National Council for Social Security Fund, scored 11 points lower than its SWF, China Investment Corporation. In contrast, the US GPF California Public Employees’ Retirement System (CalPERS) scored 95, higher than any of the US SWFs. France’s Fonds de réserve pour les retraites scored 94, about 25 points higher than its SWFs
Table 2 2015 SWF scoreboard (continued)Country Fund name Score
Nonpension SWFs
Peru Fiscal Stabilization Fund* 48
Kazakhstan Samruk-Kazyna JSC* 47
Morocco Moroccan Fund for Tourism Development* 47
Ghana Ghana Petroleum Funds 45
Venezuela Macroeconomic Stabilization Fund 42
Qatar Qatar Investment Authority 40
Vietnam State Capital Investment Corporation 39
Russia Russian Direct Investment Fund* 36
Kiribati Revenue Equalization Reserve Fund 35
United Arab Emirates Abu Dhabi Investment Council* 33
Brunei Brunei Investment Agency 30
Algeria Revenue Regulation Fund 26
Libya Libyan Investment Authority 23
United Arab Emirates Istithmar World 23
Equatorial Guinea Fund for Future Generations 11
Subtotal (60 SWFs) 62
Government pension funds
United States California Public Employees’ Retirement System 95
Canada Canada Pension Plan Investment Board 94
France Fonds de réserve pour les retraites 94
Netherlands Stichting Pensioenfonds ABP 92
Canada Caisse de dépôt et placement du Quebec 91
Canada Ontario Teachers’ Pension Plan 86
Thailand Government Pension Fund 86
Japan Government Pension Investment Fund 83
China National Council for Social Security Fund 59
Subtotal (9 GPFs) 87
All funds (69) 64
* = indicates a fund that was included for the first time in this scoreboard
Source: Authors’ calculations.

10
Number PB16-18 October 2016
Caisse des Dépôts et Consignations (68) and BPIFrance (65). Canada’s three GPFs scored an average of 90, similar to its SWF, Alberta Heritage Savings Trust Fund (91).
Six US states have a total of seven SWFs: Alabama, Alaska, New Mexico, North Dakota, Wyoming, and Texas, which has two. Their average score is 79, significantly higher than the overall average of the 60 SWFs (62).14 However, there is a 29-point range between the highest-scoring fund, the Permanent Wyoming Mineral Trust Fund (93), and the lowest-scoring, the North Dakota Legacy Fund (64), which is only slightly above the average for all nonpension SWFs.15 Thus, the scores of US funds vary substantially.
A different comparison for the US funds is the other country with the largest number of SWFs and all at the subnational level: the United Arab Emirates. The seven Emirate funds average 50 percent, which is 12 points below the overall SWF average. In addition, the range between the highest scorer, Mubadala Development Company (68), and the lowest scorer, Istithmar World (23), is even greater than that for the US subnational funds.16
One often hears that SWFs from emerging-market and developing countries are nontransparent, and consequently not as accountable to their citizens or those of the rest of the world. The scoreboard results refute this generalization. It is true that all of the 30 SWFs below the median in table 2 are from emerging-market and developing countries. However, 15 of the 30 above the median score 77 on average, compared
14. By convention in the SWF scoreboards, the subnational and pension funds receive a score that is 3 percentage points lower than the maximum possible for all other funds because they receive only half credit on elements that by design do not apply to them: whether (7) their operations are integrated with mon-etary and fi scal policies and (8) their holdings are separate from international reserves. One might say yes to both questions and give them full credit, but that too would bias the results.
15. We understand that the role of Wyoming’s SWF and other funds in jurisdictions experiencing lower-than-expected mineral prices and revenues was debated at the Stroock Public Forum on Sovereign Wealth, in Jackson, Wyoming, in August 2016.
16. Istithmar World may be in liquidation.
with 80 on average for the 15 funds from advanced coun-tries and 79 for the group as a whole.17 One can see that the funds of nonadvanced countries are well represented in each of the three groups of 10 above the median.
To address the Middle Eastern oil exporters specifically: two of them, the Kuwait Investment Authority (68) and the UAE’s Mubadala Development Company (68), score above the overall average. But if the seven UAE funds are treated as one data point, the average for the six Middle Eastern oil exporters is 52 percent.18 Their scores are low, but not at the bottom except for the UAE’s Istithmar World.
On the other hand, the 15 new funds average only 57 percent.19 The highest scorer is the Palestine Investment Fund at 77 percent. Five others squeeze in above the overall average of 62, and eight are below the average, with the Abu Dhabi Investment Council the lowest at 33.
Italy’s Fondo Strategico Italiano earns a score of 67, essentially at the average. The Kuwait Investment Authority is an investor in the Italian fund and has a similar score 68. BPIFrance Investissement is slightly lower at 65, and its compatriot organization Caisse des Dépôts et Consignations receives a 68. None are distinguished scores.
In addition, the four largest funds with assets of more than $500 billion score only 74 percent on average, with the Abu Dhabi Investment Authority below the average for all funds. For the 10 next largest funds, the average is 62, equal to that for the 60 SWFs.
Progress on the SWF Scoreboard
A substantial number of SWFs have made significant prog-ress in their transparency and accountability during what is essentially a decade since the first scoreboard was released in late 2007 (Truman 2007b).
Table 3 provides a summary comparison of the results of the four SWF scoreboards.20 The number of funds added since the 2007 scoreboard (Truman 2008) is 27. Each row
17. Of course, how one makes the split matters. In this com-parison, countries such as Chile, Korea, China, Singapore, and Malaysia are classifi ed as nonadvanced.
18. The average for the UAE funds is 50. The scores for the oth-ers are: the Kuwait Investment Authority 68, Bahrain Mumtalakat Holding Company 52, Oman’s State General Reserve Fund 52, National Development Fund of Iran 48, and the Qatar Investment Authority 40.
19. The new funds are indicated by an asterisk (*) in table 2.
20. The number of SWFs scored in the 2007, 2009, and 2012 scoreboards were 37, 44, and 49, respectively, but, as mentioned earlier, four of these funds have been dropped from the 2015 scoreboard. Therefore, the number of funds that have been consistently scored are 33 (2007), 40 (2009), 45 (2012), and 60 (2015). See also footnote 1.
One often hears that SWFs from emerging-market and developing
countries are nontransparent, and consequently not as accountable to their citizens or those of the
rest of the world. The scoreboard results refute this generalization.

11
Number PB16-18 October 2016
in the table provides averaged results on a consistent set of the indicated number of funds.
Three observations: First, the 16-percentage-point increase in the average score of the 33 funds first scored in 2007 is quite impressive, a 31 percent increase.21 Second, for these funds the first big adjustment was between 2007 and 2009, after the work on this topic by one of us was first published (Truman 2007a, 2007b, 2008) and the Santiago Principles were developed and released (see below). The second big increase in scores was between 2012 and 2015, the explanation for which is not obvious, other than, perhaps, the growing influence of the IFSWF established after the Santiago Principles were released. Third, this pattern is repeated for each of the expanded lists of funds, those scored first for 2009 and 2012. Of course, the overall performance of each group is influenced by the scores of the first 33 funds in Truman (2008). But abstracting from the funds that came before, the seven funds introduced in 2009 (Truman 2010) showed no increase in average scores in the third scoreboard in 2012 (Bagnall and Truman 2013) but increased 15 percentage points, on average, in the latest scoreboard. The five funds introduced in 2012 had a very low average score at that time (19) but more than doubled their average by 2015 (41).
Figure 2 depicts the progress on the SWF scoreboard of the 60 nonpension funds in the 2015 scoring. Focusing on the 33 funds first scored in 2007, the divergence in improve-ment is striking. Ten funds had overall improvements of 20 percentage points (Singapore’s Temasek Holdings and Trinidad and Tobago’s Heritage and Stabilization Fund) to 64 percentage points (Nigeria Sovereign Investment
21. The seven GPFs that were scored in 2007 already had a rather high average score of 83 percent in 2007 and their aver-age increased only to 87 percent in 2015.
Authority). Arrayed between these two extremes are, from largest to smallest, the funds of Oman, the UAE’s Mubadala Development Company and Abu Dhabi Investment Authority, China, Qatar, Venezuela, and Iran. It would have been difficult for funds that scored highly in the 2007 scoreboard to show significant improvement by 2015. But one might have expected more improvement from the funds that scored below 80 percent in 2007. Nine of these 21 funds recorded less than double-digit improvements by 2015. From the lowest 2015 score to the highest, they were the UAE’s Istithmar World, the funds of Algeria, Brunei, Kiribati, Russia’s National Welfare and Reserve Fund, Botswana, Hong Kong, Ireland Strategic Investment Fund, and New Mexico State Investment Council. The last two funds did improve their scores from a respectable 77 percent to 82 and 84 percent, respectively.22
Performance on Elements of the Scoreboard
One approach to analyzing the results of the 2015 SWF scoreboard is to examine the performance of funds on average on each of the 33 elements and the four sections of the score-board: structure, governance, specific aspects of transparency and accountability, and behavior.23 Table 4 summarizes the average performance in the 2015 scoreboard of the 60 SWFs and 9 GPFs on these elements and categories.
The nonpension SWFs on average score the highest on structure, perhaps because the elements in the structure
22. Tables 6a and 6b provide more information on these trends.
23. One of the principles underlying the SWF scoreboard during its design phase was to make sure that at least one SWF did what all funds were being asked whether they did. The average scores understate the absolute number of funds that provide some information on each element because for most elements partial credit is allowed.
Table 3 Progression of average scores for the same
nonpension SWFs (percent)
Number
of funds 2007 2009 2012 2015
Change from
2007, 2009,
or 2012 score
to 2015 score
(percentage points)
60 funds 62 0
45 funds 53 63 11
40 funds 56 57 66 10
33 funds 51 58 59 67 16
Note: The data for previous scoreboards are from Truman (2008, 2010) and Bagnall and Truman (2013), respectively, adjusted as described in footnote 1. Four funds that were evaluated in the first, second, and third scoreboards were not evaluated in the fourth (2015) scoreboard: the National Fund of the Republic of Kazakhstan, São Tomé & Principe’s National Oil Account, the Oil Revenue Stabilization Account of Sudan/South Sudan, and Venezuela’s National Development Fund.
Sources: Truman (2008, 2010); Bagnall and Truman (2013); and authors’ calculations.

12
Number PB16-18 October 2016
010
2030
4050
6070
8090
100
Equa
toria
l Gui
nea—
Fund
for F
utur
e G
ener
atio
nsU
AE—
Istit
hmar
Wor
ldLi
byan
Inve
stm
ent A
utho
rity
Alg
eria
—Re
venu
e Re
gula
tion
Fund
Brun
ei In
vest
men
t Age
ncy
Abu
Dha
bi In
vest
men
t Cou
ncil
Kirib
ati—
Reve
nue
Equa
lizat
ion
Rese
rve
Fund
Russ
ian
Dire
ct In
vest
men
t Fun
dVi
etna
m—
Stat
e Ca
pita
l Inv
estm
ent C
orpo
ratio
nQ
atar
Inve
stm
ent A
utho
rity
Vene
zuel
a—M
acro
econ
omic
Sta
biliz
atio
n Fu
ndG
hana
Pet
role
um F
unds
Mor
occa
n Fu
nd fo
r Tou
rism
Dev
elop
men
tKa
zakh
stan
—Sa
mru
k-Ka
zyna
Nat
iona
l Dev
elop
men
t Fun
d of
Iran
Kaza
khst
an—
Nat
iona
l Inv
estm
ent C
orpo
ratio
nFo
ndo
Mex
ican
o de
l Pet
rolé
oPe
ru—
Fisc
al S
tabi
lizat
ion
Fund
Russ
ia—
Nat
iona
l Wel
fare
and
Res
erve
Fun
dBa
hrai
n M
umta
laka
t Hol
ding
Com
pany
Om
an—
Stat
e G
ener
al R
eser
ve F
und
UA
E—In
tern
atio
nal P
etro
leum
Inve
stm
ent C
ompa
nyIn
vest
men
t Cor
pora
tion
of D
ubai
Rwan
da—
Aga
ciro
Dev
elop
men
t Fun
dD
ubai
Hol
ding
Bots
wan
a—Pu
la F
und
Sove
reig
n Fu
nd o
f Bra
zil
Abu
Dha
bi In
vest
men
t Aut
horit
yM
alay
sia—
Khaz
anah
Nas
iona
l Ber
had
Sing
apor
e—G
IC P
rivat
e Lt
d.N
orth
Dak
ota
Lega
cy F
und
BPIF
ranc
e In
vest
isse
men
tM
exic
o—Bu
dget
ary
Inco
me
Stab
iliza
tion
Fund
Fund
o So
bera
no d
e A
ngol
aFo
ndo
Stra
tegi
co It
alia
noU
AE—
Mub
adal
a D
evel
opm
ent C
ompa
nyCh
ina
Inve
stm
ent C
orpo
ratio
nFr
ance
—Ca
isse
des
Dép
ôts
et C
onsi
gnat
ions
Hon
g Ko
ng—
Exch
ange
Fun
dKu
wai
t Inv
estm
ent A
utho
rity
(Tex
as) P
erm
anen
t Uni
vers
ity F
und
Texa
s Pe
rman
ent S
choo
l Fun
dN
iger
ia S
over
eign
Inve
stm
ent A
utho
rity
Sing
apor
e—Te
mas
ek H
oldi
ngs
Pale
stin
e In
vest
men
t Fun
dKo
rea
Inve
stm
ent C
orpo
ratio
nTr
inid
ad a
nd T
obag
o—H
erita
ge a
nd S
tabi
lizat
ion
Fund
Irela
nd S
trat
egic
Inve
stm
ent F
und
Ala
bam
a Tr
ust F
und
New
Mex
ico
Stat
e In
vest
men
t Cou
ncil
Aus
tral
ia—
Futu
re F
und
Chile
—Pe
nsio
n Re
serv
e Fu
ndPe
trol
eum
Fun
d of
Tim
or-L
este
Ala
ska
Perm
anen
t Fun
d Co
rpor
atio
nA
lber
ta H
erita
ge S
avin
gs T
rust
Fun
dCh
ile—
Econ
omic
and
Soc
ial S
tabi
lizat
ion
Fund
Stat
e O
il Fu
nd o
f the
Rep
ublic
of A
zerb
aija
nPe
rman
ent W
yom
ing
Min
eral
Tru
st F
und
New
Zea
land
Sup
eran
nuat
ion
Fund
Nor
way
Gov
ernm
ent P
ensi
on F
und–
Glo
bal
2007
2009
2012
2015 sc
ore
Fig
ure
2
Pro
gre
ss o
n t
he
SW
F s
co
reb
oa
rd,
20
07
–1
5
Sour
ce: A
utho
rs’ c
alcu
latio
ns.

13
Number PB16-18 October 2016
Table 4 2015 SWF scoreboard elements
Element
Nonpension
SWFs
Government
pension funds All funds
Structure
1 Objective stated 98 100 99
2 Legal framework 85 100 87
3 Changing the atructure 83 100 86
4 Investment strategy 75 100 79
5 Source of funding 88 100 89
6 Use of fund earnings 69 100 73
7 Integrated with policies 64 50 62
8 Separate from international reserves 64 50 62
Subtotal 78 88 80
Governance
9 Role of government 88 100 89
10 Role of governing body 88 100 90
11 Role of managers 65 100 70
12 Decisions made by managers 54 89 59
13 Internal ethical standards 53 78 57
14 Guidelines for corporate responsibility 36 89 43
15 Ethical investment guidelines 22 83 30
Subtotal 58 91 62
Transparency and accountability
16 Categories 78 100 80
17 Benchmarks 45 89 51
18 Credit ratings 48 89 54
19 Mandates 28 78 35
20 Size 85 100 87
21 Returns 63 100 67
22 Locations 41 75 46
23 Specific investments 48 83 53
24 Currency composition 43 78 47
25 Annual reports 82 100 84
26 Quarterly reports 46 56 47
27 Regular audits 89 100 90
28 Published audits 58 89 62
29 Independent audits 82 100 84
Subtotal 60 88 63
Behavior
30 Risk management 67 100 71
31 Policy on leverage 35 44 37
32 Policy on derivatives 58 100 63
33 Portfolio adjustment 11 44 15
Subtotal 43 72 46
Total All categories 62 87 65
Source: Authors’ calculations.

14
Number PB16-18 October 2016
section concern the basics of organization. The funds score about the same (on average) for governance and transpar-ency and accountability, and the least for behavior.
The governance elements focus on operations. The lowest scores in this section are on the elements about whether the fund has publicly stated policies with respect to (14) corporate responsibility (see below) and (15) guidelines for ethical investment. The latter concerns not the internal operations of the fund (covered by element 13) but whether it has public policies about where and in what types of activities it invests or does not invest.
The section on transparency and accountability includes 14 elements that relate to the scope and content of public reports. On average, the funds publish a substantial amount of information about (16) the categories of their invest-ments, but less about (22) their location, (24) currency composition, or (23) specific investments. However, almost half the funds, in terms of their average scores, do provide some information on their specific investments. The same is true for whether funds state that they use (17) benchmarks or (18) credit ratings to guide their investments. The funds record the lowest scores on average on (19) disclosing the names of the external asset managers who have mandates to invest all or part of the fund.
A major issue surrounding SWFs at the time the SWF scoreboard was first developed in 2007–08 was (20) the size of each fund in terms of assets under management. In Truman (2010, 135) one of us predicted that within five years all SWFs would publicly disclose the size of their total assets at least once a year. While this prediction did not come to pass, Truman (2010) identified the trend in the funds that were scored in the 2009 scoreboard. Nine provided no information on their size in 2009, six of them still do not, and three of the six are estimated to be large funds (table 1): the Qatar Investment Authority, Singapore’s GIC Private Ltd. (formerly the Government Investment Corporation), and the Abu Dhabi Investment Authority.24 Five provided only some information on their size in 2009 and now only two of these five do, though one of the five (São Tomé &
24. The other three are Brunei’s Investment Agency, Oman’s State General Reserve Fund, and the UAE’s Istithmar World.
Principe) no longer is scored. In other words, progress for the funds initially scored is slower than was predicted. On the other hand, 18 of the 20 funds scored since 2009 report their size; the exceptions are Morocco’s fund, which provides only partial information, and the UAE’s new Abu Dhabi Investment Council.25
A lower level of transparency on average is recorded on (21) disclosure of funds’ returns, and the improvement since the 2009 scoreboard is similarly meager. In contrast, the average score with respect to (27) regular auditing of funds has risen to 89 percent from 65 percent on the 2007 scoreboard. The average score for (29) independent audits, conducted by an outside party (which includes, for these purposes, the government audit authority), has recorded a similar rise. These results are encouraging.
The last element in the behavior section examines whether a fund has an announced policy for (33) how it ad-justs its portfolio. The motivation is to discern whether the fund takes explicit account of its potential market impact. Few funds had such a policy in 2007 and the average score on this element in 2015 is roughly the same. However, on the more general question about (30) a risk management policy, the record is more comforting, with the average score for nonpension funds at 67 percent.
The performance of the GPFs on each element rela-tive to the other elements is about the same as that of the nonpension SWFs, except higher in all cases.26 In particular, however, the average performance on many of the transpar-ency and accountability elements is substantially higher.
The objective of this exercise is not to see if all SWFs score 100 percent. As table 2 shows, no SWF scores 100 percent on the 2015 scoreboard. Consider the four top-scoring funds: We deduct half a point for Norway for the lack of clarity in its policy on the use of leverage. New Zealand, as a pension reserve fund, loses 3 percentage points off the top (see footnote 14), but it also has no public policy on how it adjusts its portfolio. The US Permanent Wyoming Mineral Trust Fund loses 3 percentage points because it is a subna-tional fund (see footnote 14), yet it also does not p rovide information on the location and currency composition of its investments. Finally, oil producer Azerbaijan’s fund has no public policy on leverage or on adjusting its portfolio, and it receives only half credit for its statement of policy on corporate governance. In other words, even the funds with the highest scores demonstrate less than full performance on some elements of the SWF scoreboard.
25. In the UAE, each fund goes its diff erent way as already noted. Four of the seven provide complete information on their size.
26. The lower scores on (7) integration with policies and (8) separate from international reserves reflect the convention described in footnote 14: The maximum score the GPFs can have on these elements is 50 percent.
A major issue surrounding SWFs at the time the SWF scoreboard was first developed in 2007–08
was the size of each fund in terms of assets under management.
15
Number PB16-18 October 2016
THE IFSWF AND THE SANTIAGO PRINCIPLES
The IFSWF was formed by the countries and funds that participated in the International Working Group (IWG) of SWFs, which drafted the Santiago Principles, or the Generally Accepted Principles and Practices (GAPP) of SWFs, released in October 2008 (Truman 2010, 121). The IFSWF initially had 23 member countries with 25 funds and three observer countries, Oman (which recently joined), Saudi Arabia, and Vietnam.27 Five years later, the IFSWF had added only one new member country and fund, Malaysia with its Khazanah Nasional Berhad. In 2014, it added four new member coun-tries, Angola, Italy, Kazakhstan, and Nigeria, for a total of 28 countries and 30 funds.
As of this writing, four additional countries and their funds have joined the IFSWF (Morocco, Oman, Palestine, and Rwanda28), but two countries have withdrawn member-ship (Bahrain and Equatorial Guinea),29 one fund has with-drawn (Singapore’s Temasek Holdings),30 and one country (Kazakhstan) now has two new member funds.31 Norway’s Government Pension Fund–Global withdrew from member-ship because the Norwegian finance ministry no longer spon-sors it. However, in the 2015 scoreboard, it is treated as a member of the IFSWF. Thus, in this Policy Brief, the Forum is treated as having 30 member countries with 32 funds, of which 11 are new since the establishment of the Forum.
Four of the countries with funds that are now members of the Forum have changed the names and/or nature of the funds. In the 2015 scoreboard two of these funds are treated as continuations and two are not. 32 These adjustments reflect
27. Chile has two member funds, Economic and Social Stabilization Fund and Pension Reserve Fund, which have been scored as two funds starting with the 2009 scoreboard, even though the IFSWF treats them as one member fund. Singapore also had two member funds, the Government Investment Corporation (now GIC Private Ltd.) and Temasek.
28. The IFSWF classifies Rwanda as an associate member be-cause it has not fully started investment operations.
29. Equatorial Guinea’s Fund for Future Generations scored at the bottom of the 2015 SWF scoreboard, as it did when it was first scored in 2012. Bahrain Mumtalakat Holding Company at 52 percent scored closer to the average for all SWFs (62) but in 2012 it scored much lower at 38. One can surmise that these two funds were encouraged to withdraw from IFSWF membership in part because of the low level of their involvement with the IFSWF and its principles.
30. Reportedly, the managers of the entirely government-owned Temasek did not think the fund should be thought of as an SWF.
31. The IFSWF counts funds as members. Thus, Kazakhstan has two members. As noted above, the Forum counts Chile’s two funds as one member fund because both funds report to the ministry of finance. In total, the Forum currently lists 30 member funds from 29 countries.
32. Iran’s first fund in the IFSWF was its Oil Stabilization Fund, and now it is the National Development Fund. As noted above,
political and economic changes in those countries. Those changes illustrate the fact that the structure and purposes of a particular SWF are not, nor should they be, set in stone.
Several of the IFSWF member funds focus exclusively or predominantly on domestic investments, for example, the funds of Italy, Morocco, Palestine, Rwanda, and Russia. Consequently, in order to score all the IFSWF member funds, we dropped the previous, exclusive focus in the SWF scoreboard on SWFs that invest outside their countries.
Under the leadership of Adrian Orr as chair, the IFSWF has not only expanded its membership but also tightened its de facto membership criteria. Orr (2015a, 2015b) has emphasized the standard-setting role of the Forum by encouraging ongoing commitment to the Santiago Principles; knowledge-sharing with respect to increasing expected risk-adjusted investment returns of members; and representation in terms of collaboration with global finan-cial policy institutions. The IFSWF now has subcommittees on governance, investment management, and the global economy. It has also promoted additional exercises in self-assessments by member funds with brief summaries of each fund’s objectives on the IFSWF website and links to the websites of most of the member funds and to their reports on compliance with the Santiago Principles.
Six funds have not completed full self-assessments: Kazakhstan’s Samruk-Kazyna, the Libyan Investment Authority, and Malaysia’s Khazanah Nasional Berhad have nothing posted and the Abu Dhabi Investment Authority, Qatar Investment Authority, and Trinidad and Tobago’s Heritage and Stabilization Fund only have brief summa-ries.33 The evidence presented in the 2015 SWF scoreboard suggests that completion of an IFSWF self-assessment is no guarantee of a high score. Seven of the 26 funds that have completed the self-assessments score below the average for all 60 funds scored. On the 16-element simulation of Santiago Principles the comparable number is 5; see the next section.
Ireland’s Pension Reserve Fund has been converted into the Ireland Strategic Investment Fund focused largely on investment in the domestic economy. These funds are treated as continu-ations. The National Fund of the Republic of Kazakhstan, which we did not score on this scoreboard because there was so little information on it, is reportedly being drawn down, but that country now has two funds that are members of the IFSWF, the National Investment Corporation and Samruk-Kazyna. Russia’s combined National Welfare and Reserve Fund is also being drawn down, but enough information is available for us to score it. We also score the new Russian Direct Investment Fund, which is focused largely on domestic investments and is an IFSWF member.
33. The self-assessment of Mexico’s Budgetary Income Stabilization Fund was posted in mid-September 2016. Reportedly, one or two more funds will post self-assessments in early November 2016.

16
Number PB16-18 October 2016
Comparing the SWF 2015 Scoreboard with the Santiago Principles
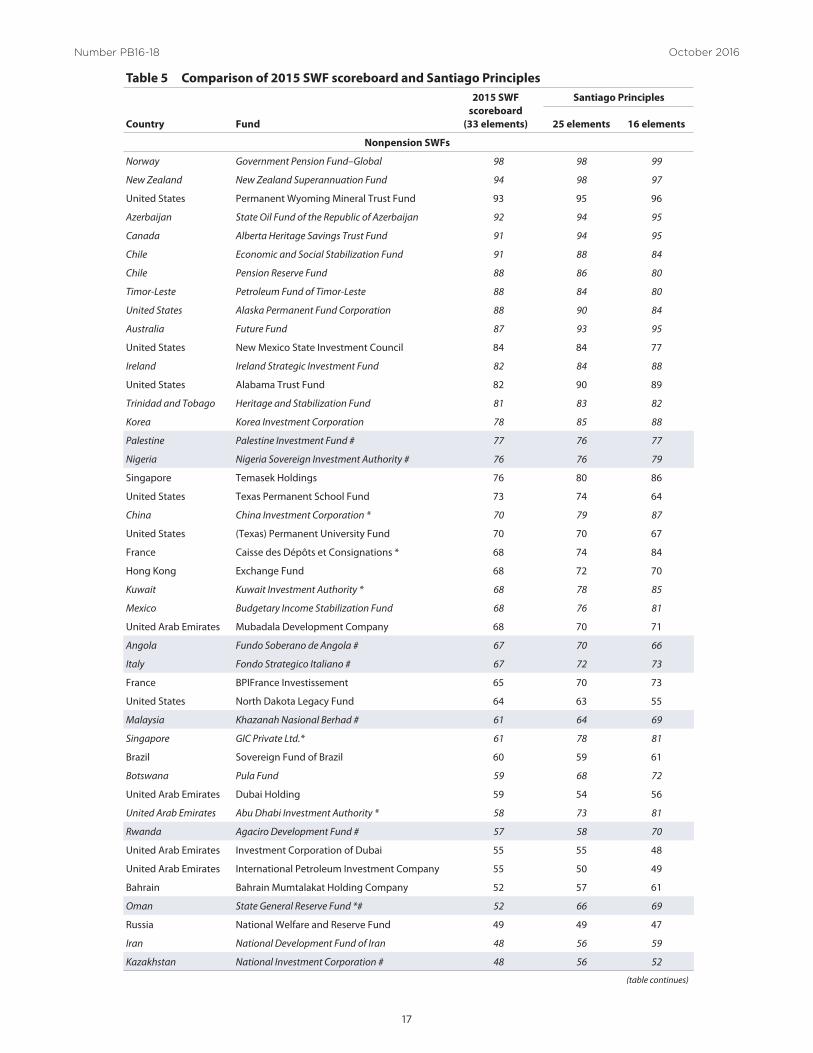
Table 5 presents a comparison of the performance of the 60 SWFs and 9 GPFs on the 2015 SWF scoreboard and on two simulations of the Santiago Principles, which consist of 30 principles and subprinciples. The 30 parts overlap with 25 of the 33 elements in the SWF scoreboard; see Truman (2010, appendix 6A) for the correspondence. This simula-tion is in the third column of table 5. Alternatively, 16 of the major Santiago Principles overlap with one or more of the elements in the SWF scoreboard. This simulation is in the last column of table 5.34
On average, the 60 SWFs score only marginally lower on the SWF scoreboard than on the two simulations of adherence to the Santiago Principles.35 For all funds, the three measures are highly and significantly correlated. The current members of the IFSWF score about as well, on average, across the three measures. This may be a bit of a surprise given that one might expect them to have an advantage with their own criteria derived from the Santiago Principles, particularly in the16-element simulation, which implicitly requires less detail in some areas. On average, the current non-IFSWF-member funds also score slightly higher on the Santiago Principles simulations.
The results for 9 funds are higher by 15 percentage points or more on the narrower, 16-element simulation of the Santiago Principles than on the 2015 scoreboard. These funds are indicated by an asterisk (*). Seven of those funds are members of the IFSWF. One might suspect a certain amount of this behavior is guided by the specifics of the Santiago Principles. Two non-IFSWF-member funds also record double-digit positive differences. These differences are not large or persistent enough to produce a difference in increase in the average score for the two groups of funds in
34. For the fi rst, 25-element simulation, the 25 elements of the SWF scoreboard where there is an overlap are averaged to pro-duce a score. For the second, 16-element simulation, the scores on more than one of the elements of the SWF scoreboard are averaged where they overlap with one of the Santiago Principles.
35. In the simulations each element is worth more when scaled to 100 than on the scoreboard.
part because half a dozen funds have scores on 16-element simulation that are lower by about 10 percentage points than on the SWF scoreboard. On the SWF scoreboard, nine of the top 10 scores belong to members of the IFSWF; the exception is the Permanent Wyoming Mineral Trust Fund. Six of the next 10 funds are also members of the Forum.
In contrast, however, three of the lowest-scoring funds in the bottom 10 are also members of the IFSWF: the Libyan Investment Authority, the Russian Direct Investment Fund, and the Qatar Investment Authority. The assets of the Libyan Investment Authority have been frozen under UN sanctions even as the fund is suing Goldman Sachs and Société Générale in connection with their roles in earlier investment activities. (On October 14, 2016, the judge decided in favor of Goldman Sachs.36) The rival chairs of the fund and the unity government are trying to reach a solution to put the fund with its $67 billion in assets back in business.37 The Russian Direct Investment Fund, investing primarily in Russia, receives a score 13 percentage points below the score of Russia’s National Welfare and Reserve Fund, which was once a member of the IFSWF.
Another former member of the IFSWF, Equatorial Guinea’s Fund for Future Generations, remains at the bottom of the scoreboard on all measures. On the other hand, the fund of Bahrain, also a former member country, improved its score on the 2015 scoreboard by 13 percentage points from the 2012 SWF scoreboard. Its score is also 9 percentage points higher on the 16-element simula-tion of the Santiago Principles than its score on the 2015 scoreboard.
Do funds that are IFSWF members score higher than their nonmember compatriots? The answer is no. As noted above, the new Russian Direct Investment Fund scores lower than the former Russian member fund. This pattern is seen in each of the other countries with multiple funds, where one fund is an IFSWF member. For the United States, the Wyoming fund scores slightly higher than the Alaskan fund, which is an IFSWF member; this margin is a bit larger in the 16-element comparison. (The Alaskan fund ranks second out of all seven US funds.) For Singapore, Temasek Holdings (former IFSWF member) outscores current member, GIC Private Ltd. though the gap narrows on the 16-element comparison. Lastly, the Abu Dhabi Investment Authority lags somewhat behind Mubadala
36. Simon Clark, “Goldman Sachs Wins Legal Battle With Libyan Sovereign-Wealth Fund,” Wall Street Journal, October 14, 2016, http://on.wsj.com/2ebfGRP.
37. Simon Clark, “Libya’s Rival Sovereign-Wealth Fund Chiefs Seek Truce,” Wall Street Journal, September 6, 2016.
Do funds that are IFSWF members score higher than their
nonmember compatriots? The answer is no.
17
Number PB16-18 October 2016
Table 5 Comparison of 2015 SWF scoreboard and Santiago Principles
Country Fund
2015 SWF
scoreboard
(33 elements)
Santiago Principles
25 elements 16 elements
Nonpension SWFs
Norway Government Pension Fund–Global 98 98 99
New Zealand New Zealand Superannuation Fund 94 98 97
United States Permanent Wyoming Mineral Trust Fund 93 95 96
Azerbaijan State Oil Fund of the Republic of Azerbaijan 92 94 95
Canada Alberta Heritage Savings Trust Fund 91 94 95
Chile Economic and Social Stabilization Fund 91 88 84
Chile Pension Reserve Fund 88 86 80
Timor-Leste Petroleum Fund of Timor-Leste 88 84 80
United States Alaska Permanent Fund Corporation 88 90 84
Australia Future Fund 87 93 95
United States New Mexico State Investment Council 84 84 77
Ireland Ireland Strategic Investment Fund 82 84 88
United States Alabama Trust Fund 82 90 89
Trinidad and Tobago Heritage and Stabilization Fund 81 83 82
Korea Korea Investment Corporation 78 85 88
Palestine Palestine Investment Fund # 77 76 77
Nigeria Nigeria Sovereign Investment Authority # 76 76 79
Singapore Temasek Holdings 76 80 86
United States Texas Permanent School Fund 73 74 64
China China Investment Corporation * 70 79 87
United States (Texas) Permanent University Fund 70 70 67
France Caisse des Dépôts et Consignations * 68 74 84
Hong Kong Exchange Fund 68 72 70
Kuwait Kuwait Investment Authority * 68 78 85
Mexico Budgetary Income Stabilization Fund 68 76 81
United Arab Emirates Mubadala Development Company 68 70 71
Angola Fundo Soberano de Angola # 67 70 66
Italy Fondo Strategico Italiano # 67 72 73
France BPIFrance Investissement 65 70 73
United States North Dakota Legacy Fund 64 63 55
Malaysia Khazanah Nasional Berhad # 61 64 69
Singapore GIC Private Ltd.* 61 78 81
Brazil Sovereign Fund of Brazil 60 59 61
Botswana Pula Fund 59 68 72
United Arab Emirates Dubai Holding 59 54 56
United Arab Emirates Abu Dhabi Investment Authority * 58 73 81
Rwanda Agaciro Development Fund # 57 58 70
United Arab Emirates Investment Corporation of Dubai 55 55 48
United Arab Emirates International Petroleum Investment Company 55 50 49
Bahrain Bahrain Mumtalakat Holding Company 52 57 61
Oman State General Reserve Fund *# 52 66 69
Russia National Welfare and Reserve Fund 49 49 47
Iran National Development Fund of Iran 48 56 59
Kazakhstan National Investment Corporation # 48 56 52
(table continues)

18
Number PB16-18 October 2016
Development Company, though this ranking is reversed on the 16-element comparison.
In table 5, the 16-percentage-point gap between the average score for the 11 new members of the IFSWF since 2008 (58) and the 21 original members (74) on the SWF scoreboard is essentially the same as for the two simulations of
the Santiago Principles.38 Among the new members, the high
38. New members are indicated by # and shading in table 5, and include the two Kazakhstan funds as well as the new Russian Direct Investment Fund. Original members include Norway’s Government Pension Fund–Global as well as both Chilean funds separately but exclude Singapore’s Temasek.
Table 5 Comparison of 2015 SWF scoreboard and Santiago Principles (continued)
Country Fund
2015 SWF
scoreboard
(33 elements)
Santiago Principles
25 elements 16 elements
Nonpension SWFs
Mexico Fondo Mexicano del Petroléo para la Estabilización y el Desarrollo
48 48 50
Peru Fiscal Stabilization Fund 48 47 44
Kazakhstan Samruk-Kazyna # 47 50 55
Morocco Moroccan Fund for Tourism Development * # 47 54 64
Ghana Ghana Petroleum Funds 45 52 51
Venezuela Macroeconomic Stabilization Fund 42 48 49
Qatar Qatar Investment Authority * 40 47 55
Vietnam State Capital Investment Corporation 39 43 47
Russia Russian Direct Investment Fund # 36 33 31
Kiribati Revenue Equalization Reserve Fund * 35 44 54
United Arab Emirates Abu Dhabi Investment Council 33 36 41
Brunei Brunei Investment Agency 30 35 35
Algeria Revenue Regulation Fund 26 30 34
Libya Libyan Investment Authority 23 26 29
United Arab Emirates Istithmar World 23 22 27
Equatorial Guinea Fund for Future Generations 11 10 9
Subtotal (60 SWFs) 62 65 67
of which IFSWF members (32) 68 73 75
Original members (21) 74 75 77
New members (11) 58 61 64
of which non-IFSWF members (28) 54 56 62
Government pension funds
United States California Public Employees’ Retirement System 95 96 96
Canada Canada Pension Plan Investment Board 94 98 97
France Fonds de réserve pour les retraites 94 98 97
Netherlands Stichting Pensioenfonds ABP 92 94 95
Canada Caisse de dépôt et placement du Quebec 91 98 97
Canada Ontario Teachers’ Pension Plan 86 90 94
Thailand Government Pension Fund 86 88 88
Japan Government Pension Investment Fund 83 89 91
China National Council for Social Security Fund 59 68 66
Subtotal (9 GPFs) 87 91 91
All funds (69) 64 69 70
IFSWF = International Forum of Sovereign Wealth Funds; members indicated in italics including two separate funds for Chile, which the IFSWF counts as one member fund, and Norway’s fund, which was formerly a member.* = indicates a fund that scores 15 points or more higher on the 16-element simulation than on the 2015 SWF scoreboard# = indicates a fund that joined the IFSWF after 2008
Source: Authors’ calculations.

19
Number PB16-18 October 2016
scores of the new member funds of Palestine and Nigeria are notable. On the other hand, the two funds of Kazakhstan, the Moroccan fund, and the new Russian fund have a long way to go to catch up with other IFSWF members.
Progress of IFSWF Member and Nonmember Funds
As a complement to table 3, table 6a provides the scores for the current IFSWF member funds on the 2015 scoreboard. It also provides their scores in each of the three previous score-boards if they were scored.39 At the bottom are the average scores for a consistent group of funds each time they were scored. As with the entire group of SWFs, the big changes in average and individual scores for current IFSWF member funds were from the first, pre–Santiago Principles scoreboard for 2007 to the second in 2009 and from the third score-board for 2012 to the 2015 scoreboard. This latter change corresponds to a period of increased activity by the IFSWF. Notable among the scores of new IFSWF members is the current score for Nigeria’s Sovereign Investment Authority, which has had, along with its country, a checkered economic and political history. Between the third and fourth score-boards, its score increased by 58 percentage points.
The next to last column presents the changes in scores for 22 member funds from when they were first scored in 2007 until this fourth SWF scoreboard. The average change was 18 percentage points. Five funds had changes of more than 25 percentage points. They include the funds of Qatar and Oman and the Abu Dhabi Investment Authority, which are still below the average for all SWFs in this scoreboard. The scores of the funds of China, Mexico, and Nigeria also increased more than 25 percentage points.
An alternative measure of progress is shown in the last column, which presents the change between 2007 and 2015 relative to the difference between the fund’s 2007 score and 100. The measure shows how much of this gap has been closed over the eight years. The average amount is 41 percent. Six funds narrow the gap by more than 50 percent: the funds of China and Nigeria, again, along with the funds of Trinidad and Tobago, Canada, Chile, and Azerbaijan.
In presenting the second edition of the SWF score-board, Truman (2010) noted the cluster of funds with scores above 80 percent. Nine current IFSWF members were in that category at the time, including two whose scores had moved into the category from the first score-board. Now there are two more, for a total of 11 of the
39. The Nigerian and Malaysian funds were included in the 2007 scoreboard, but they did not join the IFSWF until later. Chile’s Pension Reserve Fund was fi rst included in the 2009 scoreboard.
32 IFSWF member funds. Progress by any of the measures has not been uniform across these 32 funds. For example, Botswana’s fund, which was only slightly below the average of all IFSWF members in 2007 and slightly above the average for all funds, has not recorded much progress on the SWF scoreboard.
Table 6b provides a similar historical comparison of the funds that are not members of the IFSWF. As already noted, they have recorded a lower average on each scoreboard. However, they show the same pattern as IFSWF members with their scores increasing principally between the first and second scoreboards and between the third and fourth scoreboards. The latter improvement cannot be directly attributed to the activities of the IFSWF. However, the activities of the IFSWF may have triggered a general uptick
in embracing international standards. Alternatively, the member and nonmember funds may have been responding to common global and domestic forces for more transpar-ency and accountability.
Each of the 11 nonmember funds increased its score between the first and fourth scoreboard. The increases of Venezuela’s Macroeconomic Stabilization Fund, UAE’s Mubadala Development Company, and Singapore’s Tema-sek Holdings are most noteworthy. Temasek’s increase oc-curred primarily while it was a member of the IFSWF. In addition, four other funds recorded increases of 15 percent-age points or more between the third and fourth editions of the scoreboard: the UAE’s Investment Corporation of Dubai and Dubai Holding, Sovereign Fund of Brazil, and Alabama Trust Fund. On the other hand, the nonmembers of the IFSWF include laggards with low scores on the first scoreboard, which have remained low on the fourth; see the first four funds in table 6b that were scored for 2007.
[T]he activities of the IFSWF may have triggered a general uptick in
embracing international standards. Alternatively, the member and
nonmember funds may have been responding to common global and domestic forces for more
transparency and accountability.

20
Number PB16-18 October 2016
Table 6a Progress of IFSWF member funds
Scores Change from 2007 to 2015
Country Fund 2007 2009 2012 2015
Percentage
points
Relative to
difference
between
2007 score
and 100
Libya Libyan Investment Authority — — 5 23 — —
Russia Russian Direct Investment Fund — — — 36 — —
Qatar Qatar Investment Authority 14 15 15 40 26 30
Morocco Moroccan Fund for Tourism Development — — — 47 — —
Kazakhstan Samruk-Kazyna — — — 47 — —
Iran National Development Fund of Iran 26 26 26 48 22 30
Kazakhstan National Investment Corporation — — — 48 — —
Oman State General Reserve Fund 18 18 21 52 34 41
Rwandaa Agaciro Development Fund — — — 57 — —
United Arab Emirates Abu Dhabi Investment Authority 20 58 58 58 38 48
Botswana Pula Fund 53 55 55 59 6 13
Malaysia Khazanah Nasional Berhad 45 55 55 61 16 29
Singapore GIC Private Ltd. 45 60 61 61 16 29
Angola Fundo Soberano de Angola — — 15 67 — —
Italy Fondo Strategico Italiano — — — 67 — —
Mexico Budgetary Income Stabilization Fund 42 42 42 68 26 45
Kuwait Kuwait Investment Authority 58 64 65 68 10 24
China China Investment Corporation 35 58 61 70 35 100
Nigeria Nigeria Sovereign Investment Authority 12 12 18 76 64 73
Palestine Palestine Investment Fund — — — 77 — —
Korea Korea Investment Corporation 60 69 69 78 18 45
Trinidad and Tobago Heritage and Stabilization Fund 61 75 75 81 20 51
Ireland Ireland Strategic Investment Fund 77 79 82 82 5 22
Australia Future Fund 77 86 86 87 10 43
Chileb Pension Reserve Fund — 80 82 88 — —
Timor-Leste Petroleum Fund of Timor-Leste 80 85 85 88 8 40
United States Alaska Permanent Fund Corporation 88 88 88 88 0 0
Canada Alberta Heritage Savings Trust Fund 82 86 86 91 9 50
Chileb Economic and Social Stabilization Fund 74 86 86 91 17 65
Azerbaijan State Oil Fund of the Republic of Azerbaijan 80 83 85 92 12 60
New Zealand New Zealand Superannuation Fund 94 94 94 94 0 0
Norwayc Government Pension Fund–Global 97 97 97 98 1 33
Average 32 funds 68
Average 25 funds 60 72
Average 23 funds 64 65 75
Average 22 funds 56 63 64 74 18 41
— = not included on earlier scoreboards; IFSWF = International Forum of Sovereign Wealth Funds
a. The IFSWF classifies Rwanda as an associate member because it has not fully started its investment operations.b. Chile has two member funds, Economic and Social Stabilization Fund and Pension Reserve Fund, which have been scored as two funds from the start even though the IFSWF treats them as one member fund. c. The Norwegian Government Pension Fund-Global withdrew from membership because the Norwegian finance ministry no longer sponsors it. However, in this 2015 scoreboard, it is treated as a member of the IFSWF.
Source: Authors’ calculations.

21
Number PB16-18 October 2016
Comparison of IFSWF Members and Nonmembers on Elements of Scoreboard
With respect to the individual elements of the SWF score-board, members of the IFSWF, on average, score essentially as high as or higher than nonmembers (table 7). For the scoreboard as a whole, IFSWF members outperform non-members by 14 percentage points. An alternative measure of
the difference in scores between the two groups on average is the difference relative to the gap between non-IFSWF mem-bers’ scores and 100, which is 31 percent for the two aver-age overall totals. By this measure, the higher average scores of IFSWF members are most pronounced in the structure and governance categories. This difference suggests that, as a group, the Forum funds are established with greater atten-
Table 6b Progress of non-IFSWF members
Scores Change from 2007 to 2015
Country Fund 2007 2009 2012 2015
Percentage
points
Relative to
difference
between
2007 score
and 100
Equatorial Guinea Fund For Future Generations — — 2 11 — —
United Arab Emirates Istithmar World 13 17 17 23 10 11
Algeria Revenue Regulation Fund 21 21 21 26 5 6
Brunei Brunei Investment Agency 21 21 21 30 9 11
United Arab Emirates Abu Dhabi Investment Council — — — 30 — —
Kiribati Revenue Equalization Reserve Fund 33 33 33 35 2 3
Vietnam State Capital Investment Corporation — 38 38 39 — —
Venezuela Macroeconomic Stabilization Fund 16 21 21 42 26 31
Ghana Ghana Petroleum Funds — — 45 45 — —
Mexico Fondo Mexicano del Petroléo para la Estabilización y el Desarrollo
— — — 48 — —
Peru Fiscal Stabilization Fund — — — 48 — —
Russia National Welfare and Reserve Fund 40 46 47 49 9 15
Bahrain Bahrain Mumtalakat Holding Company — 38 38 52 — —
United Arab Emirates International Petroleum Investment Company — 43 43 53 — —
United Arab Emirates Investment Corporation of Dubai — 20 20 54 — —
United Arab Emirates Dubai Holding — 38 38 58 — —
Brazil Sovereign Fund of Brazil — — 30 60 — —
United States North Dakota Legacy Fund — — — 64 — —
France BPIFrance Investissement — — — 65 — —
United Arab Emirates Mubadala Development Company 26 59 59 68 42 57
France Caisse des Dépôts et Consignations — — — 68 — —
Hong Kong Exchange Fund 61 67 68 68 7 18
United States (Texas) Permanent University Fund — — — 70 — —
United States Texas Permanent School Fund — — — 73 — —
Singapore Temasek Holdings 56 73 73 76 20 45
United States Alabama Trust Fund — 67 67 82 — —
United States New Mexico State Investment Council 77 79 79 84 7 30
United States Permanent Wyoming Mineral Trust Fund 88 89 89 93 5 42
Average 28 funds 54
Average 20 funds 42 52
Average 17 funds 45 45 55
Average 11 funds 41 48 48 54 13 22
— = not included on earlier scoreboards; IFSWF = International Forum of Sovereign Wealth Funds
Source: Authors’ calculations.

22
Number PB16-18 October 2016
Table 7 Comparison of IFSWF members and nonmembes on scoreboard elements
Element All SWFs
IFSWF
members
Other
SWFs
Difference
Members
minus
nonmembers
Relative to
gap with 100
Structure
1 Objective stated 98 100 96 4 100
2 Legal framework 85 95 73 22 83
3 Changing the structure 83 89 77 12 53
4 Investment strategy 75 76 75 1 3
5 Source of funding 88 87 89 –3 –24
6 Use of fund earnings 69 77 61 16 40
7 Integrated with policies 64 70 57 13 31
8 Separate from international reserves 64 72 55 17 37
Subtotal 78 83 73 10 38
Governance
9 Role of government 88 95 79 17 78
10 Role of governing body 88 100 75 25 100
11 Role of managers 65 77 52 25 51
12 Decisions made by managers 54 73 32 41 61
13 Internal ethical standards 53 67 38 30 48
14 Guidelines for corporate responsibility 36 41 31 9 14
15 Ethical investment guidelines 22 27 15 12 14
Subtotal 58 69 46 23 42
Transparency and accountability
16 Categories 78 84 62 22 57
17 Benchmarks 45 60 25 35 47
18 Credit ratings 48 53 38 16 25
19 Mandates 28 34 19 16 19
20 Size 85 84 75 9 38
21 Returns 63 66 52 14 29
22 Locations 41 53 24 29 38
23 Specific investments 48 45 46 –2 –3
24 Currency composition 43 48 31 17 25
25 Annual reports 82 86 68 18 56
26 Quarterly reports 46 57 29 28 40
27 Regular audits 89 97 70 27 90
28 Published audits 58 55 53 2 3
29 Independent audits 82 88 66 22 64
Subtotal 60 65 54 11 25
Behavior
30 Risk management 67 83 48 35 67
31 Policy on leverage 35 40 30 9 14
32 Policy on derivatives 58 63 51 12 25
33 Portfolio adjustment 11 14 7 7 7
Subtotal 43 50 34 16 24
Total 62 68 54 14 31
IFSWF = International Forum of Sovereign Wealth Funds
Source: Authors’ calculations.

23
Number PB16-18 October 2016
tion to these institutional aspects. With regard to account-ability and transparency, the most significant difference in average scores is with respect to (25) annual reports and (27) and (29) regular and independent audits. The IFSWF mem-bers also perform better in terms of stated risk management policies (30).
Affiliation with the IFSWF and Corporate Responsibility
As in the past, slightly more than half of the funds scored in this fourth scoreboard are members of the IFSWF. As a consequence, three supplemental elements were added to the 2015 scoreboard to examine whether and to what extent these funds emphasize their affiliation with the Forum; see the left half of table 8. Of the 32 members, 20 members, or about two-thirds, mention their Forum membership on their websites.40 The Alberta Heritage Savings Trust Fund received partial credit in this category because it mentions only its payment to the IFSWF for membership.
About half the members mention on their own websites the extent of their adherence to the Santiago Principles. The China Investment Corporation also does so even though it does not explicitly note its membership in the Forum. Interestingly, even though Bahrain’s fund is not a member of the Forum, it states that it complies with the Santiago Principles but does not appear to comply thoroughly (see table 5). And Singapore’s Temasek Holdings, a former member, mentions the Principles. In addition, the $1.4 billion Fondo de Ahorro de Panamá, which is not now a member of the IFSWF and was not scored because of its small size, states on its website that it adopts and seeks to comply with the spirit and purpose of the Santiago Principles.41
Lastly, six IFSWF members not only mention their adherence to the Principles but also post their self-assess-ment reports. The correlation between the average scaled score of members of the Forum on these three supplemental elements and their scores on the SWF scoreboard is only 0.17. The conclusion is that most of the members of the Forum are either reluctant to trumpet their membership or think it is not important to do so.
In the 2015 edition of the SWF scoreboard, the element on funds’ policies with respect to corporate responsibility
40. Norway again is in the total, even though, as a nonmember, it would not be expected to comment on the Forum.
41. Fondo de Ahorro de Panamá, https://static1.squarespace.com/static/53924649e4b010f4651fd393/t/53da9174e4b04075c12db889/1406833012766/%5BPUB%5D+Pol%C3%ADticas+de+Inversi%C3%B3n+FAP+%28Acuerdo+%237%29_22+abril+2014_FirmasJD.pdf (accessed on October 14, 2016).
(scoreboard element 14) also was further investigated. This topic has been a focus of discussion within the Forum. The IFSWF cosponsored a workshop that included a session on responsible investment in March 2016. At the annual IFSWF meeting in November 2016, a focus will be on climate change. Moreover, Santiago Principle 21 states:
SWFs view shareholder ownership rights as a fundamental element of their equity investments’ value. If an SWF chooses to exercise its ownership rights, it should do so in a manner that is consis-tent with its investment policy and protects the financial value of its investments. The SWF should publicly disclose its general approach to voting securi-ties of listed entities, including the key factors guiding its exercise of ownership rights. (Emphasis added)42
The right half of table 8 lists, first, the results for IFSWF members for SWF scoreboard element 14.43 It then reports on three supplemental elements. First, on whether the fund’s guidelines mention environmental considerations, only five IFSWF members do so with any clarity and one, Qatar’s fund, received partial credit. The two French funds are the only nonmembers to mention the environment.
Second, in light of the italicized portion of Santiago Principle 21 above, another element asked whether the fund has a stated policy on voting its equity shares. Only 14 IFSWF members have a public policy, with the Italian fund receiving partial credit; in other words, less than half of IFSWF members. Seven nonmembers have a stated policy and two have a less-than-clear policy, for which they receive partial credit. The third supplemental element assesses whether the funds always exercise their voting rights. Only four members of the IFSWF clearly do so. In contrast, five nonmembers have a clear statement that they do, and the statements of two other funds give them half-credit.
The last column in table 8 scales the average score on these three supplemental elements to 100. In general, neither IFSWF members nor nonmembers appear to have active policies in the area of corporate responsibility. As one might suspect from visual inspection, the correlation of this average with IFSWF members’ SWF scoreboard results is higher, at 0.42, than is the case for their stated relationship with the Forum in the left part of table 8.
42. See the Santiago Principles at www.iwg-swf.org/pubs/eng/santiagoprinciples.pdf.
43. Element 14 of the scoreboard is “Does the SWF have in place, and make publicly available, guidelines for corporate responsibil-ity that it follows?”

24
Number PB16-18 October 2016
Ta
ble
8
IF
SW
F m
em
be
rs’ a
ffili
ati
on
wit
h t
he
Fo
rum
an
d c
orp
ora
te r
esp
on
sib
ilit
y
IFS
WF
aff
ilia
tio
n2
01
5 s
co
re o
n
ele
me
nt
14
:
Gu
ide
lin
es
for
co
rpo
rate
resp
on
sib
ilit
y
En
vir
on
me
nt
an
d v
oti
ng
rig
hts
Co
un
try
Fu
nd
20
15
sco
re
IFS
WF
me
nti
on
Pri
nc
iple
s
me
nti
on
Se
lf-
ass
ess
me
nt
me
nti
on
Av
era
ge
sca
led
sco
re
En
vir
on
me
nt
me
nti
on
Vo
tin
g
me
nti
on
Vo
tin
g
in a
ll
ca
ses
Av
era
ge
sca
led
sco
re
Liby
aLi
byan
Inve
stm
ent A
utho
rity
230
00
00
00
00
Russ
iaRu
ssia
n D
irect
Inve
stm
ent F
und
361
10
670
01
033
Qat
arQ
atar
Inve
stm
ent A
utho
rity
401
10
670
0.5
10
50
Mor
occo
Mor
occa
n Fu
nd fo
r Tou
rism
Dev
elop
men
t47
11
067
11
00
33
Kaza
khst
anSa
mru
k-Ka
zyna
470
00
01
01
033
Iran
Nat
iona
l Dev
elop
men
t Fun
d of
Iran
481
11
100
00
00
0
Kaza
khst
anN
atio
nal I
nves
tmen
t Cor
pora
tion
480
00
00
00
00
Om
anSt
ate
Gen
eral
Res
erve
Fun
d52
10
033
00
00
0
Rwan
daA
gaci
ro D
evel
opm
ent F
und
570
00
00
00
00
Bots
wan
aPu
la F
und
591
10
670
00
00
Uni
ted
Ara
b Em
irate
sA
bu D
habi
Inve
stm
ent A
utho
rity
581
11
100
0.5
00
00
Mal
aysi
aKh
azan
ah N
asio
nal B
erha
d61
00
00
00
00
0
Sing
apor
eG
IC P
rivat
e Lt
d.61
00
00
00
00
0
Ang
ola
Fund
o So
bera
no d
e A
ngol
a67
11
067
00
00
0
Italy
Fond
o St
rate
gico
Ital
iano
671
10
670.
50
0.5
017
Mex
ico
Budg
etar
y In
com
e St
abili
zatio
n Fu
nd68
00
00
0.5
00
00
Kuw
ait
Kuw
ait I
nves
tmen
t Aut
horit
y68
10
033
0.5
01
033
Chin
aCh
ina
Inve
stm
ent C
orpo
ratio
n70
00.
750
251
01
033
Nig
eria
Nig
eria
Sov
erei
gn In
vest
men
t Aut
horit
y76
11
067
00
00
0
Pale
stin
ePa
lest
ine
Inve
stm
ent F
und
771
00
330.
50
10
33
Kore
aKo
rea
Inve
stm
ent C
orpo
ratio
n78
11
067
10
10
33
Trin
idad
and
Tob
ago
Her
itage
and
Sta
biliz
atio
n Fu
nd81
00
00
00
00
0
Irela
ndIre
land
Str
ateg
ic In
vest
men
t Fun
d82
00
00
10
00
0
Aus
tral
iaFu
ture
Fun
d87
10
033
11
10
67
Chile
Pens
ion
Rese
rve
Fund
881
11
100
00
00
0
Tim
or-L
este
Petr
oleu
m F
und
of T
imor
-Les
te88
11
067
00
00
0
Uni
ted
Stat
esA
lask
a Pe
rman
ent F
und
Corp
orat
ion
880
00
01
01
167
Cana
daA
lber
ta H
erita
ge S
avin
gs T
rust
Fun
d91
0.5
00
171
11
110
0
Chile
Econ
omic
and
Soc
ial S
tabi
lizat
ion
Fund
911
11
100
00
00
0
Aze
rbai
jan
Stat
e O
il Fu
nd o
f the
Rep
ublic
of A
zerb
aija
n92
11
110
00.
50
10
33
New
Zea
land
New
Zea
land
Sup
eran
nuat
ion
Fund
94
11
110
01
11
110
0
Nor
way
Gov
ernm
ent P
ensi
on F
und–
Glo
bal
980
00
01
11
110
0
(tabl
e co
ntin
ues)

25
Number PB16-18 October 2016
Ta
ble
8
IF
SW
F m
em
be
rs’ a
ffili
ati
on
wit
h t
he
Fo
rum
an
d c
orp
ora
te r
esp
on
sib
ilit
y (c
ontin
ued)
IFS
WF
aff
ilia
tio
n2
01
5 s
co
re o
n
ele
me
nt
14
:
Gu
ide
lin
es
for
co
rpo
rate
resp
on
sib
ilit
y
En
vir
on
me
nt
an
d v
oti
ng
rig
hts
Co
un
try
Fu
nd
20
15
sco
re
IFS
WF
me
nti
on
Pri
nc
iple
s
me
nti
on
Se
lf-
ass
ess
me
nt
me
nti
on
Av
era
ge
sca
led
sco
re
En
vir
on
me
nt
me
nti
on
Vo
tin
g
me
nti
on
Vo
tin
g
in a
ll
ca
ses
Av
era
ge
sca
led
sco
re
To
tal
—1
9.5
01
5.7
56
.00
—1
3.0
05
.50
13
.50
4.0
0—
Scal
ed
IFSW
F m
embe
rs (3
2)68
6149
1943
4117
4213
24
Non
-IFSW
F m
embe
rs (2
8)54
05
02
317
2921
19
All
SWFs
(60)
6233
2910
2436
1336
1722
GPF
s (9
)87
——
——
8956
8978
74
All
fund
s (6
9)64
——
——
4318
4325
29
— =
not
app
licab
le; I
FSW
F =
Inte
rnat
iona
l For
um o
f Sov
erei
gn W
ealth
Fun
ds; G
PFs
= go
vern
men
t pen
sion
fund
s
Sour
ce: A
utho
rs’ c
alcu
latio
ns.

26
Number PB16-18 October 2016
Summary
This analysis of the IFSWF and its work points to four conclusions about this important institution.
First, members of the Forum in general rank more highly on the SWF scoreboard. Some of the credit for their doing so must go to the activities of the Forum. But the differences between averages of member and nonmember scores are not huge.
Second, IFSWF members substantially diverge with respect to their performance on the SWF scoreboard and implicitly the Santiago Principles as well. Some members
have low scores and/or have not substantially improved their scores since joining the IFSWF. Of the 32 IFSWF member funds, the mean and median score is 68 percent, only six percentage points above the average for all funds and 14 percentage points above the average for nonmembers (table 5). Of course, it is unreasonable to expect that all member funds will have very high scores.
Third, the IFSWF currently does not include as members all the largest funds. Six of the 11 funds listed in table 1 with more than $100 billion in assets under manage-ment are not current IFSWF members; three were formerly members counting, for this purpose, Norway’s Government Pension Fund–Global, Singapore’s Temasek, and Russia’s National Welfare and Reserve Fund. Nine of the 14 funds with assets under management of between $50 billion and $100 billion are nonmembers; one was formerly a member but appears to be in dissolution (National Fund of the Republic of Kazakhstan) and two invest primarily domesti-cally (Australia’s Queensland Investment Corporation and Argentina’s Sustainability Guarantee Fund). Saudi Arabia’s Public Investment Fund is a prime candidate for IFSWF membership, especially if it absorbs Aramco. The IFSWF should also reach out to more funds from countries with multiple funds, particularly those in the United States and the United Arab Emirates.
Fourth, IFSWF members should revise either the Santiago Principles or their de facto practices to provide more relevant detail on funds’ financial activities, such as identification of holders of investment mandates (score-board element 19), information on specific investments and the currency composition of their portfolios (elements 23 and 24), and, in particular, whether they not only conduct but also publish audits of their financial statements (element 28). They also fall short on corporate responsibility (element 14) and policy on leverage (element 31).
CONCLUDING REMARKS
Transparency and accountability are at the core of good governance. This was the principal motivation behind the development of the SWF scoreboard in 2007. The same motivation has guided the 2015 update provided in this Policy Brief.
The recent controversy surrounding Malaysia’s sover-eign fund, 1Malaysia Development Berhad (1MDB), illus-trates the consequences of little-to-no openness to public scrutiny.44 1MDB is not technically an SWF, but it is at the lower end of the spectrum of accountability and transpar-ency. Its website yields only a brief statement of its mission and no details about its governance, investments, or finan-cial operations. Allegedly, some of its transactions involved the UAE’s International Petroleum Investment Company, which is scored at 55 in the 2015 scoreboard. The head of that fund, Khadem Al Qubaisi, was dismissed when these allegations became public and recently was arrested.45
The 2015 SWF scoreboard results support three major conclusions. First, the variation in the 60 SWF scores is substantial in many dimensions. A large number of funds fall short of what the citizens of their countries or the inter-national community should expect from these funds, in particular the large funds, with regard to their transparency and accountability.
Second, many funds have substantially increased their scores over the past decade, thereby increasing their trans-parency and accountability to their own citizens and to the
44. The 1MDB scandal involves a government-owned strategic investment company that has been charged with diverting funds to the personal account of the prime minister and others and taking on debt that it cannot service. The scandal is under investigation in a number of countries, including Switzerland, the United States, and the United Arab Emirates. See BBC News, “1MDB: The case that has riveted Malaysia,” July 22, 2016, www.bbc.com/news/world-asia-33447456.
45. See Bradley Hope, “Key Figure in 1MDB Probe Is Arrested in Abu Dhabi,” Wall Street Journal, August 18, 2016, www.wsj.com/articles/key-figure-in-1mdb-probe-is-arrested-in-abu-dhabi-1471561639.
Members of the Forum in general rank more highly on
the SWF scoreboard. Some of the credit for their doing so
must go to the activities of the Forum. But the differences
between averages of member and nonmember scores are not huge.

27
Number PB16-18 October 2016
© Peterson Institute for International Economics. All rights reserved. This publication has been subjected to a prepublication peer review intended to ensure analytical quality.
The views expressed are those of the authors. This publication is part of the overall program of the Peterson Institute for International Economics, as endorsed by its Board of Directors, but it does not neces-
sarily reflect the views of individual members of the Board or of the Institute’s staff or management. The Peterson Institute for International Economics is a private nonpartisan, nonprofit institution for rigorous,
intellectually open, and indepth study and discussion of international economic policy. Its purpose is to identify and analyze important issues to make globalization beneficial and sustainable for the people of the United States and the world, and then to develop and communicate practical new approaches for dealing with them. Its work is funded by a highly diverse group
of philanthropic foundations, private corporations, and interested individuals, as well as income on its capital fund. About 35 percent of the Institute’s resources in its latest fiscal year were provided by contributors from outside the United States.
A list of all financial supporters for the preceding six years is posted at https://piie.com/sites/default/files/supporters.pdf.
governments and citizens of other countries. Progress is happening, but more can be done.
Third, the IFSWF has had substantial success in promoting the transparency and accountability of many of the SWFs that are members, but only 32 (actually 31) of the 60 funds that we scored are members. The Forum should be more active not only in increasing its membership but also in improving the transparency of its current members beyond the Santiago Principles.
REFERENCESBagnall, Allie E. and Edwin M. Truman. 2013. Progress on Sove reign Wealth Fund Transparency and Accountability: An Updated SWF Scoreboard. PIIE Policy Brief 13-19 (August). Washington: Peterson Institute for International Economics.
Cummine, Angela. 2016. Citizens’ Wealth: Why (and How) Sovereign Funds Should be Managed by the People and for the People. New Haven: Yale University Press.
FSB (Financial Stability Board). 2016. Proposed Policy Recom-mendations to Address Structural Vulnerabilities from Assent Management Activities: Consultative Document (June 22). Available at www.fsb.org/wp-content/uploads/FSB-Asset-Management-Consultative-Document.pdf (accessed on Au-gust 26, 2016).
IMF (International Monetary Fund). 2009. Sixth Balance of Payments and International Investment Position Manual. Washington. Available at www.imf.org.
IWG (International Working Group of Sovereign Wealth Funds). 2008. Sovereign Wealth Funds Generally Accepted Principle and Practices “Santiago Principles” (October). Washington. Available at www.iwg-swf.org (accessed on Au-gust 17, 2016).
OMFIF (Official Monetary and Financial Institutions Forum). 2016. Top 500 Ranking in Global Public Investor. Available at www.omfif.org/analysis/global-public-investor/.
Orr, Adrian. 2015a. The International Forum of Sovereign Wealth Funds: Overview Presentation. Available at www.if-swf.org/sites/default/files/Presentation%20of%20IFSWF_0.pdf.
Orr, Adrian. 2015b. Opening Address: From Form to Sub-stance. Seventh Annual Meeting of the International Forum of Sovereign Wealth Funds, September 30. Available at www.ifswf.org/sites/default/files/blog/files/IFSWF_Annual_Meet-ing_Speech_Adrian_Orr_Milan_September_2015_0.pdf (ac-cessed on September 6, 2016).
Rozanov, Andrew. 2005. Who Holds the Wealth of Nations? Central Banking Journal 15, no.4 (May): 52–57.
Truman, Edwin M. 2007a. Sovereign Wealth Funds: The Need for Greater Transparency and Accountability. PIIE Policy Brief 07-6 (August). Washington: Peterson Institute for Interna-tional Economics.
Truman, Edwin M. 2007b. A Scoreboard for Sovereign Wealth Funds. Paper presented at the Conference on China’s Ex-change Rate Policy, October 19. (Incorporated into “The Management of China’s International Reserves: China and a Sovereign Wealth Fund Scoreboard,” in Debating China’s For-eign Exchange Rate Policy, ed. Morris Goldstein and Nicholas Lardy. Washington: Peterson Institute for International Eco-nomics, 2008).
Truman, Edwin M. 2008. A Blueprint for Sovereign Wealth Fund Best Practices. PIIE Policy Brief 08-3 (April). Washing-ton: Peterson Institute for International Economics.
Truman, Edwin M. 2010. Sovereign Wealth Funds: Threat or Salvation? Washington: Peterson Institute for International Economics.