Embed Size (px)
Citation preview

CYCLING INCLUSIVE PLANNING: POLICY AND PRACTICE – EXAMPLES FROM THE
NETHERLANDS
MARTIN VAN MAARSEVEEN
ANPET XXVII, 5-8 November 2013

2
Global trends: rapid urbanization
The world we live in …
World population will increase from 7
billion today to more than 9 billion in
2050.
That translates into an average 1 million
more city dwellers every week for the
next 38 years.
These trends are impossible to stop, so
the question is not whether or not
urbanization should take place, but how
best to urbanize.
Source: Planet under pressure, 2012


4
Impacts of urbanization
Urban sprawl
Environmental degradation
Severe accessibility
problems
Poor living conditions

5
Global trends: rapid motorization
The world we live in …
Rapid increase in car ownership and use
(timing and rate of change differs).
Extensive expansion of (urban) road
networks, thereby supporting
suburbanization.
Marginalization of alternative modes of
transport.
Urban divide in transport opportunities.
Source: Planet under pressure, 2012

6
Historical trend of worldwide vehicle registrations
1960-2010 (thousands)
Type of vehicle 1960 1970 1980 1990 2000 2005 2009 2010
Car registrations(1)
98,305 193,479 320,390 444,900 548,558 617,914 684,570 707,764
Truck and bus registrations 28,583 52,899 90,592 138,082 203,272 245,798 295,115 307,497
World total 126,888 246,378 410,982 582,982 751,830 863,712 979,685 1,015,261
Note (1) Cars registrations do not include U.S. light trucks (SUVs, minivan and pickups) that are used for personal travel. These vehicles are
accounted among trucks.
Comparison of motorization rates by region
1999 and 2009
(vehicles per 1000 people)
Country/Region 1999 2009
Africa 20.9 24.9
Asia, Far East 39.1 157.7
Asia, Middle East 66.2 101.2
Canada 560.0 620.9
Central and South America 133.6 169.7
Europe, East 370.0 363.9
Europe, West 528.8 583.3
Pacific 513.9 560.9
United States 790.07 828.04
Source: Automobile and Truck Trends, 2011
Source: Transportation Energy Data Book, 2011, 2012

7
Impacts of motorization
Congestion
Emissions (climate
change, pollution, noise)
Traffic casualties
Fragmentation (barriers,
road space)
Degradation of livability
in cities

8
Land use and transport planning challenge
Cities place tremendous strains on natural
resources and the environment.
Land use and transport planning are crucial
for giving direction to urban developments.
Dense cities designed for efficiency offer one
of the most promising paths to sustainability.
New ways of thinking about how to make
cities more self-sufficient and sustainable,
along with advances in a wide range of
technologies and heightened environmental
awareness is leading to a reformulation of
urban planning and development

9
Paradigm shift in urban transport planning …
Car/vehicle-oriented approach (current) People-oriented approach (proposed)
Lo
w p
rio
rity
H
igh
Prio
rity
NMT
Lo
w V
olu
me
Hig
h V
olu
me
Lo
w p
rio
rity
H
igh
Prio
rity
NMT
Hig
h V
olu
me
Lo
w V
olu
me
….from car/vehicle-oriented towards people-oriented !

CYCLING
Cycling is part of the transport system in highly motorized
countries
Cycling contributes to livelihood, to urban quality and the
economic vitality of cities
To promote cycling, the quality road design requirements have to
be addressed
The economic benefits of cycling are high
Cycling is an important feeder for public transport

Benefits …

CYCLING IN THE NETHERLANDS
16 mln people
own over 16 mln bicycles,
ride 16 mln bicycle trips/day

27 % of trips are made by bicycle, 19 % by walking
A Dutch person cycles 1000 km/y, walks 250 km/y.
Only nation with more bicycles than people (1.2 per person)
14
SOME FACTS
Car driver Car pass.
Bike Walk
Train
Other
Bus/tram
metro
Motorcycle/
scooter
Modal split in the Netherlands 2004-2008
Source: Mobility Survey Netherlands

Cycling inclusive planning is ensuring that the role of cycling is
part of the integrated land use and transport planning.
Its goal is to realise as much as possible the potential that
cycling offers.
In doing so it
Contributes to meet the transport needs of individuals & society
Maximises contribution to social & economic well being
Contributes to
Road safety
Liveability
Environmental quality
15
WHAT IS CYCLING INCLUSIVE PLANNING?

16
THE MUTUALLY INFLUENCING MARKETS
Travel
market
(trips) •Activity patterns
•Spatial distribution
•Spread in time
•Avoid trips
Transport
market
(transport
systems) •Availability
•Effectiveness
•Efficiency
•Status
•Costs
Traffic
market
(flows) •Routes
•Speeds
•Manoeuvres
•Congestion
•Safety
AVOID
Spatial planning etc.
SHIFT : integrated
multimodal systems IMPROVE: fuels,
traffic management
17
FINDING THE OPTIMAL MIX IN THE TRANSPORT MARKET

Factual use
Potentials
which trips could be made by bicycle?
Trends in bicycle use
up or down?
Competiveness
travel time
availability
Quality of bicycle trips
Safety, comfort, directness, ….
BASIC CONSIDERATIONS

Who are the current cyclists?
Why are they cycling? Which trips?
Who belong to potential market segments?
Socio-economic characteristics
Behavioural characteristics
Cultural aspects
Barriers
From where to where do bike trips go?
WHO, WHY and WHERE are people cycling?

Example behavioural approach:
study in Dar es Salaam (Alphonse Nkurunziza)
to identify groups of people in different stages of change,
to analyse attitudes for each group,
to identify motivators and barriers,
and to be able to develop tailor made policy approaches.
POTENTIAL MARKETS

All trip purposes (work, school, shop, visit friends, recreational)
e.g. the Netherlands, Denmark, Germany
Sports related/recreational
e.g. USA, Australia
Transport purpose/earning an income
e.g. China, India, Africa
Bike trips (origin-destination)
Bike trips (access/egress Public Transport)
WHICH TRIPS?

22
car train bus, tram, metro bicycle walk
The role of modes on the transport market depend on travel
distances
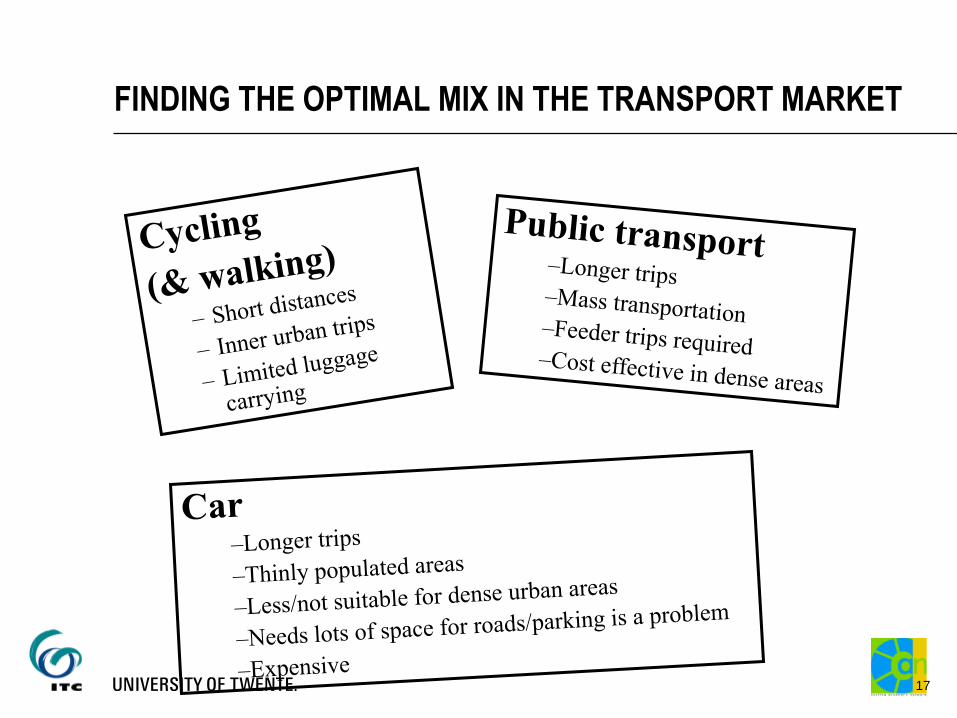
The car is gradually becoming slower than the bicycle
Verplaatsingstijd verhouding fiets / auto
0,93
0,84
0,98
1,13
1,08
0,95
2000-2004 2006-2010
> 1,0 fiets langzamer < 1,0 fiets sneller
Kleine gemeenten 20.000 - 50.0000
Middelgrote gemeenten50.000 - 100.000
Grote gemeenten > 100.000
Source: Dutch Cyclists Federaton, 2012
Travel time ratio bike/car
Bike slower Bike faster
Small cities
Medium-sized cities
Large cities

Increasing access to jobs, facilities, education
Improvement of the quality of the living environment
Improving social and traffic safety
Improvement of public health
24
KEY POLICY OBJECTIVES FOR CYCLING

Campaign for changing behaviour: cycling
“You won’t believe it… you’re safer
on the bicycle than on the sofa!”
“Lack of daily exercise is harmful to
your health, while physical activity
keeps your body healthy. Cycling
extends your life – daily exercise for a
minimum of 30 minutes extends your
lifespan by up to five years.”

Responsibility primarily at municipalities, each municipality can
have a different approach
Funding: Municipal budget, subsidies (Central government, EU)
E.g. Amsterdam spends 20 million Euro per year on cycling
related projects
26
CYCLING POLICY DEVELOPMENT AND IMPLEMENTATION

27
POLICY DEVELOPMENT MEANS INTERACTION
Politicians,
Decision makers
Experts,
Civil servants
Society
•Businesses
•Civil society
•Opinion makers
• Media…

Provision of fully networked infrastructure in integration with
public transport
Traffic management: give priority to cyclists and pedestrians
Legal: protection of cyclists and pedestrians in case of accidents
Demotivate car use, car-low city centres and streets, transferia
Land use planning
28
KEY POLICY INTERVENTIONS

1. Cultural and political
2. Spatial development
3. A high level of bicycle infrastructure, also parking
4. Good integration with public transport
5. A strong and innovative industry
6. Effective traffic safety policies and legislation
7. High level of knowledge in spatial and transport planning, social
and policy science and the ability to apply this in actual practice
29
SUCCESS FACTORS OF DUTCH NON-MOTORISED TRANSPORT

Egalitarian society: young and old, rich and poor, educated and
uneducated, everybody cycles.
The bicycle is an icon of Dutch culture, straight back, against the
wind, calvinistic, effort driven.
Politics are therefore deemed to be supportive of cycling
A planning culture, every bit of space is subject of discussion
30
SUCCESS FACTOR 1: CULTURAL AND POLITICAL

Small and compact cities with relatively short trip lengths
Clustering of functions in city centres
Transit Oriented Development
31
SUCCESS FACTOR 2: SPATIAL DEVELOPMENT

29,000 km of free lying cycle lane (2 m per inhabitant)
Dedicate infrastructure solutions (bridges, roundabouts, tunnels,
cycling streets etc.
32
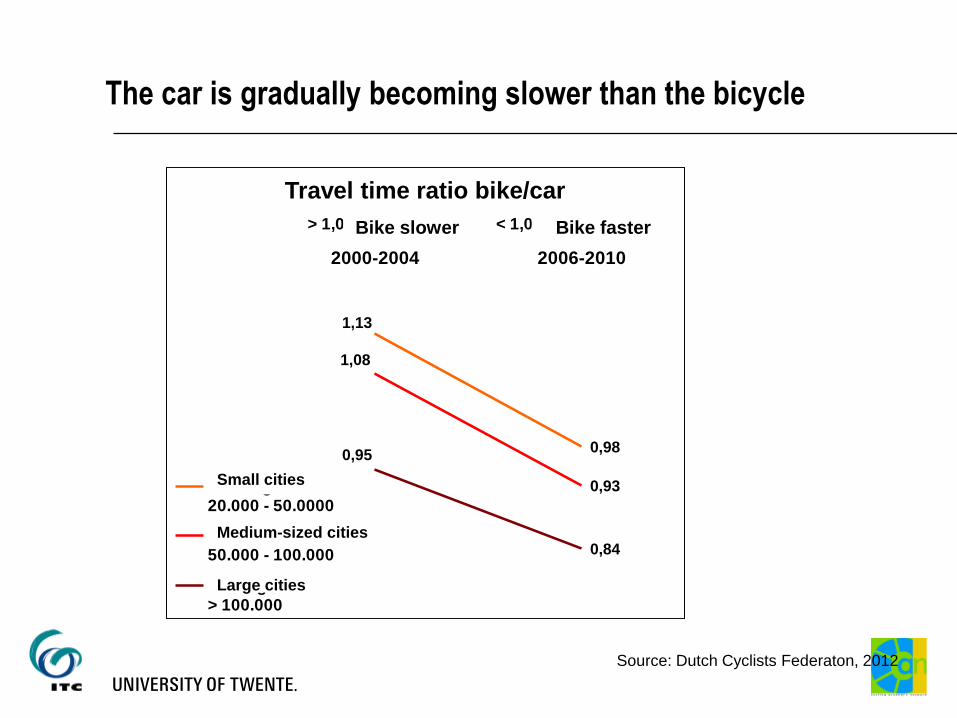
SUCCESS FACTOR 3: INFRASTRUCTURE
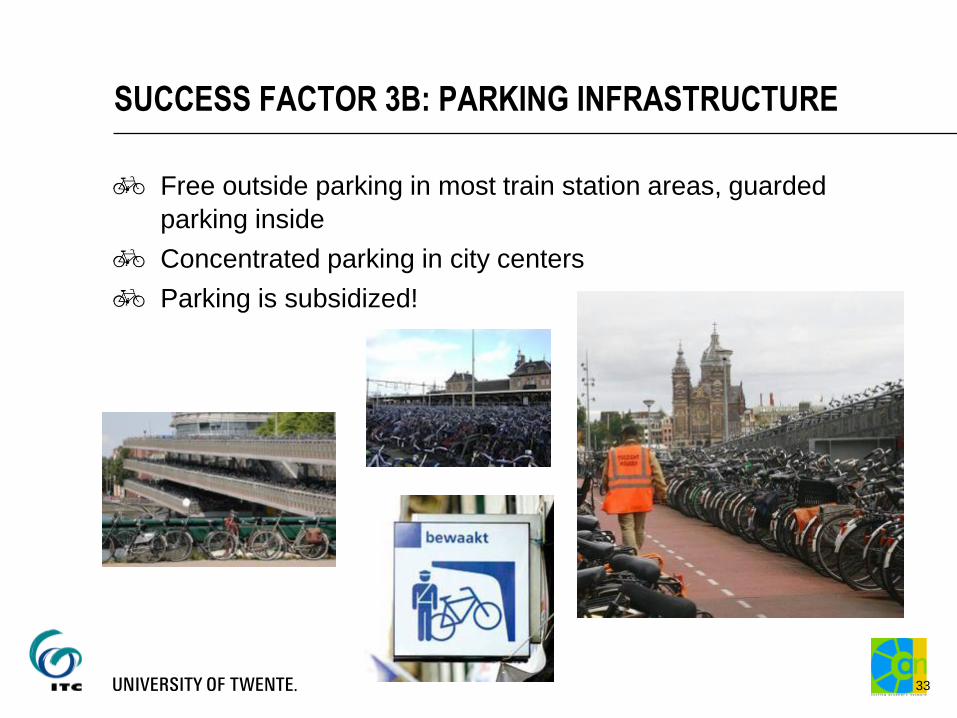
Free outside parking in most train station areas, guarded
parking inside
Concentrated parking in city centers
Parking is subsidized!
33
SUCCESS FACTOR 3B: PARKING INFRASTRUCTURE

Planning through the concept of mobility chains.
“OV fiets” public bike rental scheme; typically for egress trips
from train stations, available at over 500 train stations in the
country, mostly work related trips
Flat fare of Euro 2.85 per 24 hrs.
Also now featuring electrical bikes
34
SUCCESS FACTOR 4 : PT INTEGRATION

Traditionally the NL have a strong bike industry
Most people buy Dutch made bicycles.
Innovations in design creating versatile bikes for different
occasions.
35
SUCCESS FACTOR 5: STRONG BIKE INDUSTRY

36
SUCCESS FACTOR 6: TRAFFIC SAFETY
Source: Cycling in the Netherlands, 2009
Infrastructure design very much geared to traffic safety for
cyclists.
Legislation to support the cyclist, priority, legal protection,
insurance.
High level of knowledge in spatial and transport planning, social
and policy science and the ability to apply this in actual practice
Rather well educated civil cervants in the transport sector.
Well functioning societal organisations that have an input in
policy development and decision making in spatial planning and
transport.
37
SUCCESS FACTOR 7: INTEGRATED KNOWLEDGE

1. Safety
2. Coherence
3. Directness
4. Comfort
5. Attractiveness
(source: Boudewijn Bach,1990)
THE FIVE PRINCIPLES OF BICYCLE NETWORK DESIGN

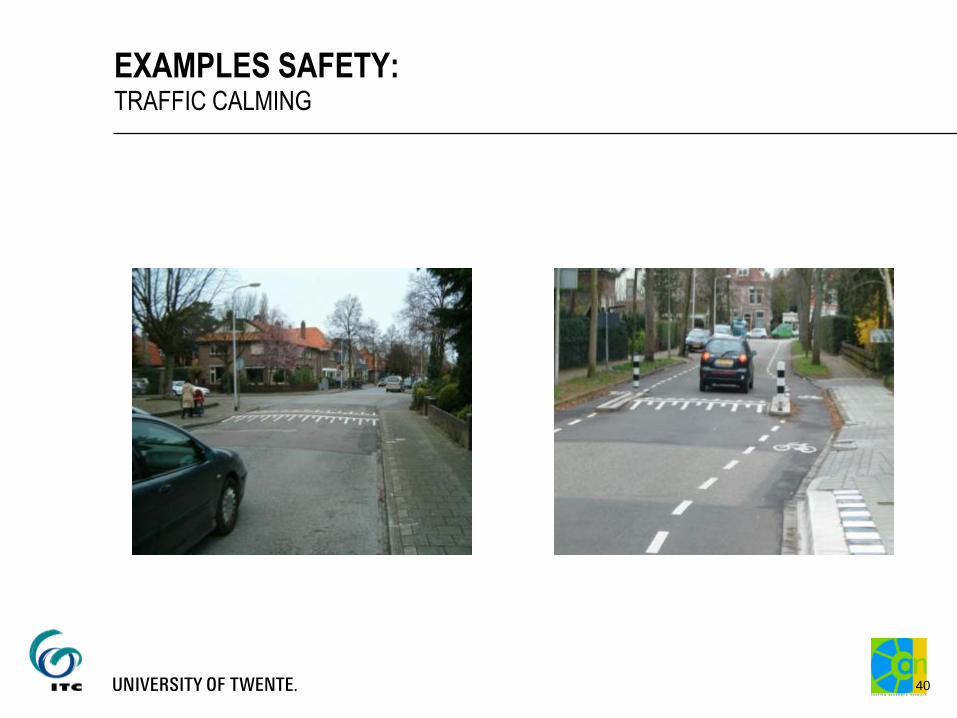
1. Reduce car speeds: Traffic calming, road narrowing etc.
2. Separate traffic with significant speed differences
Separate cyclists and pedestrians;
Avoid cyclists or cars together on roads of more than 30km/hr
Separate through traffic from access traffic
39
1 SAFETY SIX WAYS OF MAKING BICYCLE TRAFFIC SAFER
40
EXAMPLES SAFETY: TRAFFIC CALMING

41
EXAMPLES SAFETY BICYCLES AND CARS COMPLETELY SEPARATED

EXAMPLES SAFETY: WHOSE ROAD IS IT ANYWAY? BIKE STREETS: THE CAR IS GUEST
Force cars to keep low speeds!

GUIDELINES FOR SEGREGATION VERSUS INTEGRATION

3. Make roads and intersections predictable and “understandable”
Implement a clear road hierarchy by road function
Distinguish in design between through roads for cars and
cycle traffic, local access or habitat roads with pedestrian
activities etc.
44
1 SAFETY SIX WAYS OF MAKING BICYCLE TRAFFIC SAFER

Solution for an intersection that is different from a regular crossing to
avoid conflicts between cyclists.
45
EXAMPLES SAFETY: SPECIAL SOLUTIONS
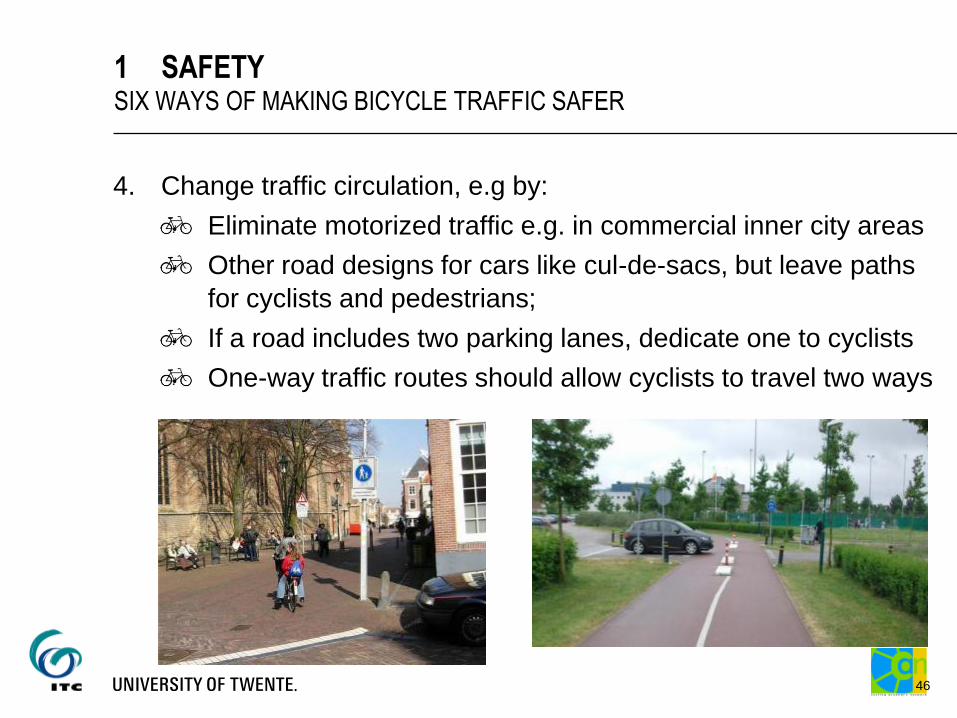
4. Change traffic circulation, e.g by:
Eliminate motorized traffic e.g. in commercial inner city areas
Other road designs for cars like cul-de-sacs, but leave paths
for cyclists and pedestrians;
If a road includes two parking lanes, dedicate one to cyclists
One-way traffic routes should allow cyclists to travel two ways
46
1 SAFETY SIX WAYS OF MAKING BICYCLE TRAFFIC SAFER

5. Change the use of existing spaces
Create public green space or parks
Private gardens or properties.
6. Construct tunnels, bridges, overpasses for cyclists, pedestrians
and/or motorized traffic
47
1 SAFETY SIX WAYS OF MAKING BICYCLE TRAFFIC SAFER

1. A complete network of cycle facilities (network level; mainly
important for urban and traffic planners);
2. Freedom to choose different routes (network level; mainly
important for urban and traffic planners);
3. Consistent quality (recognizable layout, primarily requires
attention from designers);
4. Complete (uninterrupted) routes (primarily requires attention
from designers);
5. Proper signposting (primarily requires attention from designers).
48
2 COHERENT SYSTEM
S1 5
S0 1
S0 3
W 0 2
S 0 2
R 0 1
W 0 1
W 0 3
W 0 4
S 1 1
W 0 5R 0 6
S 1 4
S 1 3
R 0 5
R 0 4
R 0 3
S 0 7
S 0 8
S 0 9
S 1 0
R0 2
F IE T S E N N E T W E R K D E L F T F IE T S A C T IE P L A N II
R 0 7
S 1 2
S0 4
S0 6
S C H A A L S C H A A L 0 .2 5 0 .5 00 0 .7 5 1 .0 0 1 .5 0 K M1 .2 5
F ie ts ro u t e w ijk n e tw e rk
F ie ts ro u t e s t a d s n e tw e rk
F ie t s ro u te re g io n a a l n e tw e rk
O n tb re k e n d e s c h a k e l in w ijk n e tw e rk
F ie ts ro u t e w ijk n e tw e rk
O n tb re k e n d e s c h a k e l in s ta d s n e tw e rk ( Ho o fd f ie t sn e twe rk)
F ie ts ro u t e s t a d s n e tw e rk ( Ho o fd f ie t sn e twe rk)
K n e lp u n t in re g io n a a l n e t w e rk ( Ho o fd f ie t sn e twe rk)
F ie t s ro u te re g io n a a l n e tw e rk ( Ho o fd f ie t sn e twe rk)
M id d e n D e lf la n d ro u te
L E G E N D A
G e m e e n t e g re n s
X X X C o m f o rt v e rb e te r in g

Planners should give priority to:
Short routes for cyclists;
Two-way cycle traffic, preferably on all roads;
Avoiding conflicts with pedestrians
Ways to achieve this:
A finely meshed cycle network;
Cycling is allowed on all urban roads where no cycling
infrastructure exists
Make shortcuts wherever possible;
Keep cycle paths, lanes and routes as straight as possible;
Ensure pedestrians have separate facilities;
Favourable signalling for cyclists;
49
3 DIRECTNESS

Cycling infrastructure should provide a smooth surface, favour
manoeuvrability and limit the need for cyclists to stop.
Ways to achieve this:
Minimize stops by providing right of way and favourable
signalling;
Ensure a smooth, comfortable road surface;
Provide cycle routes that are wide enough for cyclists with
children, packages or on special vehicles such as tricycles;
Include natural landscaping that provides shelter from wind,
direct sunlight and rain;
Avoid components that force cyclists to stop, dismount, deal
with unnecessary curves or right angles.
50
4 COMFORT

51
EXAMPLES COMFORT: CARPET PAVEMENT, RIGHT OF WAY, ETC.
Cycling infrastructure should be carefully designed and fitted to
surroundings so that the option of cycling becomes attractive.
Ways to achieve this:
Cycle routes pass through attractive and varied
surroundings;
Cycle routes coincide as little as possible with car and public
transport corridors, especially where there is no segregation
between modes;
Cycle routes make use of areas with natural vigilance and
other components necessary for cyclists, especially women
and children, to feel safe.
52
5 ATTRACTIVENESS

53
EXAMPLES ATTRACTIVENESS: SURROUNDING, LANDSCAPING ETC.

Problem: Solution:
1. Speed difference between bicycles and
other vehicles
- Traffic calming (30 k/hour zones, woonerf)
- Enforcement,
- Segregation, parallel routes
2. Lack of dedicated space
Tiny gaps between moving vehicles and the
curb / parked cars or between 2 lanes of
moving traffic. Parked cars pulling in & out;
opening doors
- Provide dedicated space (segregated / shared)
- Alternative parallel routes
- Rumble strips on the road surface
3. Intersections
Long crossing distances
High speeds
Signalling favouring faster modes
- Adjust/reconstruct intersections
- Reduce speed on all sides
- Pre-signalling for cyclists
- Adjust phasing of signals
4. Difficult weaving movements
Cyclists turning right crossing lanes
Cyclists going straight, traffic turning L or R
- Reduce speed where modes are mixed
- Weaving lanes
- Dedicated crossings
54
COMMON PROBLEMS AND SOLUTIONS TABLE (1)

55
COMMON PROBLEMS AND SOLUTIONS TABLE (2)
55
Problem: Solution:
5. Road markings: absent/ partial/
confusing
Inconsistency encourages less disciplined
behaviour
- Definition of policy / standards of: having traffic
lanes, cycle lanes through intersections, white
lines, logos, red surface etc.
- Minimize road markings within Habitat areas
6. Proximity of trucks and buses
Especially while turning
Fast vehicles create draughts
Passengers (dies) embarking
- Special zones for trucks and buses
- Minimum bus & cycle lane width
- Careful design of bus stops
7. Detours
Discontinuities in existing facilities
- Contra flows for cyclists
- Run cycle tracks through intersections
8. Weak enforcement of traffic laws:
Red light braking
Speeding (especially motorbike couriers)
Car encroaching on cycle tracks (at pinch
points, parking, loading)
Jaywalking pedestrians
- Better laws and regulations
- Enforcement of all laws and regulations
- Segregation
- Parking & loading windows
- More green time for pedestrians
- Educational campaigns to ensure all users
understand the different rules, the rationale
behind them, and how they apply to the different
transport modes

56
COMMON PROBLEMS AND SOLUTIONS TABLE (3)
Problem: Solution:
9. Cyclists not being seen - Cyclist and driver education
- Enforcement of proper lighting, reflectors, bells
- Designs “boxes” that designate a stopping area
for cyclists, clearly visible to drivers
- Avoid designs that leave cyclists stopped in
cars’ blind spots
10. General abundance of traffic and
parking
Its general presence and sometimes erratic
movements
No place for social activities (incl. play)
Noise & pollution
- Implementation of an integrated and efficient
public transport system
- Traffic calming (30 km/hr zones, Woonerf)
- More car free areas
- Diminishing the number of parked cars and
strict enforcement
11. Bad road condition
Holes, trenches
Glass and wet leaves
Street ‘furniture’ - railings
- Regular maintenance
- Remove street furniture where cyclists could
be crushed up against it by turning vehicles
(tight) corners
- Locate lighting and electric posts out of
pedestrian and cycle routes and, where possible,
bury utilities, thus reducing the number of posts

Identify actors
Partners and opponents
Allow for modifications and alterations
Plans will be better geared to needs and obstacles
Ownership will be broadened
Less vulnerable in changing circumstances
Make an actor’s analysis
RECOMMENDATIONS (1): Include stakeholders

What could be in it for cycling?
What can cycling offer?
Learning by doing:
Organise pilots
Define smart success indicators
Evaluate and improve
RECOMMENDATIONS (2):
Use opportunities to create momentum

Example of an opportunity
Cities always struggle with a lack of sufficient financial means that
can be used to shift land use and transport developments into a
more sustainable direction.
Because of the large contribution of the transport sector to CO2
emissions, and thereby climate change, large money flows are
generated on the carbon market to achieve international policy
objectives.
The “Climate value of Cycling” concept enables to calculate the
amount of avoided CO2 emissions in an area related to the
(future) use of the bicycle system in that area.
This concept could thereby be used to generate money flows to
set up, expand and improve bicycle facilities within a cycling-
inclusive urban transport planning approach.
CONCLUSIONS
Global urbanization and motorization trends urge for a
reformulation of urban planning and development.
An increasing number of cities adopt the strategic objective of
sustainable mobility, in which land use planning and transport
planning are integrated, and where all transport alternatives are
considered crucial to maintain a liveable city.
Cycling-inclusive urban transport planning recognizes the fact that
cycling is a very attractive transport mode for short distances as
well as a feeder for public transport systems.

CONCLUSIONS (2)
Cycling-inclusive urban transport planning is much more than the
supply of bicycle facilities. It requires an integrated approach with
other modes of transport and includes, among others, travel demand
orientation, behavioural issues, high quality engineering, education,
public campaigns, stakeholder involvement and financial
entrepeneurship.

Cycling - inclusive policy development : a handbook / ed. by T.
Godefrooij, C. Pardo, L. Sagaris. Eschborne : Utrecht :
Deutsche Gesellschaft für Technische Zusammenarbeit (GTZ),
Interface for Cycling Expertise, 2009.
62
FURTHER READING

and colleagues in CAN
www.cyclingresearch.nl
63
THANK YOU FOR YOUR ATTENTION