Embed Size (px)
Citation preview
International Journal of Computer Applications Technology and Research
Volume 7–Issue 10, 386-389, 2018, ISSN:-2319–8656
www.ijcat.com 386
Policies for Green Computing and E-Waste in Nigeria
Shedrack Mmeah Department of Computer
Science, Ken Saro Wiwa
Polytechnic, Bori,
Rivers State - Nigeria
Barida Baah
Department of Computer
Science, Ebonyi State
University, Abakaliki –
Nigeria
Abasiama G. Akpan
Department of Computer
Science, Ebonyi State
University, Abakaliki –
Nigeria
Abstract: Computers today are an integral part of individuals’ lives all around the world, but unfortunately these devices are toxic to
the environment given the materials used, their limited battery life and technological obsolescence. Individuals are concerned about the
hazardous materials ever present in computers, even if the importance of various attributes differs, and that a more environment -
friendly attitude can be obtained through exposure to educational materials. In this paper, we aim to delineate the problem of e-waste
in Nigeria and highlight a series of measures and the advantage they herald for our country and propose a series of action steps to
develop in these areas further. It is possible for Nigeria to have an immediate economic stimulus and job creation while moving
quickly to abide by the requirements of climate change legislation and energy efficiency directives. The costs of implementing energy
efficiency and renewable energy measures are minimal as they are not cash expenditures but rather investments paid back by future,
continuous energy savings.
Keywords: Green Computing, eco trends, climate change, e-waste and eco-friendly
1. INTRODUCTION Green computing is the environmentally responsible and eco-
friendly use of computers and their resources. In broader
terms, it is also defined as the study of designing,
manufacturing/engineering, using and disposing of computing
devices in a way that reduces their environmental impact.
Green computing aims to attain economic viability and
improve the way computing devices are used. Green IT
practices include the development of environmentally
sustainable production practices, energy efficient computers
and improved disposal and recycling procedures.
To promote green computing concepts at all possible levels,
the following four complementary approaches are employed:
• Green use: Minimizing the electricity consumption
of computers and their peripheral devices and using
them in an eco-friendly manner
• Green disposal: Re-purposing an existing computer
or appropriately disposing of, or recycling,
unwanted electronic equipment
• Green design: Designing energy-efficient
computers, servers, printers, projectors and other
digital devices
• Green manufacturing: Minimizing waste during
the manufacturing of computers and other
subsystems to reduce the environmental impact of
these activities
Government regulatory authorities also actively work to
promote green computing concepts by introducing several
voluntary programs and regulations for their enforcement.[l]
At a macro level, as the ecotrends are sweeping across the
globe, the European Union, for example, has established
guidelines for a computers’ end of life (EOL) making
manufacturers responsible for the implementation of measures
during and after the sale to ensure that their products are sold
and then collected, deposited or recycled so as to reduce their
impact on the environment.
Europe’s strong stance on the environment has strong support
from it newest member states in Eastern and Central Europe.
These transitioning economies are in the process of
transferring legislation and incorporating EU policies. Nigeria
has developed a National Strategy for Sustainable
Development for 20 13—2020—2030 which set out the
following priorities: climate change and clean energy,
sustainable consumption and waste management, conservation
and management of natural resources. However, there is still a
gap between legislation and practice [2]. Particularly, in the
reduction of e - waste, Nigeria is working to set up the
infrastructure to facilitate these directives that closely mirror
those established by the EU. However, as public awareness of
environmental standards has increased, companies have
grown more compliant with environmental standards and
regulations. Currently, Nigeria is situated at the bottom of the
list according to its Environmental Performance Index, having
less scores for health impacts and forests and needing to
improve its management of fisheries and water resources.
In this paper, we aim to delineate the problem of e-waste in
Nigeria and highlight a series of measures and the advantage
they herald for our country.
2.0 E-WASTE “Electronic waste” may be defined as discarded computers,
office electronic equipment, entertainment device electronics,
mobile phones, television sets, and refrigerators. This includes
used electronics which are destined for reuse, resale, salvage,
recycling, or disposal. Others are re-usable (working and
repairable electronics) and secondary scrap (copper, steel,
plastic, etc.) to be ‘commodities”, and reserve the term
“waste” for residue or material which is dumped by the buyer
rather than recycled, including residue from reuse and
recycling operations. Because loads of surplus electronics are
frequently commingled (good, recyclable, and non-

International Journal of Computer Applications Technology and Research
Volume 7–Issue 10, 386-389, 2018, ISSN:-2319–8656
www.ijcat.com 387
recyclable), several public policy advocates apply the term “e-
waste” broadly to all surplus electronics. [3]
Today the electronic waste recycling business is in all areas of
the developed world a large and rapidly consolidating
business. People tend to forget that properly disposing or
reusing electronics can help prevent health problems, create
jobs, and reduce greenhouse-gas emissions. Part of this
evolution has involved greater diversion of electronic waste
from energy-intensive down cycling processes (e.g.,
conventional recycling), where equipment is reverted to a raw
material form. This recycling is done by sorting, dismantling,
and recovery of valuable materials. This diversion is achieved
through reuse and refurbishing. The environmental and social
benefits of reuse include diminished demand for new products
and virgin raw materials (with their own environmental
issues); larger quantities of pure water and electricity for
associated manufacturing; less packaging per unit; availability
of technology to wider swaths of society due to greater
affordability of products; and diminished use of landfills.
If one attempted to break the e-waste recycling process into
several connected steps, the following cycle would be of use:
1) Collection
2) Sorting/dismantling and pre-processing (i.e. sorting,
dismantling, mechanical treatment)
3) End-processing (i.e. refining and disposal) — see Table 1
Table 1: Recycling chain for e-waste
Taken from UNEP 2009, Recycling —from E-waste to
resources
On the whole, the efficiency of the entire recycling chain is
inextricably linked to the efficiency of each step and to how
well the interfaces between these interdependent steps are
managed.
Therefore, in a context characterized by fundamental changes
in demographic and pronounced regional disparities, sharp
dynamics of technical progress combined with a relative
increase in living standards significantly contribute to
increased sales of electronic products and consumer goods
which translate, at the end their lifetime, in an increase in the
amount of e-waste generated in Nigeria. Of course, a potential
e-waste management system must be carefully tailored and
well organized, so it would be able to collect, recycle and
dispose of electronic used equipment. E-waste collection from
households in Nigeria is organized through three collection
channels: by organizing a collection day at fixed dates from
the population, by giving back to the store the old equipment
when purchasing a new one (free take- back system) or by
giving it directly to the municipal collection centers. [4]
Regarding the acquisition trends of c-waste collection,
national studies conducted in 2008 and 2009 on the electronic
market revealed the following:
• penetration of small appliances increased;
• there is a tendency to abandon the use of old
equipment which are more than five years;
• although the percentage of people who keep in their
household non-operational equipment decreased,
many of them still keep it because they don’t know
very well the alternatives. They should be attracted
by offering discounts on the purchase of new
equipment, or by collecting the old ones from their
home.
Consequently, one can say that in Nigeria, the difference
between the amount of equipment placed on the market and
the amount of equipment collected from consumers is the
quite high compared with other countries in the AU.
There are special legal provisions for c-waste and used
batteries, but their implementation and enforcement have a
long way to go. Good practices are visible though there is a
monthly national campaign for collecting e-waste,
encouraging people to put old fridges, TV sets, washing
machines and computers outside their houses, which the local
waste management company then collects. Due to this
campaign, the average amount collected in 2009 was almost
2% of the national target, experts estimated. E-waste
associations had an online media campaign in 2009 to
advertise their services. In May-June 2010 a public awareness
campaign, funded by e-waste management companies, called
for photos and videos of e-waste, which it called “the
monsters of your community”.[3]
The media campaign is backed by the Ministry of
Environment — a good example of cooperation between civil
society, business organisations and the government. Perhaps
as a result, research on e-waste-related attitudes and
behaviours, conducted in Nigeria urban areas, has shown
positive trends in terms of a willingness to recycle
dysfunctional appliances. At the same time, however, 70% of
the Nigeria urban population surveyed is not aware of the
laws and regulations related to c-waste.
The attitudes and habits concerning electrical and electronic
waste can be discerned from the following data, issued by a
recent survey done by ECOTIC (data for the survey was
collected between August 10 and August 31 2014, on a
sample of 1,000 people from the urban area, aged between 15
and 65):
• some 60% of Nigerians who live in urban areas say
they separate waste for recycling, mainly plastic,
paper, glass and metallic products;
International Journal of Computer Applications Technology and Research
Volume 7–Issue 10, 386-389, 2018, ISSN:-2319–8656
www.ijcat.com 388
• Only 4% separately collect electrical and electronic
waste;
• 87.5% of respondents know that they can recycle
this kind of waste; -.
• when asked “Why do you think electrical waste
should be recycled?”, most of Nigerians relate to the
re-use of materials — 38%, environmental reasons
— 36% and to repairing and putting back into use—
15%.
• only 36% of respondents have actually turned in
electrical waste to licensed entities, such as
specially arranged centres in different areas of the
city (over 30% took the electrical waste in such
places), in stores when buying a new product (26%),
and specialized firms (13%).
• 6% gave such waste to people who periodically pass
through residential areas to collect scrap iron.
• the most common waste equipment Romanians
recycle are TV sets— 49%- refrigerators — 33%
and washing machines — 28%.
• of the 64% of respondents who don’t give electrical
waste to licensed operators, 27% say they give it to
people who collect scrap iron waste on the streets,
26% keep them in their homes and 34% give them
to friends or relatives.
• most respondents say they keep electrical waste for
parts or because they intend to repair them, that they
don’t know about any disposal facilities nearby,
they don’t know what to do with them or that they
can be recycled; others say they just lack the time.
• Nigerians should collect 4 kg of electrical waste per
year per person for recycling, according to EU
quotas, but the recorded results don’t exceed 1.5 kg
per capita.
The factor that would most motivate the Romanians to give-
up non-functional home electronics and appliances are buy-
back campaigns, where consumers receive a discount on the
purchase of new equipment when they give in return the old
ones. Furthermore, surveys indicate that over 90% of
respondents admit that selective waste collection activity is
important, but still they do not operate in this direction. They
are willing to adopt an ecological environmental behaviour
regarding electronic equipment only to the extent that this
does not require great efforts on their part.
There are several implications for these findings. If these
implications should be translated into steps of an e-waste
programme, they should focus on the following aspects:
• First and foremost, consumers need to be educated
regarding the toxicity of computers and the
problems of e - waste. The results of the survey
suggest that when presented with information the
consumers positive attitudes toward green
computing and e-waste collection increase
significantly in. This education would best be
carried out by public policy holders, educational
institutions and various non - profit agencies such as
the Green Electronics Council on a prolonged basis
to initiate attitude change.
• In 2001, the Western Electronic Product
Stewardship Initiative (WEPSI) proposed
developing environmental assessment criteria of
electronics as a means to direct governments and
other entities into environmentally better purchasing
decisions. The EPEAT system is used in at least
eight nations including the US and Canada and is
used to identify environmentally friendly
electronics; however, expansion of this system is
needed in more countries as the proliferation of e -
waste continues. In this system electronics are
evaluated based such criteria as reduction of
harmful materials, recyclability, energy
conservation, corporate performance, end - of
life(EOL) management, and product longevity.
EPEAT registered computers have reduced levels of
toxic metals, are energy efficient and are easy to
upgrade and recycle. Although many manufacturers
subscribe to the EPEAT system, getting the message
to consumers is not without difficulties. Findings
show that consumers are proactive regarding energy
savings; however, regarding other components of
computers, such as batteries and materials, they lack
the knowledge necessary to make informed choices.
• Marketing can play a vital role in increasing
favorable attitudes towards green computing and
prompting sustainable development of computers
and other similar devices minimizing their impact
on the environment while satisfying consumers’
needs and wants. Depending on the country the role
of government in moderating consumer purchasing
behavior of green computers and other electronics
through educational materials could be perceived
both positively and negatively.
Electronics manufacturers must realize that consumers in
developing nations are environmentally conscious and desire
access to eco - friendly computer products and accessories.
Hence, manufacturers that subscribe to EPEAT should
develop labeling and symbols that are incorporated into
packaging and product design to further communicate their
support of green computing initiatives such as EOL. Further,
these manufacturers should communicate this distinction as a
point of brand differentiation when developing advertising
messages. Until now, differentiation among computer
manufacturers has been based on after - sale service, brand
reputation, speed, and technological capabilities. Additionally,
product strategies should include educational seminars
provided to resellers in the form of employee trainings so that
they are better able to communicate the features and benefits
of “green” computer brands and models to consumers in
developed, transitioning and LDC countries.
As an overall recommendation, the development of
collaboration between institutions with responsibilities in
waste management should be enhanced and more support
rendered by competent state bodies to private sector is

International Journal of Computer Applications Technology and Research
Volume 7–Issue 10, 386-389, 2018, ISSN:-2319–8656
www.ijcat.com 389
required. There are insufficient actions of ecological parties
and nongovernmental organisations to promote solutions and
measures for waste management. Environmental awareness of
citizens should be continued and intensified and the national
awareness campaign on the importance of selective collection
is still needed to be implemented. [5]
Keeping a close interest in e-waste recycling is important
considering the hazardous substances contained in many of
the products in this waste stream. One key issue is the multi-
criteria nature of the challenge: it is desirable to maximize
reuse of equipment and economic development while
minimizing environmental burdens and economic costs.
3. CONCLUSIONS
Currently, c-waste receives more and more public attention as
it is considered to be one of the fastest-growing waste
streams. This sector operates within a long-established
legislative framework that covers issues such as product
safety, energy labeling, minimum efficiency requirements,
ecodesign and waste. Two Directives (2008/34 and 2008/3 5)
on waste electrical and electronic equipment and the
restriction of the use of certain hazardous substances in
electrical and electronic ‘equipment were introduced in 2008
in order to amend the Directive 2002/96/EC and Directive
2002/95/EC. The EU aims to take measures to prevent the
generation of electrical and electronic waste and to promote
reuse, recycling and other forms of recovery in order to
reduce the quantity of such waste by encouraging
manufacturers to design products with the environmental
impacts in mind throughout their entire life cycle.
In Nigeria, it can be said that environmental issues still evolve
on a rocky path, though with visible signs of improvement. In
order to develop a green agenda in the country, several steps
have been looked at:
• Key stakeholders should be educated in order to
promote a green approach to c-waste and a clean-
tech approach to the environment.
• A set of economic indicators should be publicly
available in order to assess the environmental
impact of e-waste use, e.g. monitoring the
availability of environmental content on the internet
as a measure of the success of awareness-raising
efforts.
• A set of environmental indicators should be
developed in order to assess the impact of c-waste
on the environment, and made publicly available.
• Primary research on c-waste collection and the
environment should be encouraged through funding.
• Romanian environmental protection officials should
be more actively involved in international
discussions taking place at green computing events.
• Civil society organisations should have a more
active role in promoting the green computing
agenda, along with businesses and governmental
agencies.
In conclusion, computers today are an integral part
of individuals’ lives all around the world; but unfortunately
these devices are toxic to the environment given the materials
used, their limited battery life and technological obsolescence.
Individuals are concerned about the hazardous materials ever
present in computers, even if the importance of various
attributes differs, and that a more environment - friendly
attitude can be obtained through exposure to educational
materials. The costs of implementing energy efficiency and
renewable energy measures are minimal as they are not cash
expenditures but rather investments paid back by future,
continuous energy savings. Sustainable innovation,
understood as the shift of sustainable technologies, products
and services to the market, requires a market creation concept
and one common global agenda. The challenge is to raise
awareness among all actors of the different sectors in order to
realize the innovation potential and to shift to eco-innovations
that lead to sustainable consumption and production patterns.
REFERENCES
[1] Liu, Q., Li, K.Q., Zhao, H., Li, G. and Fa, F.Y.
(2009). “The global challenge of electronic waste
management”, Environmental Science Pollution
Research, Vol. 16, pp. 248 - 249.
[2] Seitz, V., Karant, V., Vanti, F., Mihai, O. and
Rizkallah, E. (2013). “Attitudes Regarding Green
Computing: A Step Towards E - Waste Reduction. “
Western Decision Sciences Institute Annual
Meeting, Long Beach, CA, March 18 - 20.
[3] Daedalus, M. 8. (2009). Echipamente electronice si
electrice existente in gospodarii si atitudinea
populatieifata de echipamentele electron ice uzate,
Ecotic. www.ecotic.ro
[4] Ciocoiu N., Burcea S. and Tartlu V. The weee
management system in Nigeria:. dimension,
strengths and weaknesses. Retrived from
http://www.um.ase.ro/no 15/1 .pdf.
[5] Vetter, T. (2009). Measuring the impact of Internet
governance on sustainable development, report
presented in Workshop #304 at the 4th Internet
Governance Forum, Sharm el Sheikh, Egypt, 15-18
November.
International Journal of Computer Applications Technology and Research
Volume 7–Issue 10, 390-397, 2018, ISSN:-2319–8656
www.ijcat.com 390
Assessing the Influence of Green Computing Practices
on Sustainable IT Services
Shedrack Mmeah Department of Computer
Science, Ken Saro Wiwa
Polytechnic, Bori,
Rivers State - Nigeria
Barida Baah
Department of Computer
Science, Ebonyi State
University, Abakaliki –
Nigeria
Abasiama G. Akpan
Department of Computer
Science, Ebonyi State
University, Abakaliki –
Nigeria
Abstract: This study focused on the practice of using computing resources more efficiently while maintaining or increasing overall
performance. Sustainable IT services require the integration of green computing practices such as power management, virtualization,
improving cooling technology, recycling, electronic waste disposal, and optimization of the IT infrastructure to meet sustainability
requirements. Studies have shown that costs of power utilized by IT departments can approach 50% of the overall energy costs for an
organization. While there is an expectation that green IT should lower costs and the firm’s impact on the environment, there has been
far less attention directed at understanding the strategic benefits of sustainable IT services in terms of the creation of customer value,
business value and societal value. This paper provides a review of the literature on sustainable IT, key areas of focus, and identifies a
core set of principles to guide sustainable IT service design.
Keywords: Green Computing, Sustainable IT Services, Optimization, Virtualization, Workload Managements
1. INTRODUCTION Green computing or its alternative “Green IT” have recently
become widely trendy and taken on increased; their
conceptual origin is almost two decades old. In 1991 the
Environmental Protection Agency (EPA) introduced the
Green Lights program to promote energy-efficient lighting.
This was followed by the ENERGY STAR program in 1992,
which established energy- efficiency specifications for
computers and monitors [13, 50]. The swift growth of
Internet-based business computing, often allegorically
referred to as “cloud” computing, and the costs of energy to
run the IT infrastructure are the key drivers of green
computing. Over the last several years the link between
energy use and carbon generation and the desire to lessen both
has given rise to the green computing tag.
Drastically, increased energy use driven by the rapid
expansion of data centres has increased IT costs, and the
resulting environmental influence of IT, to new levels.
Enterprise data centers can easily account for than 50 percent
of a company’s energy bill and approximately half of the
corporate carbon footprint [15, 25].
Although energy use and its associated cost have been the key
driver for green computing, a growing appreciation of the
risks of climate change and increasing concerns about energy
security have elevated green computing to a global issue. The
new administration in the United States has stated intentions
to endorse a “green energy economy” which will likely cap
carbon emissions; increase energy costs, and holds companies
more accountable for their impact on the environment [9].
Due to the immediate influence on business value, it is likely
that green computing will remain focused on reducing costs
while improving the performance of energy- hungry data
centres and desktop computers. However, it is not likely that
this first wave of activity will fully extend to the general
minimization of the ecological footprint of IT products and
services for companies and their customers. Ecological issues
involving IT product and service design, supply chain
optimization, and changes in processes to deal with e-waste,
pollution, usage of critical resources such as water, toxic
materials, and the air shed will need to be more fully
addressed. Although these first-signal activities are driven
more by cost-reduction-based business value there is growing
potential for green IT products and services being the
deciding factor in terms of the intangible benefits of
“greenness” to the customer. Vendors are now able to position
products and services in terms of energy consumption and
lower costs, but the real benefit over time may be in
positioning on environmental and social responsibility of the
company itself [27, 32, 40].
“Sustainable IT” and especially “sustainable IT services” are
terms that are becoming synonymous with an emergent
second signal of green computing innovation. Sustainable IT
strategies are driving sustainability beyond just energy use
and product considerations. This broader approach to
corporate sustainability will necessitate the redesign of the IT
organization and indeed the company itself if the strategic
benefits of green computing are to be realized. This second
signal will include the adoption of ecological strategies that
will redefine markets, spur technological innovation, and lead
to shifts in process, behavior and organizational culture that
will integrate business models with environmental and social
responsibility [9, 32]. These changes are being driven by the
evolving changes in customer requirements from a sole
emphasis on the tangible cost-benefit of reduced energy usage
to increasingly intangible green benefits and cultural issues
motivated by concerns for global warming and climate change
[40].
International Journal of Computer Applications Technology and Research
Volume 7–Issue 10, 390-397, 2018, ISSN:-2319–8656
www.ijcat.com 391
For this paper, we define green computing as the practice of
maximizing the efficient use of computing resources to
minimize environmental impact. This includes the goals of
controlling and reducing a product’s environmental footprint
by minimizing the use of hazardous materials, energy, water,
and other scarce resources, as well as minimizing waste from
manufacturing and throughout the supply chain [1]. Green
computing goals extend to the product’s use over its lifecycle,
and the recycling, reuse, and biodegradability of obsolete
products. We define sustainable IT services1 in broader terms
to include the impact of IT service strategies on the firm’s and
customers’ societal bottom line to include economic,
environmental, and social responsibility criteria for defining
organizational success. Therefore, as defined, green
computing practices inform a company’s sustainable IT
service strategies and process decisions.
The purpose of this paper is to review the current literature on
green computing and its influences on sustainable IT services
with the idea of identifying critical issues and leverage points
to improve customer value, business value, and societal value.
1.2 GREEN COMPUTING: THE FIRST SIGNAL
Since its inception, the IT industry has focused on the
development and deployment of IT equipment and services
that was capable of meeting the ever-growing demands of
business customers. Hence, the emphasis has been on
processing power and systems spending. Less attention was
afforded to infrastructure issues which include energy
consumption, cooling, and space for data centres, since they
were assumed to be always available and affordable. Over the
last decade these issues have become limiting factors in
determining the feasibility of deploying new IT systems,
while processing power is widely available and affordable
[47].
Data centres typically account for 25% of total corporate IT
budgets and their costs are expected to continue to increase as
the number of servers rise and the cost of electricity increases
faster than revenues. One study indicated that the cost of
running data centres is increasing 20% per year on average
[15]. With annual energy costs for computing and cooling
nearly matching the costs for new equipment, data center
expenses can squeeze out investment in new products, make
data intensive products uneconomic, and squeeze overall
margins. The quest for data centre efficiency has become a
strategic issue [15].
The high and increasing use of electricity makes data centres
an important source of greenhouse gases. For information-
intensive organizations, data centres can account for over 50%
of the total corporate carbon footprint. For service firms, data
centers are the primary source of green house emissions. Data
centres, with their high energy costs and increasingly negative
impact on the environment, are the driving force behind the
green computing movement.
1.3 Factors Driving the Adoption of Green Computing
The following trends are impacting data centers, and to a
lesser degree, desktop computers, and driving the adoption of
green-computing practices:
The rapid growth of the Internet
The increasing reliance on electronic data is driving the rapid
growth in the size and number of data centers. This growth
results from the rapid adoption of Internet communications
and media, the computerization of business processes and
applications, legal requirements for retention of records, and
disaster recovery. Internet usage is growing at more than 10
percent annually leading to an estimated 20% CAGR in data
center demand [51]. Video and music downloads, on-line
gaming, social networks, c-commerce, and VoIP are key
drivers. In addition, business use of the Internet has ramped
up. Industries such as financial services (investment, banking,
and insurance), real estate, healthcare, retailing,
manufacturing, and transportation are using information
technology for key business functions [2]. The advent of the
Sarbanes-Oxley Act with its requirement to retain electronic
records has increased storage demand in some industries at 50
percent CAGR [48]. Disaster recovery strategies that mandate
duplicate records increases demand further. Finally, many
federal, state, and local government agencies have adopted c-
government strategies that utilize the Web for public
information, reporting, transactions, homeland security, and
scientific computing [131.
Increasing equipment power density
Although advances in server CPUs have in some cases
enabled higher performance with less power consumption per
CPU, overall server power consumption has continued to
increase as more servers are installed with higher performance
power-hungry processors with more memory capacity [42,
47]. As more servers are installed they require more floor
space. To pack more servers in the same footprint the form
factor of servers has become much smaller, in some cases
shrinking by more than 70% through the use of blade servers.
This increase in packaging density has been matched by a
major increase in the power density of data centers. Density
has increased more than ten times from 300 watts per square
foot in 1996 to over 4,000 watts per square foot in 2007, a
trend that is expected to continue its upward spiral [13, 42, 45,
47].
3. Increasing cooling requirements
The increase in server power density has led to a concomitant
increase in data center heat density. Servers require
approximately 1 to 1.5 watts of cooling for each watt of power
used [16, 24, 39]. The ratio of cooling power to server power
requirements will continue to increase as data center server
densities increase.
Increasing energy costs
Data centre expenditures for power and cooling can exceed
that for equipment over the useful life of a server. For a
typical $4,000 server rated at 500 watts, one study estimated it
would consume approximately $4,000 of electricity for power
and cooling over three years, at $0.08 per kilowatt-hour, and
double that in Japan [2]. The ratio of power and cooling
expense to equipment expenses has increased from

International Journal of Computer Applications Technology and Research
Volume 7–Issue 10, 390-397, 2018, ISSN:-2319–8656
www.ijcat.com 392
approximately 0.1 to 1 in 2000 to I to 1 in 2007 [47]. With the
likely increase in the number of data centers and servers and
the advent of a carbon cap-and-trade scheme, the cost of
energy for data center power and cooling will continue to
increase [26].
Restrictions on energy supply and access
Companies such as Google, Microsoft, and Yahoo with the
need for large data centers may not be able to find power at
any price in major American cities [14]. Therefore, they have
built new data centers in the Pacific Northwest near the
Columbia River where they have direct access to low-cost
hydroelectric power and do not need to depend on the
overtaxed electrical grid. In states such as, California, Illinois,
and New York, the aging electrical infrastructure and high
costs of power can stall or stop the construction of new data
centers and limit the operations of existing centers [24]. In
some crowded urban areas utility power feeds are at capacity
and electricity is not available for new data centers at any
price [10].
Low server utilization rates
Data center efficiency is a major problem in terms of energy
use. The server utilization rates average 5-10 per cent for large
data centers [15]. Low server utilization means that
companies are overpaying for energy, maintenance,
operations support, while only using a small percentage of
computing capacity [9].
Growing awareness of IT’s impact on the
environment
Carbon emissions are proportional to energy usage. In 2007
there were approximately 44 million servers worldwide
consuming 0.5% of all electricity. Data centers in the server-
dense U.S. use more than 1% of all electricity [10]. Their
collective annual carbon emissions of 80 metric megatons of
CO2 are approaching the carbon footprint of the Netherlands
and Argentina [15]. Carbon emissions from operations are
expected to grow at more than 11% per year to 340 metric
megatons by 2020. In addition, the carbon footprint of
manufacturing the IT product is largely unaccounted for by IT
organizations [15].
1.3 Implementing Green Computing Strategies
Transitioning to green computing has involved a number of
strategies to optimize the efficiency of data center operations
in order to lower costs and to lessen the impact of computing
on the environment. The transitioning to a green data center
involves a mix of integrating new approaches for power and
cooling with energy-efficient hardware, virtualization,
software, and power and workload management [10].
Data center infrastructure
Infrastructure equipment includes chillers, power supplies,
storage devices, switches, pumps, fans, and network
equipment. Many data centers are over ten years old. Their
infrastructure equipment is reaching the end of its useful life.
It is power hungry and inefficient. Such data centers typically
use 2 or 3 times the amount of power overall as used for the
IT equipment, mostly for cooling [10]. The obvious strategy
here has been to invest in new data centers that are designed
to be energy efficient or to retrofit existing centers.
Power and workload management
Power and workload management software could save $25-75
per desktop per month and more for servers [50]. Power
management software adjusts the processor power states (P-
states) to match workload requirements. It makes full use of
the processor power when needed and conserves power when
workloads are lighter. Some companies are shifting from
desktops to laptops for their power- management capabilities.
Thermal load management
Technology compaction in data centers has increased power
density and the need for efficient heat dissipation. Power use
by ventilation and cooling systems is on par with that of
servers. Typical strategies for thermal management are
variable cooling delivery, airflow management, and raised-
floor data center designs to ensure good air flow, more
efficient air conditioning equipment, ambient air, liquid heat
removal systems, heat recovery systems, and smart
thermostats [10, 39].
Product design
For example, microprocessor performance increased at
approximately 50% CAGR from 1982 to 2002. However,
performance increases per watt over the same period were
modest. Energy use by servers continued to rise relatively
proportionally with the increase in installed base [13]. The
shift to multiple cores and the development of dynamic
frequency and voltage scaling technologies hold great promise
for reducing energy use by servers. Multiple-core
microprocessors run at slower clock speeds and lower
voltages than single-core processors and can better leverage
memory and other architectural components to run faster
while consuming less energy. Dynamic frequency and voltage
scaling features enable microprocessor performance to ramp
up or down to match workloads. Moving beyond
microprocessors, the energy proportional computing concept
takes advantage of the observation that servers consume
relatively more energy at low levels of efficiency than at peak
levels [3]. Therefore, the goal is to design servers that
consume energy in proportion to the work performed. Since
microprocessors have more quickly acquired energy-saving
capabilities, it is expected that CPUs will consume relatively
less energy than other components. Therefore, it will be
necessary for major improvements in memory, disk drives,
and other components to reduce their power usage at higher
levels of utilization. Energy proportionality, which promises
to double server efficiency with the potential for large energy
savings for data centers, should become a primary goal for
equipment designers [3].
Virtualization
Virtualization has become a primary strategy for addressing
growing business computing needs. It is fundamentally about
IT optimization in terms energy efficiency and cost reduction.
It improves the utilization of existing IT resources while
reducing energy use, capital spending and human resource
costs [30, 37]. Data center virtualization affects four areas:
server hardware and operating systems, storage, networks, and
application infrastructure. For instance, virtualization enables
increased server utilization by pooling applications on fewer
servers. Through virtualization, data centers can support new
applications while using less power, physical space, and labor.
International Journal of Computer Applications Technology and Research
Volume 7–Issue 10, 390-397, 2018, ISSN:-2319–8656
www.ijcat.com 393
This method is especially useful for extending the life of older
data centers with no space for expansion. Virtual servers use
less power and have higher levels of efficiency than
standalone servers [3].
Virtualization technology was originally developed by IBM
(as CP/CMS in the 1960’s) to increase the utilization
efficiency of mainframes. More recently the concept has been
applied to x86 servers in data centers. With the use of a
hardware platform virtualization program called a hypervisor,
or virtual machine monitor (VMM), multiple operating
systems can run concurrently on a host computer. The
hypervisor controls access to the server’s processor and
memory and enables a server to be segmented into several
“virtual machines”, each with its own operating system and
application. For large data centers, server usage ranges from
5-10 percent of capacity on average. With virtualization,
server workloads can be increased to 50-85 percent where
they can operate more energy efficiently [3]. Less servers are
needed which means smaller server footprints, lower cooling
costs, less headcount, and improved manageability.
Cloud computing and cloud services
As Internet-based computing centralizes in the data center,
software technology has advanced to enable applications to be
used where and when needed. The term “cloud computing”
refers to a computing model that aims to make high-
performance computing available to the masses over the
Internet [35]. Cloud computing enables developers to create,
deploy, and run easily scalable services that are high
performance, reliable, and free the user from location and
infrastructure concerns [31]. The “cloud” has long been a
metaphor for the Internet. When combined with “computing”
the definition turns to services [23].
As cloud computing continues to evolve it has increasingly
taken on service characteristics. These services include utility
computing, software as a service (SaaS), platform as a service
(PaaS), and infrastructure as a service (IaaS).
• Utility computing: The first cloud services were developed
by companies such as Amazon.com, Sun, and IBM that
offered virtual servers and storage that can be accessed on
demand. This is often described as an updated version of
utility computing—essentially virtual computing capacity
where users pay for what they use when they need it. Early
adopters used this service for supplemental and non mission-
critical needs. This model could be extended to include virtual
data centers as a virtual resource pool [23].
• SaaS: This implementation of cloud computing delivers
applications through a browser interface to thousands of
customers using a multitenant architecture [17, 23, 34].
Salesforce.com is perhaps the best known of the SaaS
companies with applications in sales force automation, CRM,
human resources, and supply chain management. More
recently, Google has adopted a SaaS model for its
GoogleApps and Zoho Office [23]. The benefits for customers
include: no upfront investment in infrastructure, servers, or
software licenses; reduced operating expenses, end-to end
business processes integrated with services
anywhere/anytime; dynamically scalable infrastructure, SLAs
for composite services, mobile device and sensor control,
access to leading-edge technology, and less environmental
impact (34].
• PaaS: An outgrowth of the SaaS model, PaaS delivers
development environments as a service [23]. The model
provides the required resources to support the entire life cycle
for developing and delivering web applications and services
over the Internet. Developers can essentially create their own
applications as a service that will run on the provider’s
platform and are delivered to their customers from the
provider’s servers. Leading PaaS companies are Force.com,
Google AppEngine, and Microsoft Azure. The primary
advantages are the speed and low cost that can be achieved for
development and deployment [46].
•IaaS: This cloud offering provides basic infrastructure, such
as servers, storage, clients, and networking as an on demand
service. Leading IaaS companies include Amazon Web
Services, GoGrid, and Flexiscale [43].
• Total power consumption: In a recent study, this metric
was the most popular with 68% of IT managers specifying its
use. The cost of power and the volume of kilowatts used are
typically included in the baseline assessment [9]. This metric
can be useful in tracking power usage by facility, function,
application, and employee. Accountability for electricity
usage by IT organizations has been highlighted since it is a
cost that can easily be tracked and it is a large part of the IT
budget. Making power cost a discrete line item in the IT
budget invites action to become more efficient and generate
cost savings.
• Power usage effectiveness (PUE): PUE is equal to Total
Facility Power/IT Equipment Power. IT equipment power is
defined as the load associated with computers, storage,
network equipment and peripherals [33, 44]. Total facility
power is the total power measured at the utility meter. A PUE
of 2.0 indicates that data center demand is twice as high as the
power necessary to power the IT equipment. A PUE value of
1.0 would indicate 100% efficiency with all power consumed
by IT equipment.
• Data center infrastructure efficiency (DCiE). DCiE =
1/PUE: This ratio is equivalent to the PUE. In the above
example IT equipment uses 50% of the power in the data
center. The other 50% is of power demand is typically
required for cooling. As IT equipment uses less energy pay as
you go, access to the latest technology, faster service delivery
and time to market.
1.4 Green Computing Metrics
Power-related metrics currently dominate green computing.
Several energy-efficiency related metrics have been proposed
to help IT organizations understand and improve the
efficiency of data centers. Table 1 presents summarizes the
most widely used benchmarks per unit of performance, then
less energy is needed for cooling and DCiE will move higher
[33].
• Data center performance efficiency (DCPE). DCPE
Useful Work/Total Facility Power. This ratio is informed by
PUE and DCiE. However, it is much more complex to define
and measure “useful work” performance as a standard metric
[44].
International Journal of Computer Applications Technology and Research
Volume 7–Issue 10, 390-397, 2018, ISSN:-2319–8656
www.ijcat.com 394
• Other energy efficiency benchmarks: An alternate
approach to energy efficiency monitory at the data center level
is to build energy efficiency into the initial design of
components and systems and to adaptively manage system
power consumption in response to changes in workload and
environment [36]. These benchmarks include Analysis tool,
Energy Bench, SWaP, Energy Star, SPEC Power, and
JouleSort.
2. Environmental Impact
• Carbon footprint: Regulations to reduce green house gas
emissions worldwide will likely be forthcoming soon as a
carbon tax or cap and trade scheme is being considered by the
U.S. government and the Intergovernmental Panel on Climate
Change (IPCC). Already some businesses are requesting that
their partners provide information on carbon dioxide
production [6]. One emerging strategy is to purchase
electricity from renewable energy sources such as wind, solar,
or hydro. Google has adopted this strategy, although the low-
cost hydro energy it has tapped into has significant
environmental drawbacks that offset its attractiveness long
term [20]. The key metric here is the volume of carbon
dioxide that is produced by various business processes and
products—the carbon footprint.
2.0 SUSTAINABLE IT SERVICES: THE
SECOND SIGNAL Sustainable IT services are essential to business success.
There is increasing pressure to adopt sustainable business
practices. Sustainable IT services are not only about the first-
wave green computing focus on data-center efficiency or how
to minimize carbon footprints. It is squarely focused on the
long-term importance of IT to the organization, its customers
and to society at large—all second-wave sustainability issues.
Therefore, sustainable IT is about everything an organization
needs to do to ensure that IT services delivers superior value
to attain a strong market position and to ensure its ability to
survive. It is about aligning IT with business strategy to
achieve market-leading business value, customer value and
societal value. This will ensure the viability of the IT
organization itself. There are several elements that comprise
sustainable IT services [7].
• Service sustainability: At a minimum, this includes
effective and reliable processes for delivering IT
services. It is about managing performance and
doing what is necessary to keep the service running
smoothly such as constant security, systems
recovery planning, and keeping versions current [7].
• Temporal sustainability: To sustain IT services
over time an organization has to start with a clear
understanding of the value that is to be created. It
must have a strong business case, be responsive to
business conditions, and create value for the
customer and society, as well as the business [7].
• Cost sustainability: This includes acquisition and
operating costs such as the choice of low cost
hardware and software that also offer benefits such
as low power consumption and ensure high levels of
resource utilization. Life cycle management and
replacement costs are also important consideration
[7, 11, 28].
• Organizational sustainability: Organizational
change is inevitable. Whether it derives from
personnel changes or major changes in technology,
markets, or mergers and acquisitions, IT services
must continue to operate and innovate. Well
managed systems with good documentation and
training are more able to manage change [7].
• Environmental sustainability: In an ecological
context, IT services must be able deliver customer
and business value while ensuring that the Earth’s
resources are being used at a rate that ensures
replenishment. In essence, the goal for
environmental sustainability is for IT services to be
able to meet the needs of the present without
compromising the ability of future generations to
meet their needs [40].
We define sustainable IT services from a total societal value
perspective as the aggregate value available to society from
the systematic integration and alignment of the individual IT
service components for the purpose of creating superior
societal value. Therefore, all aspects of IT services must meet
societal goals for sustainability while meeting customer and
business value goals in terms of economic, environmental,
and social responsibility requirements [38].
From Business Value to Customer Value to
Societal Value
Business value is the overall benefit for business units and the
enterprise as a whole that results from IT solutions or
services. Business value is evidenced by increases in revenue
or market position that derive from meeting customer
requirements, providing customer savings or ROI, and making
investments in innovation that advance the industry as a
whole [1, 43]. Although this definition does recognize the
customer and the industry at large, the overall focus of
business value is to provide returns to the company. As such,
business value often focuses on short-term, cost-based
solutions that can overlook the long-term best interests of the
customer, society, and resultantly, the business as well. The
first wave focus on green computing, with its primary
emphasis on cutting energy costs, can certainly increase
business value, while increasing customer and societal value
(carbon reductions). However, the short-term focus on costs
cannot ensure that benefits to the customer and society will
continue to be realized over the long term. A sole focus on
creating business value is not sufficient for a sustainable IT
services orientation.
Customer value is the overall benefit derived from a product
or service, as the customer perceives it, at the price the
customer is willing to pay [21, 22, 41]. A focus on customer
value requirements forces companies to look to the markets
and the customer as the core drivers of business activity. With
this external focus, customer value is a broader concept than
the mostly inward looking business value. IT service
providers must first understand how their customers perceive
value in terms of the perceived benefits perceived and the
International Journal of Computer Applications Technology and Research
Volume 7–Issue 10, 390-397, 2018, ISSN:-2319–8656
www.ijcat.com 395
perceived price of the service that delivers those benefits [21].
It is necessary to understand what these tradeoffs are and how
they might influence service configurations that can maximize
customer value and business outcomes. The power of choice
will ensure that those configurations that deliver superior
value will also achieve superior business value. However, a
short-term focus on customer value, which is the default
approach given short product lifecycles and competitive
pressures, is not sufficient for a sustainable IT services
orientation. Some customers are willing to look at their long-
term needs in a societal context, but for most consumers cost
and performance are the dominant drivers [9].
The concept of societal value holds that companies should
meet their market goals in such a way that enhances the
customer’s and the society’s long-term well being. In that
way, customer value and business value will be maximized as
well. Societal value calls upon organizations to build ethical,
social responsibility, and environmental considerations into
their business practices. Therefore, companies must balance
profits, customer requirements, and social responsibility in
their business models. These goals are often in conflict and
successful sustainable IT strategies should provide a roadmap
for their alignment [38, 40].
Toward a Framework for Sustainable IT
Services
Although the need for the development of strategies to
address the environmental sustainability of IT services has
been apparent for many years, there is no extant body of
literature on strategies or best practices. The issues
surrounding the first wave of green computing are clearer and
focused on reducing energy costs through new data center
designs, architectures, facility and server density, and
virtualization. Beyond that, companies are approaching
sustainability through a fragmented incremental “greener IT”
approach [8].
Cost optimization was the primary emphasis of the first wave
of green computing. Problems and solutions associated with
green computing are well known. The second wave, which we
call sustainable IT, or more appropriately, sustainable IT
services, has a much broader focus on the role of IT in the
society. The primary driver of sustainable IT is corporate
social responsibility (CSR), especially as it applies to firm’s
impact on the economy, environment, and society at large
[52].
3.0 CONCLUSION
Sustainable IT has been a major focus for IT organizations for
the past decade as the cost of power for data centers has risen
rapidly. The focus of the first wave of sustainable IT
initiatives has been on strategies to increase data center
efficiency. Therefore, infrastructure, power and workload
management, thermal management, product design,
virtualization, and cloud computing strategies have assumed
primacy in terms of both strategic and tactical focus. The
second wave of sustainable IT services is nascent and much
more difficult to define and implement. It involves defining
the role of the IT organization in an enterprise’s overall CSR
strategy. It will involve establishing a roadmap and baseline
metrics, redesigning business processes, encouraging
participation, and adapting the organization’s culture to new
ways of doing things [49]. IT governance and decision
making will likely be substantially impacted.
This paper offered a review of current thinking and suggested
factors that should be considered for a sustainable IT strategy.
Future research should address the relationship between
customer value, business value, and societal value and how
sustainable IT strategies will impact each. It would seem that
these concepts should be mutually supportive. However,
many business professionals view them to be at odds with
each other, or at least to involve tradeoffs that may not always
be beneficial for the company. More research is needed to
fully understand the market impact of a sustainable IT
services strategy. Beyond cost savings are there benefits from
sustainability oriented business strategies that customers are
willing to pay for? Does sustainability for IT services create
competitive advantage? Finally, a model for the development
and implementation of sustainable IT services needs to be
developed. This model will likely involve the integration of
the IT organization’s sustainability initiatives with the
enterprise-level model and throughout the corporate
ecosystem.
REFERENCES [1] Akpan, A. G and Onu, F. U. (2016). Carbon
Footprint and Nigerian Banks: Exploring Factors of
Green Computing Adoption in Data Centres. Nexus
Journal of Science and Energy Studies. Vol. 5, no.3,
pp. 166 – 172.
[2] Baldwin, E. and M. Curley. Managing IT
Innovation for Business Value, Intel Press, 2007.
[3] Bailey, M., M. Eastwood, T. Grieaer, L. Borovick,
V. Turner, and R.C. Gray. Special Study: Data
Center of the Future, New York: IDC 06C4799,
2007.
[4] Barroso, L. A. and U. Hblze. “The Case for
Energy-Proportional Computing,” IEEE Computer
Society, December, pp. 33-37, 2007.
[5] Barreto, L., H. Anderson, A. Anglin, and C.
Tomovic. “Product Lifecycle Management in
Support of Green Manufacturing: Assessing the
Challenges of Global Climate Change,” Proceedings
of the International Conference on Comprehensive
Product Realization 2007 (ICCPR2007), June 18-
20, Beijing, 2007.
[6] Belady, C. L. “In the Data Center, Power and
Cooling Costa More Than the IT Equipment it
Supports,” Electronics Cooling, February, 2007.
[7] Butner, K., D. Geuder, and J. Hittner. ‘Mastering
Carbon Management: Balancing Trade-Offs to
Optimize Supply Chain Efficiencies,” Supply Chain
Management, IBM Institute for Business Value, pp.
1-13, 2008.
[8] Clifford, A., “Sustainable IT,” It toolbox, com:
Project Management Community, 2009, Retrieved
February 25, 2009 from:
International Journal of Computer Applications Technology and Research
Volume 7–Issue 10, 390-397, 2018, ISSN:-2319–8656
www.ijcat.com 396
htto://it.toolbox.com./blogs/minimalit/sustainable-it-
30 157
[9] Daoud, D. “Beyond Power: IT’s Roadmap to
Sustainable Computing,” IDC Whitepaper, October
2008, www.idc.com.
[10] Deloitte Touch Tohmatsu. “The Next Wave of
Green IT,” CFO Research Services, Boston: CFO
Publishing Corp, 32 pages, January 2009.
[11] Dietrich, J. and R. Schmidt. “The Green Data
Center,” IBM Global Services, white paper, 21
pages, May 2007.
[12] Dubie, D. “How to Cut IT Costs With Less Pain,”
Network-world, pp.11,40, January 26, 2009.
[13] Elkington, J. Cannibals with Forks: Triple Bottom
Line of2l” Century Business, Oxford: Capstone
Publishing Ltd. 1999.
[14] Fanara, A. ‘Report to Congress on Server and Data
Center Efficiency: Public Law 109-431, U.S.
Environmental Protection Agency: Energy Star
Program, 133 pages, 2007. Retrieved February 25,
2009 from
http://www.energystar.gov/ia!partners/prod
development/downloads/E PA Datacenter Report
Congress Final I .pdf
[16] Foley, J., “Google in Oregon: Mother Nature Meets
the Data Center,” Information Week’s Google
Weblog, August 24, 2007.
[I6] Forrest, W., J. M. Kaplan, and N. Kindler, “Data
Centers: How to Cut Carbon Emissions and Costs,
The McKinsey Quarterly, Number 14, Winter 2008.
[17] Goodin, D., “IT Confronts the Datacenter Power
Crisis,” Info World, October 6, 2006,
www.infoworId.com.
[18] Guptill, B. and W. S. McNee, “SaaS Sets the Stage
for Cloud Computing,” Financial Executive, pp. 37-
44, June 2008.
[19] Hanselman, S. E. and M. Pegah. “The Wild Wild
Waste: e-Waste,” SIGUCCS ‘07, pp. 157-162.
October 7-10, 2007.
[20] Harmon, R. R. and K. R. Cowan. “A Multiple
Perspectives View of the Market Case for Green
Energy,” Technological Forecasting & Social
Change, 76, Pp.204-213,2009.
[21] Harmon, R. R., H. Demirkan, B. Hefley, and N.
Auseklis. “Pricing Strategies for Information
Technology Services: A Value-Based Approach,”
Proceedings of the 42” Hawaii International
Conference on System Sciences (HJCSS-42), 10
pages, CD-ROM, IEEE Computer
Society, January 2009.
[22] Harmon, R. R. and G. Laird. “Linking Marketing
Strategy to Customer Value: Implications for
Technology Marketers,” In Kocaoglu, et al (Eda.)
Innovation in Technology Management, Portland,
OR: PICMET/IEEE, Pp. 897-900, 1997.
[23] Knorr, E. and G. Gruman. “What Cloud Computing
Really Means,” Info World, April 7, 2008,
www.inforworld.com.
[24] Lawton, G., “Powering Down the Computing
Infrastructure,” Computer, Vol.40(2), pp. 16-19,
February 2007.
[25] Mckeefry, H. L. “A high-energy Problem,” eWeek,
March 2008.
[26] Mitchell, R. L. “Power Pinch in the Data Center,”
Computer World, April 30, 2007,
www.computerworld.com
[27] Murugesan, S. “Harnessing Green IT: Principles
and Practices.” IT Professional. pp. 24-33, January-
February 2008.
[28] Nagata, S. and Shoji O. “Green Process Aiming at
Reduction of Environmental Burden,” Fujitsu
Science and Technology Journal, 41(2), pp. 25 1-
258, July 2005.
[29] Olson, G. “Creating an Enterprise-level Green
Strategy, Journal of Business Strategy, 29(2), pp.
22-30, 2008.
[30] Ou, G., “Introduction to Server Virtualization,”
Techrepublic.com, 5 pages, May 22, 2006.
[31] Perry, G. “How Cloud & Utility Computing are
Different,” GigaOM, February 28, 2008. Retrieved
March 5, 2009 from:
htto://gigaom.com!2008/02/28/how-cloud-utility-
computing-are- different!
[32] Pohle, G. and J. Hittner. “Attaining Sustainable
Growth through Corporate Social Responsibility,”
IBM Institute for Business Value, White paper, 20
pages, 2008, www.ibm.com.
[33] Rawson, A., J. Pfleuger, and T. Cader. Green Grid
Data Center Power Efficiency Metrics: PUE and
DCiE, The Green Grid, Whitepaper No. 6, C.
Belady (Ed.), 9 pages, 2008.
[34] Reid, C. K. “SaaS: The Secret Weapon for Profits
(and the planet)” Econtent Magazine, pp. 24-29,
January-February, 2009.
[35] Ricadela, A. “Computing Heads for the Clouds,”
Business Week, November 16, 2007,
www.businessweek.com.
[36] Rivoire, S., M. A. Shah, P. Ranganathan, C.
Kozyrakis, and J. Meza. “Models and Metrics to
Enable Energy-Efficiency Optimizations,” IEEE
Computer Society, Pp. 39-48, December 2007.
[37] Ryder, C. “Improving Energy Efficiency through
Application of Infrastructure Virtualization:
Introducing IBM WebSphere Virtual Enterprise,”
The Sagezo Group Whitepaper, 13 pages, April
2008.
[38] Savitz, A. and K. Weber. The Triple Bottom Line:
How Today’s Best- Run Companies Are Achieving
Economic, Social and Environmental Success—and
How You Can Too, San Francisco: Josey-Bass
Publishers, 2006.
[39] Schmidt, R. R. and H. Shaukatallah. “Computer and
Telecommunication Equipment Room Cooling: A
Review of the Literature,” 2002 IEEE Inter Society
Conference on Thermal Phenomena, Pp. 751-766,
2002.
International Journal of Computer Applications Technology and Research
Volume 7–Issue 10, 390-397, 2018, ISSN:-2319–8656
www.ijcat.com 397
[40] Senge, P., B. Smith, N. Kruschwitz, J. Laur, and S.
Schley. The Necessary Revolution: How
Individuals and Organizations are Working to
Create a Sustainable World, New York: Double
Day, 2008.
[41] Sheth, J. N., Newman, B.l, and Gross, B.L.
Consumption Values and Market Choices: Theory
and Applications, Cincinnati, OH: Southwestern
Publishing Company, 1991.
[42] Stanford, E. “Environmental Trends and
Opportunities for Computer System Power
Delivery,” Proceedings of the 20” International
Symposium on Power Semiconductor Devices &
ICs, pp. 1-3, May 18-22, 2008.
[43] Sward, D. Measuring the Business Value of
Information Technology, Intel Press, 2006
[44] The Green Grid. “Get a Grip on Your Data Center
Power Efficiency,” Power Management Design
Line, 7 pages, June 7, 2007.
wwwpowermanagementdesienline.com
[45] Torres, J., D. Carrera, K. Hogan, R. Gavalds, V.
Beltran, and N. Poggi. “Reducing Wasted
Resources to Help Achieve Green Data Centers,”
IEEE International Symposium on Parallel and
Distributed Processing 2008, April 1-8, 2008.
[46] Urquhart, J. “Finding Distinction in ‘Infrastructure
as a Service,” The Wisdom of Clouds — CNET
News, January 11, 2009. Retrieved February 25,
2009 from: http’//news.cnet.comJ83Ol-194I3 3- I
0l40278-240.html
[47] Wang, D. “Meeting Green Computing Challenges,”
Proceeding of the International Symposium on High
Density Packaging and Microsyslem Integration,
2007 (HDP ‘07), IEEE, 2007.
[48] Warmenhoven, D. “Three Years Later: A Look at
Sarbanes-Oxley, Forbes, July 27, 2005.
[49] Wellsands, S. and S. Snyder. “Building a Long-
Term Strategy for IT Sustainability,” Intel
Information Technology, White paper, 12 pages,
April 2009. Retrieved April 26, 2009 from
http://communities.intel .com/
community/openportit/it
[50] Wilbanks, L. “Green: My Favorite Color,” IT
Professional, pp. 63-64, November-December,
2008.
[51] Wong, H., “EPA Datacenter Study IT Equipment
Feedback Summary,” Intel Digital Enterprise
Group, Cited in: Report to Congress on Server and
Data Center Efficiency Public Law 109-43 1, U.S.
EPA Energy Star Program, August 2, 2007.
[52] Zarella, E. “Sustainable IT: The Case for Strategic
Leadership,” KPMG IT Advisory, White paper, 24
pages, 2008. www.kome.com.
International Journal of Computer Applications Technology and Research
Volume 7–Issue 10, 398-406, 2018, ISSN:-2319–8656
www.ijcat.com 398
Text Mining in Digital Libraries using OKAPI BM25 Model
Gesare Asnath Tinega1
Student SCIT,
JKUAT
Nairobi, Kenya
Prof. Waweru Mwangi2
Associate Professor SCIT,
JKUAT
Nairobi, Kenya
Dr. Richard Rimiru3,
Senior Lecturer SCIT, JKUAT
Nairobi, Kenya
Abstract: The emergence of the internet has made vast amounts of information available and easily accessible online. As a result,
most libraries have digitized their content in order to remain relevant to their users and to keep pace with the advancement of the
internet. However, these digital libraries have been criticized for using inefficient information retrieval models that do not perform
relevance ranking to the retrieved results. This paper proposed the use of OKAPI BM25 model in text mining so as means of
improving relevance ranking of digital libraries. Okapi BM25 model was selected because it is a probability-based relevance ranking
algorithm. A case study research was conducted and the model design was based on information retrieval processes. The performance
of Boolean, vector space, and Okapi BM25 models was compared for data retrieval. Relevant ranked documents were retrieved and
displayed at the OPAC framework search page. The results revealed that Okapi BM 25 outperformed Boolean model and Vector Space
model. Therefore, this paper proposes the use of Okapi BM25 model to reward terms according to their relative frequencies in a
document so as to improve the performance of text mining in digital libraries.
Keywords: Online Public Access Catalogs, Relevance Ranking, Digital Libraries, Okapi BM25 Model, Text Mining, Information
Retrieval Models
1. INTRODUCTION The internet and information technology evolution has
drastically transformed information development and access,
especially in the library sector thus disrupting the
functionality of libraries. As a result, majority of the libraries
have digitized their content in order to remain relevant and
exist in distributed networks [11]; [7]. Users are now using
Public Access Catalogs (OPAC) to search and retrieve
information from the digital library’s database [5]. Khiste,
Deshmukh & Awate [8] defined digital libraries as huge
collection of electronic information that can be accessed by
distributed users from different locations. In their study
Dwivedi; Sharma & Patel, defined OPAC as a library catalog
that displays a large collection of materials held by a database
in which users search to access the desired documents
available at a library by using in search terms such as the
author, title, subject/keyword, or date of publications of the
material [5]; [17].
However, studies reveal that digital libraries are still losing to
other online search engines such as Amazon despite the
efforts to transform library catalogs from traditional card
cataloging to digital cataloging using Open Public Access
Catalogs (OPACs). This is so because the results retrieved at
the library's OPAC catalog does not satisfy the users need. Kumar & Vohra [9] explains that the majority of OPACs
requires exact search terms to perform relevancy ranking
otherwise they will display the 'no output/null retrieval in the
results section. Others simply rank the results using last
in/first out. The most cataloged items will show up ending up
not meeting the expectations of the user. The digital libraries’
OPAC use the Boolean model for information retrieval which
retrieves too many or too little of the documents. These causes
havoc to users when searching relevant results. It is therefore
in the interest of the researcher, to establish how to improve
search capabilities in the digital libraries by implementing the
Okapi BM25 algorithm in order to improve relevance ranking
in the online public access catalogs (OPACs) before the
results are displayed to the user. The Okapi BM25 model is
based on the term frequency, length normalization to improve
the relevance performance of the digital libraries especially
during retrieval.
2. LITERATURE REVIEW
2.1 Digitization Information and communication technology (ICT) in libraries
and many organizations has led to the increase of soft data
and digitization of materials [10]. Materials are digitalized to
improve their online accessibility, sorting, transmission and
retrieval. Digitization refers to the process of converting print
media to the digital content for electronic storage, access, and
distribution among users [3]. The digitization process has
facilitated storage and enhanced ease manipulation of the
traditionally digitized content by researchers [25]. The process
has further decentralized information storage therefore
making information in the digital libraries readily accessible
from anywhere anytime around the globe.
2.1.1 OPAC catalog Online public access catalog is one of the most important
tools that contain all the bibliographic collection of documents
stored in the digital library database [19]. The frequent use of
the internet among the researchers has slowed the usage of the
library catalogs since they lack most of web 2.0 features such
as relevancy ranking [12]. The huge unstructured and
amorphous data available in the digital library databases has
on the other hand made it difficult for developers to come up
with algorithms for enhancing successful information retrieval
that matches the user queries [3]. In their study Kumar &
Vohra [9] established that 12.5 % of the library users at Guru
Nanak Dev University found the OPAC catalogue to be slow
and complicated to use thus they needed help from librarians.
Current generations of library users are not satisfied with the
results that the catalog retrieves because they display either
too many or too little documents in a given search. The recent
developments of the newer catalogs by organizations outside
of libraries have resulted in vocal criticisms about the
capability of digital libraries especially on relevance ranking
[1].
International Journal of Computer Applications Technology and Research
Volume 7–Issue 10, 398-406, 2018, ISSN:-2319–8656
www.ijcat.com 399
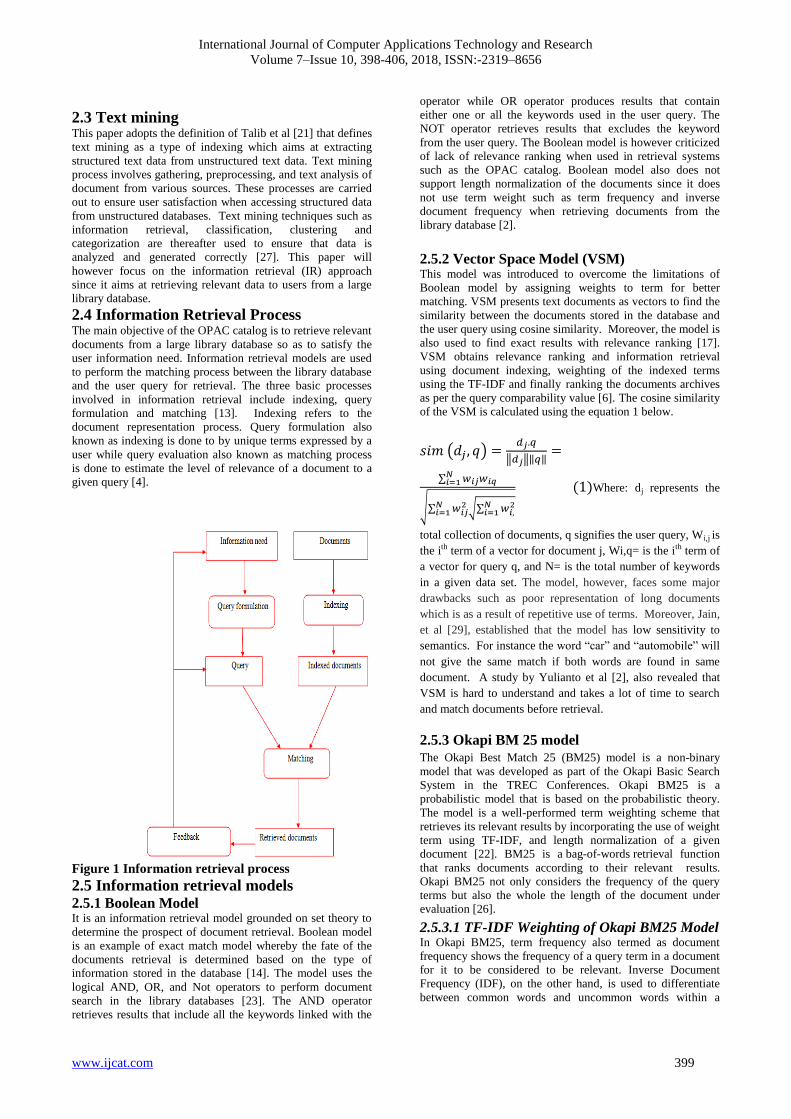
2.3 Text mining This paper adopts the definition of Talib et al [21] that defines
text mining as a type of indexing which aims at extracting
structured text data from unstructured text data. Text mining
process involves gathering, preprocessing, and text analysis of
document from various sources. These processes are carried
out to ensure user satisfaction when accessing structured data
from unstructured databases. Text mining techniques such as
information retrieval, classification, clustering and
categorization are thereafter used to ensure that data is
analyzed and generated correctly [27]. This paper will
however focus on the information retrieval (IR) approach
since it aims at retrieving relevant data to users from a large
library database.
2.4 Information Retrieval Process The main objective of the OPAC catalog is to retrieve relevant
documents from a large library database so as to satisfy the
user information need. Information retrieval models are used
to perform the matching process between the library database
and the user query for retrieval. The three basic processes
involved in information retrieval include indexing, query
formulation and matching [13]. Indexing refers to the
document representation process. Query formulation also
known as indexing is done to by unique terms expressed by a
user while query evaluation also known as matching process
is done to estimate the level of relevance of a document to a
given query [4].
Figure 1 Information retrieval process 2.5 Information retrieval models 2.5.1 Boolean Model It is an information retrieval model grounded on set theory to
determine the prospect of document retrieval. Boolean model
is an example of exact match model whereby the fate of the
documents retrieval is determined based on the type of
information stored in the database [14]. The model uses the
logical AND, OR, and Not operators to perform document
search in the library databases [23]. The AND operator
retrieves results that include all the keywords linked with the
operator while OR operator produces results that contain
either one or all the keywords used in the user query. The
NOT operator retrieves results that excludes the keyword
from the user query. The Boolean model is however criticized
of lack of relevance ranking when used in retrieval systems
such as the OPAC catalog. Boolean model also does not
support length normalization of the documents since it does
not use term weight such as term frequency and inverse
document frequency when retrieving documents from the
library database [2].
2.5.2 Vector Space Model (VSM) This model was introduced to overcome the limitations of
Boolean model by assigning weights to term for better
matching. VSM presents text documents as vectors to find the
similarity between the documents stored in the database and
the user query using cosine similarity. Moreover, the model is
also used to find exact results with relevance ranking [17].
VSM obtains relevance ranking and information retrieval
using document indexing, weighting of the indexed terms
using the TF-IDF and finally ranking the documents archives
as per the query comparability value [6]. The cosine similarity
of the VSM is calculated using the equation 1 below.
Where: dj represents the
total collection of documents, q signifies the user query, Wi,j is
the ith term of a vector for document j, Wi,q= is the ith term of
a vector for query q, and N= is the total number of keywords
in a given data set. The model, however, faces some major
drawbacks such as poor representation of long documents
which is as a result of repetitive use of terms. Moreover, Jain,
et al [29], established that the model has low sensitivity to
semantics. For instance the word “car” and “automobile” will
not give the same match if both words are found in same
document. A study by Yulianto et al [2], also revealed that
VSM is hard to understand and takes a lot of time to search
and match documents before retrieval.
2.5.3 Okapi BM 25 model
The Okapi Best Match 25 (BM25) model is a non-binary
model that was developed as part of the Okapi Basic Search
System in the TREC Conferences. Okapi BM25 is a
probabilistic model that is based on the probabilistic theory.
The model is a well-performed term weighting scheme that
retrieves its relevant results by incorporating the use of weight
term using TF-IDF, and length normalization of a given
document [22]. BM25 is a bag-of-words retrieval function
that ranks documents according to their relevant results.
Okapi BM25 not only considers the frequency of the query
terms but also the whole the length of the document under
evaluation [26].
2.5.3.1 TF-IDF Weighting of Okapi BM25 Model In Okapi BM25, term frequency also termed as document
frequency shows the frequency of a query term in a document
for it to be considered to be relevant. Inverse Document
Frequency (IDF), on the other hand, is used to differentiate
between common words and uncommon words within a
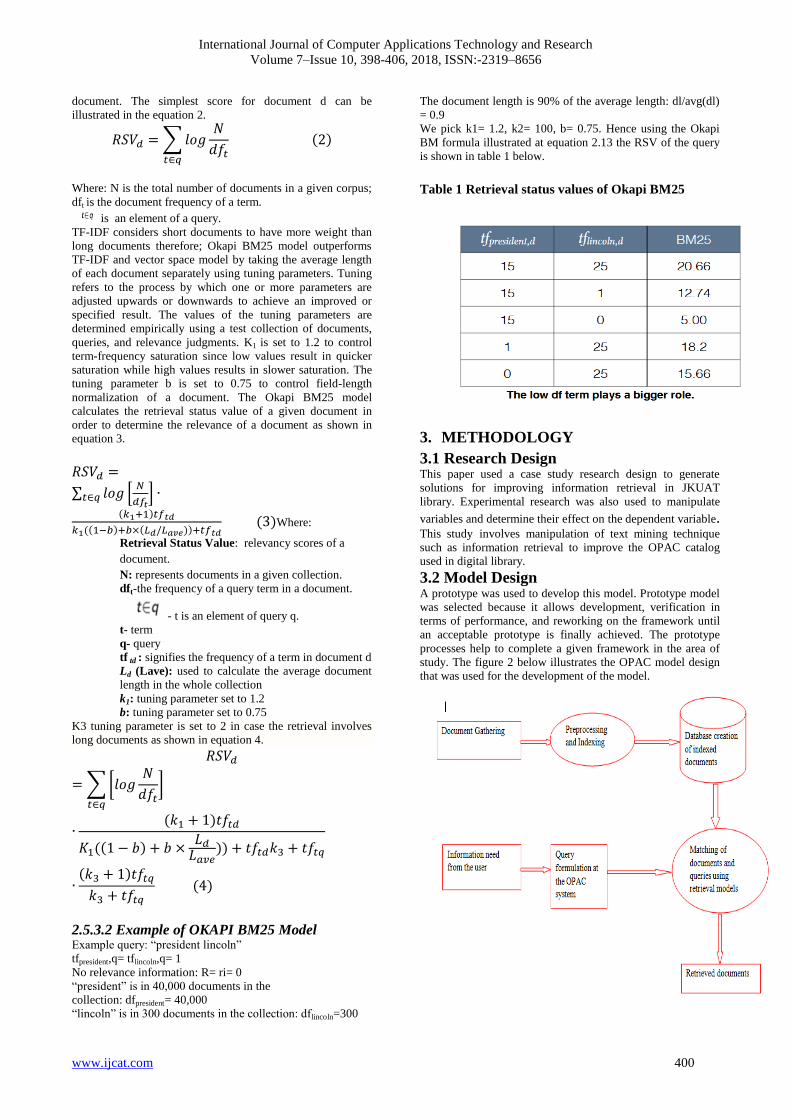
International Journal of Computer Applications Technology and Research
Volume 7–Issue 10, 398-406, 2018, ISSN:-2319–8656
www.ijcat.com 400
document. The simplest score for document d can be
illustrated in the equation 2.
Where: N is the total number of documents in a given corpus;
dft is the document frequency of a term.
is an element of a query.
TF-IDF considers short documents to have more weight than
long documents therefore; Okapi BM25 model outperforms
TF-IDF and vector space model by taking the average length
of each document separately using tuning parameters. Tuning
refers to the process by which one or more parameters are
adjusted upwards or downwards to achieve an improved or
specified result. The values of the tuning parameters are
determined empirically using a test collection of documents,
queries, and relevance judgments. K1 is set to 1.2 to control
term-frequency saturation since low values result in quicker
saturation while high values results in slower saturation. The
tuning parameter b is set to 0.75 to control field-length
normalization of a document. The Okapi BM25 model
calculates the retrieval status value of a given document in
order to determine the relevance of a document as shown in
equation 3.
Where:
Retrieval Status Value: relevancy scores of a
document.
N: represents documents in a given collection.
dft-the frequency of a query term in a document.
- t is an element of query q.
t- term
q- query
tf td : signifies the frequency of a term in document d
Ld (Lave): used to calculate the average document
length in the whole collection
k1: tuning parameter set to 1.2
b: tuning parameter set to 0.75
K3 tuning parameter is set to 2 in case the retrieval involves
long documents as shown in equation 4.
2.5.3.2 Example of OKAPI BM25 Model Example query: “president lincoln”
tfpresident,q= tflincoln,q= 1
No relevance information: R= ri= 0
“president” is in 40,000 documents in the
collection: dfpresident= 40,000
“lincoln” is in 300 documents in the collection: dflincoln=300
The document length is 90% of the average length: dl/avg(dl)
= 0.9
We pick k1= 1.2, k2= 100, b= 0.75. Hence using the Okapi
BM formula illustrated at equation 2.13 the RSV of the query
is shown in table 1 below.
Table 1 Retrieval status values of Okapi BM25
3. METHODOLOGY
3.1 Research Design This paper used a case study research design to generate
solutions for improving information retrieval in JKUAT
library. Experimental research was also used to manipulate
variables and determine their effect on the dependent variable. This study involves manipulation of text mining technique
such as information retrieval to improve the OPAC catalog
used in digital library. 3.2 Model Design A prototype was used to develop this model. Prototype model
was selected because it allows development, verification in
terms of performance, and reworking on the framework until
an acceptable prototype is finally achieved. The prototype
processes help to complete a given framework in the area of
study. The figure 2 below illustrates the OPAC model design
that was used for the development of the model.
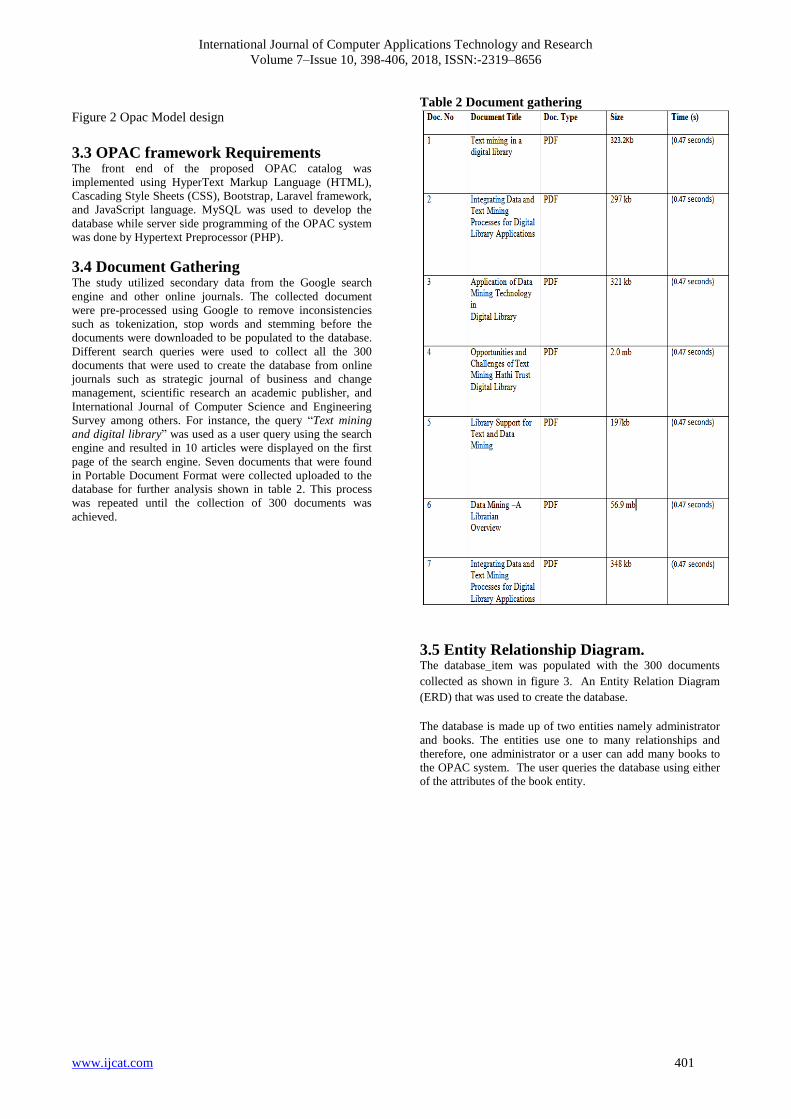
International Journal of Computer Applications Technology and Research
Volume 7–Issue 10, 398-406, 2018, ISSN:-2319–8656
www.ijcat.com 401
Figure 2 Opac Model design
3.3 OPAC framework Requirements The front end of the proposed OPAC catalog was
implemented using HyperText Markup Language (HTML),
Cascading Style Sheets (CSS), Bootstrap, Laravel framework,
and JavaScript language. MySQL was used to develop the
database while server side programming of the OPAC system
was done by Hypertext Preprocessor (PHP).
3.4 Document Gathering The study utilized secondary data from the Google search
engine and other online journals. The collected document
were pre-processed using Google to remove inconsistencies
such as tokenization, stop words and stemming before the
documents were downloaded to be populated to the database.
Different search queries were used to collect all the 300
documents that were used to create the database from online
journals such as strategic journal of business and change
management, scientific research an academic publisher, and
International Journal of Computer Science and Engineering
Survey among others. For instance, the query “Text mining
and digital library” was used as a user query using the search
engine and resulted in 10 articles were displayed on the first
page of the search engine. Seven documents that were found
in Portable Document Format were collected uploaded to the
database for further analysis shown in table 2. This process
was repeated until the collection of 300 documents was
achieved.
Table 2 Document gathering
3.5 Entity Relationship Diagram. The database_item was populated with the 300 documents
collected as shown in figure 3. An Entity Relation Diagram
(ERD) that was used to create the database.
The database is made up of two entities namely administrator
and books. The entities use one to many relationships and
therefore, one administrator or a user can add many books to
the OPAC system. The user queries the database using either
of the attributes of the book entity.
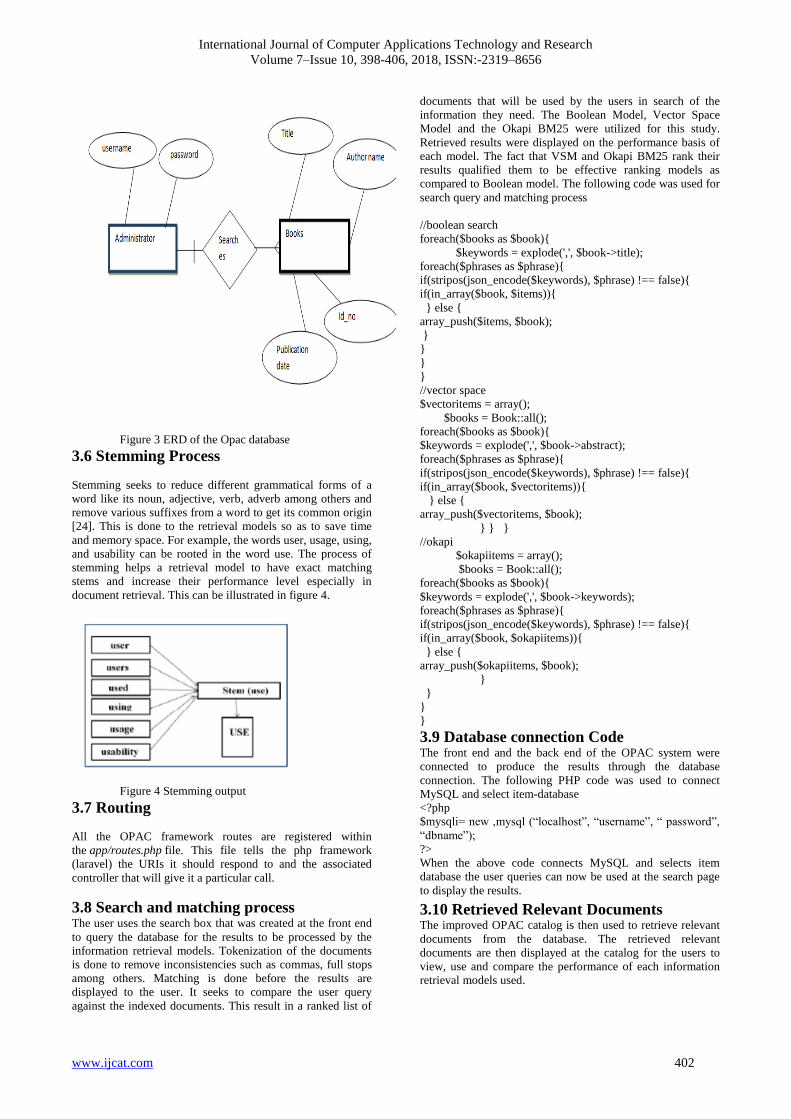
International Journal of Computer Applications Technology and Research
Volume 7–Issue 10, 398-406, 2018, ISSN:-2319–8656
www.ijcat.com 402
Figure 3 ERD of the Opac database
3.6 Stemming Process
Stemming seeks to reduce different grammatical forms of a
word like its noun, adjective, verb, adverb among others and
remove various suffixes from a word to get its common origin
[24]. This is done to the retrieval models so as to save time
and memory space. For example, the words user, usage, using,
and usability can be rooted in the word use. The process of
stemming helps a retrieval model to have exact matching
stems and increase their performance level especially in
document retrieval. This can be illustrated in figure 4.
Figure 4 Stemming output 3.7 Routing
All the OPAC framework routes are registered within
the app/routes.php file. This file tells the php framework
(laravel) the URIs it should respond to and the associated
controller that will give it a particular call.
3.8 Search and matching process The user uses the search box that was created at the front end
to query the database for the results to be processed by the
information retrieval models. Tokenization of the documents
is done to remove inconsistencies such as commas, full stops
among others. Matching is done before the results are
displayed to the user. It seeks to compare the user query
against the indexed documents. This result in a ranked list of
documents that will be used by the users in search of the
information they need. The Boolean Model, Vector Space
Model and the Okapi BM25 were utilized for this study.
Retrieved results were displayed on the performance basis of
each model. The fact that VSM and Okapi BM25 rank their
results qualified them to be effective ranking models as
compared to Boolean model. The following code was used for
search query and matching process
//boolean search
foreach($books as $book){
$keywords = explode(',', $book->title);
foreach($phrases as $phrase){
if(stripos(json_encode($keywords), $phrase) !== false){
if(in_array($book, $items)){
} else {
array_push($items, $book);
}
}
}
}
//vector space
$vectoritems = array();
$books = Book::all();
foreach($books as $book){
$keywords = explode(',', $book->abstract);
foreach($phrases as $phrase){
if(stripos(json_encode($keywords), $phrase) !== false){
if(in_array($book, $vectoritems)){
} else {
array_push($vectoritems, $book);
} } }
//okapi
$okapiitems = array();
$books = Book::all();
foreach($books as $book){
$keywords = explode(',', $book->keywords);
foreach($phrases as $phrase){
if(stripos(json_encode($keywords), $phrase) !== false){
if(in_array($book, $okapiitems)){
} else {
array_push($okapiitems, $book);
}
}
}
}
3.9 Database connection Code The front end and the back end of the OPAC system were
connected to produce the results through the database
connection. The following PHP code was used to connect
MySQL and select item-database
<?php
$mysqli= new ,mysql (“localhost”, “username”, “ password”,
“dbname”);
?>
When the above code connects MySQL and selects item
database the user queries can now be used at the search page
to display the results.
3.10 Retrieved Relevant Documents The improved OPAC catalog is then used to retrieve relevant
documents from the database. The retrieved relevant
documents are then displayed at the catalog for the users to
view, use and compare the performance of each information
retrieval models used.

International Journal of Computer Applications Technology and Research
Volume 7–Issue 10, 398-406, 2018, ISSN:-2319–8656
www.ijcat.com 403
4. PERFORMANCE AND EVALUATION
OF RESULTS
4.1 OPAC Results Once the user has installed PHP software (Xampp) in the
computer Apache and MySQL module are turned on as shown
in figure 5 below.
Figure 5 Xampp Control Panel The user opens any browser and enters the
url:http.localhost/opac/public/users/login The following
screen will appear for the user to enter his or her email
address and a password to access the system.
Figure 6 Opac framework
The OPAC framework displays the figure below once the user
logs in the details. This can be illustrated in figure 7 below.
Figure 7 Opac framework search display When the user hits the search button the following results are
observed as illustrated in the figure 8 below
Figure 8 Search Display When the user searches for example the query “Information
System” the three models displayed the following results as
shown in figure 9.
Figure 9 users enters a query" information
technology
The results of the search entered by the user in figure 9 results
to the retrieval of relevant documents from each model. The
first page of the retrieved was screenshot as shown in figure
10. The Okapi BM 25 model retrieved documents by
calculating the retrieval status value of each relevant
document. Vector Space Model calculates the cosine
similarity of each document that was found to match the user
query was calculated while Boolean model retrieved just the
book title and the author name only.
Figure 10 Retrieved documents
4.2 Tests for Performance
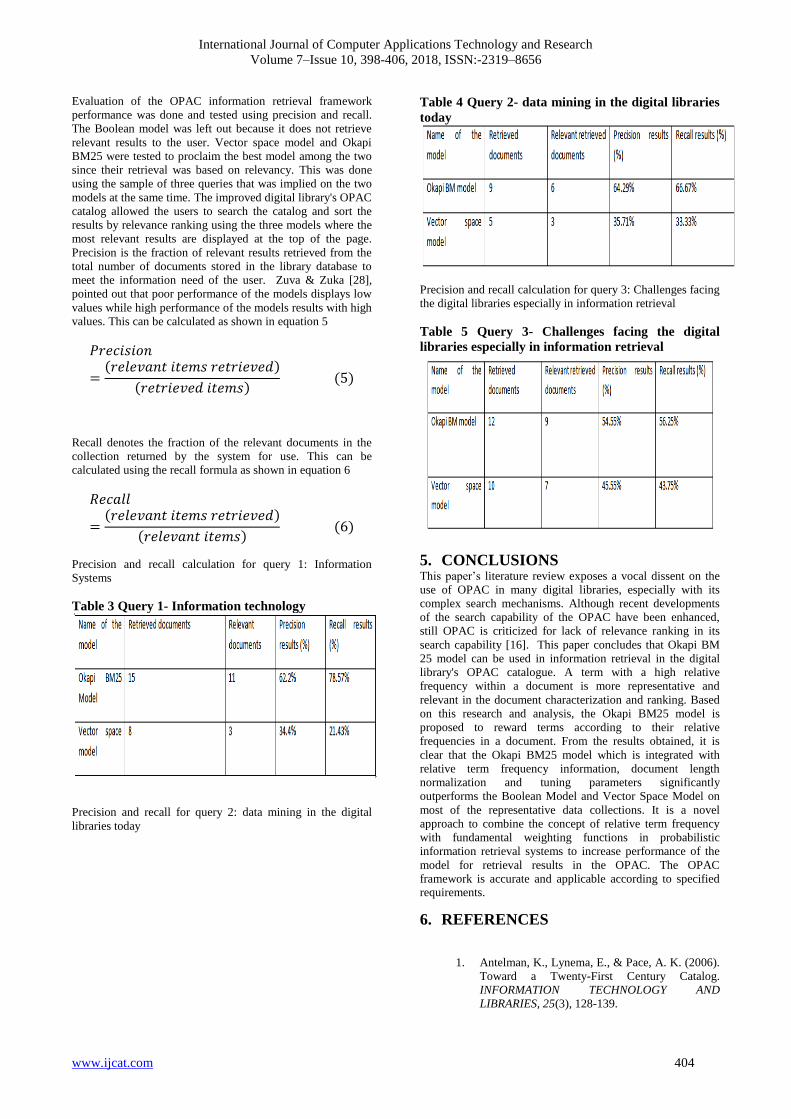
International Journal of Computer Applications Technology and Research
Volume 7–Issue 10, 398-406, 2018, ISSN:-2319–8656
www.ijcat.com 404
Evaluation of the OPAC information retrieval framework
performance was done and tested using precision and recall.
The Boolean model was left out because it does not retrieve
relevant results to the user. Vector space model and Okapi
BM25 were tested to proclaim the best model among the two
since their retrieval was based on relevancy. This was done
using the sample of three queries that was implied on the two
models at the same time. The improved digital library's OPAC
catalog allowed the users to search the catalog and sort the
results by relevance ranking using the three models where the
most relevant results are displayed at the top of the page.
Precision is the fraction of relevant results retrieved from the
total number of documents stored in the library database to
meet the information need of the user. Zuva & Zuka [28],
pointed out that poor performance of the models displays low
values while high performance of the models results with high
values. This can be calculated as shown in equation 5
Recall denotes the fraction of the relevant documents in the
collection returned by the system for use. This can be
calculated using the recall formula as shown in equation 6
Precision and recall calculation for query 1: Information
Systems
Table 3 Query 1- Information technology
Precision and recall for query 2: data mining in the digital
libraries today
Table 4 Query 2- data mining in the digital libraries
today
Precision and recall calculation for query 3: Challenges facing
the digital libraries especially in information retrieval
Table 5 Query 3- Challenges facing the digital
libraries especially in information retrieval
5. CONCLUSIONS This paper’s literature review exposes a vocal dissent on the
use of OPAC in many digital libraries, especially with its
complex search mechanisms. Although recent developments
of the search capability of the OPAC have been enhanced,
still OPAC is criticized for lack of relevance ranking in its
search capability [16]. This paper concludes that Okapi BM
25 model can be used in information retrieval in the digital
library's OPAC catalogue. A term with a high relative
frequency within a document is more representative and
relevant in the document characterization and ranking. Based
on this research and analysis, the Okapi BM25 model is
proposed to reward terms according to their relative
frequencies in a document. From the results obtained, it is
clear that the Okapi BM25 model which is integrated with
relative term frequency information, document length
normalization and tuning parameters significantly
outperforms the Boolean Model and Vector Space Model on
most of the representative data collections. It is a novel
approach to combine the concept of relative term frequency
with fundamental weighting functions in probabilistic
information retrieval systems to increase performance of the
model for retrieval results in the OPAC. The OPAC
framework is accurate and applicable according to specified requirements.
6. REFERENCES
1. Antelman, K., Lynema, E., & Pace, A. K. (2006).
Toward a Twenty-First Century Catalog.
INFORMATION TECHNOLOGY AND
LIBRARIES, 25(3), 128-139.
International Journal of Computer Applications Technology and Research
Volume 7–Issue 10, 398-406, 2018, ISSN:-2319–8656
www.ijcat.com 405
2. Yulianto, B., Budiharto, W., & Kartowisastro, H,
I. (2017). The Performance of Boolean Retrieval
and Vector Space Model in Textual Information
Retrieval. Communication & Information
Technology, 11(1), 33-39
3. Aruleba, K. D., Akomolafe, D. T., & Afeni, B.
(2016). A Full Text Retrieval System in a Digital
Library Environment. Scientific Research
Publishing, 8(1), 1-8.
4. Boubekeur, F., & Azzoug, W. (2013).
CONCEPT-BASED INDEXING IN TEXT
INFORMATION RETRIEVAL. International
Journal of Computer Science & Information
Technology (IJCSIT), 5(1), 119-136.
5. Brahaj, A., Razum, M., & Hoxha, J. (2013).
Defining Digital Library. In T. Aalberg, C.
Papatheodorou, M. Dobreva, G. Tsakonas, & C.
J. Farrugia, Research and Advanced Technology
for Digital Libraries. (pp. 23-28). Berlin:
Springer, Berlin, Heidelberg.
6. Dwivedi, S. J. (2014). Comparative Analysis of
IDF Methods to Determine Word Relevance in
Web Document. International Journal of
Computer Science Issues, 11, 59-65.
7. Ibba, S., & Pani, F. E. (2016, May 10). Digital
Libraries: The Challenge of Integrating Instagram
with a Taxonomy for Content Management.
Future Internet, pp. 1-15.
8. Khiste, G. P., Deshmukh, R. K., & Awate, A. P.
(2018, Feb 24). LITERATURE AUDIT OF
‘DIGITAL LIBRARY’: AN OVERVIEW.
Research gate, pp. 403-411.
9. Kumar, S., & Vohra, R. (2013). "User perception
and use of OPAC: a comparison of three
universities in the Punjab region of India". The
Electronic Library, 31(1), 36-54.
10. Mishra, R. K. (2016). DIGITAL LIBRARIES:
DEFINITIONS, ISSUES, AND CHALLENGES.
Innovare Journal of Education, 4(3), 1-3.
11. O'Connell, J. (2008). Information Literacy meets
Library 2.0. In P. J, & G. P, School library 2.0:
new skills, new knowledge, new futures (pp. 51-
62). London: Facet Publishing.
12. Ogbole, J. O., & Morayo, A. (2017). Factors
Affecting Online Public Access Catalogue
Provision And Sustainable Use By
Undergraduates In Two Selected University
Libraries In Ogun And Oyo States, Nigeria.
Journal of Research & Method in Education,
7(4), 14-25.
13. Roshdi, A., & Roohparvar, A. (2015). Review:
Information Retrieval Techniques and
Applications. International Journal of Computer
Networks and Communications Security, 3(9),
373-377.
14. Ruban, s., Sam, S. B., Serrao, L. V., & Harshitha.
(2015). A Study and Analysis of Information
Retrieval Models. International Journal of
Innovative Research in Computer and
Communication Engineering, 3(7), 230-236.
15. Rybchak, Z., & Basystiuk, O. (2017). Analysis of
methods and means of text mining.
ECONTECHMOD. AN INTERNATIONAL
QUARTERLY JOURNAL, 6(2), 73-78.
16. Sankari, R. L., Chinnasamy, K.,
Balasubramanian, P., & Muthuraj, R. (2013). A
STUDY ON THE USE OF ONLINE PUBLIC
ACCESS CATALOGUE (OPAC) BY
STUDENTS AND FACULTY MEMBERS OF
UNNAMALAI INSTITUTE OF
TECHNOLOGY IN KOVILPATTI (TAMIL
NADU). International Journal of Library and
Information Studies, 3(1), 17-26.
17. Sharma, M., & Patel, R. (2013). “A survey on
information retrieval models, techniques and
applications,” International Journal of Emerging
Technology and Advanced Engineering, 3(11),
542–545.
18. Shiva Kanaujia, S., & Parveen, B. (2016).
Marketing and Building Relations in Digital
Academic Library: Overview of Central Library,
Jawaharlal Nehru University, New Delhi.
DESIDOC Journal of Library & Information
Technology, 36(3), 143-147.
19. Sundari, G. J., & Sundar, D. (2017). A Study of
Various Text Mining Techniques. International
Journal of Advanced Networking & Applications
(IJANA, 08(05), 82-85.
20. Swaminathan, K. S. (2017). Use and Awareness
of Online Public Access Catalogue (OPAC) by
Students and Faculty members of Anna
University Regional Campus, Coimbatore, Tamil
Nadu – A Case Study. International Journal of
Scientific Research and Management, 5(5), 5345-
5349.
21. Talib, R., Hanif, K. M., Ayesha, S., & Fatima, F.
(2016). Text Mining: Techniques, Applications
and Issues. International Journal of Advanced
Computer Science and Applications, 7(11), 414-
418.
22. Garcia, E. (2016, November 11). A Tutorial on
the BM25F Model - Minerazzi. Retrieved June
18, 2017, from minerazzi.com:
https://www.researchgate.net/publication/308991
534_A_Tutorial_on_the_BM25F_Model
23. Muhammad, A. B. (2017). Efficiency of Boolean
Search strings for Information Retrieval.
American Journal of Engineering Research
(AJER. 6(11), 216-222
24. Singh, V. K., & Singh, V. K. (2015). VECTOR
SPACE MODEL: AN INFORMATION
International Journal of Computer Applications Technology and Research
Volume 7–Issue 10, 398-406, 2018, ISSN:-2319–8656
www.ijcat.com 406
RETRIEVAL. International Journal of Advanced
Engineering Research and Studies, 141-143.
25. Tuna, G., Zogo, R., & Dermirelli., B. (2013). An
Introduction to Digitization Projects Conducted
by Public Libraries: Digitization and
Optimization Techniques Journal of Balkan
Libraries Union, 1(1), 28-30.
26. Zhu, R. (2016, June 5). GRADUATE PROGRAM
IN INFORMATION SYSTEMS AND
TECHNOLOGY. IMPROVEMENT IN
PROBABILISTIC INFORMATION RETRIEVAL
MODEL REWARDING TERMS WITH HIGH
RELATIVE TERM FREQUENCY, pp. 1-95.
27. Gaikwad, S. V., Chaugule, A., & Patil, P. (2014).
Text Mining Methods and Techniques.
International Journal of Computer Applications,
85(17), 42-45.
28. Zuva, K.., & Zuva, T. (2012). Evaluation of
Information Retieval Systems. International
Journal of Computer Science & Information
Technology, 4(3), 35-43.
29. Jain, A., Jain, A., Chauhan, N., Singh, V., &
Thakur, N. (2017). Information Retrieval using
Cosine and Jaccard Similarity Measures in Vector
Space Model. International Journal of Computer
Applications , 164 (6), 28-30.