Embed Size (px)
Citation preview

Policies and Research on Financial and
Real Estate Markets in Post Crisis
May 20, 2011 NUS-IRES Symposium
Kyung-Hwan Kim Sogang University

Outline of presentation
Introduction
The impact of Global Financial Crisis on housing and housing finance in Korea
Housing asset and rental markets
Mortgage market
Policy issues
Continued expansion of household debt
Mortgage lending and housing price
Regulation of LTV and DTI
Consumer protection
Down-sizing of the housing sector in a rapidly aging society?
Some research questions
2

The impact of the Global Financial Crisis on housing and
housing finance
Impact on housing price : How is this time different?
In neither AFC and GFC, housing was the cause of the crisis.
Mortgage lending and household debt
Steady expansion of mortgage lending and household debt
No significant increase in delinquency or default on mortgages
Low LTV and DTI, low interest rate
HF stopped issuing MBS for four months since September 2008 due to a sudden rise in the MBS spread over the 5 year KTB rate.
Project financing
Not purely project financing
Rapid expansion and high delinquency: a serious concern
Changing market sentiments and rental market
As housing market sentiments turned negative, chonsei is becoming less popular compared with monthly rents with deposit schemes.
3

Korea Purchase
Korea Chonsei
The real rate of change in purchase price and
chonsei deposit index

Housing market conditions one year prior to the AFC and GFC
Dec-96 Dec-07
population ('000) 45954 48297
population growth rate 0.94% 0.33%
share of age 65 and older 6.40% 9.90%
per capita GNI ($) 11205 21695
number of households ('000) 11542 12760
housing supply ratio 92.0% 108.1%
housing stock('000) 10627 13793
unsold units 88867 112254
PIR 4.6 6.6
5 year house price change (%) 0% 23.5%
5 year CPI change (%) 21.8% 11.6%
5 year real house price change(%) -21.8% 11.9%
MDO/GDP 10.0% 33.0%
household loan lending rate 12.30% 6.48%
LTV on KB mortgages 22.7% 35.3%
Source: KB, MLTM, Kim (2011)

The magnitude of house price fall: AFC vs GFC
Korea Seoul
-14
-10
-6
-2
2
6
1 2 3 4 5 6 7 8
Korea house price AFC
Korea house price GFC
-14
-10
-6
-2
2
6
10
1 2 3 4 5 6 7 8
Seoul house price AFC
Seoul house price GFC
Source: KB, Kim (2011)

0
0.2
0.4
0.6
0.8
1
1.2
1.4
1.6
1.8
2
-5
0
5
10
15
20
25
30
35
40
(%)
Rate of change in Seoul apartment price and delinquency
on housing loans
Outstanding balance and delinquency rate of project finance
Lender Category Jun-08 Dec-08 Jun-09 Dec-09 Jun-10
Commercial Balance 47,912 52,512 54,135 50,959 44,900
banks Delinquency 0.68 1.07 2.62 1.67 2.94
Savings Balance 12,210 11,523 11,049 11,808 11,900
banks Delinquency 14.28 13.03 9.56 10.6 12.0
Insurance Balance 5,324 5,519 5,474 5,736 5,395
companies Delinquency 2.37 2.41 4.06 4.55 7.9
Securities Balance 2,960 2,858 2,829 2,747 2,457
companies Delinquency 6.57 13.92 24.52 30.28 25.17
(Unit: Billion KRW, %)
Source: Financial Supervisory Service

Trend of unsold units
9
Unsold houses have become a problem in recent years.
Year 1995-1998
1999-2002
2003 2004 2005 2006 2007 2008 2009 2010
Korea 113380 46464 38261 69133 57215 73772 112254 165599 123297 88,706
Seoul 1927 1914 735 612 574 529 454 2486 1803 2,729
Incheon 4197 957 467 1770 1196 426 527 1647 4539 4,265
Gyeonggi 18511 10002 6168 13076 10472 3769 13643 22795 19325 22,418
SCR 24635 12873 7370 15458 12242 4724 14624 26928 25667 29,412

Rekindling fear of bubble?
A short-lived up-turn
House price appreciation in 2009
Government intervened to cool the housing market
Reversal of the pattern of house price increases
Emergence of gloomy forecast for house prices
Demographic changes, but weren’t they expected?
Implications of lowered expectations
Demand for home ownership fell
Demand for chonsei increased
Emergence of monthly-rental contracts

Why has the suffering been less severe this time?
Macroeconomic factors
GDP growth suffered, but not so much in general, and bottomed out
sooner.
Interest rate remained low.
Financial sector has gotten bigger and stronger (much smaller non-
performing loans)
Government stimulus package was large, comprehensive and prompt.
Housing market factors
Housing price appreciation was smaller than in Europe and US.
Household sector is more resilient
Market expectations recovered soon (learning from the previous crisis?)
Government pre-emptive intervention to stabilize housing demand.

Policy issues going forward
Managing household debt
Strengthening the mortgage market
Macroprudential regulations
Down-sizing of housing sector?
The future of chonsei
Will it phase out?
12

Rapid growth in household debt
13
Mortgage debt currently comprises 65% of banks’ household debt.
Household’s financial liabilities to disposable income ratio rose to 142.7%.
There is a concern that household debt could be a potential risk having an adverse effect on the financial system and the recovery of economy, in case its increasing trend persists.
Source : BOK, NSO
Mortgage Debt Outstanding
Source : BOK, NSO
Household’s financial liabilities to disposable income
0
2
4
6
8
10
12
14
16
18
0
50
100
150
200
250
300
350
400
450
01 02 03 04 05 06 07 08 09
Bank's Household loan (L)Bank's Mortgage loan (L)Mortgage Debt per Household(R)
House
hold
&
Mort
gage loan (
KRW
in t
rillio
ns)
Mo
rtgag
e D
eb
t per H
ou
seh
old
1
1.05
1.1
1.15
1.2
1.25
1.3
1.35
1.4
1.45
1.5
400
450
500
550
600
650
700
750
800
850
900
02 03 04 05 06 07 08 09
Household's liabilities(L) Household's liabilities/Disposable income(R)
(KR
W in
tri
llio
ns)
13 Source: HF

Improving the mortgage system
Problems with the ARM-dominated market
Non-amortizing bullet mortgages
How to promote FRM?
Developments in the U.K. since Miles report (2004)
Funding FRM
MBS vs covered bonds
Going down markets
The credit-constrained and underserved
Mortgage insurance?
Consumer protection
Rollover risk, interest rate adjustment with no cap, prepayment penalty
Provision of information about the risk of loan products

Composition of mortgage products by interest
variability
0%
10%
20%
30%
40%
50%
60%
70%
80%
90%
100%
Denm
ark
Nethe
rland
s
Cana
da US
Germ
any
Japa
n UK
Spain
Ireland
Australia
Korea
ARM
ST Fixed
MedT Fixed
LT Fixed
FRM marketsARM markets
Source: Lea (2010), HF (2010)
15
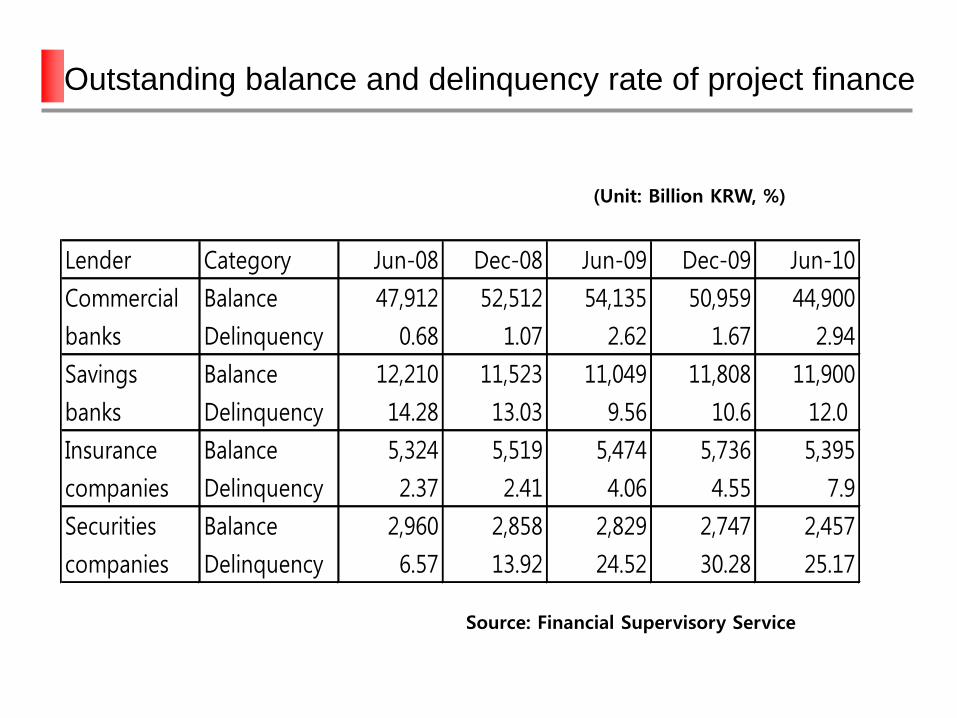
Funding for mortgage lending in selected countries
16
Source: Lea (2010), Cho and Kim (2010)
0%
10%
20%
30%
40%
50%
60%
70%
80%
90%
100%
Denmark US
Spain UK
Cana
da
Japa
n
Nethe
rland
s
German
y
Austra
lia
Korea
Other
MBB/CB
MBS
Institutional
Deposit
MBS/CB-based
Deposit-based

Macroprudential regulations
What is a macroprudential regulation?
Protect the financial system as a whole
Capital requirements as a key tool to control pro-cyclical leverage
Relationship with monetary policy
LTV or DTI ceilings as macroprudential regulation?
Devised as a tool for containing house price hike?
Direct control of lending criteria vs. indirect regulation via banking
supervision
More flexible system relying on individual lenders
17

Housing prices and household loans, 2000-2010
18
Source: Kim and Kim 2010
Positive correlation

Regulations on mortgage origination
LTV
DTI
First Introduced in Sep. 2002
Now applicable to all mortgage origination
Max. LTV ratio differently set by considering
Loan Maturity, House Price, House Type
Location (Speculation Zone, Metropolitan Region)
Lender (Bank vs. Non-banking)
Introduced in 2004 as a requirement for allowing Max.
70% of LTV ratio to FRMs
Expanded its application to mortgages originated
in Speculation Zone in 2006
Application of DTI, decided by Location & House Type
Max. DTI ratio differently set by considering
House Price, Loan Amount, Property Size
Lender (bank vs. Non-banking)
19

MAX. LTV
ratio
MAX. LTV
ratio
70%
Raised to 70%
(More >=10 yrs &
less than 1yr of interest-only payments)
70%
60% All
properties 60%
50% Reduced to
50%
( M=< 3yrs)
Set the LTV ceiling as 50% for
nonbank financial institutions
(M=<10yrs &
more than 600m Won)
Reduced to 50%
(More than 600m Won
in metropolitan area)
50%
40% Reduced to 40%
( M=< 10yrs)
Reduced to 40%
( M=< 10yrs &
more than 600m
Won)
40%
Extended to Nonbank financial Institutions
Removed speculative zones
except 3 Gangnam districts in 2008
Expand the LTV regulations to
all financial institutions for the metropolitan
area in 2009
Introduced the LTV ratio
ceiling of 60% in 2002
Apartment price change
Delinquency Ratio
(%)
History of LTV regulation

MAX. DTI
ratio
MAX. DTI
ratio 70%
Extended to nonbanking institutions as
40~70% of DTI ceiling
70%
60%
Set DTI as
40~60%
for
=<600m
Won
Other
metropolitan
area
60% 50%
40%
Introduced
DTI ceiling
as 40%
>=600m
Won
(speculative
zones)
Non-speculative
zones 50%
3 Gangnam
districts 40%
Apartment price change
Delinquency Ratio
(%)
Extended to overheated
speculative zones
Give exemption to debtors
owning less than 2 houses
until March 2011
History of DTI regulation

Down-sizing the housing sector?
Prospects of shrinking demand
A Mankiw-Weil thesis?
Income growth and cohort effect
Need to overhaul the supply system?
How to upgrade the existing stock?
Demand-supply mismatch?
Spatial
Size and quality
Coping with a rapidly aging population
Reverse mortgages in an early stage of development
Lower the portion of housing asset?
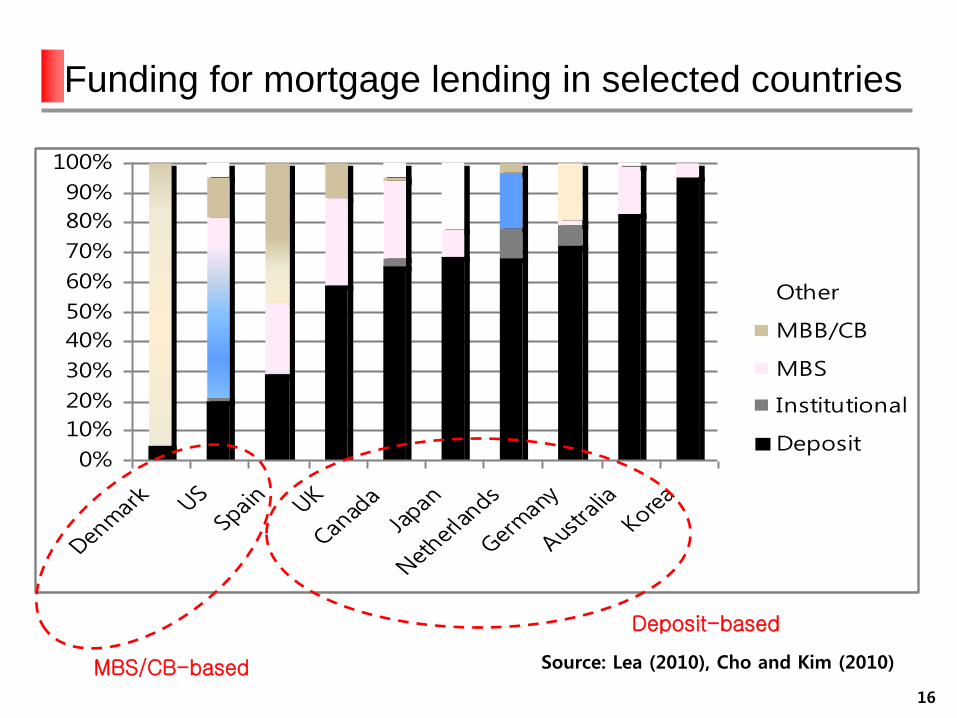
Some research questions
Explaining volatility in housing markets
price and quantity volatility
Narrowing the gap between macroeconomics and real estate economics
Macroeconomists need to appreciate the heterogeneity in real estate markets
Rear estate economists need to understand the macro-real estate linkages
Housing finance after GFC
The end of originate to distribute model?
How to secure internationally comparable data on real estate?
Availability and limitations of price indexes and quantity data
How can we explain the persistence of chonsei system in Korea?
Chonsei as a unique lease and financing mechanism
23

Explaining volatility in housing markets
Supply elasticity and volatility
Price volatility vs quantity volatility
Price stability with an elastic regime vs hangover of overbuilding
during a boom driven by irrational expectations
Market sentiments and dynamics
Predicting turning points
Mean reversion?
Momentum traders and the price-volume correlation
Pre-sale and the behavior of developers
24

Observational equivalence: Supply becoming more elastic
vs shifting inelastic supply curve
25
P2
P1
D1
S2A
S1A
Q0 Q1 Q2
P0
P
D2
S0A
Do
SB
Q

Supply elasticity and the U.S. housing bubble
The expected rate of appreciation in house prices is very sensitive to
the assumed supply elasticity.
Speculation has driven house prices well above levels that can be
justified by economic fundamentals in less than half of the cities
examined.
Establishing ‘‘30% over the expected increase” as a housing bubble
threshold, only 25 of the 84 metropolitan areas with significantly positive
supply elasticities exceed this threshold.
With the exception of Las Vegas, every single one of these areas is
either within 75 miles of the Atlantic coast or California’s Pacific coast,
suggesting that extreme speculative activity, so prominently publicized,
was extraordinarily localized.
26 Source: Goodman and Thibodeau JHE 2008

House price gain since 2000 to peak and fall from
peak
27
Source: SPCS, A year in review 2009

Chonsei as informal housing finance
The mechanism
The tenant pays a lump sum deposit to the landlord up front
The deposit is fully refunded at the termination of lease
It is a rental contract and a financing device at the same time.
The deposit level
The ratio between the deposit and the house value varies over time and
across locations.
The ratio is affected by the supply conditions as well as expectations about
capital gains.
A spectrum of deposit and monthly rents
Pure monthly rental contracts are rare.
Various combinations of deposit and monthly rents are available.
The implicit interest rate is much higher than market rate.
The future of chonsei? 28
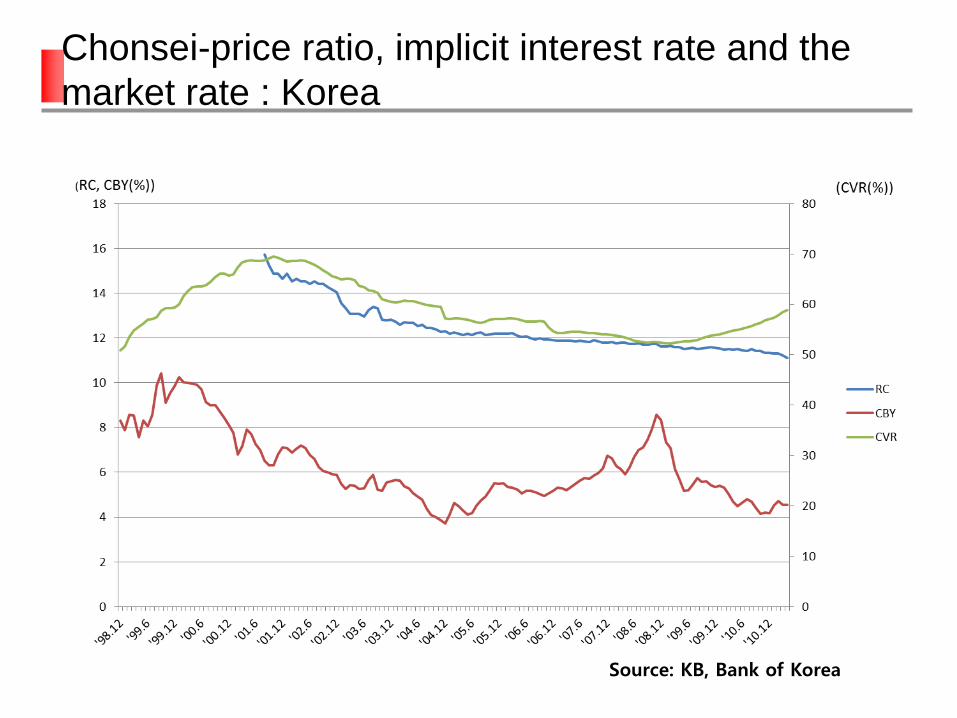
Chonsei-price ratio, implicit interest rate and the
market rate : Korea
Source: KB, Bank of Korea