Embed Size (px)
Citation preview
1900 VOLUME 16J O U R N A L O F A T M O S P H E R I C A N D O C E A N I C T E C H N O L O G Y
q 1999 American Meteorological Society
Polarization Diversity Pulse-Pair Technique for Millimeter-WaveDoppler Radar Measurements of Severe Storm Features
ANDREW L. PAZMANY AND JOHN C. GALLOWAY
Microwave Remote Sensing Laboratory, University of Massachusetts, Amherst, Amherst, Massachusetts
JAMES B. MEAD AND IVAN POPSTEFANIJA
Quadrant Engineering Inc., Amherst, Massachusetts
ROBERT E. MCINTOSH*
Microwave Remote Sensing Laboratory, University of Massachusetts, Amherst, Amherst, Massachusetts
HOWARD W. BLUESTEIN
School of Meteorology, University of Oklahoma, Norman, Oklahoma
(Manuscript received 6 October 1998, in final form 26 January 1999)
ABSTRACT
The Polarization Diversity Pulse-Pair (PDPP) technique can extend simultaneously the maximum unambiguousrange and the maximum unambiguous velocity of a Doppler weather radar. This technique has been appliedusing a high-resolution 95-GHz radar to study the reflectivity and velocity structure in severe thunderstorms.This paper documents the technique, presents an analysis of the first two moments of the estimated mean velocity,and provides a comparison of the results with experimental data, including PDPP images of high-vorticity regionsin supercell storms.
1. Introduction
The maximum unambiguous range rmax and maximumunambiguous velocity umax of a conventional pulsedDoppler radar are related by (Doviak and Zrnic 1984;Miller and Rochwarger 1972)
rmax|umax| 5 cl/8, (1)
where c is the speed of light and l is the radar wave-length. While this ambiguity relation applies to allweather radars, millimeter-wavelength radars face a par-ticularly stringent limit due to the increase in Dopplerfrequency shift with increasing operating frequency.This high Doppler shift often forces the operation ofmillimeter-wave radars to sacrifice range and acceptmultiple folding in the velocity data, even for moderate
* Deceased.
Corresponding author address: Dr. Andrew Pazmany, MicrowaveRemote Sensing Laboratory, University of Massachusetts, Amherst,Knowles Bldg., Amherst, MA 01002.E-mail: [email protected].
winds. For example, at 3 mm (95 GHz) wavelength theproduct of the maximum velocity and range is so smallthat for a umax of 68 m s21, rmax is reduced to 14 km.These limitations may be acceptable during zenith ob-servations of some clouds and precipitation; longer-range capability is often necessary during horizontalmeasurements, however, and weather phenomena suchas convective clouds and storms require the ability tomeasure much higher wind speeds.
Conventional estimators of Doppler velocity, such asthe Fourier transform and pulse-pair techniques, canmeasure beyond umax by using multiple (staggered)pulse-repetition frequencies (PRF) (Doviak and Zrnic1984); however, the performance of these estimatorsdegrades when the standard deviation of the Dopplerspectrum is large compared to the folding velocity. Anincrease in PRF increases the folding velocity but alsodecreases the maximum range, which can make inter-ference from scatterers located past rmax more likely.Golestani et al. (1995) successfully reduced this inter-ference by combining multiple polarizations with stag-gered PRFs, but this method did not remove the limi-tation imposed by (1).
Doviak and Sirmans (1973) proposed a polarization
Unauthenticated | Downloaded 01/25/22 11:09 AM UTC
DECEMBER 1999 1901P A Z M A N Y E T A L .
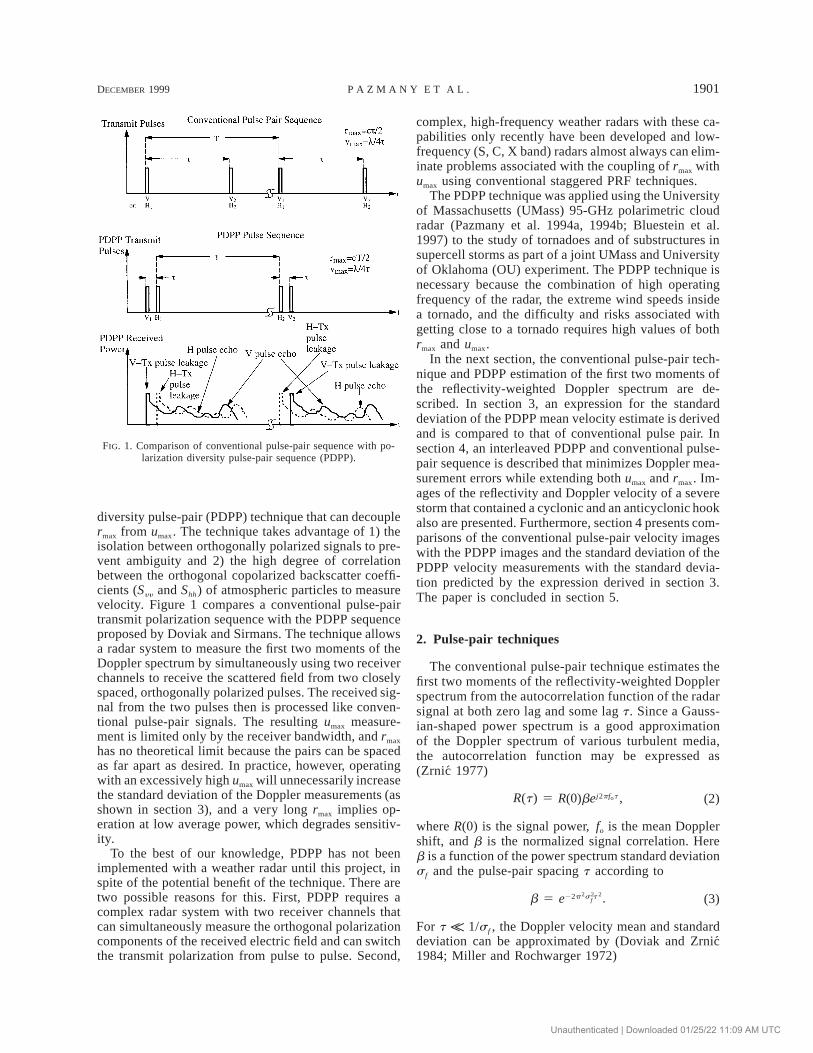
FIG. 1. Comparison of conventional pulse-pair sequence with po-larization diversity pulse-pair sequence (PDPP).
diversity pulse-pair (PDPP) technique that can decouplermax from umax. The technique takes advantage of 1) theisolation between orthogonally polarized signals to pre-vent ambiguity and 2) the high degree of correlationbetween the orthogonal copolarized backscatter coeffi-cients (Syy and Shh) of atmospheric particles to measurevelocity. Figure 1 compares a conventional pulse-pairtransmit polarization sequence with the PDPP sequenceproposed by Doviak and Sirmans. The technique allowsa radar system to measure the first two moments of theDoppler spectrum by simultaneously using two receiverchannels to receive the scattered field from two closelyspaced, orthogonally polarized pulses. The received sig-nal from the two pulses then is processed like conven-tional pulse-pair signals. The resulting umax measure-ment is limited only by the receiver bandwidth, and rmax
has no theoretical limit because the pairs can be spacedas far apart as desired. In practice, however, operatingwith an excessively high umax will unnecessarily increasethe standard deviation of the Doppler measurements (asshown in section 3), and a very long rmax implies op-eration at low average power, which degrades sensitiv-ity.
To the best of our knowledge, PDPP has not beenimplemented with a weather radar until this project, inspite of the potential benefit of the technique. There aretwo possible reasons for this. First, PDPP requires acomplex radar system with two receiver channels thatcan simultaneously measure the orthogonal polarizationcomponents of the received electric field and can switchthe transmit polarization from pulse to pulse. Second,
complex, high-frequency weather radars with these ca-pabilities only recently have been developed and low-frequency (S, C, X band) radars almost always can elim-inate problems associated with the coupling of rmax withumax using conventional staggered PRF techniques.
The PDPP technique was applied using the Universityof Massachusetts (UMass) 95-GHz polarimetric cloudradar (Pazmany et al. 1994a, 1994b; Bluestein et al.1997) to the study of tornadoes and of substructures insupercell storms as part of a joint UMass and Universityof Oklahoma (OU) experiment. The PDPP technique isnecessary because the combination of high operatingfrequency of the radar, the extreme wind speeds insidea tornado, and the difficulty and risks associated withgetting close to a tornado requires high values of bothrmax and umax.
In the next section, the conventional pulse-pair tech-nique and PDPP estimation of the first two moments ofthe reflectivity-weighted Doppler spectrum are de-scribed. In section 3, an expression for the standarddeviation of the PDPP mean velocity estimate is derivedand is compared to that of conventional pulse pair. Insection 4, an interleaved PDPP and conventional pulse-pair sequence is described that minimizes Doppler mea-surement errors while extending both umax and rmax. Im-ages of the reflectivity and Doppler velocity of a severestorm that contained a cyclonic and an anticyclonic hookalso are presented. Furthermore, section 4 presents com-parisons of the conventional pulse-pair velocity imageswith the PDPP images and the standard deviation of thePDPP velocity measurements with the standard devia-tion predicted by the expression derived in section 3.The paper is concluded in section 5.
2. Pulse-pair techniques
The conventional pulse-pair technique estimates thefirst two moments of the reflectivity-weighted Dopplerspectrum from the autocorrelation function of the radarsignal at both zero lag and some lag t . Since a Gauss-ian-shaped power spectrum is a good approximationof the Doppler spectrum of various turbulent media,the autocorrelation function may be expressed as(Zrnic 1977)
R(t) 5 ,j2pf toR(0)be (2)
where R(0) is the signal power, fo is the mean Dopplershift, and b is the normalized signal correlation. Hereb is a function of the power spectrum standard deviationsf and the pulse-pair spacing t according to
b 5 .2 2 222p s tfe (3)
For t K 1/sf , the Doppler velocity mean and standarddeviation can be approximated by (Doviak and Zrnic1984; Miller and Rochwarger 1972)
Unauthenticated | Downloaded 01/25/22 11:09 AM UTC
1902 VOLUME 16J O U R N A L O F A T M O S P H E R I C A N D O C E A N I C T E C H N O L O G Y
l I [R(t)]m 5 arctan , (4)u 5 64pt R [R(t)]
and
l R(t)s 5 1 2 , (5)u ! R(0)2Ï2pt
where is the mean velocity estimate, is the spectralm su u
width estimate, and R and I represent real and imaginarycomponents.
Spectral moment estimation from PDPP measure-ments takes a similar form; however, the autocorrelationfunction is replaced by the cross-correlation function ofthe orthogonally polarized signals. Again assumingGaussian-shaped power spectra, and using a vertical (y)and horizontal (h) polarization basis, the cross-corre-lation function of the scattered field for a y–h pair Ryh
can be expressed as
Ryh(t) 5 .j(2pf t1f )o|R (0)|beyh (6)
Similarly, for an h–y pair, Rhy can be expressed as
Rhy(t) 5 ,j(2pf t2f )o|R (0)|behy (7)
where the phase bias f accounts for differential phaseshift during propagation between the radar and the scat-terers and for any difference in the transmission linelengths between the two polarization channels in theradar. Since this bias has an opposite sign when thepolarization sequence is reversed, it can be eliminatedby interleaving y–h pulse pairs with h–y pairs. Aftercombining Rhy (t) with Rhy (t), the unbiased estimate ofthe mean velocity can be expressed as
I [ÏR (t)R (t) ]l yh hym 5 arctan . (8)u 5 64pt R [ÏR (t)R (t) ]yh hy
The estimate of the standard deviation of the Dopplerspectrum, similar to (5), can be expressed as
l |R (t)|yhs 5 1 2 ; (9)u ! |R (0)|2Ï2pt yh
|Ry h(t )| 5 |Rhy (t )| is assumed. The practical use of (9)is limited, however, because |Ry h(0)| is difficult to mea-sure, especially in conditions when conventional pulse-pair technique breaks down. A technique outlined byDoviak and Zrnic (1984) for the estimation of |Ry h(0)|,for example, requires the measurement of the lag 2autocorrelation Rhh(2t ). However, when this functioncan be measured, PDPP technique is not needed. Thetechnique by Doviak and Zrnic (1984) could be mod-ified to replace |Rhh(2t )| with |Ry h(2t )|, which can beobtained from lag 2 PDPP measurements, but an apriori model for the power spectrum shape also is need-ed, which model is difficult to estimate in high-shearregions such as a tornado. Noncoherent polarimetricmeasurement technique (Mead et al. 1993; Pazmanyand McIntosh 1994) may be used to estimate |Ry h(0)|,
but this technique requires a complex radar that cantransmit three or more linearly independent polariza-tions and can measure the polarization of the scatteredfield. Without this capability, |Ry h(0)| may be approx-imated from the copolarized received power at verticaland horizontal polarizations and by assuming that Sy y
and Shh are completely correlated. This approximation,however, leads to an imprecise estimate of su ; there-fore, it is useful only to locate regions that have veryhigh spectral width, such as tornadoes.
The implementation of PDPP requires a polarimetricDoppler radar system with some unique capabilities. Asseen in Fig. 1, the close pulse spacing and varying trans-mit polarization during PDPP measurements require aradar with fast transmit/receive and polarization switch-es, and the radar must have two receivers to measuresimultaneously the scattering from the two orthogonallypolarized transmit pulses. Such a radar system is theUMass W-band cloud radar, documented in Pazmany etal. (1994a), which was constructed with two receiverchannels to speed the measurement of the polarimetricscattering properties of clouds and precipitation froman aircraft.
3. Polarization diversity pulse-pair estimate errors
The PDPP technique provides an unbiased estimateof the Doppler velocity and can be used to measurevery high wind speeds effectively in the presence ofhigh shear, but it sacrifices accuracy to achieve this.The high unambiguous velocity of PDPP is one of themain contributors to the relatively high estimate errorbecause, with increasing umax , the error in the measuredphase of the correlation function maps into a largervelocity error. These errors in the measured phase aregenerated by thermal and phase noise and by interfer-ence between the orthogonally polarized signals re-sulting from the finite polarization isolation of the an-tenna and orthomode transducer (OMT). These inter-fering ‘‘noiselike’’ signals add to thermal noise to de-crease the effective signal-to-noise ratio, and thereforemust be considered when estimating the standard de-viation of PDPP velocity estimates. This analysis ispresented next.
For a polarimetric radar, the measured voltage Vm thatcorresponds to scattering from range r at time t can bewritten in terms of the signal and noise componentsaccording to
V (r, t) V (r, t) N (t) N (t)yy yh y yV (r, t) 5 1 , (10)m [ ] [ ]V (r, t) V (r, t) N (t) N (t)hy hh h h
where Vij is the signal component of the voltage at theoutput of the i-polarized receiver when j polarizationwas transmitted, and Ny and Nh represent system noisein the vertical and horizontal receiver channels, respec-tively. The signal component is a function of the targetscattering matrix and matrices that characterize the po-
Unauthenticated | Downloaded 01/25/22 11:09 AM UTC
DECEMBER 1999 1903P A Z M A N Y E T A L .
larimetric transformation of the signal during propa-gation according to Wood (1986)
V (r, t) V (r, t) kyy yh 5 D D S[r, t 2 (r/c)]D D , (11)R P P T2[ ]V (r, t) V (r, t) rhy hh
where DR is the normalized [DR(1, 1) 5 1] complexreceiver distortion matrix, DP is the normalized propa-gation distortion matrix that accounts for differentialattenuation a and phase shift f p according to
1 0D 5 , (12)P fp[ ]0 ae
DT is the normalized complex transmitter distortion ma-trix, S(r, t) is the complex scattering matrix correspond-ing to the range cell located at a distance r from theradar at time t, and the complex constant k accounts forsystem gain and propagation effects. The estimate ofthe cross-correlation function R of the vertical and hor-izontal signals from M independent, closely spaced(small t relative to the decorrelation time of the scat-tered signal) y–h pairs can be expressed as
M1R (r, t) 5 {[V (r, t ) 1 V (r 2 Dr, t ) 1 N (t )]Oyh yy i yh i y iM i51
3 [V (r, t 1 t) 1 V (r 1 Dr, t 1 t)hh i hy i
1 N (t 1 t)]*},h i (13)
where Dr 5 ct /2, ti is the sample time of the ith pair’sfirst sample, and the superscript (*) represents a complexconjugate. Since the cross-polarized signals are scat-tered from cells located at ranges r 6 Dr, only Vhh(r)and Vyy (r) are correlated, and therefore the expectation(^ &) of the estimated cross-correlation function reduces to
^Ryh(r, t)& 5 ^Vyy (r, t)Vhh(r, t 1 t)*&. (14)
For h–y pairs, the expression for ^Rhy (r, t)& takes asimilar form except that the y’s and h’s are interchangedin (14).
Cross-polarization interference, phase noise, and ther-mal noise do not bias the phase of ^R& and therefore donot bias the estimated mean velocity; however, they doincrease the standard deviation of the velocity estimate.From (13) it can be shown (see the appendix) that, ifthe number of independent pulse-pair samples M is suf-ficiently large, the variance of the unbiased mean ve-locity estimate, , can be approximated as2smu
2umax2 2 2s (r) 5 [P (r) 2 |R (r, t)| 1 P (r)P (r 1 Dr) 1 2P (r)P 1 P (r 2 Dr)P (r)m co yh co cross co n cross cou 22M [p |R (r, t)|]yh
21 P (r 2 Dr)P (r 1 Dr) 1 P (r 2 Dr)P 1 P P (r 1 Dr) 1 P ], (15)cross cross cross n n cross n
where Pco(r) 5 ^|Vyy(r)|2& 5 ^|Vhh(r)|2&, Pcross(r) 5^|Vyh(r)|2& 5 ^|Vhy(r)|2&, Pn 5 ^|Ny |2& 5 ^|Nh |2&, and Mrepresents M/2 independent y–h pairs combined withM/2 independent h–y pairs. To simplify (15), the fol-lowing assumptions have been made: no differential re-flectivity, reciprocity (Syh 5 Shy ) (Zrnic 1991), and equalgain in the two orthogonally polarized channels of theradar.
To evaluate , the power terms Pco and Pcross cansmu
be measured directly, or (11) can be evaluated if DT,DR, S, and DP are known or can be approximated; ma-trices DT and DR can be obtained as a result of a polar-imetric calibration of the radar (Wood 1986) and S; andDP can be approximated based on the shape and com-position of the particles that are located in the radarbeam. Note that, if Pcross is zero and the cross-correlationfunction Ryh is replaced by the autocorrelation functionR, (15) reduces to the expression for the variance ofconventional pulse-pair mean velocity estimate, whichis given by Doviak and Zrnic (1984) as
2umax2 21 2 2s 5 [(1 1 SNR ) 2 b ], (16)mu 2 22p b Mwhere SNR is the signal-to-noise ratio.
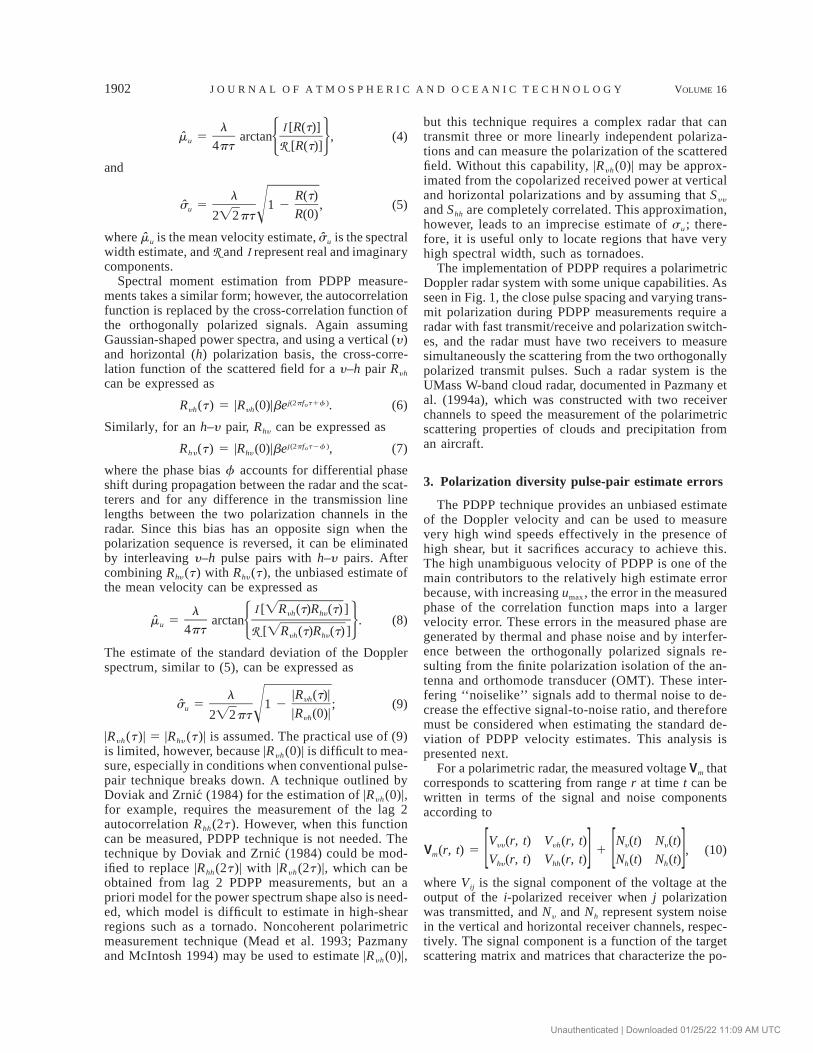
Figure 2 presents a comparison between PDPP andconventional pulse-pair estimate standard deviation asa function of range and spectral width using (15) and(16). The following conditions were assumed for thesecalculations:
R 3-mm (95 GHz) radar wavelength,R uniform scatterer distribution,R 20-dB signal–to–thermal-noise ratio at a range of 1
km (14 dB at 2 km, 8 dB at 4 km, . . . ),R no attenuation,R 20-dB polarization isolation between the co- and
cross-polarized signals; this isolation includes the ef-fect of radar system isolation and scatterer depolar-ization,
R conventional pulse-pair spacing of 66 ms (umax 5 612m s21 at 3-mm wavelength),
R PDPP spacing of 10 ms (umax 5 679 m s21 at 3-mmwavelength), and
R 100 independent samples used for each estimate.
Figure 2 shows that, for low spectrum width, conven-tional pulse-pair estimates have lower standard devia-tion than PDPP estimates, but, as the spectral width
Unauthenticated | Downloaded 01/25/22 11:09 AM UTC
1904 VOLUME 16J O U R N A L O F A T M O S P H E R I C A N D O C E A N I C T E C H N O L O G Y
FIG. 2. Comparison of PDPP and conventional pulse-pair mean velocity estimate errors. Theerrors were calculated for 66 ms (umax 5 612 m s21 at 95 GHz) conventional pulse pair spacingand 10 ms (umax 5 680 m s21 at 95 GHz) PDPP spacing, assuming uniform scatterer distribution,20-dB signal–to–thermal-noise ratio at a range of 1 km, and 20-dB polarization isolation betweencopolarized cross-polarized signals. The standard deviation of the mean velocity estimates areplotted as a function of range (decreasing signal–to–thermal-noise ratio) for different spectralwidths (su 5 2, 6, and 10 m s21).
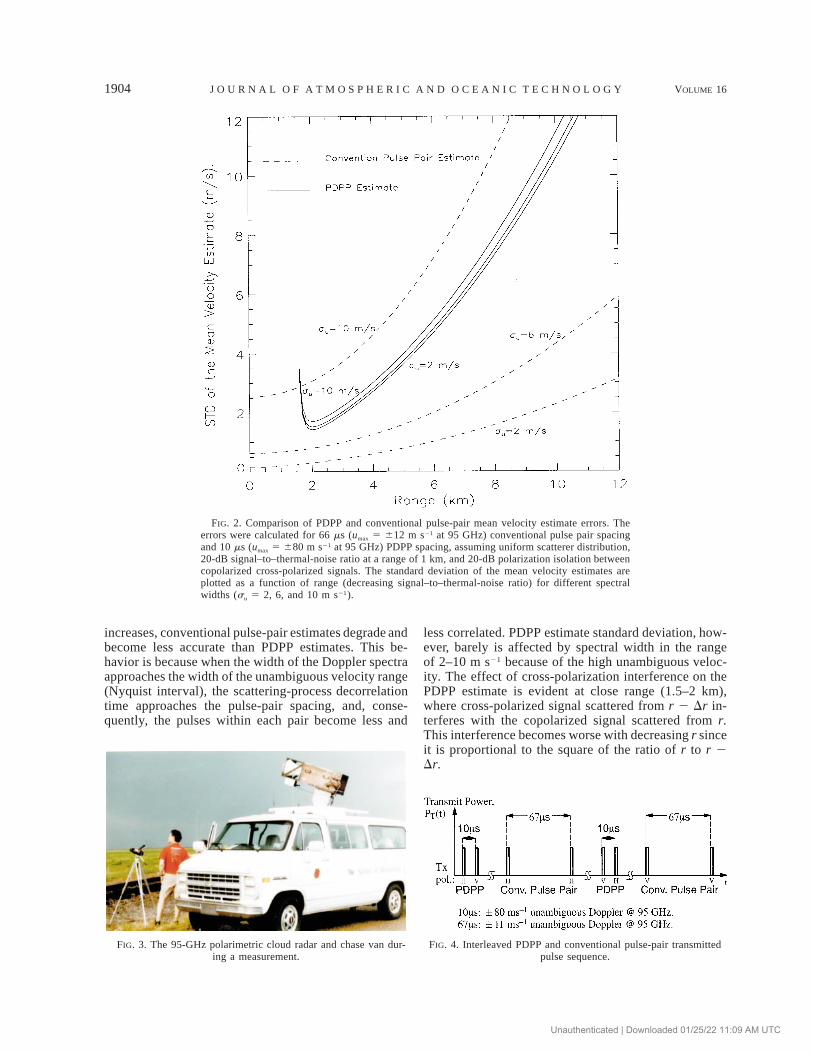
FIG. 4. Interleaved PDPP and conventional pulse-pair transmittedpulse sequence.
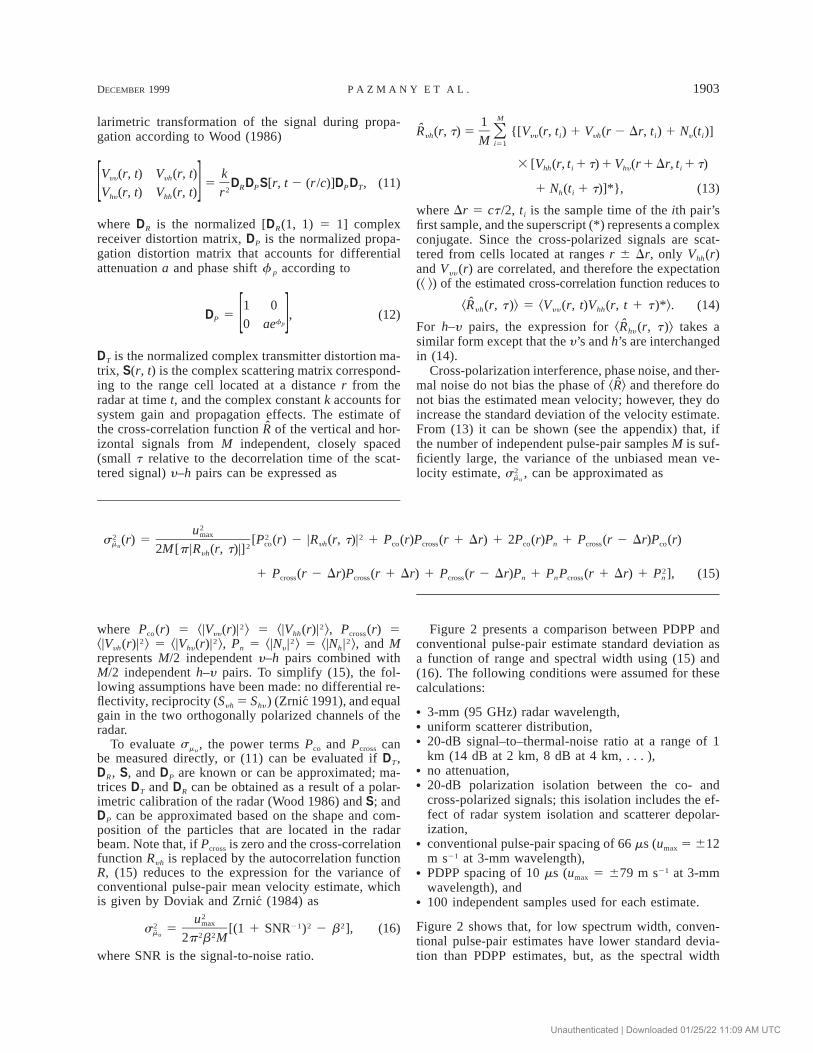
FIG. 3. The 95-GHz polarimetric cloud radar and chase van dur-ing a measurement.
increases, conventional pulse-pair estimates degrade andbecome less accurate than PDPP estimates. This be-havior is because when the width of the Doppler spectraapproaches the width of the unambiguous velocity range(Nyquist interval), the scattering-process decorrelationtime approaches the pulse-pair spacing, and, conse-quently, the pulses within each pair become less and
less correlated. PDPP estimate standard deviation, how-ever, barely is affected by spectral width in the rangeof 2–10 m s21 because of the high unambiguous veloc-ity. The effect of cross-polarization interference on thePDPP estimate is evident at close range (1.5–2 km),where cross-polarized signal scattered from r 2 Dr in-terferes with the copolarized signal scattered from r.This interference becomes worse with decreasing r sinceit is proportional to the square of the ratio of r to r 2Dr.
Unauthenticated | Downloaded 01/25/22 11:09 AM UTC
DECEMBER 1999 1905P A Z M A N Y E T A L .
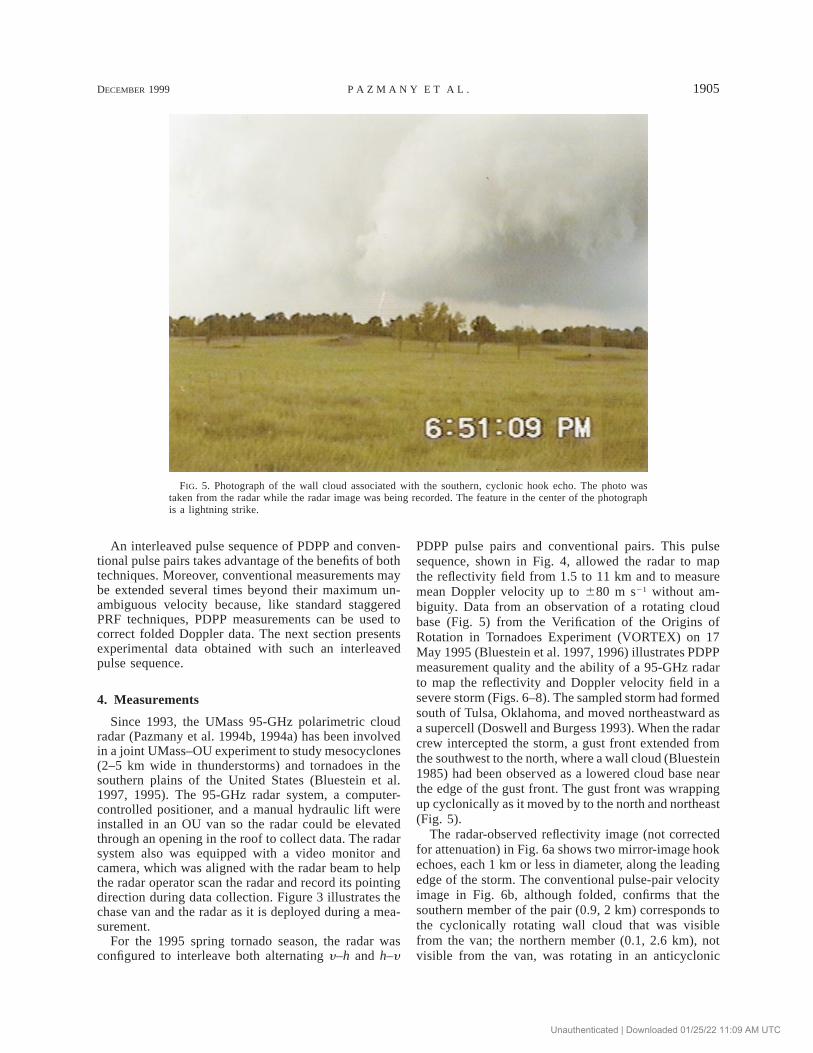
FIG. 5. Photograph of the wall cloud associated with the southern, cyclonic hook echo. The photo wastaken from the radar while the radar image was being recorded. The feature in the center of the photographis a lightning strike.
An interleaved pulse sequence of PDPP and conven-tional pulse pairs takes advantage of the benefits of bothtechniques. Moreover, conventional measurements maybe extended several times beyond their maximum un-ambiguous velocity because, like standard staggeredPRF techniques, PDPP measurements can be used tocorrect folded Doppler data. The next section presentsexperimental data obtained with such an interleavedpulse sequence.
4. Measurements
Since 1993, the UMass 95-GHz polarimetric cloudradar (Pazmany et al. 1994b, 1994a) has been involvedin a joint UMass–OU experiment to study mesocyclones(2–5 km wide in thunderstorms) and tornadoes in thesouthern plains of the United States (Bluestein et al.1997, 1995). The 95-GHz radar system, a computer-controlled positioner, and a manual hydraulic lift wereinstalled in an OU van so the radar could be elevatedthrough an opening in the roof to collect data. The radarsystem also was equipped with a video monitor andcamera, which was aligned with the radar beam to helpthe radar operator scan the radar and record its pointingdirection during data collection. Figure 3 illustrates thechase van and the radar as it is deployed during a mea-surement.
For the 1995 spring tornado season, the radar wasconfigured to interleave both alternating y–h and h–y
PDPP pulse pairs and conventional pairs. This pulsesequence, shown in Fig. 4, allowed the radar to mapthe reflectivity field from 1.5 to 11 km and to measuremean Doppler velocity up to 680 m s21 without am-biguity. Data from an observation of a rotating cloudbase (Fig. 5) from the Verification of the Origins ofRotation in Tornadoes Experiment (VORTEX) on 17May 1995 (Bluestein et al. 1997, 1996) illustrates PDPPmeasurement quality and the ability of a 95-GHz radarto map the reflectivity and Doppler velocity field in asevere storm (Figs. 6–8). The sampled storm had formedsouth of Tulsa, Oklahoma, and moved northeastward asa supercell (Doswell and Burgess 1993). When the radarcrew intercepted the storm, a gust front extended fromthe southwest to the north, where a wall cloud (Bluestein1985) had been observed as a lowered cloud base nearthe edge of the gust front. The gust front was wrappingup cyclonically as it moved by to the north and northeast(Fig. 5).
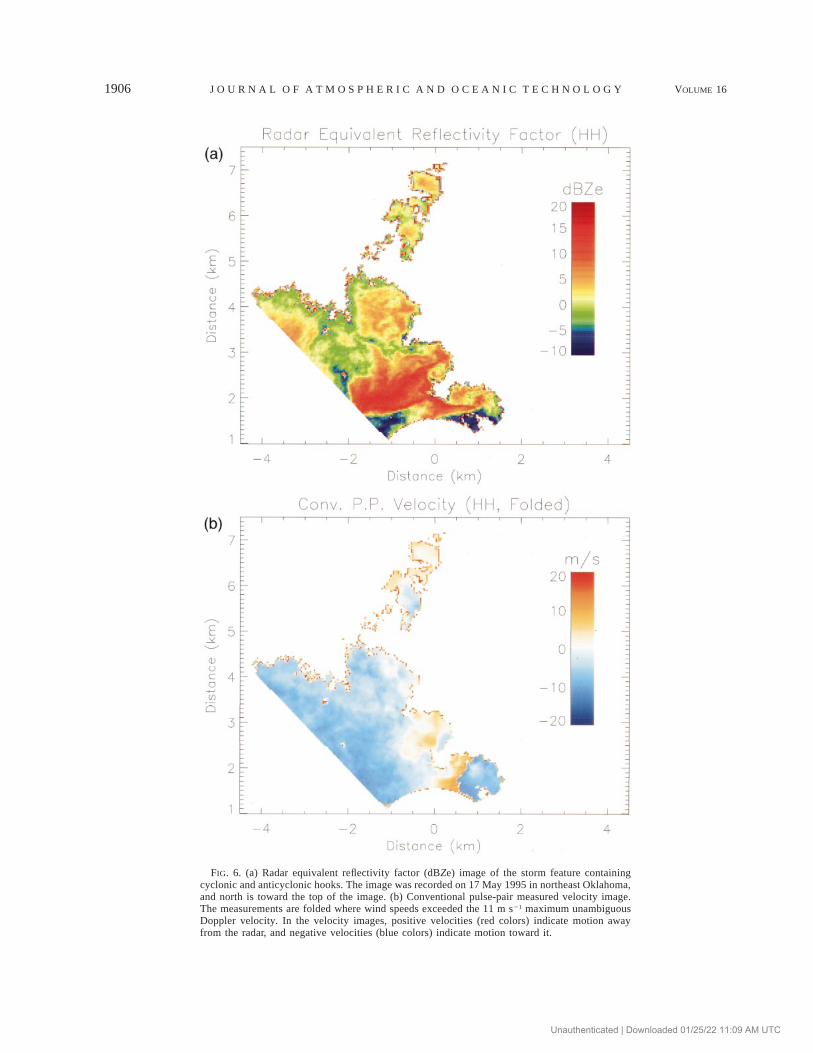
The radar-observed reflectivity image (not correctedfor attenuation) in Fig. 6a shows two mirror-image hookechoes, each 1 km or less in diameter, along the leadingedge of the storm. The conventional pulse-pair velocityimage in Fig. 6b, although folded, confirms that thesouthern member of the pair (0.9, 2 km) corresponds tothe cyclonically rotating wall cloud that was visiblefrom the van; the northern member (0.1, 2.6 km), notvisible from the van, was rotating in an anticyclonic
Unauthenticated | Downloaded 01/25/22 11:09 AM UTC
1906 VOLUME 16J O U R N A L O F A T M O S P H E R I C A N D O C E A N I C T E C H N O L O G Y
FIG. 6. (a) Radar equivalent reflectivity factor (dBZe) image of the storm feature containingcyclonic and anticyclonic hooks. The image was recorded on 17 May 1995 in northeast Oklahoma,and north is toward the top of the image. (b) Conventional pulse-pair measured velocity image.The measurements are folded where wind speeds exceeded the 11 m s21 maximum unambiguousDoppler velocity. In the velocity images, positive velocities (red colors) indicate motion awayfrom the radar, and negative velocities (blue colors) indicate motion toward it.
Unauthenticated | Downloaded 01/25/22 11:09 AM UTC
DECEMBER 1999 1907P A Z M A N Y E T A L .
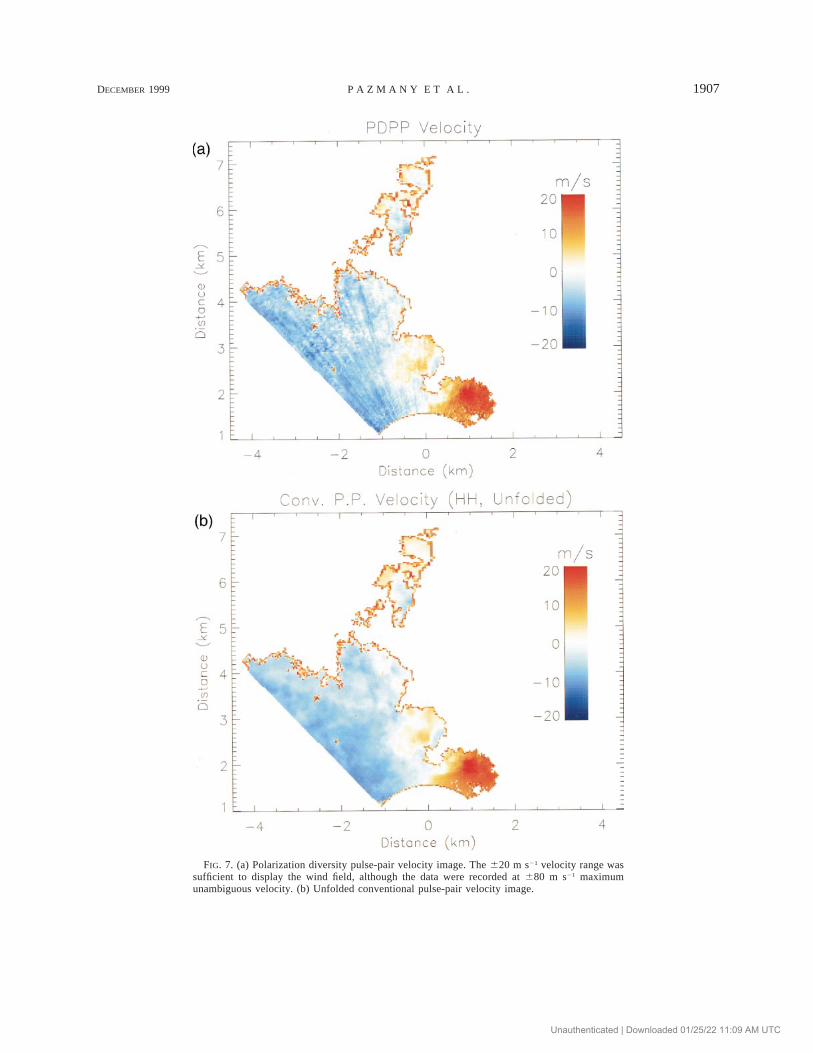
FIG. 7. (a) Polarization diversity pulse-pair velocity image. The 620 m s21 velocity range wassufficient to display the wind field, although the data were recorded at 680 m s21 maximumunambiguous velocity. (b) Unfolded conventional pulse-pair velocity image.
Unauthenticated | Downloaded 01/25/22 11:09 AM UTC
1908 VOLUME 16J O U R N A L O F A T M O S P H E R I C A N D O C E A N I C T E C H N O L O G Y
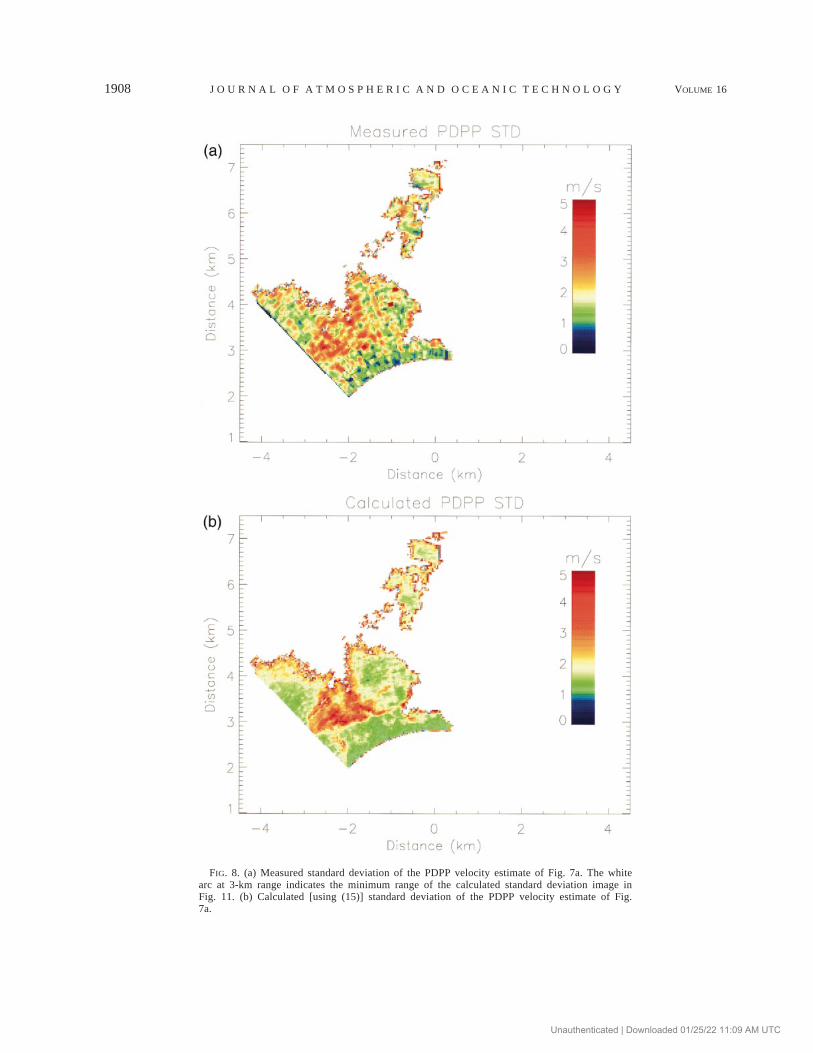
FIG. 8. (a) Measured standard deviation of the PDPP velocity estimate of Fig. 7a. The whitearc at 3-km range indicates the minimum range of the calculated standard deviation image inFig. 11. (b) Calculated [using (15)] standard deviation of the PDPP velocity estimate of Fig.7a.
Unauthenticated | Downloaded 01/25/22 11:09 AM UTC
DECEMBER 1999 1909P A Z M A N Y E T A L .
direction. The hook echoes apparently were associatedwith counterrotating vortices.
The corresponding PDPP Doppler velocity image inFig. 7a, depicts a similar windfield with inferior pre-cision but better accuracy in regions where conventionalpulse pairs folded in Fig. 6b. The PDPP measurementswere sufficiently precise, however, to locate these foldedregions and to reveal the number of folds (wind speedsdid not exceed 33 m s21 so double- or higher-orderfolding did not occur in this dataset). The unfolded con-ventional pulse-pair image is shown in Fig. 7b. Sincethe storm feature did not contain regions with high spec-tral width, such as those associated with a tornado, theconventional pulse-pair measurements were more pre-cise everywhere in the image than were the PDPP mea-surements.
To test the validity of (15), was calculated forsmu
each point in the storm feature image using (15) andwas compared to the standard deviation in the PDPPvelocity image. Since the data acquisition system re-corded only the radar parameters from 1.5 to 9 km,
could be calculated only from 3 to 7.5 km [(15)smu
requires Pcross(r 6 Dr)]. The standard deviation of theradar-measured Doppler velocity was estimated spa-tially from Fig. 7a using a 3 3 3 pixel window (about90 m 3 90 m area at a range of 3 km). The windowwas centered on each point in the PDPP image and thestandard deviation of the enclosed nine points was cal-culated. The same procedure then was implemented onthe conventional pulse-pair image to estimate and tocorrect for the spatial variation in the actual wind fieldover the 3 3 3 pixel window. The resulting image ofthis ‘‘measured’’ standard deviation is shown in Fig. 8a,and, although noisier, in magnitude it agrees well withthe calculated , shown in Fig. 8b.smu
5. Conclusions
The data presented in this paper demonstrate the fea-sibility and the benefit of PDPP technique and howPDPP enables millimeter-wave radars to be used to im-age severe storm dynamics, including tornadoes andhurricane-force winds. The implementation of the PDPPtechnique requires a radar system with two orthogonallypolarized transmitters and receivers, the capability toswitch the transmit polarization rapidly from pulse topulse, and the capability to receive simultaneously thescattered field from both pulses. High polarization iso-lation between the two channels is necessary to mini-mize measurement errors.
The benefit of the PDPP technique is the ability tomeasure Doppler velocity from long range up to extremespeeds even when the standard deviation of the Dopplerspectrum is large; its weakness is the lack of accuracycompared to that of conventional pulse pairs in moderateto low wind conditions and at short ranges. To takeadvantage of the benefits of both techniques, PDPP maybe interleaved with conventional pulse pairs. This pulse
sequence may be the ideal ‘‘staggered’’ PRF because itcan be effective in almost any weather condition andmeasurement configuration.
Acknowledgments. The authors wish to thank BruceWilliams for preparing the radar for the experiment, andDavid Dowell, Herb Stein, Todd Crawford, and ToddHutchinson for their help during the storm chases. Thiswork was supported by NSF Grant ATM-9616730 anda supplement to NSF Grant ATM-9320672 at UMassand by supplements to NSF Grants ATM-9019821 andATM-9302379 at OU.
APPENDIX
Standard Deviation of the Polarization DiversityPulse Pair Estimate of the Mean Velocity
The estimate of the cross-correlation function Ryh
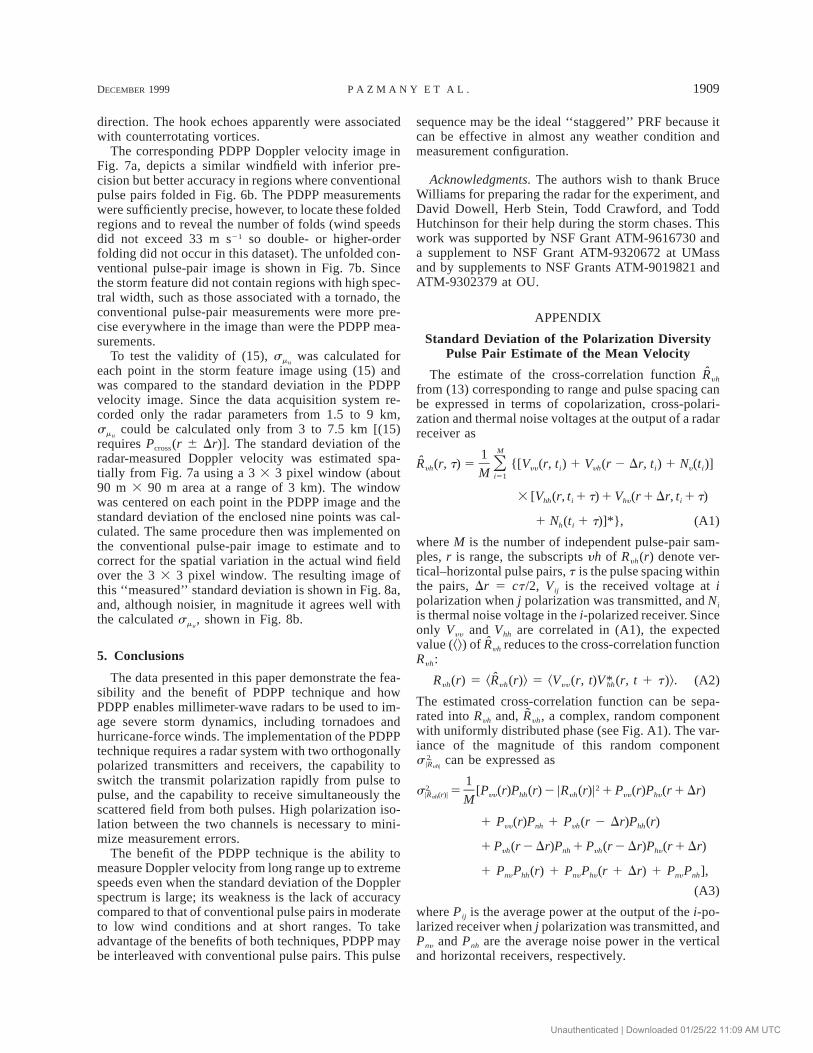
from (13) corresponding to range and pulse spacing canbe expressed in terms of copolarization, cross-polari-zation and thermal noise voltages at the output of a radarreceiver as
M1R (r, t) 5 {[V (r, t ) 1 V (r 2 Dr, t ) 1 N (t )]Oyh yy i yh i y iM i51
3 [V (r, t 1 t) 1 V (r 1 Dr, t 1 t)hh i hy i
1 N (t 1 t)]*},h i (A1)
where M is the number of independent pulse-pair sam-ples, r is range, the subscripts yh of Ryh(r) denote ver-tical–horizontal pulse pairs, t is the pulse spacing withinthe pairs, Dr 5 ct /2, Vij is the received voltage at ipolarization when j polarization was transmitted, and Ni
is thermal noise voltage in the i-polarized receiver. Sinceonly Vyy and Vhh are correlated in (A1), the expectedvalue (^&) of Ryh reduces to the cross-correlation functionRyh:
Ryh(r) 5 ^Ryh(r)& 5 ^Vyy (r, t) (r, t 1 t)&. (A2)V*hh
The estimated cross-correlation function can be sepa-rated into Ryh and, Ryh, a complex, random componentwith uniformly distributed phase (see Fig. A1). The var-iance of the magnitude of this random component
can be expressed as2s ˜|Ryh|
12 2s 5 [P (r)P (r) 2 |R (r)| 1 P (r)P (r 1 Dr)˜|R (r)| yy hh yh yy hyyh M
1 P (r)P 1 P (r 2 Dr)P (r)yy nh yh hh
1 P (r 2 Dr)P 1 P (r 2 Dr)P (r 1 Dr)yh nh yh hy
1 P P (r) 1 P P (r 1 Dr) 1 P P ],ny hh ny hy ny nh
(A3)
where Pij is the average power at the output of the i-po-larized receiver when j polarization was transmitted, andPny and Pnh are the average noise power in the verticaland horizontal receivers, respectively.
Unauthenticated | Downloaded 01/25/22 11:09 AM UTC
1910 VOLUME 16J O U R N A L O F A T M O S P H E R I C A N D O C E A N I C T E C H N O L O G Y
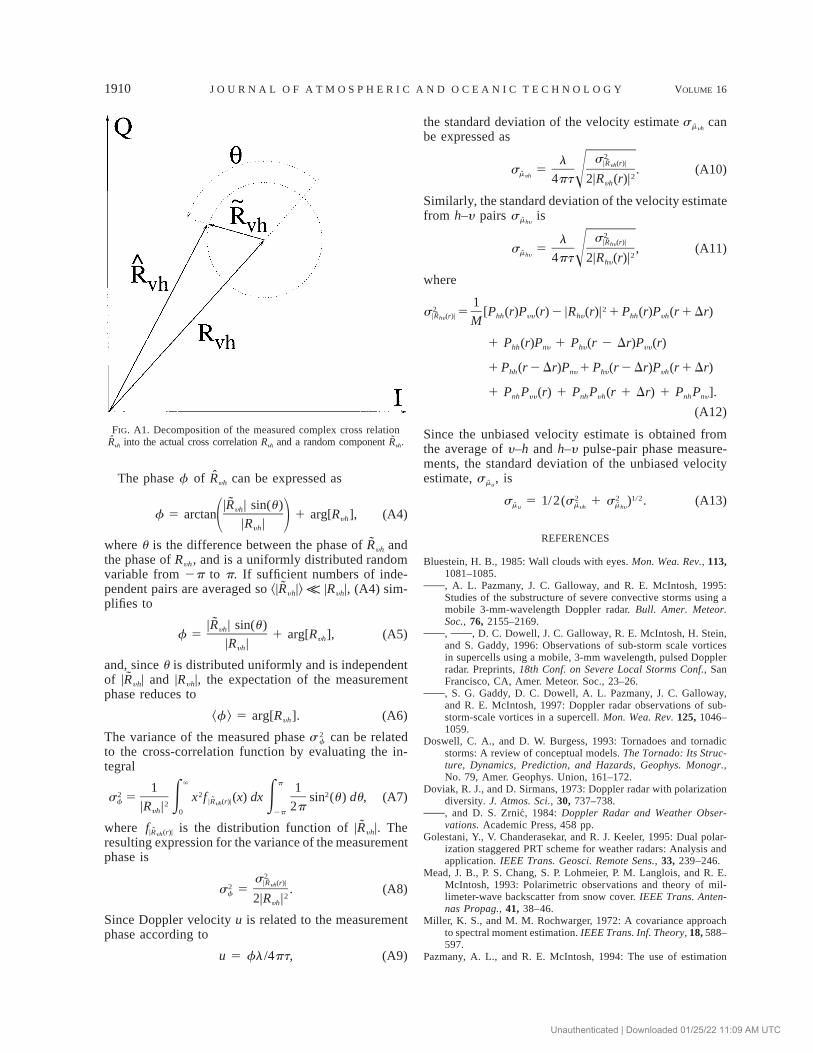
FIG. A1. Decomposition of the measured complex cross relationRyh into the actual cross correlation Ryh and a random component Ryh.
The phase f of Ryh can be expressed as
˜|R | sin(u)yhf 5 arctan 1 arg[R ], (A4)yh1 2|R |yh
where u is the difference between the phase of Ryh andthe phase of Ryh, and is a uniformly distributed randomvariable from 2p to p. If sufficient numbers of inde-pendent pairs are averaged so ^|Ryh|& K |Ryh|, (A4) sim-plifies to
˜|R | sin(u)yhf 5 1 arg[R ], (A5)yh|R |yh
and, since u is distributed uniformly and is independentof |Ryh| and |Ryh|, the expectation of the measurementphase reduces to
^f& 5 arg[Ryh]. (A6)
The variance of the measured phase can be related2s f
to the cross-correlation function by evaluating the in-tegral
` p1 12 2 2s 5 x f (x) dx sin (u) du, (A7)˜f E |R (r)| Eyh2|R | 2pyh 0 2p
where is the distribution function of |Ryh|. Thef ˜|R (r)|yh
resulting expression for the variance of the measurementphase is
2s ˜|R (r)|yh2s 5 . (A8)f 22|R |yh
Since Doppler velocity u is related to the measurementphase according to
u 5 fl /4pt, (A9)
the standard deviation of the velocity estimate cansmyh
be expressed as2sl ˜|R (r)|yhs 5 . (A10)myh 2!4pt 2|R (r)|yh
Similarly, the standard deviation of the velocity estimatefrom h–y pairs issmhy
2sl ˜|R (r)|hys 5 , (A11)mhy 2!4pt 2|R (r)|hy
where
12 2s 5 [P (r)P (r) 2 |R (r)| 1 P (r)P (r 1 Dr)˜|R (r)| hh yy hy hh yhhy M
1 P (r)P 1 P (r 2 Dr)P (r)hh ny hy yy
1 P (r 2 Dr)P 1 P (r 2 Dr)P (r 1 Dr)hh ny hy yh
1 P P (r) 1 P P (r 1 Dr) 1 P P ].nh yy nh yh nh ny
(A12)
Since the unbiased velocity estimate is obtained fromthe average of y–h and h–y pulse-pair phase measure-ments, the standard deviation of the unbiased velocityestimate, , issmu
2 2 1/2s 5 1/2(s 1 s ) . (A13)m m mu yh hy
REFERENCES
Bluestein, H. B., 1985: Wall clouds with eyes. Mon. Wea. Rev., 113,1081–1085., A. L. Pazmany, J. C. Galloway, and R. E. McIntosh, 1995:Studies of the substructure of severe convective storms using amobile 3-mm-wavelength Doppler radar. Bull. Amer. Meteor.Soc., 76, 2155–2169., , D. C. Dowell, J. C. Galloway, R. E. McIntosh, H. Stein,and S. Gaddy, 1996: Observations of sub-storm scale vorticesin supercells using a mobile, 3-mm wavelength, pulsed Dopplerradar. Preprints, 18th Conf. on Severe Local Storms Conf., SanFrancisco, CA, Amer. Meteor. Soc., 23–26., S. G. Gaddy, D. C. Dowell, A. L. Pazmany, J. C. Galloway,and R. E. McIntosh, 1997: Doppler radar observations of sub-storm-scale vortices in a supercell. Mon. Wea. Rev. 125, 1046–1059.
Doswell, C. A., and D. W. Burgess, 1993: Tornadoes and tornadicstorms: A review of conceptual models. The Tornado: Its Struc-ture, Dynamics, Prediction, and Hazards, Geophys. Monogr.,No. 79, Amer. Geophys. Union, 161–172.
Doviak, R. J., and D. Sirmans, 1973: Doppler radar with polarizationdiversity. J. Atmos. Sci., 30, 737–738., and D. S. Zrnic, 1984: Doppler Radar and Weather Obser-vations. Academic Press, 458 pp.
Golestani, Y., V. Chanderasekar, and R. J. Keeler, 1995: Dual polar-ization staggered PRT scheme for weather radars: Analysis andapplication. IEEE Trans. Geosci. Remote Sens., 33, 239–246.
Mead, J. B., P. S. Chang, S. P. Lohmeier, P. M. Langlois, and R. E.McIntosh, 1993: Polarimetric observations and theory of mil-limeter-wave backscatter from snow cover. IEEE Trans. Anten-nas Propag., 41, 38–46.
Miller, K. S., and M. M. Rochwarger, 1972: A covariance approachto spectral moment estimation. IEEE Trans. Inf. Theory, 18, 588–597.
Pazmany, A. L., and R. E. McIntosh, 1994: The use of estimation
Unauthenticated | Downloaded 01/25/22 11:09 AM UTC
DECEMBER 1999 1911P A Z M A N Y E T A L .
techniques to reduce noncoherent polarimetric measurement er-rors. IEEE Trans. Antennas Propag., 42, 1325–1328., , R. D. Kelly, and G. Vali, 1994a: An airborne 95 GHzdual-polarized radar for cloud studies. IEEE Trans. Geosci. Re-mote Sens., 32, 731–739., J. B. Mead, R. E. McIntosh, M. Hervig, R. Kelly, and G. Vali,1994b: 95-GHz polarimetric radar measurements of orographiccap clouds. J. Atmos. Oceanic Technol., 11, 140–153.
Wood, A. M., 1986: A theoretical study of calibration procedures forcoherent and noncoherent polarimetric radars. Tech. Rep. 86011,Royal Signals and Radar Establishment, Malverne, 43 pp.
Zrnic, D. S., 1997: Spectral moment estimates from correlated pulsepairs. IEEE Trans. Aerosp. Electron. Syst., 13, 344–345., 1991: Complete polarimetric and Doppler measurements witha single receiver radar. J. Atmos. Oceanic Technol., 8, 159–165.
Unauthenticated | Downloaded 01/25/22 11:09 AM UTC


![DOA and Polarization Estimation for Non-Circular Signals ... · arXiv:1712.05587v1 [eess.SP] 15 Dec 2017 1 DOA and Polarization Estimation for Non-Circular Signals in 3-D Millimeter](https://img.pdfslide.us/doc/110x75/5ca12cca88c9932f098bb9a6/doa-and-polarization-estimation-for-non-circular-signals-arxiv171205587v1.jpg)