Embed Size (px)
Citation preview

1
PolarPortalSeasonReport2018
UnusualweatherresultedinanatypicalmeltingseasonintheArcticThe2017-18seasonintheArctichasonceagainbeenextraordinary.Acoldsummerwithhighlevels of precipitation has benefitted the Ice Sheet, whilst glaciers have continued thedevelopmentseenduringthe lastsixyears inwhichtheyhavemoreor lessmaintainedtheirarea.Thesea ice,on theotherhand,hasbeenmorevulnerable,withhighsea temperaturesand warmwinds leading to a large area north of Greenland being ice-free in two separateperiods–FebruaryandAugustrespectively.TheheatwaveinEuropeandthecoldGreenlandicsummerareconnectedthroughtheAtlantic“seesaw”Manypeople in theNorthernHemisphere – andinparticularnorthernEurope–willremembertherecord-breakingheatanddroughtofthesummerof2018.Incontrast,Greenlandhadarathercoldand snowy summer, particularly in June and attheendofAugust,whenamajor stormdumpedlargeamountsofsnowontheIceSheet.
As early as AD 1230, a Norwegian book called“TheKing’sMirror”containedadescriptionofthecorrelation between stormy weather over theeastern Atlantic and cold air, which is “suckeddown” from the Ice Sheet to inhabited areas.Muchlater,inthe1770s,DanishmissionaryHansEgede observed that “when the winter inDenmark was severe, as we perceive it, thewinter inGreenland in itsmannerwasmild, andconversely. In other words, the “seesaw”connection between warm weather in Europeand cold weather in Greenland (and vice versa)
has been a recognised phenomenon forcenturies. And the summer of 2018 was aparticularly clear example of this circulationanomaly.
From the end of April until mid-October, acirculation pattern in the form of the Greekcapital letter Ω over Scandinavia was prevailingmostofthetime.Thistypeofcirculation“blocks”thenormalwesterlies,andwhilewarmairmovesnorthacross largepartsofnorthernEurope,coldairfromthecentralArcticispresentoverIcelandandGreenland. This pattern is seenmost clearlyin the map of temperature anomalies for May2018 shown below. But the same circulationanomalywaspresentduringtheothermonthsaswell.
Figure1:TemperatureanomalyforMay2018relativetotheaveragefor1981-2010.Credit:CopernicusClimateChangeService/ECMWF.
2
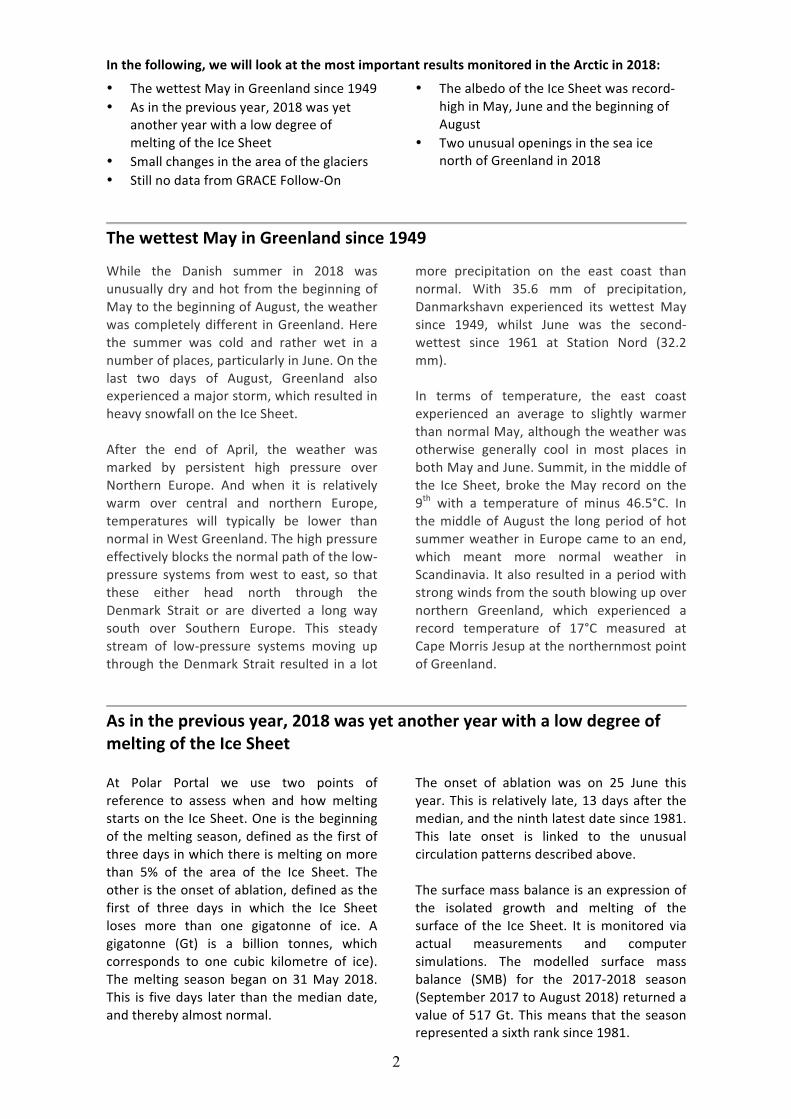
Inthefollowing,wewilllookatthemostimportantresultsmonitoredintheArcticin2018:
• ThewettestMayinGreenlandsince1949• Asinthepreviousyear,2018wasyet
anotheryearwithalowdegreeofmeltingoftheIceSheet
• Smallchangesintheareaoftheglaciers• StillnodatafromGRACEFollow-On
• ThealbedooftheIceSheetwasrecord-highinMay,JuneandthebeginningofAugust
• TwounusualopeningsintheseaicenorthofGreenlandin2018
ThewettestMayinGreenlandsince1949
While the Danish summer in 2018 wasunusuallydryandhot fromthebeginningofMaytothebeginningofAugust,theweatherwascompletelydifferent inGreenland.Herethe summer was cold and rather wet in anumberofplaces,particularlyinJune.Onthelast two days of August, Greenland alsoexperiencedamajorstorm,whichresultedinheavysnowfallontheIceSheet.After the end of April, the weather wasmarked by persistent high pressure overNorthern Europe. And when it is relativelywarm over central and northern Europe,temperatures will typically be lower thannormalinWestGreenland.Thehighpressureeffectivelyblocksthenormalpathofthelow-pressure systems fromwest to east, so thatthese either head north through theDenmark Strait or are diverted a long waysouth over Southern Europe. This steadystream of low-pressure systems moving upthrough theDenmarkStrait resulted ina lot
more precipitation on the east coast thannormal. With 35.6 mm of precipitation,Danmarkshavn experienced its wettest Maysince 1949, whilst June was the second-wettest since 1961 at Station Nord (32.2mm).In terms of temperature, the east coastexperienced an average to slightly warmerthannormalMay,althoughtheweatherwasotherwise generally cool in most places inbothMayandJune.Summit,inthemiddleofthe Ice Sheet, broke theMay record on the9th with a temperature of minus 46.5°C. InthemiddleofAugust the longperiodofhotsummerweather inEuropecametoanend,which meant more normal weather inScandinavia. Italsoresulted inaperiodwithstrongwindsfromthesouthblowingupovernorthern Greenland, which experienced arecord temperature of 17°C measured atCapeMorrisJesupatthenorthernmostpointofGreenland.
Asinthepreviousyear,2018wasyetanotheryearwithalowdegreeofmeltingoftheIceSheet
At Polar Portal we use two points ofreference to assess when and how meltingstartsontheIceSheet.Oneisthebeginningofthemeltingseason,definedasthefirstofthreedaysinwhichthereismeltingonmorethan 5% of the area of the Ice Sheet. Theotheristheonsetofablation,definedasthefirst of three days in which the Ice Sheetloses more than one gigatonne of ice. Agigatonne (Gt) is a billion tonnes, whichcorresponds to one cubic kilometre of ice).Themelting season began on 31May 2018.This is fivedays later than themediandate,andtherebyalmostnormal.
The onset of ablation was on 25 June thisyear.This is relatively late,13daysafterthemedian,andtheninthlatestdatesince1981.This late onset is linked to the unusualcirculationpatternsdescribedabove.Thesurfacemassbalanceisanexpressionofthe isolated growth and melting of thesurface of the Ice Sheet. It ismonitored viaactual measurements and computersimulations. The modelled surface massbalance (SMB) for the 2017-2018 season(September2017toAugust2018)returnedavalueof517Gt.Thismeans that theseasonrepresentedasixthranksince1981.

3
Figure2:ThegraphshowshowgreatapercentageofthetotalareaoftheIceSheethasseenmelting,definedasminimum1mmmeltingatthesurface.Thebluelineindicatesthedegreeofmeltingin2018,whilstthedarkgreycurveshowsthemeanvaluefortheperiod1981-2010.Thelightgreybandshowsthedifferencesfromyeartoyear,althoughthehighestandlowestdailyvaluesarediscounted.Melting fromthe IceSheet isalsomeasureddirectly at selected locations within thePROMICE project. Observations from the 18weatherstationsinthemeltingregionoftheIceSheetindicatethattheaveragedegreeofmeltingwas the lowest recorded during the10 years in which observations have beenmade (2008-2018). The southern andnorthern measurement stations (KPC, THUand QAS) registered the lowest amount ofmeltingwith 1.3 – 1.9 standarddeviation inrelation to the mean, whilst melting at theothermeasurement stationswaswithinonestandard deviation. Only two out of eightmeasurement positions (NUK and KAN)registered more melting than normal,although these figures did not lie outsidemeasurementuncertainties.
Consistentwiththenetmeltingobservations,summer temperatures in June, July andAugust were lower than average for 2008-2018 at all PROMICE measurement stations(bymore thanone standarddeviationalongthe northern, north-western and southernedge of the Ice Sheet). July 2018 was thecoldestmonthcomparedtotheperiod2008-2018along thenorthern,north-westernandsouthernpartoftheIceSheetmeltingarea.Looking at all measurements in themonthsfromJanuarytoAugust,28%ofthemonthlytemperaturesweremore thanone standarddeviationbelowthemean.Andonly3%weremorethanonestandarddeviationabovethemean.Areas with ice not covered by snow areseparated from snow-covered areas by theso-called snowline. This can be used todocument changes in areas of non-snow-covered ice. In 2018 the snowlinewas closeto the average for 2000-2018, whichcorrespondstothepositivealbedoanomalies(see below) and the cold summertemperatureswhich reduced the amount ofmeltingin2018.The extent of non-snow-covered areas hasincreasedduringtheperiod2000-2018byanaverage of 500 km2 per year. Although thisincrease is not significant, it neverthelessdemonstrates that there has been a littlemoremeltingthanaccumulationof icesince2000.
SurfacemassbalanceSurfacemassbalanceisanexpressionoftheisolatedgrowthandmeltingofthesurfaceoftheIceSheet.PrecipitationcontributestoanincreaseofthemassoftheIceSheet,whilstmeltingcausestheIceSheettolosemass.Inrelationtothetotalmassbalance,thesurfacemassbalancesayssomethingaboutthecontributionatthesurfaceoftheIceSheet–i.e.excludingthatwhichislostwhenglacierscalveicebergsandmeltastheymeetthewarmseawater.Sincethe1990s,thesurfacemassbalancehasgenerallybeendeclining.
4
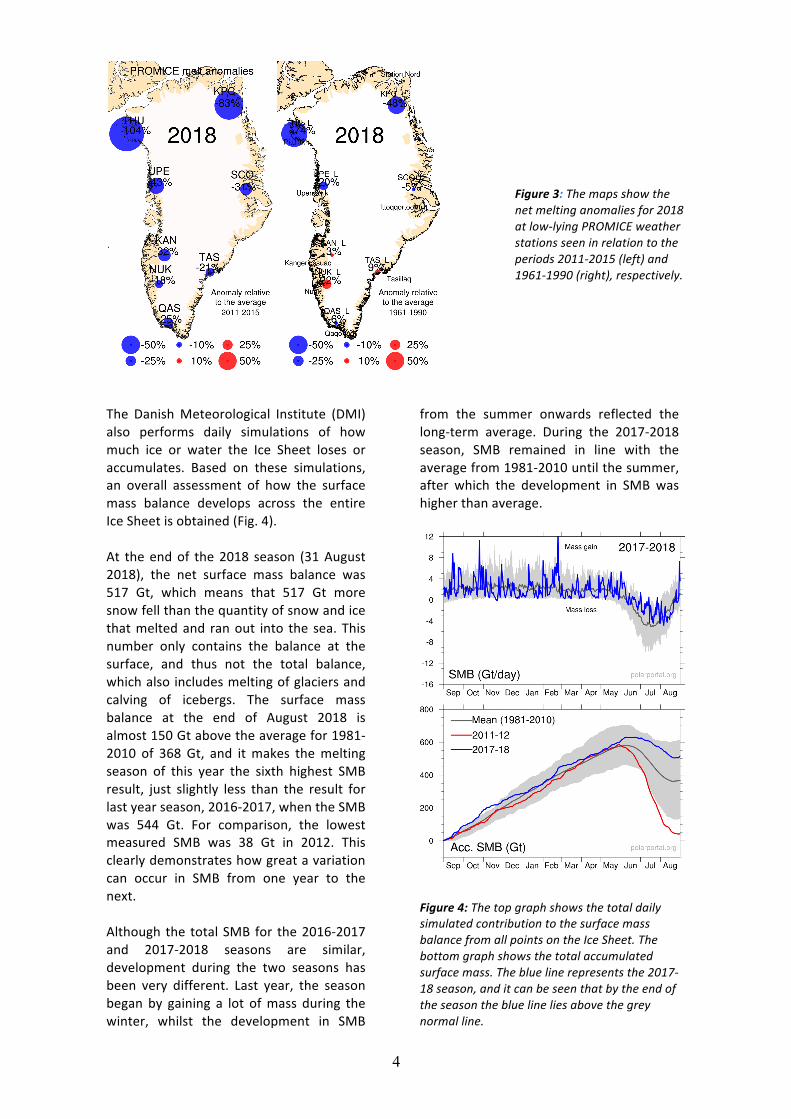
Figure3:Themapsshowthenetmeltinganomaliesfor2018atlow-lyingPROMICEweatherstationsseeninrelationtotheperiods2011-2015(left)and1961-1990(right),respectively.
The DanishMeteorological Institute (DMI)also performs daily simulations of howmuch ice or water the Ice Sheet loses oraccumulates. Based on these simulations,an overall assessment of how the surfacemass balance develops across the entireIceSheetisobtained(Fig.4).At theendof the2018 season (31August2018), the net surface mass balance was517 Gt, which means that 517 Gt moresnowfellthanthequantityofsnowandicethatmeltedand ranout into the sea.Thisnumber only contains the balance at thesurface, and thus not the total balance,whichalsoincludesmeltingofglaciersandcalving of icebergs. The surface massbalance at the end of August 2018 isalmost150Gtabovetheaveragefor1981-2010 of 368 Gt, and itmakes themeltingseason of this year the sixth highest SMBresult, just slightly less than the result forlastyearseason,2016-2017,whentheSMBwas 544 Gt. For comparison, the lowestmeasured SMB was 38 Gt in 2012. Thisclearlydemonstrateshowgreatavariationcan occur in SMB from one year to thenext.Although the totalSMB for the2016-2017and 2017-2018 seasons are similar,development during the two seasons hasbeen very different. Last year, the seasonbegan by gaining a lot ofmass during thewinter, whilst the development in SMB
from the summer onwards reflected thelong-term average. During the 2017-2018season, SMB remained in line with theaveragefrom1981-2010untilthesummer,after which the development in SMB washigherthanaverage.
Figure4:ThetopgraphshowsthetotaldailysimulatedcontributiontothesurfacemassbalancefromallpointsontheIceSheet.Thebottomgraphshowsthetotalaccumulatedsurfacemass.Thebluelinerepresentsthe2017-18season,anditcanbeseenthatbytheendoftheseasonthebluelineliesabovethegreynormalline.

5
SmallchangesintheareaoftheglaciersThe Greenland Ice Sheet loses mass via,among other things, itsmarine terminatingglaciersthatrunoutintothesea.Ifthereisa state of equilibrium, the calving of theicebergsandtheflowoficetowardstheseaareinbalance.Theareaofthe47largestglaciershasbeenmonitored by the Sentinel-2, LANDSAT andASTER satellites since 1999. Monitoringreveals that during the last six years from2012-2013until 2017-2018, there has beenaminorannuallossintermsoftheglaciers’area.Thechangefrom2016-2017to2017-2018inthe net area of the 47 monitored glaciersshowsanincreaseof+4.1km2,whichmakes2018 theonly yearwith apositive balance.This is followed by the 2006-2007 season(-19.8km2).Thislatestlossofareaisthereby113.8km2lessthantheaveragelossforthe19 seasons from 1999-2000 to 2017-2018,which was -109.7 km2. Of the monitoredglaciers,21retreatedand12grewinsize.Inthe remaining 14 glaciers the changes inareawerewithin±0.2km2.The biggest change for a single glacier wasthe loss of area of the Humboldt glacier inNorthwest Greenland (-13.3 km2) and theKangerdlugssuaq glacier in East Greenland(-8.1km2).Atthesametime,thePetermann
glacier grew (+19.1 km2), as was also thecasethepreviousyear(+11.5km2).TheJakobshavnglaciercontinueditsretreatand lost 2.6 km2 in relation to the yearbefore,whilsttheHelheimglacierincreasedits area by 10.6 km2. The changes are thusvery small. In comparison, the Petermannglacierlost323.4km2in2010and277.6km2in2012.Ifonlythe6 largestglaciersareconsidered,they have grown only slightly overall. Thisapplies to Jakobshavn, Kangerdlugssuaq,Helheim, Petermann, Zachariae and 79°Glacier, which increased their area by anaverageof+3.7km2duringtheyear.Twoofthese glaciers retreated, however, whereastheotherfourgrewinsize.
Figure 5: The graph shows the total change intheareaof47ofthelargestmarineterminatingglaciers in Greenland. It shows that since 2012theseglaciershavelostareatoamodestextent.
StillnodatafromtheGRACEFollow-OnmissionData used for calculations of themelting ofice in theArctic and the contribution of theIce Sheet to rising sea levelshas come fromthe GRACE satellites since 2002. However,the mission had to be abandoned in 2017becausethebatteriesononeofthesatellitesranoutofpower.On22May2018,twonewsatellites were therefore launched: theGRACE-FO satellites (GRACE Follow On),which are replacing the original GRACEsatellites.
However, no useful data has yet beenacquired from the new satellites, and therewill therefore be a gap in gravity data untilthe GRACE Follow-On mission can providedataformeasurementofhowthetotalmassbalance of the Ice Sheet has developedduringthe2017-2018season.As thisdata isunavailable, it isnotpossibletosaywhetherthehighSMBofthisseasonalsomeansthatthetotalmasslossforthe2017-2018seasonis low, as was the case in the 2016-2017season.

6
During the period 2003-2011 the Ice Sheethas on average lost 234 Gt every year. Thismeans that the slight total mass increase
during the last two seasons cannotcompensateforthesemasslosses.
ThealbedooftheIceSheetwasrecord-highinMay,JuneandthebeginningofAugustAlbedodatacomesfromtheMODISsatellite(Moderate-resolution Imaging Spectroradio-meter), which since 2000 has observed thereflection of sunlight from the Earth. Thealbedo is an expression of the ability of asurface to reflect the rays of the Sun. Thelighter the surface, the better it is atreflecting theraysof thesun.Darksurfaces,ontheotherhand,absorblargequantitiesofsolarenergyasheat.In 2018 the albedowas record-high inMay,JuneandthebeginningofAugust–butnotinJuly or the end of August. Normally, thesummer snowmeltwill exposedarker snowand ice, which absorbs more solar energy,
whichwill in turn lead to increasedmelting.However, this summer’s frequentsnowstorms tended to refresh the clear,whitesurface,whichsloweddownthetypicalice albedo feedback, which can otherwiselead to increased melting when dark areasabsorbsolarenergyandbegintomelt.The Ω blocking referred to earlier wasinterrupted for a few days in themiddle ofAugust.Whenthisoccurred,theairflowoverEuropewas generally from thewest, at thesame time aswhich southerlywinds causedmelting over almost half of Greenland (seealsoFig2).
Figure6:Thefigureshowsthedailyaverageofalbedomeasurementsfor2000,2010,2012,2017and2018.Thepurplelineis2018.Thisshowsthatthealbedowasrecord-highinMay,JuneandthebeginningofAugust,butnotinJulyandtheendofAugust.
TwounusualopeningsintheseaicenorthofGreenlandin2018Sea ice is important for the climatebecauseit is light and thus has a high albedo. Thesmaller the extent of the sea ice, the largerthedarkwater surfaces in theArcticwill bethat absorb solar energy and therebycontributetofurthermeltingofthe ice.Thisresults in furtherwarmingof the sea,whichwillinturndelayfreezingintheautumn.This
means that the ice therefore has a shorterperiod inwhichtothickenduringthecourseof the winter, resulting in thinner ice andthus earlier spring breakup. Sea ice whichmelts also absorbs more sunlight than coldandfrozenseaice.Whenthetemperatureinthe Arctic is above freezing, the sea icebegins its melting season. This occurred on

7
13 June this year,which is very close to themedian,whichis12June.DMI’s sea ice model for simulation of thethickness of the sea ice shows that the seaice was a little thicker at the beginning of2018 than the year before, although theextent of coverage of the sea ice was thelowest for the time of year for at least 40years.The season will be remembered for twounusual periods with open sea north ofGreenland, where there is normallypermanent polar ice cover. The first periodwas – somewhat unusually – at the end ofFebruary. In thiscase thesea icewasblownaway from the north coast by a persistentand warm Foehn wind which broughttemperatures as high as plus 6 degreesCelsius.Thiscausedanopeningintheseaicewith a length of several hundred kilometresandmorethan100kmwide insomeplaces.InMarch,however,thetemperaturefelltoamore normal level ofminus 30 tominus 20degrees,andtheopeningwascoveredbyseaiceagain.Theicewassothin,however,thatit melted once more in August. The open
area north of Greenland lasted only a shorttimeanddidnothaveanymajorsignificancein terms of the extent of the sea ice as awhole. Compared to the last 40 years ofsatelliteimagery,anewminimumrecordwasthusnotset.Althoughtheextentofcoverageoftheseaiceinthisseasonwas2millionkm2belowtheaveragefor1981-2000, itwasstill1.2 million km2 more than the record-lowcoveragein2012.However,ifthebreak-upoftheperennialicecontinues,thestabilityoftheseaicemaybethreatened. If the perennial ice breaks upanddriftssouth(where itwillmelt), there isaconsiderableriskthatice-freesummerswilloccurintheArcticOcean.During the 2018 melting season thetemperatureswerelowerthanaveragenorthofCanada,whilstitwaswarmerthannormalnorthofSiberia.Thishadsignificanceforthesea ice situation, and thereby thepossibilityfor sailing in these areas. The northeastpassage was open, whilst the northwestpassagewasclosedwithiceincertainareas.
Figure7:DMI'sgraphoftheextentoftheseaicefrom23September,whichwasthedateofthelowestextentoftheseason.ThemapandgraphicalrepresentationarebasedonEUMETSAT'sOSISAFiceconcentrationcalculationsandillustratetheextentofseaareasthathavemorethan15%icecover.GraphicsfromPolarPortal.

8
The sea ice has direct influence on thewarming of the surface water of the seaduringthesummer.AlongtheSiberiancoast,intheBeringStraitandintheGreenlandSea,summer 2018 saw large areas where thesurface water was between 2°C and 4°C, inthe Bering Strait and Chukchi Sea even 5°Cabove the norm. The high watertemperatures meant that the sea iceminimum was registered as late as 23September, and this in turnmeant that the
refreezingoftheseaicewascorrespondinglydelayed.Alongwith1997,thiswasthelatestsummer minimum registered since satelliteobservations of sea ice began. The finalextent of coverage of the sea ice was thesixth lowest ever measured, with the samevalueasin2008and2010.Andtheextentofthesea ice in Januarywasthe lowestand inSeptember the ninth-lowest measured bysatellitessince1979.
ExtentoftheArcticiceTheextentoftheArcticseaiceisanalysedbyboththeAmericanNSIDCandtheEuropeanEUMETSAT–andthusalsobyDMI.Bothcentresusethesamesatellitedata,buttheytreatnoiseoveropenwaterandalongtheedgesoftheiceslightlydifferently.Thismeansthatthegraphsfortheextentoftheseaicearenotquiteidentical.TheEuropeanfiguresarecompiledviadatafromDMIresearchersandarepublishedinthescientificjournalTheCryosphere.ObservationsoftheextentoftheseaicerevealthattheareaoftheArcticsummericehasfallenannuallybyanaverageofapprox.94,000km2sincethe1970s.ThisismorethantwicethetotallandareaofDenmark.