Embed Size (px)
Citation preview

PolandWhy not?!!!
Herning, 4 September 2013
Business Opportunities for Danish Companies in PolandBusiness Opportunities for Danish Companies in Poland

Jacek Wójcikowski
Commercial CounsellorPolish Embassy
in POLAND

148 Danish companies have
invested more than USD 1 mio
in POLAND
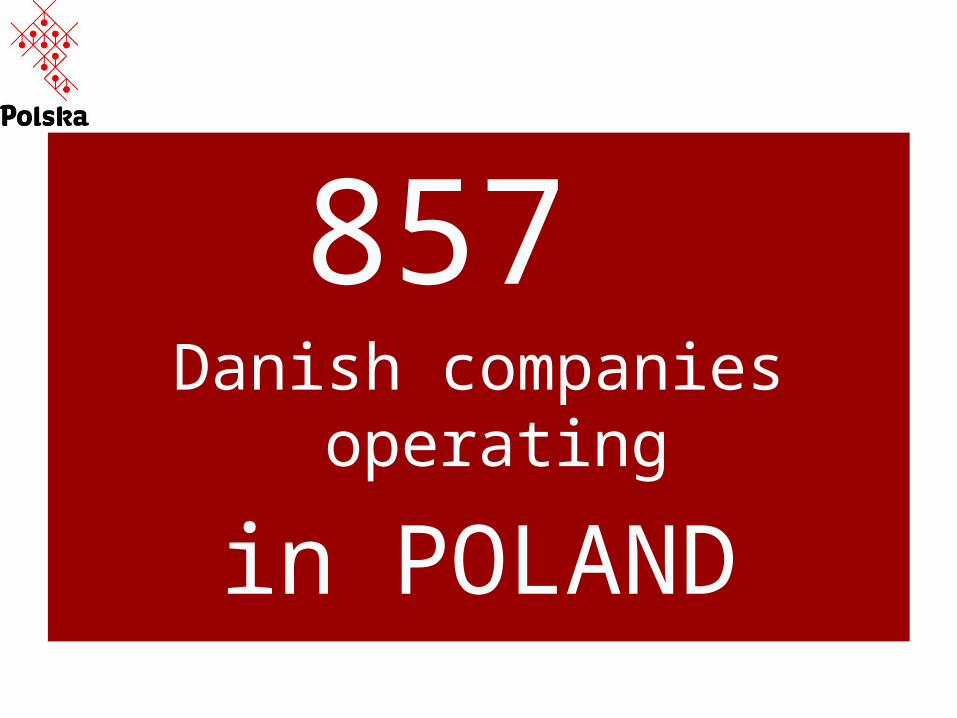
857 Danish companies operating
in POLAND

Could all these
companies be wrong?

Where do Danish companies invest
in POLAND ?

1.Mazowieckie region (Warsaw)
2.Zachodniopomorskie (Szczecin)
3.Pomorskie (Gdańsk)
Highest value of investment:

Highest value of investment:
12
3

1.Zachodniopomorskie (Szczecin)
2.Pomorskie (Gdańsk)3.Mazowieckie region
(Warsaw)
Most preferred location:

Most preferred location:
1 2
3
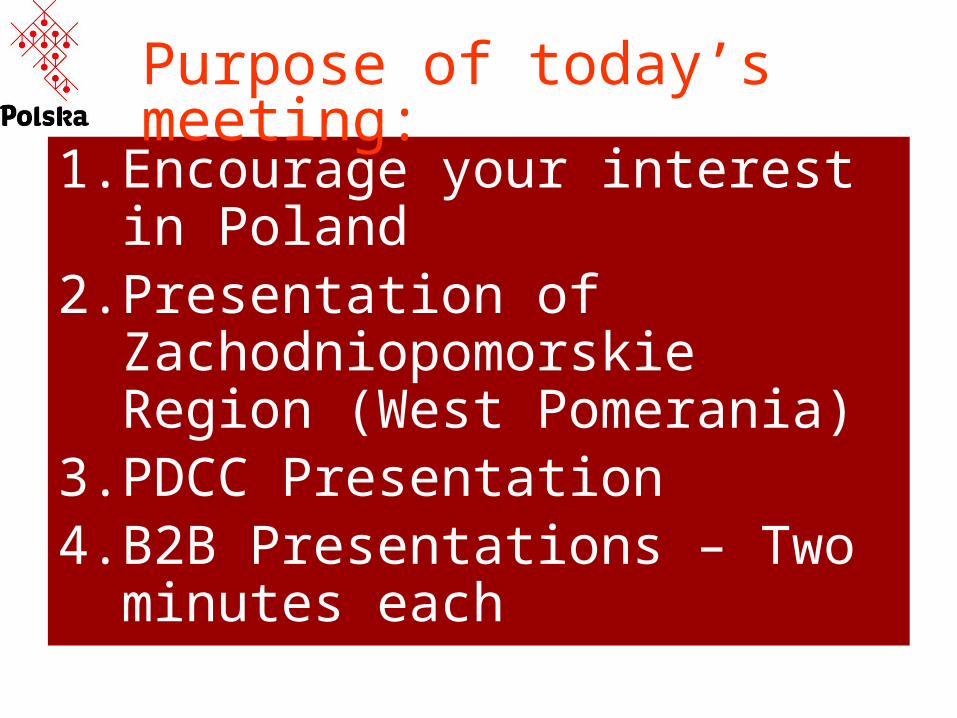
1. Encourage your interest in Poland
2. Presentation of Zachodniopomorskie Region (West Pomerania)
3. PDCC Presentation4. B2B Presentations – Two
minutes each
Purpose of today’s meeting:

1. Co-operation and investment in West Pomerania - representatives
2. B2B Presentations – individual meetings + list of participants
3. AOB in Poland – Jacek Wójcikowski and Egil Rindorf (PDCC)
What’s next:

1. Commercial Section of the Polish Embassy in Copenhagen
2. Free services to:• Investors• Importers• Wholesalers• Distributors
Who are we?

1. Assistance Centres for Investors and Exporters (COIE)
2. PAIIZ – Polish Information and Foreign Investment Agency
3. Polish Institutions (state and local)
4. Private companies
Network in Poland

1. We are big (38.1 mio)2. We are close and well-
located in Europe3. We are young and
educated4. We are charming
Why is Poland Attractive for Danish Businesses?

Investment attractiveness of the CEE region, AHK 2013
Source: Ankieta koniunkturalna EŚW 2013, AHK Polska. Scale: 1 - 6 (very attractive)
Po
lan
d
Cze
ch R
ep
ub
lic
Est
on
ia
Slo
vaki
a
Slo
ven
ia
Cro
atia
La
tvia
Lith
ua
nia
Ru
ssia
Hu
ng
ary
Ro
ma
nia
Se
rbia
2
2.5
3
3.5
4
4.5
Poland ranked as the most appealing country in the CEE.

Ch
ina
US
A
Po
lan
d
Slo
vaki
a
Bra
zil
Ind
ia
Ge
rma
ny
Ru
ssia
Fra
nce
Ca
na
da
UK
Ind
on
esi
a
Cze
ch R
ep
.
Sp
ain
Hu
ng
ary
Vie
tna
m
Ro
ma
nia
Ma
lesi
a
Th
aila
nd
Me
xico
1 2 3 4 5 6 7 8 9 10 11 12 13 14 15 16 17 18 19 20
0
100
200
300
400
500
600
Atractiveness FDI quality in the industrial
processing sector
Source: Financial Times/ FDI Intelligence.
Poland – 3rd place in the
World, 1st in Europe

18
Emerging markets in next 7 years are expected to be reposponsible for over 50% of global GDP
Source: Fortresses and Footholds: Emerging market growth strategies, practices and outlook, Deloitte, January 2012 r.
Income increase
Poland - a location that offers the biggest opportunities of income increase in 3-year perspective (45% of transnational corporations that invest in developing countries)
2nd place of Poland in the Eastern Europe (after Russia)
66
45
28
25
0 10 20 30 40 50 60 70
Russia
Poland
Ukraine
Czech Rep.

12,0%
2,5%
0%
5%
10%
15%
20%
25%
30%
35%
40%C
hin
a
Ind
ia
Are
ge
nti
na
Ind
on
es
ia
Po
lan
d
Ta
iwa
n
Bra
zil
S. K
ore
a
Tu
rke
y
Ru
ss
ia
Ge
rma
ny
RS
ACh
ang
e in
rea
l G
DP
(Q
4 20
07 -
Q2
2011
. 20
11)
Source: The Economist 2011.
Long term economic growth
Poland is one of the fastest developing countries:
• 5th in the World,• 1st in Europe.

Manufacturing competitiveness
Poland is 2nd in Europe in manufacturing competitiveness
Source: Deloitte, 2013 Global Manufacturing Competitiveness Index.
Ge
rma
ny
(2)
Po
lan
d (
14
)
Cze
ch R
ep
u..
.
Ro
ma
nia
...
0
3
6
97.98
5.87 5.71
4.09
Index value (maximum = 10). Numbers in brackets indicate position in ranking of 38 countries

ICT attractiveness
ICT Development Index: Poland 31st of 155 countries in ICT availability, usage and skills
Source: United Nations International Telecommunication Union (ITU), 2012 Measuring the Information Society
Index value (higher score = higher ICT development). Numbers in brackets indicate position in ranking
Ge
rma
ny.
..
Po
lan
d ..
.
Cze
ch R
...
Slo
vaki
a...
Hu
ng
ary
...
Bu
lga
ria
...
Ro
ma
nia
...
0
1
2
3
4
5
6
7
8 7.39
6.19 6.17 5.86 5.775.20 5.13

Talent shortage in Poland
• Talent shortage problem in Poland does not exist: only 4% of employers have problems with filling vacancies
• Poland ranks 1st among 39 countries surveyed by Manpower

Human Resources (I)
Źródło: EIU, Eurostat.
Main university centres
Szczecin
Tricity
Warsaw
Poznan
Wroclaw
Cracow
Lodz
Students in given EU countries
• 20 million of talented young people, who speak foreign languages
• 2 mln students, over 400 000 graduates every year• 87% of students speak foreign languages• 50% of population is younger than 35 yrs.
(in the group between 20 and 29 y.o. 1/3 studies)
• there is 460 of higher education institutions in Poland

3938,1
37,234,6
3230,830,530,4
29,127,427,4
23,421,6
2114,914,9
12,210,5
8,48,3
7,57,4
65,8
4,43,7
0 5 10 15 20 25 30 35 40 45
Norway
Sweden
Denmark
Belgium
Luxembourg
the Netherlands
Finland
Austria
Germany
Ireland
France
Italy
EU 27
UK
Spain
Greece
Slovenia
Portugal
Czech Rep.
Estonia
Slovakia
Hungary
Poland
Latvia
Lithuania
Romania
Bulgaria
Hourly labour costs in the business economy 2012, in EUR
Source: Eurostat, April 2013

Services and Manufacturing Hub in Poland
Automotive
White goods
Electronics

Aviation
BPO
R&D
Services and Manufacturing Hub in Poland

27
Business in 2012 (in bn EUR)
• Poland’s exports to Denmark- EUR 2.45
( - 2.7%)• Denmark’s exports to Poland- EUR 1.80
( - 9.3 %)
------------------------------------------------
TOTAL 4.25 (- 5.6%)
(Surplus) 0.64 bn (+ 22 %)

28
Our Business in 2008-2011 (IN BN EUR)
POLISH EXPORTS
TO DENMARKPOLISH IMPORTS FROM DENMARK
2008 2.25 1.73
2009 1.82 1.48
2010 2.11 1.55
2011 2.47 1.89
2012 2.45 1.80
Poland buys from Denmark
• Live animals• Chemical products• Electrical and mechanical devices• Products from base metals• Foodstuffs and drinks

Denmark buys from Poland• Electrical and mechanical
devices• Products from base metals• Wood and wooden products• Vehicles, airplanes and ships• Foodstuffs and drinks

Thank you very much for your attention.
Jacek WójcikowskiCommercial Counsellor
Jacek WójcikowskiCommercial Counsellor