Embed Size (px)
Citation preview

Poland
MARKET INSIGHTSQ1 2016
2 Market Insights | Q1 2016 | Poland
Contents
Economy ......................................................... 3
Office ............................................................... 4
Industrial ......................................................... 6
Retail ............................................................... 8
3 Market Insights | Q1 2016 | Poland
Economy General overview
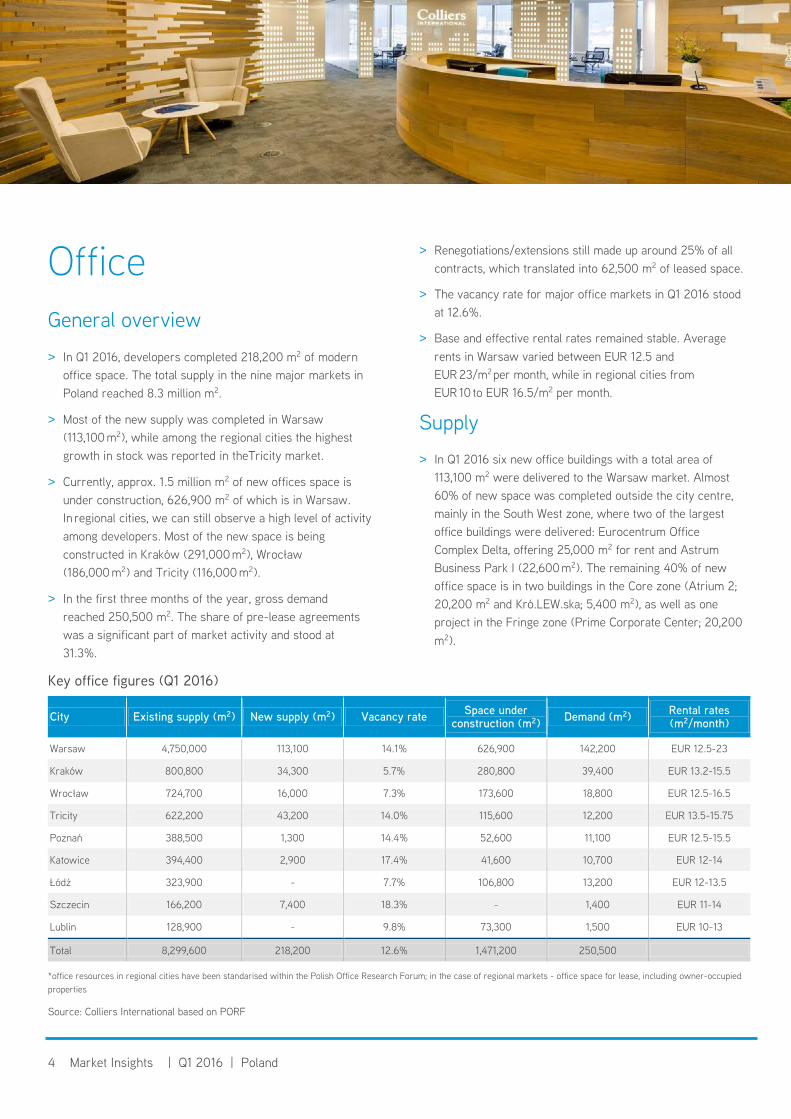
> In Q1 2016, GDP growth remained at a level (3.5%) similarto that in 2015, with a slight decrease (by 0.1%).
> New members of the Monetary Policy Council (MPC) keptinterest rates on hold. Factors that could make them lowerwould be a significant slowdown of the economy or sharpzloty appreciation.
> Within the last three months of 2016, the inflation ratestood at -0.9% y-o-y. The decrease in consumer andproducer prices is mainly caused by a sharp fall in globalcommodity prices.
> The labour market situation seems to be doing well.According to the Ministry of Family, Labour and SocialPolicy, unemployment reached a level of 10% in Q1 2016,which was 0.2 percentage points higher compared to thelast quarter in 2015.
> Gross wages in the corporate sector increased up to 4.3%in March 2016.
> Increasing labour income growth is likely to fuel householdspending. The ‘500+’ child benefit programme can be anadditional boost to consumption in the coming months.
Prognosis
> Specialists from BZ WBK predict that Q2 2016 will bring anacceleration of Polish economy up to 3.5%.
> It is thought in the labour market that the upcoming monthsof 2016 will bring some slowdown in employment growthas the supply of available labour is diminishing.
> Analysts predict that CPI inflation will reach a level of -0.5% y-o-y at the end of 2016 and a cut in interest rates isnot expected.
GDP growth rate (%)
Source: Colliers International, based on Central Statistical Office, BZ WBK
Unemployment rate and inflation (%)
Source: Colliers International, based on Central Statistical Office, Ministry of Labour and Social Policy
3.7%
4.8%
1.8% 1.7%
3.3%3.5% 3.5%
3.5% prognosis
0%
1%
2%
3%
4%
5%
6%
2010 2011 2012 2013 2014 2015 Q1 2016 Q22016
GDP
2.6%
4.3% 3.7%
0.9%0.0%
-0.9% -0,9%
12.4% 12.4%13.4% 13.4%
11.5%10.5% 10,0%
-2%
0%
2%
4%
6%
8%
10%
12%
14%
16%
2010 2011 2012 2013 2014 2015 Q1 2016
Inflation Unemployment
4 Market Insights | Q1 2016 | Poland
Office General overview
> In Q1 2016, developers completed 218,200 m2 of modernoffice space. The total supply in the nine major markets inPoland reached 8.3 million m2.
> Most of the new supply was completed in Warsaw(113,100 m2), while among the regional cities the highestgrowth in stock was reported in theTricity market.
> Currently, approx. 1.5 million m2 of new offices space isunder construction, 626,900 m2 of which is in Warsaw.In regional cities, we can still observe a high level of activityamong developers. Most of the new space is beingconstructed in Kraków (291,000 m2), Wrocław(186,000 m2) and Tricity (116,000 m2).
> In the first three months of the year, gross demandreached 250,500 m2. The share of pre-lease agreementswas a significant part of market activity and stood at31.3%.
Key office figures (Q1 2016)
> Renegotiations/extensions still made up around 25% of all contracts, which translated into 62,500 m2 of leased space.
> The vacancy rate for major office markets in Q1 2016 stood at 12.6%.
> Base and effective rental rates remained stable. Average rents in Warsaw varied between EUR 12.5 andEUR 23/m2 per month, while in regional cities fromEUR 10 to EUR 16.5/m2 per month.
Supply
> In Q1 2016 six new office buildings with a total area of 113,100 m2 were delivered to the Warsaw market. Almost 60% of new space was completed outside the city centre, mainly in the South West zone, where two of the largest office buildings were delivered: Eurocentrum Office Complex Delta, offering 25,000 m2 for rent and Astrum Business Park I (22,600 m2). The remaining 40% of new office space is in two buildings in the Core zone (Atrium 2; 20,200 m2 and Kró.LEW.ska; 5,400 m2), as well as one project in the Fringe zone (Prime Corporate Center; 20,200 m2).
City Existing supply (m2) New supply (m2) Vacancy rate Space under construction (m2) Demand (m2) Rental rates
(m2/month)
Warsaw 4,750,000 113,100 14.1% 626,900 142,200 EUR 12.5-23
Kraków 800,800 34,300 5.7% 280,800 39,400 EUR 13.2-15.5
Wrocław 724,700 16,000 7.3% 173,600 18,800 EUR 12.5-16.5
Tricity 622,200 43,200 14.0% 115,600 12,200 EUR 13.5-15.75
Poznań 388,500 1,300 14.4% 52,600 11,100 EUR 12.5-15.5
Katowice 394,400 2,900 17.4% 41,600 10,700 EUR 12-14
Łódź 323,900 - 7.7% 106,800 13,200 EUR 12-13.5
Szczecin 166,200 7,400 18.3% - 1,400 EUR 11-14
Lublin 128,900 - 9.8% 73,300 1,500 EUR 10-13
Total 8,299,600 218,200 12.6% 1,471,200 250,500
*office resources in regional cities have been standarised within the Polish Office Research Forum; in the case of regional markets - office space for lease, including owner-occupied properties
Source: Colliers International based on PORF
5 Market Insights | Q1 2016 | Poland
> In the main regional markets 11 office projects with a total area of 105,200 m2 were completed.
> In the last quarter, the highest supply growth was recorded in the Tricity market, where three projects with a total area of 43,300 m2 were completed. These included: Tryton Business House (21,300 m2) and the C200 office bulding (17,000 m2). Newly completed buildings also included Q3 BusinessCampus I (19,200 m2, Kraków), Equal Business Park A(6,900 m2, Kraków) and Storrady Park Offices (7,400 m2, Szczecin).
Demand
> The gross demand registered in first three months of 2016 in Warsaw amounted to 142,200 m2. The highest activity was observed in the two central zones (55,100 m2), with signed contracts for 32,800 m2 in the Core zone. It is also worth mentioning the South West zone where the transaction volume amounted to 28,200 m2. New agreements dominated the Warsaw market, accounting for 66.2%. The share of pre-lets also grew and stood at 26.1%.
> In the regional markets, the total volume of transactions reached the level of 108,200 m2. The highest activity was recorded in Kraków (39,400 m2) and Wrocław (18,800 m 2). The share of new contracts was 58.6%, andrenegotiations/extensions of existing contracts made up about 24.4%. A significant part of the total volume (37%) constituted lease agreements in buildings under construction.
Largest lease transactions in Q1 2016
Tenant Area (m2) Location
Credit Suisse 10,800 Grunwaldzki Center, Wrocław
Aon 10,700 Enterprise Park E, Kraków
Allegro 7,600 Q22, Warsaw
Rockwell Automation 7,400 A4 Business Park III, Katowice
Primulator 7,300 Primulator, Łódź
Shell 5,800 Dot Office, Kraków
Heineken Global Shared Services 5,700 Vinci Office Buidling,
Kraków
Mettler Toledo 4,500 Platan Park I, Warsaw
Stanley Black & Decker 4,400 Proximo I, Warsaw
Grupa Pracuj 4,300 Proximo, Warsaw
Source: Colliers International based on PORF
Vacant space
> The vacancy rate for Warsaw increased to 14.1% (against12.3% at the end of the Q4 2015.), which translated into671,700 m2 of available space. The vacancy rate grew both incentral locations (14.2%) and outside the city centre (14.1%).
> Among the regional markets, vacancy rates below 10% wererecorded in Kraków (5.7%), Wrocław (7.3%), Łódź (7.7%) andLublin (9.8%). The highest level of available space is currentlyin Szczecin (18.3%) and Katowice (17.4%).
Vacancy rates in the major office markets in Poland in Q1 2016
Source: Colliers International based on PORF
Prognosis
> Currently, 1.5 million m2 of modern office space is underconstruction of which almost 627,000 m2 is located inWarsaw. This year, between April and December, around708,000 m2 of new office space is planned for delivery. Thehighest increase in stock outside Warsaw (259,000 m2) willbe recorded in Kraków (124,000 m2) and Wrocław (130,000m2). However, it must be taken into consideration that thecompletion of some planned projects might be postponed to2017.
> We expect that due to the large level of planned supply, thevacancy rate for the main markets in Poland will grow, andthis trend will continue in the coming quarters.
> In markets characterised by a high level of construction,downward pressure on both basic and effective rents will beobserved.
14.1%
5.7%7.3%
14.0% 14.4%
17.4%
7.7%
18.3%
9.8%
0%
5%
10%
15%
20%
6 Market Insights | Q1 2016 | Poland
Industrial General overview
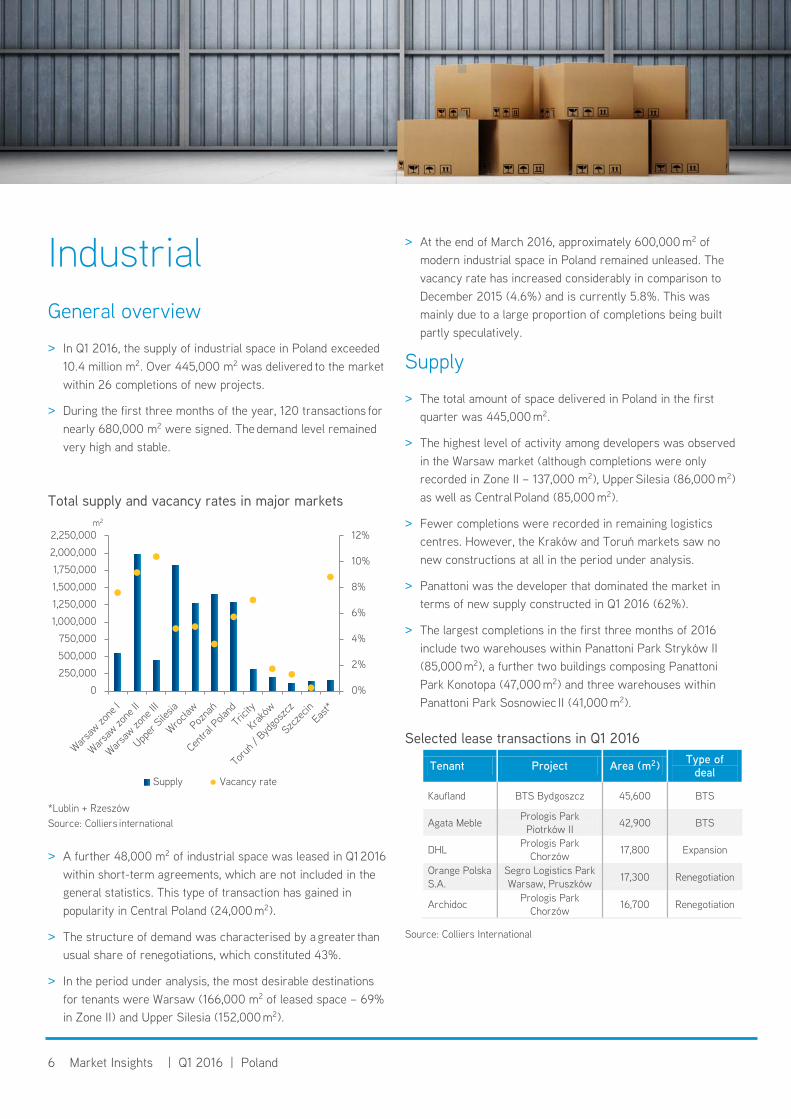
> In Q1 2016, the supply of industrial space in Poland exceeded10.4 million m2. Over 445,000 m2 was delivered to the marketwithin 26 completions of new projects.
> During the first three months of the year, 120 transactions fornearly 680,000 m2 were signed. The demand level remainedvery high and stable.
Total supply and vacancy rates in major markets
*Lublin + RzeszówSource: Colliers international
> A further 48,000 m2 of industrial space was leased in Q1 2016within short-term agreements, which are not included in thegeneral statistics. This type of transaction has gained inpopularity in Central Poland (24,000 m2).
> The structure of demand was characterised by a greater thanusual share of renegotiations, which constituted 43%.
> In the period under analysis, the most desirable destinationsfor tenants were Warsaw (166,000 m2 of leased space – 69%in Zone II) and Upper Silesia (152,000 m2).
> At the end of March 2016, approximately 600,000 m2 ofmodern industrial space in Poland remained unleased. Thevacancy rate has increased considerably in comparison toDecember 2015 (4.6%) and is currently 5.8%. This wasmainly due to a large proportion of completions being builtpartly speculatively.
Supply
> The total amount of space delivered in Poland in the firstquarter was 445,000 m2.
> The highest level of activity among developers was observedin the Warsaw market (although completions were onlyrecorded in Zone II – 137,000 m2), Upper Silesia (86,000 m2)as well as Central Poland (85,000 m2).
> Fewer completions were recorded in remaining logisticscentres. However, the Kraków and Toruń markets saw nonew constructions at all in the period under analysis.
> Panattoni was the developer that dominated the market interms of new supply constructed in Q1 2016 (62%).
> The largest completions in the first three months of 2016include two warehouses within Panattoni Park Stryków II(85,000 m2), a further two buildings composing PanattoniPark Konotopa (47,000 m2) and three warehouses withinPanattoni Park Sosnowiec II (41,000 m2).
Selected lease transactions in Q1 2016
Source: Colliers International
0%
2%
4%
6%
8%
10%
12%
0
250,000
500,000
750,000
1,000,000
1,250,000
1,500,000
1,750,000
2,000,000
2,250,000
Supply Vacancy rate
m2
Tenant Project Area (m2) Type of deal
Kaufland BTS Bydgoszcz 45,600 BTS
Agata Meble Prologis Park Piotrków II 42,900 BTS
DHL Prologis Park Chorzów 17,800 Expansion
Orange Polska S.A.
Segro Logistics Park Warsaw, Pruszków 17,300 Renegotiation
Archidoc Prologis Park Chorzów 16,700 Renegotiation
7 Market Insights | Q1 2016 | Poland
Demand in major markets in Q1 2016
*Lublin + Rzeszów Source: Colliers international
Demand
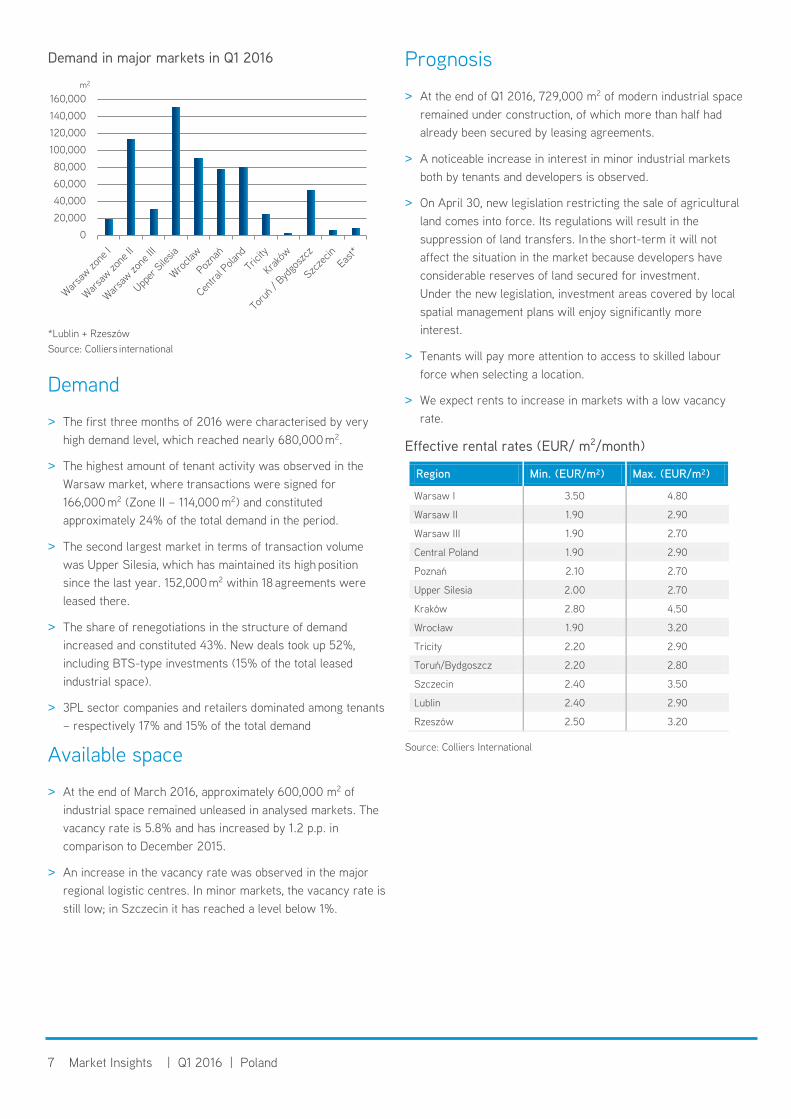
> The first three months of 2016 were characterised by very high demand level, which reached nearly 680,000 m2.
> The highest amount of tenant activity was observed in the Warsaw market, where transactions were signed for 166,000 m2 (Zone II – 114,000 m2) and constituted approximately 24% of the total demand in the period.
> The second largest market in terms of transaction volume was Upper Silesia, which has maintained its high position since the last year. 152,000 m2 within 18 agreements were leased there.
> The share of renegotiations in the structure of demand increased and constituted 43%. New deals took up 52%, including BTS-type investments (15% of the total leased industrial space).
> 3PL sector companies and retailers dominated among tenants – respectively 17% and 15% of the total demand
Available space
> At the end of March 2016, approximately 600,000 m2 of industrial space remained unleased in analysed markets. The vacancy rate is 5.8% and has increased by 1.2 p.p. in comparison to December 2015.
> An increase in the vacancy rate was observed in the major regional logistic centres. In minor markets, the vacancy rate is still low; in Szczecin it has reached a level below 1%.
Prognosis
> At the end of Q1 2016, 729,000 m2 of modern industrial space remained under construction, of which more than half had already been secured by leasing agreements.
> A noticeable increase in interest in minor industrial markets both by tenants and developers is observed.
> On April 30, new legislation restricting the sale of agricultural land comes into force. Its regulations will result in the suppression of land transfers. In the short-term it will not affect the situation in the market because developers have considerable reserves of land secured for investment. Under the new legislation, investment areas covered by local spatial management plans will enjoy significantly more interest.
> Tenants will pay more attention to access to skilled labour force when selecting a location.
> We expect rents to increase in markets with a low vacancy rate.
Effective rental rates (EUR/ m2/month)
Region Min. (EUR/m²) Max. (EUR/m²)
Warsaw I 3.50 4.80
Warsaw II 1.90 2.90
Warsaw III 1.90 2.70
Central Poland 1.90 2.90
Poznań 2.10 2.70
Upper Silesia 2.00 2.70
Kraków 2.80 4.50
Wrocław 1.90 3.20
Tricity 2.20 2.90
Toruń/Bydgoszcz 2.20 2.80
Szczecin 2.40 3.50
Lublin 2.40 2.90
Rzeszów 2.50 3.20
Source: Colliers International
020,00040,00060,00080,000
100,000120,000140,000160,000
m2
8 Market Insights | Q1 2016 | Poland
Retail General overview
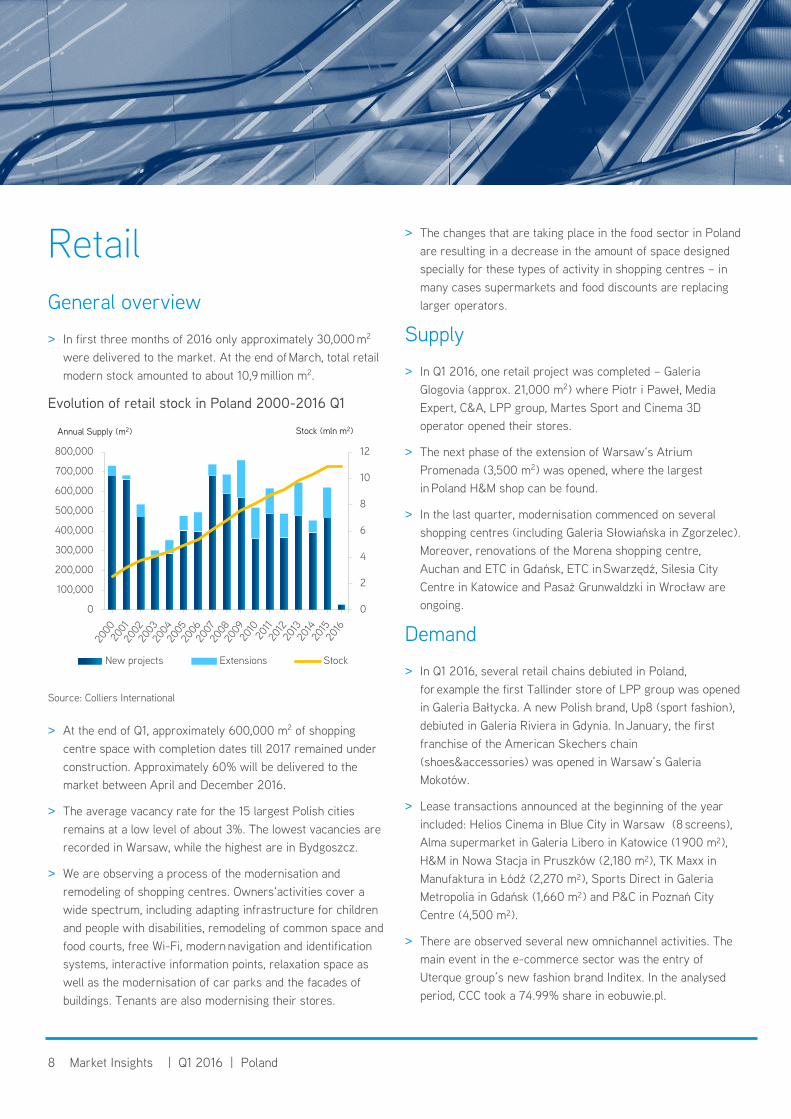
> In first three months of 2016 only approximately 30,000 m2 were delivered to the market. At the end of March, total retail modern stock amounted to about 10,9 million m2.
Evolution of retail stock in Poland 2000-2016 Q1
Source: Colliers International
> At the end of Q1, approximately 600,000 m2 of shopping centre space with completion dates till 2017 remained under construction. Approximately 60% will be delivered to the market between April and December 2016.
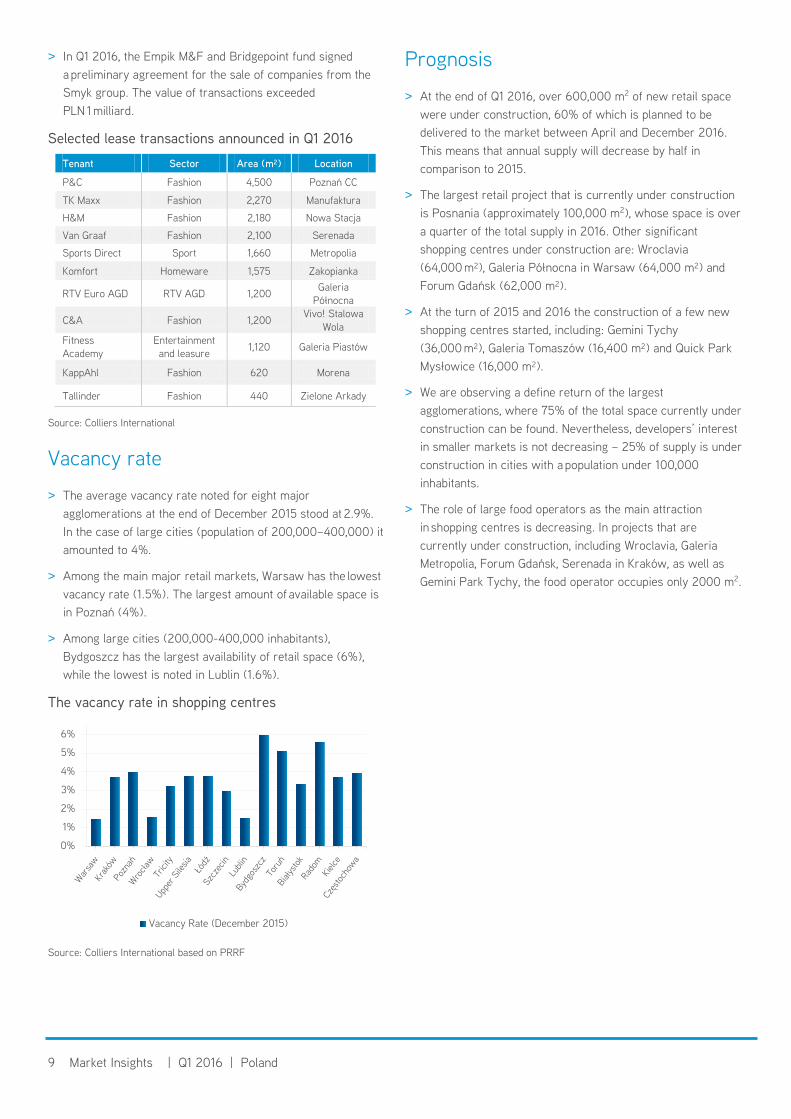
> The average vacancy rate for the 15 largest Polish cities remains at a low level of about 3%. The lowest vacancies are recorded in Warsaw, while the highest are in Bydgoszcz.
> We are observing a process of the modernisation and remodeling of shopping centres. Owners‘activities cover a wide spectrum, including adapting infrastructure for children and people with disabilities, remodeling of common space and food courts, free Wi-Fi, modern navigation and identification systems, interactive information points, relaxation space as well as the modernisation of car parks and the facades of buildings. Tenants are also modernising their stores.
> The changes that are taking place in the food sector in Poland are resulting in a decrease in the amount of space designed specially for these types of activity in shopping centres – in many cases supermarkets and food discounts are replacing larger operators.
Supply
> In Q1 2016, one retail project was completed – Galeria Glogovia (approx. 21,000 m2) where Piotr i Paweł, Media Expert, C&A, LPP group, Martes Sport and Cinema 3D operator opened their stores.
> The next phase of the extension of Warsaw‘s Atrium Promenada (3,500 m2) was opened, where the largest in Poland H&M shop can be found.
> In the last quarter, modernisation commenced on several shopping centres (including Galeria Słowiańska in Zgorzelec). Moreover, renovations of the Morena shopping centre, Auchan and ETC in Gdańsk, ETC in Swarzędź, Silesia City Centre in Katowice and Pasaż Grunwaldzki in Wrocław are ongoing.
Demand
> In Q1 2016, several retail chains debiuted in Poland, for example the first Tallinder store of LPP group was opened in Galeria Bałtycka. A new Polish brand, Up8 (sport fashion), debiuted in Galeria Riviera in Gdynia. In January, the first franchise of the American Skechers chain (shoes&accessories) was opened in Warsaw’s Galeria Mokotów.
> Lease transactions announced at the beginning of the year included: Helios Cinema in Blue City in Warsaw (8 screens), Alma supermarket in Galeria Libero in Katowice (1 900 m²), H&M in Nowa Stacja in Pruszków (2,180 m²), TK Maxx in Manufaktura in Łódź (2,270 m²), Sports Direct in Galeria Metropolia in Gdańsk (1,660 m²) and P&C in Poznań City Centre (4,500 m²).
> There are observed several new omnichannel activities. The main event in the e-commerce sector was the entry of Uterque group’s new fashion brand Inditex. In the analysed period, CCC took a 74.99% share in eobuwie.pl.
0
2
4
6
8
10
12
0
100,000
200,000
300,000
400,000
500,000
600,000
700,000
800,000
New projects Extensions Stock
Annual Supply (m2) Stock (mln m2)
9 Market Insights | Q1 2016 | Poland
> In Q1 2016, the Empik M&F and Bridgepoint fund signed a preliminary agreement for the sale of companies from the Smyk group. The value of transactions exceeded PLN 1 milliard.
Selected lease transactions announced in Q1 2016
Tenant Sector Area (m²) Location
P&C Fashion 4,500 Poznań CC
TK Maxx Fashion 2,270 Manufaktura
H&M Fashion 2,180 Nowa Stacja
Van Graaf Fashion 2,100 Serenada
Sports Direct Sport 1,660 Metropolia
Komfort Homeware 1,575 Zakopianka
RTV Euro AGD RTV AGD 1,200 Galeria Północna
C&A Fashion 1,200 Vivo! Stalowa Wola
Fitness Academy
Entertainment and leasure 1,120 Galeria Piastów
KappAhl Fashion 620 Morena
Tallinder Fashion 440 Zielone Arkady
Source: Colliers International
Vacancy rate
> The average vacancy rate noted for eight major agglomerations at the end of December 2015 stood at 2.9%. In the case of large cities (population of 200,000–400,000) it amounted to 4%.
> Among the main major retail markets, Warsaw has the lowest vacancy rate (1.5%). The largest amount of available space is in Poznań (4%).
> Among large cities (200,000-400,000 inhabitants), Bydgoszcz has the largest availability of retail space (6%), while the lowest is noted in Lublin (1.6%).
The vacancy rate in shopping centres
Source: Colliers International based on PRRF
Prognosis
> At the end of Q1 2016, over 600,000 m2 of new retail space were under construction, 60% of which is planned to be delivered to the market between April and December 2016. This means that annual supply will decrease by half in comparison to 2015.
> The largest retail project that is currently under construction is Posnania (approximately 100,000 m2), whose space is over a quarter of the total supply in 2016. Other significant shopping centres under construction are: Wroclavia (64,000 m²), Galeria Północna in Warsaw (64,000 m²) and Forum Gdańsk (62,000 m²).
> At the turn of 2015 and 2016 the construction of a few new shopping centres started, including: Gemini Tychy (36,000 m²), Galeria Tomaszów (16,400 m²) and Quick Park Mysłowice (16,000 m²).
> We are observing a define return of the largest agglomerations, where 75% of the total space currently under construction can be found. Nevertheless, developers’ interest in smaller markets is not decreasing – 25% of supply is under construction in cities with a population under 100,000 inhabitants.
> The role of large food operators as the main attraction in shopping centres is decreasing. In projects that are currently under construction, including Wroclavia, Galeria Metropolia, Forum Gdańsk, Serenada in Kraków, as well as Gemini Park Tychy, the food operator occupies only 2000 m2.
0%
1%
2%
3%
4%
5%
6%
Vacancy Rate (December 2015)

FIND THE PROPERTY YOU NEED
Map of high streets and shopping centres
Find your new warehouse
www.warehouses.plwww.retailmap.pl
Find your new office
www.officemap.pl
OUR SEARCH TOOLSYOUR NEW BUSINESS PREMISES
OUR KNOWLEDGE
Copyright © 2015 Colliers International.
The information contained herein has been obtained from sources deemed reliable. While every reasonable effort has been made to ensure its accuracy, we cannot guarantee it. No responsibility is assumed for any inaccuracies. Readers are encouraged to consult their professional advisors prior to acting on any of the material contained in this report.
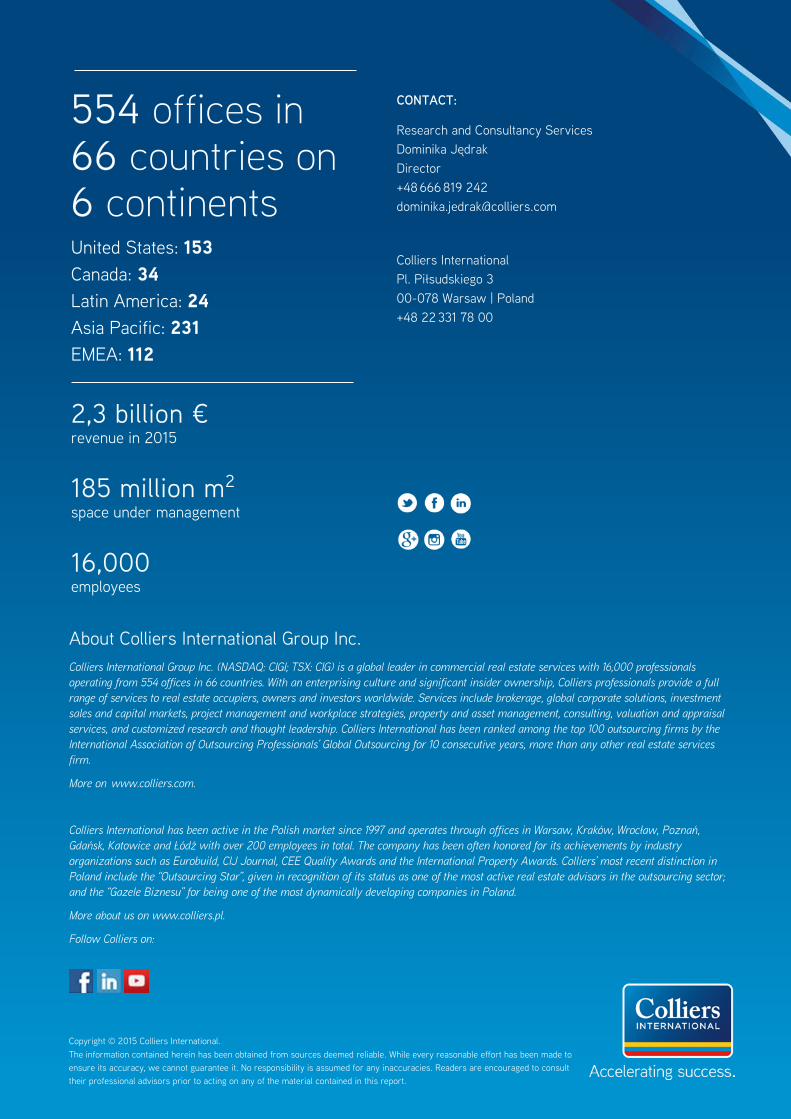
554 offices in 66 countries on 6 continents United States: 153 Canada: 34 Latin America: 24 Asia Pacific: 231 EMEA: 112
2,3 billion € revenue in 2015
185 million m2 space under management
16,000 employees
About Colliers International Group Inc. Colliers International Group Inc. (NASDAQ: CIGI; TSX: CIG) is a global leader in commercial real estate services with 16,000 professionals operating from 554 offices in 66 countries. With an enterprising culture and significant insider ownership, Colliers professionals provide a full range of services to real estate occupiers, owners and investors worldwide. Services include brokerage, global corporate solutions, investment sales and capital markets, project management and workplace strategies, property and asset management, consulting, valuation and appraisal services, and customized research and thought leadership. Colliers International has been ranked among the top 100 outsourcing firms by the International Association of Outsourcing Professionals’ Global Outsourcing for 10 consecutive years, more than any other real estate services firm.
More on www.colliers.com.
Colliers International has been active in the Polish market since 1997 and operates through offices in Warsaw, Kraków, Wrocław, Poznań, Gdańsk, Katowice and Łódź with over 200 employees in total. The company has been often honored for its achievements by industry organizations such as Eurobuild, CIJ Journal, CEE Quality Awards and the International Property Awards. Colliers’ most recent distinction in Poland include the “Outsourcing Star”, given in recognition of its status as one of the most active real estate advisors in the outsourcing sector; and the “Gazele Biznesu” for being one of the most dynamically developing companies in Poland.
More about us on www.colliers.pl.
Follow Colliers on:
CONTACT:
Research and Consultancy Services Dominika Jędrak Director +48 666 819 [email protected]
Colliers International Pl. Piłsudskiego 3 00-078 Warsaw | Poland+48 22 331 78 00