Embed Size (px)
Citation preview

Hester Biosciences Limited31st Annual Report 2017-18
Poised. Prepared.Positive.
Recognising the need for safe alternative sources of energy, Hester has commissioned a pilot Solar Power Plant with a planned expansion by 2020

Forward-looking Statements
Statements in this report that describe the Companys' objectives, projections,
estimates, expectations or predictions of the future may be ‘forward-looking
statements’ within the meaning of the applicable securities laws and
regulations. The Company cautions that such statements involve risks and
uncertainty and that actual results could differ materially from those expressed
or implied. Important factors that could cause differences include raw materials’
cost or availability, cyclical demand and pricing in the Companys' principal
markets, changes in government regulations, economic developments within
the countries in which the Company conducts business, and other factors
relating to the Companys' operations, such as litigation, labour negotiations and
fiscal regimes.
Business Overview
Strategic Overview
Business Review
People and Management
Statutory Reports
Financial Statements
01
02
03
04
05
06
03 At a Glance
07 A Proud Moment at Hester
08 Built on Strong Fundamentals
11 Highlights of the Year
13 CEO and MDs' Message
16 Strategy for Future Growth
19 Poultry Division
21 Large Animal Division
24 An Organisation Driven by Values & Ethics
25 Powerful Leadership Team
26 Corporate Information
28 Directors' Report
52 Management Discussion &
Analysis
56 Report on Corporate
Governance
75 Standalone Financial
Statements
120 Consolidated Financial
Statements
165 Ten Year Financial Statistics
166 Abbreviation
Contents

01
Business Overview
At a Glance 03
A Proud Moment at Hester 07
Built on Strong Fundamentals 08

At a Glance
Hester is amongst Indias' leading animal healthcare companies and the second largest poultry vaccine manufacturer.
Headquartered in Ahmedabad, Gujarat, Hester has a state-of-the-art manufacturing
facility for vaccines, health products and diagnostics. The Companys' products,
registered with various countries and international agencies, have received wide
acceptance and is marketed across India and a few African and Asian countries. The
Company has a total manufacturing capacity of 4.8 billion doses of vaccines.
Maulik Patel
Production Executive
Business Overview 01
31st Annual Report 2017-18 3
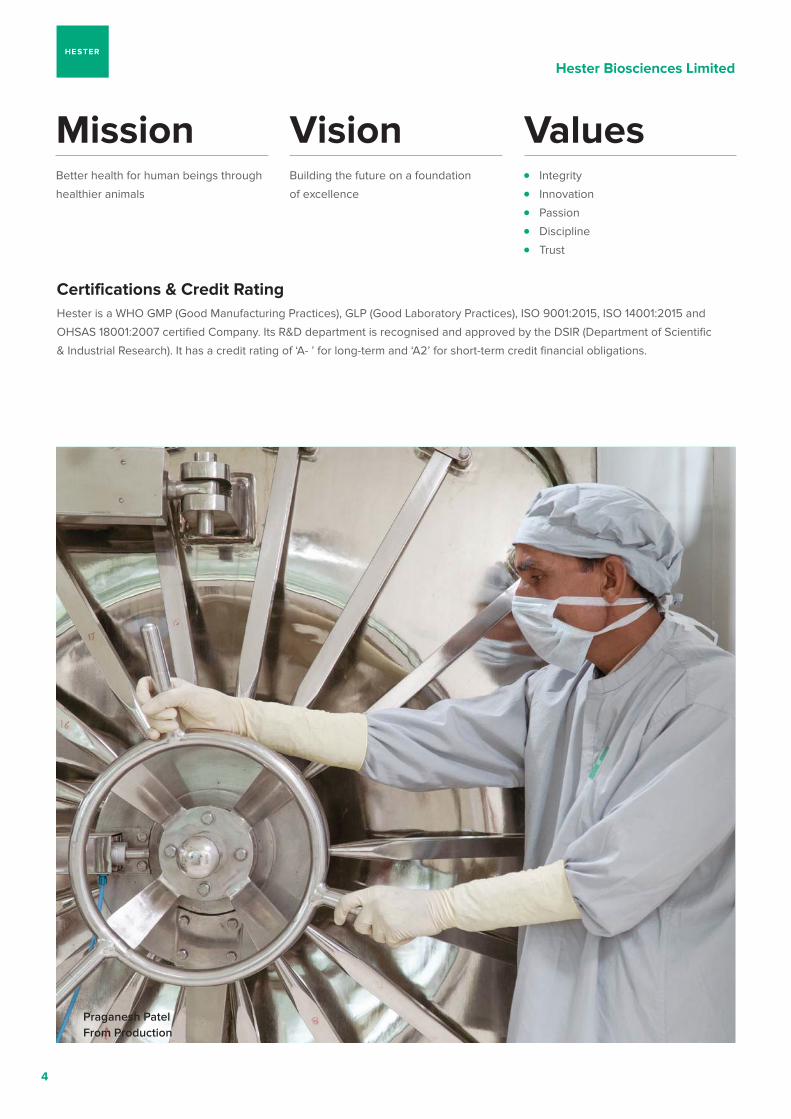
ValuesMissionBetter health for human beings through
healthier animals
VisionBuilding the future on a foundation
of excellence
Integrity
Innovation
Passion
Discipline
Trust
Certifications & Credit Rating Hester is a WHO GMP (Good Manufacturing Practices), GLP (Good Laboratory Practices), ISO 9001:2015, ISO 14001:2015 and
OHSAS 18001:2007 certified Company. Its R&D department is recognised and approved by the DSIR (Department of Scientific
& Industrial Research). It has a credit rating of ‘A- ’ for long-term and ‘A2’ for short-term credit financial obligations.
Praganesh Patel
From Production
Hester Biosciences Limited
4
Key AchievementsRecognition from the Bill & Melinda
Gates Foundation, U.S.A, for its efforts
in improving livestock health and lifting
peoples' lives globally
Acknowledgement from Mr. Bill Gates
at the Smallholder-led Agricultural
Transformation Summit, Andhra
Pradesh, India for the Companys'
efforts in making available vaccine for
Newcastle Disease at low cost
Key Highlights of the Journey
Product & Service Offerings A dedicated animal healthcare
Company, Hester has a wide portfolio
comprising of 49 vaccines and 50
health products for poultry and large
animals (livestock). The products
are segregated under the following
business divisions:
Live Vaccines
Inactivated Vaccines
Health Products
Disinfectants and Sanitisers
Diagnostic Kits
The live and inactivated vaccines are
used for immunisation against major
veterinary diseases of economic
importance. Health products enable
prevention and cure of diseases, in
addition to addressing growth promotion.
Disinfectants and water sanitisers
are health-aid products facilitating to
maintain hygiene standards. Diagnostic
Kits are used for sero-surveillance and
disease monitoring.
Apart from the products, the Company
also offers Sero-monitoring services
for poultry farms. This involves use of
diagnostic kits and other scientific tools
to provide precise immune status and
disease diagnosis, thereby assisting
poultry farmers to better manage their
flocks and improve their profitability.
The Company also offers Mastitis
prevention programs for cattle farms.
Mastitis is a major challenge for cattle
farmers. The Company with its expert
team, specialises in the prevention and
cure of mastitis using diagnostic tools,
treatment therapies and prevention
programs.
1983 Commenced operations as a propriety concern to distribute poultry medicines and feed additives in Mumbai,
covering the districts of Thane and Raigadh.
1987 Formed Hester Pharmaceuticals Private Limited to acquire the exclusive marketing rights for animal health
products of overseas brands for Indian market.
1990 Entered into exclusive marketing agreement with Ghen Corporation, Japan, for its range of poultry feed
additives and with Maine Biological Laboratories (MBL), USA, for its range of poultry vaccine.
1993 Entered into technical and financial collaboration agreement with MBL, to manufacture poultry vaccines in India.
1994 Shifted base to Ahmedabad to set-up the poultry vaccine manufacturing unit and converted Hester into a public
limited company following an IPO.
1997 Commenced marketing of the locally manufactured poultry vaccines.
2003 Terminated the financial and technical collaboration with MBL.
2007 Expanded manufacturing capacity four-fold.
2012 Partnered by the Bill & Melinda Gates Foundation, U.S.A, to develop a Thermostable Newcastle Disease Vaccine
to immunise backyard poultry in rural India
2013 Received the WHO-GMP certification and DSIR registration for the in-house R&D unit. Embarked to set-up an
animal vaccine manufacturing unit in Nepal.
2017 Completed the worlds' largest backyard poultry immunisation program
low-cost Newcastle Disease vaccine
products
Business Overview 01
31st Annual Report 2017-18 5
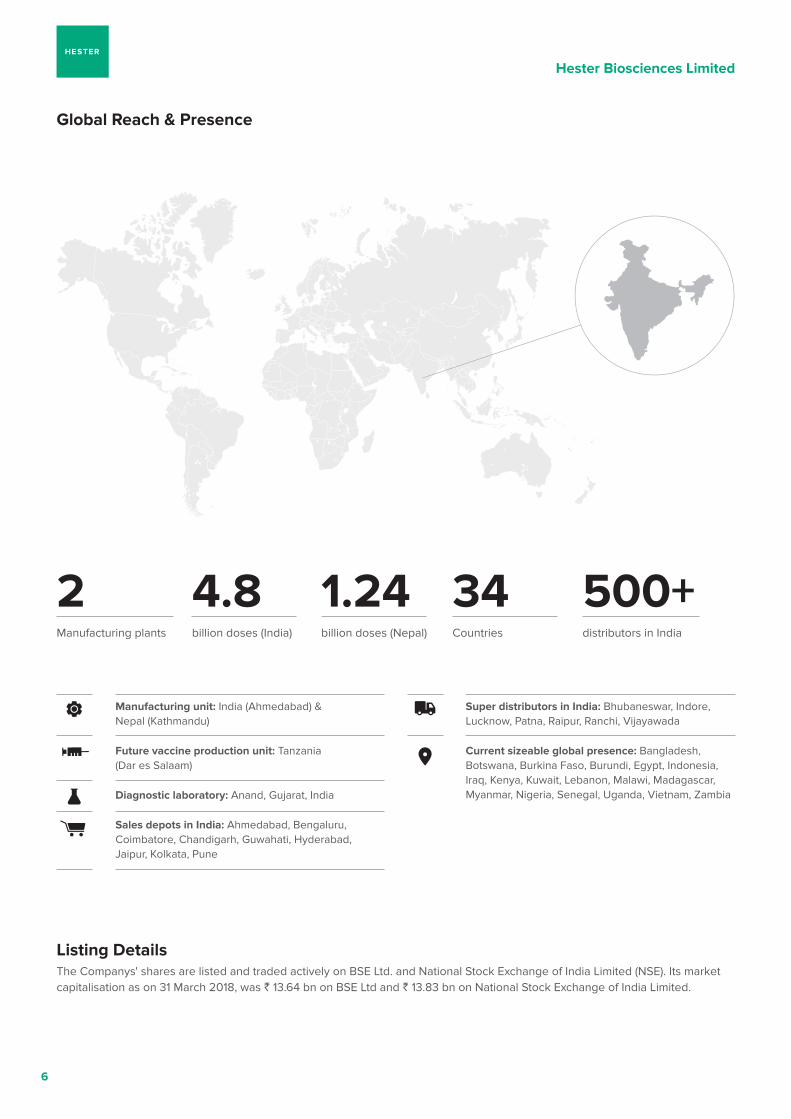
Global Reach & Presence
2 4.8 1.24 34 500+
Manufacturing unit: India (Ahmedabad) &
Nepal (Kathmandu)
Future vaccine production unit: Tanzania
(Dar es Salaam)
Diagnostic laboratory: Anand, Gujarat, India
Sales depots in India: Ahmedabad, Bengaluru,
Coimbatore, Chandigarh, Guwahati, Hyderabad,
Jaipur, Kolkata, Pune
Super distributors in India: Bhubaneswar, Indore,
Lucknow, Patna, Raipur, Ranchi, Vijayawada
Current sizeable global presence: Bangladesh,
Botswana, Burkina Faso, Burundi, Egypt, Indonesia,
Iraq, Kenya, Kuwait, Lebanon, Malawi, Madagascar,
Myanmar, Nigeria, Senegal, Uganda, Vietnam, Zambia
Manufacturing plants billion doses (India) billion doses (Nepal) Countries distributors in India
Listing Details The Companys' shares are listed and traded actively on BSE Ltd. and National Stock Exchange of India Limited (NSE). Its market
` `
Hester Biosciences Limited
6
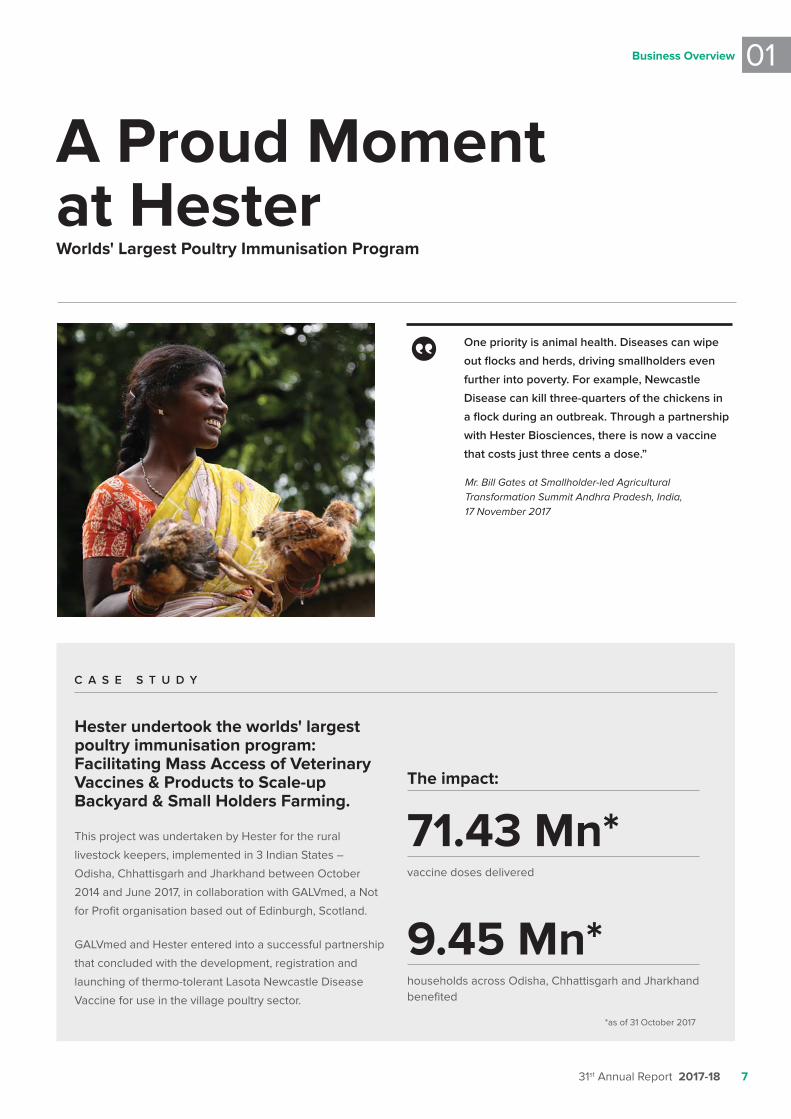
A Proud Moment at HesterWorlds' Largest Poultry Immunisation Program
One priority is animal health. Diseases can wipe
out flocks and herds, driving smallholders even
further into poverty. For example, Newcastle
Disease can kill three-quarters of the chickens in
a flock during an outbreak. Through a partnership
with Hester Biosciences, there is now a vaccine
that costs just three cents a dose.”
Mr. Bill Gates at Smallholder-led Agricultural
Transformation Summit Andhra Pradesh, India,
17 November 2017
Hester undertook the worlds' largest poultry immunisation program: Facilitating Mass Access of Veterinary Vaccines & Products to Scale-up Backyard & Small Holders Farming.
This project was undertaken by Hester for the rural
Odisha, Chhattisgarh and Jharkhand between October
2014 and June 2017, in collaboration with GALVmed, a Not
for Profit organisation based out of Edinburgh, Scotland.
GALVmed and Hester entered into a successful partnership
that concluded with the development, registration and
launching of thermo-tolerant Lasota Newcastle Disease
Vaccine for use in the village poultry sector.
C A S E S T U D Y
71.43 Mn*vaccine doses delivered
9.45 Mn*households across Odisha, Chhattisgarh and Jharkhand
benefited
The impact:
Business Overview
31st Annual Report 2017-18 7
01

Built on Strong Fundamentals
Hester Biosciences Limited
8
State-of-the-Art ManufacturingThe Company has two plants, one in India and the other in
Nepal. Benchmarked to international quality and compliance
standards, the Gujarat plant is Asias' largest single-location
animal biological manufacturing facility. Its R&D laboratory
is approved by The Department of Scientific and Industrial
Research (DSIR), Ministry of Science and Technology,
Government of India.
R&D & Innovation DrivenHester, with its strong team of research scientists, equipment
infrastructure and biological know-how, has the required
expertise to develop stable biological products that are safe,
effective and which meet regulatory requirements. The R&D
activities are funded through Hesters' own cash flow. The
Company has a focus on developing new generation vaccines
and animal health products that have higher efficacy and
which cater to the evolving needs.
Wide Portfolio Offerings The Company has a wide portfolio of 49 vaccines and 50
health products addressing preventive, curative and growth
needs of poultry and large animals. It also provides services
such as seromonitoring for poultry farms and mastitis
prevention programs for cattle farms.
Quality FocusedThe Company has adopted good manufacturing and good
laboratory practice (GMP and GLP) guidelines laid down by
WHO. Its robust quality control and quality assurance teams
ensures high quality standards.
Wide Reach & Distribution NetworkHester has received regulatory approvals for its products
in many African and Asian countries. Additional product
approvals as well as approvals in additional countries are
underway. In India, it has a country-wide presence with its
network of 500+ distributors. In rural regions, Hester partners
with various stakeholders to facilitate mass vaccination for
backyard poultry and large animals to improve the economical
conditions of backyard farmers.
The Company has a focus on expanding operations in Africa.
A wholly-owned subsidiary has been established for setting-
up of an animal vaccine manufacturing unit in Tanzania. The
current activities towards creating a distribution network in
Africa, coupled with the proposed manufacturing plant, would
synergise Hesters' business in Africa.
Proven Performance The Company has a track record of consistently growing its
topline and bottom line. This has been driven by its ability to
innovate and deliver relevant products, create strong supply
chain network, collaborate with international agencies and get
regulatory approvals within India and from various countries.
Strong Financials The Companys' strong balance sheet augurs well for its plans
for a sustainable growth in future. With its strong business
model and focused strategy of having superior products
and improving operational efficiencies, it has significantly
improved its operational performance. In the last three years,
sheet position was strong with a net worth of `
and a gearing of 0.29.
Sustainable Strategy Aligned to OpportunitiesThe Company has strategically created presence in
geographies where livestock diseases create a lot of
challenges, as well as where access to veterinary products is a
challenge. Besides, the FAOs' Global PPR Disease Eradication
Program in sheep and goat and the growing awareness of
Brucella abortus disease among farmers provide scope for
significant future growth.
Business Overview
31st Annual Report 2017-18 9
01
02
Strategic Overview
Highlights of the Year 11
A Message from the CEO and Managing Director 13
Strategy for Future Growth 16
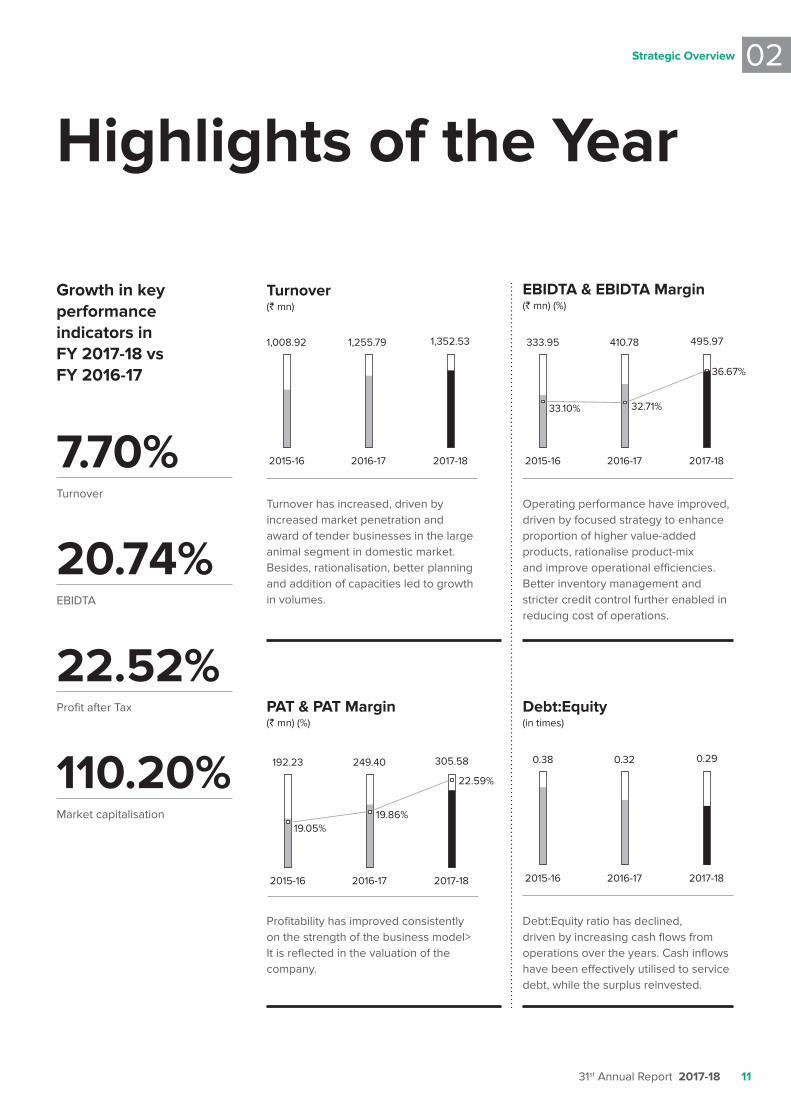
Highlights of the Year
7.70%Turnover
20.74%EBIDTA
22.52%Profit after Tax
110.20%Market capitalisation
Growth in key performance indicators in FY 2017-18 vs FY 2016-17
Turnover (` mn)
EBIDTA & EBIDTA Margin(`
PAT & PAT Margin(`
Debt:Equity (in times)
2017-18
1,008.92 1,255.79
2017-18
0.29
Turnover has increased, driven by
increased market penetration and
award of tender businesses in the large
animal segment in domestic market.
Besides, rationalisation, better planning
and addition of capacities led to growth
in volumes.
Operating performance have improved,
driven by focused strategy to enhance
proportion of higher value-added
products, rationalise product-mix
and improve operational efficiencies.
Better inventory management and
stricter credit control further enabled in
reducing cost of operations.
Profitability has improved consistently
on the strength of the business model>
It is reflected in the valuation of the
company.
Debt:Equity ratio has declined,
driven by increasing cash flows from
operations over the years. Cash inflows
have been effectively utilised to service
debt, while the surplus reinvested.
2017-18
410.78 495.97
2017-18
249.40
31st Annual Report 2017-18 11
02Strategic Overview
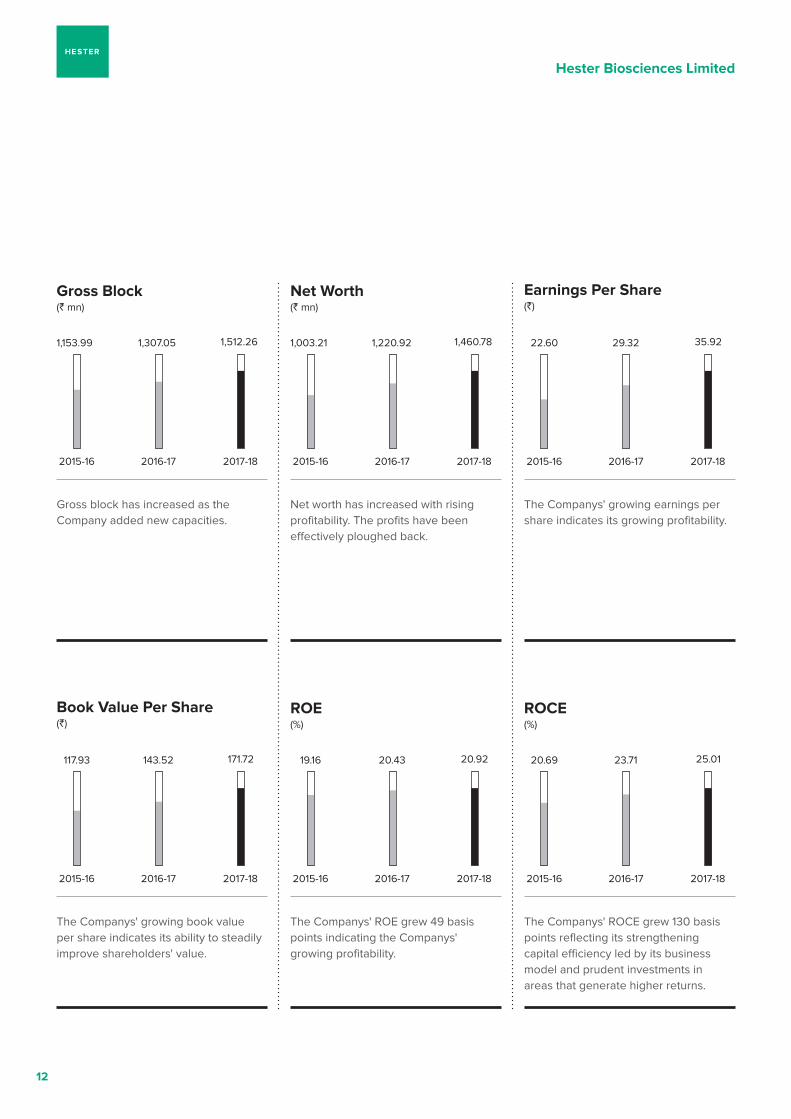
Gross Block (` mn)
Net Worth (` mn)
Earnings Per Share(`)
Book Value Per Share (`)
ROE ROCE
2017-18 2017-18
1,220.92
2017-18
2017-18
171.72
2017-18
20.92
2017-18
25.01
Gross block has increased as the
Company added new capacities.
Net worth has increased with rising
profitability. The profits have been
effectively ploughed back.
The Companys' growing earnings per
share indicates its growing profitability.
The Companys' growing book value
per share indicates its ability to steadily
improve shareholders' value.
The Companys' ROE grew 49 basis
points indicating the Companys'
growing profitability.
points reflecting its strengthening
capital efficiency led by its business
model and prudent investments in
areas that generate higher returns.
Hester Biosciences Limited
12
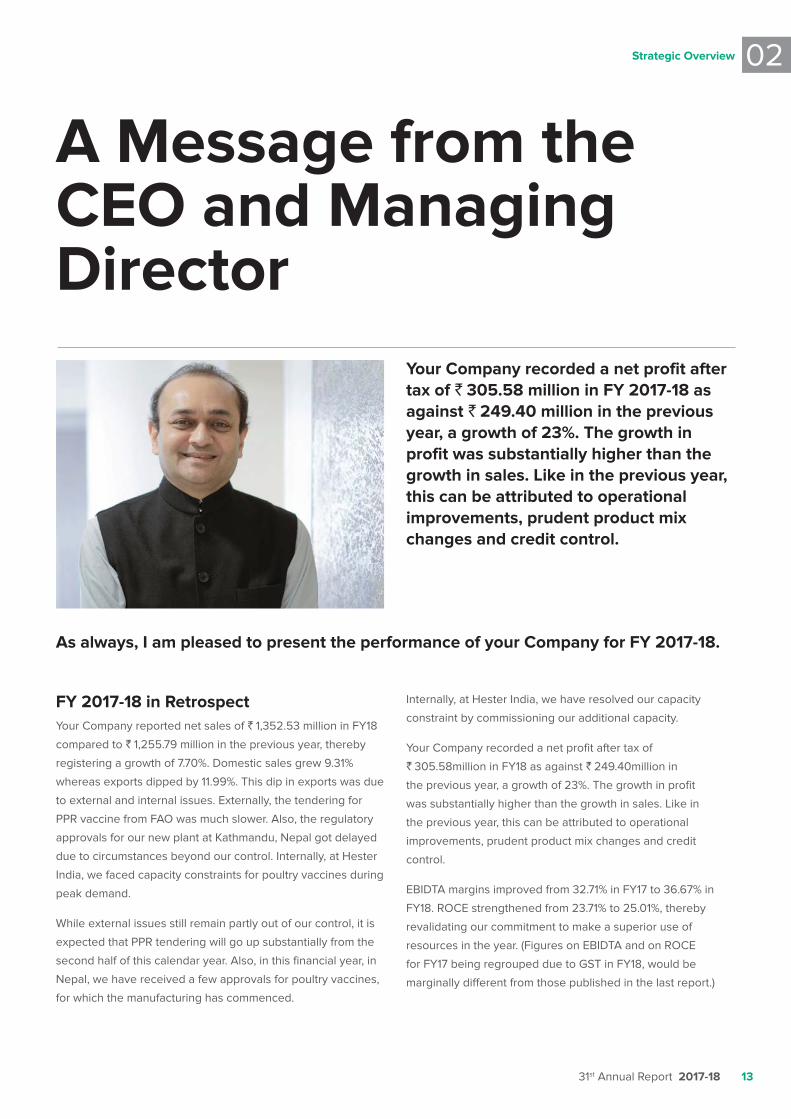
A Message from the CEO and Managing Director
FY 2017-18 in Retrospect Your Company reported net sales of `
compared to ` 1,255.79 million in the previous year, thereby
to external and internal issues. Externally, the tendering for
PPR vaccine from FAO was much slower. Also, the regulatory
approvals for our new plant at Kathmandu, Nepal got delayed
due to circumstances beyond our control. Internally, at Hester
India, we faced capacity constraints for poultry vaccines during
peak demand.
While external issues still remain partly out of our control, it is
expected that PPR tendering will go up substantially from the
second half of this calendar year. Also, in this financial year, in
Nepal, we have received a few approvals for poultry vaccines,
for which the manufacturing has commenced.
Internally, at Hester India, we have resolved our capacity
constraint by commissioning our additional capacity.
Your Company recorded a net profit after tax of
` ` 249.40million in
was substantially higher than the growth in sales. Like in
the previous year, this can be attributed to operational
improvements, prudent product mix changes and credit
control.
revalidating our commitment to make a superior use of
resources in the year. (Figures on EBIDTA and on ROCE
for FY17 being regrouped due to GST in FY18, would be
marginally different from those published in the last report.)
Your Company recorded a net profit after tax of ` 305.58 million in FY 2017-18 as against ` 249.40 million in the previous year, a growth of 23%. The growth in profit was substantially higher than the growth in sales. Like in the previous year, this can be attributed to operational improvements, prudent product mix changes and credit control.
As always, I am pleased to present the performance of your Company for FY 2017-18.
31st Annual Report 2017-18 13
Strategic Overview 02
In summary, this has been a year of mixed financial
performances. Though we did not report the kind of topline
growth that we had anticipated, yet we delivered a strong
bottom-line relative to the sales. We lived up to our mandate
towards improving the bottom-line. Our confidence assures us
of a good growth in the topline as well as in the bottom line in
the current financial year.
Going beyond financials, there were other contributions in the
year. Listing a few of them:
We embarked on the planning of our Africa manufacturing
project.
We successfully completed a mass immunisation program
in backyard animals in a few states in India. This has laid the
foundation to start our Veterinary Social business Division.
Improved efficiencies in production through our R&D which
without any capital expenditure.
A milestone achieved towards immunising backyard animals
Through my email in 19 April 2018, I had shared a document
‘Facilitating Mass Access To Veterinary Vaccines &
Products to Scale-up Backyard & Small Holder Farming’.
The document presented the project completed by Hester
towards immunising backyard poultry and other animals. The
outcome of the project was as follows: 71.50 million doses
of Newcastle (Ranikhet) Disease Vaccine were administered
to backyard poultry in Odisha, Chhattisgarh & Jharkhand.
945,000 households were covered in the three states until
October 2017. Backyard chicken population per household
chicken has gone up by 20 eggs per year and the mortality in
Backyard farmers have been able to sell eggs & chicken meat
to earn additional income as well as reduce their household
food consumption cost by themselves consuming part of the
eggs and meat. The women in the village houses have got
occupation for managing the backyard chicken. 2000 youth
in the villages who were trained free of cost to administer the
vaccine to the poultry, are now earning ` 5,000 to ` 10,000
each per month.
Hester has continued the work with the same objectives in
the same geographical area, by converting the project into a
financially sustainable business model through its new division
towards creating wealth for backyard farmers in rural India as
well as in giving employment to over 2000 people.
Prepared for a Better Future Self Reliance
While out-sourcing has become the order of the day in many
industries including that in the pharmaceutical industry, Hester
believes in being self-reliant.
Till recently, all Hester animal health products were out-
sourced. With the need to control quality and production
schedules, it seemed imperative for us to manufacture our
range of animal health products by ourselves. Another reason
to consider manufacturing the health products by ourselves
was to ensure that all registrations, worldwide, are registered
under our own entity rather than under a third partys' name.
Lifesciences Private Limited, an animal health products
manufacturing company in Mehsana. This acquisition has
enabled us to undertake manufacturing of all health products
in-house, rather than outsourcing them, and thus have better
control over quality and production schedules. Further, it
would now enable us to own product registrations across
all countries through Texas. This action has also given us an
impetus towards our brand building activities.
Focus on Africa
Worldwide economic forecasts clearly indicate that Africa
is the next continent for economic boom. Our own market
survey has brought to light that animal farming activities,
either organsied or backyard farming, are poised to grow
exponentially. This would have a direct positive impact on the
demand for animal health products in Africa.
To exploit these opportunities, Hester has decided to put
resources in to Africa towards distribution as well as towards
manufacturing.
We hope to create Hester-owned country-specific distribution
networks in most of the African countries. The objectives
of such entities would be to make available quality animal
vaccines and health products at prevailing international prices,
to organised animal farms as well as to backyard farmers.
This process has already begun, by us establishing Hester
Biosciences Kenya Limited and Hester Biosciences Tanzania
Limited as distribution companies in Kenya and in Tanzania
respectively. In a few countries we have collaborated with
local existing distributors with an aim to ultimately set up
our own entities with their participation. Product registration
activities are currently on going in many African countries.
Hester Biosciences Limited
14
Africa as a continent is yet untapped towards immunising
animals against diseases. Many Africa-specific animal
diseases, though identified, still remain unaddressed.
Seeing this as an opportunity, Hester has formed a wholly
owned subsidiary in Tanzania in the name of Hester
Biosciences Africa Limited, to set up an animal vaccine-
manufacturing unit in Tanzania. This project would
manufacture vaccines against most of the African-specific
animal diseases, thereby addressing the unaddressed market
in the continent. The project size is USD 18 million, will be an
export-oriented unit to address the animal vaccine demand
of the continent. The plant capacity would be to manufacture
1.50 billion doses of animal vaccines to reach revenues of USD
& Melinda Gates Foundation and is expected to roll out the
first commercial batch in early 2021.
Our distribution activities coupled with this manufacturing
plant would synergise our business in Africa.
Divisional focus
The focus areas in the coming years would be on large animal
vaccines and health products. When we refer to the term
‘large animals’ we mean cattle, buffalo, sheep, goat and swine.
Large Animal vaccines market is forecasted to grow
in geometric progression considering that there are
immunisation as well as eradication programs embarked on
by state governments as well as by the central government for
Brucella and PPR diseases, respectively.
Large Animal health products have a huge market. We
estimate that this division would be the fastest growing
division in the next two financial years. A large range of
products have been planned to be launched in the next two
years, which would substantially contribute to the topline.
The success of the mass immunisation program in rural India
and seeing the opportunity, we established our Veterinary
Social Business Division in this financial year which would
be focused towards embarking on similar programs in other
states in the country, besides continuing the project in Odisha,
Chhattisgarh and Jharkhand.
In conclusion, the year gone has given us many positive
lessons. We have learnt that we need to plan better. We have
learnt that we need to have a better forecasting system in
place. We have learnt that we need to keep in mind undesired
external circumstances. We have learnt that we need to build
in a lot of redundancy into our business, thereby not being
dependent on any single factor for improving the topline or
the bottom-line or for impacting our long term plans.
While our lessons and learning continue, it surely now makes
us more Poised, Prepared and Positive to take your Company
to the next level.
Warm wishes,
Rajiv Gandhi
CEO and Managing Director
31st Annual Report 2017-18 15
Strategic Overview 02

Strategy for Future Growth Hesters' mission statement is ‘Better health for human beings through healthier animals’. Our short-term and long-term goals revolve around our mission.
Trusharti Brahmbhatt – Production Assistant Manager
Krishna Patel – Production Senior Executive
Hester Biosciences Limited
16
Short-term GoalsDevelop new generation vaccines through in-house R&D
The Company would steadily move away from conventional
vaccines, towards recombinant vaccines, which are safer
and cheaper to produce and easier to administer. Each
recombinant vaccine can encompass the immunisation against
multiple diseases in one dose. They are ideal replacements
and would also provide better margins.
Grow Large Animal Business
Hester intends to grow its large animal vaccines and health
products business which has huge potential within India and
globally.
Develop International Business
Till three years ago, Hester had all its revenue derived from
domestic sales. The immediate focus is to grow international
sales by 2020.
Strengthen Base in Africa
Africa is a huge untapped market with significant
opportunities. The Companys' focus will be on creating a
distribution network in Eastern Africa as well as setting-up
an animal vaccine plant in Tanzania to manufacture vaccines
against Africa-specific animal diseases.
Long-term GoalsThe Companys' long terms goals are towards achieving its
philosophy:
Build the future on a foundation of excellence
Institutionalise the business to ensure perpetuity
31st Annual Report 2017-18 17
Strategic Overview 02

03
Business Review
Poultry Division 19
Large Animal Division 21
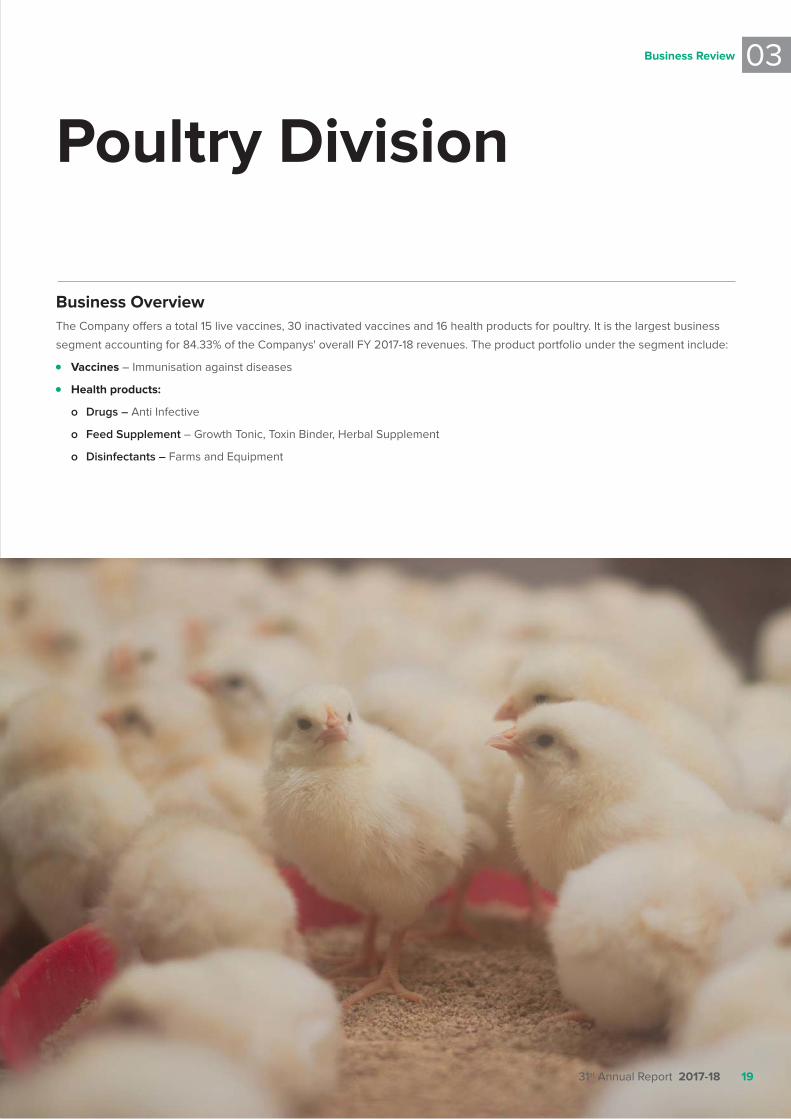
Poultry Division
Business Overview
Vaccines
Health products:
o Drugs – Anti Infective
o Feed Supplement
o Disinfectants – Farms and Equipment
31st Annual Report 2017-18 19
Business Review
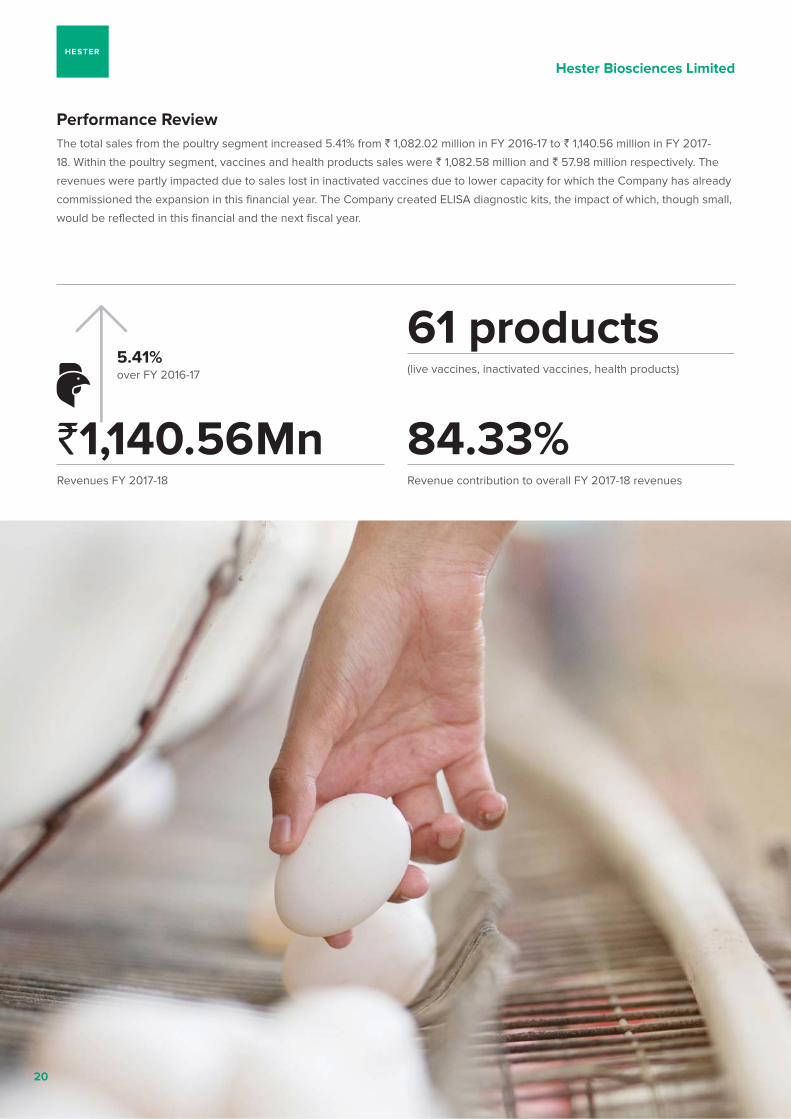
Performance Review ` `
18. Within the poultry segment, vaccines and health products sales were ` 1,082.58 million and ` 57.98 million respectively. The
revenues were partly impacted due to sales lost in inactivated vaccines due to lower capacity for which the Company has already
commissioned the expansion in this financial year. The Company created ELISA diagnostic kits, the impact of which, though small,
would be reflected in this financial and the next fiscal year.
`1,140.56MnRevenues FY 2017-18
5.41% 61 products(live vaccines, inactivated vaccines, health products)
84.33%Revenue contribution to overall FY 2017-18 revenues
Hester Biosciences Limited
20
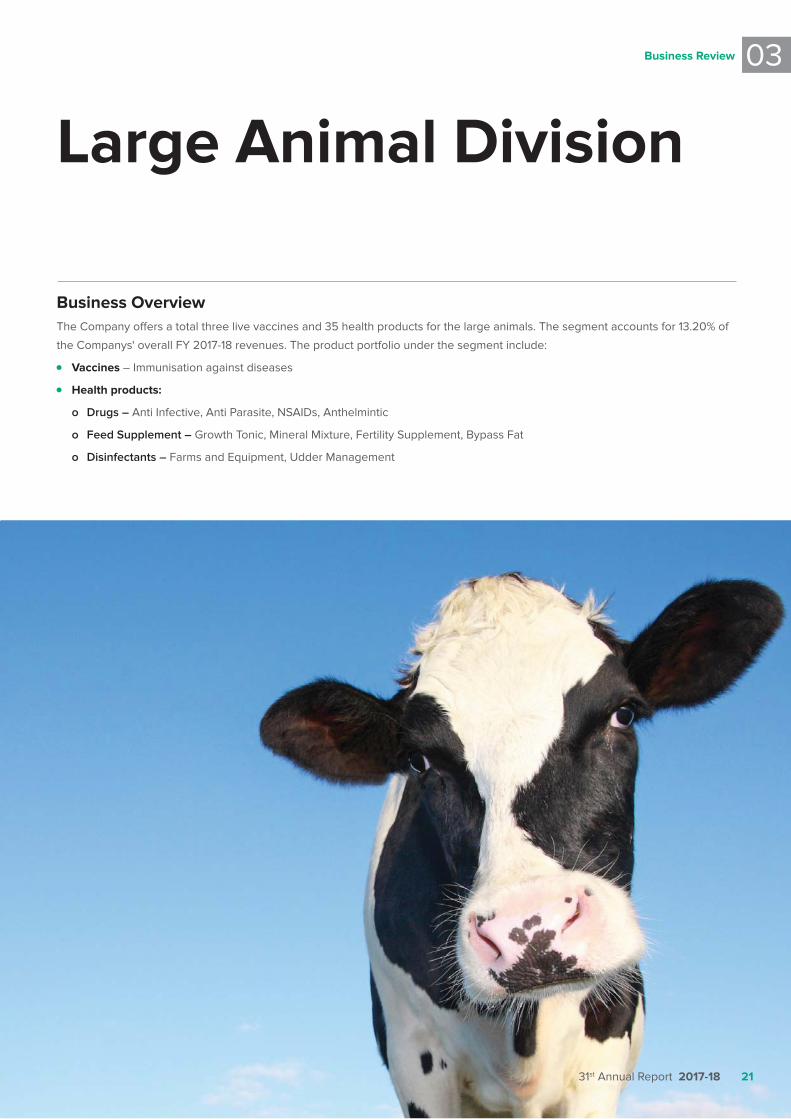
Large Animal Division
Business Overview
the Companys' overall FY 2017-18 revenues. The product portfolio under the segment include:
Vaccines
Health products:
o Drugs – Anti Infective, Anti Parasite, NSAIDs, Anthelmintic
o Feed Supplement – Growth Tonic, Mineral Mixture, Fertility Supplement, Bypass Fat
o Disinfectants – Farms and Equipment, Udder Management
31st Annual Report 2017-18 21
Business Review
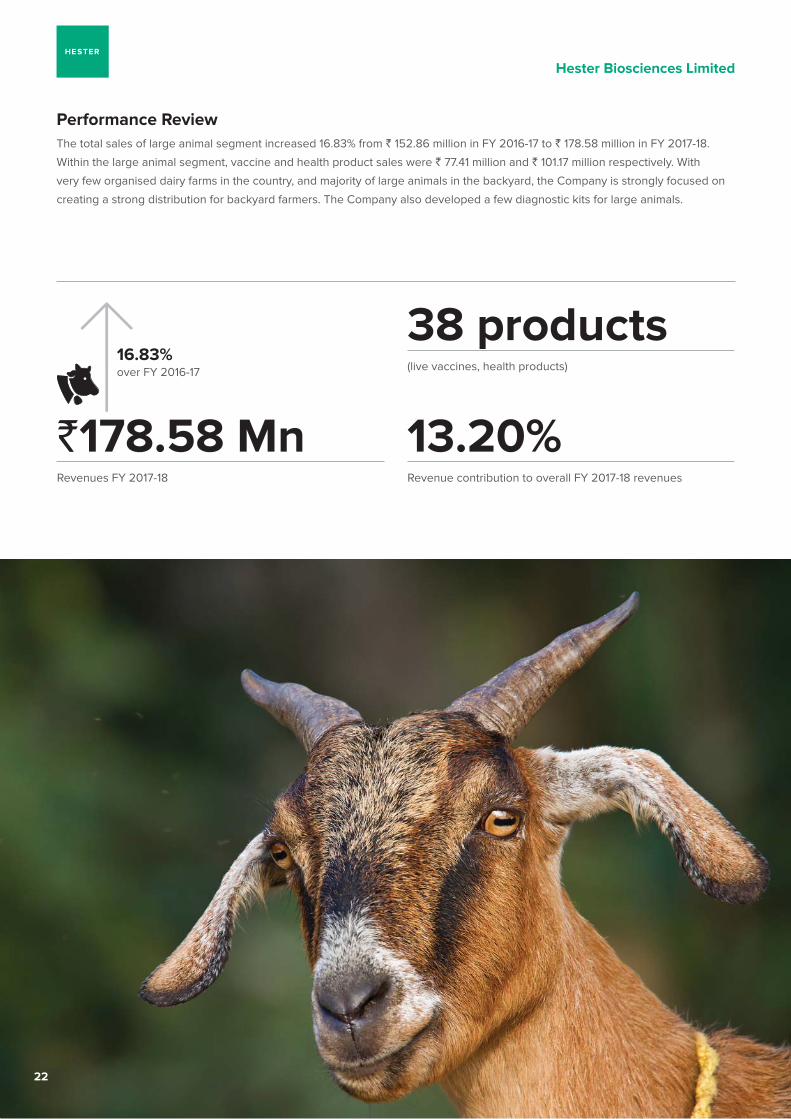
Performance Review ` ` 178.58 million in FY 2017-18.
Within the large animal segment, vaccine and health product sales were ` 77.41 million and ` 101.17 million respectively. With
very few organised dairy farms in the country, and majority of large animals in the backyard, the Company is strongly focused on
creating a strong distribution for backyard farmers. The Company also developed a few diagnostic kits for large animals.
`178.58 MnRevenues FY 2017-18
16.83% 38 products(live vaccines, health products)
13.20%Revenue contribution to overall FY 2017-18 revenues
Hester Biosciences Limited
22
04
People and Management
An Organisation Driven by Values & Ethics 24
Powerful Leadership Team 25
Corporate Information 26
31st Annual Report 2017-18 23

An Organisation Driven by Values & Ethics
Professional ManagementHesters' Board comprise of respected and experienced
people. Their overall knowledge in business, in industry as
well as in the veterinary space has been crucial in imparting
a philosophy to the company as well as in driving its business
forward.
Ethical LeadershipHesters' leadership team, driven by the Companys' as well as
their personal values and ethics, ensure that value system is
percolated right upto the bottom level in the organisation.
Corporate Governance & Regulatory CompliancesThe Company has high regards for corporate governance.
The aim is to be legally as well as morally compliant. Various
committees have been created to address legal compliance.
Transparent Business PracticesThe Company follows the practice of giving out all relevant,
timely and correct information to all its stakeholders. It also
ensures all its business dealings and transactions are fair
and transparent.
People PowerThe Company has a robust intellectual capital in terms of
people. All employees are professionals bringing in diverse
expertise. The intellect pool includes nine Ph.Ds, six Masters
of Veterinary Science, five Bachelors of Veterinary Science,
forty four Masters of Science, thirty six Bachelors of Science,
eighteen MBAs, six pharmacists, twenty six engineers and
two Chartered Accountants.
Dr. Pravinsinh Chauhan
Animal House In-charge
Hester Biosciences Limited
24

Powerful Leadership Team
1 2 4 5 7 8 9 10 11 12 14 15 17 18 19 20 21 22
1. Jigar Dhabalia,
2. Rashmin Patel,
Sales Operation
3. Maulik Patel,
Marketing
4. Raj Rughwani,
Large Animal Division
5. Sumit Gupta,
6. Raj Gera,
7. U K Jani, Consultant
8. V C Joshi,
9. Kajal Patel,
10. Priya Gandhi,
11. Rajiv Gandhi, CEO & Managing Director
12. Jigar Shah, CFO
13. Dr. J K Pal,
14. Dr. Shankar Chinchkar,
15. Dr. Surajit Bakshi,
16. Dr. Rahul Srivastava,
Veterinary Social Business
17. Dr. Manish Bhatt,
18. Mayank Gamit,
Sales & Marketing, Poultry Division
19. Ritesh Patel,
20. Srutikant Nayak,
21. Dr. Sulochana Shrestha,
Nepal Private Limited
22. Darayus Lakdawalla,
Overseas Operations
31st Annual Report 2017-18 25
People and Management 04

Corporate Information
Board of DirectorsDr. Bhupendra V. Gandhi, Chairman
Mr. Rajiv Gandhi, CEO & Managing Director
Mr. Sanjiv Gandhi, Non-Executive Director
Mr. Ravin Gandhi, Non-Executive Director
Mr. Vishwesh Patel, Independent Director
Ms. Grishma Nanavaty, Independent Director
Mr. Naman Patel, Independent Director
Mr. Amit Shukla, Independent Director
Ms. Nina Gandhi, Alternate Director
Chief Financial OfficerMr. Jigar Shah
Company SecretaryMs. Amala Parikh
Registered & Corporate Office1st Floor, Pushpak, Panchvati Circle,
Motilal Hirabhai Road, Ahmedabad
Manufacturing UnitVillage: Merda Adraj,
Taluka: Kadi, District: Mehsana
AuditorsApaji Amin & Co. LLP
Chartered Accountants
BankersState Bank of India
Overseas Branch, S G Highway,
Stock ExchangesBSE Limited
The National Stock Exchange of India Limited
ISIN: INE782E01017
Audit CommitteeMr. Vishwesh Patel, Chairman
Ms. Grishma Nanavaty, Member
Mr. Naman Patel, Member
Mr. Amit Shukla, Member
Stakeholders’ Grievances & Relationship CommitteeMs. Grishma Nanavaty, Chairperson
Mr. Vishwesh Patel, Member
Mr. Naman Patel, Member
Mr. Amit Shukla, Member
Nomination and Remuneration CommitteeMr. Vishwesh Patel, Chairman
Ms. Grishma Nanavaty, Member
Mr. Naman Patel, Member
Mr. Amit Shukla, Member
Corporate Social Responsibility CommitteeMr. Rajiv Gandhi, Chairman
Mr. Vishwesh Patel, Member
Ms. Grishma Nanavaty, Member
Share Transfer CommitteeMr. Rajiv Gandhi, Chairman
Mr. Sanjiv Gandhi, Member
Ms. Grishma Nanavaty, Member
Management CommitteeMr. Rajiv Gandhi, Chairman
Mr. Sanjiv Gandhi, Member
Ms. Grishma Nanavaty, Member
Registrar & Transfer AgentsLink Intime India Private Limited
(Unit: Hester Biosciences Limited)
Besides Gala Business Centre,
Near St. Xaviers' College Corner,
Off C G Road, Ellisesbridge,
Hester Biosciences Limited
26
05
Statutory Reports
Directors' Report 28
Management Discussion & Analysis 52
Report on Corporate Governance 56
Hester Biosciences Limited
28
Directors’ Report
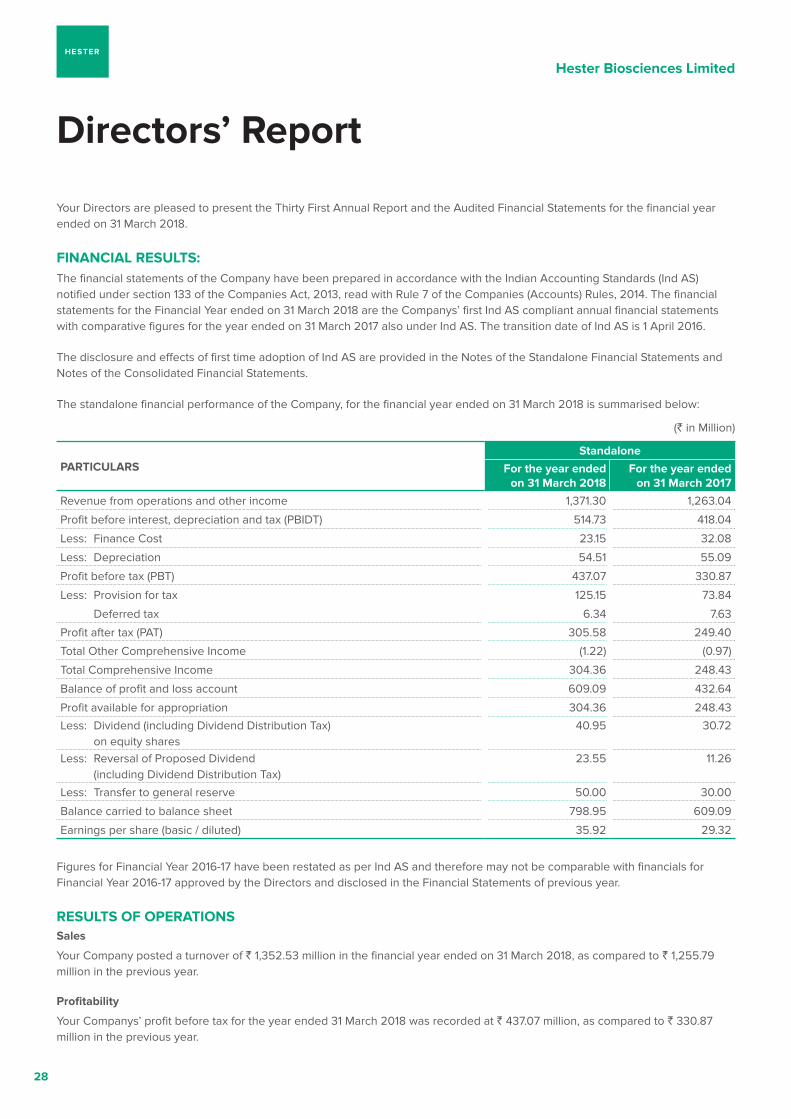
Your Directors are pleased to present the Thirty First Annual Report and the Audited Financial Statements for the financial year ended on 31 March 2018.
FINANCIAL RESULTS: The financial statements of the Company have been prepared in accordance with the Indian Accounting Standards (Ind AS) notified under section 133 of the Companies Act, 2013, read with Rule 7 of the Companies (Accounts) Rules, 2014. The financial statements for the Financial Year ended on 31 March 2018 are the Companys’ first Ind AS compliant annual financial statements with comparative figures for the year ended on 31 March 2017 also under Ind AS. The transition date of Ind AS is 1 April 2016.
The disclosure and effects of first time adoption of Ind AS are provided in the Notes of the Standalone Financial Statements and Notes of the Consolidated Financial Statements.
The standalone financial performance of the Company, for the financial year ended on 31 March 2018 is summarised below:
(` in Million)
PARTICULARSStandalone
For the year ended on 31 March 2018
For the year ended on 31 March 2017
Revenue from operations and other income 1,371.30 1,263.04
Profit before interest, depreciation and tax (PBIDT) 514.73 418.04
Less: Finance Cost 23.15 32.08
Less: Depreciation 54.51 55.09
Profit before tax (PBT) 437.07 330.87
Less: Provision for tax 125.15 73.84
Deferred tax 6.34 7.63
Profit after tax (PAT) 305.58 249.40
Total Other Comprehensive Income (1.22) (0.97)
Total Comprehensive Income 304.36 248.43
Balance of profit and loss account 609.09 432.64
Profit available for appropriation 304.36 248.43
Less: Dividend (including Dividend Distribution Tax) on equity shares
40.95 30.72
Less: Reversal of Proposed Dividend (including Dividend Distribution Tax)
23.55 11.26
Less: Transfer to general reserve 50.00 30.00
Balance carried to balance sheet 798.95 609.09
Earnings per share (basic / diluted) 35.92 29.32
Figures for Financial Year 2016-17 have been restated as per Ind AS and therefore may not be comparable with financials for Financial Year 2016-17 approved by the Directors and disclosed in the Financial Statements of previous year.
RESULTS OF OPERATIONSSales
Your Company posted a turnover of ` 1,352.53 million in the financial year ended on 31 March 2018, as compared to ` 1,255.79 million in the previous year.
Profitability
Your Companys’ profit before tax for the year ended 31 March 2018 was recorded at ` 437.07 million, as compared to ` 330.87 million in the previous year.
Statutory reportsDirectors' Report
05
31st Annual Report 2017-18 29
Earnings Per Share
EPS was at ` 35.92 as on 31 March 2018 as against ` 29.32 as on 31 March 2017.
Transfer to Reserves
` 50 million is proposed to be transferred to the General Reserve and ` 798.95 million is proposed to be retained in the surplus.
Net Worth
The Companys’ net worth as on 31 March 2018 was at ` 1,460.78 million as compared to ` 1,220.92 million as on 31 March 2017.
DIVIDENDDuring the year, your Directors declared and paid interim dividend of ` 4.00 per equity share for the financial year 2017-18. The resolution to pay interim dividend was passed in the meeting held on 9 November 2017. Further, your Directors have recommended a final dividend payment of ` 6.00 per equity share for the financial year 2017-18, making a total of ` 10.00 per equity share for the financial year as compared to ` 5.30 per equity share for the last year. This final dividend is subject to approval by the shareholders at the ensuing AGM. The total pay-out of dividend is 27.84% of the stand-alone profit, and is in line with the dividend policy adopted by the Company.
The total dividend appropriation (excluding dividend tax) for the current year is ` 53,593,249.50 as against ` 34,878,146.50 in the earlier year.
During the year, the unclaimed dividend pertaining to the dividend for the year ended 31 March 2010 was transferred to Investors Education and Protection Fund.
SHARE CAPITALThe paid-up equity share capital as on 31 March 2018 stood at ` 85.07 million.
REVIEW OF OPERATIONSThe financial year saw an increase in sales by 8% and an increase in bottom line by 23%.
The growth in sales was less than forecasted while we achieved the targeted growth in the bottom line.
We added the vertical of Diagnostics to the already existing verticals of Poultry Vaccines, Poultry Health Products, Large Animal Vaccines and Large Animal Health Products.
The poultry vaccine division witnessed a growth of 3.57%, an increase in sales to ` 1,082.57 million from ` 1,045.22 million in the previous year. The lesser than forecasted growth was mainly due to capacity constraints. The new created capacity is now functional to address the normal demand for poultry vaccines. The poultry health products division witnessed a
growth of 57.57%, an increase in sales to ` 57.98 million as compared to sales of ` 36.80 million in the previous year. Over all poultry divisions combined grew at 5.41%
The large animal vaccine division witnessed a growth of 12.09%, an increase in sales to ` 77.41 million as against ` 69.06 million in the previous year. Tender business which was expected in the last quarter, did not materialise. These orders would now come up in the first two quarters of the financial year, thus would make up for the lesser sales. The large animal health products division saw a growth of 20.73%, an increase in sales to ` 101.17 million from ` 83.80 million. Over all large animal divisions combined grew at 16.83%
Exports sales were far below forecasts. Product registrations, which were expected in various countries did not come through. Besides, a lot of resources had to be used up in rationalising the distribution network. FAO international tenders for PPR were far below their projections. Exports therefore dipped by 11.99% to ` 126.99 million from ` 144.31 million in the previous year.
While no sales was reported in the diagnostics division, we got the licenses for 3 diagnostics kits in the month of March. Sales are expected to start from the second quarter of this financial year.
While over-all sales were below forecasts, the trend in this financial year surely indicates a good growth in the top line as well as a further improvement in the bottom line.
Our CARE credit rating was reaffirmed as:
Long-term rating ‘A- (“A” Minus)’
Short-term rating ‘A2’
We continue to hold the following certifications:
1. WHO - GMP
2. GLP (Good Laboratory Practices)
3. ISO 9001:2008
4. ISO 14001:2004
5. OHSAS 180001:2007
6. DSIR approved R&D Centre
CONSOLIDATED FINANCIAL STATEMENTSThe Groups’ consolidated total income from operations is ` 1,389.59 million and total comprehensive income attributable to owners’ equity after non-controlling interest is ` 229.61 million for the financial year 2017-18 as compared to the Groups’ consolidated total income from operations of ` 1,258.23 million and total comprehensive income attributable to owners’ equity after non-controlling interest of ` 225.52 million for the previous financial year 2016-17. Consolidated financial results include the financial results of following entities:
1. Hester Biosciences Nepal Private Limited - Foreign Subsidiary
Hester Biosciences Limited
30
2. Texas Lifesciences Private Limited - Subsidiary
3. Hester Biosciences Africa Limited - Foreign Wholly-owned Subsidiary
In accordance with the Indian Accounting Standard (Ind AS)-110 Consolidated Financial Statements and as provided under the provisions of the Companies Act, 2013 (hereinafter referred to as “Act”) read with Schedule III to the Act and Rules made thereunder and the SEBI ( Listing Obligations and Disclosure Requirements) Regulations, 2015, the Audited Consolidated Financial Statements are provided in the Annual Report, which show the financial resources, assets, liabilities, incomes, profits and other details of the Company, its subsidiary Companies after elimination of minority interest, as a single entity.
SUBSIDIARY, JOINT-VENTURE & ASSOCIATE COMPANIESAs on 31 March 2018, your Company has one wholly-owned subsidiary Company namely, Hester Biosciences Africa Limited and two subsidiary Companies namely, Hester Biosciences Nepal Private Limited and Texas Lifesciences Private Limited.
Further, there has been no material change in the nature of business of the subsidiary.
During the year, Hester Biosciences Limited acquired and invested about 54.80% in the capital of Texas Laboratories, a firm having a business place at Mehsana district of Gujarat. In June 2017, Texas Laboratories converted into private limited company under the Companies Act, 2013 namely, Texas Lifesciences Private Limited. Further, Hester Biosciences Limited incorporated 100% wholly-owned subsidiary Hester Biosciences Africa Limited in Tanzania.
The audited financial accounts of the Subsidiary Companies will be available for inspection during business hours at our registered office. Further, the financial highlights of Subsidiaries are part of this Annual Report as Annexure-2 as prescribed in Form AOC-1.
As provided under section 129(3) of the Companies Act, 2013 and Rules made thereunder a statement containing the salient features of the financial statements of its subsidiaries in the format prescribed under the rules is attached to the financial statements. The policy relating to material subsidiaries as approved by the Board may be accessed on the Companys’ website at the link: https://www.hester.in/s/Policy-for-Determining-Material-Subsidiaries-gcgn.pdf
The performances of the Subsidiary Companies as under:
Hester Biosciences Nepal Private Limited (HBNPL)HBNPL is a subsidiary of Hester Biosciences Limited. Hester India holds 65% stake in HBNPL, hence becoming a subsidiary of Hester Biosciences Limited. HBNPL is in the business of manufacturing veterinary vaccines in Nepal.
Texas Lifesciences Private Limited (Texas Lifesciences)
During the year, Hester Biosciences Limited acquired and invested in capital of Texas Laboratories, a firm having a business place at Mehsana district of Gujarat. In June 2017, Texas Laboratories converted into private limited company under the Companies Act, 2013 namely, Texas Lifesciences Private Limited. Hester India holds 54.80% stake in Texas Lifesciences, hence becoming a subsidiary of Hester Biosciences Limited. Texas Lifesciences is in the business of manufacturing and supplying pharma formulations, tablets, capsules, powder, and oral liquid for human and veterinary markets.
Hester Biosciences Africa Limited (HBAL)
During the year, Hester Biosciences Limited incorporated a 100% wholly-owned subsidiary in the name of Hester Biosciences Africa Limited (HBAL) in Tanzania. HBAL will be in the business of manufacturing veterinary vaccines and animal health product in Tanzania.
The board has approved the setting up of an animal vaccine manufacturing unit in Tanzania.
Hester sees a big potential in Africa for animal vaccines. More than 80% of the vaccines required in Africa are imported. Besides the common diseases, there are Africa-specific diseases, which currently remain unaddressed, thereby causing economical losses to poultry and livestock farmers.
The objective of the project is to bridge the quantitative and qualitative gap between demand and supply of animal vaccines among small holder farmers as well as amongst the commercial farmers in the African continent. The project would mainly manufacture vaccines against Africa-specific diseases, besides having the capability as well as the capacity to manufacture a bigger range of vaccines against other commonly occurring animal diseases.
Project Highlights:
Name of entity: Hester Biosciences Africa Limited
Ownership Wholly-owned subsidiary of Hester Biosciences Limited, India
Type of company: An export Oriented Unit registered under the Companies Act, 2002 of Tanzania
Export committment: 80% of the sales
Location: Kibaha Coast Region, Tanzania
Capacity: 1.5 billion doses of vaccines
Revenue: USD 30 million per year at full capacity
Employment generation: 200 direct & 300 indirect employees at full capacity
Statutory reportsDirectors' Report
05
31st Annual Report 2017-18 31
Project Cost (In USD):
Land & Building: 7,000,000
Plant & Machinery: 7,000,000
Other Cost*: 4,000,000
Total Project Cost: 18,000,000
*Other Cost include preliminary & preoperative expenses, Technology
adaption, Market survey and product Registration Costs
Source of Finance (In USD):
Equity Share Capital
Hester Biosciences Limited 4,000,000
Secured Loan** Bill & Melinda Gates Foundation, located in U.S.A.
10,000,000
Grant** Bill & Melinda Gates Foundation, located in U.S.A.
4,000,000
Total Sources of Finance
18,000,000
** Total Sanctioned Secured loan is USD 12,000,000. Disbursement
of both the loan and the grant are pending the execution of definitive
loan agreements and the Companys' satisfaction of relevant closing
conditions.
Timeline of Project:
Completion of Construction: January 2020
Validation of facility: April 2020
First commercial batch: November 2020
In coming years, Africa is poised to become one of the major markets for animal vaccines. Tanzania, having the third largest herd of domestic livestock, will be the biggest market for animal vaccines in Africa.
Hester is also in the process of creating a strong distribution network in Africa. This network will service the backyard farmers, which constitute a big percentage of the animal population in Africa, as well as the organised poultry & livestock farmers.
BOARD OF DIRECTORS & KEY MANAGERIAL PERSONNELAppointment and Resignation of DirectorsDuring the year, there is no appointment and resignation was done under review.
None of the Directors of the Company is disqualified for being appointed as Director as specified in Section 164 (2) of the Companies Act, 2013.
Retirement by RotationsIn accordance with the provisions of section 152 (6) of the Act and in terms of the Articles of Association of the Company, Mr. Ravin Gandhi, Director (DIN - 00438361) will retire by rotation at the ensuing Annual General Meeting and being
eligible, offers himself for re-appointment. The Board recommends his re-appointment.
Profile of Directors Seeking Appointment / Re-appointmentAs required under Regulation 36 (3) of the SEBI (LODR) Regulations, 2015, particulars of Directors seeking appointment / re-appointment at the ensuing Annual General Meeting are annexed to the notice convening 31st Annual General Meeting.
Declaration by Independent DirectorsThe Company has received necessary declaration from each Independent Director under Section 149 (7) of the Companies Act, 2013, that they meet the criteria of independence laid down in Section 149 (6) of the Companies Act, 2013. The terms and conditions of the Independent Directors are incorporated on the website of the Company as per Regulation 46(2) of SEBI (Listing Obligations and Disclosures Requirements) Regulations, 2015 at: https://www.hester.in/s/Terms-and-Conditions-Independent-Director.pdf
Training of Independent Directors
To familiarise the new inductees with the strategy, operations and functions of our Company, the executive directors / senior managerial personnel make presentations to the inductees about the Companys' strategy, operations, product and service offerings, organisation structure, finance, human resources, technology, quality and facilities. Further, the Company has devised a Familiarisation Program for Independent Directors as per Regulation 46 (2) of SEBI (Listing Obligations and Disclosures Requirements) Regulations, 2015 and the same has been placed on the website of the Company at: https://www.hester.in/s/Familairisation-Programs-Details-of-Independent-Director-2017-18.pdf
Key Managerial Personnel
Mr. Vinod Mali appointed as Company Secretary and Compliance Officer in place of Ms. Amala Parikh, who has resigned from the post of Company Secretary of the Company with effect from 14 May 2018. Mr. Rajiv Gandhi, CEO & Managing Director, Mr. Jigar Shah, Chief Financial Officer and Mr. Vinod Mali, Company Secretary of the Company are the Key Managerial Personnel as per the provisions of the Companies Act, 2013.
Evaluation of Performance of the Board, its Committees and Individual Directors
During the year, the evaluation of the annual performance of individual directors including the Chairman of the Company and Independent Directors, Board and Committees of the Board was carried out under the provisions of the Act and relevant Rules and the Corporate Governance requirements as prescribed under Regulation 17 of Listing Regulations, 2015 and the circular issued by SEBI dated 5 January 2017 with respect to Guidance Note on Board Evaluation. The Nomination and Remuneration Committee had approved the indicative criteria for the evaluation based on the SEBI Guidance Note on Board Evaluation.
Hester Biosciences Limited
32
The evaluation for the performance of the Board as a whole and of the Committees were conducted by questionnaires.
In a separate meeting of Independent Directors held on 23 January 2018, performance of Non-Independent Directors and performance of the Board as a whole was evaluated. Further, they also evaluated the performance of the Chairman of the Company, taking into account the views of the Executive Directors and Non-Executive Directors.
The performance of the Board was evaluated by the Board after seeking inputs from all the Directors on the basis of various criteria such as structure and diversity of the Board, experience of Directors, strategy and performance evaluation, secretarial support, evaluation of risk, evaluation of performance of the management and feedback, independence of the management from the Board and other indicators. The Nomination and Remuneration Committee reviewed the performance of the individual Directors on the basis of the criteria such as knowledge and competency, fulfillment of functions, availability and attendance, initiative integrity contribution and commitment, independence, independent views and judgment among other components.
Nomination and Remuneration Policy
The Board has on the recommendation of the Nomination and Remuneration Committee framed a policy on selection and appointment of Directors, Senior Management and their remuneration. The Remuneration Policy is stated in the Corporate Governance Report, which is a part of this Annual Report.
Board of Director Meetings
The Board consists of eight members as on 31 March 2018, four of whom are Promoters and Non-Independent Directors and the remaining four are Independent Directors.
Regular meetings of the Board are held at least once in a quarter, inter-alia, to review the quarterly, half yearly and annual financial results of the Company. Additional Board meetings are convened to discuss and decide on various business policies, strategies and other businesses.
During the year under review, the Board of Directors of the Company met four times: 8 May 2017, 28 July 2017, 9 November 2017 and 23 January 2018.
Committees of Board of Directors
Your Company has several Committees which have been established as part of best corporate governance practices and are in compliance with the requirements of the relevant provisions of applicable laws and statutes.
The Company has following Committees of the Board:
Audit Committee
Nomination and Remuneration Committee
Stakeholders’ Grievances and Relationship Committee
Corporate Social Responsibility Committee
Management Committee
Share Transfer Committee
A detailed note on the committees with respect to composition, meetings, powers, and terms of reference is provided under the Corporate Governance Report section in this Annual Report.
CORPORATE SOCIAL RESPONSIBILITY COMMITTEE (“CSR”)The CSR Committee is responsible for indicating the activities to be undertaken by the Company, monitoring the implementation of the framework of the Corporate Social Responsibility Policy and recommending the amount to be spent on CSR activities. The details of membership of the Committee & the meetings held are detailed in the Corporate Governance Report, forming part of this Report. The contents of the CSR Policy of the Company as approved by the Board on the recommendation of the CSR Committee is available on the website of the Company and can be accessed through the web link: https://www.hester.in/s/Corporate-Social-Responsibility-Policy-6f83.pdf
Corporate Social Responsibility (CSR) Committee and Statutory Disclosures with respect to CSR Committee and an Annual Report on CSR Activities form part of this Directors’ Report as Annexure-1.
PUBLIC DEPOSITSDuring the period under review, the Company has not accepted deposits from shareholders and public falling within the ambit of Section 73 of the Companies Act, 2013 and rules made thereunder.
FINANCEThe working capital requirement and all capital expenditures were funded through internal accruals. During the year, the Company has raised the finance through Working Capital Demand Loan (unsecured) facility from Yes Bank Limited.
INSURANCEAssets of your Company are adequately insured against various perils.
VIGIL MECHANISM The Company has established a vigil mechanism and framed a Whistle Blower Policy for Directors and employees to report concerns about unethical behaviour, actual or suspected fraud or violation of the Companys’ Code of Conduct or Ethics Policy. The functioning of vigil mechanism is reviewed by the Audit Committee from time to time. No whistle blower has been denied access to the Audit Committee of the Board. The Whistle Blower Policy of the Company is available on the Companys’ website.
Statutory reportsDirectors' Report
05
31st Annual Report 2017-18 33
SEXUAL HARASSMENT OF WOMEN AT WORKPLACEYour Company strongly believes in providing a safe and harassment free workplace for each and every individual working for the Company. Its continuous endeavor of the Management of the Company to create and provide an environment to all its employees that is free from discrimination and harassment including sexual harassment. The Company has adopted a policy on prevention, prohibition and redressal of sexual harassment at workplace in line with the provisions of the Sexual Harassment of Women at Workplace (Prevention, Prohibition and Redressal) Act, 2013 and the Rules thereunder.
During the year, under review there were no incidences of sexual harassment reported and received, in terms of the provisions of the Sexual Harassment of Women at Workplace (Prevention, Prohibition and Redressal) Act, 2013.
CORPORATE GOVERNANCEThe Company has complied with the Corporate Governance requirements under the Companies Act, 2013 and Regulations 17 to 27 and 46 of the SEBI (LODR) Regulations, 2015. A separate section on detailed report on Corporate Governance practice followed by the Company under SEBI (LODR) Regulations, 2015 along with a certificate from Practicing Company Secretary, confirming the compliance forms a part of this report. The Board of Directors supports the basic principles of corporate governance and lays strong emphasis on transparency, accountability and integrity.
SECRETARIAL STANDARDSSecretarial Standards for the Board of Directors and General Meetings (SS-1 & SS-2) are applicable to the Company. The Company has complied with the provisions of both Secretarial Standards.
MANAGEMENT DISCUSSION & ANALYSIS REPORTYour attention is drawn to the perception and business outlook of the management for your company for the current year and for the industry in which it operates including its position and perceived trends in near future. The Management Discussion and Analysis Report, as required under Regulations 34 of the SEBI (LODR) Regulations, 2015 is attached and forms part of this Directors’ Report.
AUDITORSStatutory Auditor and Their Report
Apaji Amin & Co. LLP, Chartered Accountants, Ahmedabad (Firm Registration No. 100513W/W100062), was appointed as a statutory auditor of your Company, and will hold Office until the conclusion of the 32nd AGM to be held in the year 2019. Apaji Amin & Co. LLP has submitted their resignation and shown their unwillingness to ratify their appointment due to their pre-occupation in other assignments.
The Board of Directors of the Company has filled this casual vacancy by recommending Shah Karia & Associates, Chartered Accountants, Ahmedabad, as statutory auditor of the Company in their Board meeting held on 14 May 2018, subject to approval of the members in the ensuing Annual General Meeting. Shah Karia & Associates (Firm Registration No. 131546W), Chartered Accountants, Ahmedabad, have expressed their willingness to be appointed as the statutory auditor of the Company. The Audit Committee has considered the qualifications and experiences of the proposed statutory auditor and has recommended their appointment. The Board of Directors has also considered and recommends appointment of Shah Karia & Associates, Chartered Accountants, as statutory auditor in place of the Apaji Amain & Co. LLP subject to approval of shareholder of the Company in ensuing Annual General Meeting of the Company. Written consent of the proposed auditor together with a certificate that the appointment, if made, shall be in accordance with the conditions specified in Rule 4 of the Companies (Audit and Auditors) Rules, 2014 has been received.
The Board has duly reviewed the Statutory Auditors’ Report for the year ended on 31 March 2018 and the observations and comments, appearing in the report are self-explanatory and do not call for any further explanation / clarification by the Board of Directors as provided under section 134 of the Companies Act, 2013.
Internal Auditor and Their Report
Naresh J. Patel & Co., Chartered Accountants, Ahmedabad, has been the internal auditor of the Company for the FY 2017-18. The Internal Auditor is appointed by the Board of Directors of the Company on a yearly basis, based on the recommendation of the Audit Committee. The Internal Auditor reports its findings on the internal audit of the Company to the Audit Committee on a quarterly basis. The scope of internal audit is approved by the Audit Committee.
The Board has appointed Naresh J. Patel & Co., Chartered Accountants, Ahmedabad for the FY 2018-19 as an Internal Auditor of the Company in the Board meeting held on 14 May 2018, after obtaining its willingness and eligibility letter for appointment as Internal Auditor of the Company.
Cost Auditor and Their Report
Pursuant to provisions of Section 148 read with Companies (Audit & Auditors) Rules, 2014 and other applicable provisions, if any, of the Companies Act, 2013, the Board of Directors had, on recommendation of the Audit Committee, re-appointed Kiran J. Mehta & Co., Cost Accountants, Ahmedabad, as the Cost Auditor of the Company for the financial year 2017-18, on the remuneration terms as approved by the members at the last Annual General Meeting held on 28 July 2017.
The Cost Audit report for the financial year 2016-17 was filed within the due date. The due date for submission of the Cost Audit Report for the year 2017-18 is within 180 days from 31 March 2018.
Hester Biosciences Limited
34
The Board has appointed Kiran J. Mehta & Co., Cost Accountants, Ahmedabad for the FY 2018-19 as a Cost Auditor of the Company in the Board meeting held on 14 May 2018, after obtaining its willingness and eligibility letter for appointment as Cost Auditor of the Company. As required under the Act and Rules made thereunder, the remuneration payable to the Cost Auditor is required to be placed before the Members in a general meeting for ratification. Accordingly, a resolution seeking ratification by members for the remuneration payable to Kiran J. Mehta & Co. is included in the Notice convening 31st Annual General Meeting of the Company.
Secretarial Auditor and Their Report
Pursuant to the provisions of Section 204 of the Companies Act, 2013 and the Companies (Appointment and Remuneration of Managerial Personnel) Rules, 2014, the Board of Directors had appointed Mr. Tapan Shah, Practicing Company Secretary to undertake the Secretarial Audit of the Company for the FY 2017-18. The Secretarial Audit Report for the FY 2017-18 is annexed to this Directors’ Report as Annexure-6. The Board of Directors has duly reviewed the Secretarial Auditors’ Report and the observations and comments, appearing in the report are self-explanatory and do not call for any further explanation/clarification by the Board of Directors as provided under section 134 of the Act.
The Board of Directors has appointed Mr. Tapan Shah, Practicing Company Secretary to undertake the Secretarial Audit of the Company for the FY 2018-19 in the Board Meeting held on 14 May 2018.
PARTICULARS OF LOANS, GUARANTEES & INVESTMENTSDetails of loans, guarantees and investments covered under the provisions of Section 186 of the Companies Act, 2013 are given in the notes to the Financial Statements.
EXTRACT OF ANNUAL RETURNPursuant to Sub-section 3(a) of Section 134 and Sub-section (3) of Section 92 of the Companies Act, 2013 read with Rule 12 of Companies (Management and Administration) Rules, 2014, the extract of the Annual Return as at 31 March 2018 in Form MGT-9 forms part of this Annual Report as Annexure-3.
RELATED PARTY TRANSACTIONSThe policy on Related Party Transactions as approved by the Board is available on the website of the Company and can be accessed through the web link: https://www.hester.in/s/Related-Party-Transaction-Policy-jsdr.pdf
All contracts/arrangements/transactions entered by the Company during the previous financial year with the related parties were in the ordinary course of business and on arms’ length basis. There were no materially significant related party transactions entered by the Company with its Promoters,
Directors, Key Managerial Personnels or other persons which may have potential conflict with the interest of the Company.
All Related Party transactions are placed before the Audit Committee for approval, wherever applicable. Prior omnibus approval for normal business transactions is also obtained from the Audit Committee for the related party transactions which are of repetitive nature and accordingly, the required disclosures are made to the Committee on a quarterly basis in terms of the approval of the Committee.
The disclosure of Related Party Transactions as required under Section 134(3)(h) of the Act in Form AOC - 2 is not applicable for the current year.
CONSERVATION OF ENERGY, TECHNOLOGY ABSORPTION & FOREIGN EXCHANGE EARNINGS & OUTGOThe information on conservation of energy, technology absorption and foreign exchange earnings and outgo as stipulated under Section 134(3)(m) of the Act read with Rule 8 of The Companies (Accounts) Rules, 2014 forms part of this directors’ report as Annexure-4.
PARTICULAR OF EMPLOYEESThe information required under section 197 of the Act read with Rule 5(1) of the Companies (Appointment and Remuneration of Managerial Personnel) Rules, 2014, is given in this Annual Report as Annexure-5.
MATERIAL CHANGES AND COMMITMENT AFFECTING FINANCIAL POSITION OF THE COMPANYThere are no material changes and commitments, affecting the financial position of the Company which has occurred between the end of financial year and the date of Directors’ Report.
RISK MANAGEMENT POLICY & FRAMEWORKRisk management is embedded in your Companys’ operating framework. Your Company believes that managing risks helps in maximising returns. The Companys’ approach to addressing business risks is comprehensive and includes periodic review of such risks and a framework for mitigating controls and reporting mechanism of such risks. The risk management framework is reviewed periodically by the Board and the Audit Committee.
INTERNAL FINANCIAL CONTROL SYSTEMS & ITS ADEQUACYThe Company has its internal audit function which endeavours to make meaningful contributions to the organisations’ overall governance, risk management and internal controls. The function reviews and ensures sustained effectiveness of Internal Financial Control by adopting a systematic approach to its work.
Statutory reportsDirectors' Report
05
31st Annual Report 2017-18 35
The Company has designed and implemented a process driven framework for Internal Financial Controls (IFC) within the meaning of the explanation to section 134 (5) (e) of the Act. For the year ended on 31 March 2018, the Board having opinion that the Company has sound Internal Financial Control commensurate with the size, scale and complexity of its business operations. The Internal Financial Control operates effectively and no material weakness exists. The Company has a process in place to continuously monitor the same and identify gaps, if any, and implement new and / or improved controls whenever the effect of such gaps would have a material effect on the Companys’ operations.
CREDIT RATINGCARE Ratings Limited has reaffirmed the credit rating of “CARE A- /Stable” for long-term bank facilities and “CARE A2” for short term bank facilities of the Company.
UNCLAIMED EQUITY SHARES The Company has transferred 41,996 Equity Shares to Investor Education & Protection Fund pursuant to the provisions of Section 124(6) of Companies Act, 2013 read with Investor Education and Protection Fund Authority (Accounting, Audit, Transfer and Refund) Rules, 2016 (“IEPF Rules”), where the dividends for the last seven consecutive years have not been claimed by the concerned shareholders.
DIRECTORS’ RESPONSIBILITY STATEMENTAs stipulated in Section 134(3) (c) read with 134(5) of the Companies Act, 2013, Directors’ subscribe to the “Directors’ Responsibility Statement” and confirm that:
a) In preparation of annual accounts for the year ended 31 March 2018, the applicable accounting standards have been followed and no material departures have been made from the same;
b) The Directors had selected such accounting policies and applied them consistently and made judgments and estimates that are reasonable and prudent so as to give a true and fair view of the state of affairs of the Company at the end of the financial year and of the profit or loss of the Company for that year;
c) The Directors had taken proper and sufficient care for the maintenance of adequate accounting records in accordance with the provisions of the Companies Act, 2013, for safeguarding the assets of the Company and for preventing and detecting fraud and other irregularities;
d) The Directors had prepared the annual accounts for the year ended 31 March 2018 on going concern basis;
e) The Directors had laid down the internal financial controls to be followed by the Company and that such internal financial controls are adequate and were operating effectively; and
f) The Directors had devised proper systems to ensure compliance with the provisions of all applicable laws and that such systems were adequate and operating effectively.
GENERALYour Directors state that the Company has made disclosures in this report for the items prescribed in section 134 (3) of the Act and Rule 8 of the Companies (Accounts) Rules, 2014, to the extent the transactions took place on these items during the year and no disclosure or reporting is required in respect of the following items as there were no transactions on these items during the year under review:
1. Issue of equity shares with differential rights as to dividend, voting or otherwise.
2. Issue of shares (including sweat equity shares) to employees of the Company under any scheme save and ESOS.
3. The Managing Director of the Company has not received any remuneration or commission from any of its subsidiaries.
4. No significant or material orders were passed by the Regulators or Courts or Tribunals which impact the going concern status and Companys’ operations in future.
ACKNOWLEDGEMENTYour Directors wish to thank all stakeholders, employees, Companys’ bankers, various government authorities, members and business associates for their continued support and valuable co-operation.
Your Directors also wish to place on record their deep sense of appreciation for the committed services by the executives, staff and workers of the Company.
For and on behalf of Board of Directors
Date: 14 May 2018 Rajiv Gandhi Sanjiv GandhiPlace: Ahmedabad CEO & Managing Director Director
Hester Biosciences Limited
36
Annexure-1
THE ANNUAL REPORT ON CORPORATE SOCIAL RESPONSIBILITY (CSR) ACTIVITIES
1. A brief outline of the Companys’ CSR Policy, including overview of projects or programs undertaken or proposed to be undertaken and a reference to the web-link to the CSR Policy and projects or programs.
The CSR Policy encompasses the Companys’ philosophy for delineating its responsibility as a corporate citizen and lays down the guidelines and mechanism for undertaking socially useful programs for welfare and sustainable development of the community at large.
The main projects or programs proposed to be undertaken by the Company are as provided under the Schedule VII of the Companies Act, 2013. Further, The Company focuses its philanthropy primarily in geographic regions of India, where the Company has a business presence. However, the Company may contribute to causes in other parts of India, if the CSR Committee is of the opinion that such contribution is appropriate.
The CSR Committee approved the CSR spending on promotion of education, health care, improving livelihood of rural populations and so on, through charitable institutions and also directly by the Company during the FY 2017-18.
2. Composition of CSR Committee
Mr. Rajiv Gandhi Chairman
Mr. Vishwesh Patel Member
Ms. Grishma Nanavaty Member
3. Average net profits of the Company for last three financial years: ` 247.47 million
4. Prescribed CSR expenditure [2% of the amount as in item No. 3 above]: ` 4.95 million
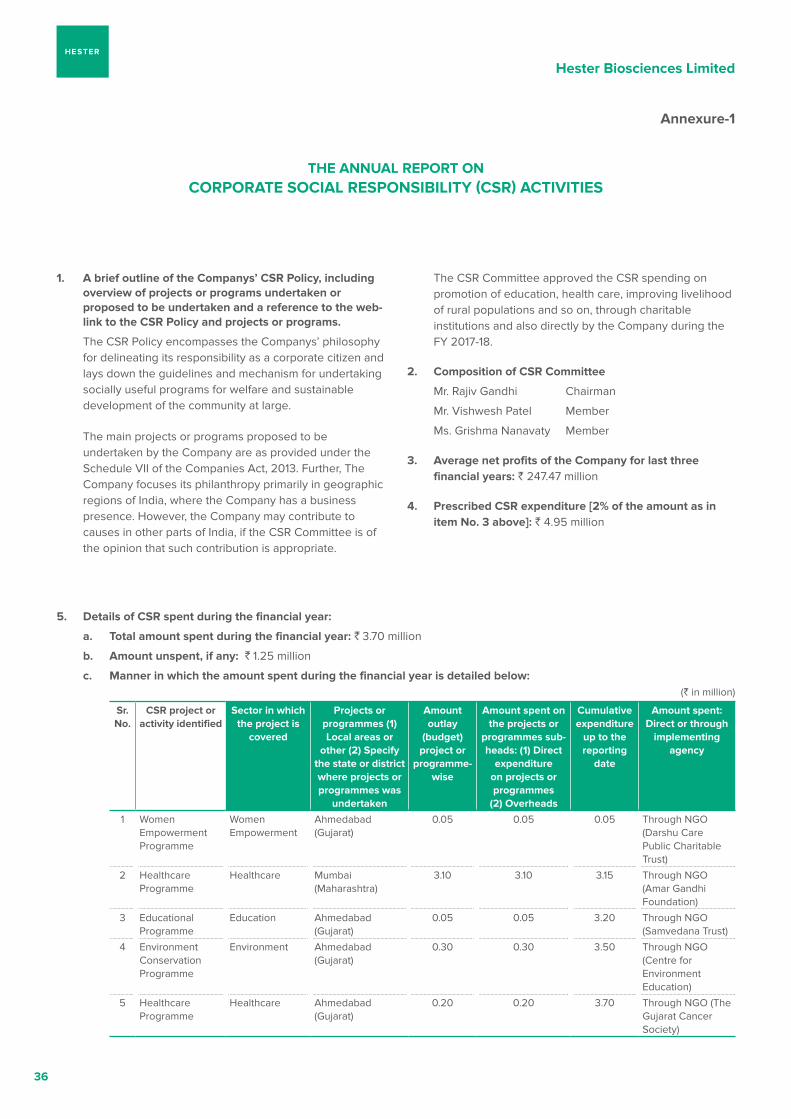
5. Details of CSR spent during the financial year:
a. Total amount spent during the financial year: ` 3.70 million
b. Amount unspent, if any: ` 1.25 million
c. Manner in which the amount spent during the financial year is detailed below:(` in million)
Sr. No.
CSR project or activity identified
Sector in which the project is
covered
Projects or programmes (1) Local areas or
other (2) Specify the state or district where projects or programmes was
undertaken
Amount outlay
(budget) project or
programme-wise
Amount spent on the projects or
programmes sub-heads: (1) Direct
expenditure on projects or programmes
(2) Overheads
Cumulative expenditure
up to the reporting
date
Amount spent: Direct or through
implementing agency
1 Women Empowerment Programme
Women Empowerment
Ahmedabad (Gujarat)
0.05 0.05 0.05 Through NGO (Darshu Care Public Charitable Trust)
2 Healthcare Programme
Healthcare Mumbai (Maharashtra)
3.10 3.10 3.15 Through NGO (Amar Gandhi Foundation)
3 Educational Programme
Education Ahmedabad (Gujarat)
0.05 0.05 3.20 Through NGO (Samvedana Trust)
4 Environment Conservation Programme
Environment Ahmedabad (Gujarat)
0.30 0.30 3.50 Through NGO (Centre for Environment Education)
5 Healthcare Programme
Healthcare Ahmedabad (Gujarat)
0.20 0.20 3.70 Through NGO (The Gujarat Cancer Society)
Statutory reportsDirectors' Report
05
31st Annual Report 2017-18 37
In case the Company has failed to spend the stipulated 2% of the average net profits of the last three financial years or any part thereof, the Company shall provide the reasons for not spending the amount in its Board report.
During the year, the Company spent ` 3,701,000 towards a project of promoting education, health care and environment conservation through NGOs. A few projects undertaken by the Company is an on-going one where the Company will have a continuing engagement over the years to come. The Company was in process of identifying and evaluating projects which were in line with the CSR policy. However given the projects were still under the evaluation process, the Company could
For and on behalf of Board of Directors
Rajiv Gandhi Sanjiv GandhiDate: 14 May 2018 Chairman - CSR Committee and DirectorPlace: Ahmedabad CEO & Managing Director
not spend a minimum of two per cent of its average profit for CSR, as defined in the Act, during the year. The Company has plans to achieve its objectives and completing the identification of projects.
A responsibility statement of the CSR Committee that the implementation and monitoring of CSR Policy is in compliance with CSR objectives and policy of the Company
The CSR Committee confirms that the implementation and monitoring of CSR Policy is in conformance with CSR objectives and policy of the Company.
Hester Biosciences Limited
38
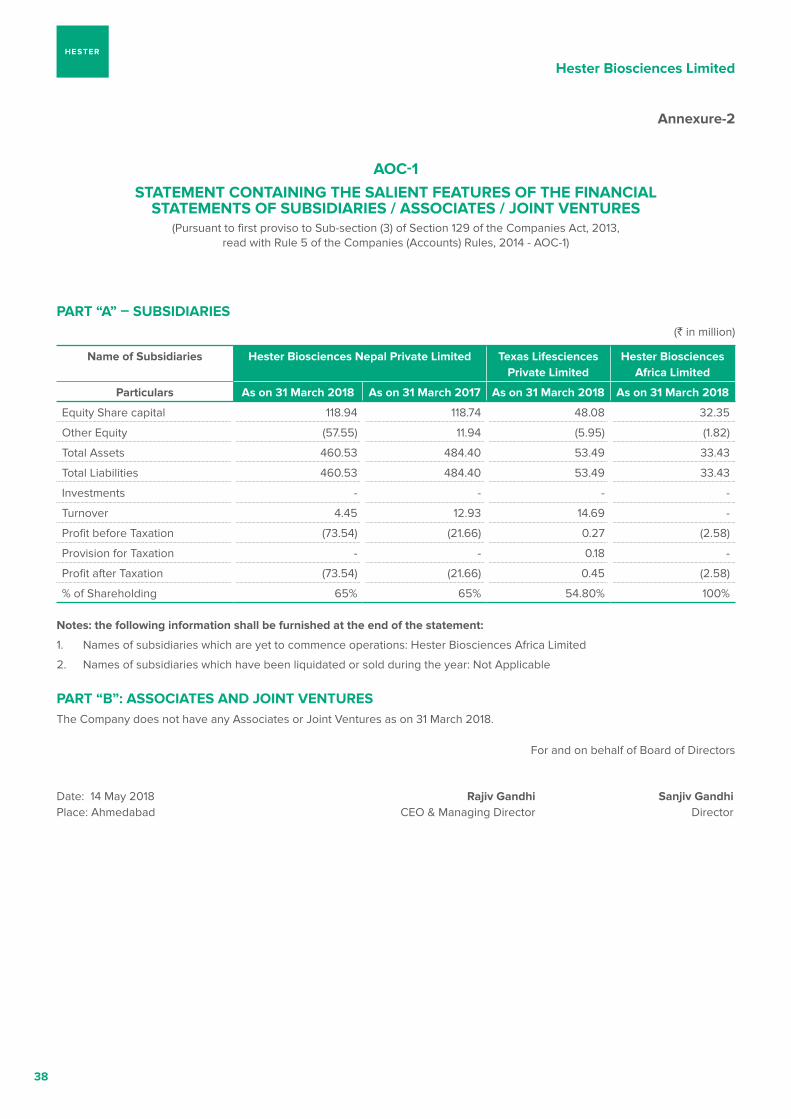
Annexure-2
AOC-1STATEMENT CONTAINING THE SALIENT FEATURES OF THE FINANCIAL
STATEMENTS OF SUBSIDIARIES / ASSOCIATES / JOINT VENTURES(Pursuant to first proviso to Sub-section (3) of Section 129 of the Companies Act, 2013,
read with Rule 5 of the Companies (Accounts) Rules, 2014 - AOC-1)
PART “A” – SUBSIDIARIES(` in million)
Name of Subsidiaries Hester Biosciences Nepal Private Limited Texas Lifesciences Private Limited
Hester Biosciences Africa Limited
Particulars As on 31 March 2018 As on 31 March 2017 As on 31 March 2018 As on 31 March 2018
Equity Share capital 118.94 118.74 48.08 32.35
Other Equity (57.55) 11.94 (5.95) (1.82)
Total Assets 460.53 484.40 53.49 33.43
Total Liabilities 460.53 484.40 53.49 33.43
Investments - - - -
Turnover 4.45 12.93 14.69 -
Profit before Taxation (73.54) (21.66) 0.27 (2.58)
Provision for Taxation - - 0.18 -
Profit after Taxation (73.54) (21.66) 0.45 (2.58)
% of Shareholding 65% 65% 54.80% 100%
Notes: the following information shall be furnished at the end of the statement:
1. Names of subsidiaries which are yet to commence operations: Hester Biosciences Africa Limited
2. Names of subsidiaries which have been liquidated or sold during the year: Not Applicable
PART “B”: ASSOCIATES AND JOINT VENTURES The Company does not have any Associates or Joint Ventures as on 31 March 2018.
For and on behalf of Board of Directors
Date: 14 May 2018 Rajiv Gandhi Sanjiv GandhiPlace: Ahmedabad CEO & Managing Director Director
Statutory reportsDirectors' Report
05
31st Annual Report 2017-18 39
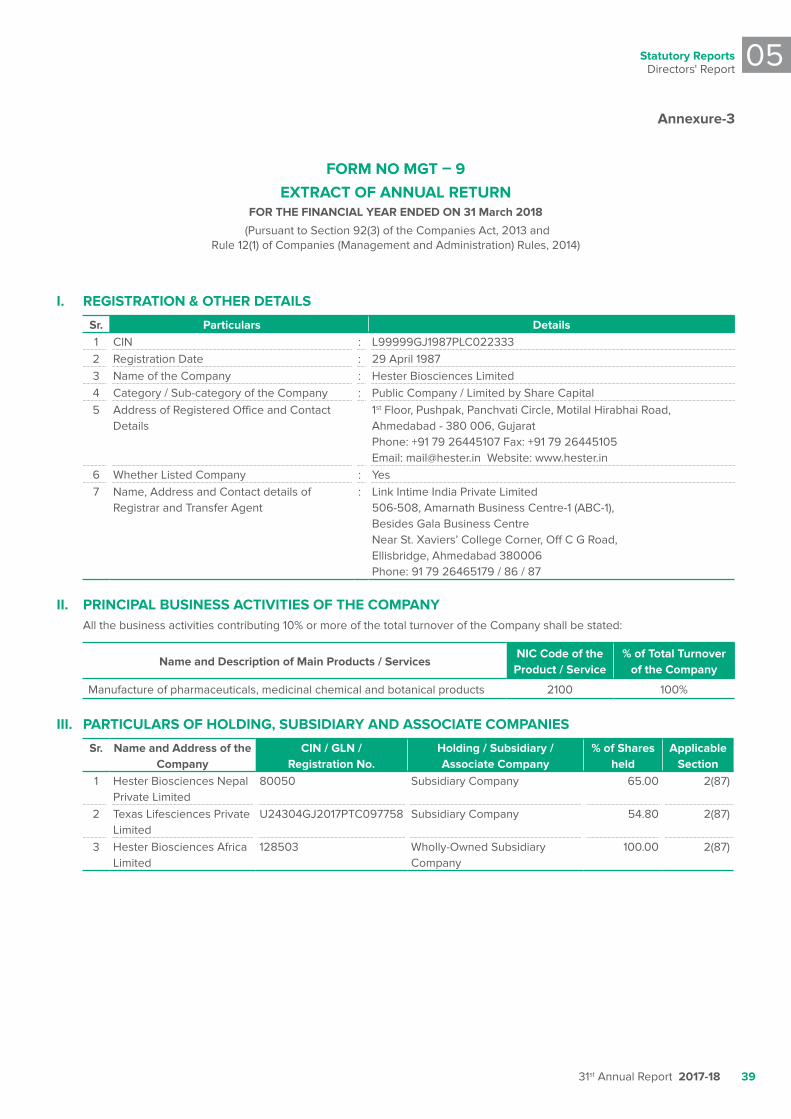
Annexure-3
FORM NO MGT – 9EXTRACT OF ANNUAL RETURN
FOR THE FINANCIAL YEAR ENDED ON 31 March 2018
(Pursuant to Section 92(3) of the Companies Act, 2013 and Rule 12(1) of Companies (Management and Administration) Rules, 2014)
I. REGISTRATION & OTHER DETAILS
Sr. Particulars Details1 CIN : L99999GJ1987PLC0223332 Registration Date : 29 April 19873 Name of the Company : Hester Biosciences Limited 4 Category / Sub-category of the Company : Public Company / Limited by Share Capital5 Address of Registered Office and Contact
Details1st Floor, Pushpak, Panchvati Circle, Motilal Hirabhai Road, Ahmedabad - 380 006, Gujarat Phone: +91 79 26445107 Fax: +91 79 26445105Email: [email protected] Website: www.hester.in
6 Whether Listed Company : Yes7 Name, Address and Contact details of
Registrar and Transfer Agent: Link Intime India Private Limited
506-508, Amarnath Business Centre-1 (ABC-1), Besides Gala Business Centre Near St. Xaviers’ College Corner, Off C G Road, Ellisbridge, Ahmedabad 380006Phone: 91 79 26465179 / 86 / 87
II. PRINCIPAL BUSINESS ACTIVITIES OF THE COMPANY All the business activities contributing 10% or more of the total turnover of the Company shall be stated:
Name and Description of Main Products / ServicesNIC Code of the Product / Service
% of Total Turnover of the Company
Manufacture of pharmaceuticals, medicinal chemical and botanical products 2100 100%
III. PARTICULARS OF HOLDING, SUBSIDIARY AND ASSOCIATE COMPANIES
Sr. Name and Address of the Company
CIN / GLN / Registration No.
Holding / Subsidiary / Associate Company
% of Shares held
Applicable Section
1 Hester Biosciences Nepal Private Limited
80050 Subsidiary Company 65.00 2(87)
2 Texas Lifesciences Private Limited
U24304GJ2017PTC097758 Subsidiary Company 54.80 2(87)
3 Hester Biosciences Africa Limited
128503 Wholly-Owned Subsidiary Company
100.00 2(87)
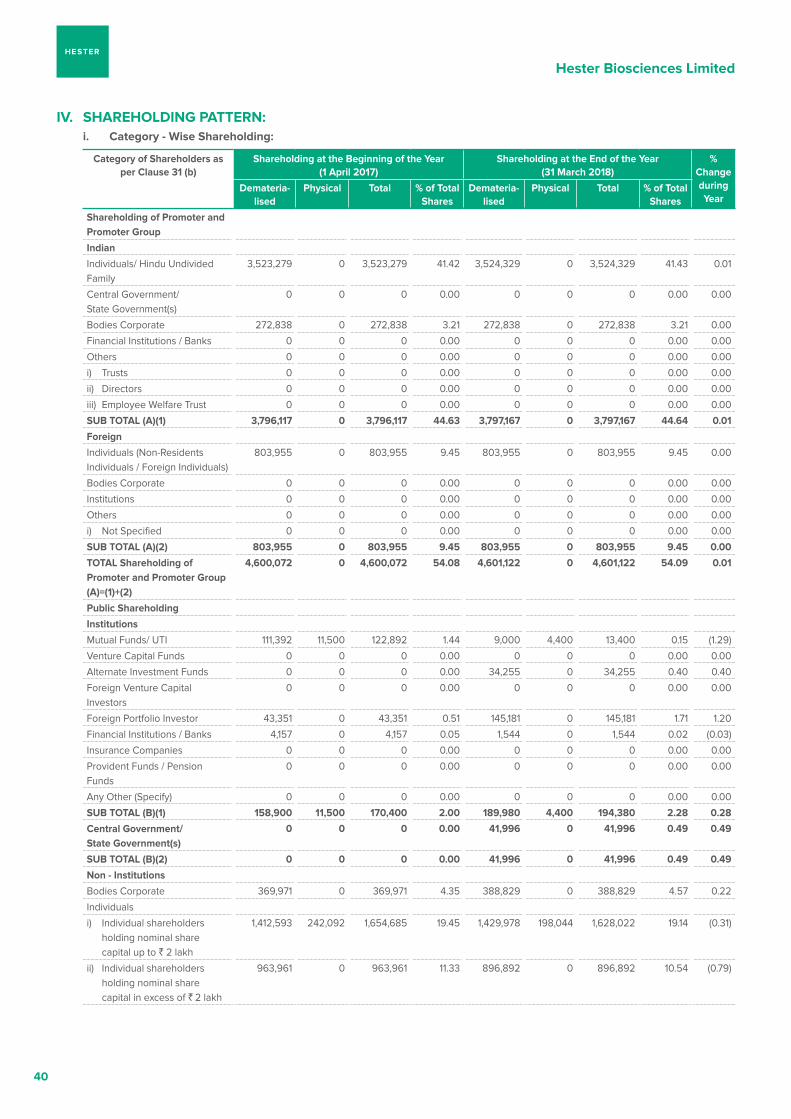
Hester Biosciences Limited
40
IV. SHAREHOLDING PATTERN: i. Category - Wise Shareholding:
Category of Shareholders as per Clause 31 (b)
Shareholding at the Beginning of the Year (1 April 2017)
Shareholding at the End of the Year (31 March 2018)
% Change during Year
Demateria-lised
Physical Total % of Total Shares
Demateria-lised
Physical Total % of Total Shares
Shareholding of Promoter and Promoter Group
Indian
Individuals/ Hindu Undivided Family
3,523,279 0 3,523,279 41.42 3,524,329 0 3,524,329 41.43 0.01
Central Government/ State Government(s)
0 0 0 0.00 0 0 0 0.00 0.00
Bodies Corporate 272,838 0 272,838 3.21 272,838 0 272,838 3.21 0.00
Financial Institutions / Banks 0 0 0 0.00 0 0 0 0.00 0.00
Others 0 0 0 0.00 0 0 0 0.00 0.00
i) Trusts 0 0 0 0.00 0 0 0 0.00 0.00
ii) Directors 0 0 0 0.00 0 0 0 0.00 0.00
iii) Employee Welfare Trust 0 0 0 0.00 0 0 0 0.00 0.00
SUB TOTAL (A)(1) 3,796,117 0 3,796,117 44.63 3,797,167 0 3,797,167 44.64 0.01
Foreign
Individuals (Non-Residents Individuals / Foreign Individuals)
803,955 0 803,955 9.45 803,955 0 803,955 9.45 0.00
Bodies Corporate 0 0 0 0.00 0 0 0 0.00 0.00
Institutions 0 0 0 0.00 0 0 0 0.00 0.00
Others 0 0 0 0.00 0 0 0 0.00 0.00
i) Not Specified 0 0 0 0.00 0 0 0 0.00 0.00
SUB TOTAL (A)(2) 803,955 0 803,955 9.45 803,955 0 803,955 9.45 0.00
TOTAL Shareholding of Promoter and Promoter Group (A)=(1)+(2)
4,600,072 0 4,600,072 54.08 4,601,122 0 4,601,122 54.09 0.01
Public Shareholding
Institutions
Mutual Funds/ UTI 111,392 11,500 122,892 1.44 9,000 4,400 13,400 0.15 (1.29)
Venture Capital Funds 0 0 0 0.00 0 0 0 0.00 0.00
Alternate Investment Funds 0 0 0 0.00 34,255 0 34,255 0.40 0.40
Foreign Venture Capital Investors
0 0 0 0.00 0 0 0 0.00 0.00
Foreign Portfolio Investor 43,351 0 43,351 0.51 145,181 0 145,181 1.71 1.20
Financial Institutions / Banks 4,157 0 4,157 0.05 1,544 0 1,544 0.02 (0.03)
Insurance Companies 0 0 0 0.00 0 0 0 0.00 0.00
Provident Funds / Pension Funds
0 0 0 0.00 0 0 0 0.00 0.00
Any Other (Specify) 0 0 0 0.00 0 0 0 0.00 0.00
SUB TOTAL (B)(1) 158,900 11,500 170,400 2.00 189,980 4,400 194,380 2.28 0.28
Central Government/ State Government(s)
0 0 0 0.00 41,996 0 41,996 0.49 0.49
SUB TOTAL (B)(2) 0 0 0 0.00 41,996 0 41,996 0.49 0.49
Non - Institutions
Bodies Corporate 369,971 0 369,971 4.35 388,829 0 388,829 4.57 0.22
Individuals
i) Individual shareholders holding nominal share capital up to ` 2 lakh
1,412,593 242,092 1,654,685 19.45 1,429,978 198,044 1,628,022 19.14 (0.31)
ii) Individual shareholders holding nominal share capital in excess of ` 2 lakh
963,961 0 963,961 11.33 896,892 0 896,892 10.54 (0.79)
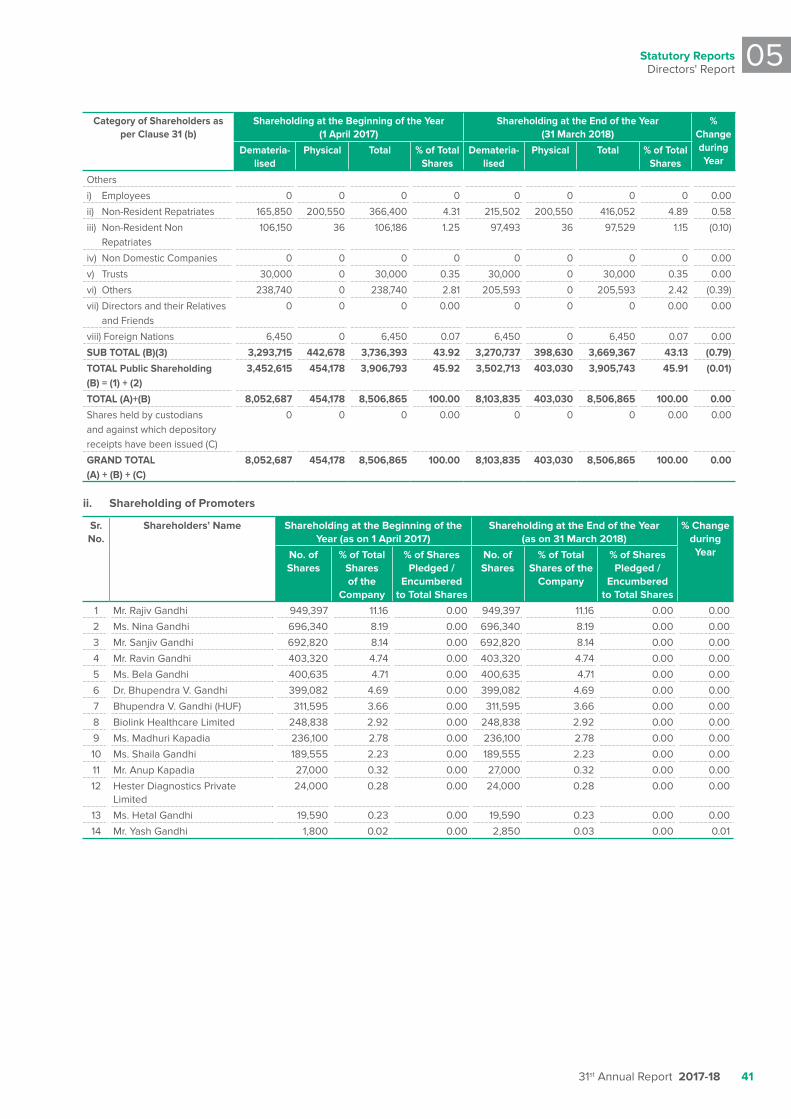
Statutory reportsDirectors' Report
05
31st Annual Report 2017-18 41
Category of Shareholders as per Clause 31 (b)
Shareholding at the Beginning of the Year (1 April 2017)
Shareholding at the End of the Year (31 March 2018)
% Change during Year
Demateria-lised
Physical Total % of Total Shares
Demateria-lised
Physical Total % of Total Shares
Others
i) Employees 0 0 0 0 0 0 0 0 0.00
ii) Non-Resident Repatriates 165,850 200,550 366,400 4.31 215,502 200,550 416,052 4.89 0.58
iii) Non-Resident Non Repatriates
106,150 36 106,186 1.25 97,493 36 97,529 1.15 (0.10)
iv) Non Domestic Companies 0 0 0 0 0 0 0 0 0.00
v) Trusts 30,000 0 30,000 0.35 30,000 0 30,000 0.35 0.00
vi) Others 238,740 0 238,740 2.81 205,593 0 205,593 2.42 (0.39)
vii) Directors and their Relatives and Friends
0 0 0 0.00 0 0 0 0.00 0.00
viii) Foreign Nations 6,450 0 6,450 0.07 6,450 0 6,450 0.07 0.00
SUB TOTAL (B)(3) 3,293,715 442,678 3,736,393 43.92 3,270,737 398,630 3,669,367 43.13 (0.79)
TOTAL Public Shareholding (B) = (1) + (2)
3,452,615 454,178 3,906,793 45.92 3,502,713 403,030 3,905,743 45.91 (0.01)
TOTAL (A)+(B) 8,052,687 454,178 8,506,865 100.00 8,103,835 403,030 8,506,865 100.00 0.00
Shares held by custodians and against which depository receipts have been issued (C)
0 0 0 0.00 0 0 0 0.00 0.00
GRAND TOTAL (A) + (B) + (C)
8,052,687 454,178 8,506,865 100.00 8,103,835 403,030 8,506,865 100.00 0.00
ii. Shareholding of Promoters
Sr. No.
Shareholders’ Name Shareholding at the Beginning of the Year (as on 1 April 2017)
Shareholding at the End of the Year (as on 31 March 2018)
% Change during YearNo. of
Shares% of Total
Shares of the
Company
% of Shares Pledged /
Encumbered to Total Shares
No. of Shares
% of Total Shares of the
Company
% of Shares Pledged /
Encumbered to Total Shares
1 Mr. Rajiv Gandhi 949,397 11.16 0.00 949,397 11.16 0.00 0.00
2 Ms. Nina Gandhi 696,340 8.19 0.00 696,340 8.19 0.00 0.00
3 Mr. Sanjiv Gandhi 692,820 8.14 0.00 692,820 8.14 0.00 0.00
4 Mr. Ravin Gandhi 403,320 4.74 0.00 403,320 4.74 0.00 0.00
5 Ms. Bela Gandhi 400,635 4.71 0.00 400,635 4.71 0.00 0.00
6 Dr. Bhupendra V. Gandhi 399,082 4.69 0.00 399,082 4.69 0.00 0.00
7 Bhupendra V. Gandhi (HUF) 311,595 3.66 0.00 311,595 3.66 0.00 0.00
8 Biolink Healthcare Limited 248,838 2.92 0.00 248,838 2.92 0.00 0.00
9 Ms. Madhuri Kapadia 236,100 2.78 0.00 236,100 2.78 0.00 0.00
10 Ms. Shaila Gandhi 189,555 2.23 0.00 189,555 2.23 0.00 0.00
11 Mr. Anup Kapadia 27,000 0.32 0.00 27,000 0.32 0.00 0.00
12 Hester Diagnostics Private Limited
24,000 0.28 0.00 24,000 0.28 0.00 0.00
13 Ms. Hetal Gandhi 19,590 0.23 0.00 19,590 0.23 0.00 0.00
14 Mr. Yash Gandhi 1,800 0.02 0.00 2,850 0.03 0.00 0.01
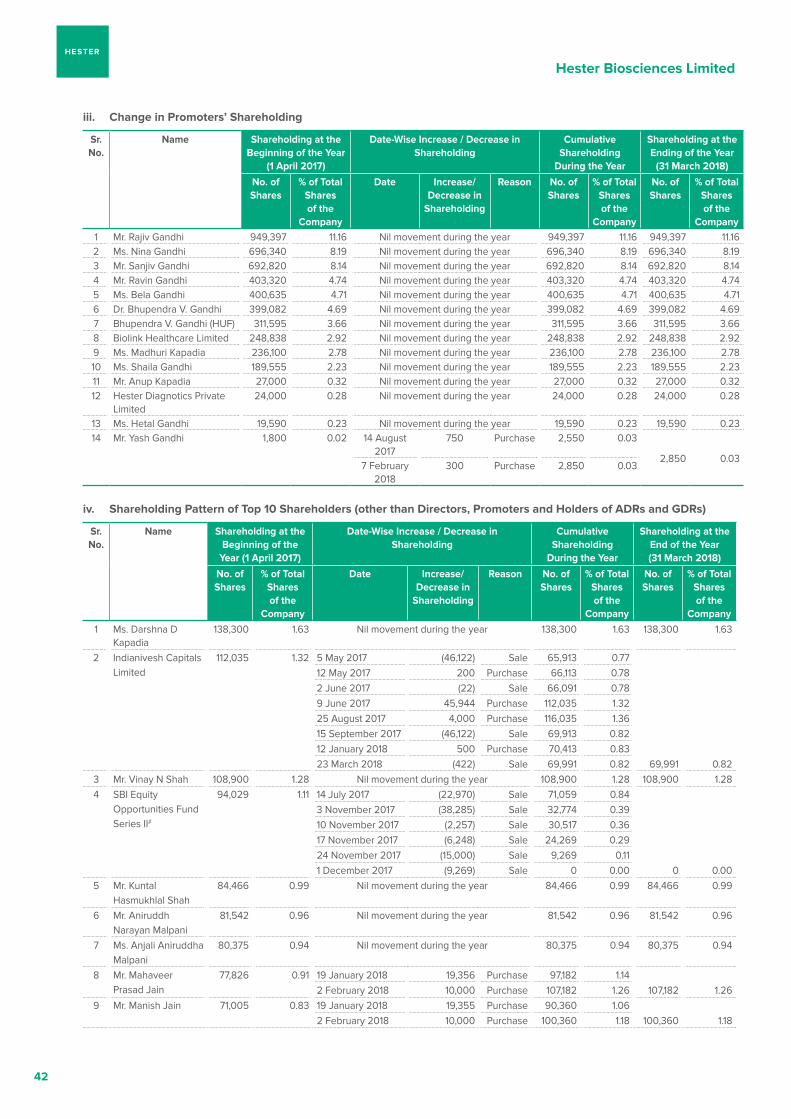
Hester Biosciences Limited
42
iii. Change in Promoters’ Shareholding
Sr. No.
Name Shareholding at the Beginning of the Year
(1 April 2017)
Date-Wise Increase / Decrease in Shareholding
Cumulative Shareholding
During the Year
Shareholding at the Ending of the Year
(31 March 2018)
No. of Shares
% of Total Shares of the
Company
Date Increase/ Decrease in
Shareholding
Reason No. of Shares
% of Total Shares of the
Company
No. of Shares
% of Total Shares of the
Company1 Mr. Rajiv Gandhi 949,397 11.16 Nil movement during the year 949,397 11.16 949,397 11.162 Ms. Nina Gandhi 696,340 8.19 Nil movement during the year 696,340 8.19 696,340 8.193 Mr. Sanjiv Gandhi 692,820 8.14 Nil movement during the year 692,820 8.14 692,820 8.144 Mr. Ravin Gandhi 403,320 4.74 Nil movement during the year 403,320 4.74 403,320 4.745 Ms. Bela Gandhi 400,635 4.71 Nil movement during the year 400,635 4.71 400,635 4.716 Dr. Bhupendra V. Gandhi 399,082 4.69 Nil movement during the year 399,082 4.69 399,082 4.697 Bhupendra V. Gandhi (HUF) 311,595 3.66 Nil movement during the year 311,595 3.66 311,595 3.668 Biolink Healthcare Limited 248,838 2.92 Nil movement during the year 248,838 2.92 248,838 2.929 Ms. Madhuri Kapadia 236,100 2.78 Nil movement during the year 236,100 2.78 236,100 2.7810 Ms. Shaila Gandhi 189,555 2.23 Nil movement during the year 189,555 2.23 189,555 2.2311 Mr. Anup Kapadia 27,000 0.32 Nil movement during the year 27,000 0.32 27,000 0.3212 Hester Diagnotics Private
Limited24,000 0.28 Nil movement during the year 24,000 0.28 24,000 0.28
13 Ms. Hetal Gandhi 19,590 0.23 Nil movement during the year 19,590 0.23 19,590 0.2314 Mr. Yash Gandhi 1,800 0.02 14 August
2017750 Purchase 2,550 0.03
2,850 0.037 February
2018300 Purchase 2,850 0.03
iv. Shareholding Pattern of Top 10 Shareholders (other than Directors, Promoters and Holders of ADRs and GDRs)
Sr. No.
Name Shareholding at the Beginning of the
Year (1 April 2017)
Date-Wise Increase / Decrease in Shareholding
Cumulative Shareholding
During the Year
Shareholding at the End of the Year (31 March 2018)
No. of Shares
% of Total Shares of the
Company
Date Increase/ Decrease in
Shareholding
Reason No. of Shares
% of Total Shares of the
Company
No. of Shares
% of Total Shares of the
Company1 Ms. Darshna D
Kapadia138,300 1.63 Nil movement during the year 138,300 1.63 138,300 1.63
2 Indianivesh Capitals Limited
112,035 1.32 5 May 2017 (46,122) Sale 65,913 0.7712 May 2017 200 Purchase 66,113 0.782 June 2017 (22) Sale 66,091 0.789 June 2017 45,944 Purchase 112,035 1.3225 August 2017 4,000 Purchase 116,035 1.3615 September 2017 (46,122) Sale 69,913 0.8212 January 2018 500 Purchase 70,413 0.8323 March 2018 (422) Sale 69,991 0.82 69,991 0.82
3 Mr. Vinay N Shah 108,900 1.28 Nil movement during the year 108,900 1.28 108,900 1.284 SBI Equity
Opportunities Fund Series II#
94,029 1.11 14 July 2017 (22,970) Sale 71,059 0.843 November 2017 (38,285) Sale 32,774 0.3910 November 2017 (2,257) Sale 30,517 0.3617 November 2017 (6,248) Sale 24,269 0.2924 November 2017 (15,000) Sale 9,269 0.111 December 2017 (9,269) Sale 0 0.00 0 0.00
5 Mr. Kuntal Hasmukhlal Shah
84,466 0.99 Nil movement during the year 84,466 0.99 84,466 0.99
6 Mr. Aniruddh Narayan Malpani
81,542 0.96 Nil movement during the year 81,542 0.96 81,542 0.96
7 Ms. Anjali Aniruddha Malpani
80,375 0.94 Nil movement during the year 80,375 0.94 80,375 0.94
8 Mr. Mahaveer Prasad Jain
77,826 0.91 19 January 2018 19,356 Purchase 97,182 1.142 February 2018 10,000 Purchase 107,182 1.26 107,182 1.26
9 Mr. Manish Jain 71,005 0.83 19 January 2018 19,355 Purchase 90,360 1.062 February 2018 10,000 Purchase 100,360 1.18 100,360 1.18
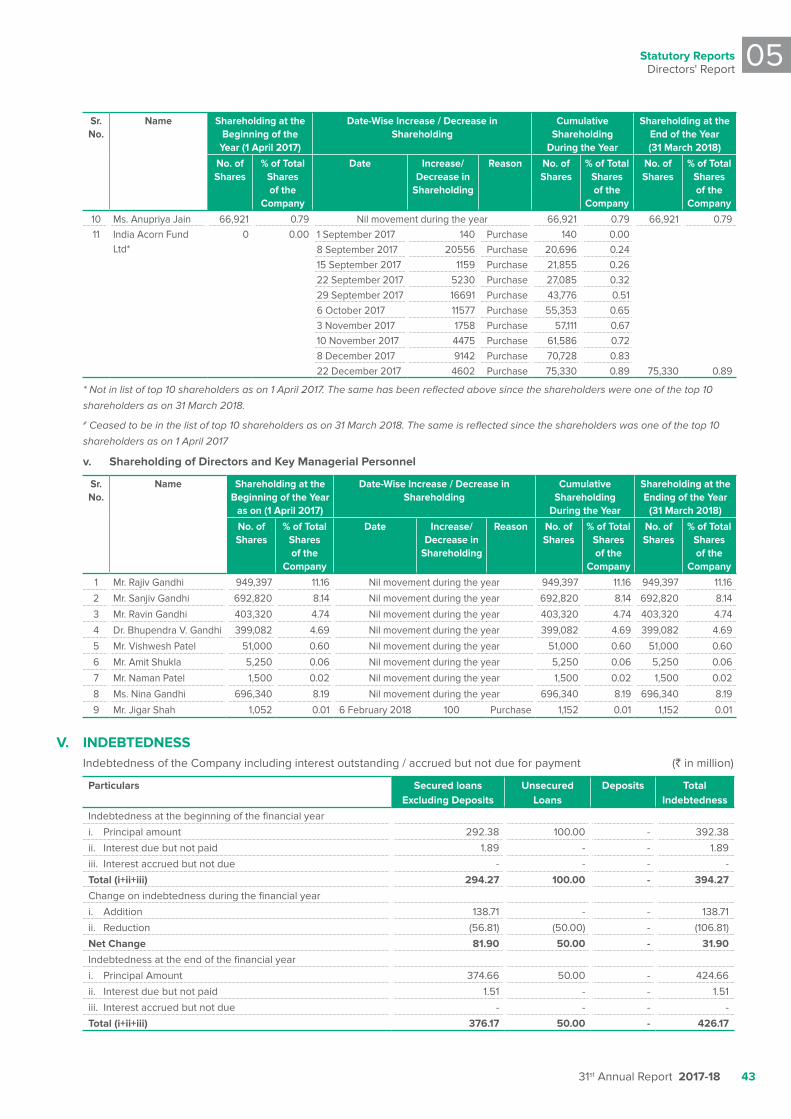
Statutory reportsDirectors' Report
05
31st Annual Report 2017-18 43
v. Shareholding of Directors and Key Managerial Personnel
Sr. No.
Name Shareholding at the Beginning of the Year
as on (1 April 2017)
Date-Wise Increase / Decrease in Shareholding
Cumulative Shareholding
During the Year
Shareholding at the Ending of the Year
(31 March 2018)
No. of Shares
% of Total Shares of the
Company
Date Increase/ Decrease in
Shareholding
Reason No. of Shares
% of Total Shares of the
Company
No. of Shares
% of Total Shares of the
Company
1 Mr. Rajiv Gandhi 949,397 11.16 Nil movement during the year 949,397 11.16 949,397 11.16
2 Mr. Sanjiv Gandhi 692,820 8.14 Nil movement during the year 692,820 8.14 692,820 8.14
3 Mr. Ravin Gandhi 403,320 4.74 Nil movement during the year 403,320 4.74 403,320 4.74
4 Dr. Bhupendra V. Gandhi 399,082 4.69 Nil movement during the year 399,082 4.69 399,082 4.69
5 Mr. Vishwesh Patel 51,000 0.60 Nil movement during the year 51,000 0.60 51,000 0.60
6 Mr. Amit Shukla 5,250 0.06 Nil movement during the year 5,250 0.06 5,250 0.06
7 Mr. Naman Patel 1,500 0.02 Nil movement during the year 1,500 0.02 1,500 0.02
8 Ms. Nina Gandhi 696,340 8.19 Nil movement during the year 696,340 8.19 696,340 8.19
9 Mr. Jigar Shah 1,052 0.01 6 February 2018 100 Purchase 1,152 0.01 1,152 0.01
V. INDEBTEDNESS Indebtedness of the Company including interest outstanding / accrued but not due for payment (` in million)
Particulars Secured loans Excluding Deposits
Unsecured Loans
Deposits Total Indebtedness
Indebtedness at the beginning of the financial year
i. Principal amount 292.38 100.00 - 392.38
ii. Interest due but not paid 1.89 - - 1.89
iii. Interest accrued but not due - - - -
Total (i+ii+iii) 294.27 100.00 - 394.27
Change on indebtedness during the financial year
i. Addition 138.71 - - 138.71
ii. Reduction (56.81) (50.00) - (106.81)
Net Change 81.90 50.00 - 31.90
Indebtedness at the end of the financial year
i. Principal Amount 374.66 50.00 - 424.66
ii. Interest due but not paid 1.51 - - 1.51
iii. Interest accrued but not due - - - -
Total (i+ii+iii) 376.17 50.00 - 426.17
Sr. No.
Name Shareholding at the Beginning of the
Year (1 April 2017)
Date-Wise Increase / Decrease in Shareholding
Cumulative Shareholding
During the Year
Shareholding at the End of the Year (31 March 2018)
No. of Shares
% of Total Shares of the
Company
Date Increase/ Decrease in
Shareholding
Reason No. of Shares
% of Total Shares of the
Company
No. of Shares
% of Total Shares of the
Company10 Ms. Anupriya Jain 66,921 0.79 Nil movement during the year 66,921 0.79 66,921 0.7911 India Acorn Fund
Ltd*0 0.00 1 September 2017 140 Purchase 140 0.00
8 September 2017 20556 Purchase 20,696 0.2415 September 2017 1159 Purchase 21,855 0.2622 September 2017 5230 Purchase 27,085 0.3229 September 2017 16691 Purchase 43,776 0.516 October 2017 11577 Purchase 55,353 0.653 November 2017 1758 Purchase 57,111 0.6710 November 2017 4475 Purchase 61,586 0.728 December 2017 9142 Purchase 70,728 0.8322 December 2017 4602 Purchase 75,330 0.89 75,330 0.89
* Not in list of top 10 shareholders as on 1 April 2017. The same has been reflected above since the shareholders were one of the top 10
shareholders as on 31 March 2018.
# Ceased to be in the list of top 10 shareholders as on 31 March 2018. The same is reflected since the shareholders was one of the top 10
shareholders as on 1 April 2017
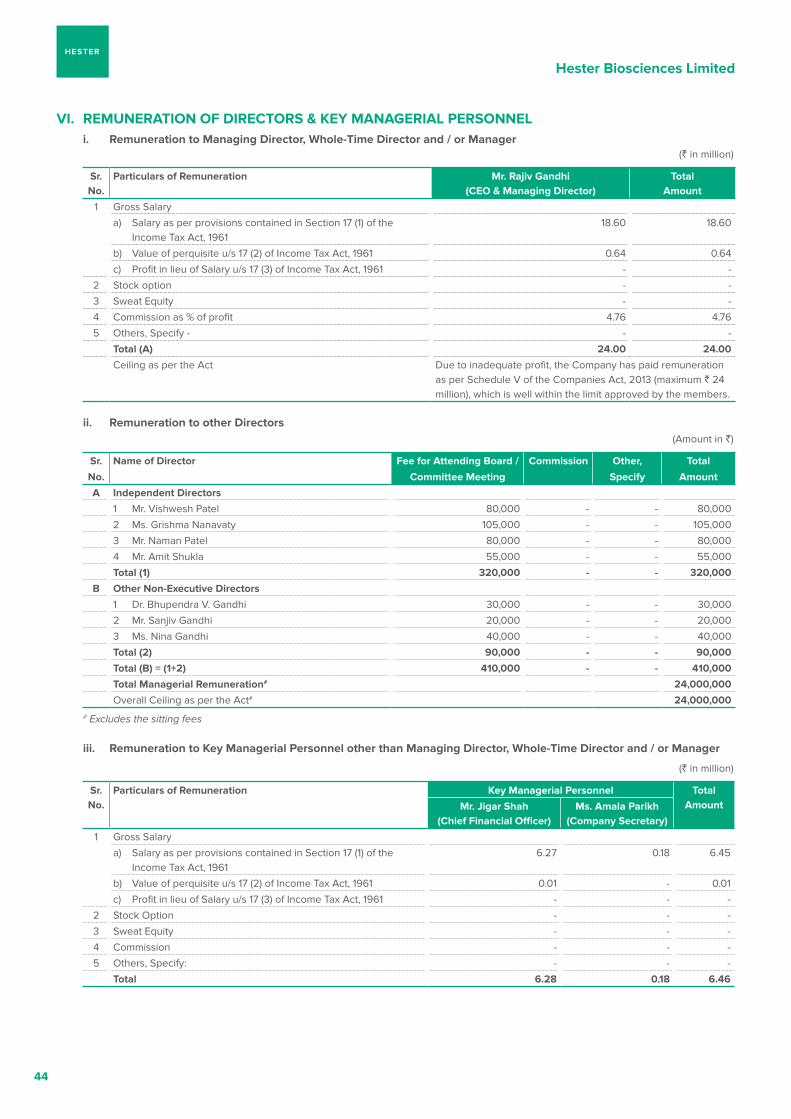
Hester Biosciences Limited
44
VI. REMUNERATION OF DIRECTORS & KEY MANAGERIAL PERSONNEL i. Remuneration to Managing Director, Whole-Time Director and / or Manager (` in million)
Sr. No.
Particulars of Remuneration Mr. Rajiv Gandhi (CEO & Managing Director)
Total Amount
1 Gross Salary
a) Salary as per provisions contained in Section 17 (1) of the Income Tax Act, 1961
18.60 18.60
b) Value of perquisite u/s 17 (2) of Income Tax Act, 1961 0.64 0.64
c) Profit in lieu of Salary u/s 17 (3) of Income Tax Act, 1961 - -
2 Stock option - -
3 Sweat Equity - -
4 Commission as % of profit 4.76 4.76
5 Others, Specify - - -
Total (A) 24.00 24.00
Ceiling as per the Act Due to inadequate profit, the Company has paid remuneration as per Schedule V of the Companies Act, 2013 (maximum ` 24 million), which is well within the limit approved by the members.
ii. Remuneration to other Directors (Amount in `)
Sr.
No.
Name of Director Fee for Attending Board /
Committee Meeting
Commission Other,
Specify
Total
Amount
A Independent Directors
1 Mr. Vishwesh Patel 80,000 - - 80,000
2 Ms. Grishma Nanavaty 105,000 - - 105,000
3 Mr. Naman Patel 80,000 - - 80,000
4 Mr. Amit Shukla 55,000 - - 55,000
Total (1) 320,000 - - 320,000
B Other Non-Executive Directors
1 Dr. Bhupendra V. Gandhi 30,000 - - 30,000
2 Mr. Sanjiv Gandhi 20,000 - - 20,000
3 Ms. Nina Gandhi 40,000 - - 40,000
Total (2) 90,000 - - 90,000
Total (B) = (1+2) 410,000 - - 410,000
Total Managerial Remuneration# 24,000,000
Overall Ceiling as per the Act# 24,000,000# Excludes the sitting fees
iii. Remuneration to Key Managerial Personnel other than Managing Director, Whole-Time Director and / or Manager
(` in million)
Sr. No.
Particulars of Remuneration Key Managerial Personnel Total AmountMr. Jigar Shah
(Chief Financial Officer)Ms. Amala Parikh
(Company Secretary)
1 Gross Salary
a) Salary as per provisions contained in Section 17 (1) of the Income Tax Act, 1961
6.27 0.18 6.45
b) Value of perquisite u/s 17 (2) of Income Tax Act, 1961 0.01 - 0.01
c) Profit in lieu of Salary u/s 17 (3) of Income Tax Act, 1961 - - -
2 Stock Option - - -
3 Sweat Equity - - -
4 Commission - - -
5 Others, Specify: - - -
Total 6.28 0.18 6.46
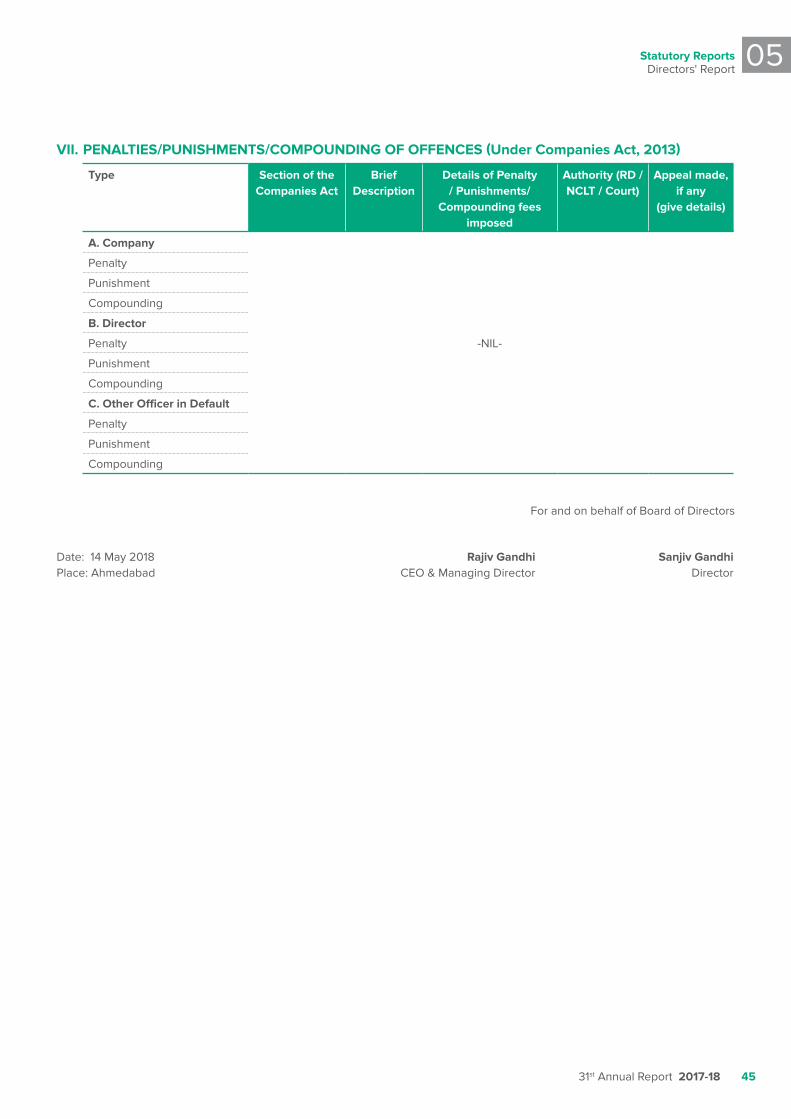
Statutory reportsDirectors' Report
05
31st Annual Report 2017-18 45
VII. PENALTIES/PUNISHMENTS/COMPOUNDING OF OFFENCES (Under Companies Act, 2013)
Type Section of the Companies Act
Brief Description
Details of Penalty / Punishments/
Compounding fees imposed
Authority (RD / NCLT / Court)
Appeal made, if any
(give details)
A. Company
Penalty
Punishment
Compounding
B. Director
Penalty -NIL-
Punishment
Compounding
C. Other Officer in Default
Penalty
Punishment
Compounding
For and on behalf of Board of Directors
Date: 14 May 2018 Rajiv Gandhi Sanjiv GandhiPlace: Ahmedabad CEO & Managing Director Director
Hester Biosciences Limited
46
Annexure-4
PARTICULARS OF ENERGY CONSERVATION, TECHNOLOGY ABSORPTION & FOREIGN EXCHANGE EARNINGS & OUTGO REQUIRED UNDER
THE COMPANIES (ACCOUNTS) RULES, 2014
A. CONSERVATION OF ENERGY i) The Steps Taken or Impact on Conservation of Energy:
1) Rain Water Harvesting
Target: Rain water harvesting at site
Action: One recharge well work is completed and have applied for CGWA permission. Once the permission arrives, will do more five wells to complete site requirement of rain water harvesting. Target date 1 April 2019.
2) New Reject Water Sump
Target: Per day approximately 30,000 liter of reject water is going to ETP. Once Egg Harvest facility will be functional, ETP load will be further increased by 30,000 liters. To reduce load of ETP, Reject Water Sump is proposed and under construction.
Action: New 2 lakh liter sump is now functional. Reject water storage and distribution started for gardening.
Initiatives in the Pipelines
3) Rain Water Harvesting
Target: Five more rain water recharge wells will be constructed
4) New Boiler
Target: To replace the existing two Non-IBR boilers of capacity 1,250 kg/hour with new one IBR boiler of 3,000 kg/ hour capacity. The benefits are:
a) Quality of plant steam will improve
b) Water and fuel power consumption will be reduced
ii) The steps taken by the Company for utilising alternate sources of energy: There were no steps taken by the Company for utilising alternate sources of energy.
iii) The capital investment on energy conservation equipment: NIL
B. TECHNOLOGY ABSORPTION i. The effort made towards technology absorption;
There were no new technologies acquired by the company, besides the on-going in-house R&D work. The Company has a focus to develop in-house technologies and reduce the dependency on outside acquired technologies.
ii. The benefit derived like product improvement, cost reduction, product development or import substitution;
Process improvement is an on-going activity in the company. It has been well reflected in the financials by way of improved operating margins. The endeavour is to keep the efforts on to further reduce the operating margins.
iii. In case of imported technology (imported during the last three years reckoned from the beginning of the financial year);
We have not acquired any technology from international sources during the year.
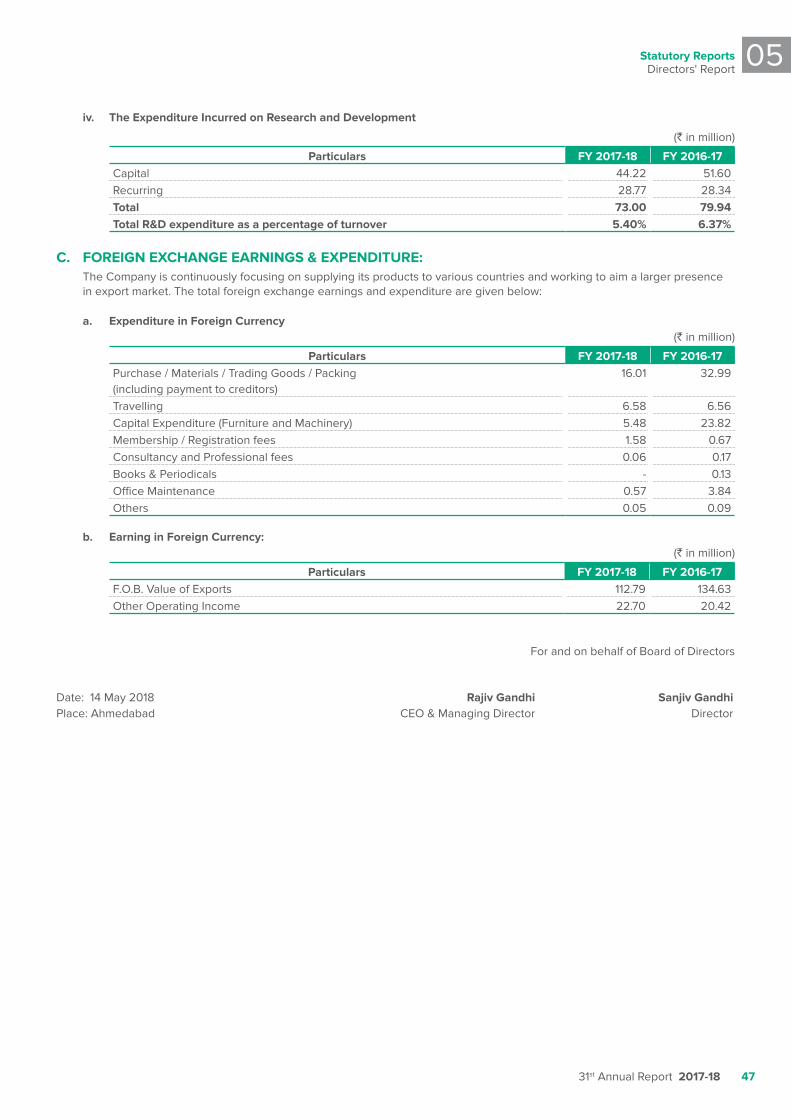
Statutory reportsDirectors' Report
05
31st Annual Report 2017-18 47
iv. The Expenditure Incurred on Research and Development
(` in million)
Particulars FY 2017-18 FY 2016-17Capital 44.22 51.60Recurring 28.77 28.34Total 73.00 79.94Total R&D expenditure as a percentage of turnover 5.40% 6.37%
C. FOREIGN EXCHANGE EARNINGS & EXPENDITURE: The Company is continuously focusing on supplying its products to various countries and working to aim a larger presence
in export market. The total foreign exchange earnings and expenditure are given below:
a. Expenditure in Foreign Currency(` in million)
Particulars FY 2017-18 FY 2016-17Purchase / Materials / Trading Goods / Packing (including payment to creditors)
16.01 32.99
Travelling 6.58 6.56Capital Expenditure (Furniture and Machinery) 5.48 23.82Membership / Registration fees 1.58 0.67Consultancy and Professional fees 0.06 0.17Books & Periodicals - 0.13Office Maintenance 0.57 3.84Others 0.05 0.09
b. Earning in Foreign Currency: (` in million)
Particulars FY 2017-18 FY 2016-17F.O.B. Value of Exports 112.79 134.63Other Operating Income 22.70 20.42
For and on behalf of Board of Directors
Date: 14 May 2018 Rajiv Gandhi Sanjiv GandhiPlace: Ahmedabad CEO & Managing Director Director
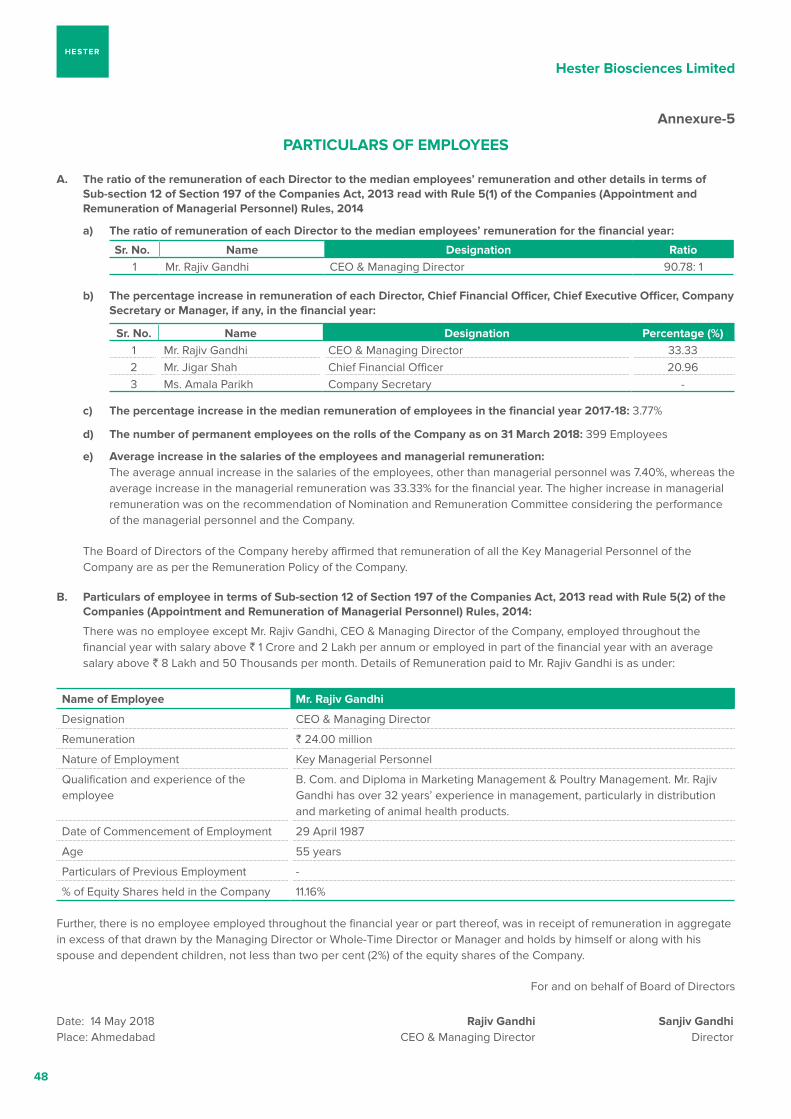
Hester Biosciences Limited
48
Annexure-5
PARTICULARS OF EMPLOYEES
A. The ratio of the remuneration of each Director to the median employees’ remuneration and other details in terms of Sub-section 12 of Section 197 of the Companies Act, 2013 read with Rule 5(1) of the Companies (Appointment and Remuneration of Managerial Personnel) Rules, 2014
a) The ratio of remuneration of each Director to the median employees’ remuneration for the financial year:
Sr. No. Name Designation Ratio1 Mr. Rajiv Gandhi CEO & Managing Director 90.78: 1
b) The percentage increase in remuneration of each Director, Chief Financial Officer, Chief Executive Officer, Company Secretary or Manager, if any, in the financial year:
Sr. No. Name Designation Percentage (%)1 Mr. Rajiv Gandhi CEO & Managing Director 33.332 Mr. Jigar Shah Chief Financial Officer 20.963 Ms. Amala Parikh Company Secretary -
c) The percentage increase in the median remuneration of employees in the financial year 2017-18: 3.77%
d) The number of permanent employees on the rolls of the Company as on 31 March 2018: 399 Employees
e) Average increase in the salaries of the employees and managerial remuneration: The average annual increase in the salaries of the employees, other than managerial personnel was 7.40%, whereas the
average increase in the managerial remuneration was 33.33% for the financial year. The higher increase in managerial remuneration was on the recommendation of Nomination and Remuneration Committee considering the performance of the managerial personnel and the Company.
The Board of Directors of the Company hereby affirmed that remuneration of all the Key Managerial Personnel of the Company are as per the Remuneration Policy of the Company.
B. Particulars of employee in terms of Sub-section 12 of Section 197 of the Companies Act, 2013 read with Rule 5(2) of the Companies (Appointment and Remuneration of Managerial Personnel) Rules, 2014:
There was no employee except Mr. Rajiv Gandhi, CEO & Managing Director of the Company, employed throughout the financial year with salary above ` 1 Crore and 2 Lakh per annum or employed in part of the financial year with an average salary above ` 8 Lakh and 50 Thousands per month. Details of Remuneration paid to Mr. Rajiv Gandhi is as under:
Name of Employee Mr. Rajiv Gandhi
Designation CEO & Managing Director
Remuneration ` 24.00 million
Nature of Employment Key Managerial Personnel
Qualification and experience of the employee
B. Com. and Diploma in Marketing Management & Poultry Management. Mr. Rajiv Gandhi has over 32 years’ experience in management, particularly in distribution and marketing of animal health products.
Date of Commencement of Employment 29 April 1987
Age 55 years
Particulars of Previous Employment -
% of Equity Shares held in the Company 11.16%
Further, there is no employee employed throughout the financial year or part thereof, was in receipt of remuneration in aggregate in excess of that drawn by the Managing Director or Whole-Time Director or Manager and holds by himself or along with his spouse and dependent children, not less than two per cent (2%) of the equity shares of the Company.
For and on behalf of Board of Directors
Date: 14 May 2018 Rajiv Gandhi Sanjiv GandhiPlace: Ahmedabad CEO & Managing Director Director
Statutory reportsDirectors' Report
05
31st Annual Report 2017-18 49
Annexure-6
SECRETARIAL AUDIT REPORT For the financial year ended 31 March 2018
[Pursuant to section 204(1) of the Companies Act, 2013 and Rule No.9 of theCompanies (Appointment and Remuneration of Managerial Personnel) Rules, 2014]
To, The Members, HESTER BIOSCIENCES LIMITED1st Floor, Pushpak, Panchvati Circle, Motilal Hirabhai Road,Ahmedabad - 380 006
I have conducted the Secretarial Audit of the compliance of applicable statutory provisions and the adherence to good corporate practices by Hester Biosciences Limited (hereinafter called ‘the Company’). Secretarial Audit was conducted in a manner that provided me a reasonable basis for evaluating the corporate conducts/statutory compliances and expressing my opinion thereon.
Based on my verification of the Companys’ books, papers, minute books, forms and returns filed and other records maintained by the Company and also the information provided by the Company, its officers, agents and authorised representatives during the conduct of Secretarial Audit, I hereby report that in my opinion, the Company has, during the audit period covering the financial year ended on 31 March 2018 generally complied with the statutory provisions listed hereunder and also that the Company has proper Board-processes and compliance-mechanism in place to the extent, in the manner and subject to the reporting made hereinafter:
I have examined the books, papers, minute books, forms and returns filed and other records maintained by the Company for the financial year ended on 31 March 2018 and made available to me, according to the provisions of:
1) The Companies Act, 2013 (‘the Act’) and the rules made there under as applicable;
2) The Securities Contracts (Regulation) Act, 1956 (‘SCRA’) and the rules made thereunder;
3) The Depositories Act, 1996 and the Regulations and Bye-laws framed there under;
4) Foreign Exchange Management Act, 1999 and the rules and regulations made thereunder to the extent of Foreign Direct Investment and Overseas Direct Investment;
5) The following Regulations and Guidelines prescribed under the Securities and Exchange Board of India Act, 1992 (‘SEBI Act’):
a) The Securities and Exchange Board of India (Substantial Acquisition of Shares and Takeovers) Regulations, 2011, as amended from time to time;
b) The Securities and Exchange Board of India (Prohibition of Insider Trading) Regulations, 2015, as amended from time to time;
c) The Securities and Exchange Board of India (Registrars to an Issue and Share Transfer Agents) Regulations, 1993 regarding the Companies Act and dealing with client;
6) Secretarial Standards issued by the Institute of Company Secretaries of India (SS – 1 and SS – 2)
I have also examined compliance with the applicable Regulations of the Securities and Exchange Board of India (Listing Obligations and Disclosure Requirements) Regulations, 2015, pursuant to the Listing Agreement of the said Company with stock exchanges.
Further being a Pharmaceutical Company, following are some of the Acts applicable to the Company, for which examination of the relevant documents and records, on test check basis, have been carried out under:
1) Pharmacy Act, 1948
2) Drugs and Cosmetics Act, 1940 & Amendment 2008 and its Rules
3) Biological Diversity Act, 2002 & its Rules
4) The Drugs and Magic Remedies (Objectionable Advertisement) Act, 1954 and its Rules
5) The Drugs (Prices Control) Order, 1995 (under the Essential Commodities Act)
6) Drug Policy, 2002
7) Gujarat Drugs (Control) Act, 1959
8) The Indian Copyright Act, 1957
9) The Trade Marks Act, 1999
During the period under review the Company has generally complied with the all material aspects of applicable provisions of the Acts, Rules, Regulations, Guidelines, Standards, etc.
Hester Biosciences Limited
50
mentioned above. However, the Company has spent less than the prescribed threshold limit of two per cent of its average net profits for the last three financial years (as calculated in accordance with the Companies Act, 2013) towards Corporate Social Responsibility.
During the Period under review, provisions of the following Acts, Rules, Regulations, Guidelines, etc. were not applicable to the Company:
i. The Securities and Exchange Board of India (Employee Stock Option Scheme and Employee Stock Purchase Scheme) Guidelines, 1999 and the Securities and Exchange Board of India (Share based employee benefits) Regulations, 2014;
ii. The Securities and Exchange Board of India (Delisting of Equity Shares) Regulations, 2009;
iii. The Securities and Exchange Board of India (Issue and Listing of Debt Securities) Regulations, 2008;
iv. The Securities and Exchange Board of India (Issue of Capital and Disclosure Requirements) Regulations, 2009;
v. The Securities and Exchange Board of India (Buyback of Securities) Regulations, 1998; and
vi. Foreign Exchange Management Act, 1999 and the rules and regulations made there under to the extent of External Commercial Borrowings.
I further report that,
The Compliance by the Company of applicable financial laws, like direct and indirect tax laws, has not been reviewed in this Audit since the same have been subject to review by statutory financial auditor and other designated professionals.
I further report that,
Based on the information provided by the Company, its officers and authorised representatives during the conduct of the audit, in my opinion, adequate systems and processes and
control mechanism exist in the Company commensurate with the size and operations of the Company to monitor and ensure compliance with applicable laws, rules, regulations, standards and guidelines and general laws like various labour laws, competition law, environmental laws, etc.
I further report that,
The Board of Directors of the Company is duly constituted with proper balance of Executive Directors, Non-Executive Directors and Independent Directors. There was no change in the composition of the Board of Directors that took place during the period under review.
Adequate notice is given to all Directors to schedule the Board Meetings, agenda and detailed notes on agenda were sent generally seven days in advance, and a system exists for seeking and obtaining further information and clarifications on the agenda items before the meeting and for meaningful participation at the meeting.
During the year, all decision in the Board Meetings were carried unanimously.
I further report that during the audit period there were no specific events / actions in pursuance of the above referred laws, rules, regulations, standards, etc. having a major bearing on the Companys’ affairs., except as stated below:
i) Incorporated wholly-owned subsidiary Company, namely Hester Biosciences Africa Limited (HBAL) in Tanzania. HBAL is in the business of manufacturing and trading of veterinary vaccines and animal health product in Tanzania.
ii) The Company has acquired (54.80% stake) and invested in Texas Lifesciences Private Limited, subsidiary of Hester Biosciences Limited. This Company is in the business of manufacturing and supplying pharma formulations, tablets, capsules, powder, and oral liquid for human and veterinary markets.
Name of Company Secretary in practice: Tapan ShahPlace: Ahmedabad FCS No. : 4476Date: 14 May 2018 C P No. : 2839
Note: This Report is to be read with my letter of above date which is annexed as Annexure A and forms an integral part of this report.
Statutory reportsDirectors' Report
05
31st Annual Report 2017-18 51
Annexure-A
To, The Members, HESTER BIOSCIENCES LIMITED1st Floor, Pushpak, Panchvati Circle, Motilal Hirabhai Road,Ahmedabad - 380 006
My report of the above date is to be read along with this letter.
1. Maintenance of secretarial records is the responsibility of the management of the Company. My responsibility is to express an opinion on these secretarial records based on my audit.
2. I have followed the audit practices and processes as were appropriate to obtain reasonable assurance about the correctness of the contents of secretarial records. The verification was done based on the records and documents provided, on test basis to ensure that correct facts are reflected in secretarial records. I believe that the processes and practices followed by me provide a reasonable basis for my opinion.
3. I have not verified the correctness and appropriateness of financial records and books of accounts of the Company.
4. Wherever required, I have obtained the Management representation about the compliance of laws, rules and regulations and happening of events etc.
5. The compliance of the provision of corporate and other applicable laws, rules, regulations, standards is the responsibility of management. My examination was limited to verification of procedures on test basis.
6. The Secretarial Audit report is neither an assurance as to the future viability of the Company nor the efficacy or effectiveness with which the management has conducted the affairs of the Company.
Name of Company Secretary in practice: Tapan ShahPlace: Ahmedabad FCS No. : 4476Date: 14 May 2018 C P No. : 2839
Hester Biosciences Limited
52
Management Discussion & Analysis
GLOBAL ECONOMIC OVERVIEWGlobal economy achieved 3.8% growth in 2017, the fastest since 2011. Growth in advanced economies was at 2.3% in 2017 versus 1.7% in 2016, primarily driven by strong pick up in investment spending. US witnessed 2.3% growth in 2017 versus 1.5% in 2016, aided by strengthening private investment. The Euro area witnessed 2.3% growth in 2017 versus 1.8% in 2016, aided by policy stimulus and strengthening global demand. Domestic demand and import growth saw upswing led by the simulative stance of the European Central Bank (ECB).
Growth in Emerging Market and Developing Economies was at 4.8% in 2017 as against 4.4% in 2016. Growth in China and India was led by robust growth in net exports and strong private consumption respectively, although investment growth has slowed during the year. Argentina, Brazil, Nigeria and the Russian Federation saw cyclical improvements.
In emerging nations, Asia witnessed strong growth with a notable upswing in emerging Europe. There were signs of recovery in several commodity exporters. Large exporters such as Germany, Japan, the United Kingdom (UK), the United States (US), and emerging Asia contributed to the recovery in exports. The recovery in imports was broad based, except in the UK.
Global Growth (in %)
2017 2018 P 2019 P
Global Economy 3.8 3.9 3.9
Advanced Economies 2.3 2.5 2.2
Emerging market and developing economies
4.8 4.9 5.1
Source: IMF, April 2018 Outlook
Global growth is expected to pick up to 3.9% in both 2018 and 2019. The growth will be aided by the sustained strong momentum, favourable market sentiments and accommodative financial conditions. Fiscal policy of US will aid growth in both the domestic and international market in the near term, though post 2020, US tax reform will lead to certain challenges. The partial recovery in commodity prices should allow conditions in commodity exporters to gradually improve. Advanced economies will grow faster than potential during the next two years. Accommodative monetary policy in Euro economies will help reduce excess capacity. Continued
strong growth in emerging Asia and Europe and upswing in performance of commodity exporters will lead to robust growth in emerging market and developing economies. India and China are the only two economies that are projected to surpass the worlds' growth rate at 7.4% and 6.6% respectively in 2018.
(Source: World Economic Outlook 2018, IMF; World Bank)
INDIAN ECONOMIC OVERVIEWIndian economy has witnessed transformational reforms in the year under review. The first half of the year struggled due to GST implementation, after effects of demonetisation and implementation of Insolvency and Bankruptcy Code (IBC). However, the second half of the financial year, witnessed a strong rebound in economic activity on the back of a turnaround in investment demand, acceleration in manufacturing, pick-up in capacity utilisation, strong activity in the services sector and a record agricultural harvest. As per second advanced estimates issued by the Central Statistics Organisation (CSO), Indias' GDP at constant prices is expected to grow by 6.6% in FY 2017-18 as compared to 7.1% in the previous year.
One Nation One Tax “GST” will create single market, increase productivity and boost corporate investment and will help in reducing the cost of capital equipment. Investment will be further supported by the plan to recapitalise public banks and by the new road plan. On the Direct tax front the plans to reduce the corporate income tax rate and broaden the base will also promote growth.
According to IMF, the Indian economy is expected to grow at an annual rate of 7.4% in FY 2018-19 and 7.8% in FY 2019-20. The growth is expected to gradually rise with continued implementation of structural reforms that raise productivity and incentivise private investment. Indias' projected 2018-19 growth rates are well above Chinas' 6.6% and 6.4% over the same period.
OUTLOOKThe outlook for India remains largely positive, underpinned by robust private consumption and public investment, as well as on-going structural reforms. Reflection of this is upgradation in Moodys' rating of Indias' local and foreign currency issuer rating to "Baa2" with a stable outlook from "Baa3". These are on the expectations that continued progress in Indias' economic reforms will enhance Indias' growth potential over time.
Statutory reportsManagement Discussion & Analysis
05
31st Annual Report 2017-18 53
According to World Banks' Ease of Doing Business 2018 Report, Indias' ranking improved by 30 positions to 100th rank. As per the World Economic Forum, Indias' rank in Global Competitiveness Index is 40 out of 137 countries in FY 2017-18 which puts India on a strong footing on the global map. However, fiscal slippages and a below-normal monsoon could portend upside risks to inflation. Factors such as food prices, crude oil prices, other commodity prices and southwest monsoon could impact the growth forecasts.
Source: World Economic Situation and Prospects 2018 report of the United Nations; Central Statistics Organisation
GLOBAL ANIMAL HEALTHCARE MARKETThe global animal healthcare market is expected to reach USD 53 billion by 2025 from USD 32 billion in 2016, by growing at 5.6% CAGR from 2017 to 2025.
Animal healthcare market consists of products and services used by animals for the purpose of safe-guarding, preserving, and preventing them from various diseases. It also includes providing necessary veterinary services to enhance their lifespan, quality of life and their respective yield.
Animal healthcare market could be segmented by product types and animal types. The product type segment includes feed additives, pharmaceuticals and vaccines. Feed additives are the biggest sub-segment of Product types, due to increasing animal population, rising demand for protein rich diet and to preserve the optimum health of the livestock. Pharmaceutical and vaccines segment is expanding rapidly due to rise in number of veterinary diseases. The animal type segment can be classified into production animals and companion animals. Production animal is the biggest sub-segment of animal type and growing rapidly, due to increasing consumption of meat, milk and related products and technological advancement in the R&D of animal healthcare. Companion animals segment is expected to gain momentum due to rise in zoonotics and animal immunisation made compulsory by the regulatory authorities in several countries.
From regional perspective, North America is the largest animal healthcare market. This is due to the largest cattle population (both milch and meat cattle), a rising demand for protein rich diet, and rising incidence of animal diseases. Asia-Pacific is the fastest growing market due to factors such as under penetration, rising trend of zoonotics, mandatory government requirement for immunisation of animals, and growing trend for keeping companion animals.
INDUSTRY GROWTH DRIVERS Growing Demand for a Protein-rich Diet
As income levels are growing across the world, there is a growing demand of protein rich diet i.e. Eggs, Meat, Milk and related products. This is resulting in large scale, commercial farming of milch and meat cattle.
Major Source of Income for Mass Population Governments in emerging countries have also
recognised the fact that livestock rearing is often the
sole means of earning for under-privileged population. To support them, government has launched several programs to promote cattle and chicken rearing, including programs that improve breed health.
Increasing Trend of Zoonotic Diseases Across the world, there is an increasing trend of zoonotic
disease, or animal disease spreading to human beings. This trend is driving the demand for effective vaccines and remedial medicines.
Increasing Awareness about Disease There is an increasing trend of keeping companion animals,
leading to better awareness about related veterinary vaccines and diseases. In addition, several governments are taking proactive actions by imposing regulatory insistence on vaccinations and regular medical treatments.
https://www.researchandmarkets.com/reports/4427317/global-companion-animal-specialty-drugs-market#rela4 https://www.prnewswire.com/news-releases/global-animal-healthcare-market-2017-2025---a-53-billion-market-potential-300577550.html
INDIAN ANIMAL HEALTHCARE MARKETThe Indian Animal Healthcare market is expected to grow at a CAGR of 8% to reach over USD 1.2 billion by 2024. A major reason for the market growth is countrys' extensive animal husbandry practices. Indian livestock population constitute 10% of global livestock population and ranks among the largest producers of cattle, chicken and fish.
The market is expected to expand in several directions viz. export opportunities, new segments, specific product and services for specific category of animals. Below are the key factors that would determine the expansion trajectory of Indian animal market
Favourable demographics
Rising disposable income leading to rising spend on high protein diet
Rising access and awareness about animal healthcare products
Government programs for better livestock health
Discovery of new treatments
Development of new generation biological and antibiotics for veterinary animals
Well-defined and structured regulatory approvals in the sub-continent as compared to other countries, leading to export opportunities
Increase in veterinary professionals
https://www.gminsights.com/industry-analysis/animal-healthcare-markethttps://www.animalhealthindia.com/ah-markethttps://www.mordorintelligence.com/industry-reports/india-veterinary-healthcare-market-industry
Hester Biosciences Limited
54
RISKS IDENTIFICATION & MITIGATION STRATEGIES Economic Slowdown
The Companys' products help to produce the most inexpensive forms of animal protein i.e. milk, eggs and meat. If there is a slowdown in the economy, the sale of these products could also impact, hence could adversely impact the sales of the Companys' animal healthcare products.
Mitigation Strategy: The Company continuously monitor the business and
economic environment and adapt new technologies and seek ways to improve market penetration to counter such an event.
Competition Risk The Companys' complex manufacturing processes and
access to export countries having stringent registration requirements, creates a competitive advantage for the Company. However, in case any competitor emerges with better technology or better access to markets, it may adversely affect the Companys' prospects.
Mitigation Strategy: The Company ranks among the largest animal healthcare
companies in Asia and effortlessly strive to stay ahead in the learning curve by implementing latest technologies and explore new and growing markets.
Delay in Government Programs Large animal vaccines such as those for Brucella and
PPR are supported by the government for their initiatives to eradicate these animal diseases. In case of delay in rolling out these programs by government, it may affect the Companys' operations in the short term.
Mitigation Strategy: The Company is developing newer routes of market
access such as selling to large dairy owners, cattle farms and co-operatives to ensure these products reach markets.
Product Development Issues One of the Companys' key product advantages has been
offering a thermostable vaccine for Newcastle disease, for the same any cold chain distribution system is not required. This allows the Company to offer product in remote regions as well. In case of delays in development, the Company would not be able to offer this product to areas doesn’t have cold storage distribution facilities.
Mitigation Strategy: The Company have been building up inventory of
theseproducts and have implemented a production planning system. However, a disproportionately large government order or export tender may require us to divert stock from other markets, or use manufacturing capacity to handle such demand. Since these vaccines need to be administered only at a specific period in the animal life cycle, the Company build sufficient inventory to meet the demand.
Forex Risks Being exposed to a significant number of geographies,
the Company deals in a number of currencies and runs the risk of unfavourable movement in any currency leading to financial losses
Mitigation Strategy: In the FY 2017-18, the Company derived over 9.39% of
sales from exports and fulfil some of its raw material requirements through imports.
Regulatory Risks The Companys' business operations are dependent on
local rules and regulations of each country. Any change in regulations, government policies or political environment could adversely impact the Companys' growth prospects
Mitigation Strategy: In the past few decades, the Company has established
a partnership level relationship with local government and authorities. The Company always strives to reduce political or regulatory risks by proper legal consultations and documentations.
INTERNAL CONTROLS, SYSTEMS & ADEQUACYThe Company has clearly laid down policies, guidelines and procedures keeping in mind the nature, size and complexity of business operations. The Company maintains a proper and adequate system of internal controls which provide for automatic checks and balances. The Companys' resilience and focus is driven to a large extent by its strong internal control systems for financial reporting. The Company follows strict procedures to ensure high accuracy in recording and providing reliable financial & operational information, meeting statutory compliances.
The Companys' internal team and Audit Committee closely oversee the business operations. These responsibilities include the design, implementation and maintenance of adequate internal financial controls to ensure the orderly and efficient conduct of its business. The committees also
Statutory reportsManagement Discussion & Analysis
05
31st Annual Report 2017-18 55
ensure adherence to Companys' policies, the safeguarding of its assets, the prevention and detection of frauds and errors, the accuracy and completeness of the accounting records, and the timely preparation of reliable financial information. Any deviations are prompted to the management. Various risk mitigation solutions are then determined to bring risk exposure levels in line with risk appetite. Timely and adequate measures are undertaken to ensure undisrupted functioning of the business.
HUMAN RESOURCESThe Company believes that human resources are the most critical element responsible for the growth of the Company. The Company values its human capital and provides them ample opportunities to grow. The Company has in place comprehensive and well-structured HR policies to ensure
employee growth both at personal and professional levels. The Company boasts of an experienced and talented pool of employees who continue to play key roles in enhancing business efficiency, devising strategies, setting-up systems and evolving business as per industry requirements. The Company ensures a safe, conducive and productive work environment. The Company values its talent pool and works hard to retain its best talent by providing ample opportunities to grow. Its strong organisational culture also enables it to attract talented resources. The Company conducts regular trainings to the employees to ensure skill upgradation and personnel development.
56
Hester Biosciences Limited
Report on Corporate Governance
The Securities and Exchange Board of India (SEBI) has stipulated Corporate Governance Standards for Listed Companies vide Regulation 17 to 27 and 46 of SEBI (Listing Obligation and Disclosure Requirement) Regulations, 2015.
Corporate Governance is corporate discipline, extended transparency, integrity and accountability towards all stakeholders. Corporate Governance helps to achieve excellence to enhance stakeholders' value by focusing on long-term value creation without compromising on integrity, social obligations and regulatory compliances.
COMPANYS' PHILOSOPHY ON CORPORATE GOVERNANCEHester Biosciences Limited has always been committed to the principal of continuous good corporate governance and always strives to improve performance at all level by adhering to corporate governance practices, such as managing its affairs with diligence, transparency, responsibility and accountability. We have, therefore, designed our systems and action plans to enhance performance and stakeholders’ value in the long run. To create a culture of good governance, your Company has adopted practices that comprises of performance accountability, effective management control, constitution of Board Committees as a part of the internal control system, fair representation of professionally qualified, non-executive and independent Directors on the Board, adequate and timely compliance, disclosure of information on performance, ownership and governance of the Company and payment of statutory dues. The Compliance Report on Corporate Governance herein signifies compliance of all mandatory requirements of SEBI (Listing Obligations and Disclosure Requirements) Regulations, 2015 (the Listing Regulations).
The Companys' continued endeavour is to achieve good governance which ensures our performance rules with integrity, thereby ensuring truth, transparency, accountability and responsibility in all our dealings with our employees, shareholders, consumers and the community at large. Apart from compliance with the statutory provisions of Company Law, allied acts and SEBI (Listing Obligations and Disclosures Requirement) Regulations, 2015, our disclosure seeks to attain best practices in corporate governance. We believe that good corporate governance is critical to enhance and retain stakeholders’ trust.
GOVERNANCE STRUCTUREGovernance structure of the Company comprises of the Board of Directors and the Committees of the Board at the top level and the internal governance structure at the operational level. The responsibility of the Board is to determine the overall corporate objectives and give direction and freedom to the management to achieve those objectives within a given framework. The organisational and governance structure enables an environment for value creation through sustainable and profitable growth. The governance structure is based on the principles of freedom to the executive management within a given framework to ensure that the powers vested in the executive management are exercised with due care and responsibilities. The primary role of the Board is to protect the interest and enhance the value for all the stakeholders. It conducts the overall strategic supervision and control by setting policies, reporting mechanism, accountability and decision making process to be followed. The CEO & Managing Director is in overall control and responsible for the overall working of the Company. He gives strategic directions, lays down the policy guidelines and ensures the implementation of the decisions of the Board and its committees. The governance system encourages the entrepreneurship, risk taking and growth orientation with an objective to lead full accountability enabled by appropriate empowerment.
BOARD OF DIRECTORSThe CEO & Managing Director looks after the day-to-day business affairs of the Company; the Board of Directors reviews the overall business operations at least once in a quarter based on updates on the Companys’ performance provided by the CEO & Managing Director.
A) Composition of the Board
The Composition of the Board of Directors, with reference to the number of Executive and Non-Executive Directors, meet with the requirements of the Code of Corporate Governance and SEBI (Listing Obligations and Disclosures Requirements) Regulations, 2015. As on 31 March 2018, your Companys’ Board comprises of eight Directors (excluding One Alternate Director) with a mix of Executive / Non-Executive and Promoter / Independent Directors of the total Board members, the Chairman is a Non-Executive Promoter Director, the Managing Director is an Executive Promoter Director, two of them are Non -
Statutory reportsReport on Corporate Governance
05
31st Annual Report 2017-18 57
Executive Promoter Directors and the remaining four are Non-Executive Independent Directors. As required under the provisions of section 149(1) of the Companies Act, 2013 and Rules made thereunder and regulation 17 of the Listing Regulations, the constitution of Board meets with the requirements stated therein. Non-Executive and Independent Directors have expert knowledge in the fields of finance, taxation, legal and industry. Thus the Board represents a balanced mix of professionals, who bring the benefits of their knowledge and expertise.
B) Board of Directors and their Meetings
During the year, there is no appointment and cessation taken a place.
In compliance with regulation 17 of the Listing Regulations and as required under the Companies Act, 2013, the Board meets at least once in each quarter and the gap between any two Board meetings was not more than 120 days. Additional meetings are held as and when required to transact important business of the Company. During the year under review, four Board of Directors meeting were held on 8 May 2017, 28 July 2017, 9 November 2017 and 23 January 2018.
The Board periodically reviews the items required to be placed before it and in particular reviews and approves quarterly / half yearly unaudited financial statements and the audited annual financial statements, projects and capital expenditure, compliance with applicable laws and regulations. It monitors overall performance of the Company and reviews performance of its subsidiary. The Agenda for the Board meeting covers items set out as guidelines in regulation 17 of Listing Regulations to the extent the same are applicable and relevant. All agenda items are supported by relevant information, documents and presentations to enable the Board to take informed decisions. In compliance with regulation 17 of Listing Regulations, the Company has circulated all agenda papers along with notes and other supportings before seven days of the Board meetings.
The meetings of the Board of Directors are scheduled well in advance and usually held in Ahmedabad, where the Registered Office of the Company is situated. The Chief Financial Officer and the Company Secretary, in consultation with the CEO & Managing Director, prepare detailed agenda for the meetings. Directors are also free to bring up any matter for discussion at the Board meetings with the permission of the Chairman.
The draft minutes of the meeting approved by the Chairman is circulated to all the Directors within fifteen
days after the conclusion of the meetings. Decisions taken at Board / Committee meetings are communicated to the concerned departments promptly for actions and an Action Taken Report on the status of the decisions taken at the Board / Committee meetings is placed, for the information, to the Board / Committee members.
The Board has complete access to the information within the Company, which inter alia includes:
1) Quarterly results and results of operations of Company, its subsidiaries.
2) All borrowings, investments, loans and guarantees.
3) Minutes of the meetings of the Board of Directors, Committees of the Board and the summary of minutes of the subsidiary Companies.
4) Details of acquisitions of brands, trademarks or companies or any collaboration agreements.
5) Any materially relevant default, if any, in financial obligations to and by the Company or substantial non-payment for goods sold or services rendered, if any
6) Any issue, which involves possible public or product liability claims of substantial nature, including any Judgment or
7) Compliance or non-compliance of any regulatory, statutory nature or listing requirements and matters related to investors’ service such as non-payment of dividend, delay in transfer of shares, etc.
While constituting the Committee of Directors, the requirement that a Director shall not be a member of more than ten committees and Chairman of not more than five committees have been ensured and complied with. None of the Independent Directors serves as an Independent Director in more than seven listed Companies. None of the Director of the Company is serving as a Whole-Time Director in any listed Company and is holding a position of Independent Director in more than three listed Companies.
The following table gives the attendance of the Directors at the Board meetings of the Company and also the number of other Directorships held in Indian Companies (other than the Company) and chairmanship / membership in Board Committees of Public Limited Companies as at 31 March 2018.
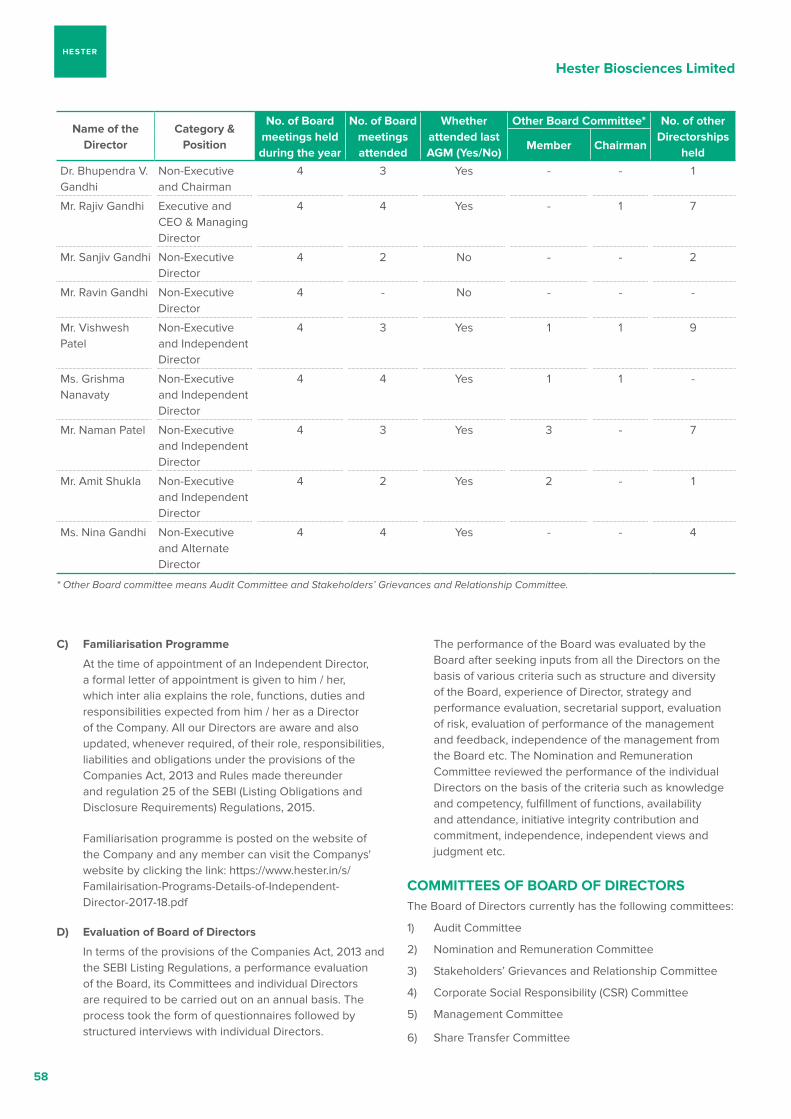
58
Hester Biosciences Limited
Name of the Director
Category & Position
No. of Board meetings held during the year
No. of Board meetings attended
Whether attended last AGM (Yes/No)
Other Board Committee* No. of other Directorships
heldMember Chairman
Dr. Bhupendra V. Gandhi
Non-Executive and Chairman
4 3 Yes - - 1
Mr. Rajiv Gandhi Executive and CEO & Managing Director
4 4 Yes - 1 7
Mr. Sanjiv Gandhi Non-Executive Director
4 2 No - - 2
Mr. Ravin Gandhi Non-Executive Director
4 - No - - -
Mr. Vishwesh Patel
Non-Executive and Independent Director
4 3 Yes 1 1 9
Ms. Grishma Nanavaty
Non-Executive and Independent Director
4 4 Yes 1 1 -
Mr. Naman Patel Non-Executive and Independent Director
4 3 Yes 3 - 7
Mr. Amit Shukla Non-Executive and Independent Director
4 2 Yes 2 - 1
Ms. Nina Gandhi Non-Executive and Alternate Director
4 4 Yes - - 4
* Other Board committee means Audit Committee and Stakeholders’ Grievances and Relationship Committee.
C) Familiarisation Programme
At the time of appointment of an Independent Director, a formal letter of appointment is given to him / her, which inter alia explains the role, functions, duties and responsibilities expected from him / her as a Director of the Company. All our Directors are aware and also updated, whenever required, of their role, responsibilities, liabilities and obligations under the provisions of the Companies Act, 2013 and Rules made thereunder and regulation 25 of the SEBI (Listing Obligations and Disclosure Requirements) Regulations, 2015.
Familiarisation programme is posted on the website of the Company and any member can visit the Companys' website by clicking the link: https://www.hester.in/s/Familairisation-Programs-Details-of-Independent-Director-2017-18.pdf
D) Evaluation of Board of Directors
In terms of the provisions of the Companies Act, 2013 and the SEBI Listing Regulations, a performance evaluation of the Board, its Committees and individual Directors are required to be carried out on an annual basis. The process took the form of questionnaires followed by structured interviews with individual Directors.
The performance of the Board was evaluated by the Board after seeking inputs from all the Directors on the basis of various criteria such as structure and diversity of the Board, experience of Director, strategy and performance evaluation, secretarial support, evaluation of risk, evaluation of performance of the management and feedback, independence of the management from the Board etc. The Nomination and Remuneration Committee reviewed the performance of the individual Directors on the basis of the criteria such as knowledge and competency, fulfillment of functions, availability and attendance, initiative integrity contribution and commitment, independence, independent views and judgment etc.
COMMITTEES OF BOARD OF DIRECTORSThe Board of Directors currently has the following committees:
1) Audit Committee
2) Nomination and Remuneration Committee
3) Stakeholders’ Grievances and Relationship Committee
4) Corporate Social Responsibility (CSR) Committee
5) Management Committee
6) Share Transfer Committee
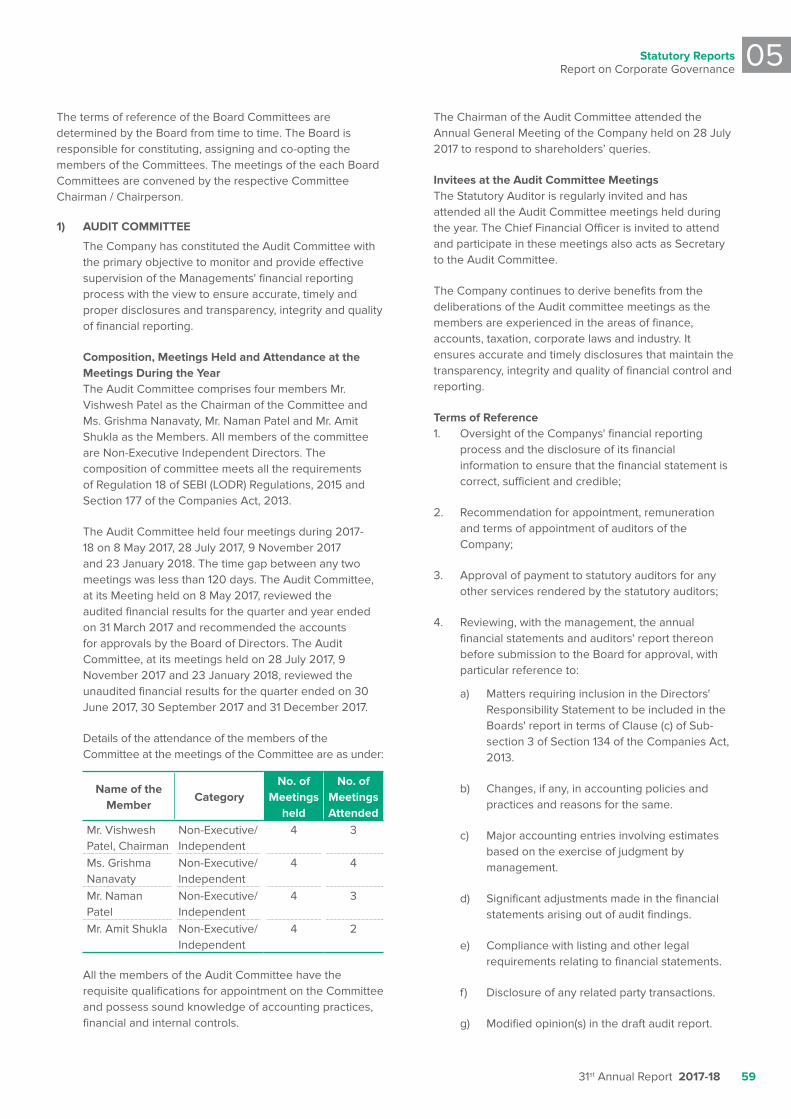
Statutory reportsReport on Corporate Governance
05
31st Annual Report 2017-18 59
The terms of reference of the Board Committees are determined by the Board from time to time. The Board is responsible for constituting, assigning and co-opting the members of the Committees. The meetings of the each Board Committees are convened by the respective Committee Chairman / Chairperson.
1) AUDIT COMMITTEE
The Company has constituted the Audit Committee with the primary objective to monitor and provide effective supervision of the Managements' financial reporting process with the view to ensure accurate, timely and proper disclosures and transparency, integrity and quality of financial reporting.
Composition, Meetings Held and Attendance at the Meetings During the Year
The Audit Committee comprises four members Mr. Vishwesh Patel as the Chairman of the Committee and Ms. Grishma Nanavaty, Mr. Naman Patel and Mr. Amit Shukla as the Members. All members of the committee are Non-Executive Independent Directors. The composition of committee meets all the requirements of Regulation 18 of SEBI (LODR) Regulations, 2015 and Section 177 of the Companies Act, 2013.
The Audit Committee held four meetings during 2017-18 on 8 May 2017, 28 July 2017, 9 November 2017 and 23 January 2018. The time gap between any two meetings was less than 120 days. The Audit Committee, at its Meeting held on 8 May 2017, reviewed the audited financial results for the quarter and year ended on 31 March 2017 and recommended the accounts for approvals by the Board of Directors. The Audit Committee, at its meetings held on 28 July 2017, 9 November 2017 and 23 January 2018, reviewed the unaudited financial results for the quarter ended on 30 June 2017, 30 September 2017 and 31 December 2017.
Details of the attendance of the members of the Committee at the meetings of the Committee are as under:
Name of the Member
CategoryNo. of
Meetings held
No. of Meetings Attended
Mr. Vishwesh Patel, Chairman
Non-Executive/ Independent
4 3
Ms. Grishma Nanavaty
Non-Executive/ Independent
4 4
Mr. Naman Patel
Non-Executive/ Independent
4 3
Mr. Amit Shukla Non-Executive/ Independent
4 2
All the members of the Audit Committee have the requisite qualifications for appointment on the Committee and possess sound knowledge of accounting practices, financial and internal controls.
The Chairman of the Audit Committee attended the Annual General Meeting of the Company held on 28 July 2017 to respond to shareholders’ queries.
Invitees at the Audit Committee Meetings The Statutory Auditor is regularly invited and has
attended all the Audit Committee meetings held during the year. The Chief Financial Officer is invited to attend and participate in these meetings also acts as Secretary to the Audit Committee.
The Company continues to derive benefits from the deliberations of the Audit committee meetings as the members are experienced in the areas of finance, accounts, taxation, corporate laws and industry. It ensures accurate and timely disclosures that maintain the transparency, integrity and quality of financial control and reporting.
Terms of Reference 1. Oversight of the Companys' financial reporting
process and the disclosure of its financial information to ensure that the financial statement is correct, sufficient and credible;
2. Recommendation for appointment, remuneration and terms of appointment of auditors of the Company;
3. Approval of payment to statutory auditors for any other services rendered by the statutory auditors;
4. Reviewing, with the management, the annual financial statements and auditors' report thereon before submission to the Board for approval, with particular reference to:
a) Matters requiring inclusion in the Directors' Responsibility Statement to be included in the Boards' report in terms of Clause (c) of Sub-section 3 of Section 134 of the Companies Act, 2013.
b) Changes, if any, in accounting policies and practices and reasons for the same.
c) Major accounting entries involving estimates based on the exercise of judgment by management.
d) Significant adjustments made in the financial statements arising out of audit findings.
e) Compliance with listing and other legal requirements relating to financial statements.
f) Disclosure of any related party transactions.
g) Modified opinion(s) in the draft audit report.
60
Hester Biosciences Limited
5. Reviewing, with the management, the quarterly financial statements before submission to the Board for approval;
6. Reviewing, with the management, the statement of uses/application of funds raised through an issue (public issue, rights issue, preferential issue, etc.), the statement of funds utilised for purposes other than those stated in the offer document / prospectus / notice and the report submitted by the monitoring agency monitoring the utilisation of proceeds of a public or rights issue, and making appropriate recommendations to the Board to take up steps in this matter;
7. Review and monitor the auditors' independence and performance, and effectiveness of the audit process;
8. Approval or any subsequent modification of transactions of the Company with related parties;
9. Scrutiny of inter-corporate loans and investments;
10. Valuation of undertakings or assets of the Company, wherever it is necessary;
11. Evaluation of internal financial controls and risk management systems;
12. Reviewing, with the management, the performance of statutory and internal auditors and adequacy of the internal control systems;
13. Reviewing the adequacy of internal audit function, if any, including the structure of the internal audit department, staffing and seniority of the official heading the department, reporting structure coverage and frequency of internal audit;
14. Discussion with internal auditors about any significant findings and follow up there on;
15. Reviewing the findings of any internal investigations by the internal auditors into matters where there is suspected fraud or irregularity or a failure of internal control systems of a material nature and reporting the matter to the Board;
16. Discussion with statutory auditors before the audit commences, about the nature and scope of audit as well as post-audit discussion to ascertain any area of concern;
17. To look into the reasons for substantial defaults in the payment to the depositors, debenture holders, shareholders (in case of non-payment of declared dividends) and creditors;
18. To review the functioning of the Whistle Blower mechanism;
19. Approval of appointment of CFO (i.e., the Whole-Time Finance Director or any other person heading the finance function or discharging that function) after assessing the qualifications, experience and background, etc. of the candidate;
20. Carrying out any other function as is mentioned in the terms of reference of the Audit Committee;
21. Management discussion and analysis of financial condition and results of operations;
22. Statement of significant related party transactions (as defined by the audit committee), submitted by management;
23. Management letters / letters of internal control weaknesses issued by the statutory auditors;
24. Internal audit reports relating to internal control weaknesses; and
25. The appointment, removal and terms of remuneration of the chief internal auditor shall be subject to review by the audit committee.
26. Statement of deviations:
(a) Quarterly statement of deviation(s) including report of monitoring agency, if applicable, submitted to stock exchange(s) in terms of Regulation 32(1).
(b) Annual statement of funds utilised for purposes other than those stated in the offer document/prospectus/notice in terms of Regulation 32(7).
2) NOMINATION AND REMUNERATION COMMITTEE
In compliance with the provisions of section 178 of the Companies Act, 2013 and regulation 19 of the Listing Regulations 2015, the Board has constituted a “Nomination and Remuneration Committee” (NRC).
The Nomination and Remuneration Committee as a committee of the Board has been constituted mainly to determine and recommend to Board, the Companys' policies on remuneration packages for Executive and Non-Executive Directors and policies on Nomination for Appointment of Director, Key Managerial Personnel and Senior Management Personnel.
Composition, Meetings Held and Attendance at the Meetings during the Year
The composition of Nomination and Remuneration Committee as on 31 March 2018 comprises four members - Mr. Vishwesh Patel as the Chairman and Ms. Grishma Nanavaty, Mr. Naman Patel and Mr. Amit Shukla as the members. All members of the committee are Non-Executive Independent Directors.
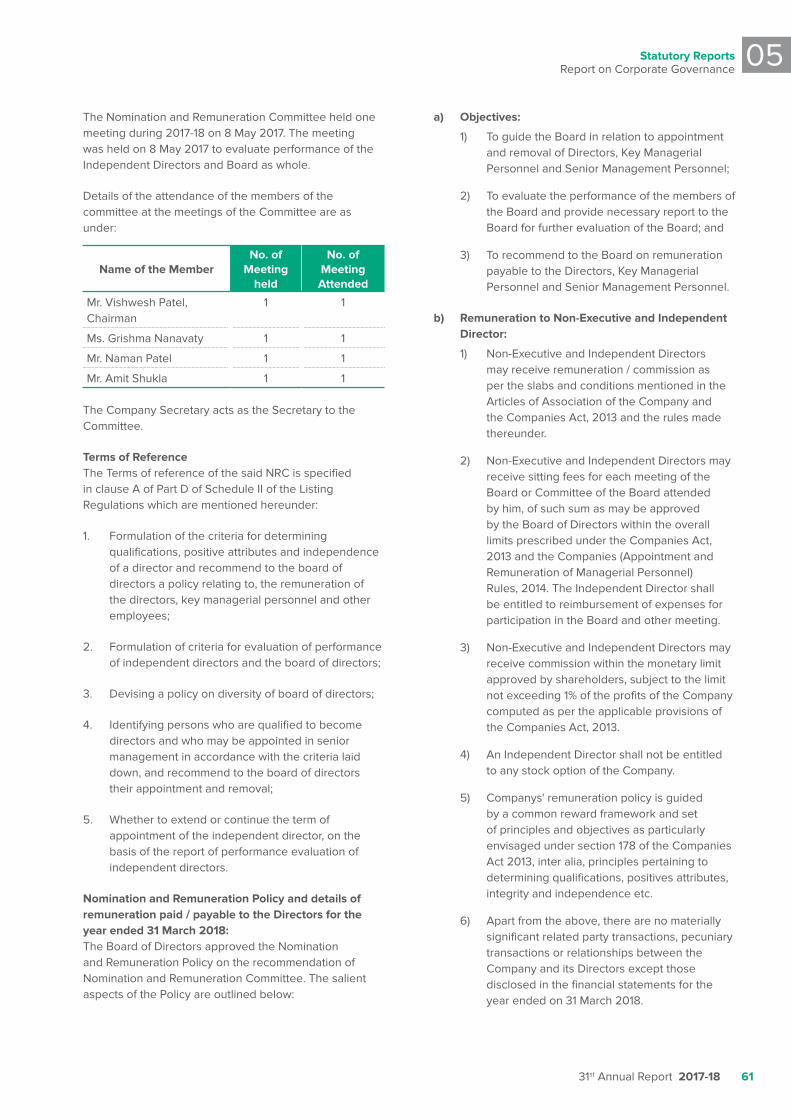
Statutory reportsReport on Corporate Governance
05
31st Annual Report 2017-18 61
The Nomination and Remuneration Committee held one meeting during 2017-18 on 8 May 2017. The meeting was held on 8 May 2017 to evaluate performance of the Independent Directors and Board as whole.
Details of the attendance of the members of the committee at the meetings of the Committee are as under:
Name of the MemberNo. of
Meeting held
No. of Meeting Attended
Mr. Vishwesh Patel, Chairman
1 1
Ms. Grishma Nanavaty 1 1
Mr. Naman Patel 1 1
Mr. Amit Shukla 1 1
The Company Secretary acts as the Secretary to the Committee.
Terms of Reference The Terms of reference of the said NRC is specified
in clause A of Part D of Schedule II of the Listing Regulations which are mentioned hereunder:
1. Formulation of the criteria for determining qualifications, positive attributes and independence of a director and recommend to the board of directors a policy relating to, the remuneration of the directors, key managerial personnel and other employees;
2. Formulation of criteria for evaluation of performance of independent directors and the board of directors;
3. Devising a policy on diversity of board of directors;
4. Identifying persons who are qualified to become directors and who may be appointed in senior management in accordance with the criteria laid down, and recommend to the board of directors their appointment and removal;
5. Whether to extend or continue the term of appointment of the independent director, on the basis of the report of performance evaluation of independent directors.
Nomination and Remuneration Policy and details of remuneration paid / payable to the Directors for the year ended 31 March 2018:
The Board of Directors approved the Nomination and Remuneration Policy on the recommendation of Nomination and Remuneration Committee. The salient aspects of the Policy are outlined below:
a) Objectives:
1) To guide the Board in relation to appointment and removal of Directors, Key Managerial Personnel and Senior Management Personnel;
2) To evaluate the performance of the members of the Board and provide necessary report to the Board for further evaluation of the Board; and
3) To recommend to the Board on remuneration payable to the Directors, Key Managerial Personnel and Senior Management Personnel.
b) Remuneration to Non-Executive and Independent Director:
1) Non-Executive and Independent Directors may receive remuneration / commission as per the slabs and conditions mentioned in the Articles of Association of the Company and the Companies Act, 2013 and the rules made thereunder.
2) Non-Executive and Independent Directors may receive sitting fees for each meeting of the Board or Committee of the Board attended by him, of such sum as may be approved by the Board of Directors within the overall limits prescribed under the Companies Act, 2013 and the Companies (Appointment and Remuneration of Managerial Personnel) Rules, 2014. The Independent Director shall be entitled to reimbursement of expenses for participation in the Board and other meeting.
3) Non-Executive and Independent Directors may receive commission within the monetary limit approved by shareholders, subject to the limit not exceeding 1% of the profits of the Company computed as per the applicable provisions of the Companies Act, 2013.
4) An Independent Director shall not be entitled to any stock option of the Company.
5) Companys' remuneration policy is guided by a common reward framework and set of principles and objectives as particularly envisaged under section 178 of the Companies Act 2013, inter alia, principles pertaining to determining qualifications, positives attributes, integrity and independence etc.
6) Apart from the above, there are no materially significant related party transactions, pecuniary transactions or relationships between the Company and its Directors except those disclosed in the financial statements for the year ended on 31 March 2018.
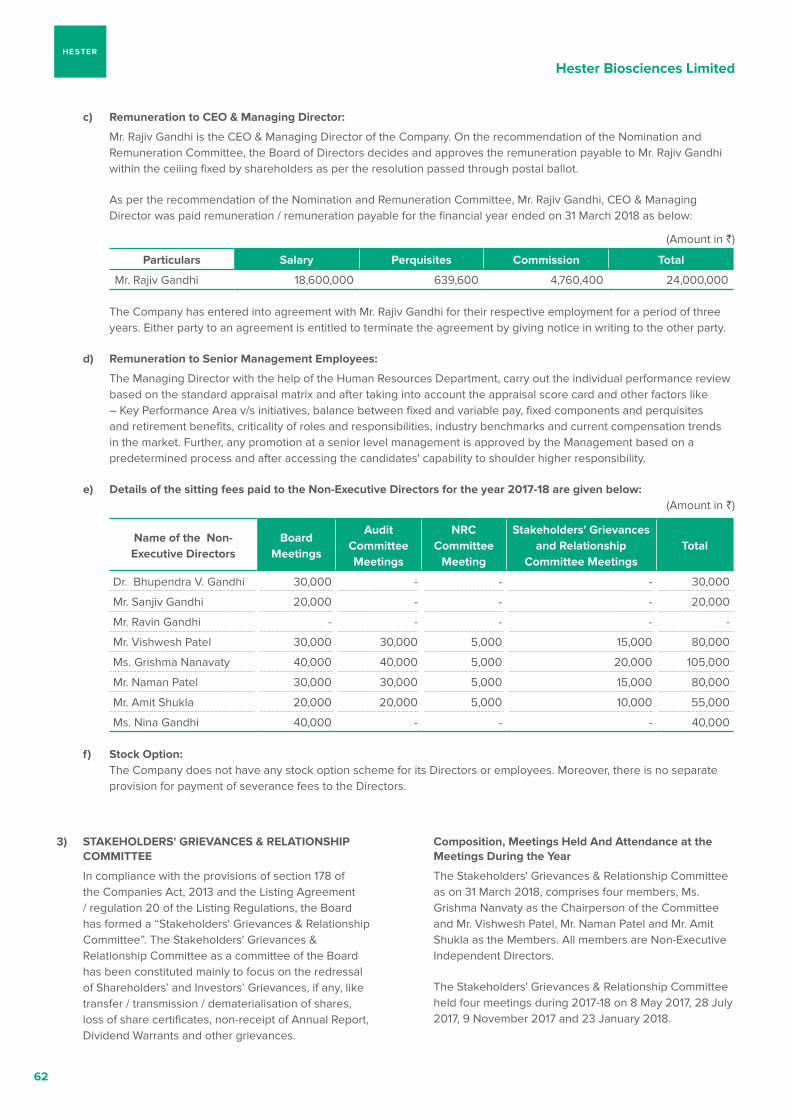
62
Hester Biosciences Limited
c) Remuneration to CEO & Managing Director:
Mr. Rajiv Gandhi is the CEO & Managing Director of the Company. On the recommendation of the Nomination and Remuneration Committee, the Board of Directors decides and approves the remuneration payable to Mr. Rajiv Gandhi within the ceiling fixed by shareholders as per the resolution passed through postal ballot.
As per the recommendation of the Nomination and Remuneration Committee, Mr. Rajiv Gandhi, CEO & Managing Director was paid remuneration / remuneration payable for the financial year ended on 31 March 2018 as below:
(Amount in `)
Particulars Salary Perquisites Commission Total
Mr. Rajiv Gandhi 18,600,000 639,600 4,760,400 24,000,000
The Company has entered into agreement with Mr. Rajiv Gandhi for their respective employment for a period of three years. Either party to an agreement is entitled to terminate the agreement by giving notice in writing to the other party.
d) Remuneration to Senior Management Employees:
The Managing Director with the help of the Human Resources Department, carry out the individual performance review based on the standard appraisal matrix and after taking into account the appraisal score card and other factors like – Key Performance Area v/s initiatives, balance between fixed and variable pay, fixed components and perquisites and retirement benefits, criticality of roles and responsibilities, industry benchmarks and current compensation trends in the market. Further, any promotion at a senior level management is approved by the Management based on a predetermined process and after accessing the candidates' capability to shoulder higher responsibility.
e) Details of the sitting fees paid to the Non-Executive Directors for the year 2017-18 are given below:(Amount in `)
Name of the Non-Executive Directors
Board Meetings
Audit Committee Meetings
NRC Committee
Meeting
Stakeholders’ Grievances and Relationship
Committee MeetingsTotal
Dr. Bhupendra V. Gandhi 30,000 - - - 30,000
Mr. Sanjiv Gandhi 20,000 - - - 20,000
Mr. Ravin Gandhi - - - - -
Mr. Vishwesh Patel 30,000 30,000 5,000 15,000 80,000
Ms. Grishma Nanavaty 40,000 40,000 5,000 20,000 105,000
Mr. Naman Patel 30,000 30,000 5,000 15,000 80,000
Mr. Amit Shukla 20,000 20,000 5,000 10,000 55,000
Ms. Nina Gandhi 40,000 - - - 40,000
f) Stock Option: The Company does not have any stock option scheme for its Directors or employees. Moreover, there is no separate
provision for payment of severance fees to the Directors.
3) STAKEHOLDERS' GRIEVANCES & RELATIONSHIP COMMITTEE
In compliance with the provisions of section 178 of the Companies Act, 2013 and the Listing Agreement / regulation 20 of the Listing Regulations, the Board has formed a “Stakeholders' Grievances & Relationship Committee”. The Stakeholders' Grievances & Relationship Committee as a committee of the Board has been constituted mainly to focus on the redressal of Shareholders’ and Investors’ Grievances, if any, like transfer / transmission / dematerialisation of shares, loss of share certificates, non-receipt of Annual Report, Dividend Warrants and other grievances.
Composition, Meetings Held And Attendance at the Meetings During the Year
The Stakeholders' Grievances & Relationship Committee as on 31 March 2018, comprises four members, Ms. Grishma Nanvaty as the Chairperson of the Committee and Mr. Vishwesh Patel, Mr. Naman Patel and Mr. Amit Shukla as the Members. All members are Non-Executive Independent Directors.
The Stakeholders' Grievances & Relationship Committee held four meetings during 2017-18 on 8 May 2017, 28 July 2017, 9 November 2017 and 23 January 2018.
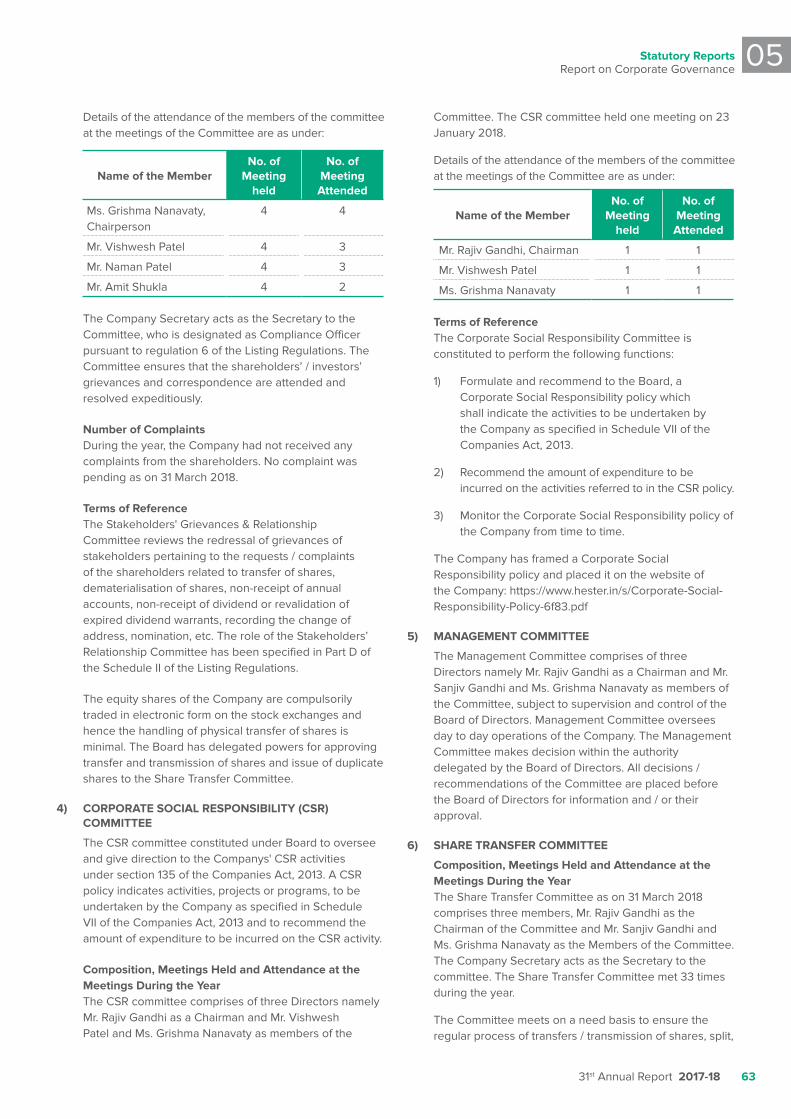
Statutory reportsReport on Corporate Governance
05
31st Annual Report 2017-18 63
Details of the attendance of the members of the committee at the meetings of the Committee are as under:
Name of the MemberNo. of
Meeting held
No. of Meeting Attended
Ms. Grishma Nanavaty, Chairperson
4 4
Mr. Vishwesh Patel 4 3
Mr. Naman Patel 4 3
Mr. Amit Shukla 4 2
The Company Secretary acts as the Secretary to the Committee, who is designated as Compliance Officer pursuant to regulation 6 of the Listing Regulations. The Committee ensures that the shareholders’ / investors’ grievances and correspondence are attended and resolved expeditiously.
Number of Complaints During the year, the Company had not received any
complaints from the shareholders. No complaint was pending as on 31 March 2018.
Terms of Reference The Stakeholders' Grievances & Relationship
Committee reviews the redressal of grievances of stakeholders pertaining to the requests / complaints of the shareholders related to transfer of shares, dematerialisation of shares, non-receipt of annual accounts, non-receipt of dividend or revalidation of expired dividend warrants, recording the change of address, nomination, etc. The role of the Stakeholders’ Relationship Committee has been specified in Part D of the Schedule II of the Listing Regulations.
The equity shares of the Company are compulsorily traded in electronic form on the stock exchanges and hence the handling of physical transfer of shares is minimal. The Board has delegated powers for approving transfer and transmission of shares and issue of duplicate shares to the Share Transfer Committee.
4) CORPORATE SOCIAL RESPONSIBILITY (CSR) COMMITTEE
The CSR committee constituted under Board to oversee and give direction to the Companys' CSR activities under section 135 of the Companies Act, 2013. A CSR policy indicates activities, projects or programs, to be undertaken by the Company as specified in Schedule VII of the Companies Act, 2013 and to recommend the amount of expenditure to be incurred on the CSR activity.
Composition, Meetings Held and Attendance at the Meetings During the Year
The CSR committee comprises of three Directors namely Mr. Rajiv Gandhi as a Chairman and Mr. Vishwesh Patel and Ms. Grishma Nanavaty as members of the
Committee. The CSR committee held one meeting on 23 January 2018.
Details of the attendance of the members of the committee at the meetings of the Committee are as under:
Name of the MemberNo. of
Meeting held
No. of Meeting Attended
Mr. Rajiv Gandhi, Chairman 1 1
Mr. Vishwesh Patel 1 1
Ms. Grishma Nanavaty 1 1
Terms of Reference The Corporate Social Responsibility Committee is
constituted to perform the following functions:
1) Formulate and recommend to the Board, a Corporate Social Responsibility policy which shall indicate the activities to be undertaken by the Company as specified in Schedule VII of the Companies Act, 2013.
2) Recommend the amount of expenditure to be incurred on the activities referred to in the CSR policy.
3) Monitor the Corporate Social Responsibility policy of the Company from time to time.
The Company has framed a Corporate Social Responsibility policy and placed it on the website of the Company: https://www.hester.in/s/Corporate-Social-Responsibility-Policy-6f83.pdf
5) MANAGEMENT COMMITTEE
The Management Committee comprises of three Directors namely Mr. Rajiv Gandhi as a Chairman and Mr. Sanjiv Gandhi and Ms. Grishma Nanavaty as members of the Committee, subject to supervision and control of the Board of Directors. Management Committee oversees day to day operations of the Company. The Management Committee makes decision within the authority delegated by the Board of Directors. All decisions / recommendations of the Committee are placed before the Board of Directors for information and / or their approval.
6) SHARE TRANSFER COMMITTEE
Composition, Meetings Held and Attendance at the Meetings During the Year
The Share Transfer Committee as on 31 March 2018 comprises three members, Mr. Rajiv Gandhi as the Chairman of the Committee and Mr. Sanjiv Gandhi and Ms. Grishma Nanavaty as the Members of the Committee. The Company Secretary acts as the Secretary to the committee. The Share Transfer Committee met 33 times during the year.
The Committee meets on a need basis to ensure the regular process of transfers / transmission of shares, split,
64
Hester Biosciences Limited
consolidation, demat / remat and issuance of duplicate share certificates.
Terms of Reference The Committee is empowered to perform all the
functions of the Board in relation to approval and monitoring transfers, transmission, dematerialisation, rematerialisation, issue of duplicate share certificates, splitting and consolidation of shares issued by the Company. The Committee also oversees the functions of the Registrar and Share Transfer Agent. The Board has delegated the powers to approve the transfer of shares to the Committee.
INDEPENDENT DIRECTORS’ MEETINGDuring the year under review, a separate meeting of Independent Directors was held on 23 January 2018, inter alia, to discuss:
1. Evaluation of performance of Non-Independent Directors and the Board of Directors as a whole,
2. Evaluation of performance of the Chairman of the Company, taking into account the views of the Executive and Non-Executive Directors, and
3. Evaluation of the quality, content and timelines of flow of information between the Management and the Board that is necessary to effectively and reasonably perform its duties.
The terms and conditions of Independent Directors are available on the website of the Company: https://www.hester.in/s/Terms-and-Conditions-Independent-Director.pdf
SUBSIDIARY COMPANIES:Company has three non-material Subsidiary Company namely Hester Biosciences Nepal Private Limited, Texas Lifesciences Private Limited and Hester Biosciences Africa Limited as on 31 March 2018. The Audit Committee reviews the financial statements, particularly, the investments made in Subsidiary Companies. The Board also reviews the financial statements of the said Subsidiary Companies on annual basis.
The Company has devised the policy for “Determining Material Subsidiaries” which is available on the website of the Company: https://www.hester.in/s/Policy-for-Determining-Material-Subsidiaries-gcgn.pdf
DISCLOSURESA) Related Party Transaction
All the transactions entered into with related parties as defined under Companies Act, 2013 and Regulations 23 of SEBI (LODR) Regulations, 2015, during the financial year were in the ordinary course of business and on arms’ length pricing basis and do not attract the provisions of Section 188 of the Companies Act, 2013. Prior approval of the Audit Committee is obtained for all Related Party Transactions. There were no materially significant transactions with related parties during the financial year which were in conflict with the interest of the Company. Related Party Transactions during the year have been disclosed in notes on financial statements as per the requirement of “Indian Accounting Standards (Ind AS)-24 Related Party Disclosure” issued by ICAI.
The Board has approved a policy for related party transactions which has been placed on Companys' website: www.hester.in
B) Code of Conduct
The Company has laid down a Code of Conduct for all Board Members and Senior Management Personnel in Compliance with Part-D under Schedule V of SEBI (LODR) Regulations, 2015. The Code of Conduct is available on the website of the Company: www.hester.in. All Board Members and the Senior Management Personnel have affirmed compliance with the Code of Conduct for the year ended on 31 March 2018 under review. The declaration of CEO & Managing Director is given below:
To the Shareholders of Hester Biosciences Limited
Subject: Compliance with Code of Conduct
I hereby declare that all the Board Members and Senior Management Personnel have affirmed compliance with the Code of Conduct as adopted by the Board of Directors.
Place: Ahmedabad Rajiv GandhiDate: 14 May 2018 CEO & Managing Director
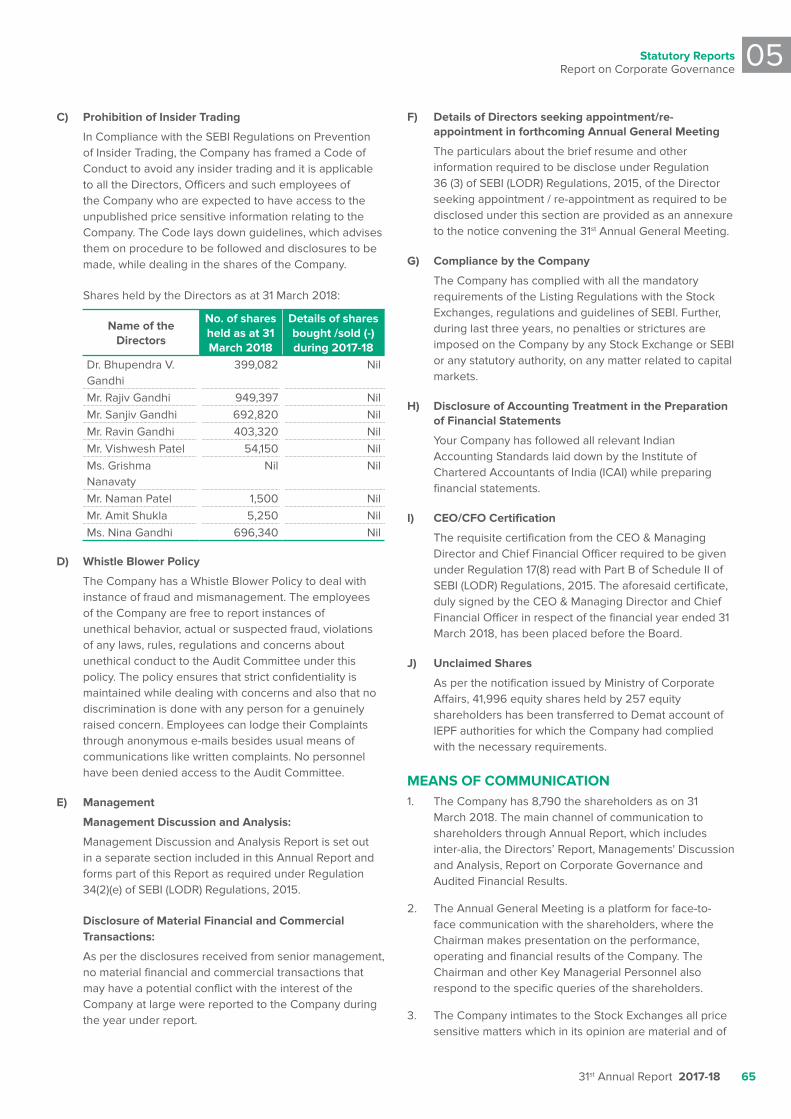
Statutory reportsReport on Corporate Governance
05
31st Annual Report 2017-18 65
C) Prohibition of Insider Trading
In Compliance with the SEBI Regulations on Prevention of Insider Trading, the Company has framed a Code of Conduct to avoid any insider trading and it is applicable to all the Directors, Officers and such employees of the Company who are expected to have access to the unpublished price sensitive information relating to the Company. The Code lays down guidelines, which advises them on procedure to be followed and disclosures to be made, while dealing in the shares of the Company.
Shares held by the Directors as at 31 March 2018:
Name of the Directors
No. of shares held as at 31 March 2018
Details of shares bought /sold (-) during 2017-18
Dr. Bhupendra V. Gandhi
399,082 Nil
Mr. Rajiv Gandhi 949,397 NilMr. Sanjiv Gandhi 692,820 NilMr. Ravin Gandhi 403,320 NilMr. Vishwesh Patel 54,150 NilMs. Grishma Nanavaty
Nil Nil
Mr. Naman Patel 1,500 NilMr. Amit Shukla 5,250 NilMs. Nina Gandhi 696,340 Nil
D) Whistle Blower Policy
The Company has a Whistle Blower Policy to deal with instance of fraud and mismanagement. The employees of the Company are free to report instances of unethical behavior, actual or suspected fraud, violations of any laws, rules, regulations and concerns about unethical conduct to the Audit Committee under this policy. The policy ensures that strict confidentiality is maintained while dealing with concerns and also that no discrimination is done with any person for a genuinely raised concern. Employees can lodge their Complaints through anonymous e-mails besides usual means of communications like written complaints. No personnel have been denied access to the Audit Committee.
E) Management
Management Discussion and Analysis:
Management Discussion and Analysis Report is set out in a separate section included in this Annual Report and forms part of this Report as required under Regulation 34(2)(e) of SEBI (LODR) Regulations, 2015.
Disclosure of Material Financial and Commercial Transactions:
As per the disclosures received from senior management, no material financial and commercial transactions that may have a potential conflict with the interest of the Company at large were reported to the Company during the year under report.
F) Details of Directors seeking appointment/re-appointment in forthcoming Annual General Meeting
The particulars about the brief resume and other information required to be disclose under Regulation 36 (3) of SEBI (LODR) Regulations, 2015, of the Director seeking appointment / re-appointment as required to be disclosed under this section are provided as an annexure to the notice convening the 31st Annual General Meeting.
G) Compliance by the Company
The Company has complied with all the mandatory requirements of the Listing Regulations with the Stock Exchanges, regulations and guidelines of SEBI. Further, during last three years, no penalties or strictures are imposed on the Company by any Stock Exchange or SEBI or any statutory authority, on any matter related to capital markets.
H) Disclosure of Accounting Treatment in the Preparation of Financial Statements
Your Company has followed all relevant Indian Accounting Standards laid down by the Institute of Chartered Accountants of India (ICAI) while preparing financial statements.
I) CEO/CFO Certification
The requisite certification from the CEO & Managing Director and Chief Financial Officer required to be given under Regulation 17(8) read with Part B of Schedule II of SEBI (LODR) Regulations, 2015. The aforesaid certificate, duly signed by the CEO & Managing Director and Chief Financial Officer in respect of the financial year ended 31 March 2018, has been placed before the Board.
J) Unclaimed Shares
As per the notification issued by Ministry of Corporate Affairs, 41,996 equity shares held by 257 equity shareholders has been transferred to Demat account of IEPF authorities for which the Company had complied with the necessary requirements.
MEANS OF COMMUNICATION1. The Company has 8,790 the shareholders as on 31
March 2018. The main channel of communication to shareholders through Annual Report, which includes inter-alia, the Directors’ Report, Managements' Discussion and Analysis, Report on Corporate Governance and Audited Financial Results.
2. The Annual General Meeting is a platform for face-to-face communication with the shareholders, where the Chairman makes presentation on the performance, operating and financial results of the Company. The Chairman and other Key Managerial Personnel also respond to the specific queries of the shareholders.
3. The Company intimates to the Stock Exchanges all price sensitive matters which in its opinion are material and of
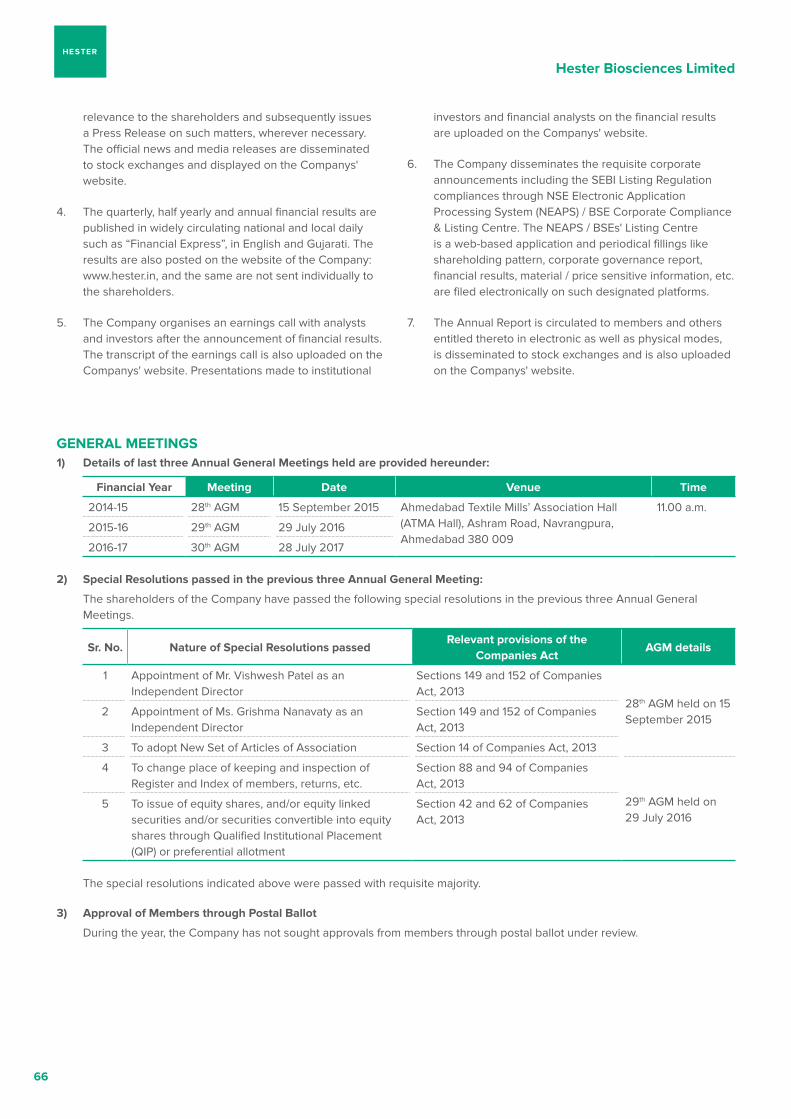
66
Hester Biosciences Limited
relevance to the shareholders and subsequently issues a Press Release on such matters, wherever necessary. The official news and media releases are disseminated to stock exchanges and displayed on the Companys' website.
4. The quarterly, half yearly and annual financial results are published in widely circulating national and local daily such as “Financial Express”, in English and Gujarati. The results are also posted on the website of the Company: www.hester.in, and the same are not sent individually to the shareholders.
5. The Company organises an earnings call with analysts and investors after the announcement of financial results. The transcript of the earnings call is also uploaded on the Companys' website. Presentations made to institutional
investors and financial analysts on the financial results are uploaded on the Companys' website.
6. The Company disseminates the requisite corporate announcements including the SEBI Listing Regulation compliances through NSE Electronic Application Processing System (NEAPS) / BSE Corporate Compliance & Listing Centre. The NEAPS / BSEs' Listing Centre is a web-based application and periodical fillings like shareholding pattern, corporate governance report, financial results, material / price sensitive information, etc. are filed electronically on such designated platforms.
7. The Annual Report is circulated to members and others entitled thereto in electronic as well as physical modes, is disseminated to stock exchanges and is also uploaded on the Companys' website.
GENERAL MEETINGS1) Details of last three Annual General Meetings held are provided hereunder:
Financial Year Meeting Date Venue Time
2014-15 28th AGM 15 September 2015 Ahmedabad Textile Mills’ Association Hall (ATMA Hall), Ashram Road, Navrangpura, Ahmedabad 380 009
11.00 a.m.
2015-16 29th AGM 29 July 2016
2016-17 30th AGM 28 July 2017
2) Special Resolutions passed in the previous three Annual General Meeting:
The shareholders of the Company have passed the following special resolutions in the previous three Annual General Meetings.
Sr. No. Nature of Special Resolutions passedRelevant provisions of the
Companies ActAGM details
1 Appointment of Mr. Vishwesh Patel as an Independent Director
Sections 149 and 152 of Companies Act, 2013
28th AGM held on 15 September 2015
2 Appointment of Ms. Grishma Nanavaty as an Independent Director
Section 149 and 152 of Companies Act, 2013
3 To adopt New Set of Articles of Association Section 14 of Companies Act, 2013
4 To change place of keeping and inspection of Register and Index of members, returns, etc.
Section 88 and 94 of Companies Act, 2013
29th AGM held on 29 July 2016
5 To issue of equity shares, and/or equity linked securities and/or securities convertible into equity shares through Qualified Institutional Placement (QIP) or preferential allotment
Section 42 and 62 of Companies Act, 2013
The special resolutions indicated above were passed with requisite majority.
3) Approval of Members through Postal Ballot
During the year, the Company has not sought approvals from members through postal ballot under review.
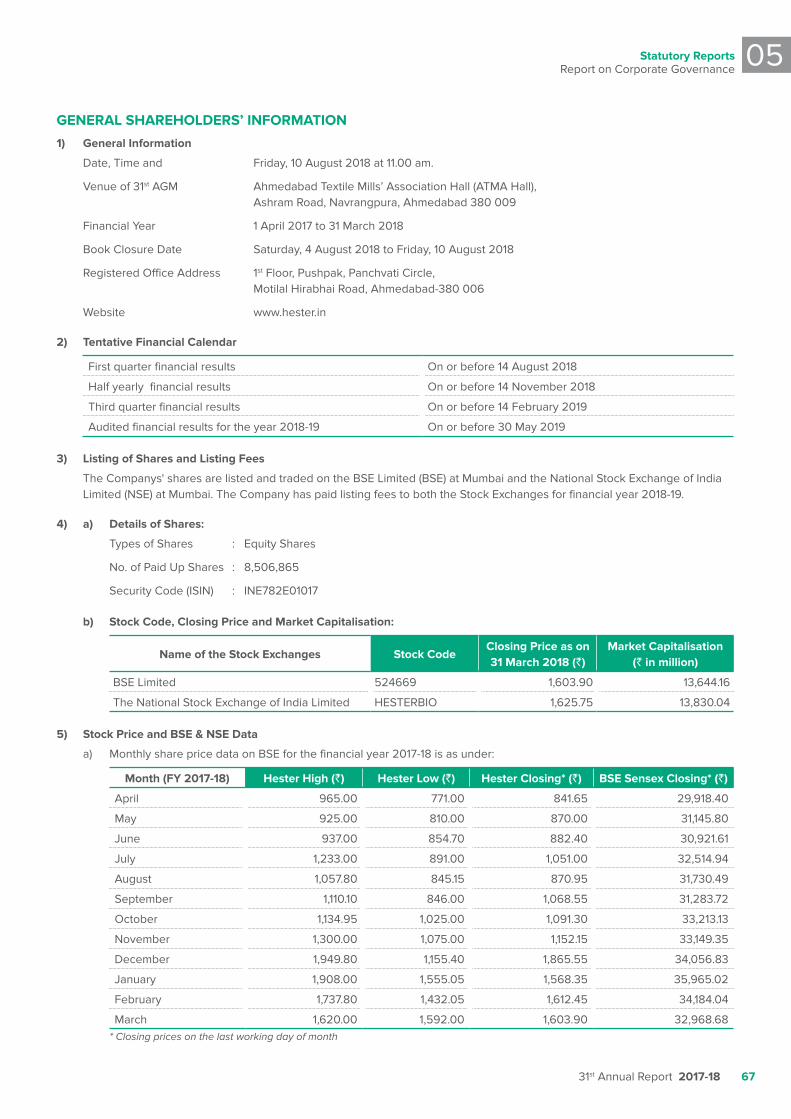
Statutory reportsReport on Corporate Governance
05
31st Annual Report 2017-18 67
GENERAL SHAREHOLDERS’ INFORMATION
1) General Information
Date, Time and Friday, 10 August 2018 at 11.00 am.
Venue of 31st AGM Ahmedabad Textile Mills’ Association Hall (ATMA Hall), Ashram Road, Navrangpura, Ahmedabad 380 009
Financial Year 1 April 2017 to 31 March 2018
Book Closure Date Saturday, 4 August 2018 to Friday, 10 August 2018
Registered Office Address 1st Floor, Pushpak, Panchvati Circle, Motilal Hirabhai Road, Ahmedabad-380 006
Website www.hester.in
2) Tentative Financial Calendar
First quarter financial results On or before 14 August 2018
Half yearly financial results On or before 14 November 2018
Third quarter financial results On or before 14 February 2019
Audited financial results for the year 2018-19 On or before 30 May 2019
3) Listing of Shares and Listing Fees
The Companys' shares are listed and traded on the BSE Limited (BSE) at Mumbai and the National Stock Exchange of India Limited (NSE) at Mumbai. The Company has paid listing fees to both the Stock Exchanges for financial year 2018-19.
4) a) Details of Shares:
Types of Shares : Equity Shares
No. of Paid Up Shares : 8,506,865
Security Code (ISIN) : INE782E01017
b) Stock Code, Closing Price and Market Capitalisation:
Name of the Stock Exchanges Stock CodeClosing Price as on 31 March 2018 (`)
Market Capitalisation (` in million)
BSE Limited 524669 1,603.90 13,644.16
The National Stock Exchange of India Limited HESTERBIO 1,625.75 13,830.04
5) Stock Price and BSE & NSE Data
a) Monthly share price data on BSE for the financial year 2017-18 is as under:
Month (FY 2017-18) Hester High (`) Hester Low (`) Hester Closing* (`) BSE Sensex Closing* (`)
April 965.00 771.00 841.65 29,918.40
May 925.00 810.00 870.00 31,145.80
June 937.00 854.70 882.40 30,921.61
July 1,233.00 891.00 1,051.00 32,514.94
August 1,057.80 845.15 870.95 31,730.49
September 1,110.10 846.00 1,068.55 31,283.72
October 1,134.95 1,025.00 1,091.30 33,213.13
November 1,300.00 1,075.00 1,152.15 33,149.35
December 1,949.80 1,155.40 1,865.55 34,056.83
January 1,908.00 1,555.05 1,568.35 35,965.02
February 1,737.80 1,432.05 1,612.45 34,184.04
March 1,620.00 1,592.00 1,603.90 32,968.68* Closing prices on the last working day of month
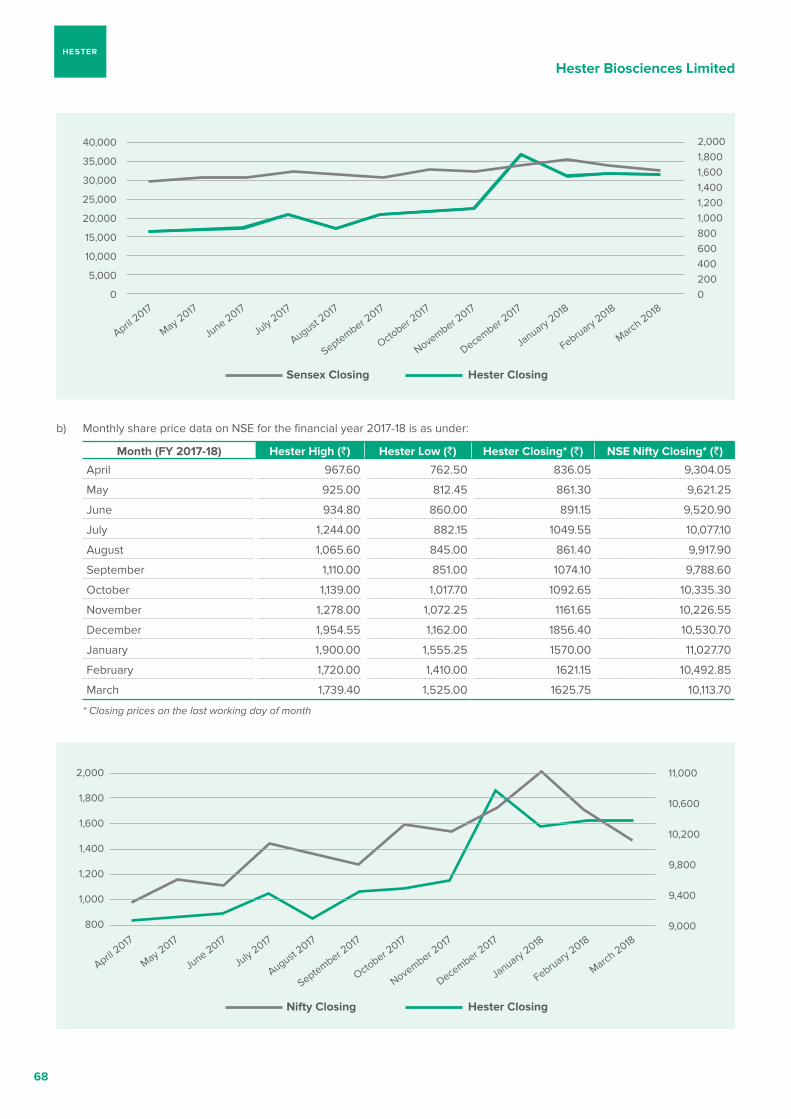
68
Hester Biosciences Limited
b) Monthly share price data on NSE for the financial year 2017-18 is as under:
Month (FY 2017-18) Hester High (`) Hester Low (`) Hester Closing* (`) NSE Nifty Closing* (`)
April 967.60 762.50 836.05 9,304.05
May 925.00 812.45 861.30 9,621.25
June 934.80 860.00 891.15 9,520.90
July 1,244.00 882.15 1049.55 10,077.10
August 1,065.60 845.00 861.40 9,917.90
September 1,110.00 851.00 1074.10 9,788.60
October 1,139.00 1,017.70 1092.65 10,335.30
November 1,278.00 1,072.25 1161.65 10,226.55
December 1,954.55 1,162.00 1856.40 10,530.70
January 1,900.00 1,555.25 1570.00 11,027.70
February 1,720.00 1,410.00 1621.15 10,492.85
March 1,739.40 1,525.00 1625.75 10,113.70
* Closing prices on the last working day of month
40,000
35,000
30,000
25,000
20,000
15,000
10,000
5,000
0
2,0001,8001,6001,4001,2001,0008006004002000
April 2017
May 2017
June 2017
July 2017
August 2017
September 2017
October 2017
November 2017
December 2017
January 2018
February 2018
March 2018
Sensex Closing Hester Closing
2,000
1,800
1,600
1,400
1,200
1,000
800
11,000
10,600
10,200
9,800
9,400
9,000
April 2017
May 2017
June 2017
July 2017
August 2017
September 2017
October 2017
November 2017
December 2017
January 2018
February 2018
March 2018
Nifty Closing Hester Closing
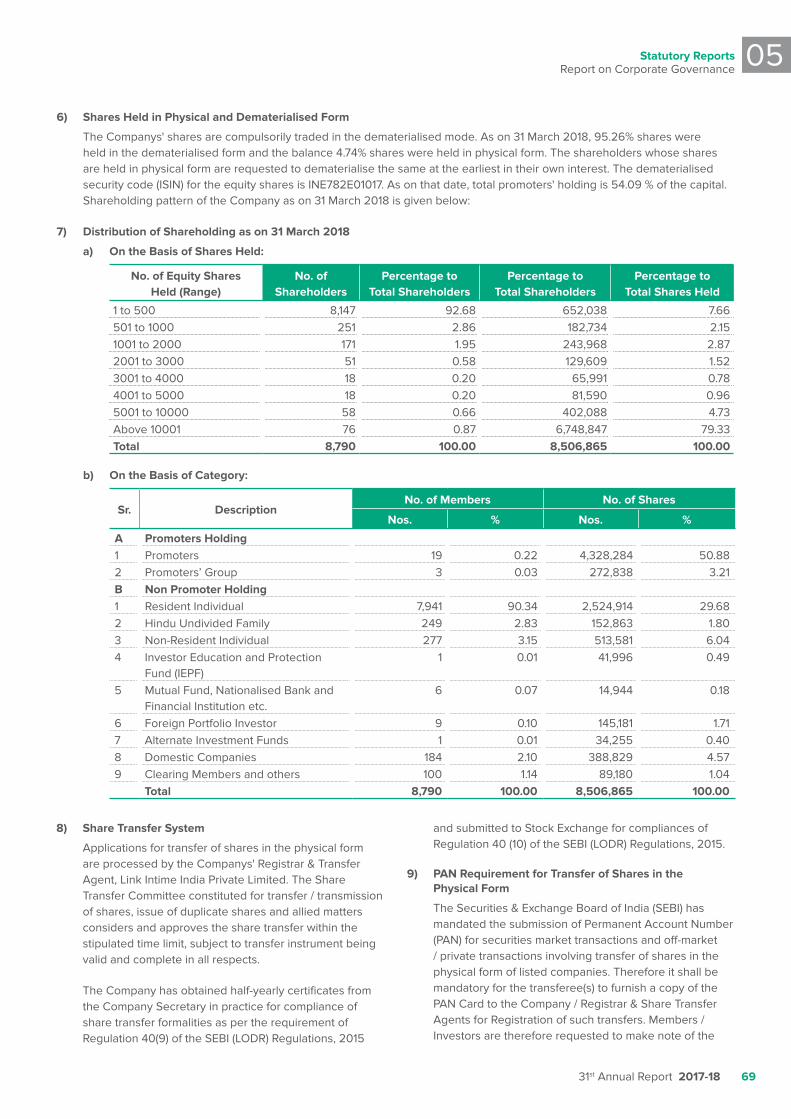
Statutory reportsReport on Corporate Governance
05
31st Annual Report 2017-18 69
6) Shares Held in Physical and Dematerialised Form
The Companys' shares are compulsorily traded in the dematerialised mode. As on 31 March 2018, 95.26% shares were held in the dematerialised form and the balance 4.74% shares were held in physical form. The shareholders whose shares are held in physical form are requested to dematerialise the same at the earliest in their own interest. The dematerialised security code (ISIN) for the equity shares is INE782E01017. As on that date, total promoters' holding is 54.09 % of the capital. Shareholding pattern of the Company as on 31 March 2018 is given below:
7) Distribution of Shareholding as on 31 March 2018
a) On the Basis of Shares Held:
No. of Equity Shares Held (Range)
No. of Shareholders
Percentage to Total Shareholders
Percentage to Total Shareholders
Percentage to Total Shares Held
1 to 500 8,147 92.68 652,038 7.66501 to 1000 251 2.86 182,734 2.151001 to 2000 171 1.95 243,968 2.872001 to 3000 51 0.58 129,609 1.523001 to 4000 18 0.20 65,991 0.784001 to 5000 18 0.20 81,590 0.965001 to 10000 58 0.66 402,088 4.73Above 10001 76 0.87 6,748,847 79.33Total 8,790 100.00 8,506,865 100.00
b) On the Basis of Category:
Sr. DescriptionNo. of Members No. of Shares
Nos. % Nos. %
A Promoters Holding1 Promoters 19 0.22 4,328,284 50.882 Promoters’ Group 3 0.03 272,838 3.21B Non Promoter Holding1 Resident Individual 7,941 90.34 2,524,914 29.682 Hindu Undivided Family 249 2.83 152,863 1.803 Non-Resident Individual 277 3.15 513,581 6.044 Investor Education and Protection
Fund (IEPF)1 0.01 41,996 0.49
5 Mutual Fund, Nationalised Bank and Financial Institution etc.
6 0.07 14,944 0.18
6 Foreign Portfolio Investor 9 0.10 145,181 1.717 Alternate Investment Funds 1 0.01 34,255 0.408 Domestic Companies 184 2.10 388,829 4.579 Clearing Members and others 100 1.14 89,180 1.04
Total 8,790 100.00 8,506,865 100.00
8) Share Transfer System
Applications for transfer of shares in the physical form are processed by the Companys' Registrar & Transfer Agent, Link Intime India Private Limited. The Share Transfer Committee constituted for transfer / transmission of shares, issue of duplicate shares and allied matters considers and approves the share transfer within the stipulated time limit, subject to transfer instrument being valid and complete in all respects.
The Company has obtained half-yearly certificates from the Company Secretary in practice for compliance of share transfer formalities as per the requirement of Regulation 40(9) of the SEBI (LODR) Regulations, 2015
and submitted to Stock Exchange for compliances of Regulation 40 (10) of the SEBI (LODR) Regulations, 2015.
9) PAN Requirement for Transfer of Shares in the Physical Form
The Securities & Exchange Board of India (SEBI) has mandated the submission of Permanent Account Number (PAN) for securities market transactions and off-market / private transactions involving transfer of shares in the physical form of listed companies. Therefore it shall be mandatory for the transferee(s) to furnish a copy of the PAN Card to the Company / Registrar & Share Transfer Agents for Registration of such transfers. Members / Investors are therefore requested to make note of the
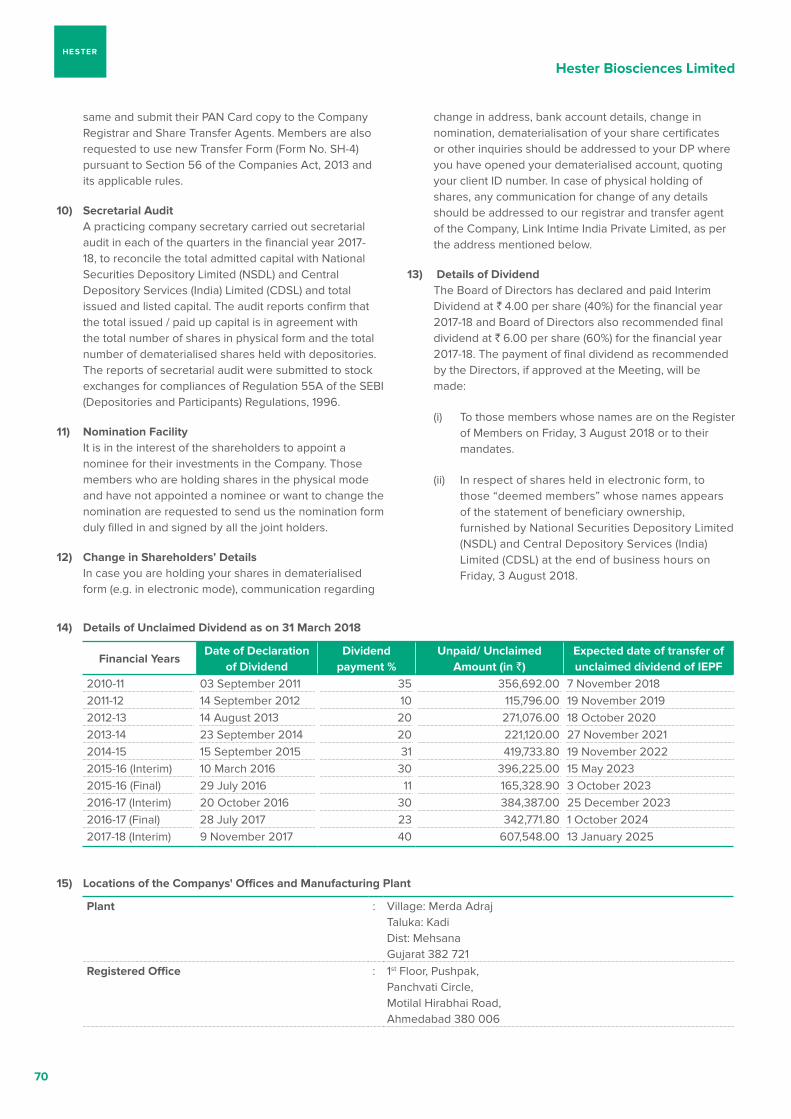
70
Hester Biosciences Limited
same and submit their PAN Card copy to the Company Registrar and Share Transfer Agents. Members are also requested to use new Transfer Form (Form No. SH-4) pursuant to Section 56 of the Companies Act, 2013 and its applicable rules.
10) Secretarial Audit A practicing company secretary carried out secretarial
audit in each of the quarters in the financial year 2017-18, to reconcile the total admitted capital with National Securities Depository Limited (NSDL) and Central Depository Services (India) Limited (CDSL) and total issued and listed capital. The audit reports confirm that the total issued / paid up capital is in agreement with the total number of shares in physical form and the total number of dematerialised shares held with depositories. The reports of secretarial audit were submitted to stock exchanges for compliances of Regulation 55A of the SEBI (Depositories and Participants) Regulations, 1996.
11) Nomination Facility It is in the interest of the shareholders to appoint a
nominee for their investments in the Company. Those members who are holding shares in the physical mode and have not appointed a nominee or want to change the nomination are requested to send us the nomination form duly filled in and signed by all the joint holders.
12) Change in Shareholders’ Details In case you are holding your shares in dematerialised
form (e.g. in electronic mode), communication regarding
change in address, bank account details, change in nomination, dematerialisation of your share certificates or other inquiries should be addressed to your DP where you have opened your dematerialised account, quoting your client ID number. In case of physical holding of shares, any communication for change of any details should be addressed to our registrar and transfer agent of the Company, Link Intime India Private Limited, as per the address mentioned below.
13) Details of Dividend The Board of Directors has declared and paid Interim
Dividend at ` 4.00 per share (40%) for the financial year 2017-18 and Board of Directors also recommended final dividend at ` 6.00 per share (60%) for the financial year 2017-18. The payment of final dividend as recommended by the Directors, if approved at the Meeting, will be made:
(i) To those members whose names are on the Register of Members on Friday, 3 August 2018 or to their mandates.
(ii) In respect of shares held in electronic form, to those “deemed members” whose names appears of the statement of beneficiary ownership, furnished by National Securities Depository Limited (NSDL) and Central Depository Services (India) Limited (CDSL) at the end of business hours on Friday, 3 August 2018.
14) Details of Unclaimed Dividend as on 31 March 2018
Financial Years Date of Declaration
of DividendDividend
payment %Unpaid/ Unclaimed
Amount (in `)Expected date of transfer of unclaimed dividend of IEPF
2010-11 03 September 2011 35 356,692.00 7 November 20182011-12 14 September 2012 10 115,796.00 19 November 20192012-13 14 August 2013 20 271,076.00 18 October 20202013-14 23 September 2014 20 221,120.00 27 November 20212014-15 15 September 2015 31 419,733.80 19 November 20222015-16 (Interim) 10 March 2016 30 396,225.00 15 May 20232015-16 (Final) 29 July 2016 11 165,328.90 3 October 20232016-17 (Interim) 20 October 2016 30 384,387.00 25 December 20232016-17 (Final) 28 July 2017 23 342,771.80 1 October 20242017-18 (Interim) 9 November 2017 40 607,548.00 13 January 2025
15) Locations of the Companys' Offices and Manufacturing Plant
Plant : Village: Merda Adraj Taluka: Kadi Dist: Mehsana Gujarat 382 721
Registered Office : 1st Floor, Pushpak, Panchvati Circle, Motilal Hirabhai Road, Ahmedabad 380 006
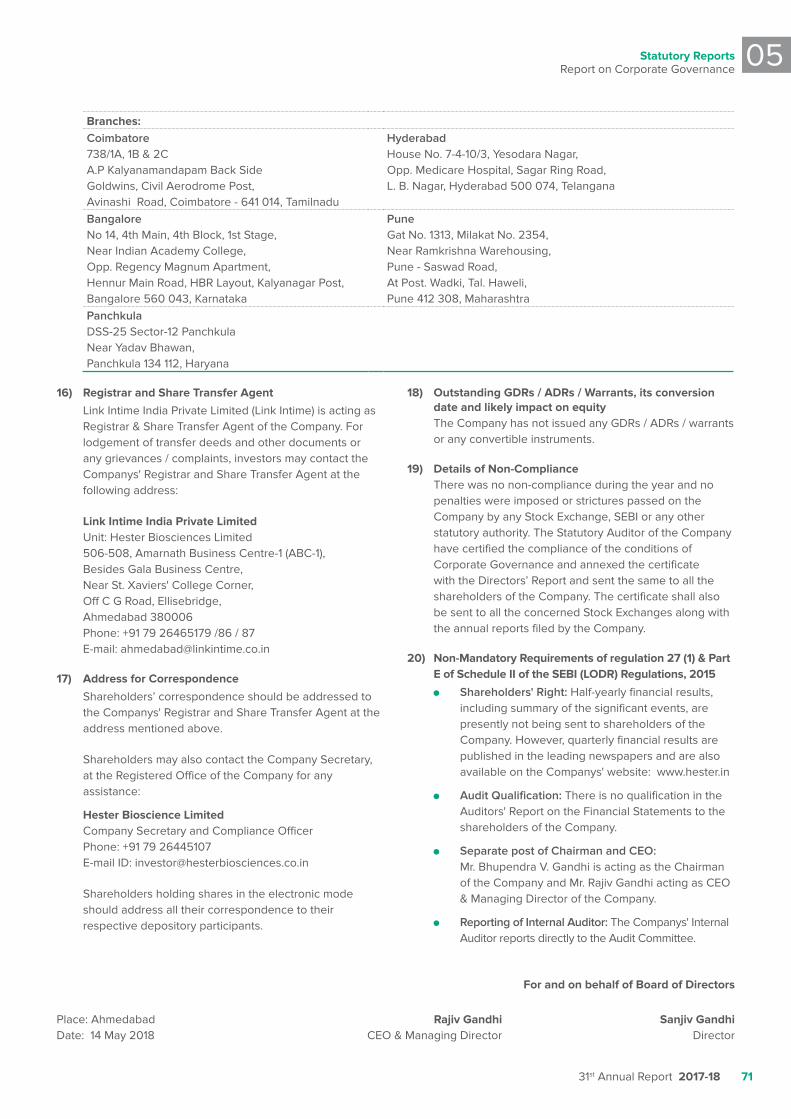
Statutory reportsReport on Corporate Governance
05
31st Annual Report 2017-18 71
Branches:Coimbatore 738/1A, 1B & 2C A.P Kalyanamandapam Back Side Goldwins, Civil Aerodrome Post, Avinashi Road, Coimbatore - 641 014, Tamilnadu
Hyderabad House No. 7-4-10/3, Yesodara Nagar, Opp. Medicare Hospital, Sagar Ring Road, L. B. Nagar, Hyderabad 500 074, Telangana
BangaloreNo 14, 4th Main, 4th Block, 1st Stage, Near Indian Academy College,Opp. Regency Magnum Apartment,Hennur Main Road, HBR Layout, Kalyanagar Post, Bangalore 560 043, Karnataka
Pune Gat No. 1313, Milakat No. 2354,Near Ramkrishna Warehousing,Pune - Saswad Road,At Post. Wadki, Tal. Haweli, Pune 412 308, Maharashtra
PanchkulaDSS-25 Sector-12 PanchkulaNear Yadav Bhawan,Panchkula 134 112, Haryana
16) Registrar and Share Transfer Agent Link Intime India Private Limited (Link Intime) is acting as
Registrar & Share Transfer Agent of the Company. For lodgement of transfer deeds and other documents or any grievances / complaints, investors may contact the Companys' Registrar and Share Transfer Agent at the following address:
Link Intime India Private Limited Unit: Hester Biosciences Limited 506-508, Amarnath Business Centre-1 (ABC-1), Besides Gala Business Centre, Near St. Xaviers' College Corner, Off C G Road, Ellisebridge, Ahmedabad 380006 Phone: +91 79 26465179 /86 / 87 E-mail: [email protected]
17) Address for Correspondence Shareholders’ correspondence should be addressed to
the Companys' Registrar and Share Transfer Agent at the address mentioned above.
Shareholders may also contact the Company Secretary, at the Registered Office of the Company for any assistance:
Hester Bioscience Limited Company Secretary and Compliance Officer Phone: +91 79 26445107 E-mail ID: [email protected]
Shareholders holding shares in the electronic mode should address all their correspondence to their respective depository participants.
18) Outstanding GDRs / ADRs / Warrants, its conversion date and likely impact on equity
The Company has not issued any GDRs / ADRs / warrants or any convertible instruments.
19) Details of Non-Compliance There was no non-compliance during the year and no
penalties were imposed or strictures passed on the Company by any Stock Exchange, SEBI or any other statutory authority. The Statutory Auditor of the Company have certified the compliance of the conditions of Corporate Governance and annexed the certificate with the Directors’ Report and sent the same to all the shareholders of the Company. The certificate shall also be sent to all the concerned Stock Exchanges along with the annual reports filed by the Company.
20) Non-Mandatory Requirements of regulation 27 (1) & Part E of Schedule II of the SEBI (LODR) Regulations, 2015
Shareholders' Right: Half-yearly financial results, including summary of the significant events, are presently not being sent to shareholders of the Company. However, quarterly financial results are published in the leading newspapers and are also available on the Companys' website: www.hester.in
Audit Qualification: There is no qualification in the Auditors' Report on the Financial Statements to the shareholders of the Company.
Separate post of Chairman and CEO: Mr. Bhupendra V. Gandhi is acting as the Chairman of the Company and Mr. Rajiv Gandhi acting as CEO & Managing Director of the Company.
Reporting of Internal Auditor: The Companys' Internal Auditor reports directly to the Audit Committee.
For and on behalf of Board of Directors
Place: Ahmedabad Rajiv Gandhi Sanjiv GandhiDate: 14 May 2018 CEO & Managing Director Director

72
Hester Biosciences Limited
CEO & MANAGING DIRECTOR & CHIEF FINANCIAL OFFICER CERTIFICATION
To,Board of DirectorsHester Biosciences LimitedAhmedabad
As required under the Regulation 17 (8) of the SEBI (Listing Obligations and Disclosure Requirements) Regulations, 2015 (the Listing Regulations) read with Schedule II part B of the Listing Regulations, we hereby certify that;
1. We have reviewed the Balance Sheet and Profit and Loss account, its schedule and notes to the accounts and cash flow statements for the year ended 31 March 2018 and that to the best of our knowledge and belief:
a. These statements do not contain any materially untrue statement or omit any material fact or contain statements that may be misleading;
b. These statements together present a true and fair view of the Companys' affairs and are in compliance with existing accounting standards, applicable laws and regulations.
2. We also certify that based on our knowledge and information provided to us, there are no transactions entered into by the Company during the year which are fraudulent, illegal or violate the Companys' Code of Conduct.
3. We accept the responsibilities for establishing and maintaining internal controls for financial reporting and that we have evaluated the effectiveness of internal control systems of the Company pertaining to financial reporting and we have disclosed to the auditors and the Audit Committee, deficiencies in the design or operation of such internal controls, if any, of which we are aware and the steps taken or propose to take to rectify these deficiencies.
4. We have indicated to the Auditors and the Audit Committee:
a. Significant change in internal control over financial reporting during the year.
b. Significant changes in accounting policies during the year and that the same have been disclosed in notes to the financial statements; and
c. Instances of significant fraud of which we have become aware and involvement therein, if any, of the management or an employee having a significant role in the Companys' internal control system over financial reporting.
Place: Ahmedabad Rajiv Gandhi Jigar ShahDate: 14 May 2018 CEO & Managing Director Chief Financial Officer
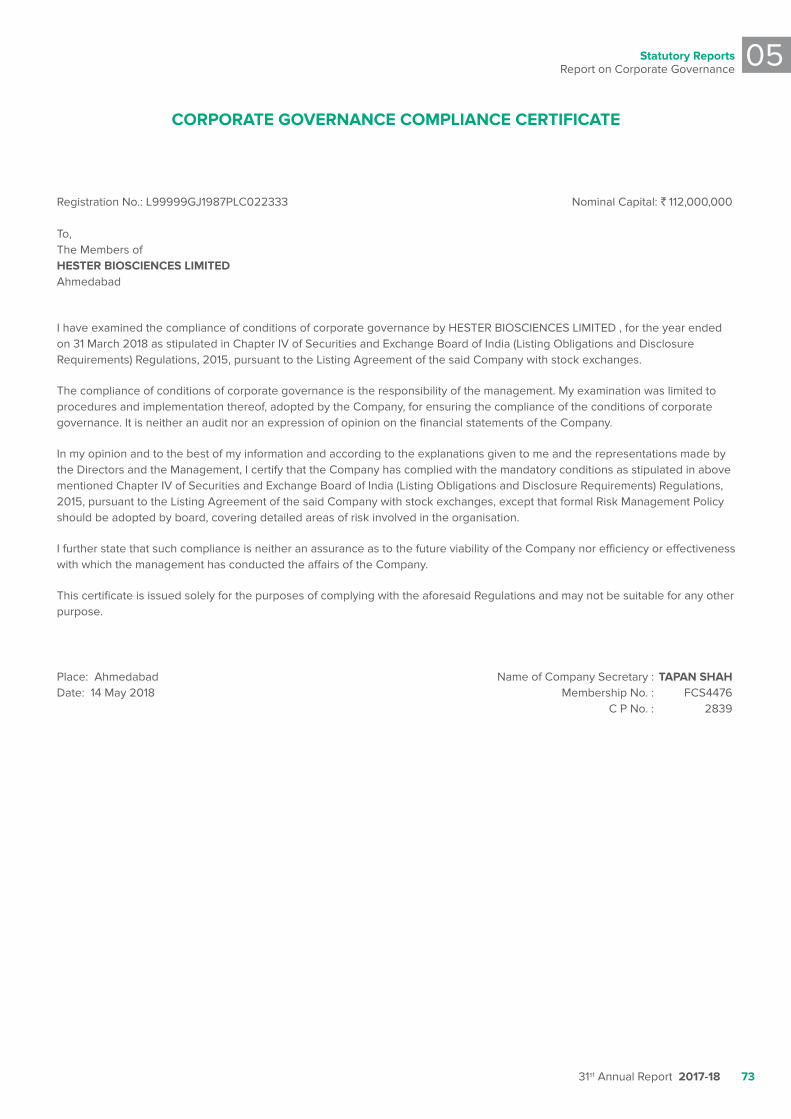
Statutory reportsReport on Corporate Governance
05
31st Annual Report 2017-18 73
CORPORATE GOVERNANCE COMPLIANCE CERTIFICATE
Registration No.: L99999GJ1987PLC022333 Nominal Capital: ` 112,000,000
To,The Members ofHESTER BIOSCIENCES LIMITEDAhmedabad
I have examined the compliance of conditions of corporate governance by HESTER BIOSCIENCES LIMITED , for the year ended on 31 March 2018 as stipulated in Chapter IV of Securities and Exchange Board of India (Listing Obligations and Disclosure Requirements) Regulations, 2015, pursuant to the Listing Agreement of the said Company with stock exchanges.
The compliance of conditions of corporate governance is the responsibility of the management. My examination was limited to procedures and implementation thereof, adopted by the Company, for ensuring the compliance of the conditions of corporate governance. It is neither an audit nor an expression of opinion on the financial statements of the Company.
In my opinion and to the best of my information and according to the explanations given to me and the representations made by the Directors and the Management, I certify that the Company has complied with the mandatory conditions as stipulated in above mentioned Chapter IV of Securities and Exchange Board of India (Listing Obligations and Disclosure Requirements) Regulations, 2015, pursuant to the Listing Agreement of the said Company with stock exchanges, except that formal Risk Management Policy should be adopted by board, covering detailed areas of risk involved in the organisation.
I further state that such compliance is neither an assurance as to the future viability of the Company nor efficiency or effectiveness with which the management has conducted the affairs of the Company.
This certificate is issued solely for the purposes of complying with the aforesaid Regulations and may not be suitable for any other purpose.
Place: Ahmedabad Name of Company Secretary : TAPAN SHAHDate: 14 May 2018 Membership No. : FCS4476 C P No. : 2839
06
Financial Statements
Standalone Financial Statements 75
Consolidated Financial Statements 120
Ten Year Financial Statistics 165
Financial StatementsStandalone
06
31st Annual Report 2017-18 75
To the Members of HESTER BIOSCIENCES LIMITED
REpORT ON THE STaNDaLONE FINaNCIaL STaTEMENTSWe have audited the accompanying standalone financial statements of HESTER BIOSCIENCES LIMITED (“the Company”), which comprise the Balance Sheet as at 31 March 2018, the Statement of Profit and Loss (including other comprehensive income), the Cash Flow Statement and Statement of Changes in Equity for the year then ended, and a summary of significant accounting policies and other explanatory information.
MaNagEMENTS’ RESpONSIBILITy FOR THE STaNDaLONE FINaNCIaL STaTEMENTSThe Companys’ Board of Directors are responsible for the matters stated in Section 134(5) of the Companies Act, 2013 (“the Act”) with respect to the preparation of these standalone financial statements to give a true and fair view of the financial position, financial performance including other comprehensive income, cash flow and changes in equity of the Company in accordance with the Indian Accounting Standards (Ind AS) prescribed under Section 133 of the Act, read with the Companies (Indian Accounting Standards) Rules, 2015, as amended, and other accounting principles generally accepted in India.
This responsibility also includes maintenance of adequate accounting records in accordance with the provisions of the Act for safeguarding of the assets of the Company and for preventing and detecting the frauds and other irregularities; selection and application of appropriate accounting policies; making judgments and estimates that are reasonable and prudent; and design, implementation and maintenance of adequate internal financial controls, those were operating effectively for ensuring the accuracy and completeness of the accounting records, relevant to the preparation and presentation of the financial statements that give a true and fair view and are free from material misstatement, whether due to fraud or error.
auDITORS’ RESpONSIBILITyOur responsibility is to express an opinion on these standalone financial statements based on our audit. In conducting our audit, we have taken into account the provisions of the Act, the accounting and auditing standards and matters which are required to be included in the audit report under the provisions of the Act and the Rules made thereunder.
We conducted our audit of the standalone financial statements in accordance with the Standards on Auditing specified under section 143(10) of the Act. Those Standards require that we comply with ethical requirements and plan and perform
the audit to obtain reasonable assurance about whether the standalone financial statements are free from material misstatements.
An audit involves performing procedures to obtain audit evidence about the amounts and disclosures in the standalone financial statements. The procedures selected depend on the auditors’ judgment, including the assessment of the risks of material misstatement of the standalone financial statements, whether due to fraud or error. In making those risk assessments, the auditor considers internal control relevant to the Companys’ preparation of the standalone financial statements that give true and fair view in order to design audit procedures that are appropriate in the circumstances. An audit also includes evaluating the appropriateness of accounting policies used and the reasonableness of the accounting estimates made by the Companys’ Directors, as well as evaluating the overall presentation of the standalone financial statements.
We believe that the audit evidence we have obtained is sufficient and appropriate to provide a basis for our audit opinion on the standalone financial statements.
OpINIONIn our opinion and to the best of our information and according to the explanations given to us, the aforesaid standalone financial statements give the information required by the Act in the manner so required and give a true and fair view in conformity with the accounting principles generally accepted in India, of the state of affairs of the Company as at 31 March 2018, and its profit, total comprehensive income, its cash flows and the changes in equity for the year ended on that date.
REpORT ON OTHER LEgaL & REguLaTORy REquIREMENTS1. As required by the Companies (Auditors’ Report) Order,
2016 (‘the Order’) issued by the Central Government of India in terms of sub-section (11) of Section 143 of the Act, we give in the “Annexure A’’, a statement on the matters specified in the paragraph 3 and 4 of the order.
2. As required by Section 143(3) of the Act, based on our audit, we report that:
a. We have sought and obtained all the information and explanations which to the best of our knowledge and belief were necessary for the purpose of our audit.
b. In our opinion, proper books of account as required by law have been kept by the Company so far as it appears from our examination of those books.
c. The Balance Sheet, the Statement of Profit and Loss including other comprehensive income, the Cash Flow Statement and Statement of Changes in Equity
Independent AudItors’ report
Hester Biosciences Limited
76
dealt with by this Report are in agreement with the books of account.
d. In our opinion, the aforesaid standalone financial statements comply with the Indian Accounting Standards specified under Section 133 of the Act.
e. On the basis of the written representations received from the directors as on 31 March 2018, taken on record by the Board of Directors, none of the directors is disqualified as on 31 March 2018, from being appointed as a director in terms of Section 164(2) of the Act.
f. With respect to the adequacy of the internal financial controls over financial reporting of the Company and the operating effectiveness of such controls, refer to our separate report in ‘’Annexure-B’’; and Our report expresses an unmodified opinion on the adequacy and operating effectiveness of the Companys’ internal financial controls over financial reporting.
g. With respect to the other matters to be included In the Auditors’ Report in accordance with Rule 11 of the Companies (Audit and Auditors) Rules, 2014, as amended, in our opinion and to the best of our
information and according to explanations given to us:
i) The Company has disclosed the impact of pending litigations on its financial position in its standalone financial statements.
ii) The Company did not have any long-term contracts including derivative contracts for which there were any material foreseeable losses.
iii) There has been no delay in transferring amounts, required to be transferred, to the Investor Education and Protection Fund by the Company.
For apaji amin & Co. LLpChartered Accountants
Firm Registration No.: 100513W/W100062
Tehmul B. Sethnaplace : ahmedabad PartnerDate : 14 May 2018 Membership No: 035476
Financial StatementsStandalone
06
31st Annual Report 2017-18 77
The Annexure referred to in Independent Auditors’ Report to the members of the Company on the standalone financial statements for the year ended 31 March 2018, we report that
i) In respect of Fixed assets: a) The Company has maintained proper records
showing full particulars, including quantitative details and situation of Property, Plant & Equipment.
b) The Company has a regular program of physical verification of its Property, Plant & Equipment by which all fixed assets are verified in phased manner by the management during the year, which in our opinion is reasonable, having regards to the size of the Company and nature of the assets. No material discrepancies were noticed on such physical verification.
c) According to the information and explanations given to us and on the basis of our examination of the records of the Company, the title deeds of immovable properties are held in the name of the Company.
ii) As explained to us, physical verification of the inventories have been conducted at reasonable intervals by the management, which in our opinion is reasonable, having regard to the size of the Company and nature of its inventories. No material discrepancies were noticed on such physical verification.
iii) The Company has granted unsecured loans to one subsidiary company covered in the register maintained under Section 189 of the Act. There are no Firms, Limited Liability Partnership and Other parties covered in the register maintained under section 189 of the Act.
(a) In respect of the aforesaid loan, the terms and conditions under which such loans were granted are not prejudicial to Companys’ interest.
(b) In respect of aforesaid loan, no schedule for repayment of principal and payment of interest has been stipulated by the Company. Therefore, in the
absence of stipulation of repayment terms, we don’t make any comment in the regularity of repayment of principal and payment of interest.
(c) In respect of the aforesaid loan, there is no amount which is overdue for more than ninety days.
iv) In our opinion and according to the information and explanations given to us, the Company has complied with the provisions of Section 185 and 186 of the Act in respect of grant of loans, making investments and providing guarantees and securities, as applicable.
v) According to information and explanation given to us, the company has not accepted any deposits from the public in accordance with the provisions of sections 73 to 76 of the Act and rules framed there under.
vi) We have broadly reviewed the cost records maintained by the company pursuant to the rules made by the Central Government for the maintenance of cost records under section 148(1) of the Act and are of the opinion that, the prescribed accounts and cost records have been made and maintained. We have not, however, made a detailed examination of the same.
vii) In respect of Statuary due: (a) The Company has generally been regular in
depositing undisputed statutory dues, including Provident Fund, Employees’ State Insurance, Income-tax, Sales Tax, Service Tax, Goods and Service Tax, Customs Duty, Excise Duty, Value Added Tax, Cess and other material statutory dues applicable to it to the appropriate authorities.
(b) There were no undisputed amounts payable in respect of Provident Fund, Employees’ State Insurance, Income-tax, Sales Tax, Service Tax, Goods and Service Tax, Value Added Tax, Customs Duty, Excise Duty, Value Added Tax, Cess and other material statutory dues in arrears as at 31 March 2018 for a period of more than six months from the date they became payable.
aNNExuRE a TO THE INDEpENDENT auDITORS’ REpORT
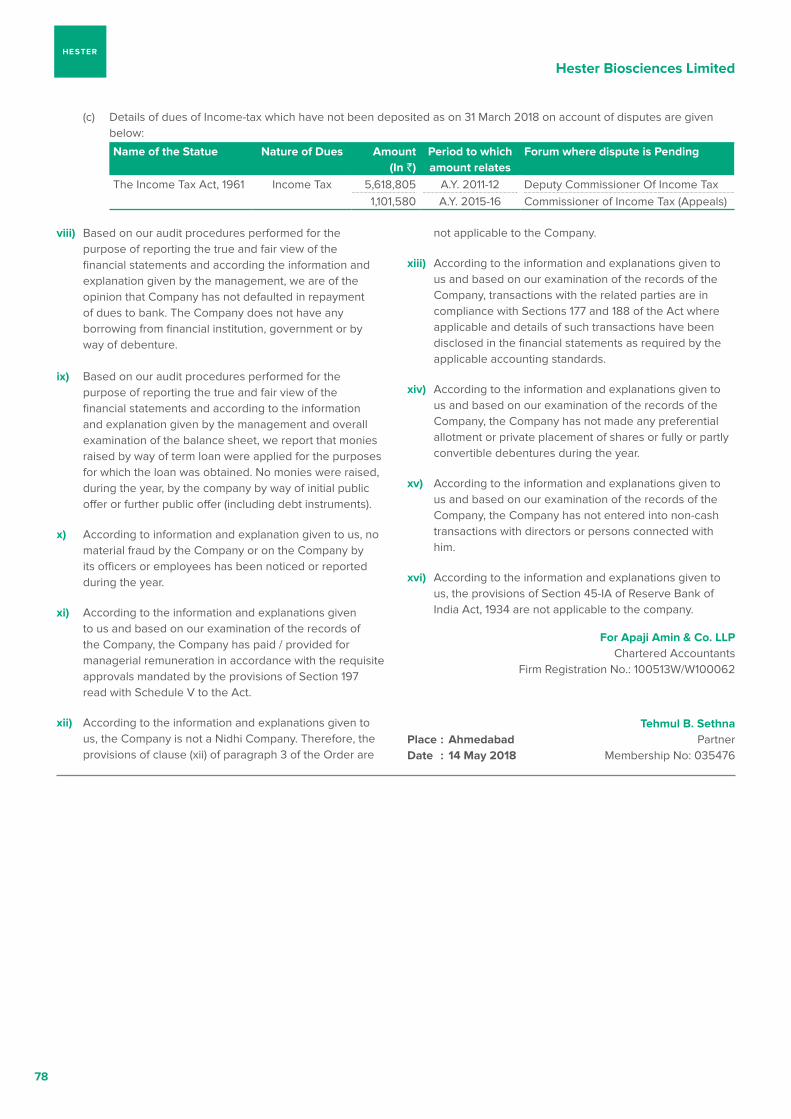
Hester Biosciences Limited
78
viii) Based on our audit procedures performed for the purpose of reporting the true and fair view of the financial statements and according the information and explanation given by the management, we are of the opinion that Company has not defaulted in repayment of dues to bank. The Company does not have any borrowing from financial institution, government or by way of debenture.
ix) Based on our audit procedures performed for the purpose of reporting the true and fair view of the financial statements and according to the information and explanation given by the management and overall examination of the balance sheet, we report that monies raised by way of term loan were applied for the purposes for which the loan was obtained. No monies were raised, during the year, by the company by way of initial public offer or further public offer (including debt instruments).
x) According to information and explanation given to us, no material fraud by the Company or on the Company by its officers or employees has been noticed or reported during the year.
xi) According to the information and explanations given to us and based on our examination of the records of the Company, the Company has paid / provided for managerial remuneration in accordance with the requisite approvals mandated by the provisions of Section 197 read with Schedule V to the Act.
xii) According to the information and explanations given to us, the Company is not a Nidhi Company. Therefore, the provisions of clause (xii) of paragraph 3 of the Order are
not applicable to the Company.
xiii) According to the information and explanations given to us and based on our examination of the records of the Company, transactions with the related parties are in compliance with Sections 177 and 188 of the Act where applicable and details of such transactions have been disclosed in the financial statements as required by the applicable accounting standards.
xiv) According to the information and explanations given to us and based on our examination of the records of the Company, the Company has not made any preferential allotment or private placement of shares or fully or partly convertible debentures during the year.
xv) According to the information and explanations given to us and based on our examination of the records of the Company, the Company has not entered into non-cash transactions with directors or persons connected with him.
xvi) According to the information and explanations given to us, the provisions of Section 45-IA of Reserve Bank of India Act, 1934 are not applicable to the company.
For apaji amin & Co. LLpChartered Accountants
Firm Registration No.: 100513W/W100062
Tehmul B. Sethnaplace : ahmedabad PartnerDate : 14 May 2018 Membership No: 035476
(c) Details of dues of Income-tax which have not been deposited as on 31 March 2018 on account of disputes are given below:
Name of the Statue Nature of Dues amount(In `)
period to which amount relates
Forum where dispute is pending
The Income Tax Act, 1961 Income Tax 5,618,805 A.Y. 2011-12 Deputy Commissioner Of Income Tax1,101,580 A.Y. 2015-16 Commissioner of Income Tax (Appeals)
Financial StatementsStandalone
06
31st Annual Report 2017-18 79
REpORT ON THE INTERNaL FINaNCIaL CONTROLS uNDER CLauSE (I) OF SuB-SECTION 3 OF SECTION 143 OF THE COMpaNIES aCT, 2013 (‘THE aCT’)We have audited the internal financial controls over financial reporting of Hester Biosciences Limited (‘the Company’) as of 31 March 2018 in conjunction with our audit of the standalone financial statements of the Company for the year ended on that date.
MaNagEMENTS’ RESpONSIBILITy FOR INTERNaL FINaNCIaL CONTROLSThe Companys’ management is responsible for establishing and maintaining internal financial controls based on the internal control over financial reporting criteria established by the Company considering the essential components of internal control stated in the Guidance Note on Audit of Internal Financial Controls over Financial Reporting issued by the Institute of Chartered Accountants of India (‘ICAI’). These responsibilities include the design, implementation and maintenance of adequate internal financial controls that were operating effectively for ensuring the orderly and efficient conduct of its business, including adherence to the Companys’ policies, the safeguarding of its assets, the prevention and detection of frauds and errors, the accuracy and completeness of the accounting records, and the timely preparation of reliable financial information, as required under the Companies Act, 2013.
auDITORS’ RESpONSIBILITyOur responsibility is to express an opinion on the Companys’ internal financial controls over financial reporting based on our audit. We conducted our audit in accordance with the Guidance Note on Audit of Internal Financial Controls over Financial Reporting (the ‘Guidance Note’) and the Standards on Auditing, issued by ICAI and deemed to be prescribed under Section 143(10) of the Companies Act, 2013, to the extent applicable to an audit of internal financial controls, both applicable to an audit of Internal Financial Controls and, both issued by the Institute of Chartered Accountants of India. Those Standards and the Guidance Note require that we comply with ethical requirements and plan and perform the audit to obtain reasonable assurance about whether adequate
aNNExuRE B TO THE auDITORS’ REpORT
internal financial controls over financial reporting were established and maintained and if such controls operated effectively in all material respects.
Our audit involves performing procedures to obtain audit evidence about the adequacy of the internal financial controls system over financial reporting and their operating effectiveness. Our audit of internal financial controls over financial reporting included obtaining an understanding of internal financial controls over financial reporting, assessing the risk that a material weakness exists, and testing and evaluating the design and operating effectiveness of internal control based on the assessed risk. The procedures selected depend on the auditors’ judgment, including the assessment of the risks of material misstatement of the financial statements, whether due to fraud or error.
We believe that the audit evidence we have obtained is sufficient and appropriate to provide a basis for our audit opinion on the Companys’ internal financial controls system over financial reporting.
MEaNINg OF INTERNaL FINaNCIaL CONTROLS OvER FINaNCIaL REpORTINgA Companys’ internal financial control over financial reporting is a process designed to provide reasonable assurance regarding the reliability of financial reporting and the preparation of financial statements for external purposes in accordance with generally accepted accounting principles. A Companys’ internal financial control over financial reporting includes those policies and procedures that (1) pertain to the maintenance of records that, in reasonable detail, accurately and fairly reflect the transactions and dispositions of the assets of the Company; (2) provide reasonable assurance that transactions are recorded as necessary to permit preparation of financial statements in accordance with generally accepted accounting principles, and that receipts and expenditures of the Company are being made only in accordance with authorisations of the Management and directors of the Company; and (3) provide reasonable assurance regarding prevention or timely detection of unauthorised acquisition, use, or disposition of the Companys’ assets that could have a material effect on the financial statements.
Hester Biosciences Limited
80
INHERENT LIMITaTIONS OF INTERNaL FINaNCIaL CONTROLS OvER FINaNCIaL REpORTINgBecause of the inherent limitations of internal financial controls over financial reporting, including the possibility of collusion or improper management override of controls, material misstatements due to error or fraud may occur and not be detected. Also, projections of any evaluation of the internal financial controls over financial reporting to future periods are subject to the risk that the internal financial control over financial reporting may become inadequate because of changes in conditions, or that the degree of compliance with the policies or procedures may deteriorate.
OpINIONIn our opinion, the Company has, in all material respects, an adequate internal financial control system over financial
reporting and such internal financial controls over financial reporting were operating effectively as at 31 March 2018, based on the internal controls over financial reporting criteria established by the Company considering the essential components of internal control stated in the Guidance Note on Audit of Internal Financial Controls Over Financial Reporting issued by the Institute of Chartered Accountants of India.
For apaji amin & Co. LLpChartered Accountants
Firm Registration No.: 100513W/W100062
Tehmul B. Sethnaplace : ahmedabad PartnerDate : 14 May 2018 Membership No: 035476
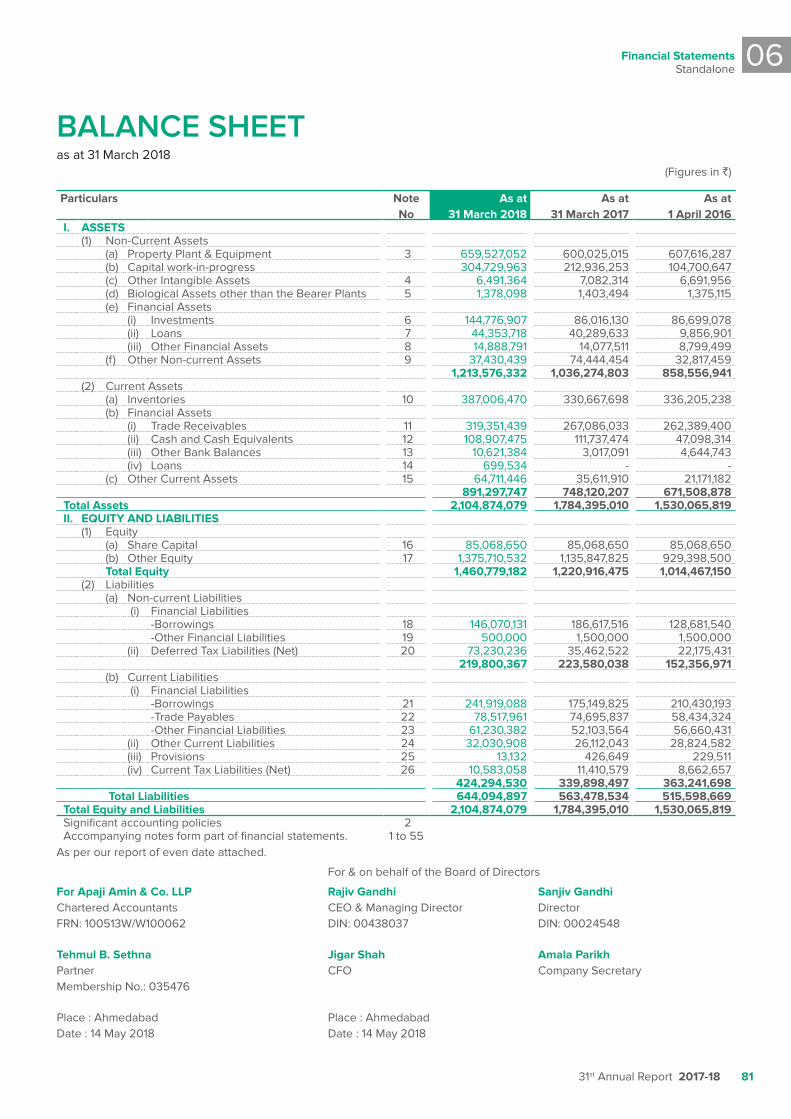
Financial StatementsStandalone
06
31st Annual Report 2017-18 81
BAlAnce sheet as at 31 March 2018
(Figures in `)
particulars Note No
as at 31 March 2018
as at 31 March 2017
as at 1 april 2016
I. aSSETS (1) Non-Current Assets (a) Property Plant & Equipment 3 659,527,052 600,025,015 607,616,287 (b) Capital work-in-progress 304,729,963 212,936,253 104,700,647 (c) Other Intangible Assets 4 6,491,364 7,082,314 6,691,956 (d) Biological Assets other than the Bearer Plants 5 1,378,098 1,403,494 1,375,115 (e) Financial Assets (i) Investments 6 144,776,907 86,016,130 86,699,078 (ii) Loans 7 44,353,718 40,289,633 9,856,901 (iii) Other Financial Assets 8 14,888,791 14,077,511 8,799,499 (f) Other Non-current Assets 9 37,430,439 74,444,454 32,817,459
1,213,576,332 1,036,274,803 858,556,941 (2) Current Assets (a) Inventories 10 387,006,470 330,667,698 336,205,238 (b) Financial Assets (i) Trade Receivables 11 319,351,439 267,086,033 262,389,400 (ii) Cash and Cash Equivalents 12 108,907,475 111,737,474 47,098,314 (iii) Other Bank Balances 13 10,621,384 3,017,091 4,644,743 (iv) Loans 14 699,534 - - (c) Other Current Assets 15 64,711,446 35,611,910 21,171,182
891,297,747 748,120,207 671,508,878 Total assets 2,104,874,079 1,784,395,010 1,530,065,819 II. EquITy aND LIaBILITIES (1) Equity (a) Share Capital 16 85,068,650 85,068,650 85,068,650 (b) Other Equity 17 1,375,710,532 1,135,847,825 929,398,500 Total Equity 1,460,779,182 1,220,916,475 1,014,467,150 (2) Liabilities (a) Non-current Liabilities (i) Financial Liabilities -Borrowings 18 146,070,131 186,617,516 128,681,540 -Other Financial Liabilities 19 500,000 1,500,000 1,500,000 (ii) Deferred Tax Liabilities (Net) 20 73,230,236 35,462,522 22,175,431
219,800,367 223,580,038 152,356,971 (b) Current Liabilities (i) Financial Liabilities -Borrowings 21 241,919,088 175,149,825 210,430,193
-Trade Payables 22 78,517,961 74,695,837 58,434,324 -Other Financial Liabilities 23 61,230,382 52,103,564 56,660,431
(ii) Other Current Liabilities 24 32,030,908 26,112,043 28,824,582 (iii) Provisions 25 13,132 426,649 229,511 (iv) Current Tax Liabilities (Net) 26 10,583,058 11,410,579 8,662,657
424,294,530 339,898,497 363,241,698 Total Liabilities 644,094,897 563,478,534 515,598,669 Total Equity and Liabilities 2,104,874,079 1,784,395,010 1,530,065,819 Significant accounting policies 2 Accompanying notes form part of financial statements. 1 to 55
As per our report of even date attached.
For & on behalf of the Board of Directors
For apaji amin & Co. LLp Rajiv gandhi Sanjiv gandhi Chartered Accountants CEO & Managing Director Director FRN: 100513W/W100062 DIN: 00438037 DIN: 00024548
Tehmul B. Sethna Jigar Shah amala parikh Partner CFO Company Secretary Membership No.: 035476
Place : Ahmedabad Place : Ahmedabad Date : 14 May 2018 Date : 14 May 2018
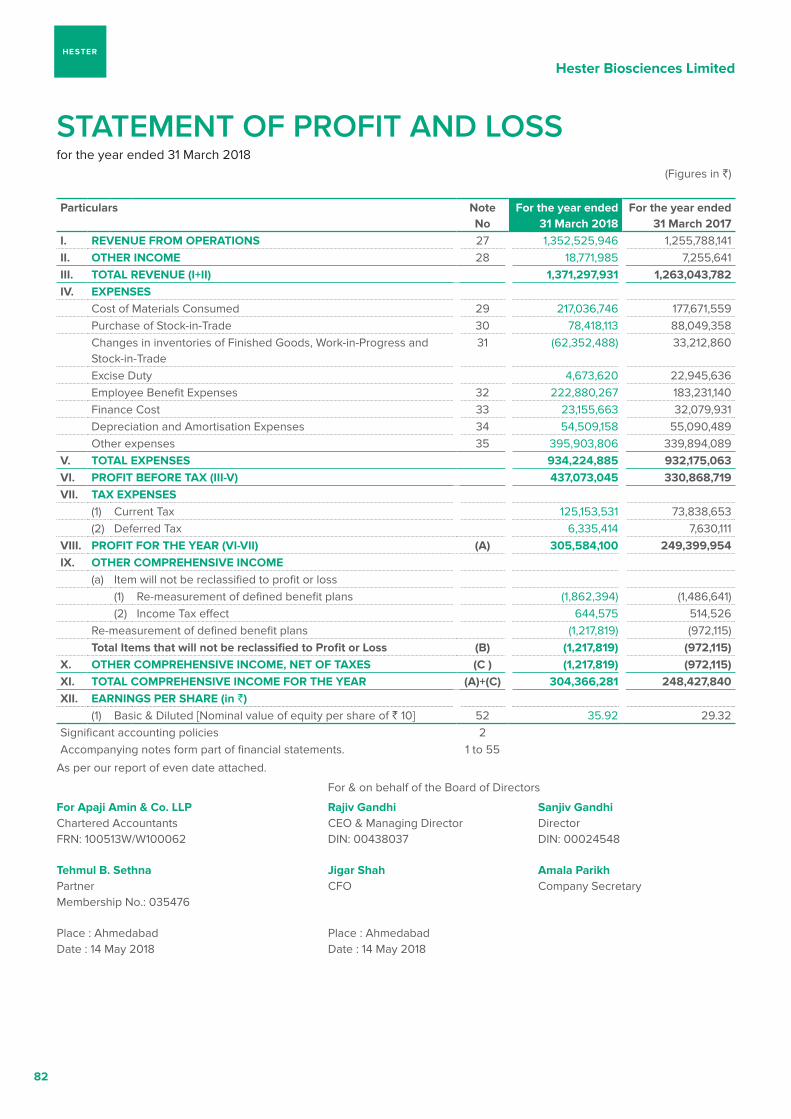
Hester Biosciences Limited
82
stAtement of profIt And loss for the year ended 31 March 2018
(Figures in `)
particulars NoteNo
For the year ended 31 March 2018
For the year ended 31 March 2017
I. REvENuE FROM OpERaTIONS 27 1,352,525,946 1,255,788,141 II. OTHER INCOME 28 18,771,985 7,255,641 III. TOTaL REvENuE (I+II) 1,371,297,931 1,263,043,782 Iv. ExpENSES
Cost of Materials Consumed 29 217,036,746 177,671,559 Purchase of Stock-in-Trade 30 78,418,113 88,049,358 Changes in inventories of Finished Goods, Work-in-Progress and Stock-in-Trade
31 (62,352,488) 33,212,860
Excise Duty 4,673,620 22,945,636 Employee Benefit Expenses 32 222,880,267 183,231,140 Finance Cost 33 23,155,663 32,079,931 Depreciation and Amortisation Expenses 34 54,509,158 55,090,489 Other expenses 35 395,903,806 339,894,089
v. TOTaL ExpENSES 934,224,885 932,175,063vI. pROFIT BEFORE Tax (III-v) 437,073,045 330,868,719vII. Tax ExpENSES
(1) Current Tax 125,153,531 73,838,653 (2) Deferred Tax 6,335,414 7,630,111
vIII. pROFIT FOR THE yEaR (vI-vII) (a) 305,584,100 249,399,954Ix. OTHER COMpREHENSIvE INCOME
(a) Item will not be reclassified to profit or loss(1) Re-measurement of defined benefit plans (1,862,394) (1,486,641)(2) Income Tax effect 644,575 514,526
Re-measurement of defined benefit plans (1,217,819) (972,115)Total Items that will not be reclassified to profit or Loss (B) (1,217,819) (972,115)
x. OTHER COMpREHENSIvE INCOME, NET OF TaxES (C ) (1,217,819) (972,115)xI. TOTaL COMpREHENSIvE INCOME FOR THE yEaR (a)+(C) 304,366,281 248,427,840xII. EaRNINgS pER SHaRE (in `)
(1) Basic & Diluted [Nominal value of equity per share of ` 10] 52 35.92 29.32 Significant accounting policies 2Accompanying notes form part of financial statements. 1 to 55
As per our report of even date attached.
For & on behalf of the Board of Directors
For apaji amin & Co. LLp Rajiv gandhi Sanjiv gandhi Chartered Accountants CEO & Managing Director Director FRN: 100513W/W100062 DIN: 00438037 DIN: 00024548
Tehmul B. Sethna Jigar Shah amala parikh Partner CFO Company Secretary Membership No.: 035476
Place : Ahmedabad Place : Ahmedabad Date : 14 May 2018 Date : 14 May 2018
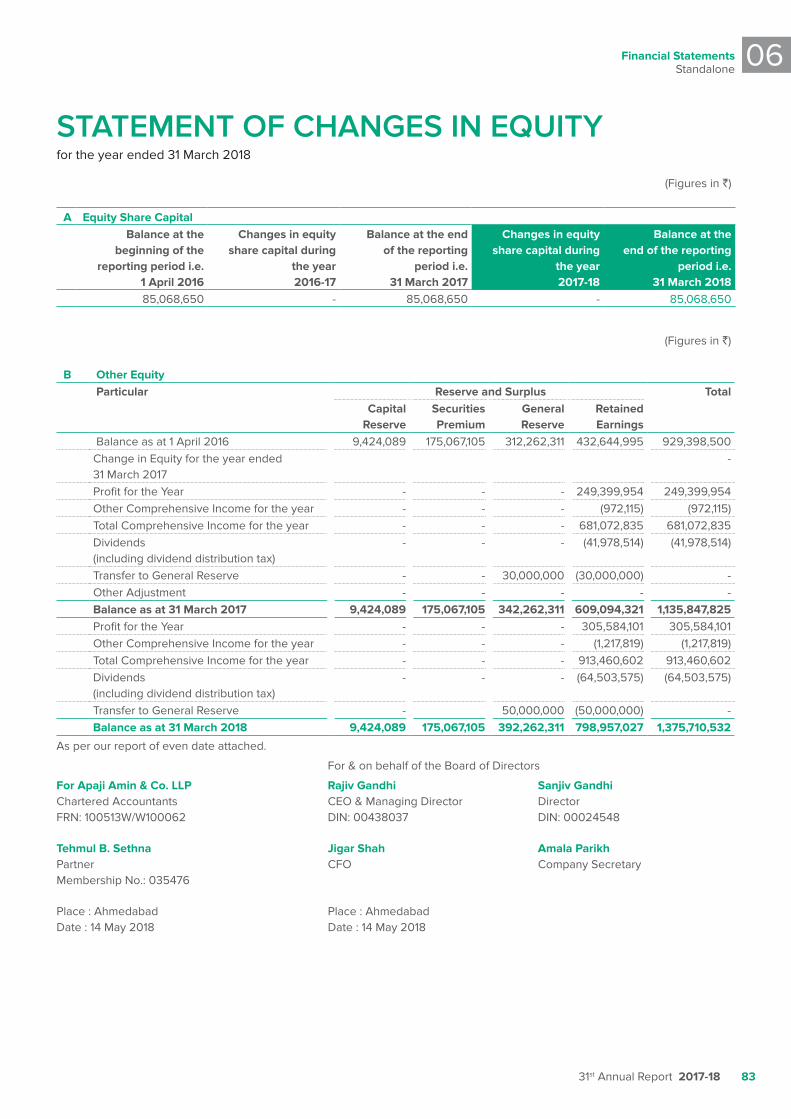
Financial StatementsStandalone
06
31st Annual Report 2017-18 83
stAtement of chAnges In equIty for the year ended 31 March 2018
(Figures in `)
a Equity Share Capital Balance at the
beginning of the reporting period i.e.
1 april 2016
Changes in equity share capital during
the year 2016-17
Balance at the end of the reporting
period i.e. 31 March 2017
Changes in equity share capital during
the year 2017-18
Balance at the end of the reporting
period i.e. 31 March 2018
85,068,650 - 85,068,650 - 85,068,650
(Figures in `)
B Other Equity particular Reserve and Surplus Total
Capital Reserve
Securities premium
general Reserve
Retained Earnings
Balance as at 1 April 2016 9,424,089 175,067,105 312,262,311 432,644,995 929,398,500 Change in Equity for the year ended 31 March 2017
-
Profit for the Year - - - 249,399,954 249,399,954 Other Comprehensive Income for the year - - - (972,115) (972,115)Total Comprehensive Income for the year - - - 681,072,835 681,072,835 Dividends (including dividend distribution tax)
- - - (41,978,514) (41,978,514)
Transfer to General Reserve - - 30,000,000 (30,000,000) - Other Adjustment - - - - - Balance as at 31 March 2017 9,424,089 175,067,105 342,262,311 609,094,321 1,135,847,825 Profit for the Year - - - 305,584,101 305,584,101 Other Comprehensive Income for the year - - - (1,217,819) (1,217,819)Total Comprehensive Income for the year - - - 913,460,602 913,460,602 Dividends (including dividend distribution tax)
- - - (64,503,575) (64,503,575)
Transfer to General Reserve - 50,000,000 (50,000,000) - Balance as at 31 March 2018 9,424,089 175,067,105 392,262,311 798,957,027 1,375,710,532
As per our report of even date attached.
For & on behalf of the Board of Directors
For apaji amin & Co. LLp Rajiv gandhi Sanjiv gandhi Chartered Accountants CEO & Managing Director Director FRN: 100513W/W100062 DIN: 00438037 DIN: 00024548
Tehmul B. Sethna Jigar Shah amala parikh Partner CFO Company Secretary Membership No.: 035476
Place : Ahmedabad Place : Ahmedabad Date : 14 May 2018 Date : 14 May 2018
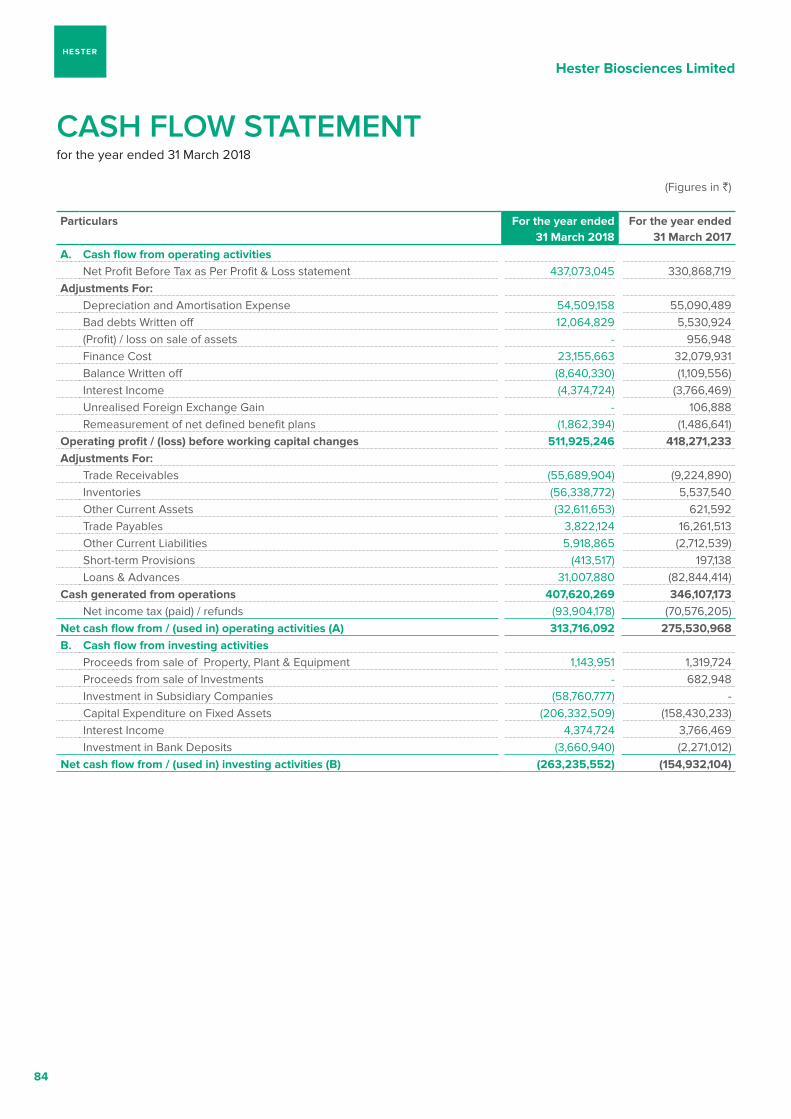
Hester Biosciences Limited
84
cAsh flow stAtementfor the year ended 31 March 2018
(Figures in `)
particulars For the year ended 31 March 2018
For the year ended 31 March 2017
a. Cash flow from operating activitiesNet Profit Before Tax as Per Profit & Loss statement 437,073,045 330,868,719
adjustments For:Depreciation and Amortisation Expense 54,509,158 55,090,489 Bad debts Written off 12,064,829 5,530,924 (Profit) / loss on sale of assets - 956,948 Finance Cost 23,155,663 32,079,931 Balance Written off (8,640,330) (1,109,556)Interest Income (4,374,724) (3,766,469)Unrealised Foreign Exchange Gain - 106,888 Remeasurement of net defined benefit plans (1,862,394) (1,486,641)
Operating profit / (loss) before working capital changes 511,925,246 418,271,233adjustments For:
Trade Receivables (55,689,904) (9,224,890)Inventories (56,338,772) 5,537,540 Other Current Assets (32,611,653) 621,592 Trade Payables 3,822,124 16,261,513 Other Current Liabilities 5,918,865 (2,712,539)Short-term Provisions (413,517) 197,138 Loans & Advances 31,007,880 (82,844,414)
Cash generated from operations 407,620,269 346,107,173Net income tax (paid) / refunds (93,904,178) (70,576,205)
Net cash flow from / (used in) operating activities (a) 313,716,092 275,530,968B. Cash flow from investing activities
Proceeds from sale of Property, Plant & Equipment 1,143,951 1,319,724 Proceeds from sale of Investments - 682,948 Investment in Subsidiary Companies (58,760,777) - Capital Expenditure on Fixed Assets (206,332,509) (158,430,233)Interest Income 4,374,724 3,766,469 Investment in Bank Deposits (3,660,940) (2,271,012)
Net cash flow from / (used in) investing activities (B) (263,235,552) (154,932,104)
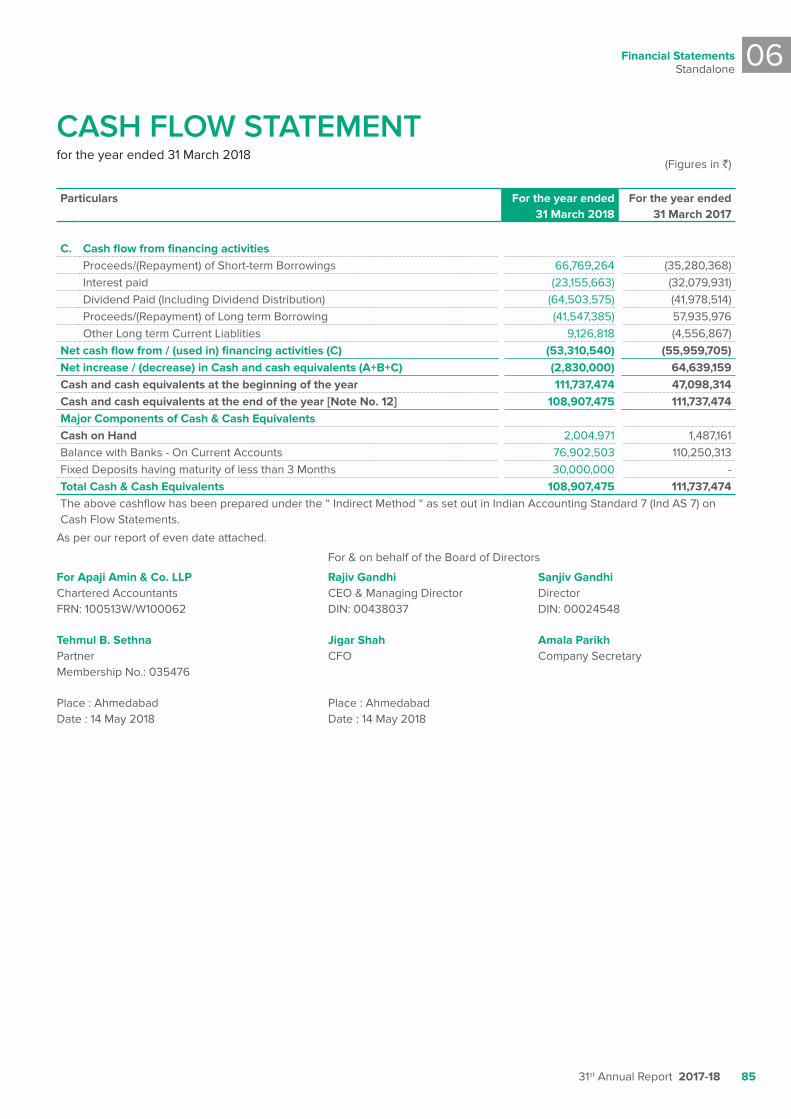
Financial StatementsStandalone
06
31st Annual Report 2017-18 85
(Figures in `)
particulars For the year ended 31 March 2018
For the year ended 31 March 2017
C. Cash flow from financing activitiesProceeds/(Repayment) of Short-term Borrowings 66,769,264 (35,280,368)Interest paid (23,155,663) (32,079,931)Dividend Paid (Including Dividend Distribution) (64,503,575) (41,978,514)Proceeds/(Repayment) of Long term Borrowing (41,547,385) 57,935,976 Other Long term Current Liablities 9,126,818 (4,556,867)
Net cash flow from / (used in) financing activities (C) (53,310,540) (55,959,705)Net increase / (decrease) in Cash and cash equivalents (a+B+C) (2,830,000) 64,639,159Cash and cash equivalents at the beginning of the year 111,737,474 47,098,314 Cash and cash equivalents at the end of the year [Note No. 12] 108,907,475 111,737,474 Major Components of Cash & Cash EquivalentsCash on Hand 2,004,971 1,487,161 Balance with Banks - On Current Accounts 76,902,503 110,250,313 Fixed Deposits having maturity of less than 3 Months 30,000,000 - Total Cash & Cash Equivalents 108,907,475 111,737,474 The above cashflow has been prepared under the “ Indirect Method “ as set out in Indian Accounting Standard 7 (Ind AS 7) on Cash Flow Statements.
As per our report of even date attached.
For & on behalf of the Board of Directors
For apaji amin & Co. LLp Rajiv gandhi Sanjiv gandhi Chartered Accountants CEO & Managing Director Director FRN: 100513W/W100062 DIN: 00438037 DIN: 00024548
Tehmul B. Sethna Jigar Shah amala parikh Partner CFO Company Secretary Membership No.: 035476
Place : Ahmedabad Place : Ahmedabad Date : 14 May 2018 Date : 14 May 2018
cAsh flow stAtementfor the year ended 31 March 2018
Hester Biosciences Limited
86
1 CORpORaTE INFORMaTION Hester Biosciences Limited is a public limited company
domiciled in India and listed on BSE Limited (BSE) and The National Stock Exchange of India Limited (NSE).The company is engaged in manufacturing of Poultry Vaccines and Large Animal Vaccines and trading of Poultry and Large Animal Health Products having its manufacturing set up at Merda Adraj Village, Mehsana District, Gujarat.
2 SIgNIFICaNT aCCOuNTINg pOLICIES a. BaSIS OF pREpaRaTION: The financial statements have been prepared on the
historical cost basis except for following assets and liabilities which have been measured at fair value amount:
i) Defined benefit plans - plan assets measured at fair value
ii) Biological assets - measured at fair value less cost to sell
The financial statements of the Company have been prepared to comply with the Indian Accounting Standards (‘Ind AS’), including the rules notified under the relevant provisions of the Companies Act, 2013.
Upto the year ended 31 March 2016, the Company has prepared its financial statements in accordance with the requirement of Indian Generally Accepted Accounting Principles (GAAP), which includes Standards notified under the Companies (Accounting Standards) Rules, 2006 and considered as “Previous GAAP"
These financial statements are the Companys’ first Ind AS standalone financial statements.
b. uSE OF ESTIMaTES: The preparation of financial statements in conformity
with Ind AS requires the management to make estimates and assumption that affect the reported amounts of assets and liabilities, disclosures of contingent assets and liabilities at the financial statements and the reported amounts of revenues and expenses during the reporting period. Actual results could differ from these estimates. Difference between the actual results and the estimates are recognised in the periods in which the results are known/ materialised.
c. REvENuE RECOgNITION: Revenue from sale of goods is recognised when the
significant risks and rewards of ownership have been transferred to the buyer, recovery of the consideration is probable, the associated cost can be estimated
reliably, there is no continuing effective control or managerial involvement with the goods, and the amount of revenue can be measured reliably. Sale of goods is recorded net of returns, Trade Discounts, Rebates, VAT/Sales Tax, Service Tax, Goods and Service Tax but inclusive excise duty.
Revenue from services are recognised as the related services are performed.
Interest income primarily comprises of interest from term deposits with banks and on loans to subsidiary companies. Interest income is recorded using the Effective Interest Rate (EIR). EIR is the rate that exactly discounts the estimated future cash receipts over the expected life of the financial instrument or a shorter period, where appropriate, to the gross carrying amount of the financial asset.
d. pROpERTy pLaNT & EquIpMENTS : Property, Plant and Equipment are stated at cost
of acquisition or construction less accumulated depreciation and accumulated impairement losses. The cost of Property, Plant and Equipment comprises of its purchase price, non-refundable taxes & levies, freight and other incidental expenses related to the acquisition and installation of the respective assets.
Subsequent expenditure related to an item of Property, Plant and Equipment is added to its book value only if it increases the future benefits from the existing asset beyond its previously assessed standard of performance. All other expenses on existing assets, including day-to-day repair and maintenance expenditure and cost of replacing parts, are charged to the Statement of Profit and Loss for the period during which such expenses are incurred except for high values which are capitalised.
Gains or losses arising from de-recognition of Property, Plant and Equipment are measured as the difference between the net disposal proceeds and the carrying amount of the asset and are recognised in the Statement of Profit and Loss when the asset is derecognised.
Capital assets under erection/installation are stated at cost in the Balance Sheet as “Capital Work-in-Progress”.
Advances paid towards the acquisition of property, plant and equipment outstanding at each reporting date is disclosed as capital advances under other non current assets. The cost of property, plant and equipment not ready to use before such date are disclosed under capital work-in-progress. Assets not ready for use are not depreciated.
Notes Forming Part of Financial Statements for the year ended 31 March 2018
Financial StatementsStandalone
06
31st Annual Report 2017-18 87
Transition to Ind aS On transiiton to Ind AS, the group has elected to
continue with the carrying value of all of its property, plant and equipment recognised as at 1 April 2016 measured as per the previous GAAP and use that carrying value as the deemed cost of the property, plant and equipment.
e. INTaNgIBLE aSSETS Intangible assets that are acquired by the Company
and that have finite useful lives are measured at cost less accumulated amortisation and accumulated impairment losses.
Subsequent expenditures are capitalised only when they increase the future economic benefits embodied in the specific asset to which they relate.
Transition to Ind aS On transiiton to Ind AS, the group has elected
to continue with the carrying value of all of its intangible assets recognised as at 1 April 2016 measured as per the previous GAAP and use that carrying value as the deemed cost of the intangible assets.
f. DEpRECIaTION / aMORTISaTION : Depreciation on Fixed Assets is provided on Straight
Line method (SLM) method based on useful life of the assets as prescribed under Part-C of Schedule II to the companies Act, 2013 except in respect of the following assets, where useful life is different than those prescribed in Schedule II are used. The Management estimates the useful lives for such fixed assets as under:-
particulars Estimated useful LifeFurniture & Fixtures Over a Period of 9 YearsVehicles Over a Period of 8 YearsPlant & Machineries, Equipments, Electrical Installation & Utilities
Over a Period of 9 Years
Office Building Over a Period of 30 Years
g. IMpaIRMENT OF NON-FINaNCIaL aSSET- property, plant and Equipment and Intangible assets:
The Company assesses at each reporting date as to whether there is any indication that any Property, Plant and Equipment and Intangible Assets or group of Assets, called Cash Generating Units (CGU) may be impaired. If any such indication exists, the recoverable amount of an asset or CGU is estimated to determine the extent of impairment, if any. When it is not possible to estimate the recoverable amount of an individual asset, the Company estimates the recoverable amount of the CGU to which the asset belongs.
An impairment loss is recognised in the Statement of Profit and Loss to the extent, assets’ carrying amount exceeds its recoverable amount. The recoverable amount is higher of an assets’ fair value less cost of disposal and value in use. Value in use is based on the estimated future cash flows, discounted to their present value using pre-tax discount rate that reflects current market assessments of the time value of money and risk specific to the assets.
Goodwill is tested for impairment annually as at year end and when circumstances indicate that the carrying value may be impaired. Impairment is determined for goodwill by assessing the recoverable amount of each CGU (or group of CGU’s) to which the goodwill relates. When the recoverable amount of the CGU is less than its carrying amount, an impairment loss is recognised. Impairment losses relating to goodwill are not reversed in future periods.
h. INvESTMENTS: Investments, which are readily realisable and
intended to be held for not more than a year from the date on which such investments are made, are classified as current investments. All other investments are classified as long-term investments.
Current investments are carried in the financial statements at lower of cost and fair value determined on an individual investment basis. Long-term investments are carried at cost. However, provision for diminution in value is made to recognise a decline other than temporary in the value of the investments.
Investments in buildings that are not intended to be occupied substantially for use by, or in the operations of the Company, have been classified as investment properties. Investment properties are carried at cost less accumulated depreciation and accumulated impairment losses, if any.
i. INvENTORIES: Inventories include raw materials, bought out
components, work-in-progress and manufactured finished goods.
Finished products: Finished products produced by the Company are
valued at lower of cost and net realisable value. Cost includes direct materials, labour, a proportion of manufacturing overheads.
Work in progress: Work in Progress is valued at cost of direct materials,
labour and other Manufacturing overheads up to estimated stage of process.
Notes Forming Part of Financial Statements for the year ended 31 March 2018
Hester Biosciences Limited
88
Raw materials and stores and spares: Raw materials and stores and spares are valued at
Lower of cost and net realisable value. However, materials and other items held for use in the production of inventories are not written down below cost if the finished products in which they will be incorporated are expected to be sold at or above cost. The cost is determined using First in First out (FIFO) method.
j. BORROWINg COSTS: Borrowing costs that are attributable to the
acquisitions or construction of fixed assets/ qualifying assets for expansion/new project are capitalised to respective fixed assets. A qualifying asset is one that necessarily takes substantial period of time to get ready for its intended use. Other borrowing costs are charged to revenue in the year in which they are incurred.
k. FOREIgN CuRRENCy TRaNSaCTIONS: i Foreign currency transactions are recorded at
the exchange rates prevailing at the time of transaction.
ii Monetary items representing assets and liabilities denominated in foreign currencies at the balance sheet date are translated at rates prevailing on balance sheet date.
iii Investments in equity capital of company registered outside India are carried in the Balance Sheet at the rates prevailing on the date of transaction.
iv Non-monetary items which are carried in terms of historical cost denominated in foreign currency are reported using the exchange rate at the date of transaction. Exchange differences arising as a result of the above are recognised as income or expenses in the statement of profit and loss. Exchange difference arising on the settlement of monetary items at rates different from those at which they were initially recorded during the year, or reported in previous financial statements, are recognised as income or expenses in the year in which they arise.
l RESEaRCH aND DEvELOpMENT: Revenue expenditure on Research and
Development is charged to the Statement of Profit and Loss for the year in which it is incurred. Capital expenditure on Research and Development is shown as an addition to the fixed assets and is depreciated on the same basis as other fixed assets.
m. pROvISION FOR RETIREMENT BENEFITS: (i) short-term employee Benefits: The undiscounted amount of short term
employee benefits expected to be paid in exchange for the services rendered by employees are recognised as an expense during the period when the employees render the services.
(ii) post- employment benefit plans: a) Defined Contribution plan: Contribution for provident fund are
accrued in accordance with applicable Statutes and deposited with the Regional Provident Fund Commissioner.
b) Defined Benefit plan: The Company operates two defined
benefit plans for its employees, viz., Gratuity and Leave Encashment. The costs of providing benefits under these plans are determined on the basis of actuarial valuation at each year-end. Actuarial valuation is carried out for using the projected unit credit method. Actuarial gains and losses for defined benefit plan is recognised in full in the period in which they occur.
Remeasurements, comprising of actuarial gains and losses are recognised immediately in the balance sheet with a corresponding debit or credit to retained earnings through OCI in the period in which they occur. Remeasurements are not reclassified to profit or loss in subsequent periods.
n. EaRNINgS pER SHaRE: Basic earnings per share are calculated by dividing
the net profit or loss after tax for the year attributable to equity shareholders by the weighted average number of equity shares outstanding during the year.
For the purpose of calculating diluted earnings per share, the net profit or loss for the period attributable to equity shareholders of the parent company and the weighted average number of shares outstanding during the period are adjusted for the effects of all dilutive potential equity shares, which includes all stock options granted to employees.
o CaSH aND CaSH EquIvaLENTS: Cash and cash equivalents comprises cash on hand
and balance at bank including fixed deposits with an original maturity period of less than three months and short term investments with an original maturity of three months or less.
Notes Forming Part of Financial Statements for the year ended 31 March 2018
Financial StatementsStandalone
06
31st Annual Report 2017-18 89
p. FINaNCIaL INSTRuMENTS: (i) financial Asset: (a) Classification: On initial recognition the Company
classifies financial assets as subsequently measured at amortised cost, fair value through other comprehensive income or fair value through profit or loss on the basis of its business model for managing the financial assets and the contractual cash flow characteristics of the financial asset.
(b) Initial recognition and measurement: All financial assets (not measured
subsequently at fair value through profit or loss) are recognised initially at fair value plus transaction costs that are attributable to the acquisition of the financial asset. Purchases or sales of financial assets that require delivery of assets within a time frame established by regulation or convention in the market place (regular way trades) are recognised on the trade date,i.e., the date that the Group commits to purchase or sell the asset.
(c) Financial assets at amortised cost: A ‘financial asset’ is measured at the
amortised cost if both the following conditions are met:
1) the asset is held within a business model whose objective is to hold assets for collecting contractual cash flows, and
2) contractual terms of the asset give rise on specified dates to cash flows that are solely payments of principal and interest (SPPI) on the principal amount outstanding.
After initial measurement, such financial assets are subsequently measured at amortised cost using the effective interest rate (EIR) method. Amortised cost is calculated by taking into account any discount or premium and fees or costs that are an integral part of the EIR. The EIR amortisation is included in finance income in the Statement of Profit and Loss. The losses arising from impairment are recognised in the Statement of Profit and Loss. This category generally applies to trade and other receivables.
Financial assets included within the fair value through profit and loss (FVTPL) category are measured at fair value with all changes recognised.
(d) Derecognition: A financial asset (or, where applicable, a
part of a financial asset or part of a group of similar financial assets) is primarily derecognised (i.e. removed from the groups’ financial statements) when:
The rights to receive cash flows from The asset have expired, or
The Company has transferred its rights to receive cash flows from the asset or has assumed an obligation to pay the received cash flows in full without material delay to a third party under a ‘pass-through’ arrangement; and either:
(i) the Company has transferred substantially all the risks and rewards of the asset, or
(ii) the Company has neither transferred nor retained substantially all the risks and rewards of the asset, but has transferred control of the asset.
When the Company has transferred its rights to receive cash flows from an asset or has entered into a pass-through arrangement, it evaluates if and to what extent it has retained the risks and rewards of ownership. When it has neither transferred nor retained substantially all of the risks and rewards of the asset, nor transferred control of the asset, the Company continues to recognise the transferred asset to the extent of the Companys’ continuing involvement. In that case, the Company also recognises an associated liability. The transferred asset and the associated liability are measured on a basis that reflects the rights and obligations that the Company has retained.
Continuing involvement that takes the form of a guarantee over the transferred asset is measured at the lower of the original carrying amount of the asset and the maximum amount of consideration that the Company could be required to repay.
Notes Forming Part of Financial Statements for the year ended 31 March 2018
Hester Biosciences Limited
90
(e) Impairment of financial assets: In accordance with Ind AS 109, the
Company applies Expected Credit Loss (ECL) model for measurement and recognition of impairment loss on the following financial assets and credit risk exposure:
(i) financial assets that are debt instruments, and are measured at amortised cost e.g., loans, debt securities, deposits, and bank balance.
(ii) trade receivables: The Company follows ‘simplified
approach’ for recognition of impairment loss allowance on trade receivables which do not contain a significant financing component.
The application of simplified approach does not require the Company to track changes in credit risk. Rather, it recognises impairment loss allowance based on lifetime ECLs at each reporting date, right from its initial recognition.
(ii) financial liabilities: (a) Classification: The Company classifies all financial
liabilities as subsequently measured at amortised cost, except for financial liabilities measured at fair value through profit or loss. Such liabilities, including derivatives that are liabilities, shall be subsequently measured at fair value with changes in fair value being recognised in the Statement of Profit and Loss.
(b) Initial recognition and measurement: Financial liabilities are classified, at initial
recognition, as financial liabilities at fair value through profit or loss, at amortised cost (loans and borrowings, and payables), or as derivatives designated as hedging instruments in an effective hedge, as appropriate.
All financial liabilities are recognised initially at fair value and, in the case of loans and borrowings and payables, net of directly attributable transaction costs.
The Companys’ financial liabilities include trade and other payables, loans and borrowings including bank overdrafts,
financial guarantee contracts and derivative financial instruments.
(c) Loans and borrowings: After initial recognition, interest-bearing
loans and borrowings are subsequently measured at amortised cost using the EIR method. Gains and losses are recognised in Statement of Profit and Loss when the liabilities are derecognised.
Amortised cost is calculated by taking into account any discount or premium on acquisition and fees or costs that are an integral part of the EIR. The EIR amortisation is included as finance costs in the Statement of Profit and Loss. This category generally applies to interest-bearing loans and borrowings.
(d) Derecognition: A financial liability is derecognised
when the obligation under the liability is discharged or cancelled or expires. When an existing financial liability is replaced by another from the same lender on substantially different terms, or the terms of an existing liability are substantially modified, such an exchange or modification is treated as the derecognition of the original liability and the recognition of a new liability. The difference in the respective carrying amounts is recognised in the Statement of Profit and Loss.
q. TaxaTION: i. Current Tax: Current tax is the expected tax payable on
the taxable income for the year, using tax rates enacted or substantively enacted at the reporting date, and any adjustment to tax payable in respect of previous years.
ii. Deferred Tax Provision: Deferred tax is recognised on temporary
differences between the carrying amounts of assets and liabilities in the financial statements and the corresponding tax bases used in the computation of taxable profit.Deferred tax liabilities and assets are measured at the tax rates that are expected to apply in the period in which the liability is settled or the asset realised, based on tax rates (and tax laws) that have been enacted or substantively enacted by the end of the reporting period. The carrying amount of deferred tax liabilities and assets are reviewed at the end of each reporting period.
Notes Forming Part of Financial Statements for the year ended 31 March 2018
Financial StatementsStandalone
06
31st Annual Report 2017-18 91
iii. Minimum Alternative Tax (MAT): Minimum Alternative Tax (MAT) paid in
accordance with the tax laws in India which gives rise to future economic benefit in the form of MAT credit entitlement for adjustment of future income tax liability, is considered as an asset only when there is convincing evidence that the company will pay normal income tax within the specified period. Accordingly MAT is recognised as an asset in the balance sheet when the asset can be measured reliably and it is probable that the future economic benefit associated with it will fructify. Such assets are revised at each balance sheet date.
r. gRaNTS: Government grants are recognised when there is
reasonable assurance that the Company will comply with the conditions attached to them and the grants will be received. Government grants receivable are recognised as income over the periods necessary to match them with the related costs which they are intended to compensate, on a systematic basis.
s. pROvISIONS aND CONTINgENT LIaBLITIES: A provision is recognised when an enterprise has
a present obligation as a result of past event; it is probable that an outflow of resources will be required to settle the obligation, in respect of which a reliable estimate can be made. Provisions are not discounted to its present value and are determined based on best estimate required to settle the obligation at the balance sheet date. These are reviewed at each balance sheet date and adjusted to reflect the current best estimates. A Contingent Liability is a possible obligation that arises from past events whose existence will be confirmed by the occurrence or non-occurrence of one or more uncertain future events beyond the control of the Company or a present obligation that is not recognised because it is not probable that an outflow of resources will be required to settle the obligation. A Contingent Liability also arises in extremely rare cases where there is a liability that cannot be recognised because it cannot be measured reliably. The Company does not recognise a contingent liability but discloses its existence in the financial statements.
t. OpERaTINg CyCLE aND CuRRENT/NON-CuRRENT CLaSSIFICaTION:
All the assets and liabilities have been classified as current or non current as per the Companys’ normal operating cycle and other criteria set out in the Schedule III to the Companies Act, 2013.
An asset is current when it is: - Expected to be realised or intended to be sold
or consumed in normal operating cycle.
- Held primarily for the purpose of trading.
- Expected to be realised within twelve months after the reporting period, or
- Cash or cash equivalent unless restricted from being exchanged or used to settle a liability for at least twelve months after the reporting period.
All other assets are classified as non-current.
A liability is current when: - It is expected to be settled in normal operating
cycle.
- It is held primarily for the purpose of trading.
- It is due to be settled within twelve months after the reporting period, or
- There is no unconditional right to defer the settlement of the liability for at least twelve months after the reporting period.
The Company classifies all other liabilities as non-current.
Deferred tax assets and liabilities are classified as non-current assets and liabilities
u. BIOLOgICaL aSSETS: Biological assets are measured at fair value less
costs to sell, with any change therein recognised in Statement of Profit and Loss.
v. STaNDaRDS ISSuED BuT NOT EFFECTIvE: Appendix B to Ind AS 21, Foreign currency
transactions and advance consideration: On 28 March 2018, Ministry of Corporate Affairs ("MCA") has notified the Companies (Indian Accounting Standards) Amendment Rules, 2018 containing Appendix B to Ind AS 21, Foreign currency transactions and advance consideration which clarifies the date of the transaction for the purpose of determining the exchange rate to use on initial recognition of the related asset, expense or income, when an entity has received or paid advance consideration in a foreign currency. The amendment will come into force from 1 April 2018. The Company has evaluated the effect of this on the financial statements and the impact is not material.
Ind AS 115- Revenue from Contract with Customers: On 28 March 2018, Ministry of Corporate Affairs ("MCA") has notified the Ind AS 115, Revenue from
Notes Forming Part of Financial Statements for the year ended 31 March 2018
Hester Biosciences Limited
92
Contract with Customers. The core principle of the new standard is that an entity should recognise revenue to depict the transfer of promised goods or services to customers in an amount that reflects the consideration to which the entity expects to be entitled in exchange for those goods or services. Further the new standard requires enhanced disclosures about the nature, amount, timing and uncertainty of revenue and cash flows arising from the entitys’ contracts with customers.
The standard permits two possible methods of transition:
- Retrospective approach - Under this approach the standard will be applied retrospectively
to each prior reporting period presented in accordance with Ind AS 8- Accounting Policies, Changes in Accounting Estimates and Errors.
- Retrospectively with cumulative effect of initially applying the standard recognised at the date of initial application (Cumulative catch-up approach).
The effective date for adoption of Ind AS 115 is financial periods beginning on or after 1 April 2018. The effect on adoption of Ind AS 115 is expected to be insignificant.
Notes Forming Part of Financial Statements for the year ended 31 March 2018
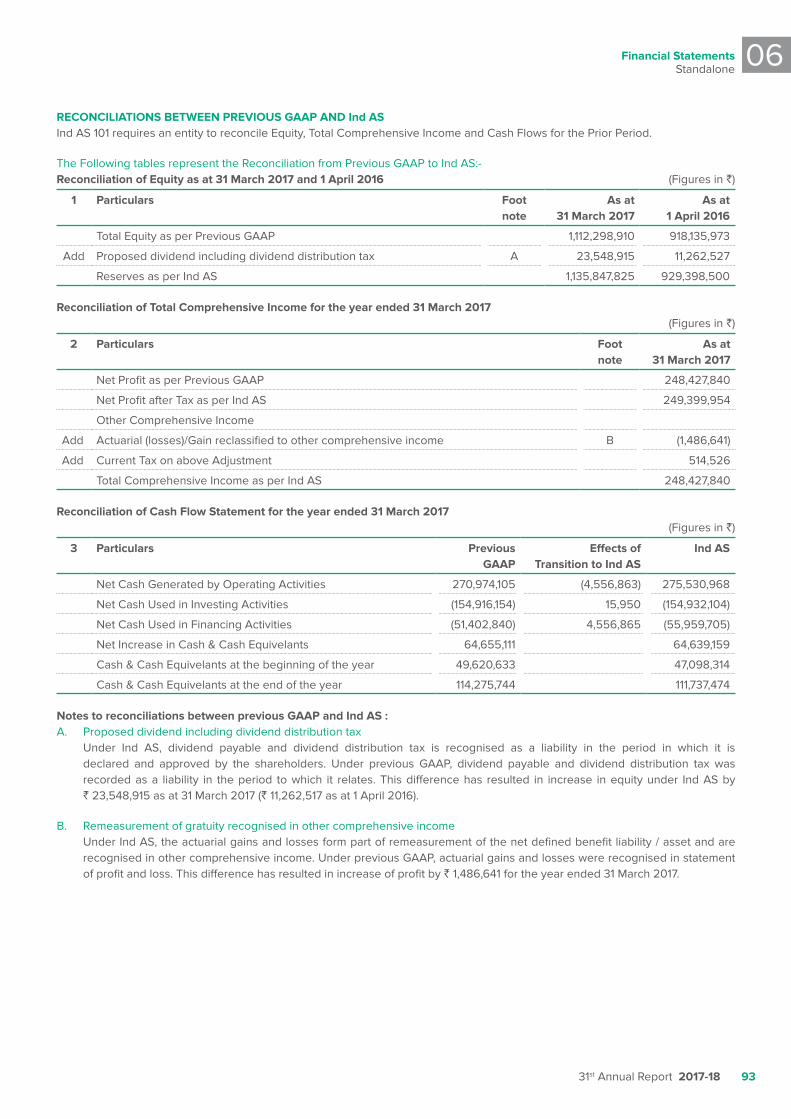
Financial StatementsStandalone
06
31st Annual Report 2017-18 93
RECONCILIaTIONS BETWEEN pREvIOuS gaap aND Ind aS Ind AS 101 requires an entity to reconcile Equity, Total Comprehensive Income and Cash Flows for the Prior Period.
The Following tables represent the Reconciliation from Previous GAAP to Ind AS:- Reconciliation of Equity as at 31 March 2017 and 1 april 2016 (Figures in `)
1 particulars Foot note
as at 31 March 2017
as at1 april 2016
Total Equity as per Previous GAAP 1,112,298,910 918,135,973
Add Proposed dividend including dividend distribution tax A 23,548,915 11,262,527
Reserves as per Ind AS 1,135,847,825 929,398,500
Reconciliation of Total Comprehensive Income for the year ended 31 March 2017 (Figures in `)
2 particulars Foot note
as at31 March 2017
Net Profit as per Previous GAAP 248,427,840
Net Profit after Tax as per Ind AS 249,399,954
Other Comprehensive Income
Add Actuarial (losses)/Gain reclassified to other comprehensive income B (1,486,641)
Add Current Tax on above Adjustment 514,526
Total Comprehensive Income as per Ind AS 248,427,840
Reconciliation of Cash Flow Statement for the year ended 31 March 2017 (Figures in `)
3 particulars previous gaap
Effects of Transition to Ind aS
Ind aS
Net Cash Generated by Operating Activities 270,974,105 (4,556,863) 275,530,968
Net Cash Used in Investing Activities (154,916,154) 15,950 (154,932,104)
Net Cash Used in Financing Activities (51,402,840) 4,556,865 (55,959,705)
Net Increase in Cash & Cash Equivelants 64,655,111 64,639,159
Cash & Cash Equivelants at the beginning of the year 49,620,633 47,098,314
Cash & Cash Equivelants at the end of the year 114,275,744 111,737,474
Notes to reconciliations between previous gaap and Ind aS : A. Proposed dividend including dividend distribution tax Under Ind AS, dividend payable and dividend distribution tax is recognised as a liability in the period in which it is
declared and approved by the shareholders. Under previous GAAP, dividend payable and dividend distribution tax was recorded as a liability in the period to which it relates. This difference has resulted in increase in equity under Ind AS by ` 23,548,915 as at 31 March 2017 (` 11,262,517 as at 1 April 2016).
B. Remeasurement of gratuity recognised in other comprehensive income Under Ind AS, the actuarial gains and losses form part of remeasurement of the net defined benefit liability / asset and are
recognised in other comprehensive income. Under previous GAAP, actuarial gains and losses were recognised in statement of profit and loss. This difference has resulted in increase of profit by ` 1,486,641 for the year ended 31 March 2017.
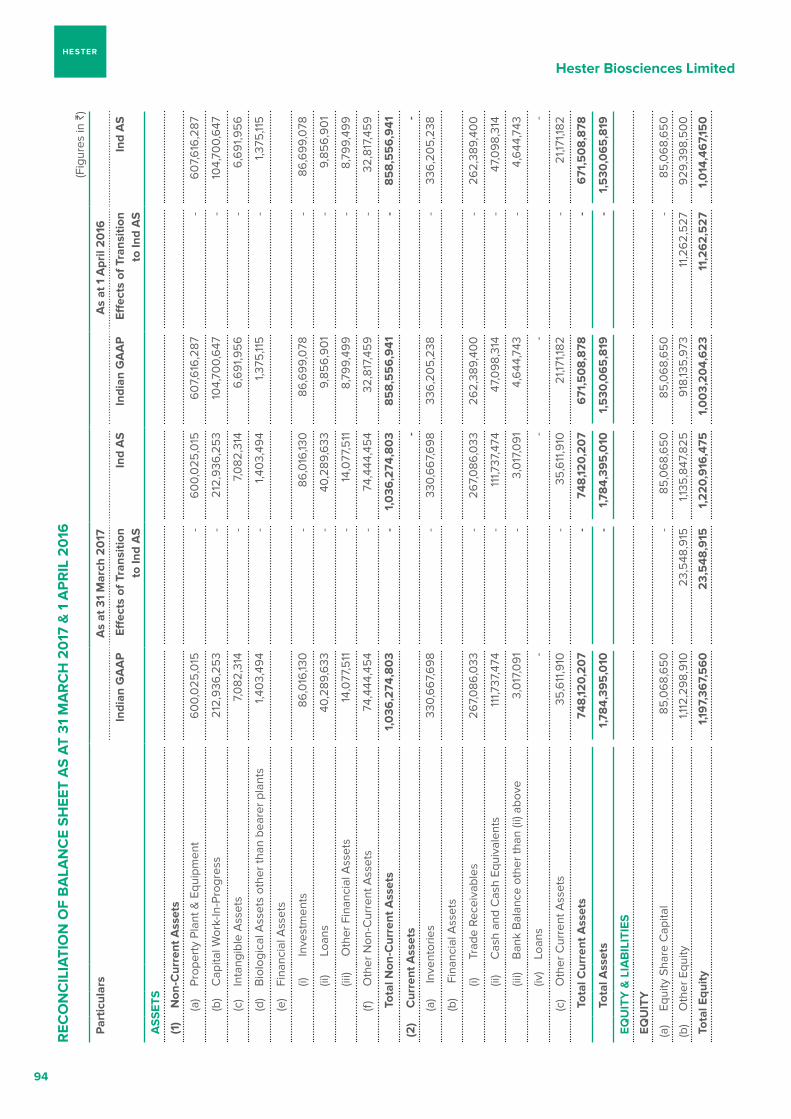
Hester Biosciences Limited
94
REC
ON
CIL
IaTI
ON
OF
Ba
LaN
CE
SH
EET
aS
aT
31 M
aR
CH
20
17 &
1 a
pR
IL 2
016
(Fig
ures
in `
)
par
ticul
ars
as
at 3
1 M
arch
20
17
as
at 1
apr
il 2
016
Indi
an g
aa
p
Eff
ects
of T
rans
ition
to
Ind
aS
In
d a
S
Indi
an g
aa
p
Eff
ects
of T
rans
ition
to
Ind
aS
In
d a
S
aS
SET
S
(1)
Non
-Cur
rent
ass
ets
(a)
Prop
erty
Pla
nt &
Equ
ipm
ent
60
0,0
25,0
15
- 6
00,
025
,015
6
07,
616
,287
- 6
07,
616
,287
(b)
Cap
ital W
ork-
In-P
rogr
ess
212
,936
,25
3 -
212
,936
,25
3 1
04,
700,
647
-
10
4,70
0,6
47
(c)
Inta
ngib
le A
sset
s 7,
082
,314
- 7,
082
,314
6,6
91,9
56
-
6,6
91,9
56
(d)
Bio
logi
cal A
sset
s ot
her t
han
bear
er p
lant
s 1
,40
3,49
4 -
1,4
03,
494
1,375
,115
- 1,3
75,11
5
(e)
Fina
ncia
l Ass
ets
(i) In
vest
men
ts
86
,016
,130
-
86
,016
,130
8
6,6
99,
078
-
86
,69
9,0
78
(ii)
Loa
ns
40,2
89,6
33 -
40,2
89,6
339,
856
,90
1 -
9,85
6,9
01
(iii)
Oth
er F
inan
cial
Ass
ets
14,0
77,5
11 -
14,0
77,5
118,
799,
499
- 8,
799,
499
(f)
Oth
er N
on-C
urre
nt A
sset
s 7
4,44
4,45
4 -
74,
444,
454
32,
817,
459
-
32,
817,
459
Tot
al N
on-C
urre
nt a
sset
s 1,
036
,274
,80
3 -
1,0
36,2
74,8
03
85
8,5
56
,941
- 8
58
,55
6,9
41
(2)
Cur
rent
ass
ets
- -
(a)
Inve
ntor
ies
330
,66
7,6
98
- 3
30,6
67,
69
8 3
36,2
05
,238
-
336
,20
5,2
38
(b)
Fin
anci
al A
sset
s
(i)Tr
ade
Rece
ivab
les
267,
086
,033
- 26
7,0
86,0
33 2
62,
389,
400
-
26
2,38
9,40
0
(ii)
Cas
h an
d C
ash
Equi
vale
nts
111,7
37,4
74 -
111,7
37,4
7447
,09
8,31
4 -
47,0
98,
314
(iii)
Ban
k B
alan
ce o
ther
than
(ii)
abov
e 3,
017
,09
1 -
3,0
17,0
91
4,6
44,7
43 -
4,6
44,7
43
(iv)
Loan
s -
- -
-
(c)
Oth
er C
urre
nt A
sset
s 35
,611
,910
- 35
,611
,910
21,1
71,18
2 -
21,1
71,18
2
Tot
al C
urre
nt a
sset
s 74
8,12
0,2
07
- 74
8,12
0,2
07
671
,50
8,8
78 -
671
,50
8,8
78
Tot
al a
sset
s 1,7
84,
395
,010
- 1,7
84,
395
,010
1,5
30,0
65
,819
- 1,
530
,06
5,8
19
Eq
uIT
y &
LIa
BIL
ITIE
S
Eq
uIT
y
(a)
Equi
ty S
hare
Cap
ital
85
,06
8,6
50
-
85
,06
8,6
50
8
5,0
68,
65
0
- 8
5,0
68,
65
0
(b)
Oth
er E
quity
1
,112,
298,
910
2
3,5
48,9
15
1,13
5,8
47,8
25
918
,135
,973
1
1,26
2,5
27
929
,39
8,5
00
Tot
al E
quity
1
,197,
367,
56
0
23,
548
,915
1
,22
0,9
16,4
75
1,0
03,
20
4,6
23
11,
26
2,5
27
1,0
14,4
67,
150
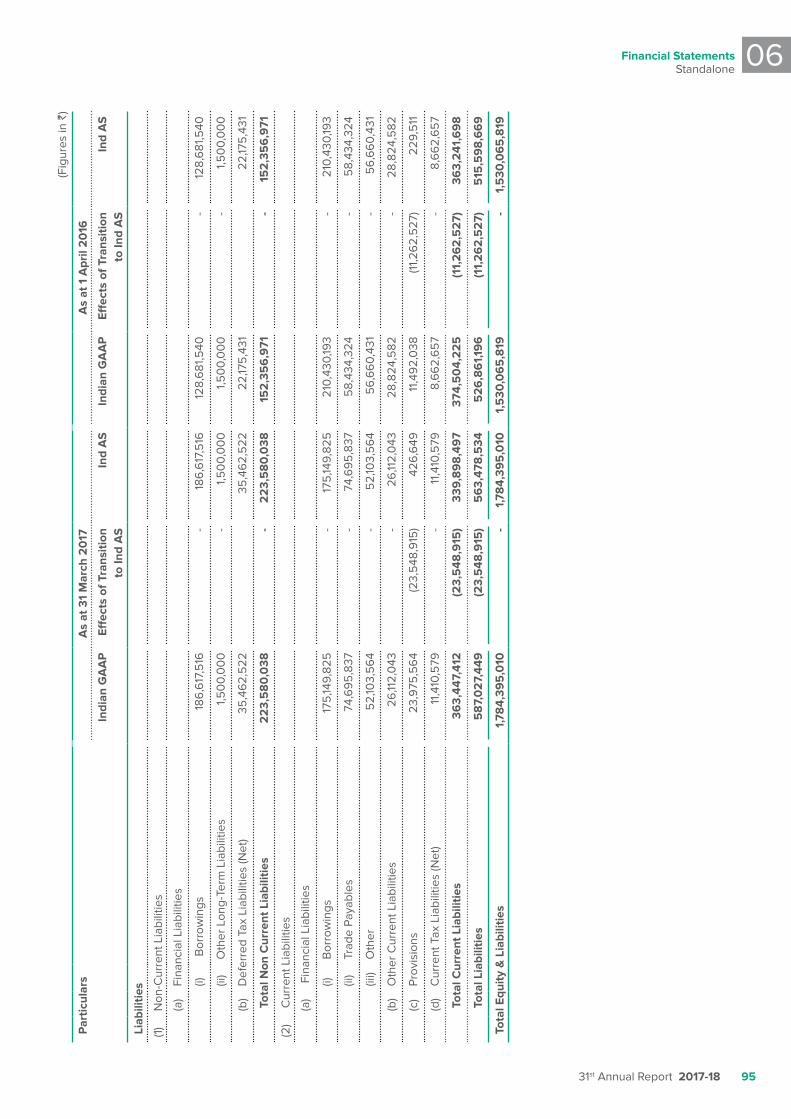
Financial StatementsStandalone
06
31st Annual Report 2017-18 95
par
ticul
ars
as
at 3
1 M
arch
20
17
as
at 1
apr
il 2
016
Indi
an g
aa
p
Eff
ects
of T
rans
ition
to
Ind
aS
In
d a
S
Indi
an g
aa
p
Eff
ects
of T
rans
ition
to
Ind
aS
In
d a
S
Lia
bilit
ies
(1)N
on-C
urre
nt L
iabi
litie
s
(a)
Fina
ncia
l Lia
bilit
ies
(i) B
orro
win
gs
186
,617
,516
-
186
,617
,516
1
28,6
81,5
40
- 1
28,6
81,5
40
(ii)
Oth
er L
ong-
Term
Lia
bilit
ies
1,5
00,
00
0
- 1
,50
0,0
00
1
,50
0,0
00
-
1,5
00,
00
0
(b)
Def
erre
d Ta
x Li
abili
ties
(Net
) 3
5,4
62,
522
3
5,4
62,
522
2
2,17
5,4
31
22,
175
,431
Tot
al N
on C
urre
nt L
iabi
litie
s 2
23,
58
0,0
38
- 2
23,
58
0,0
38
15
2,3
56
,971
-
15
2,3
56
,971
(2)
Cur
rent
Lia
bilit
ies
(a)
Fin
anci
al L
iabi
litie
s
(i)B
orro
win
gs
175
,149,
825
-
175
,149,
825
2
10,4
30,19
3 -
210
,430
,193
(ii)
Trad
e Pa
yabl
es
74,6
95
,837
- 74
,69
5,8
37 5
8,43
4,32
4 -
58,
434,
324
(iii)
Oth
er
52,
103,
56
4 -
52,
103,
56
45
6,6
60,
431
- 5
6,6
60,
431
(b)
Oth
er C
urre
nt L
iabi
litie
s 26
,112,
043
- 26
,112,
043
28,8
24,5
82 -
28,8
24,5
82
(c)
Prov
isio
ns
23,
975
,56
4 (2
3,5
48,9
15)
426
,649
1
1,49
2,0
38
(11,2
62,
527
) 2
29,5
11
(d)
Cur
rent
Tax
Lia
bilit
ies
(Net
) 11
,410
,579
- 11
,410
,579
8,6
62,
65
7 -
8,6
62,
65
7
Tot
al C
urre
nt L
iabi
litie
s 36
3,44
7,41
2 (2
3,5
48,9
15)
339,
89
8,4
97
374,
50
4,2
25
(11,
26
2,5
27)
363,
241
,69
8
Tot
al L
iabi
litie
s 5
87,
02
7,44
9 (2
3,5
48,9
15)
56
3,47
8,5
345
26
,86
1,19
6 (1
1,2
62
,52
7)5
15,5
98
,66
9
Tot
al E
quity
& L
iabi
litie
s 1,7
84,
395
,010
- 1,7
84,
395
,010
1,5
30,0
65
,819
- 1,
530
,06
5,8
19
(Fig
ures
in `
)
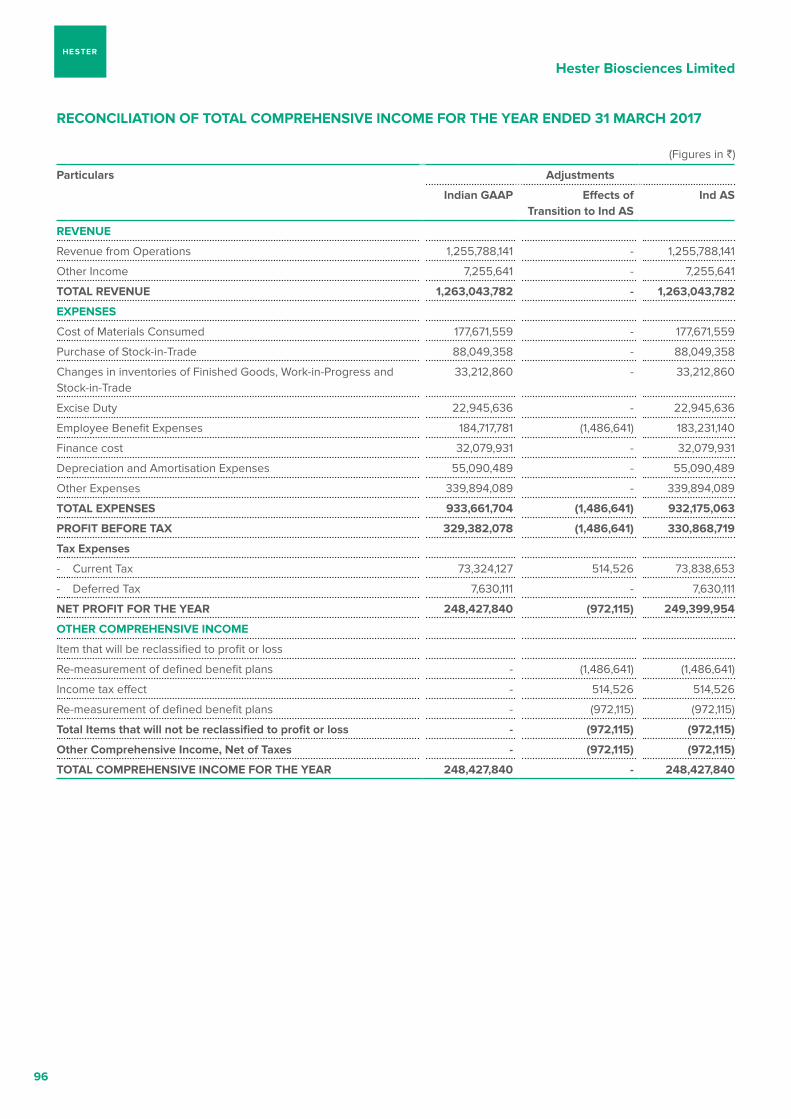
Hester Biosciences Limited
96
RECONCILIaTION OF TOTaL COMpREHENSIvE INCOME FOR THE yEaR ENDED 31 MaRCH 2017
(Figures in `)
particulars
adjustments
Indian gaap Effects of Transition to Ind aS
Ind aS
REvENuE
Revenue from Operations 1,255,788,141 - 1,255,788,141
Other Income 7,255,641 - 7,255,641
TOTaL REvENuE 1,263,043,782 - 1,263,043,782
ExpENSES
Cost of Materials Consumed 177,671,559 - 177,671,559
Purchase of Stock-in-Trade 88,049,358 - 88,049,358
Changes in inventories of Finished Goods, Work-in-Progress and Stock-in-Trade
33,212,860 - 33,212,860
Excise Duty 22,945,636 - 22,945,636
Employee Benefit Expenses 184,717,781 (1,486,641) 183,231,140
Finance cost 32,079,931 - 32,079,931
Depreciation and Amortisation Expenses 55,090,489 - 55,090,489
Other Expenses 339,894,089 - 339,894,089
TOTaL ExpENSES 933,661,704 (1,486,641) 932,175,063
pROFIT BEFORE Tax 329,382,078 (1,486,641) 330,868,719
Tax Expenses
- Current Tax 73,324,127 514,526 73,838,653
- Deferred Tax 7,630,111 - 7,630,111
NET pROFIT FOR THE yEaR 248,427,840 (972,115) 249,399,954
OTHER COMpREHENSIvE INCOME
Item that will be reclassified to profit or loss
Re-measurement of defined benefit plans - (1,486,641) (1,486,641)
Income tax effect - 514,526 514,526
Re-measurement of defined benefit plans - (972,115) (972,115)
Total Items that will not be reclassified to profit or loss - (972,115) (972,115)
Other Comprehensive Income, Net of Taxes - (972,115) (972,115)
TOTaL COMpREHENSIvE INCOME FOR THE yEaR 248,427,840 - 248,427,840
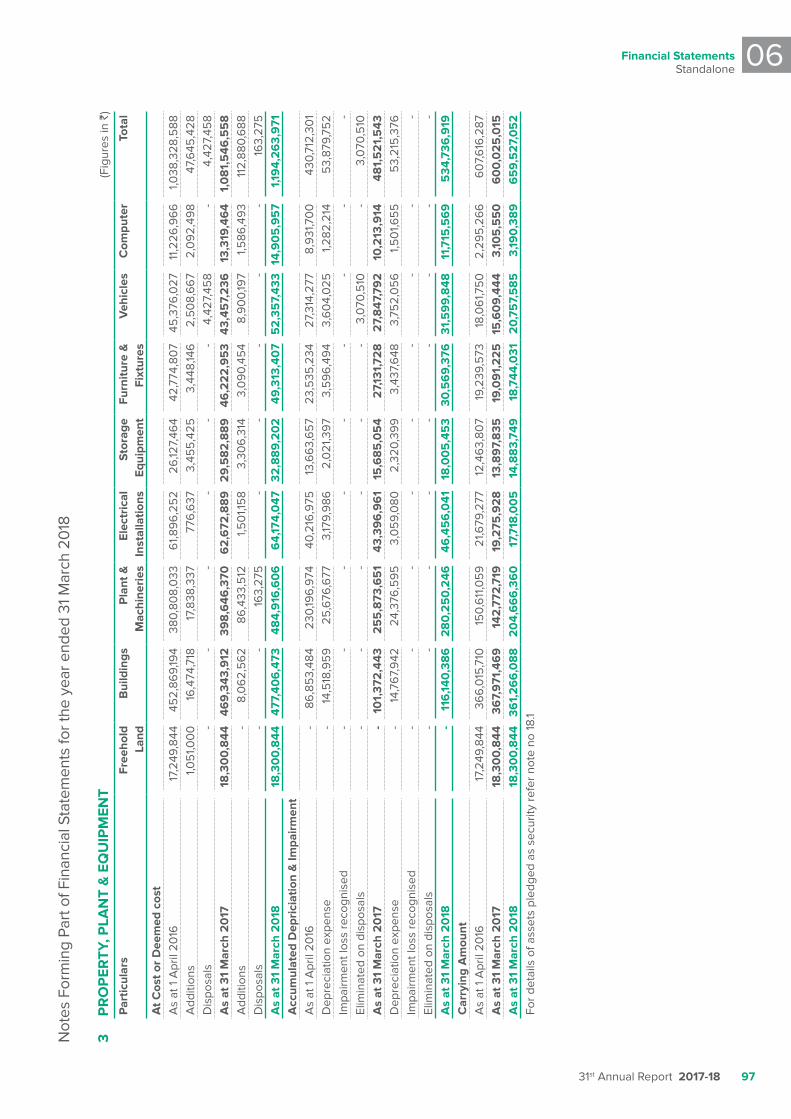
Financial StatementsStandalone
06
31st Annual Report 2017-18 97
Not
es F
orm
ing
Part
of F
inan
cial
Sta
tem
ents
for t
he y
ear e
nded
31 M
arch
20
18
3 p
RO
pER
Ty, p
LaN
T &
Eq
uIp
MEN
T (F
igur
es in
`)
par
ticul
ars
Fre
ehol
d La
nd
Bui
ldin
gs
pla
nt &
M
achi
neri
es
Ele
ctri
cal
Inst
alla
tions
S
tora
ge
Equi
pmen
t F
urni
ture
&
Fixt
ures
v
ehic
les
Com
pute
r T
otal
at C
ost o
r D
eem
ed c
ost
As
at 1
Apr
il 20
16 1
7,24
9,84
4 4
52,
869,
194
380
,80
8,0
33
61,8
96
,25
2 2
6,12
7,46
4 4
2,77
4,80
7 4
5,3
76,0
27
11,2
26,9
66
1
,038
,328
,588
A
dditi
ons
1,0
51,0
00
1
6,4
74,7
18
17,
838,
337
776
,637
3
,45
5,4
25
3,4
48,14
6
2,5
08,
66
7 2
,09
2,49
8 4
7,6
45,4
28
Dis
posa
ls -
- -
- -
- 4
,427
,45
8 -
4,4
27,4
58
as
at 3
1 M
arch
20
17 1
8,3
00
,844
46
9,34
3,9
12
39
8,6
46,3
70
62
,672
,88
9
29,
58
2,8
89
4
6,2
22
,95
3 43
,45
7,2
36
13,
319,
464
1,0
81,
546
,55
8
Add
ition
s -
8,0
62,
56
2 8
6,4
33,5
12
1,5
01,1
58
3,3
06
,314
3
,09
0,45
4 8
,90
0,19
7 1
,586
,49
3 1
12,8
80,6
88
Dis
posa
ls -
- 1
63,
275
-
- -
- -
16
3,27
5
as
at 3
1 M
arch
20
18 1
8,3
00
,844
4
77,4
06
,473
4
84,
916
,60
6
64,
174,
047
32
,88
9,2
02
4
9,31
3,40
7 5
2,3
57,
433
14,9
05
,95
7 1
,194,
26
3,9
71
acc
umul
ated
Dep
rici
atio
n &
Impa
irm
ent
As
at 1
Apr
il 20
16 -
86
,85
3,48
4 2
30,19
6,9
74
40,
216
,975
1
3,6
63,
65
7 2
3,5
35,2
34
27,
314,
277
8,9
31,7
00
4
30,7
12,3
01
Dep
reci
atio
n ex
pens
e -
14,
518
,95
9
25
,676
,677
3
,179,
986
2
,021
,39
7 3
,59
6,4
94
3,6
04,
025
1
,282
,214
5
3,87
9,75
2 Im
pairm
ent l
oss
reco
gnis
ed-
--
--
--
- -
Elim
inat
ed o
n di
spos
als
- -
- -
- -
3,0
70,5
10
- 3
,070
,510
a
s at
31
Mar
ch 2
017
- 1
01,
372
,443
2
55
,873
,65
1 4
3,39
6,9
61
15
,68
5,0
54
27,
131,7
28
2
7,8
47,7
92
1
0,2
13,9
14
48
1,5
21,
543
D
epre
ciat
ion
expe
nse
- 1
4,76
7,9
42
24,
376
,59
5
3,0
59,
080
2
,320
,39
9
3,4
37,6
48
3,7
52,
05
6
1,5
01,6
55
5
3,21
5,3
76
Impa
irmen
t los
s re
cogn
ised
- -
- -
- -
- -
- El
imin
ated
on
disp
osal
s -
- -
- -
- -
- -
as
at 3
1 M
arch
20
18 -
116
,140
,38
6
28
0,2
50
,246
4
6,4
56
,041
1
8,0
05
,45
3 3
0,5
69,
376
31
,59
9,8
48
11,7
15,5
69
5
34,7
36,9
19
Car
ryin
g a
mou
ntA
s at
1 A
pril
2016
17,
249,
844
36
6,0
15,7
10
15
0,6
11,0
59
2
1,679
,277
1
2,46
3,80
7 1
9,23
9,5
73
18,
06
1,75
0
2,2
95
,26
6
60
7,6
16,2
87
as
at 3
1 M
arch
20
17 1
8,3
00
,844
3
67,
971
,46
9
142
,772
,719
1
9,2
75,9
28
1
3,8
97,
835
1
9,0
91,
22
5
15,6
09,
444
3,10
5,5
50
6
00
,02
5,0
15
as
at 3
1 M
arch
20
18 1
8,3
00
,844
36
1,2
66
,08
8
20
4,6
66
,36
0
17,
718
,00
5
14,
88
3,74
9
18
,744
,031
2
0,7
57,
58
5
3,19
0,3
89
6
59,
52
7,0
52
Fo
r det
ails
of a
sset
s pl
edge
d as
sec
urity
refe
r not
e no
18.
1
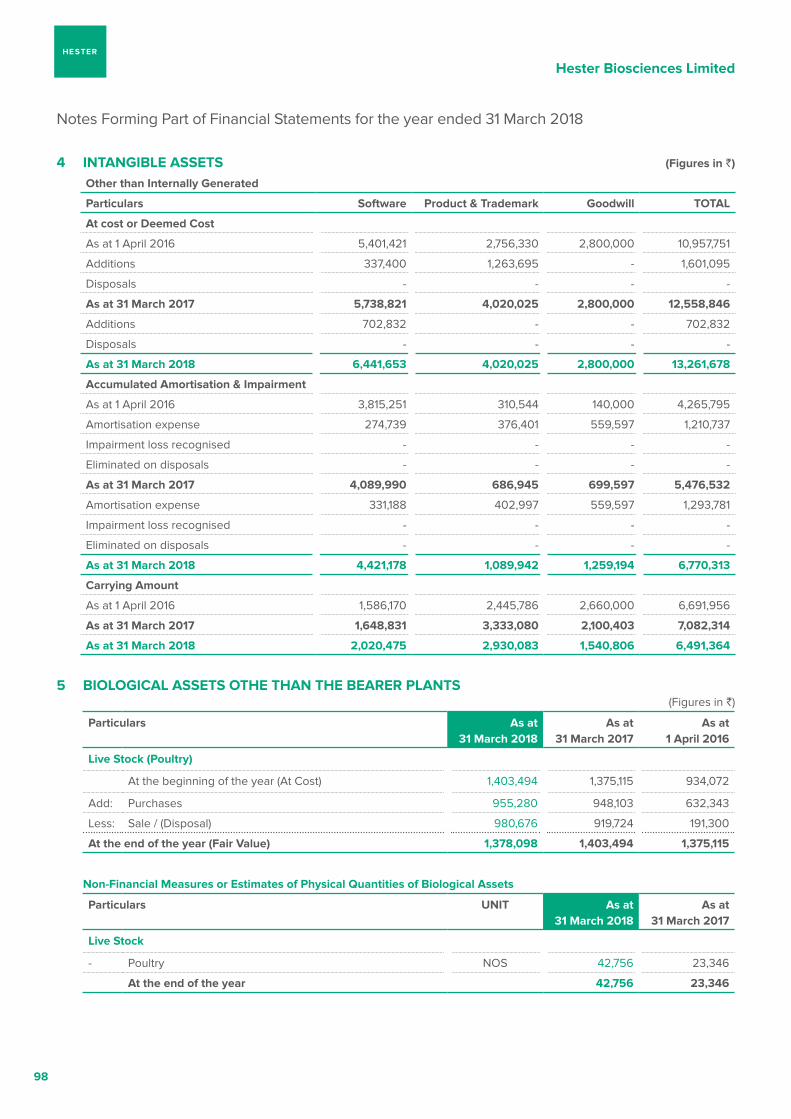
Hester Biosciences Limited
98
4 INTaNgIBLE aSSETS (Figures in `)
Other than Internally generated
particulars Software product & Trademark goodwill TOTaL
at cost or Deemed Cost
As at 1 April 2016 5,401,421 2,756,330 2,800,000 10,957,751
Additions 337,400 1,263,695 - 1,601,095
Disposals - - - -
as at 31 March 2017 5,738,821 4,020,025 2,800,000 12,558,846
Additions 702,832 - - 702,832
Disposals - - - -
as at 31 March 2018 6,441,653 4,020,025 2,800,000 13,261,678
accumulated amortisation & Impairment
As at 1 April 2016 3,815,251 310,544 140,000 4,265,795
Amortisation expense 274,739 376,401 559,597 1,210,737
Impairment loss recognised - - - -
Eliminated on disposals - - - -
as at 31 March 2017 4,089,990 686,945 699,597 5,476,532
Amortisation expense 331,188 402,997 559,597 1,293,781
Impairment loss recognised - - - -
Eliminated on disposals - - - -
as at 31 March 2018 4,421,178 1,089,942 1,259,194 6,770,313
Carrying amount
As at 1 April 2016 1,586,170 2,445,786 2,660,000 6,691,956
as at 31 March 2017 1,648,831 3,333,080 2,100,403 7,082,314
as at 31 March 2018 2,020,475 2,930,083 1,540,806 6,491,364
5 BIOLOgICaL aSSETS OTHE THaN THE BEaRER pLaNTS(Figures in `)
particulars as at 31 March 2018
as at 31 March 2017
as at 1 april 2016
Live Stock (poultry)
At the beginning of the year (At Cost) 1,403,494 1,375,115 934,072
Add: Purchases 955,280 948,103 632,343
Less: Sale / (Disposal) 980,676 919,724 191,300
at the end of the year (Fair value) 1,378,098 1,403,494 1,375,115
Non-Financial Measures or Estimates of physical quantities of Biological assets
particulars uNIT as at 31 March 2018
as at 31 March 2017
Live Stock
- Poultry NOS 42,756 23,346
at the end of the year 42,756 23,346
Notes Forming Part of Financial Statements for the year ended 31 March 2018
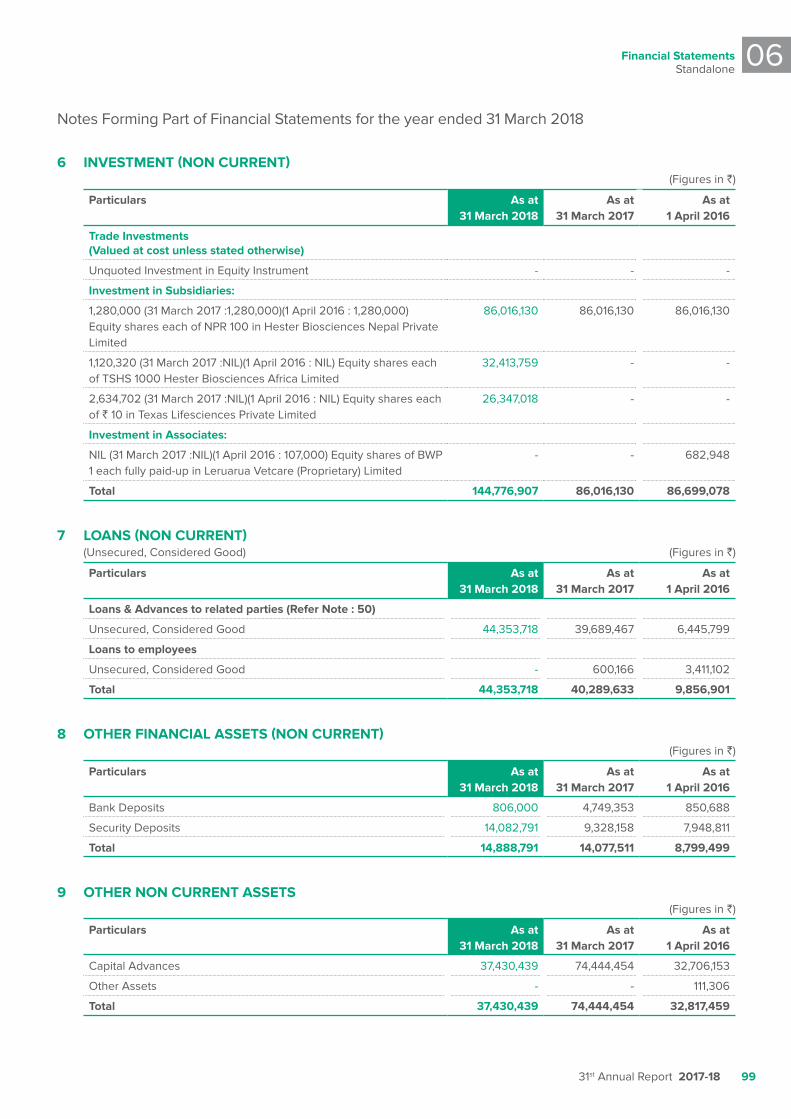
Financial StatementsStandalone
06
31st Annual Report 2017-18 99
Notes Forming Part of Financial Statements for the year ended 31 March 2018
6 INvESTMENT (NON CuRRENT)(Figures in `)
particulars as at 31 March 2018
as at 31 March 2017
as at 1 april 2016
Trade Investments (valued at cost unless stated otherwise)
Unquoted Investment in Equity Instrument - - -
Investment in Subsidiaries:
1,280,000 (31 March 2017 :1,280,000)(1 April 2016 : 1,280,000) Equity shares each of NPR 100 in Hester Biosciences Nepal Private Limited
86,016,130 86,016,130 86,016,130
1,120,320 (31 March 2017 :NIL)(1 April 2016 : NIL) Equity shares each of TSHS 1000 Hester Biosciences Africa Limited
32,413,759 - -
2,634,702 (31 March 2017 :NIL)(1 April 2016 : NIL) Equity shares each of ` 10 in Texas Lifesciences Private Limited
26,347,018 - -
Investment in associates:
NIL (31 March 2017 :NIL)(1 April 2016 : 107,000) Equity shares of BWP 1 each fully paid-up in Leruarua Vetcare (Proprietary) Limited
- - 682,948
Total 144,776,907 86,016,130 86,699,078
7 LOaNS (NON CuRRENT) (Unsecured, Considered Good) (Figures in `)
particulars as at 31 March 2018
as at 31 March 2017
as at 1 april 2016
Loans & advances to related parties (Refer Note : 50)
Unsecured, Considered Good 44,353,718 39,689,467 6,445,799
Loans to employees
Unsecured, Considered Good - 600,166 3,411,102
Total 44,353,718 40,289,633 9,856,901
8 OTHER FINaNCIaL aSSETS (NON CuRRENT)(Figures in `)
particulars as at 31 March 2018
as at 31 March 2017
as at 1 april 2016
Bank Deposits 806,000 4,749,353 850,688
Security Deposits 14,082,791 9,328,158 7,948,811
Total 14,888,791 14,077,511 8,799,499
9 OTHER NON CuRRENT aSSETS(Figures in `)
particulars as at 31 March 2018
as at 31 March 2017
as at 1 april 2016
Capital Advances 37,430,439 74,444,454 32,706,153
Other Assets - - 111,306
Total 37,430,439 74,444,454 32,817,459
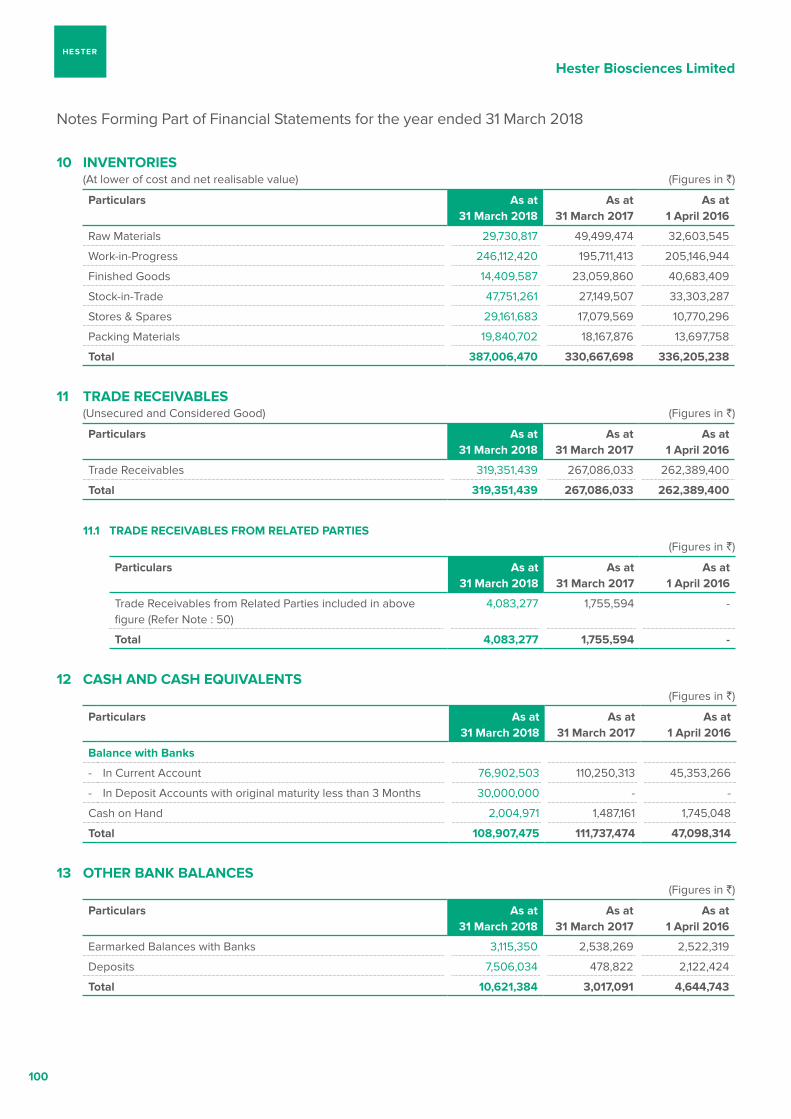
Hester Biosciences Limited
100
10 INvENTORIES (At lower of cost and net realisable value) (Figures in `)
particulars as at 31 March 2018
as at 31 March 2017
as at 1 april 2016
Raw Materials 29,730,817 49,499,474 32,603,545
Work-in-Progress 246,112,420 195,711,413 205,146,944
Finished Goods 14,409,587 23,059,860 40,683,409
Stock-in-Trade 47,751,261 27,149,507 33,303,287
Stores & Spares 29,161,683 17,079,569 10,770,296
Packing Materials 19,840,702 18,167,876 13,697,758
Total 387,006,470 330,667,698 336,205,238
11 TRaDE RECEIvaBLES (Unsecured and Considered Good) (Figures in `)
particulars as at 31 March 2018
as at 31 March 2017
as at 1 april 2016
Trade Receivables 319,351,439 267,086,033 262,389,400
Total 319,351,439 267,086,033 262,389,400
11.1 TRaDE RECEIvaBLES FROM RELaTED paRTIES(Figures in `)
particulars as at 31 March 2018
as at 31 March 2017
as at 1 april 2016
Trade Receivables from Related Parties included in above figure (Refer Note : 50)
4,083,277 1,755,594 -
Total 4,083,277 1,755,594 -
12 CaSH aND CaSH EquIvaLENTS(Figures in `)
particulars as at 31 March 2018
as at 31 March 2017
as at 1 april 2016
Balance with Banks
- In Current Account 76,902,503 110,250,313 45,353,266
- In Deposit Accounts with original maturity less than 3 Months 30,000,000 - -
Cash on Hand 2,004,971 1,487,161 1,745,048
Total 108,907,475 111,737,474 47,098,314
13 OTHER BaNk BaLaNCES(Figures in `)
particulars as at 31 March 2018
as at 31 March 2017
as at 1 april 2016
Earmarked Balances with Banks 3,115,350 2,538,269 2,522,319
Deposits 7,506,034 478,822 2,122,424
Total 10,621,384 3,017,091 4,644,743
Notes Forming Part of Financial Statements for the year ended 31 March 2018
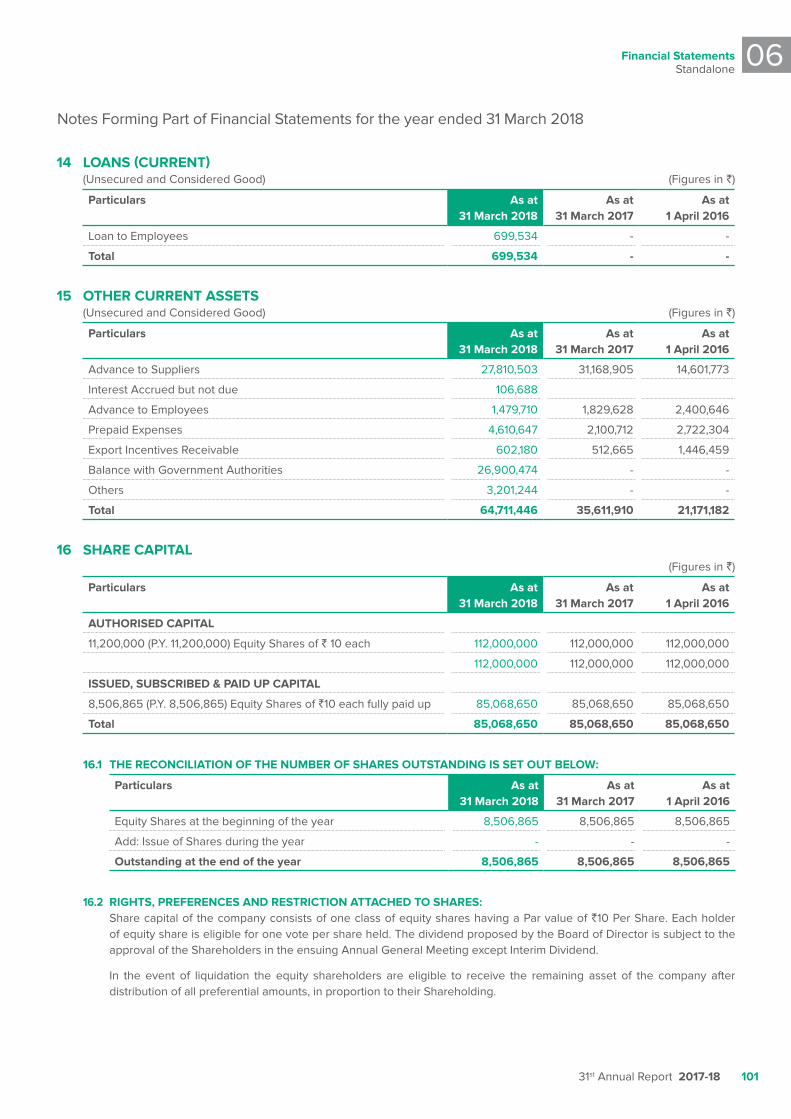
Financial StatementsStandalone
06
31st Annual Report 2017-18 101
14 LOaNS (CuRRENT) (Unsecured and Considered Good) (Figures in `)
particulars as at 31 March 2018
as at 31 March 2017
as at 1 april 2016
Loan to Employees 699,534 - -
Total 699,534 - -
15 OTHER CuRRENT aSSETS (Unsecured and Considered Good) (Figures in `)
particulars as at 31 March 2018
as at 31 March 2017
as at 1 april 2016
Advance to Suppliers 27,810,503 31,168,905 14,601,773
Interest Accrued but not due 106,688
Advance to Employees 1,479,710 1,829,628 2,400,646
Prepaid Expenses 4,610,647 2,100,712 2,722,304
Export Incentives Receivable 602,180 512,665 1,446,459
Balance with Government Authorities 26,900,474 - -
Others 3,201,244 - -
Total 64,711,446 35,611,910 21,171,182
16 SHaRE CapITaL(Figures in `)
particulars as at 31 March 2018
as at 31 March 2017
as at 1 april 2016
auTHORISED CapITaL
11,200,000 (P.Y. 11,200,000) Equity Shares of ` 10 each 112,000,000 112,000,000 112,000,000
112,000,000 112,000,000 112,000,000
ISSuED, SuBSCRIBED & paID up CapITaL
8,506,865 (P.Y. 8,506,865) Equity Shares of `10 each fully paid up 85,068,650 85,068,650 85,068,650
Total 85,068,650 85,068,650 85,068,650
16.1 THE RECONCILIaTION OF THE NuMBER OF SHaRES OuTSTaNDINg IS SET OuT BELOW:
particulars as at 31 March 2018
as at 31 March 2017
as at 1 april 2016
Equity Shares at the beginning of the year 8,506,865 8,506,865 8,506,865
Add: Issue of Shares during the year - - -
Outstanding at the end of the year 8,506,865 8,506,865 8,506,865
16.2 RIgHTS, pREFERENCES aND RESTRICTION aTTaCHED TO SHaRES: Share capital of the company consists of one class of equity shares having a Par value of `10 Per Share. Each holder
of equity share is eligible for one vote per share held. The dividend proposed by the Board of Director is subject to the approval of the Shareholders in the ensuing Annual General Meeting except Interim Dividend.
In the event of liquidation the equity shareholders are eligible to receive the remaining asset of the company after distribution of all preferential amounts, in proportion to their Shareholding.
Notes Forming Part of Financial Statements for the year ended 31 March 2018
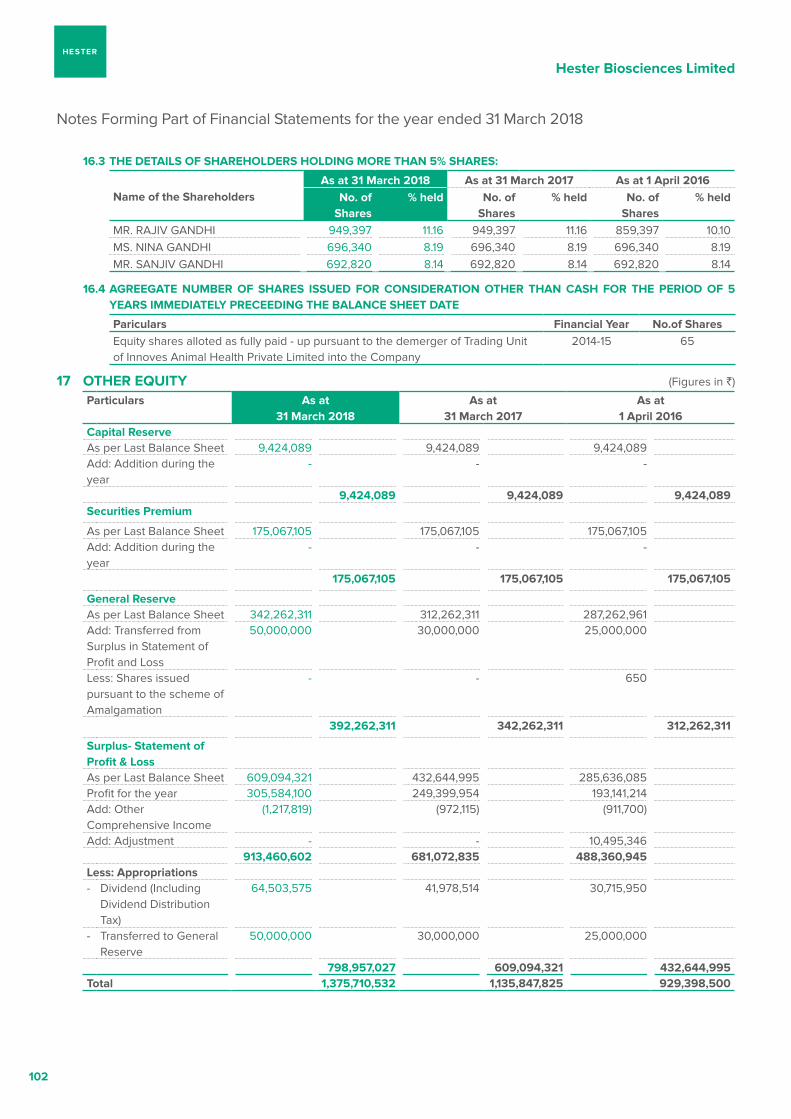
Hester Biosciences Limited
102
16.3 THE DETaILS OF SHaREHOLDERS HOLDINg MORE THaN 5% SHaRES:
Name of the Shareholdersas at 31 March 2018 as at 31 March 2017 as at 1 april 2016
No. of Shares
% held No. of Shares
% held No. of Shares
% held
MR. RAJIV GANDHI 949,397 11.16 949,397 11.16 859,397 10.10MS. NINA GANDHI 696,340 8.19 696,340 8.19 696,340 8.19MR. SANJIV GANDHI 692,820 8.14 692,820 8.14 692,820 8.14
16.4 agREEgaTE NuMBER OF SHaRES ISSuED FOR CONSIDERaTION OTHER THaN CaSH FOR THE pERIOD OF 5 yEaRS IMMEDIaTELy pRECEEDINg THE BaLaNCE SHEET DaTE
pariculars Financial year No.of SharesEquity shares alloted as fully paid - up pursuant to the demerger of Trading Unit of Innoves Animal Health Private Limited into the Company
2014-15 65
17 OTHER EquITy (Figures in `)
particulars as at 31 March 2018
as at 31 March 2017
as at 1 april 2016
Capital ReserveAs per Last Balance Sheet 9,424,089 9,424,089 9,424,089 Add: Addition during the year
- - -
9,424,089 9,424,089 9,424,089 Securities premium
As per Last Balance Sheet 175,067,105 175,067,105 175,067,105 Add: Addition during the year
- - -
175,067,105 175,067,105 175,067,105
general ReserveAs per Last Balance Sheet 342,262,311 312,262,311 287,262,961 Add: Transferred from Surplus in Statement of Profit and Loss
50,000,000 30,000,000 25,000,000
Less: Shares issued pursuant to the scheme of Amalgamation
- - 650
392,262,311 342,262,311 312,262,311
Surplus- Statement of profit & LossAs per Last Balance Sheet 609,094,321 432,644,995 285,636,085 Profit for the year 305,584,100 249,399,954 193,141,214 Add: Other Comprehensive Income
(1,217,819) (972,115) (911,700)
Add: Adjustment - - 10,495,346 913,460,602 681,072,835 488,360,945
Less: appropriations- Dividend (Including
Dividend Distribution Tax)
64,503,575 41,978,514 30,715,950
- Transferred to General Reserve
50,000,000 30,000,000 25,000,000
798,957,027 609,094,321 432,644,995 Total 1,375,710,532 1,135,847,825 929,398,500
Notes Forming Part of Financial Statements for the year ended 31 March 2018
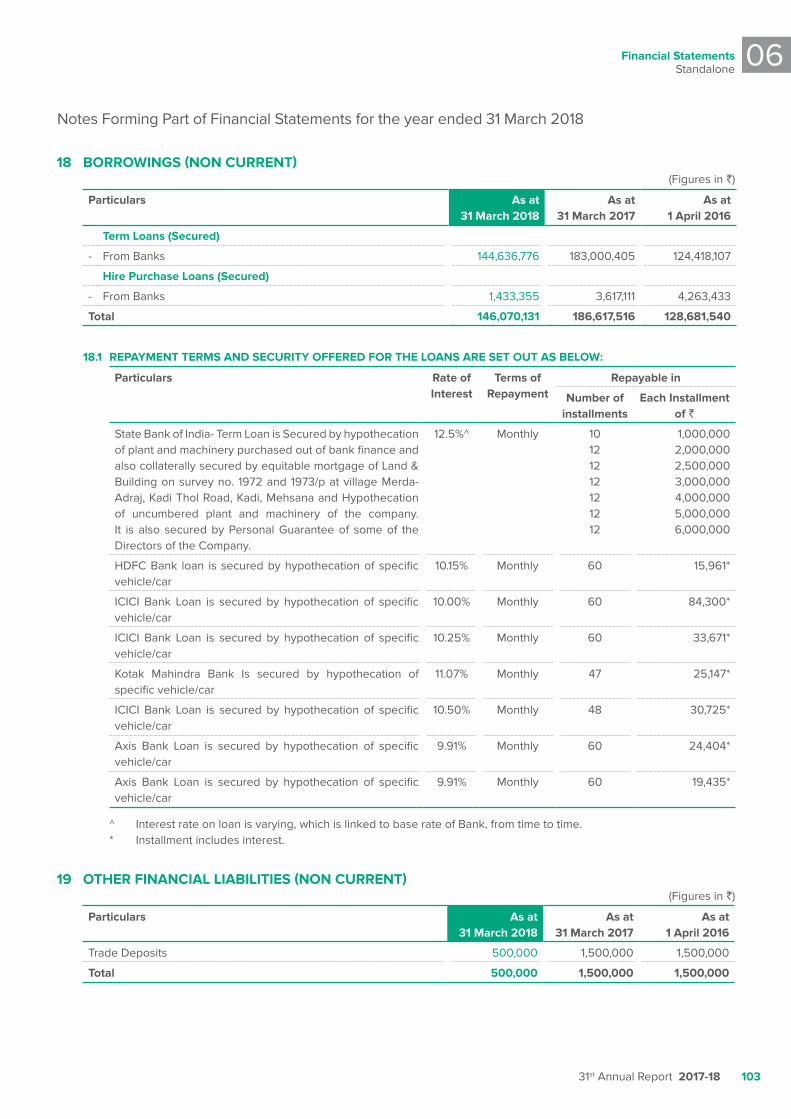
Financial StatementsStandalone
06
31st Annual Report 2017-18 103
18 BORROWINgS (NON CuRRENT)(Figures in `)
particulars as at 31 March 2018
as at 31 March 2017
as at 1 april 2016
Term Loans (Secured)
- From Banks 144,636,776 183,000,405 124,418,107
Hire purchase Loans (Secured)
- From Banks 1,433,355 3,617,111 4,263,433
Total 146,070,131 186,617,516 128,681,540
18.1 REpayMENT TERMS aND SECuRITy OFFERED FOR THE LOaNS aRE SET OuT aS BELOW:
particulars Rate of Interest
Terms of Repayment
Repayable in
Number of installments
Each Installment of `
State Bank of India- Term Loan is Secured by hypothecation of plant and machinery purchased out of bank finance and also collaterally secured by equitable mortgage of Land & Building on survey no. 1972 and 1973/p at village Merda-Adraj, Kadi Thol Road, Kadi, Mehsana and Hypothecation of uncumbered plant and machinery of the company. It is also secured by Personal Guarantee of some of the Directors of the Company.
12.5%^ Monthly 10 12 12 12 12 12 12
1,000,000 2,000,000 2,500,000 3,000,000 4,000,000 5,000,000 6,000,000
HDFC Bank loan is secured by hypothecation of specific vehicle/car
10.15% Monthly 60 15,961*
ICICI Bank Loan is secured by hypothecation of specific vehicle/car
10.00% Monthly 60 84,300*
ICICI Bank Loan is secured by hypothecation of specific vehicle/car
10.25% Monthly 60 33,671*
Kotak Mahindra Bank Is secured by hypothecation of specific vehicle/car
11.07% Monthly 47 25,147*
ICICI Bank Loan is secured by hypothecation of specific vehicle/car
10.50% Monthly 48 30,725*
Axis Bank Loan is secured by hypothecation of specific vehicle/car
9.91% Monthly 60 24,404*
Axis Bank Loan is secured by hypothecation of specific vehicle/car
9.91% Monthly 60 19,435*
^ Interest rate on loan is varying, which is linked to base rate of Bank, from time to time. * Installment includes interest.
19 OTHER FINaNCIaL LIaBILITIES (NON CuRRENT)(Figures in `)
particulars as at 31 March 2018
as at 31 March 2017
as at 1 april 2016
Trade Deposits 500,000 1,500,000 1,500,000
Total 500,000 1,500,000 1,500,000
Notes Forming Part of Financial Statements for the year ended 31 March 2018
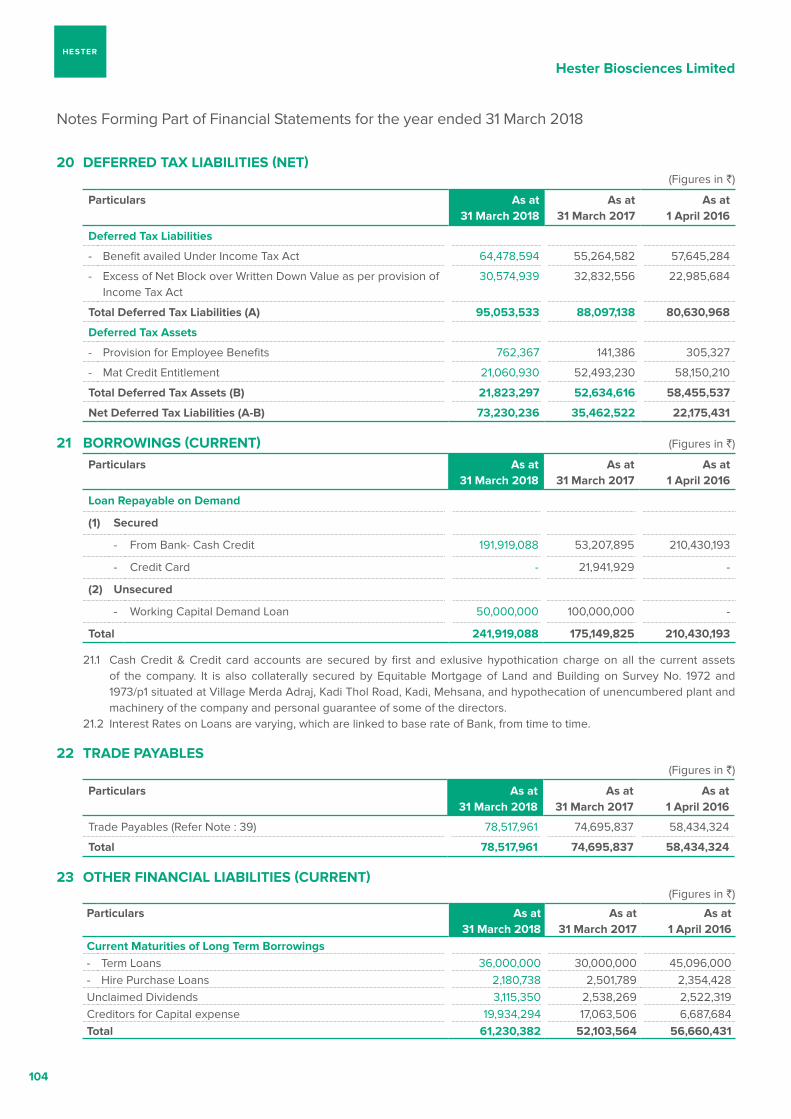
Hester Biosciences Limited
104
20 DEFERRED Tax LIaBILITIES (NET)(Figures in `)
particulars as at 31 March 2018
as at 31 March 2017
as at 1 april 2016
Deferred Tax Liabilities
- Benefit availed Under Income Tax Act 64,478,594 55,264,582 57,645,284
- Excess of Net Block over Written Down Value as per provision of Income Tax Act
30,574,939 32,832,556 22,985,684
Total Deferred Tax Liabilities (a) 95,053,533 88,097,138 80,630,968
Deferred Tax assets
- Provision for Employee Benefits 762,367 141,386 305,327
- Mat Credit Entitlement 21,060,930 52,493,230 58,150,210
Total Deferred Tax assets (B) 21,823,297 52,634,616 58,455,537
Net Deferred Tax Liabilities (a-B) 73,230,236 35,462,522 22,175,431
21 BORROWINgS (CuRRENT) (Figures in `)
particulars as at 31 March 2018
as at 31 March 2017
as at 1 april 2016
Loan Repayable on Demand
(1) Secured
- From Bank- Cash Credit 191,919,088 53,207,895 210,430,193
- Credit Card - 21,941,929 -
(2) unsecured
- Working Capital Demand Loan 50,000,000 100,000,000 -
Total 241,919,088 175,149,825 210,430,193
21.1 Cash Credit & Credit card accounts are secured by first and exlusive hypothication charge on all the current assets of the company. It is also collaterally secured by Equitable Mortgage of Land and Building on Survey No. 1972 and 1973/p1 situated at Village Merda Adraj, Kadi Thol Road, Kadi, Mehsana, and hypothecation of unencumbered plant and machinery of the company and personal guarantee of some of the directors.
21.2 Interest Rates on Loans are varying, which are linked to base rate of Bank, from time to time.
22 TRaDE payaBLES(Figures in `)
particulars as at 31 March 2018
as at 31 March 2017
as at 1 april 2016
Trade Payables (Refer Note : 39) 78,517,961 74,695,837 58,434,324
Total 78,517,961 74,695,837 58,434,324
23 OTHER FINaNCIaL LIaBILITIES (CuRRENT)(Figures in `)
particulars as at 31 March 2018
as at 31 March 2017
as at 1 april 2016
Current Maturities of Long Term Borrowings- Term Loans 36,000,000 30,000,000 45,096,000 - Hire Purchase Loans 2,180,738 2,501,789 2,354,428 Unclaimed Dividends 3,115,350 2,538,269 2,522,319 Creditors for Capital expense 19,934,294 17,063,506 6,687,684 Total 61,230,382 52,103,564 56,660,431
Notes Forming Part of Financial Statements for the year ended 31 March 2018
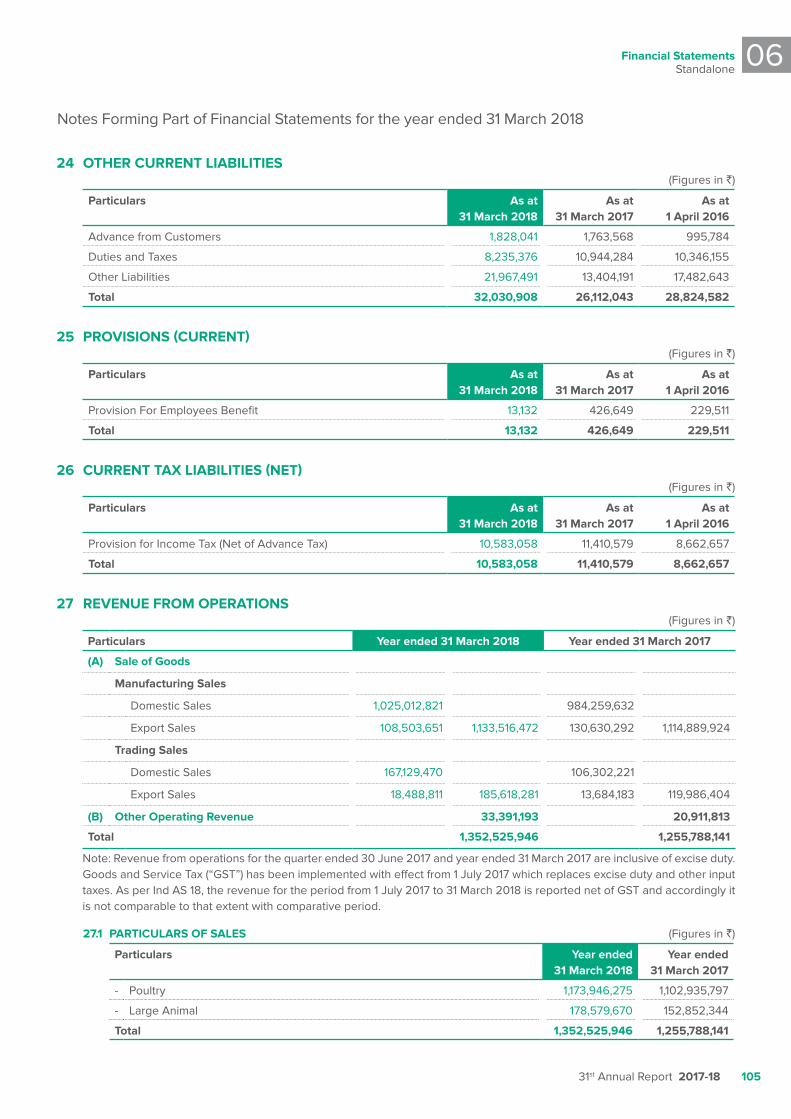
Financial StatementsStandalone
06
31st Annual Report 2017-18 105
24 OTHER CuRRENT LIaBILITIES(Figures in `)
particulars as at 31 March 2018
as at 31 March 2017
as at 1 april 2016
Advance from Customers 1,828,041 1,763,568 995,784
Duties and Taxes 8,235,376 10,944,284 10,346,155
Other Liabilities 21,967,491 13,404,191 17,482,643
Total 32,030,908 26,112,043 28,824,582
25 pROvISIONS (CuRRENT) (Figures in `)
particulars as at 31 March 2018
as at 31 March 2017
as at 1 april 2016
Provision For Employees Benefit 13,132 426,649 229,511
Total 13,132 426,649 229,511
26 CuRRENT Tax LIaBILITIES (NET)(Figures in `)
particulars as at 31 March 2018
as at 31 March 2017
as at 1 april 2016
Provision for Income Tax (Net of Advance Tax) 10,583,058 11,410,579 8,662,657
Total 10,583,058 11,410,579 8,662,657
27 REvENuE FROM OpERaTIONS(Figures in `)
particulars year ended 31 March 2018 year ended 31 March 2017
(a) Sale of goods
Manufacturing Sales
Domestic Sales 1,025,012,821 984,259,632
Export Sales 108,503,651 1,133,516,472 130,630,292 1,114,889,924
Trading Sales
Domestic Sales 167,129,470 106,302,221
Export Sales 18,488,811 185,618,281 13,684,183 119,986,404
(B) Other Operating Revenue 33,391,193 20,911,813
Total 1,352,525,946 1,255,788,141
Note: Revenue from operations for the quarter ended 30 June 2017 and year ended 31 March 2017 are inclusive of excise duty. Goods and Service Tax (“GST”) has been implemented with effect from 1 July 2017 which replaces excise duty and other input taxes. As per Ind AS 18, the revenue for the period from 1 July 2017 to 31 March 2018 is reported net of GST and accordingly it is not comparable to that extent with comparative period.
27.1 paRTICuLaRS OF SaLES (Figures in `)
particulars year ended 31 March 2018
year ended 31 March 2017
- Poultry 1,173,946,275 1,102,935,797
- Large Animal 178,579,670 152,852,344
Total 1,352,525,946 1,255,788,141
Notes Forming Part of Financial Statements for the year ended 31 March 2018
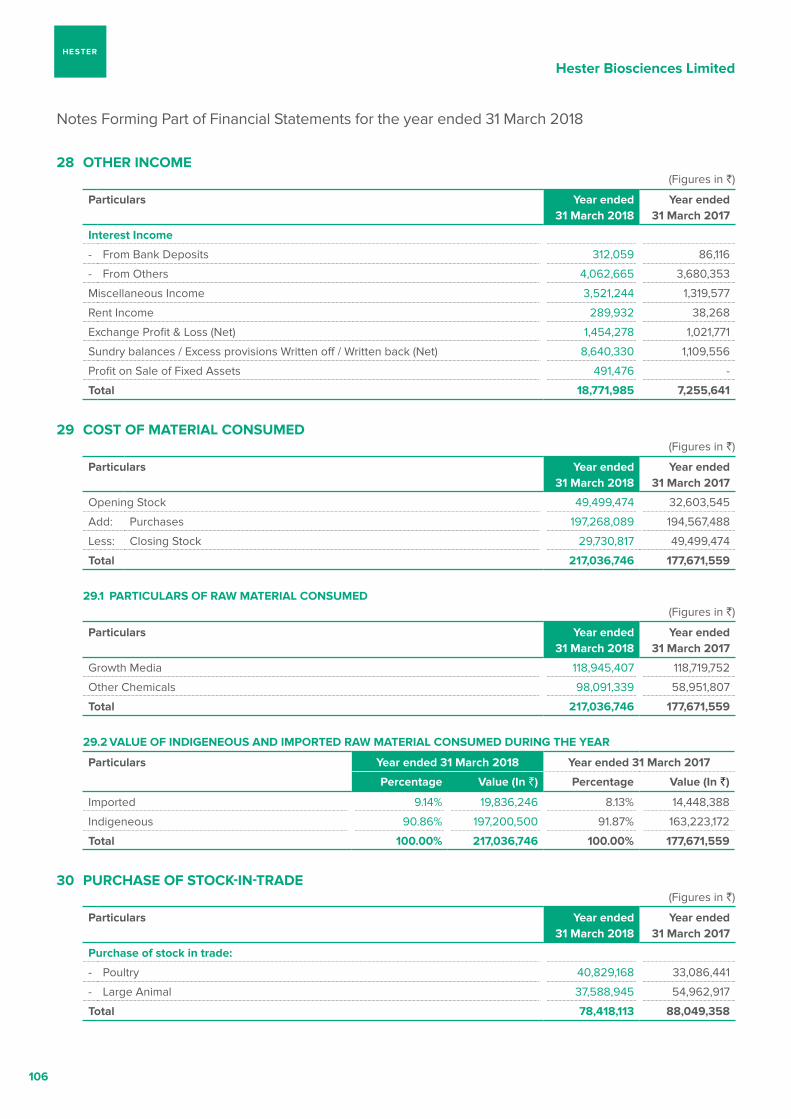
Hester Biosciences Limited
106
28 OTHER INCOME(Figures in `)
particulars year ended 31 March 2018
year ended 31 March 2017
Interest Income
- From Bank Deposits 312,059 86,116
- From Others 4,062,665 3,680,353
Miscellaneous Income 3,521,244 1,319,577
Rent Income 289,932 38,268
Exchange Profit & Loss (Net) 1,454,278 1,021,771
Sundry balances / Excess provisions Written off / Written back (Net) 8,640,330 1,109,556
Profit on Sale of Fixed Assets 491,476 -
Total 18,771,985 7,255,641
29 COST OF MaTERIaL CONSuMED(Figures in `)
particulars year ended 31 March 2018
year ended 31 March 2017
Opening Stock 49,499,474 32,603,545
Add: Purchases 197,268,089 194,567,488
Less: Closing Stock 29,730,817 49,499,474
Total 217,036,746 177,671,559
29.1 paRTICuLaRS OF RaW MaTERIaL CONSuMED(Figures in `)
particulars year ended 31 March 2018
year ended 31 March 2017
Growth Media 118,945,407 118,719,752
Other Chemicals 98,091,339 58,951,807
Total 217,036,746 177,671,559
29.2 vaLuE OF INDIgENEOuS aND IMpORTED RaW MaTERIaL CONSuMED DuRINg THE yEaR
particulars year ended 31 March 2018 year ended 31 March 2017
percentage value (In `) percentage value (In `)
Imported 9.14% 19,836,246 8.13% 14,448,388
Indigeneous 90.86% 197,200,500 91.87% 163,223,172
Total 100.00% 217,036,746 100.00% 177,671,559
30 puRCHaSE OF STOCk-IN-TRaDE(Figures in `)
particulars year ended 31 March 2018
year ended 31 March 2017
purchase of stock in trade:
- Poultry 40,829,168 33,086,441
- Large Animal 37,588,945 54,962,917
Total 78,418,113 88,049,358
Notes Forming Part of Financial Statements for the year ended 31 March 2018
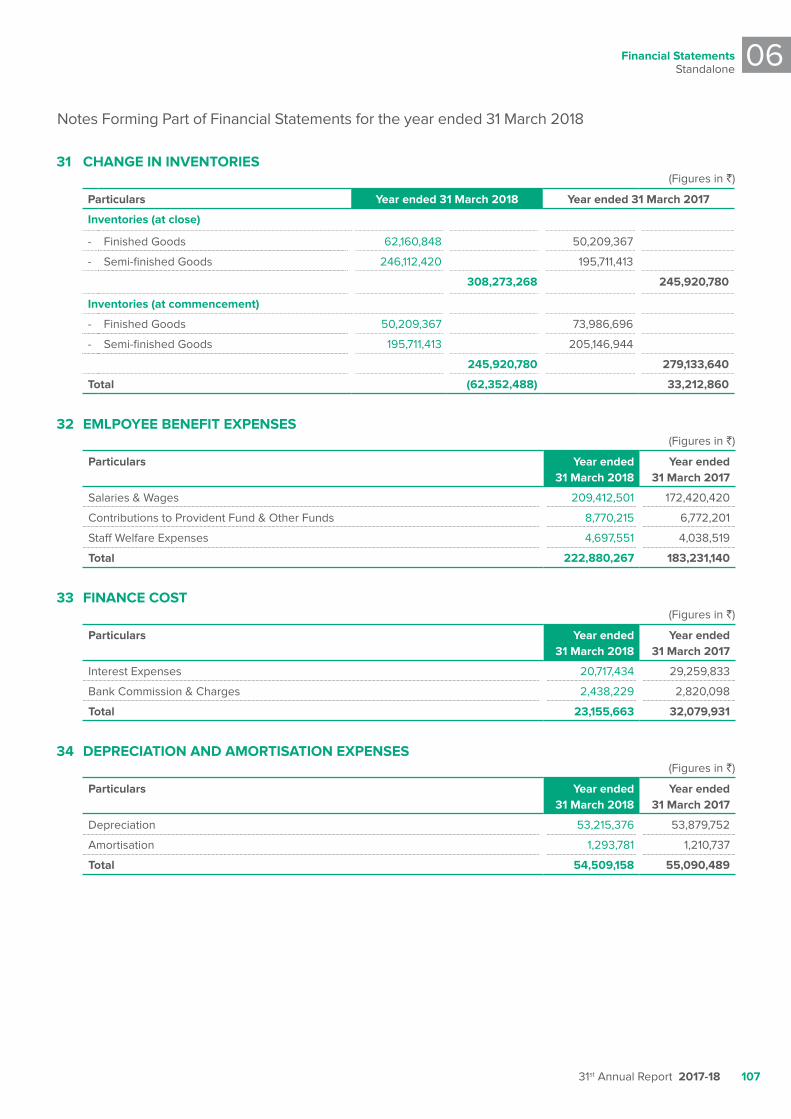
Financial StatementsStandalone
06
31st Annual Report 2017-18 107
31 CHaNgE IN INvENTORIES(Figures in `)
particulars year ended 31 March 2018 year ended 31 March 2017
Inventories (at close)
- Finished Goods 62,160,848 50,209,367
- Semi-finished Goods 246,112,420 195,711,413
308,273,268 245,920,780
Inventories (at commencement)
- Finished Goods 50,209,367 73,986,696
- Semi-finished Goods 195,711,413 205,146,944
245,920,780 279,133,640
Total (62,352,488) 33,212,860
32 EMLpOyEE BENEFIT ExpENSES(Figures in `)
particulars year ended 31 March 2018
year ended 31 March 2017
Salaries & Wages 209,412,501 172,420,420
Contributions to Provident Fund & Other Funds 8,770,215 6,772,201
Staff Welfare Expenses 4,697,551 4,038,519
Total 222,880,267 183,231,140
33 FINaNCE COST(Figures in `)
particulars year ended 31 March 2018
year ended 31 March 2017
Interest Expenses 20,717,434 29,259,833
Bank Commission & Charges 2,438,229 2,820,098
Total 23,155,663 32,079,931
34 DEpRECIaTION aND aMORTISaTION ExpENSES(Figures in `)
particulars year ended 31 March 2018
year ended 31 March 2017
Depreciation 53,215,376 53,879,752
Amortisation 1,293,781 1,210,737
Total 54,509,158 55,090,489
Notes Forming Part of Financial Statements for the year ended 31 March 2018
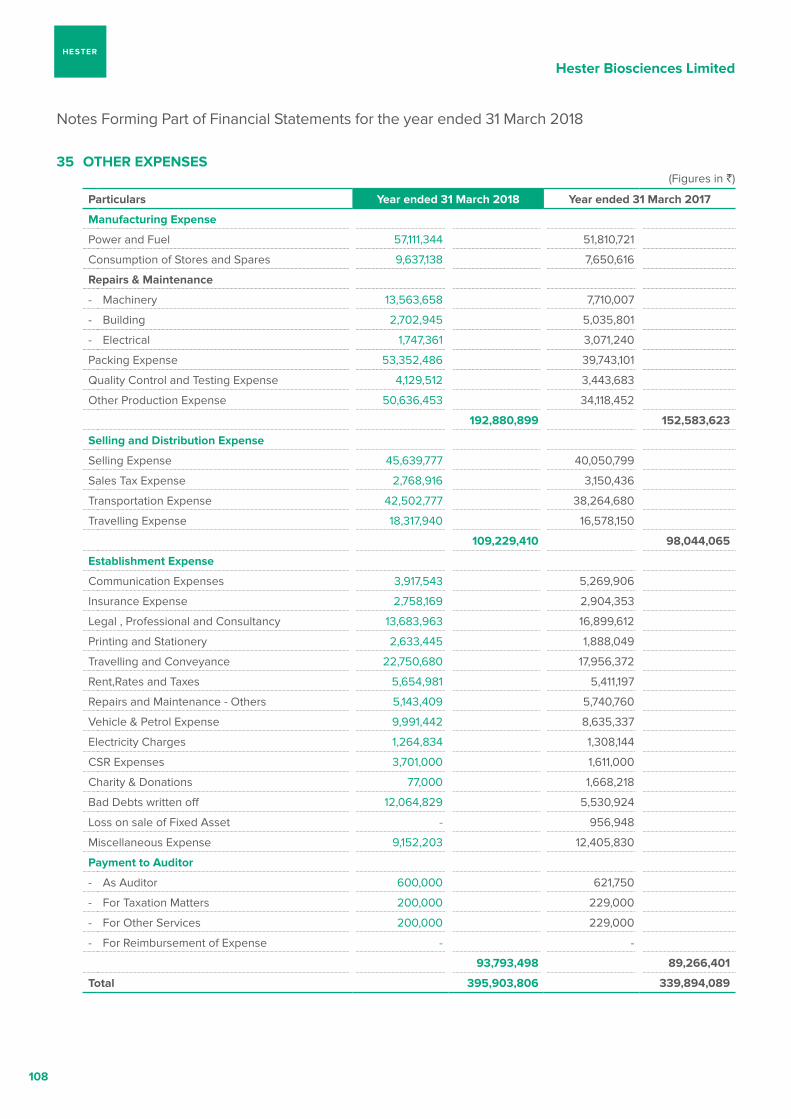
Hester Biosciences Limited
108
35 OTHER ExpENSES(Figures in `)
particulars year ended 31 March 2018 year ended 31 March 2017
Manufacturing Expense
Power and Fuel 57,111,344 51,810,721
Consumption of Stores and Spares 9,637,138 7,650,616
Repairs & Maintenance
- Machinery 13,563,658 7,710,007
- Building 2,702,945 5,035,801
- Electrical 1,747,361 3,071,240
Packing Expense 53,352,486 39,743,101
Quality Control and Testing Expense 4,129,512 3,443,683
Other Production Expense 50,636,453 34,118,452
192,880,899 152,583,623
Selling and Distribution Expense
Selling Expense 45,639,777 40,050,799
Sales Tax Expense 2,768,916 3,150,436
Transportation Expense 42,502,777 38,264,680
Travelling Expense 18,317,940 16,578,150
109,229,410 98,044,065
Establishment Expense
Communication Expenses 3,917,543 5,269,906
Insurance Expense 2,758,169 2,904,353
Legal , Professional and Consultancy 13,683,963 16,899,612
Printing and Stationery 2,633,445 1,888,049
Travelling and Conveyance 22,750,680 17,956,372
Rent,Rates and Taxes 5,654,981 5,411,197
Repairs and Maintenance - Others 5,143,409 5,740,760
Vehicle & Petrol Expense 9,991,442 8,635,337
Electricity Charges 1,264,834 1,308,144
CSR Expenses 3,701,000 1,611,000
Charity & Donations 77,000 1,668,218
Bad Debts written off 12,064,829 5,530,924
Loss on sale of Fixed Asset - 956,948
Miscellaneous Expense 9,152,203 12,405,830
payment to auditor
- As Auditor 600,000 621,750
- For Taxation Matters 200,000 229,000
- For Other Services 200,000 229,000
- For Reimbursement of Expense - -
93,793,498 89,266,401
Total 395,903,806 339,894,089
Notes Forming Part of Financial Statements for the year ended 31 March 2018
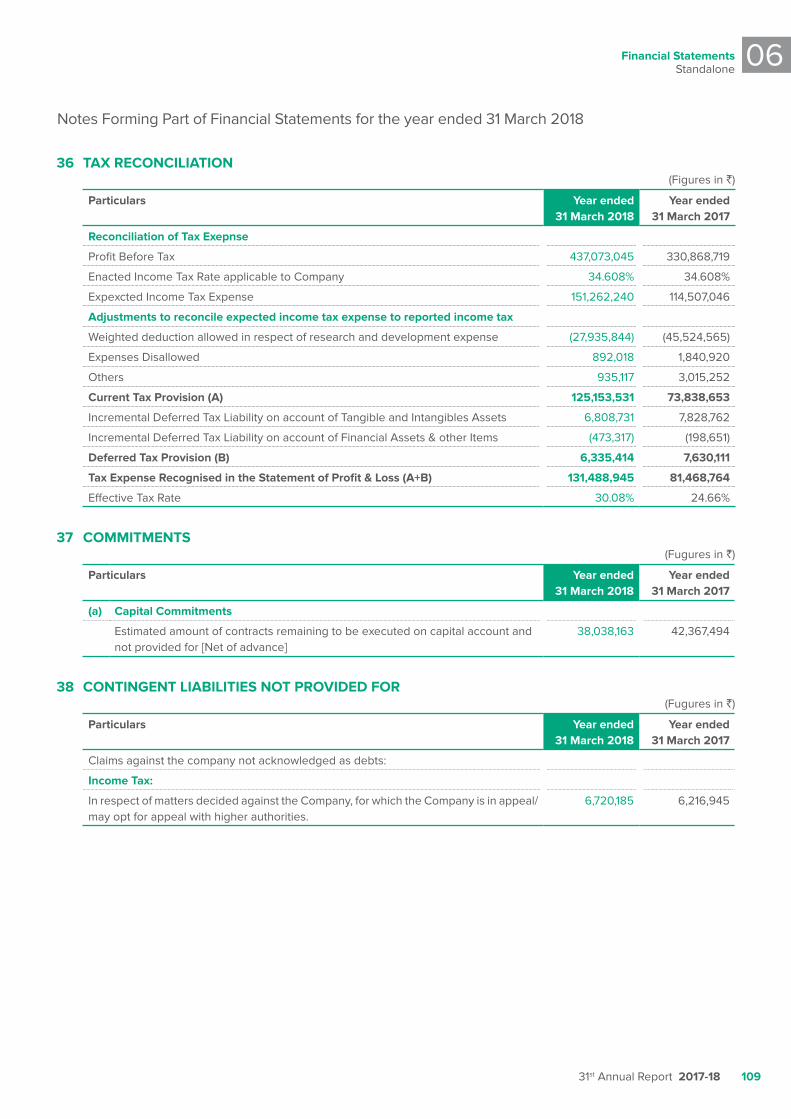
Financial StatementsStandalone
06
31st Annual Report 2017-18 109
36 Tax RECONCILIaTION(Figures in `)
particulars year ended 31 March 2018
year ended 31 March 2017
Reconciliation of Tax Exepnse
Profit Before Tax 437,073,045 330,868,719
Enacted Income Tax Rate applicable to Company 34.608% 34.608%
Expexcted Income Tax Expense 151,262,240 114,507,046
adjustments to reconcile expected income tax expense to reported income tax
Weighted deduction allowed in respect of research and development expense (27,935,844) (45,524,565)
Expenses Disallowed 892,018 1,840,920
Others 935,117 3,015,252
Current Tax provision (a) 125,153,531 73,838,653
Incremental Deferred Tax Liability on account of Tangible and Intangibles Assets 6,808,731 7,828,762
Incremental Deferred Tax Liability on account of Financial Assets & other Items (473,317) (198,651)
Deferred Tax provision (B) 6,335,414 7,630,111
Tax Expense Recognised in the Statement of profit & Loss (a+B) 131,488,945 81,468,764
Effective Tax Rate 30.08% 24.66%
37 COMMITMENTS(Fugures in `)
particulars year ended 31 March 2018
year ended 31 March 2017
(a) Capital Commitments
Estimated amount of contracts remaining to be executed on capital account and not provided for [Net of advance]
38,038,163 42,367,494
38 CONTINgENT LIaBILITIES NOT pROvIDED FOR(Fugures in `)
particulars year ended 31 March 2018
year ended 31 March 2017
Claims against the company not acknowledged as debts:
Income Tax:
In respect of matters decided against the Company, for which the Company is in appeal/may opt for appeal with higher authorities.
6,720,185 6,216,945
Notes Forming Part of Financial Statements for the year ended 31 March 2018
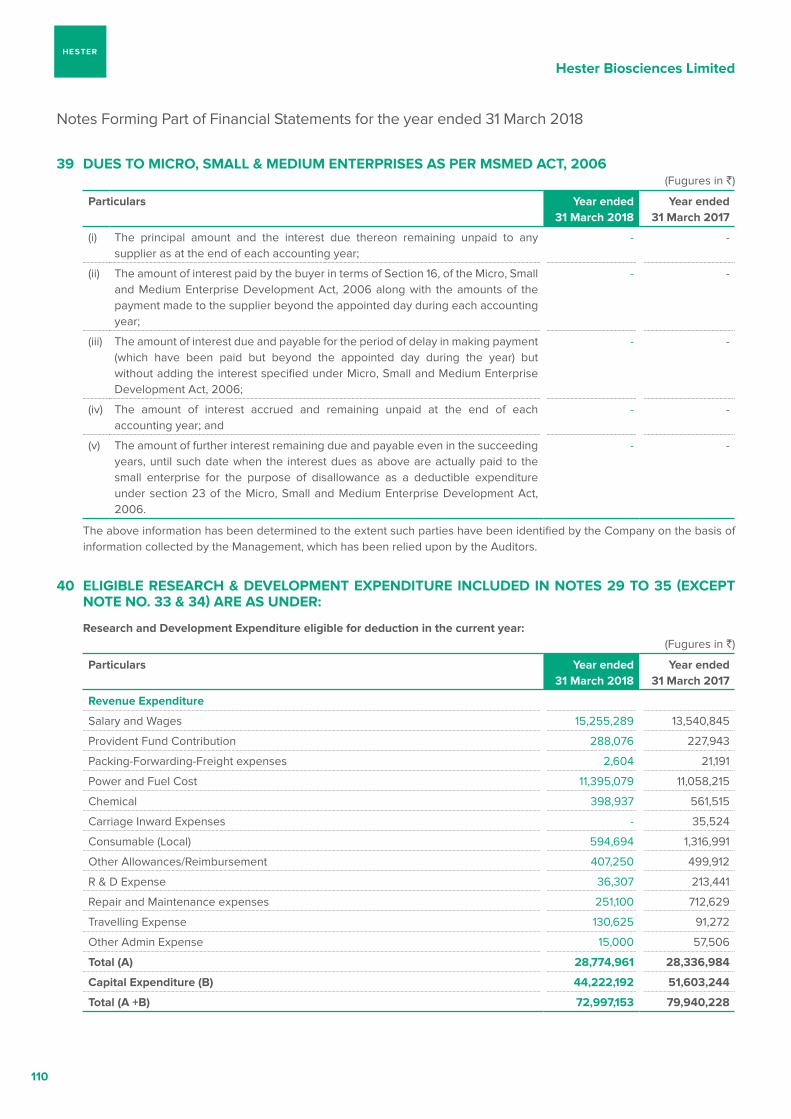
Hester Biosciences Limited
110
39 DuES TO MICRO, SMaLL & MEDIuM ENTERpRISES aS pER MSMED aCT, 2006(Fugures in `)
particulars year ended 31 March 2018
year ended 31 March 2017
(i) The principal amount and the interest due thereon remaining unpaid to any supplier as at the end of each accounting year;
- -
(ii) The amount of interest paid by the buyer in terms of Section 16, of the Micro, Small and Medium Enterprise Development Act, 2006 along with the amounts of the payment made to the supplier beyond the appointed day during each accounting year;
- -
(iii) The amount of interest due and payable for the period of delay in making payment (which have been paid but beyond the appointed day during the year) but without adding the interest specified under Micro, Small and Medium Enterprise Development Act, 2006;
- -
(iv) The amount of interest accrued and remaining unpaid at the end of each accounting year; and
- -
(v) The amount of further interest remaining due and payable even in the succeeding years, until such date when the interest dues as above are actually paid to the small enterprise for the purpose of disallowance as a deductible expenditure under section 23 of the Micro, Small and Medium Enterprise Development Act, 2006.
- -
The above information has been determined to the extent such parties have been identified by the Company on the basis of information collected by the Management, which has been relied upon by the Auditors.
40 ELIgIBLE RESEaRCH & DEvELOpMENT ExpENDITuRE INCLuDED IN NOTES 29 TO 35 (ExCEpT NOTE NO. 33 & 34) aRE aS uNDER:
Research and Development Expenditure eligible for deduction in the current year:(Fugures in `)
particulars year ended 31 March 2018
year ended 31 March 2017
Revenue Expenditure
Salary and Wages 15,255,289 13,540,845
Provident Fund Contribution 288,076 227,943
Packing-Forwarding-Freight expenses 2,604 21,191
Power and Fuel Cost 11,395,079 11,058,215
Chemical 398,937 561,515
Carriage Inward Expenses - 35,524
Consumable (Local) 594,694 1,316,991
Other Allowances/Reimbursement 407,250 499,912
R & D Expense 36,307 213,441
Repair and Maintenance expenses 251,100 712,629
Travelling Expense 130,625 91,272
Other Admin Expense 15,000 57,506
Total (a) 28,774,961 28,336,984
Capital Expenditure (B) 44,222,192 51,603,244
Total (a +B) 72,997,153 79,940,228
Notes Forming Part of Financial Statements for the year ended 31 March 2018
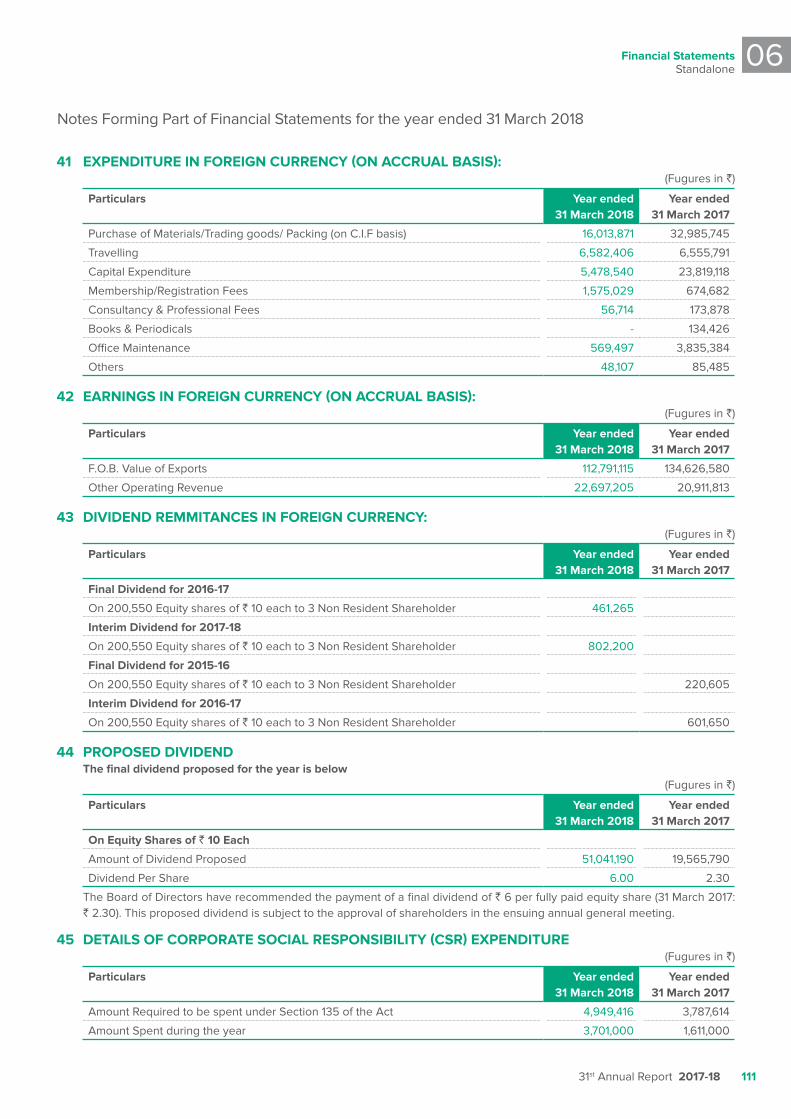
Financial StatementsStandalone
06
31st Annual Report 2017-18 111
41 ExpENDITuRE IN FOREIgN CuRRENCy (ON aCCRuaL BaSIS):(Fugures in `)
particulars year ended 31 March 2018
year ended 31 March 2017
Purchase of Materials/Trading goods/ Packing (on C.I.F basis) 16,013,871 32,985,745
Travelling 6,582,406 6,555,791
Capital Expenditure 5,478,540 23,819,118
Membership/Registration Fees 1,575,029 674,682
Consultancy & Professional Fees 56,714 173,878
Books & Periodicals - 134,426
Office Maintenance 569,497 3,835,384
Others 48,107 85,485
42 EaRNINgS IN FOREIgN CuRRENCy (ON aCCRuaL BaSIS):(Fugures in `)
particulars year ended 31 March 2018
year ended 31 March 2017
F.O.B. Value of Exports 112,791,115 134,626,580
Other Operating Revenue 22,697,205 20,911,813
43 DIvIDEND REMMITaNCES IN FOREIgN CuRRENCy:(Fugures in `)
particulars year ended 31 March 2018
year ended 31 March 2017
Final Dividend for 2016-17
On 200,550 Equity shares of ` 10 each to 3 Non Resident Shareholder 461,265
Interim Dividend for 2017-18
On 200,550 Equity shares of ` 10 each to 3 Non Resident Shareholder 802,200
Final Dividend for 2015-16
On 200,550 Equity shares of ` 10 each to 3 Non Resident Shareholder 220,605
Interim Dividend for 2016-17
On 200,550 Equity shares of ` 10 each to 3 Non Resident Shareholder 601,650
44 pROpOSED DIvIDEND The final dividend proposed for the year is below
(Fugures in `)
particulars year ended 31 March 2018
year ended 31 March 2017
On Equity Shares of ` 10 Each
Amount of Dividend Proposed 51,041,190 19,565,790
Dividend Per Share 6.00 2.30
The Board of Directors have recommended the payment of a final dividend of ` 6 per fully paid equity share (31 March 2017: ` 2.30). This proposed dividend is subject to the approval of shareholders in the ensuing annual general meeting.
45 DETaILS OF CORpORaTE SOCIaL RESpONSIBILITy (CSR) ExpENDITuRE(Fugures in `)
particulars year ended 31 March 2018
year ended 31 March 2017
Amount Required to be spent under Section 135 of the Act 4,949,416 3,787,614
Amount Spent during the year 3,701,000 1,611,000
Notes Forming Part of Financial Statements for the year ended 31 March 2018
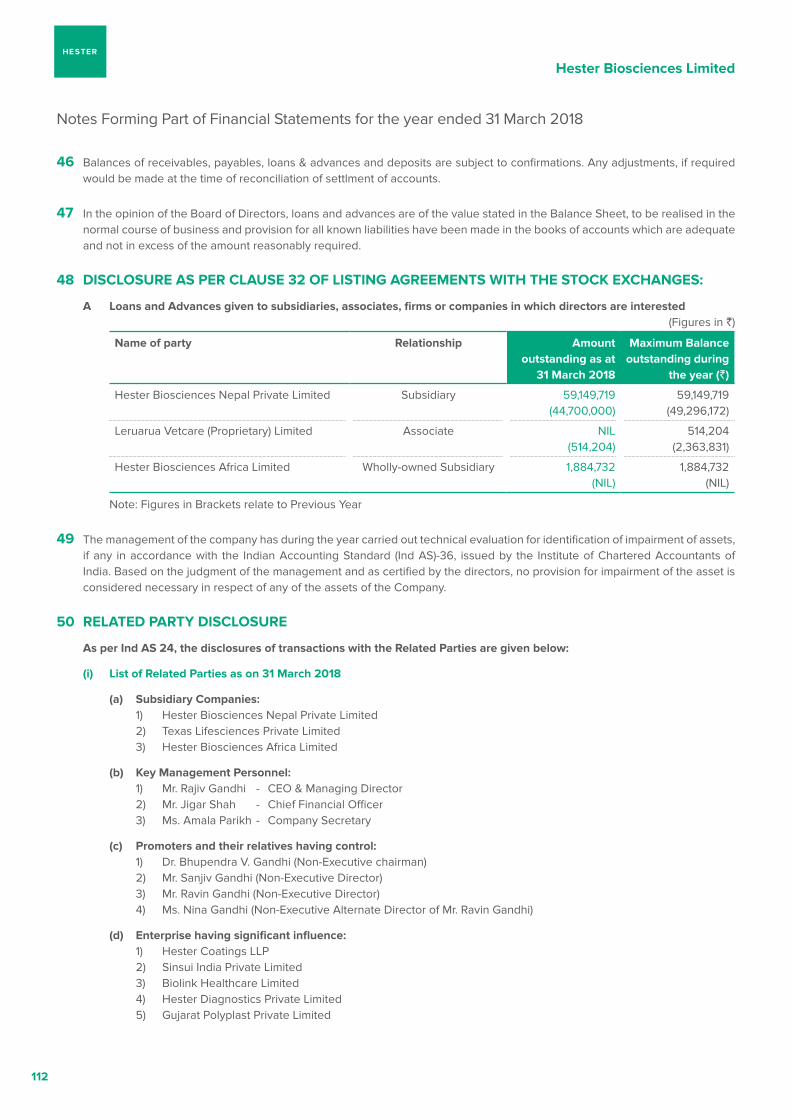
Hester Biosciences Limited
112
46 Balances of receivables, payables, loans & advances and deposits are subject to confirmations. Any adjustments, if required would be made at the time of reconciliation of settlment of accounts.
47 In the opinion of the Board of Directors, loans and advances are of the value stated in the Balance Sheet, to be realised in the normal course of business and provision for all known liabilities have been made in the books of accounts which are adequate and not in excess of the amount reasonably required.
48 DISCLOSuRE aS pER CLauSE 32 OF LISTINg agREEMENTS WITH THE STOCk ExCHaNgES:
a Loans and advances given to subsidiaries, associates, firms or companies in which directors are interested(Figures in `)
Name of party Relationship amount outstanding as at
31 March 2018
Maximum Balance outstanding during
the year (`)
Hester Biosciences Nepal Private Limited Subsidiary 59,149,719 (44,700,000)
59,149,719 (49,296,172)
Leruarua Vetcare (Proprietary) Limited Associate NIL (514,204)
514,204 (2,363,831)
Hester Biosciences Africa Limited Wholly-owned Subsidiary 1,884,732 (NIL)
1,884,732 (NIL)
Note: Figures in Brackets relate to Previous Year
49 The management of the company has during the year carried out technical evaluation for identification of impairment of assets, if any in accordance with the Indian Accounting Standard (Ind AS)-36, issued by the Institute of Chartered Accountants of India. Based on the judgment of the management and as certified by the directors, no provision for impairment of the asset is considered necessary in respect of any of the assets of the Company.
50 RELaTED paRTy DISCLOSuRE
as per Ind aS 24, the disclosures of transactions with the Related parties are given below:
(i) List of Related parties as on 31 March 2018
(a) Subsidiary Companies: 1) Hester Biosciences Nepal Private Limited 2) Texas Lifesciences Private Limited 3) Hester Biosciences Africa Limited
(b) key Management personnel: 1) Mr. Rajiv Gandhi - CEO & Managing Director 2) Mr. Jigar Shah - Chief Financial Officer 3) Ms. Amala Parikh - Company Secretary
(c) promoters and their relatives having control: 1) Dr. Bhupendra V. Gandhi (Non-Executive chairman) 2) Mr. Sanjiv Gandhi (Non-Executive Director) 3) Mr. Ravin Gandhi (Non-Executive Director) 4) Ms. Nina Gandhi (Non-Executive Alternate Director of Mr. Ravin Gandhi)
(d) Enterprise having significant influence: 1) Hester Coatings LLP 2) Sinsui India Private Limited 3) Biolink Healthcare Limited 4) Hester Diagnostics Private Limited 5) Gujarat Polyplast Private Limited
Notes Forming Part of Financial Statements for the year ended 31 March 2018
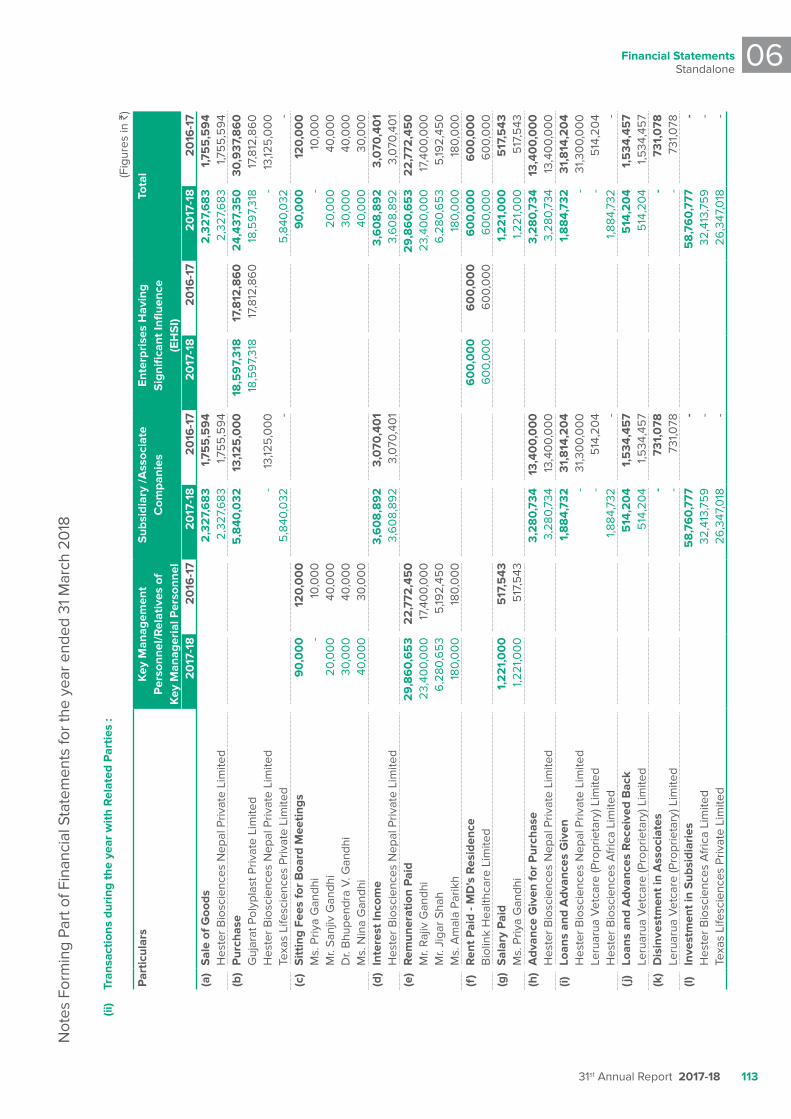
Financial StatementsStandalone
06
31st Annual Report 2017-18 113
(ii
) Tr
ansa
ctio
ns d
urin
g th
e ye
ar w
ith R
elat
ed p
artie
s :
(Fig
ures
in `
)
par
ticul
ars
key
Man
agem
ent
per
sonn
el/R
elat
ives
of
key
Man
ager
ial p
erso
nnel
Sub
sidi
ary
/ass
ocia
te
Com
pani
esEn
terp
rise
s H
avin
g S
igni
fican
t Infl
uenc
e (E
HS
I)
Tota
l
20
17-1
82
016
-17
20
17-1
82
016
-17
20
17-1
82
016
-17
20
17-1
82
016
-17
(a)
Sal
e of
goo
ds
2
,32
7,6
83
1,7
55
,59
4 2
,32
7,6
83
1,7
55
,59
4 H
este
r Bio
scie
nces
Nep
al P
rivat
e Li
mite
d 2
,327
,683
1
,75
5,5
94
2,3
27,6
83
1,7
55
,59
4 (b
)p
urch
ase
5,8
40,0
32 1
3,12
5,0
00
18
,59
7,31
8
17,
812
,86
0
24,
437,
350
3
0,9
37,8
60
G
ujar
at P
olyp
last
Priv
ate
Lim
ited
18,
59
7,31
8 1
7,81
2,86
0 1
8,5
97,
318
17,
812,
860
H
este
r Bio
scie
nces
Nep
al P
rivat
e Li
mite
d -
13,
125
,00
0
- 1
3,12
5,0
00
Te
xas
Life
scie
nces
Priv
ate
Lim
ited
5,8
40,0
32
- 5
,840
,032
-
(c)
Sitt
ing
Fees
for
Boa
rd M
eetin
gs 9
0,0
00
1
20
,00
0
90
,00
0
12
0,0
00
M
s. P
riya
Gan
dhi
- 1
0,0
00
-
10,
00
0
Mr.
Sanj
iv G
andh
i 2
0,0
00
4
0,0
00
2
0,0
00
4
0,0
00
D
r. B
hupe
ndra
V. G
andh
i 3
0,0
00
4
0,0
00
3
0,0
00
4
0,0
00
M
s. N
ina
Gan
dhi
40,
00
0
30,
00
0
40,
00
0
30,
00
0
(d)
Inte
rest
Inco
me
3,6
08
,89
2
3,0
70,4
01
3,6
08
,89
2
3,0
70,4
01
Hes
ter B
iosc
ienc
es N
epal
Priv
ate
Lim
ited
3,6
08,
892
3,0
70,4
01
3,6
08,
892
3,0
70,4
01
(e)
Rem
uner
atio
n p
aid
29,
86
0,6
53
22
,772
,45
0
29,
86
0,6
53
22
,772
,45
0
Mr.
Rajiv
Gan
dhi
23,
400,
00
0
17,
400,
00
0
23,
400,
00
0
17,
400,
00
0
Mr.
Jiga
r Sha
h 6
,280
,65
3 5
,192,
450
6
,280
,65
3 5
,192,
450
M
s. A
mal
a Pa
rikh
180
,00
0
180
,00
0
180
,00
0
180
,00
0
(f)
Ren
t pai
d - M
D's
Res
iden
ce 6
00
,00
0
60
0,0
00
6
00
,00
0
60
0,0
00
B
iolin
k H
ealth
care
Lim
ited
60
0,0
00
6
00,
00
0
60
0,0
00
6
00,
00
0
(g)
Sal
ary
pai
d 1
,22
1,0
00
5
17,5
43
1,2
21,
00
0
517
,543
M
s. P
riya
Gan
dhi
1,2
21,0
00
5
17,5
43
1,2
21,0
00
5
17,5
43
(h)
adv
ance
giv
en fo
r p
urch
ase
3,2
80
,734
1
3,40
0,0
00
3
,28
0,7
34
13,
400
,00
0
Hes
ter B
iosc
ienc
es N
epal
Priv
ate
Lim
ited
3,2
80,7
34
13,
400,
00
0
3,2
80,7
34
13,
400,
00
0
(i)Lo
ans
and
adv
ance
s g
iven
1,8
84,
732
3
1,8
14,2
04
1,8
84,
732
3
1,8
14,2
04
Hes
ter B
iosc
ienc
es N
epal
Priv
ate
Lim
ited
- 3
1,30
0,0
00
-
31,3
00,
00
0
Leru
arua
Vet
care
(Pro
prie
tary
) Lim
ited
- 5
14,2
04
- 5
14,2
04
Hes
ter B
iosc
ienc
es A
fric
a Li
mite
d 1
,884
,732
-
1,8
84,7
32
- (j
)Lo
ans
and
adv
ance
s R
ecei
ved
Bac
k 5
14,2
04
1,5
34,4
57
514
,20
4 1
,534
,45
7 Le
ruar
ua V
etca
re (P
ropr
ieta
ry) L
imite
d 5
14,2
04
1,5
34,4
57
514
,20
4 1
,534
,45
7 (k
)D
isin
vest
men
t in
ass
ocia
tes
- 7
31,0
78
- 7
31,0
78
Leru
arua
Vet
care
(Pro
prie
tary
) Lim
ited
- 7
31,0
78
- 7
31,0
78
(l)In
vest
men
t in
Sub
sidi
arie
s 5
8,7
60
,777
-
58
,76
0,7
77
- H
este
r Bio
scie
nces
Afr
ica
Lim
ited
32,
413,
759
-
32,
413,
759
-
Texa
s Li
fesc
ienc
es P
rivat
e Li
mite
d 2
6,3
47,0
18
- 2
6,3
47,0
18
-
Not
es F
orm
ing
Part
of F
inan
cial
Sta
tem
ents
for t
he y
ear e
nded
31 M
arch
20
18
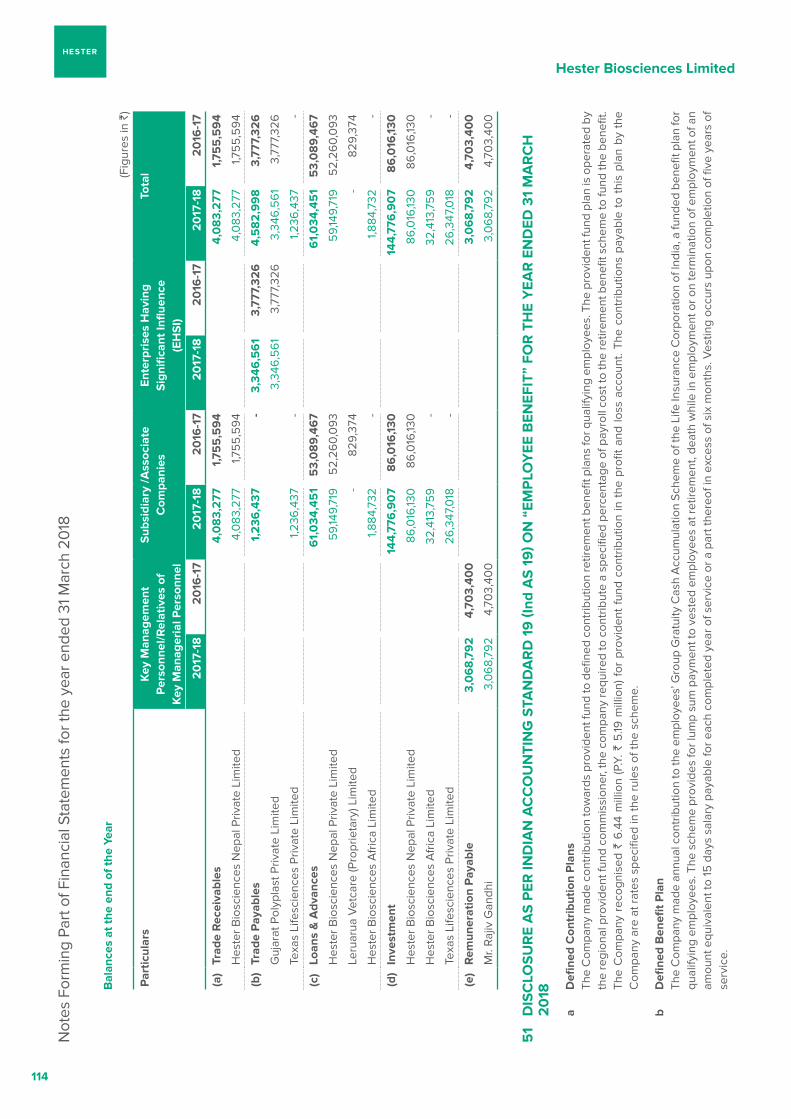
Hester Biosciences Limited
114
Bal
ance
s at
the
end
of th
e ye
ar(F
igur
es in
`)
par
ticul
ars
key
Man
agem
ent
per
sonn
el/R
elat
ives
of
key
Man
ager
ial p
erso
nnel
Sub
sidi
ary
/ass
ocia
te
Com
pani
esEn
terp
rise
s H
avin
g S
igni
fican
t Infl
uenc
e (E
HS
I)
Tota
l
20
17-1
82
016
-17
20
17-1
82
016
-17
20
17-1
82
016
-17
20
17-1
82
016
-17
(a)
Trad
e R
ecei
vabl
es 4
,08
3,2
77
1,7
55
,59
4 4
,08
3,2
77
1,7
55
,59
4
Hes
ter B
iosc
ienc
es N
epal
Priv
ate
Lim
ited
4,0
83,2
77
1,7
55
,59
4 4
,083
,277
1
,75
5,5
94
(b)
Trad
e p
ayab
les
1,2
36,4
37
- 3
,346
,56
1 3
,777
,32
6
4,5
82
,99
8
3,7
77,3
26
Guj
arat
Pol
ypla
st P
rivat
e Li
mite
d 3
,346
,56
1 3
,777
,326
3
,346
,56
1 3
,777
,326
Texa
s Li
fesc
ienc
es P
rivat
e Li
mite
d 1
,236
,437
-
1,2
36,4
37
-
(c)
Loan
s &
adv
ance
s 6
1,0
34,4
51
53,
08
9,46
7 6
1,0
34,4
51
53,
08
9,46
7
Hes
ter B
iosc
ienc
es N
epal
Priv
ate
Lim
ited
59,
149,
719
5
2,26
0,0
93
59,
149,
719
5
2,26
0,0
93
Leru
arua
Vet
care
(Pro
prie
tary
) Lim
ited
- 8
29,3
74
- 8
29,3
74
Hes
ter B
iosc
ienc
es A
fric
a Li
mite
d 1
,884
,732
-
1,8
84,7
32
-
(d)
Inve
stm
ent
144,
776
,90
7 8
6,0
16,13
0
144,
776
,90
7 8
6,0
16,13
0
Hes
ter B
iosc
ienc
es N
epal
Priv
ate
Lim
ited
86
,016
,130
8
6,0
16,13
0
86
,016
,130
8
6,0
16,13
0
Hes
ter B
iosc
ienc
es A
fric
a Li
mite
d 3
2,41
3,75
9
- 3
2,41
3,75
9
-
Texa
s Li
fesc
ienc
es P
rivat
e Li
mite
d 2
6,3
47,0
18
- 2
6,3
47,0
18
-
(e)
Rem
uner
atio
n p
ayab
le 3
,06
8,7
92
4
,70
3,40
0
3,0
68
,79
2
4,7
03,
400
Mr.
Rajiv
Gan
dhi
3,0
68,
792
4,7
03,
400
3
,06
8,79
2 4
,70
3,40
0
51
DIS
CLO
Su
RE
aS
pER
IND
IaN
aC
CO
uN
TIN
g S
TaN
Da
RD
19
(Ind
aS
19
) ON
“EM
pLO
yEE
BEN
EFIT
” FO
R T
HE
yEa
R E
ND
ED 3
1 M
aR
CH
2
018
a
Defi
ned
Con
trib
utio
n p
lans
The
Com
pany
mad
e co
ntrib
utio
n to
war
ds p
rovi
dent
fund
to d
efine
d co
ntrib
utio
n re
tirem
ent b
enefi
t pla
ns fo
r qua
lifyi
ng e
mpl
oyee
s. T
he p
rovi
dent
fund
pla
n is
ope
rate
d by
th
e re
gion
al p
rovi
dent
fund
com
mis
sion
er, t
he c
ompa
ny re
quire
d to
con
trib
ute
a sp
ecifi
ed p
erce
ntag
e of
pay
roll
cost
to th
e re
tirem
ent b
enefi
t sch
eme
to fu
nd th
e be
nefit
.
Th
e C
ompa
ny r
ecog
nise
d `
6.4
4 m
illio
n (P
.Y. `
5.19
mill
ion)
for
pro
vide
nt f
und
cont
ribut
ion
in t
he p
rofit
and
loss
acc
ount
. The
con
trib
utio
ns p
ayab
le t
o th
is p
lan
by t
he
Com
pany
are
at r
ates
spe
cifie
d in
the
rule
s of
the
sche
me.
b
Defi
ned
Ben
efit p
lan
The
Com
pany
mad
e an
nual
con
trib
utio
n to
the
empl
oyee
s’ G
roup
Gra
tuity
Cas
h A
ccum
ulat
ion
Sche
me
of th
e Li
fe In
sura
nce
Cor
pora
tion
of In
dia,
a fu
nded
ben
efit p
lan
for
qual
ifyin
g em
ploy
ees.
The
sch
eme
prov
ides
for l
ump
sum
pay
men
t to
vest
ed e
mpl
oyee
s at
retir
emen
t, de
ath
whi
le in
em
ploy
men
t or o
n te
rmin
atio
n of
em
ploy
men
t of a
n am
ount
equ
ival
ent t
o 15
day
s sa
lary
pay
able
for e
ach
com
plet
ed y
ear o
f ser
vice
or a
par
t the
reof
in e
xces
s of
six
mon
ths.
Ves
ting
occu
rs u
pon
com
plet
ion
of fi
ve y
ears
of
serv
ice.
Not
es F
orm
ing
Part
of F
inan
cial
Sta
tem
ents
for t
he y
ear e
nded
31 M
arch
20
18
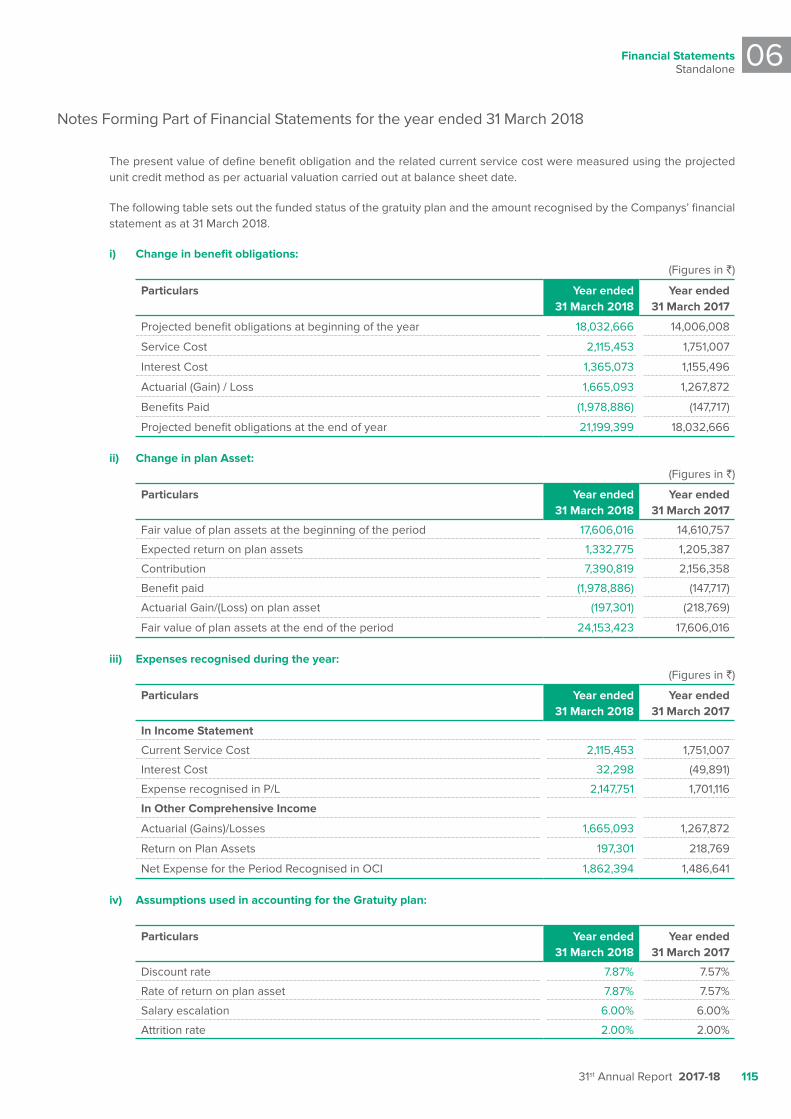
Financial StatementsStandalone
06
31st Annual Report 2017-18 115
The present value of define benefit obligation and the related current service cost were measured using the projected unit credit method as per actuarial valuation carried out at balance sheet date.
The following table sets out the funded status of the gratuity plan and the amount recognised by the Companys’ financial statement as at 31 March 2018.
i) Change in benefit obligations: (Figures in `)
particulars year ended 31 March 2018
year ended 31 March 2017
Projected benefit obligations at beginning of the year 18,032,666 14,006,008
Service Cost 2,115,453 1,751,007
Interest Cost 1,365,073 1,155,496
Actuarial (Gain) / Loss 1,665,093 1,267,872
Benefits Paid (1,978,886) (147,717)
Projected benefit obligations at the end of year 21,199,399 18,032,666
ii) Change in plan asset:(Figures in `)
particulars year ended 31 March 2018
year ended 31 March 2017
Fair value of plan assets at the beginning of the period 17,606,016 14,610,757
Expected return on plan assets 1,332,775 1,205,387
Contribution 7,390,819 2,156,358
Benefit paid (1,978,886) (147,717)
Actuarial Gain/(Loss) on plan asset (197,301) (218,769)
Fair value of plan assets at the end of the period 24,153,423 17,606,016
iii) Expenses recognised during the year: (Figures in `)
particulars year ended 31 March 2018
year ended 31 March 2017
In Income Statement
Current Service Cost 2,115,453 1,751,007
Interest Cost 32,298 (49,891)
Expense recognised in P/L 2,147,751 1,701,116
In Other Comprehensive Income
Actuarial (Gains)/Losses 1,665,093 1,267,872
Return on Plan Assets 197,301 218,769
Net Expense for the Period Recognised in OCI 1,862,394 1,486,641
iv) assumptions used in accounting for the gratuity plan:
particulars year ended 31 March 2018
year ended 31 March 2017
Discount rate 7.87% 7.57%
Rate of return on plan asset 7.87% 7.57%
Salary escalation 6.00% 6.00%
Attrition rate 2.00% 2.00%
Notes Forming Part of Financial Statements for the year ended 31 March 2018
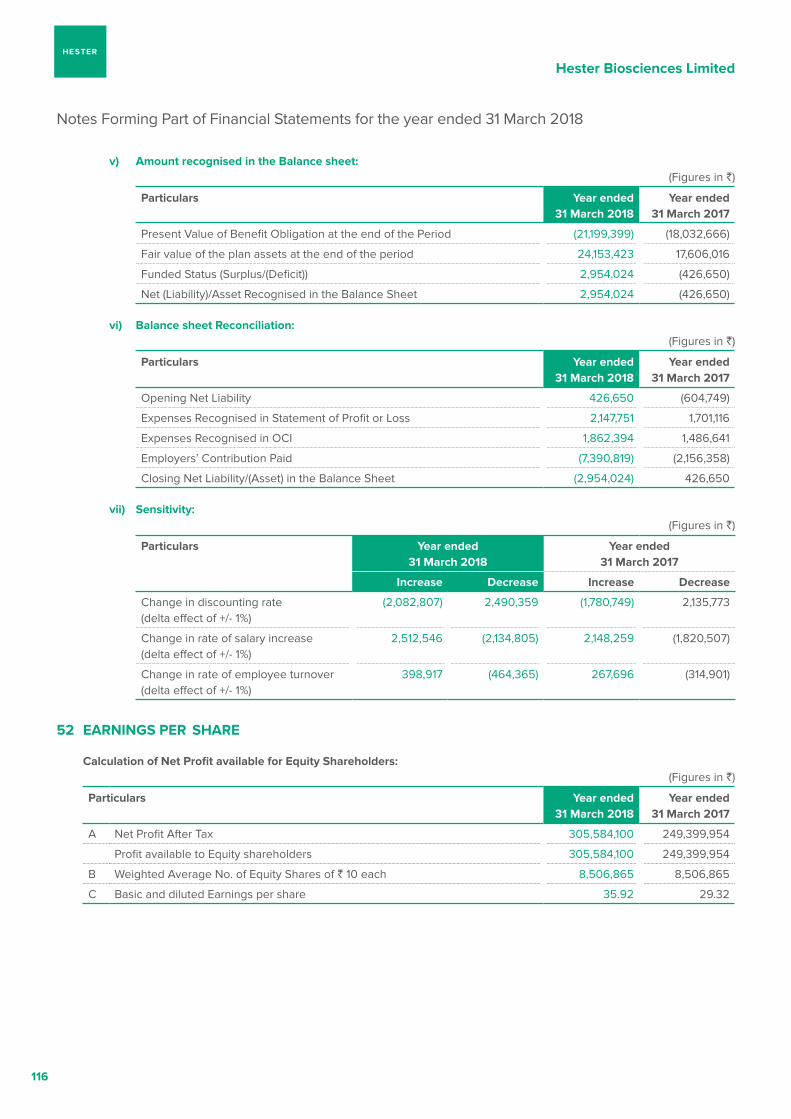
Hester Biosciences Limited
116
v) amount recognised in the Balance sheet:(Figures in `)
particulars year ended 31 March 2018
year ended 31 March 2017
Present Value of Benefit Obligation at the end of the Period (21,199,399) (18,032,666)
Fair value of the plan assets at the end of the period 24,153,423 17,606,016
Funded Status (Surplus/(Deficit)) 2,954,024 (426,650)
Net (Liability)/Asset Recognised in the Balance Sheet 2,954,024 (426,650)
vi) Balance sheet Reconciliation: (Figures in `)
particulars year ended 31 March 2018
year ended 31 March 2017
Opening Net Liability 426,650 (604,749)
Expenses Recognised in Statement of Profit or Loss 2,147,751 1,701,116
Expenses Recognised in OCI 1,862,394 1,486,641
Employers’ Contribution Paid (7,390,819) (2,156,358)
Closing Net Liability/(Asset) in the Balance Sheet (2,954,024) 426,650
vii) Sensitivity: (Figures in `)
particulars year ended 31 March 2018
year ended 31 March 2017
Increase Decrease Increase Decrease
Change in discounting rate(delta effect of +/- 1%)
(2,082,807) 2,490,359 (1,780,749) 2,135,773
Change in rate of salary increase(delta effect of +/- 1%)
2,512,546 (2,134,805) 2,148,259 (1,820,507)
Change in rate of employee turnover(delta effect of +/- 1%)
398,917 (464,365) 267,696 (314,901)
52 EaRNINgS pER SHaRE
Calculation of Net profit available for Equity Shareholders: (Figures in `)
particulars year ended 31 March 2018
year ended 31 March 2017
A Net Profit After Tax 305,584,100 249,399,954
Profit available to Equity shareholders 305,584,100 249,399,954
B Weighted Average No. of Equity Shares of ` 10 each 8,506,865 8,506,865
C Basic and diluted Earnings per share 35.92 29.32
Notes Forming Part of Financial Statements for the year ended 31 March 2018
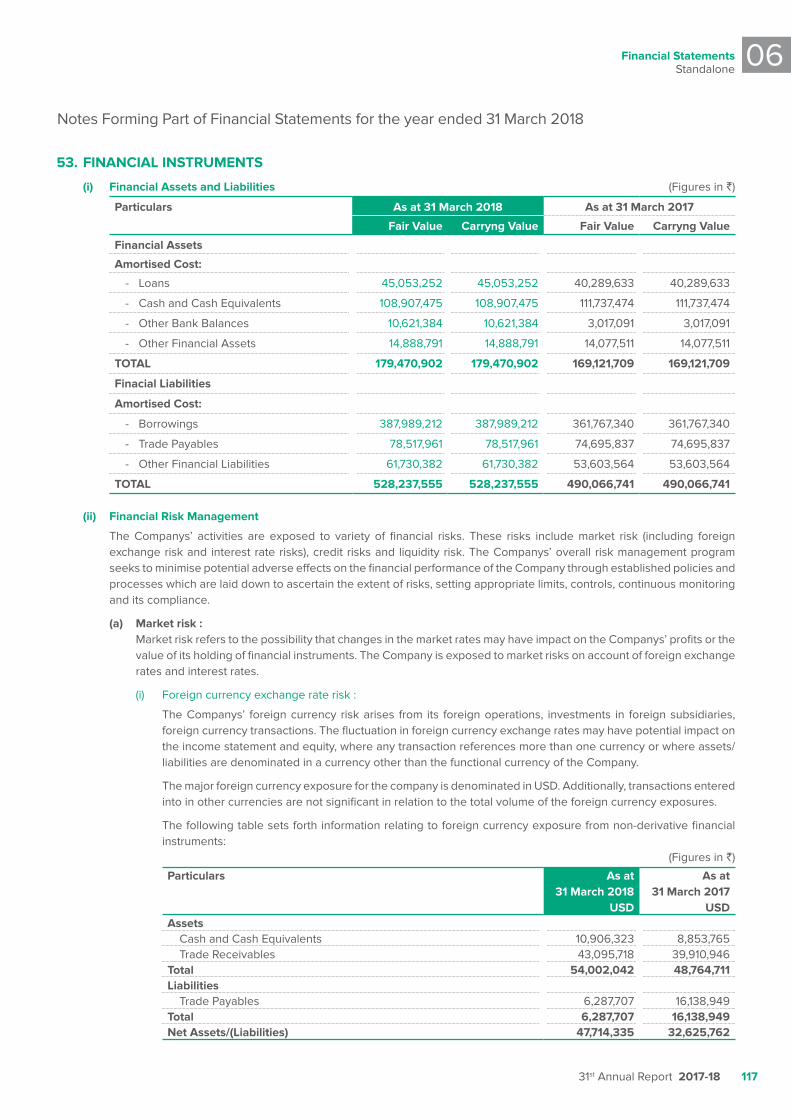
Financial StatementsStandalone
06
31st Annual Report 2017-18 117
53. FINaNCIaL INSTRuMENTS
(i) Financial assets and Liabilities (Figures in `)
particulars as at 31 March 2018 as at 31 March 2017
Fair value Carryng value Fair value Carryng value
Financial assets
amortised Cost:
- Loans 45,053,252 45,053,252 40,289,633 40,289,633
- Cash and Cash Equivalents 108,907,475 108,907,475 111,737,474 111,737,474
- Other Bank Balances 10,621,384 10,621,384 3,017,091 3,017,091
- Other Financial Assets 14,888,791 14,888,791 14,077,511 14,077,511
TOTaL 179,470,902 179,470,902 169,121,709 169,121,709
Finacial Liabilities
amortised Cost:
- Borrowings 387,989,212 387,989,212 361,767,340 361,767,340
- Trade Payables 78,517,961 78,517,961 74,695,837 74,695,837
- Other Financial Liabilities 61,730,382 61,730,382 53,603,564 53,603,564
TOTaL 528,237,555 528,237,555 490,066,741 490,066,741
(ii) Financial Risk Management
The Companys’ activities are exposed to variety of financial risks. These risks include market risk (including foreign exchange risk and interest rate risks), credit risks and liquidity risk. The Companys’ overall risk management program seeks to minimise potential adverse effects on the financial performance of the Company through established policies and processes which are laid down to ascertain the extent of risks, setting appropriate limits, controls, continuous monitoring and its compliance.
(a) Market risk : Market risk refers to the possibility that changes in the market rates may have impact on the Companys’ profits or the
value of its holding of financial instruments. The Company is exposed to market risks on account of foreign exchange rates and interest rates.
(i) Foreign currency exchange rate risk :
The Companys’ foreign currency risk arises from its foreign operations, investments in foreign subsidiaries, foreign currency transactions. The fluctuation in foreign currency exchange rates may have potential impact on the income statement and equity, where any transaction references more than one currency or where assets/liabilities are denominated in a currency other than the functional currency of the Company.
The major foreign currency exposure for the company is denominated in USD. Additionally, transactions entered into in other currencies are not significant in relation to the total volume of the foreign currency exposures.
The following table sets forth information relating to foreign currency exposure from non-derivative financial instruments:
(Figures in `)
particulars as at 31 March 2018
uSD
as at 31 March 2017
uSDassets Cash and Cash Equivalents 10,906,323 8,853,765 Trade Receivables 43,095,718 39,910,946 Total 54,002,042 48,764,711 Liabilities Trade Payables 6,287,707 16,138,949 Total 6,287,707 16,138,949 Net assets/(Liabilities) 47,714,335 32,625,762
Notes Forming Part of Financial Statements for the year ended 31 March 2018
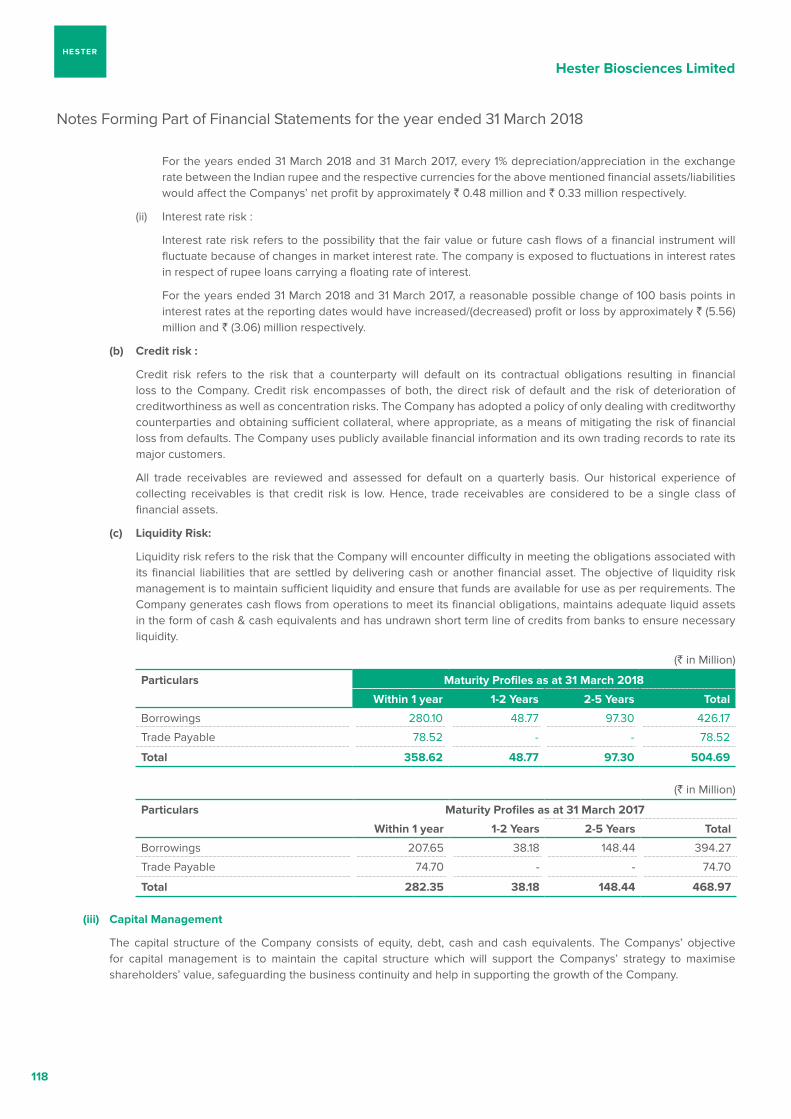
Hester Biosciences Limited
118
For the years ended 31 March 2018 and 31 March 2017, every 1% depreciation/appreciation in the exchange rate between the Indian rupee and the respective currencies for the above mentioned financial assets/liabilities would affect the Companys’ net profit by approximately ` 0.48 million and ` 0.33 million respectively.
(ii) Interest rate risk :
Interest rate risk refers to the possibility that the fair value or future cash flows of a financial instrument will fluctuate because of changes in market interest rate. The company is exposed to fluctuations in interest rates in respect of rupee loans carrying a floating rate of interest.
For the years ended 31 March 2018 and 31 March 2017, a reasonable possible change of 100 basis points in interest rates at the reporting dates would have increased/(decreased) profit or loss by approximately ` (5.56) million and ` (3.06) million respectively.
(b) Credit risk :
Credit risk refers to the risk that a counterparty will default on its contractual obligations resulting in financial loss to the Company. Credit risk encompasses of both, the direct risk of default and the risk of deterioration of creditworthiness as well as concentration risks. The Company has adopted a policy of only dealing with creditworthy counterparties and obtaining sufficient collateral, where appropriate, as a means of mitigating the risk of financial loss from defaults. The Company uses publicly available financial information and its own trading records to rate its major customers.
All trade receivables are reviewed and assessed for default on a quarterly basis. Our historical experience of collecting receivables is that credit risk is low. Hence, trade receivables are considered to be a single class of financial assets.
(c) Liquidity Risk:
Liquidity risk refers to the risk that the Company will encounter difficulty in meeting the obligations associated with its financial liabilities that are settled by delivering cash or another financial asset. The objective of liquidity risk management is to maintain sufficient liquidity and ensure that funds are available for use as per requirements. The Company generates cash flows from operations to meet its financial obligations, maintains adequate liquid assets in the form of cash & cash equivalents and has undrawn short term line of credits from banks to ensure necessary liquidity.
(` in Million)
particulars Maturity profiles as at 31 March 2018
Within 1 year 1-2 years 2-5 years Total
Borrowings 280.10 48.77 97.30 426.17
Trade Payable 78.52 - - 78.52
Total 358.62 48.77 97.30 504.69
(` in Million)
particulars Maturity profiles as at 31 March 2017
Within 1 year 1-2 years 2-5 years Total
Borrowings 207.65 38.18 148.44 394.27
Trade Payable 74.70 - - 74.70
Total 282.35 38.18 148.44 468.97
(iii) Capital Management
The capital structure of the Company consists of equity, debt, cash and cash equivalents. The Companys’ objective for capital management is to maintain the capital structure which will support the Companys’ strategy to maximise shareholders’ value, safeguarding the business continuity and help in supporting the growth of the Company.
Notes Forming Part of Financial Statements for the year ended 31 March 2018
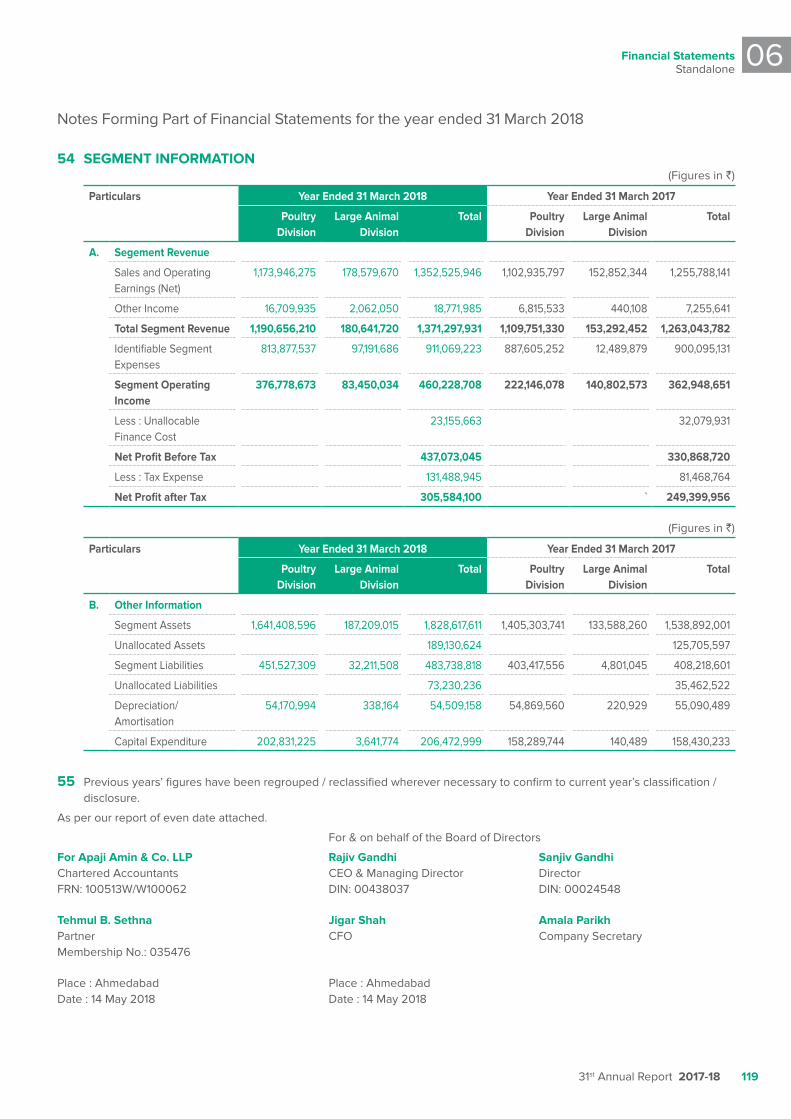
Financial StatementsStandalone
06
31st Annual Report 2017-18 119
54 SEgMENT INFORMaTION(Figures in `)
particulars year Ended 31 March 2018 year Ended 31 March 2017
poultry Division
Large animal Division
Total poultry Division
Large animal Division
Total
a. Segement Revenue
Sales and Operating Earnings (Net)
1,173,946,275 178,579,670 1,352,525,946 1,102,935,797 152,852,344 1,255,788,141
Other Income 16,709,935 2,062,050 18,771,985 6,815,533 440,108 7,255,641
Total Segment Revenue 1,190,656,210 180,641,720 1,371,297,931 1,109,751,330 153,292,452 1,263,043,782
Identifiable Segment Expenses
813,877,537 97,191,686 911,069,223 887,605,252 12,489,879 900,095,131
Segment Operating Income
376,778,673 83,450,034 460,228,708 222,146,078 140,802,573 362,948,651
Less : Unallocable Finance Cost
23,155,663 32,079,931
Net profit Before Tax 437,073,045 330,868,720
Less : Tax Expense 131,488,945 81,468,764
Net profit after Tax 305,584,100 ` 249,399,956
(Figures in `)
particulars year Ended 31 March 2018 year Ended 31 March 2017
poultry Division
Large animal Division
Total poultry Division
Large animal Division
Total
B. Other Information
Segment Assets 1,641,408,596 187,209,015 1,828,617,611 1,405,303,741 133,588,260 1,538,892,001
Unallocated Assets 189,130,624 125,705,597
Segment Liabilities 451,527,309 32,211,508 483,738,818 403,417,556 4,801,045 408,218,601
Unallocated Liabilities 73,230,236 35,462,522
Depreciation/Amortisation
54,170,994 338,164 54,509,158 54,869,560 220,929 55,090,489
Capital Expenditure 202,831,225 3,641,774 206,472,999 158,289,744 140,489 158,430,233
55 Previous years’ figures have been regrouped / reclassified wherever necessary to confirm to current year’s classification / disclosure.
As per our report of even date attached.
For & on behalf of the Board of Directors
For apaji amin & Co. LLp Rajiv gandhi Sanjiv gandhi Chartered Accountants CEO & Managing Director Director FRN: 100513W/W100062 DIN: 00438037 DIN: 00024548
Tehmul B. Sethna Jigar Shah amala parikh Partner CFO Company Secretary Membership No.: 035476
Place : Ahmedabad Place : Ahmedabad Date : 14 May 2018 Date : 14 May 2018
Notes Forming Part of Financial Statements for the year ended 31 March 2018
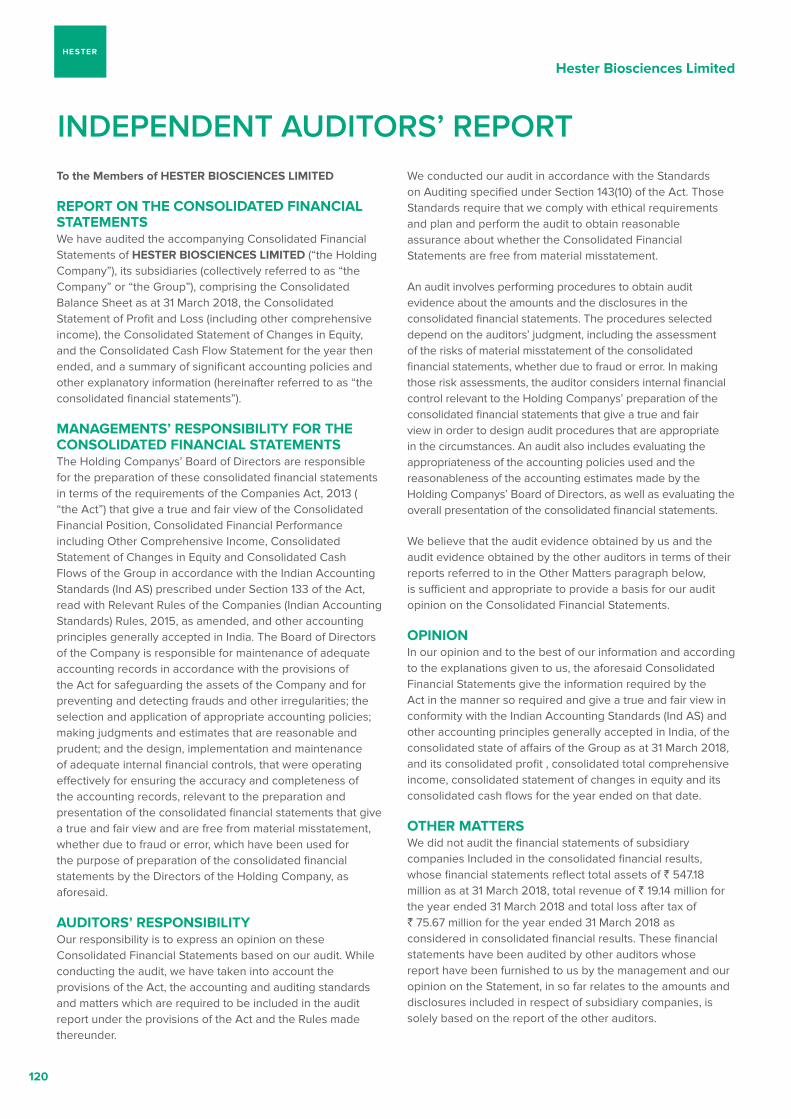
Hester Biosciences Limited
120
To the Members of HESTER BIOSCIENCES LIMITED
REpORT ON THE CONSOLIDaTED FINaNCIaL STaTEMENTSWe have audited the accompanying Consolidated Financial Statements of HESTER BIOSCIENCES LIMITED (“the Holding Company”), its subsidiaries (collectively referred to as “the Company” or “the Group”), comprising the Consolidated Balance Sheet as at 31 March 2018, the Consolidated Statement of Profit and Loss (including other comprehensive income), the Consolidated Statement of Changes in Equity, and the Consolidated Cash Flow Statement for the year then ended, and a summary of significant accounting policies and other explanatory information (hereinafter referred to as “the consolidated financial statements”).
MaNagEMENTS’ RESpONSIBILITy FOR THE CONSOLIDaTED FINaNCIaL STaTEMENTSThe Holding Companys’ Board of Directors are responsible for the preparation of these consolidated financial statements in terms of the requirements of the Companies Act, 2013 ( “the Act”) that give a true and fair view of the Consolidated Financial Position, Consolidated Financial Performance including Other Comprehensive Income, Consolidated Statement of Changes in Equity and Consolidated Cash Flows of the Group in accordance with the Indian Accounting Standards (Ind AS) prescribed under Section 133 of the Act, read with Relevant Rules of the Companies (Indian Accounting Standards) Rules, 2015, as amended, and other accounting principles generally accepted in India. The Board of Directors of the Company is responsible for maintenance of adequate accounting records in accordance with the provisions of the Act for safeguarding the assets of the Company and for preventing and detecting frauds and other irregularities; the selection and application of appropriate accounting policies; making judgments and estimates that are reasonable and prudent; and the design, implementation and maintenance of adequate internal financial controls, that were operating effectively for ensuring the accuracy and completeness of the accounting records, relevant to the preparation and presentation of the consolidated financial statements that give a true and fair view and are free from material misstatement, whether due to fraud or error, which have been used for the purpose of preparation of the consolidated financial statements by the Directors of the Holding Company, as aforesaid.
auDITORS’ RESpONSIBILITyOur responsibility is to express an opinion on these Consolidated Financial Statements based on our audit. While conducting the audit, we have taken into account the provisions of the Act, the accounting and auditing standards and matters which are required to be included in the audit report under the provisions of the Act and the Rules made thereunder.
We conducted our audit in accordance with the Standards on Auditing specified under Section 143(10) of the Act. Those Standards require that we comply with ethical requirements and plan and perform the audit to obtain reasonable assurance about whether the Consolidated Financial Statements are free from material misstatement.
An audit involves performing procedures to obtain audit evidence about the amounts and the disclosures in the consolidated financial statements. The procedures selected depend on the auditors’ judgment, including the assessment of the risks of material misstatement of the consolidated financial statements, whether due to fraud or error. In making those risk assessments, the auditor considers internal financial control relevant to the Holding Companys’ preparation of the consolidated financial statements that give a true and fair view in order to design audit procedures that are appropriate in the circumstances. An audit also includes evaluating the appropriateness of the accounting policies used and the reasonableness of the accounting estimates made by the Holding Companys’ Board of Directors, as well as evaluating the overall presentation of the consolidated financial statements.
We believe that the audit evidence obtained by us and the audit evidence obtained by the other auditors in terms of their reports referred to in the Other Matters paragraph below, is sufficient and appropriate to provide a basis for our audit opinion on the Consolidated Financial Statements.
OpINIONIn our opinion and to the best of our information and according to the explanations given to us, the aforesaid Consolidated Financial Statements give the information required by the Act in the manner so required and give a true and fair view in conformity with the Indian Accounting Standards (Ind AS) and other accounting principles generally accepted in India, of the consolidated state of affairs of the Group as at 31 March 2018, and its consolidated profit , consolidated total comprehensive income, consolidated statement of changes in equity and its consolidated cash flows for the year ended on that date.
OTHER MaTTERSWe did not audit the financial statements of subsidiary companies Included in the consolidated financial results, whose financial statements reflect total assets of ` 547.18 million as at 31 March 2018, total revenue of ` 19.14 million for the year ended 31 March 2018 and total loss after tax of ` 75.67 million for the year ended 31 March 2018 as considered in consolidated financial results. These financial statements have been audited by other auditors whose report have been furnished to us by the management and our opinion on the Statement, in so far relates to the amounts and disclosures included in respect of subsidiary companies, is solely based on the report of the other auditors.
Independent AudItors’ report
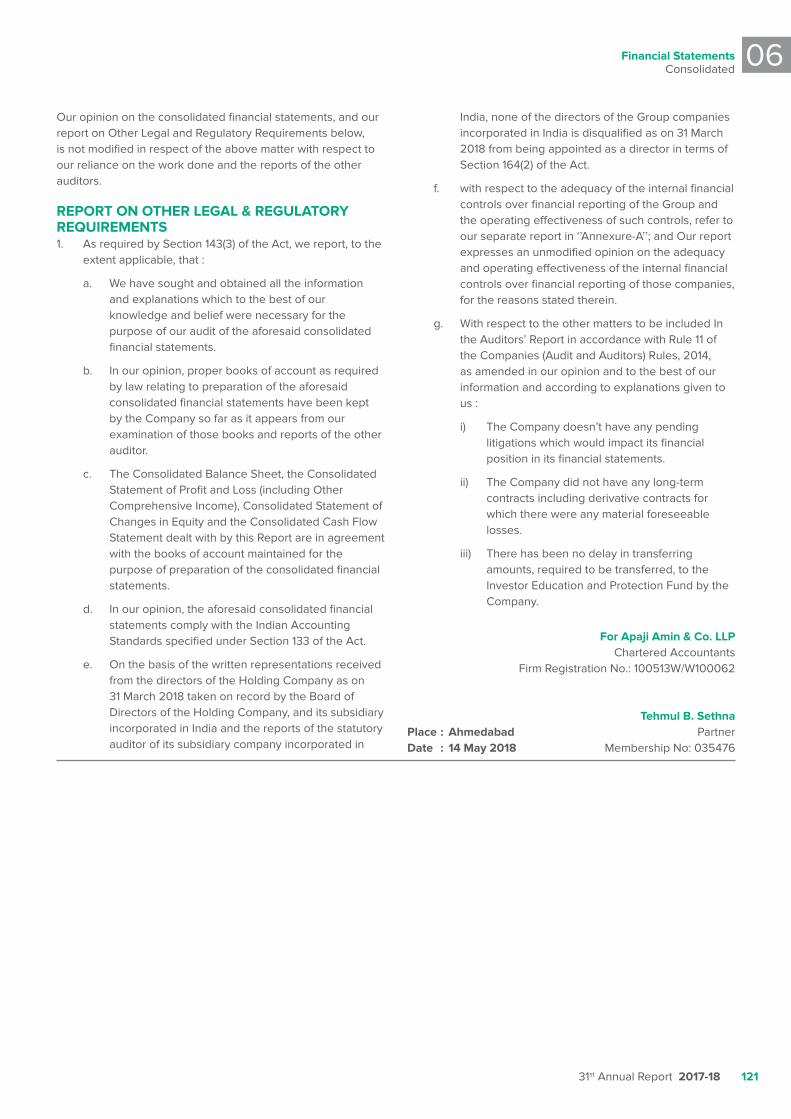
Financial StatementsConsolidated
06
31st Annual Report 2017-18 121
Our opinion on the consolidated financial statements, and our report on Other Legal and Regulatory Requirements below, is not modified in respect of the above matter with respect to our reliance on the work done and the reports of the other auditors.
REpORT ON OTHER LEgaL & REguLaTORy REquIREMENTS1. As required by Section 143(3) of the Act, we report, to the
extent applicable, that :
a. We have sought and obtained all the information and explanations which to the best of our knowledge and belief were necessary for the purpose of our audit of the aforesaid consolidated financial statements.
b. In our opinion, proper books of account as required by law relating to preparation of the aforesaid consolidated financial statements have been kept by the Company so far as it appears from our examination of those books and reports of the other auditor.
c. The Consolidated Balance Sheet, the Consolidated Statement of Profit and Loss (including Other Comprehensive Income), Consolidated Statement of Changes in Equity and the Consolidated Cash Flow Statement dealt with by this Report are in agreement with the books of account maintained for the purpose of preparation of the consolidated financial statements.
d. In our opinion, the aforesaid consolidated financial statements comply with the Indian Accounting Standards specified under Section 133 of the Act.
e. On the basis of the written representations received from the directors of the Holding Company as on 31 March 2018 taken on record by the Board of Directors of the Holding Company, and its subsidiary incorporated in India and the reports of the statutory auditor of its subsidiary company incorporated in
India, none of the directors of the Group companies incorporated in India is disqualified as on 31 March 2018 from being appointed as a director in terms of Section 164(2) of the Act.
f. with respect to the adequacy of the internal financial controls over financial reporting of the Group and the operating effectiveness of such controls, refer to our separate report in ‘’Annexure-A’’; and Our report expresses an unmodified opinion on the adequacy and operating effectiveness of the internal financial controls over financial reporting of those companies, for the reasons stated therein.
g. With respect to the other matters to be included In the Auditors’ Report in accordance with Rule 11 of the Companies (Audit and Auditors) Rules, 2014, as amended in our opinion and to the best of our information and according to explanations given to us :
i) The Company doesn’t have any pending litigations which would impact its financial position in its financial statements.
ii) The Company did not have any long-term contracts including derivative contracts for which there were any material foreseeable losses.
iii) There has been no delay in transferring amounts, required to be transferred, to the Investor Education and Protection Fund by the Company.
For apaji amin & Co. LLpChartered Accountants
Firm Registration No.: 100513W/W100062
Tehmul B. Sethnaplace : ahmedabad PartnerDate : 14 May 2018 Membership No: 035476
Hester Biosciences Limited
122
REpORT ON THE INTERNaL FINaNCIaL CONTROLS uNDER CLauSE (I) OF SuB-SECTION 3 OF SECTION 143 OF THE COMpaNIES aCT, 2013 (‘THE aCT’)We have audited the internal financial controls over financial reporting of Hester Biosciences Limited (‘the Company’) as of 31 March 2018 in conjunction with our audit of the consolidated financial statements of the Company for the year ended on that date.
MaNagEMENTS’ RESpONSIBILITy FOR INTERNaL FINaNCIaL CONTROLSThe respective Board of Directors of the Holding Company are responsible for establishing and maintaining internal financial controls based on the internal control over financial reporting criteria established by the Company considering the essential components of internal control stated in the Guidance Note on Audit of Internal Financial Controls over Financial Reporting issued by the Institute of Chartered Accountants of India (‘ICAI’). These responsibilities include the design, implementation and maintenance of adequate internal financial controls that were operating effectively for ensuring the orderly and efficient conduct of its business, including adherence to the Companys’ policies, the safeguarding of its assets, the prevention and detection of frauds and errors, the accuracy and completeness of the accounting records, and the timely preparation of reliable financial information, as required under the Companies Act, 2013.
auDITORS’ RESpONSIBILITyOur responsibility is to express an opinion on the Companys’ internal financial controls over financial reporting based on our audit. We conducted our audit in accordance with the Guidance Note on Audit of Internal Financial Controls over Financial Reporting (the ‘Guidance Note’) and the Standards on Auditing, issued by ICAI and deemed to be prescribed under Section 143(10) of the Companies Act, 2013, to the extent applicable to an audit of internal financial controls, both applicable to an audit of Internal Financial Controls and, both issued by the Institute of Chartered Accountants of India. Those Standards and the Guidance Note require that we comply with ethical requirements and plan and perform the audit to obtain reasonable assurance about whether adequate internal financial controls over financial reporting were established and maintained and if such controls operated effectively in all material respects.
Our audit involves performing procedures to obtain audit evidence about the adequacy of the internal financial controls system over financial reporting and their operating effectiveness. Our audit of internal financial controls over financial reporting included obtaining an understanding of internal financial controls over financial reporting, assessing the risk that a material weakness exists, and testing and evaluating the design and operating effectiveness of internal
control based on the assessed risk. The procedures selected depend on the auditors’ judgment, including the assessment of the risks of material misstatement of the financial statements, whether due to fraud or error.
We believe that the audit evidence we have obtained is sufficient and appropriate to provide a basis for our audit opinion on the Companys’ internal financial controls system over financial reporting.
MEaNINg OF INTERNaL FINaNCIaL CONTROLS OvER FINaNCIaL REpORTINgA Companys’ internal financial control over financial reporting is a process designed to provide reasonable assurance regarding the reliability of financial reporting and the preparation of financial statements for external purposes in accordance with generally accepted accounting principles. A Companys’ internal financial control over financial reporting includes those policies and procedures that (1) pertain to the maintenance of records that, in reasonable detail, accurately and fairly reflect the transactions and dispositions of the assets of the Company; (2) provide reasonable assurance that transactions are recorded as necessary to permit preparation of financial statements in accordance with generally accepted accounting principles, and that receipts and expenditures of the Company are being made only in accordance with authorisations of the Management and directors of the Company; and (3) provide reasonable assurance regarding prevention or timely detection of unauthorised acquisition, use, or disposition of the Companys’ assets that could have a material effect on the financial statements.
INHERENT LIMITaTIONS OF INTERNaL FINaNCIaL CONTROLS OvER FINaNCIaL REpORTINgBecause of the inherent limitations of internal financial controls over financial reporting, including the possibility of collusion or improper management override of controls, material misstatements due to error or fraud may occur and not be detected. Also, projections of any evaluation of the internal financial controls over financial reporting to future periods are subject to the risk that the internal financial control over financial reporting may become inadequate because of changes in conditions, or that the degree of compliance with the policies or procedures may deteriorate.
OpINIONIn our opinion, to the best of our information and according to the explanations given to us and based on the consideration of report of other auditor, as referred to in Other Matters paragraph, the Holding Company, its subsidiary which is company incorporated in India have maintained in all material respects, an adequate internal financial controls system over financial reporting and such internal financial controls over financial reporting were operating effectively as at 31 March
aNNExuRE a TO THE INDEpENDENT auDITORS’ REpORT

Financial StatementsConsolidated
06
31st Annual Report 2017-18 123
2018, based on the internal control over financial reporting criteria established by the Holding Company considering the essential components of internal control stated in the Guidance Note on Audit of Internal Financial Controls over Financial Reporting issued by the Institute of Chartered Accountants of India.
OTHER MaTTEROur aforesaid reports under Section 143(3) (i) of the Act on the adequacy and operating effectiveness of the internal financial controls over financial reporting of the Holding Company, in so far as it relates to separate financial statement of one
subsidiary company which is incorporated in India, is based in the corresponding report of the auditor of such subsidiary incorporated in India.
For apaji amin & Co. LLpChartered Accountants
Firm Registration No.: 100513W/W100062
Tehmul B. Sethnaplace : ahmedabad PartnerDate : 14 May 2018 Membership No: 035476
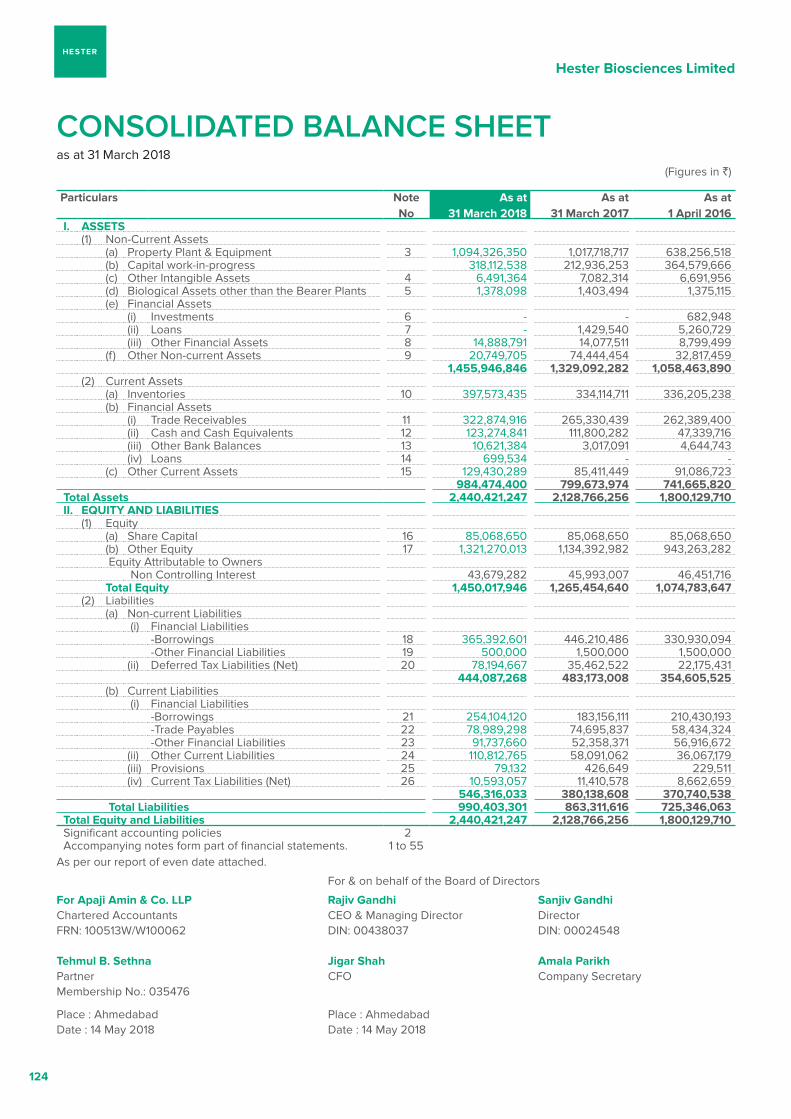
Hester Biosciences Limited
124
consolIdAted BAlAnce sheet as at 31 March 2018
(Figures in `)
particulars Note No
as at 31 March 2018
as at 31 March 2017
as at 1 april 2016
I. aSSETS (1) Non-Current Assets (a) Property Plant & Equipment 3 1,094,326,350 1,017,718,717 638,256,518 (b) Capital work-in-progress 318,112,538 212,936,253 364,579,666 (c) Other Intangible Assets 4 6,491,364 7,082,314 6,691,956 (d) Biological Assets other than the Bearer Plants 5 1,378,098 1,403,494 1,375,115 (e) Financial Assets (i) Investments 6 - - 682,948 (ii) Loans 7 - 1,429,540 5,260,729 (iii) Other Financial Assets 8 14,888,791 14,077,511 8,799,499 (f) Other Non-current Assets 9 20,749,705 74,444,454 32,817,459
1,455,946,846 1,329,092,282 1,058,463,890 (2) Current Assets (a) Inventories 10 397,573,435 334,114,711 336,205,238 (b) Financial Assets (i) Trade Receivables 11 322,874,916 265,330,439 262,389,400 (ii) Cash and Cash Equivalents 12 123,274,841 111,800,282 47,339,716 (iii) Other Bank Balances 13 10,621,384 3,017,091 4,644,743 (iv) Loans 14 699,534 - - (c) Other Current Assets 15 129,430,289 85,411,449 91,086,723
984,474,400 799,673,974 741,665,820 Total assets 2,440,421,247 2,128,766,256 1,800,129,710 II. EquITy aND LIaBILITIES (1) Equity (a) Share Capital 16 85,068,650 85,068,650 85,068,650 (b) Other Equity 17 1,321,270,013 1,134,392,982 943,263,282
Equity Attributable to Owners Non Controlling Interest 43,679,282 45,993,007 46,451,716
Total Equity 1,450,017,946 1,265,454,640 1,074,783,647 (2) Liabilities (a) Non-current Liabilities (i) Financial Liabilities -Borrowings 18 365,392,601 446,210,486 330,930,094 -Other Financial Liabilities 19 500,000 1,500,000 1,500,000 (ii) Deferred Tax Liabilities (Net) 20 78,194,667 35,462,522 22,175,431
444,087,268 483,173,008 354,605,525 (b) Current Liabilities (i) Financial Liabilities -Borrowings 21 254,104,120 183,156,111 210,430,193
-Trade Payables 22 78,989,298 74,695,837 58,434,324 -Other Financial Liabilities 23 91,737,660 52,358,371 56,916,672
(ii) Other Current Liabilities 24 110,812,765 58,091,062 36,067,179 (iii) Provisions 25 79,132 426,649 229,511 (iv) Current Tax Liabilities (Net) 26 10,593,057 11,410,578 8,662,659
546,316,033 380,138,608 370,740,538 Total Liabilities 990,403,301 863,311,616 725,346,063 Total Equity and Liabilities 2,440,421,247 2,128,766,256 1,800,129,710 Significant accounting policies 2 Accompanying notes form part of financial statements. 1 to 55
As per our report of even date attached.
For & on behalf of the Board of Directors
For apaji amin & Co. LLp Rajiv gandhi Sanjiv gandhi Chartered Accountants CEO & Managing Director Director FRN: 100513W/W100062 DIN: 00438037 DIN: 00024548
Tehmul B. Sethna Jigar Shah amala parikh Partner CFO Company Secretary Membership No.: 035476
Place : Ahmedabad Place : Ahmedabad Date : 14 May 2018 Date : 14 May 2018
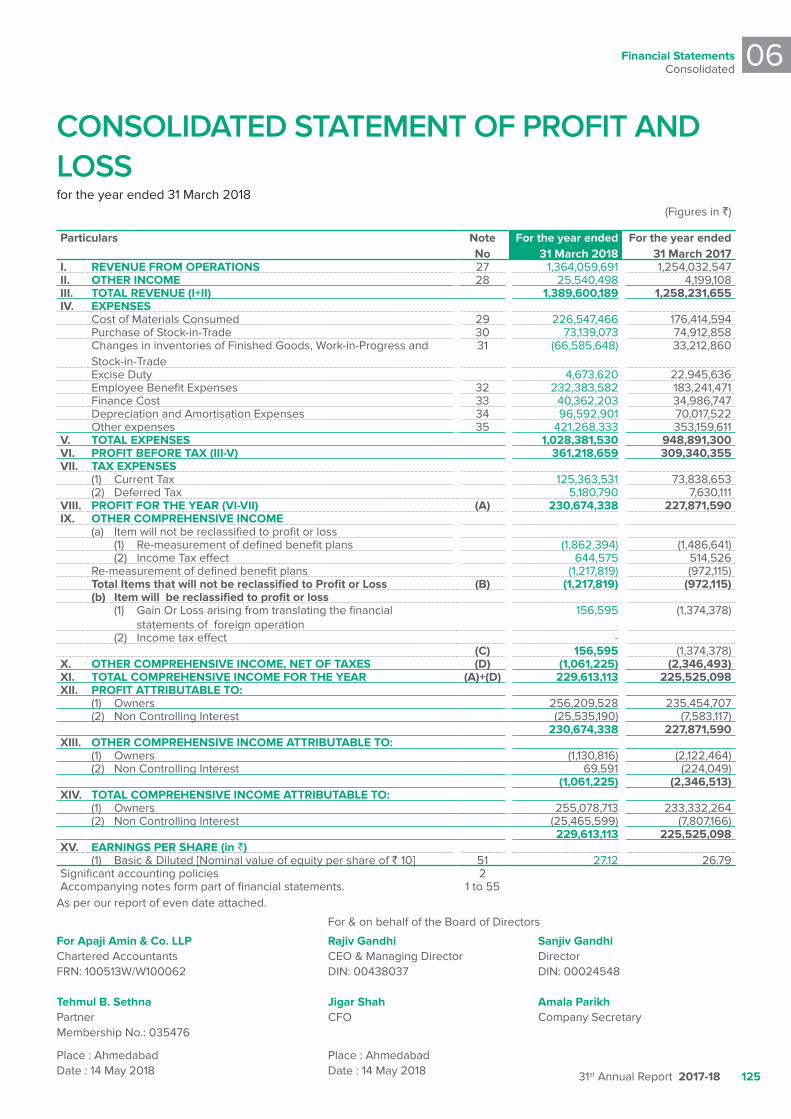
Financial StatementsConsolidated
06
31st Annual Report 2017-18 125
consolIdAted stAtement of profIt And loss for the year ended 31 March 2018
(Figures in `)
particulars NoteNo
For the year ended 31 March 2018
For the year ended 31 March 2017
I. REvENuE FROM OpERaTIONS 27 1,364,059,691 1,254,032,547 II. OTHER INCOME 28 25,540,498 4,199,108 III. TOTaL REvENuE (I+II) 1,389,600,189 1,258,231,655 Iv. ExpENSES
Cost of Materials Consumed 29 226,547,466 176,414,594 Purchase of Stock-in-Trade 30 73,139,073 74,912,858 Changes in inventories of Finished Goods, Work-in-Progress and Stock-in-Trade
31 (66,585,648) 33,212,860
Excise Duty 4,673,620 22,945,636 Employee Benefit Expenses 32 232,383,582 183,241,471 Finance Cost 33 40,362,203 34,986,747 Depreciation and Amortisation Expenses 34 96,592,901 70,017,522 Other expenses 35 421,268,333 353,159,611
v. TOTaL ExpENSES 1,028,381,530 948,891,300 vI. pROFIT BEFORE Tax (III-v) 361,218,659 309,340,355 vII. Tax ExpENSES
(1) Current Tax 125,363,531 73,838,653 (2) Deferred Tax 5,180,790 7,630,111
vIII. pROFIT FOR THE yEaR (vI-vII) (a) 230,674,338 227,871,590 Ix. OTHER COMpREHENSIvE INCOME
(a) Item will not be reclassified to profit or loss(1) Re-measurement of defined benefit plans (1,862,394) (1,486,641)(2) Income Tax effect 644,575 514,526
Re-measurement of defined benefit plans (1,217,819) (972,115)Total Items that will not be reclassified to profit or Loss (B) (1,217,819) (972,115)(b) Item will be reclassified to profit or loss
(1) Gain Or Loss arising from translating the financial statements of foreign operation
156,595 (1,374,378)
(2) Income tax effect - (C) 156,595 (1,374,378)
x. OTHER COMpREHENSIvE INCOME, NET OF TaxES (D) (1,061,225) (2,346,493)xI. TOTaL COMpREHENSIvE INCOME FOR THE yEaR (a)+(D) 229,613,113 225,525,098 xII. pROFIT aTTRIBuTaBLE TO:
(1) Owners 256,209,528 235,454,707 (2) Non Controlling Interest (25,535,190) (7,583,117)
230,674,338 227,871,590 xIII. OTHER COMpREHENSIvE INCOME aTTRIBuTaBLE TO:
(1) Owners (1,130,816) (2,122,464)(2) Non Controlling Interest 69,591 (224,049)
(1,061,225) (2,346,513)xIv. TOTaL COMpREHENSIvE INCOME aTTRIBuTaBLE TO:
(1) Owners 255,078,713 233,332,264(2) Non Controlling Interest (25,465,599) (7,807,166)
229,613,113 225,525,098xv. EaRNINgS pER SHaRE (in `)
(1) Basic & Diluted [Nominal value of equity per share of ` 10] 51 27.12 26.79Significant accounting policies 2Accompanying notes form part of financial statements. 1 to 55
As per our report of even date attached.
For & on behalf of the Board of Directors
For apaji amin & Co. LLp Rajiv gandhi Sanjiv gandhi Chartered Accountants CEO & Managing Director Director FRN: 100513W/W100062 DIN: 00438037 DIN: 00024548
Tehmul B. Sethna Jigar Shah amala parikh Partner CFO Company Secretary Membership No.: 035476
Place : Ahmedabad Place : Ahmedabad Date : 14 May 2018 Date : 14 May 2018
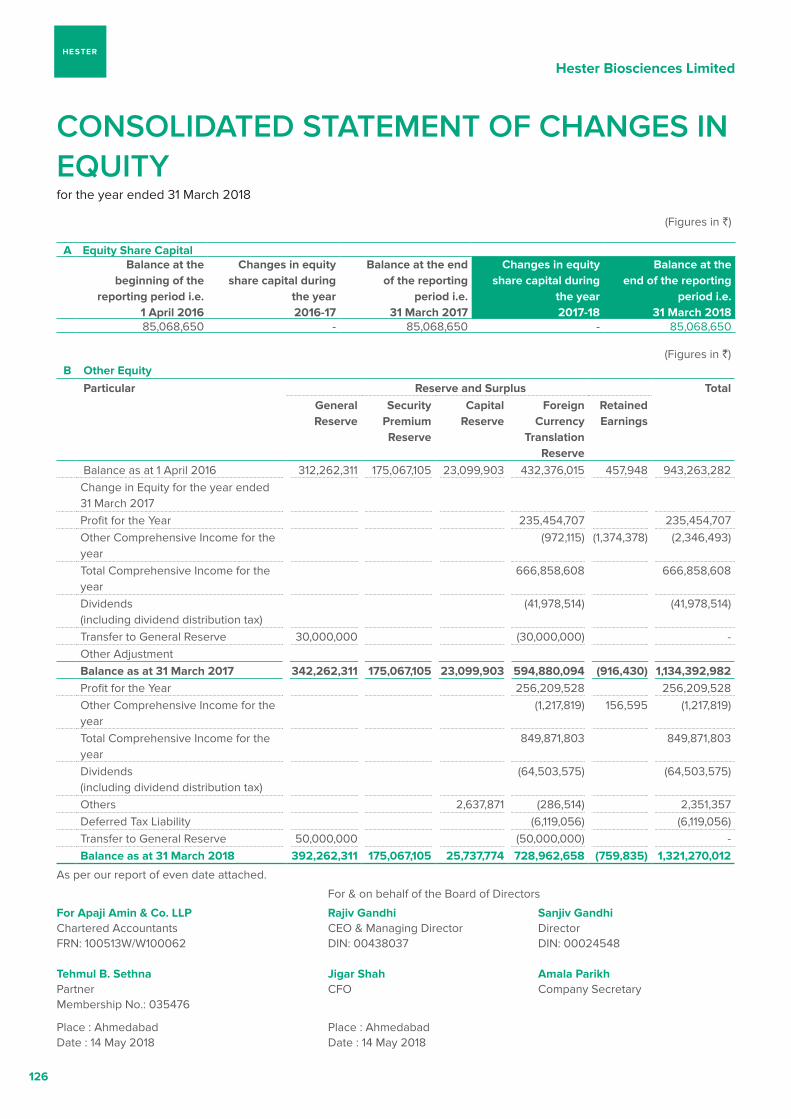
Hester Biosciences Limited
126
consolIdAted stAtement of chAnges In equIty for the year ended 31 March 2018
(Figures in `)
a Equity Share Capital Balance at the
beginning of the reporting period i.e.
1 april 2016
Changes in equity share capital during
the year 2016-17
Balance at the end of the reporting
period i.e. 31 March 2017
Changes in equity share capital during
the year 2017-18
Balance at the end of the reporting
period i.e. 31 March 2018
85,068,650 - 85,068,650 - 85,068,650
(Figures in `) B Other Equity
particular Reserve and Surplus Total general Reserve
Security premium Reserve
Capital Reserve
Foreign Currency
Translation Reserve
Retained Earnings
Balance as at 1 April 2016 312,262,311 175,067,105 23,099,903 432,376,015 457,948 943,263,282 Change in Equity for the year ended 31 March 2017 Profit for the Year 235,454,707 235,454,707 Other Comprehensive Income for the year
(972,115) (1,374,378) (2,346,493)
Total Comprehensive Income for the year
666,858,608 666,858,608
Dividends (including dividend distribution tax)
(41,978,514) (41,978,514)
Transfer to General Reserve 30,000,000 (30,000,000) - Other Adjustment Balance as at 31 March 2017 342,262,311 175,067,105 23,099,903 594,880,094 (916,430) 1,134,392,982 Profit for the Year 256,209,528 256,209,528 Other Comprehensive Income for the year
(1,217,819) 156,595 (1,217,819)
Total Comprehensive Income for the year
849,871,803 849,871,803
Dividends (including dividend distribution tax)
(64,503,575) (64,503,575)
Others 2,637,871 (286,514) 2,351,357Deferred Tax Liability (6,119,056) (6,119,056)Transfer to General Reserve 50,000,000 (50,000,000) - Balance as at 31 March 2018 392,262,311 175,067,105 25,737,774 728,962,658 (759,835) 1,321,270,012
As per our report of even date attached.
For & on behalf of the Board of Directors
For apaji amin & Co. LLp Rajiv gandhi Sanjiv gandhi Chartered Accountants CEO & Managing Director Director FRN: 100513W/W100062 DIN: 00438037 DIN: 00024548
Tehmul B. Sethna Jigar Shah amala parikh Partner CFO Company Secretary Membership No.: 035476
Place : Ahmedabad Place : Ahmedabad Date : 14 May 2018 Date : 14 May 2018
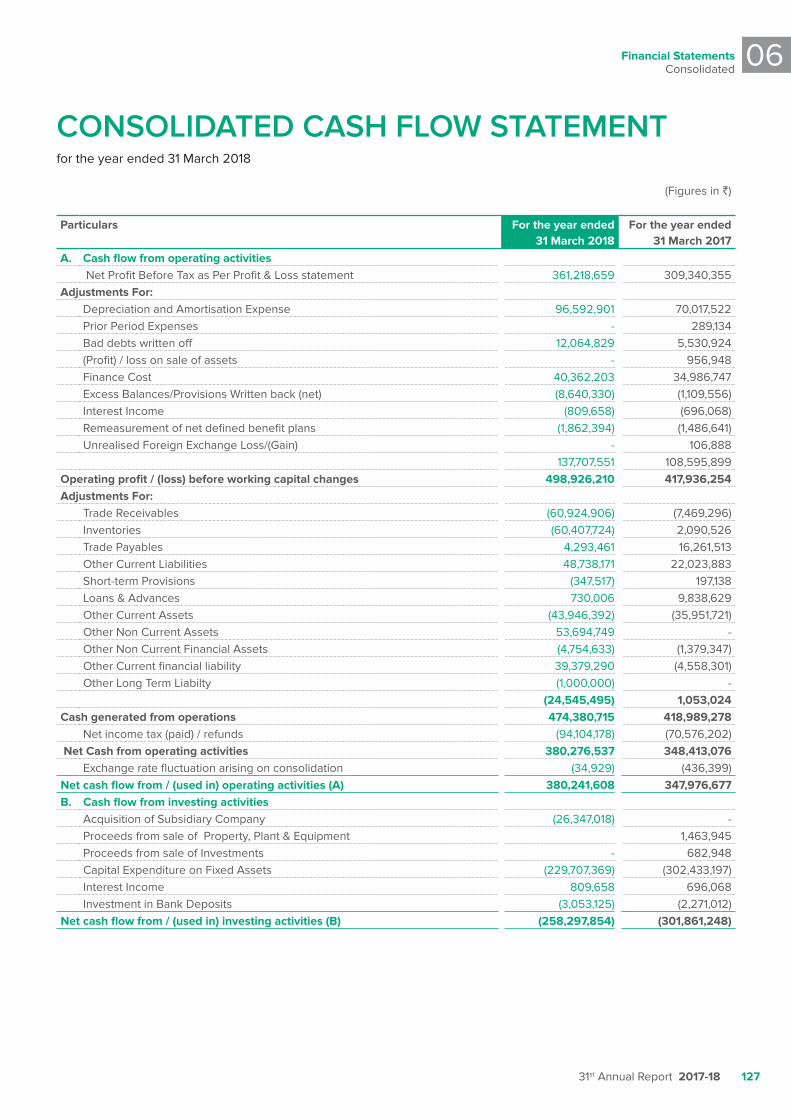
Financial StatementsConsolidated
06
31st Annual Report 2017-18 127
consolIdAted cAsh flow stAtementfor the year ended 31 March 2018
(Figures in `)
particulars For the year ended 31 March 2018
For the year ended 31 March 2017
a. Cash flow from operating activities Net Profit Before Tax as Per Profit & Loss statement 361,218,659 309,340,355
adjustments For:Depreciation and Amortisation Expense 96,592,901 70,017,522 Prior Period Expenses - 289,134 Bad debts written off 12,064,829 5,530,924 (Profit) / loss on sale of assets - 956,948 Finance Cost 40,362,203 34,986,747 Excess Balances/Provisions Written back (net) (8,640,330) (1,109,556)Interest Income (809,658) (696,068)Remeasurement of net defined benefit plans (1,862,394) (1,486,641)Unrealised Foreign Exchange Loss/(Gain) - 106,888
137,707,551 108,595,899 Operating profit / (loss) before working capital changes 498,926,210 417,936,254 adjustments For:
Trade Receivables (60,924,906) (7,469,296)Inventories (60,407,724) 2,090,526 Trade Payables 4,293,461 16,261,513 Other Current Liabilities 48,738,171 22,023,883 Short-term Provisions (347,517) 197,138 Loans & Advances 730,006 9,838,629 Other Current Assets (43,946,392) (35,951,721)Other Non Current Assets 53,694,749 - Other Non Current Financial Assets (4,754,633) (1,379,347)Other Current financial liability 39,379,290 (4,558,301)Other Long Term Liabilty (1,000,000) -
(24,545,495) 1,053,024 Cash generated from operations 474,380,715 418,989,278
Net income tax (paid) / refunds (94,104,178) (70,576,202) Net Cash from operating activities 380,276,537 348,413,076
Exchange rate fluctuation arising on consolidation (34,929) (436,399)Net cash flow from / (used in) operating activities (a) 380,241,608 347,976,677 B. Cash flow from investing activities
Acquisition of Subsidiary Company (26,347,018) - Proceeds from sale of Property, Plant & Equipment 1,463,945 Proceeds from sale of Investments - 682,948 Capital Expenditure on Fixed Assets (229,707,369) (302,433,197)Interest Income 809,658 696,068 Investment in Bank Deposits (3,053,125) (2,271,012)
Net cash flow from / (used in) investing activities (B) (258,297,854) (301,861,248)
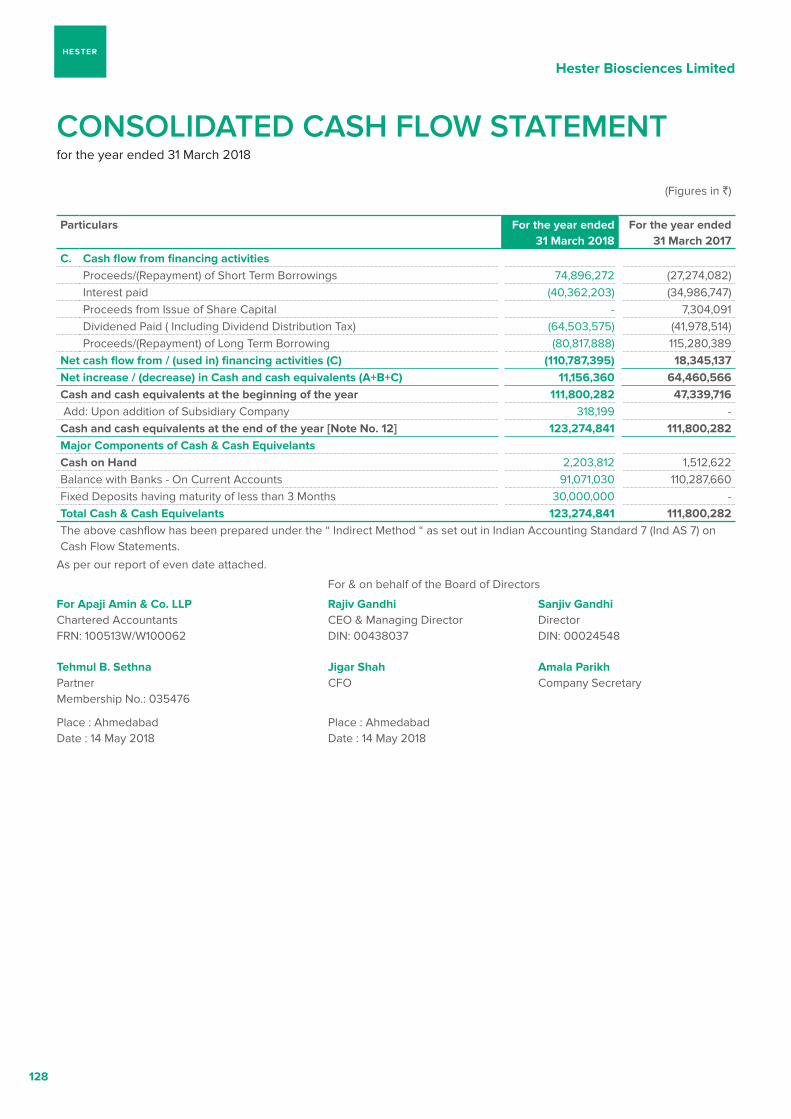
Hester Biosciences Limited
128
(Figures in `)
particulars For the year ended 31 March 2018
For the year ended 31 March 2017
C. Cash flow from financing activitiesProceeds/(Repayment) of Short Term Borrowings 74,896,272 (27,274,082)Interest paid (40,362,203) (34,986,747)Proceeds from Issue of Share Capital - 7,304,091 Dividened Paid ( Including Dividend Distribution Tax) (64,503,575) (41,978,514)Proceeds/(Repayment) of Long Term Borrowing (80,817,888) 115,280,389
Net cash flow from / (used in) financing activities (C) (110,787,395) 18,345,137 Net increase / (decrease) in Cash and cash equivalents (a+B+C) 11,156,360 64,460,566 Cash and cash equivalents at the beginning of the year 111,800,282 47,339,716 Add: Upon addition of Subsidiary Company 318,199 - Cash and cash equivalents at the end of the year [Note No. 12] 123,274,841 111,800,282 Major Components of Cash & Cash EquivelantsCash on Hand 2,203,812 1,512,622 Balance with Banks - On Current Accounts 91,071,030 110,287,660 Fixed Deposits having maturity of less than 3 Months 30,000,000 - Total Cash & Cash Equivelants 123,274,841 111,800,282The above cashflow has been prepared under the “ Indirect Method “ as set out in Indian Accounting Standard 7 (Ind AS 7) on Cash Flow Statements.
As per our report of even date attached.
For & on behalf of the Board of Directors
For apaji amin & Co. LLp Rajiv gandhi Sanjiv gandhi Chartered Accountants CEO & Managing Director Director FRN: 100513W/W100062 DIN: 00438037 DIN: 00024548
Tehmul B. Sethna Jigar Shah amala parikh Partner CFO Company Secretary Membership No.: 035476
Place : Ahmedabad Place : Ahmedabad Date : 14 May 2018 Date : 14 May 2018
consolIdAted cAsh flow stAtementfor the year ended 31 March 2018
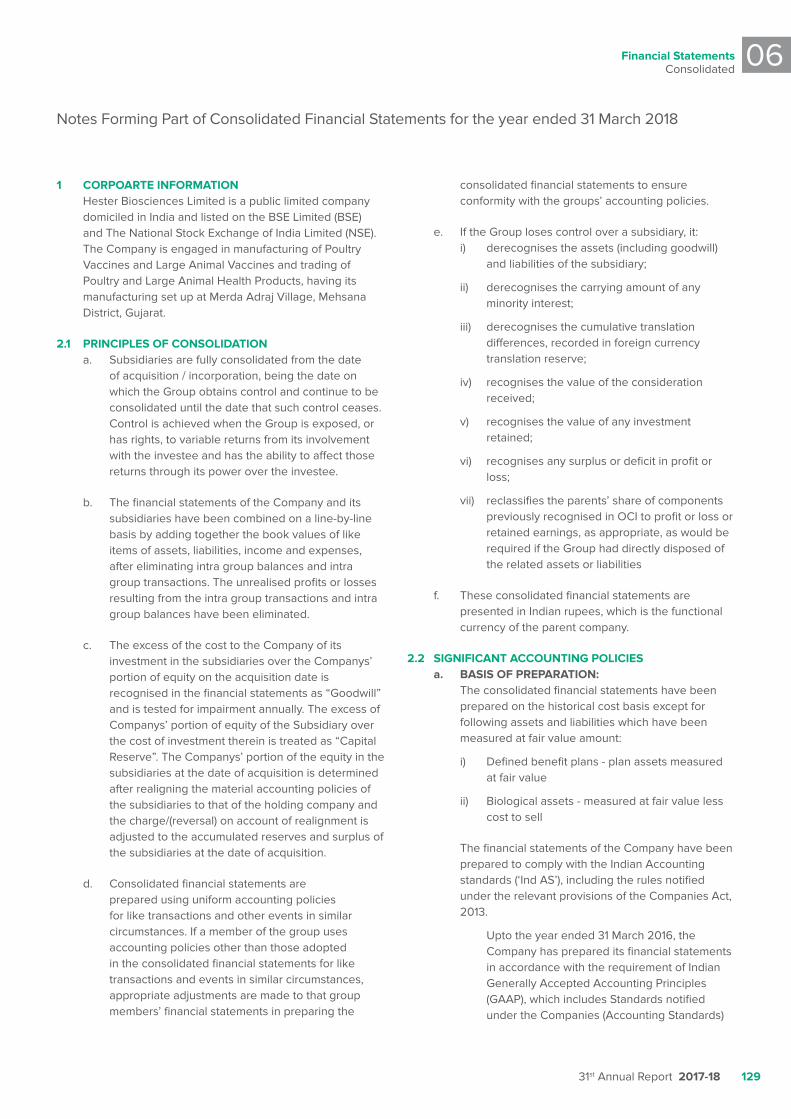
Financial StatementsConsolidated
06
31st Annual Report 2017-18 129
1 CORpOaRTE INFORMaTION Hester Biosciences Limited is a public limited company
domiciled in India and listed on the BSE Limited (BSE) and The National Stock Exchange of India Limited (NSE). The Company is engaged in manufacturing of Poultry Vaccines and Large Animal Vaccines and trading of Poultry and Large Animal Health Products, having its manufacturing set up at Merda Adraj Village, Mehsana District, Gujarat.
2.1 pRINCIpLES OF CONSOLIDaTION a. Subsidiaries are fully consolidated from the date
of acquisition / incorporation, being the date on which the Group obtains control and continue to be consolidated until the date that such control ceases. Control is achieved when the Group is exposed, or has rights, to variable returns from its involvement with the investee and has the ability to affect those returns through its power over the investee.
b. The financial statements of the Company and its subsidiaries have been combined on a line-by-line basis by adding together the book values of like items of assets, liabilities, income and expenses, after eliminating intra group balances and intra group transactions. The unrealised profits or losses resulting from the intra group transactions and intra group balances have been eliminated.
c. The excess of the cost to the Company of its investment in the subsidiaries over the Companys’ portion of equity on the acquisition date is recognised in the financial statements as “Goodwill” and is tested for impairment annually. The excess of Companys’ portion of equity of the Subsidiary over the cost of investment therein is treated as “Capital Reserve”. The Companys’ portion of the equity in the subsidiaries at the date of acquisition is determined after realigning the material accounting policies of the subsidiaries to that of the holding company and the charge/(reversal) on account of realignment is adjusted to the accumulated reserves and surplus of the subsidiaries at the date of acquisition.
d. Consolidated financial statements are prepared using uniform accounting policies for like transactions and other events in similar circumstances. If a member of the group uses accounting policies other than those adopted in the consolidated financial statements for like transactions and events in similar circumstances, appropriate adjustments are made to that group members’ financial statements in preparing the
consolidated financial statements to ensure conformity with the groups’ accounting policies.
e. If the Group loses control over a subsidiary, it: i) derecognises the assets (including goodwill)
and liabilities of the subsidiary;
ii) derecognises the carrying amount of any minority interest;
iii) derecognises the cumulative translation differences, recorded in foreign currency translation reserve;
iv) recognises the value of the consideration received;
v) recognises the value of any investment retained;
vi) recognises any surplus or deficit in profit or loss;
vii) reclassifies the parents’ share of components previously recognised in OCI to profit or loss or retained earnings, as appropriate, as would be required if the Group had directly disposed of the related assets or liabilities
f. These consolidated financial statements are presented in Indian rupees, which is the functional currency of the parent company.
2.2 SIgNIFICaNT aCCOuNTINg pOLICIES a. BaSIS OF pREpaRaTION: The consolidated financial statements have been
prepared on the historical cost basis except for following assets and liabilities which have been measured at fair value amount:
i) Defined benefit plans - plan assets measured at fair value
ii) Biological assets - measured at fair value less cost to sell
The financial statements of the Company have been prepared to comply with the Indian Accounting standards (‘Ind AS’), including the rules notified under the relevant provisions of the Companies Act, 2013.
Upto the year ended 31 March 2016, the Company has prepared its financial statements in accordance with the requirement of Indian Generally Accepted Accounting Principles (GAAP), which includes Standards notified under the Companies (Accounting Standards)
Notes Forming Part of Consolidated Financial Statements for the year ended 31 March 2018
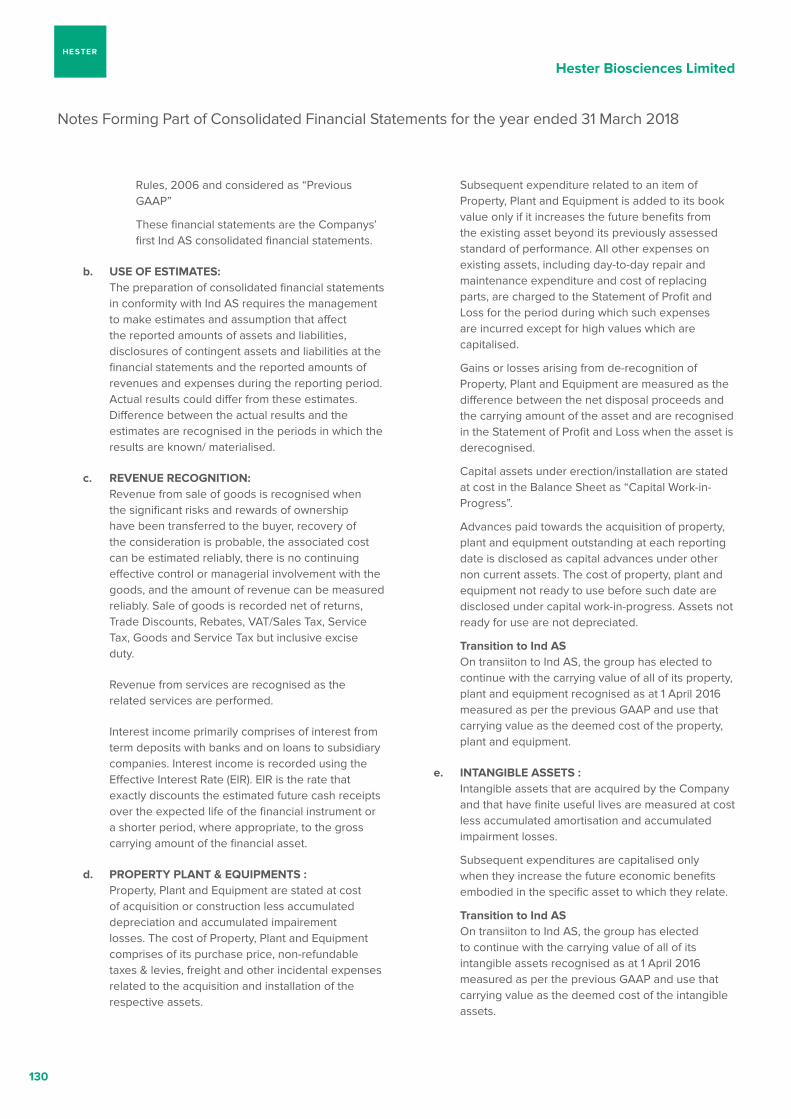
Hester Biosciences Limited
130
Notes Forming Part of Consolidated Financial Statements for the year ended 31 March 2018
Rules, 2006 and considered as “Previous GAAP”
These financial statements are the Companys’ first Ind AS consolidated financial statements.
b. uSE OF ESTIMaTES: The preparation of consolidated financial statements
in conformity with Ind AS requires the management to make estimates and assumption that affect the reported amounts of assets and liabilities, disclosures of contingent assets and liabilities at the financial statements and the reported amounts of revenues and expenses during the reporting period. Actual results could differ from these estimates. Difference between the actual results and the estimates are recognised in the periods in which the results are known/ materialised.
c. REvENuE RECOgNITION: Revenue from sale of goods is recognised when
the significant risks and rewards of ownership have been transferred to the buyer, recovery of the consideration is probable, the associated cost can be estimated reliably, there is no continuing effective control or managerial involvement with the goods, and the amount of revenue can be measured reliably. Sale of goods is recorded net of returns, Trade Discounts, Rebates, VAT/Sales Tax, Service Tax, Goods and Service Tax but inclusive excise duty.
Revenue from services are recognised as the related services are performed.
Interest income primarily comprises of interest from term deposits with banks and on loans to subsidiary companies. Interest income is recorded using the Effective Interest Rate (EIR). EIR is the rate that exactly discounts the estimated future cash receipts over the expected life of the financial instrument or a shorter period, where appropriate, to the gross carrying amount of the financial asset.
d. pROpERTy pLaNT & EquIpMENTS : Property, Plant and Equipment are stated at cost
of acquisition or construction less accumulated depreciation and accumulated impairement losses. The cost of Property, Plant and Equipment comprises of its purchase price, non-refundable taxes & levies, freight and other incidental expenses related to the acquisition and installation of the respective assets.
Subsequent expenditure related to an item of Property, Plant and Equipment is added to its book value only if it increases the future benefits from the existing asset beyond its previously assessed standard of performance. All other expenses on existing assets, including day-to-day repair and maintenance expenditure and cost of replacing parts, are charged to the Statement of Profit and Loss for the period during which such expenses are incurred except for high values which are capitalised.
Gains or losses arising from de-recognition of Property, Plant and Equipment are measured as the difference between the net disposal proceeds and the carrying amount of the asset and are recognised in the Statement of Profit and Loss when the asset is derecognised.
Capital assets under erection/installation are stated at cost in the Balance Sheet as “Capital Work-in-Progress”.
Advances paid towards the acquisition of property, plant and equipment outstanding at each reporting date is disclosed as capital advances under other non current assets. The cost of property, plant and equipment not ready to use before such date are disclosed under capital work-in-progress. Assets not ready for use are not depreciated.
Transition to Ind aS On transiiton to Ind AS, the group has elected to
continue with the carrying value of all of its property, plant and equipment recognised as at 1 April 2016 measured as per the previous GAAP and use that carrying value as the deemed cost of the property, plant and equipment.
e. INTaNgIBLE aSSETS : Intangible assets that are acquired by the Company
and that have finite useful lives are measured at cost less accumulated amortisation and accumulated impairment losses.
Subsequent expenditures are capitalised only when they increase the future economic benefits embodied in the specific asset to which they relate.
Transition to Ind aS On transiiton to Ind AS, the group has elected
to continue with the carrying value of all of its intangible assets recognised as at 1 April 2016 measured as per the previous GAAP and use that carrying value as the deemed cost of the intangible assets.
Financial StatementsConsolidated
06
31st Annual Report 2017-18 131
f. DEpRECIaTION / aMORTISaTION : Depreciation on Fixed Assets is provided on Straight
Line method (SLM) based on useful life of the assets as prescribed under Part-C of Schedule II to the companies Act, 2013 except in respect of the following assets , where useful life is different than those prescribed in Schedule II are used. The Management estimates the useful lives for such fixed assets as under:-
particulars Estimated useful LifeFurniture & Fixtures Over a Period of 9 YearsVehicles Over a Period of 8 YearsPlant & Machineries, Equipments, Electrical Installation & Utilities
Over a Period of 9 Years
Office Building Over a Period of 30 Years
g. IMpaIRMENT OF NON - FINaNCIaL aSSET - property, plant and Equipment and Intangible assets:
The Company assesses at each reporting date as to whether there is any indication that any Property, Plant and Equipment and Intangible Assets or group of Assets, called Cash Generating Units (CGU) may be impaired. If any such indication exists, the recoverable amount of an asset or CGU is estimated to determine the extent of impairment, if any. When it is not possible to estimate the recoverable amount of an individual asset, the Company estimates the recoverable amount of the CGU to which the asset belongs.
An impairment loss is recognised in the Statement of Profit and Loss to the extent, assets carrying amount exceeds its recoverable amount. The recoverable amount is higher of an assets’ fair value less cost of disposal and value in use. Value in use is based on the estimated future cash flows, discounted to their present value using pre-tax discount rate that reflects current market assessments of the time value of money and risk specific to the assets.
Goodwill is tested for impairment annually as at year end and when circumstances indicate that the carrying value may be impaired. Impairment is determined for goodwill by assessing the recoverable amount of each CGU (or group of CGUs’) to which the goodwill relates. When the recoverable amount of the CGU is less than its carrying amount, an impairment loss is recognised. Impairment losses relating to goodwill are not reversed in future periods.
h. INvESTMENTS: Investments, which are readily realisable and intended to
be held for not more than a year from the date on which such investments are made, are classified as current investments. All other investments are classified as long-term investments.
Current investments are carried in the financial statements at lower of cost and fair value determined on an individual investment basis. Long-term investments are carried at cost. However, provision for diminution in value is made to recognise a decline other than temporary in the value of the investments.
Investments in buildings that are not intended to be occupied substantially for use by, or in the operations of the Company, have been classified as investment properties. Investment properties are carried at cost less accumulated depreciation and accumulated impairment losses, if any.
i. INvENTORIES: Inventories include raw materials, bought out
components, work-in-progress and manufactured finished goods.
Finished products: Finished products produced by the Company are valued
at lower of cost and net realisable value. Cost includes direct materials, labour, a proportion of manufacturing overheads.
Work in progress: Work in Progress is valued at cost of direct materials,
labour and other Manufacturing overheads up to estimated stage of process.
Raw materials and stores and spares: Raw materials and stores and spares are valued at Lower
of cost and net realisable value. However, materials and other items held for use in the production of inventories are not written down below cost if the finished products in which they will be incorporated are expected to be sold at or above cost. The cost is determined using First in First out (FIFO) method.
j. BORROWINg COSTS: Borrowing costs that are attributable to the acquisitions
or construction of fixed assets/ qualifying assets for expansion/new project are capitalised to respective fixed assets. A qualifying asset is one that necessarily takes substantial period of time to get ready for its intended use. Other borrowing costs are charged to revenue in the year in which they are incurred.
k. FOREIgN CuRRENCy TRaNSaCTIONS: i Foreign currency transactions are recorded at the
exchange rates prevailing at the time of transaction.
ii Monetary items representing assets and liabilities denominated in foreign currencies at the balance sheet date are translated at rates prevailing on balance sheet date.
Notes Forming Part of Consolidated Financial Statements for the year ended 31 March 2018
Hester Biosciences Limited
132
iii Investments in equity capital of company registered outside India are carried in the Balance Sheet at the rates prevailing on the date of transaction.
iv Non-monetary items which are carried in terms of historical cost denominated in foreign currency are reported using the exchange rate at the date of transaction. Exchange differences arising as a result of the above are recognised as income or expenses in the statement of profit and loss. Exchange difference arising on the settlement of monetary items at rates different from those at which they were initially recorded during the year, or reported in previous financial statements, are recognised as income or expenses in the year in which they arise.
l. RESEaRCH aND DEvELOpMENT: Revenue expenditure on Research and Development is
charged to the Statement of Profit and Loss for the year in which it is incurred. Capital expenditure on Research and Development is shown as an addition to the fixed assets and is depreciated on the same basis as other fixed assets.
m. pROvISION FOR RETIREMENT BENEFITS: (i) short-term employee Benefits: The undiscounted amount of short term employee
benefits expected to be paid in exchange for the services rendered by employees are recognised as an expense during the period when the employees render the services.
(ii) post- employment benefit plans: (a) Defined Contribution plan: Contribution for provident fund are accrued
in accordance with applicable statutes and deposited with the Regional Provident Fund Commissioner.
(b) Defined Benefit plan: The Company operates two defined benefit
plans for its employees, viz., Gratuity and Leave Encashment. The costs of providing benefits under these plans are determined on the basis of actuarial valuation at each year-end. Actuarial valuation is carried out for using the projected unit credit method. Actuarial gains and losses for defined benefit plan is recognised in full in the period in which they occur.
Remeasurements, comprising of actuarial gains and losses are recognised immediately in the balance sheet with a corresponding debit or credit to retained earnings through OCI in the period in which they occur. Remeasurements
are not reclassified to profit or loss in subsequent periods.
n. EaRNINgS pER SHaRE: Basic earnings per share are calculated by dividing the
net profit or loss after tax for the year attributable to equity shareholders by the weighted average number of equity shares outstanding during the year.
For the purpose of calculating diluted earnings per share, the net profit or loss for the period attributable to equity shareholders of the parent company and the weighted average number of shares outstanding during the period are adjusted for the effects of all dilutive potential equity shares, which includes all stock options granted to employees.
o. CaSH aND CaSH EquIvaLENTS: Cash and cash equivalents comprises cash on hand and
balance at bank including fixed deposits with an original maturity period of less than three months and short term investments with an original maturity of three months or less.
p. FINaNCIaL INSTRuMENTS: (i) financial Asset:
(a) Classification: On initial recognition the Company classifies
financial assets as subsequently measured at amortised cost, fair value through other comprehensive income or fair value through profit or loss on the basis of its business model for managing the financial assets and the contractual cash flow characteristics of the financial asset.
(b) Initial recognition and measurement: All financial assets (not measured subsequently
at fair value through profit or loss) are recognised initially at fair value plus transaction costs that are attributable to the acquisition of the financial asset. Purchases or sales of financial assets that require delivery of assets within a time frame established by regulation or convention in the market place (regular way trades) are recognised on the trade date,i.e., the date that the Group commits to purchase or sell the asset.
(c) Financial assets at amortised cost: A ‘financial asset’ is measured at the amortised
cost if both the following conditions are met:
1) the asset is held within a business model whose objective is to hold assets for collecting contractual cash flows, and
Notes Forming Part of Consolidated Financial Statements for the year ended 31 March 2018
Financial StatementsConsolidated
06
31st Annual Report 2017-18 133
2) contractual terms of the asset give rise on specified dates to cash flows that are solely payments of principal and interest (SPPI) on the principal amount outstanding.
After initial measurement, such financial assets are subsequently measured at amortised cost using the Effective Interest Rate (EIR) method. Amortised cost is calculated by taking into account any discount or premium and fees or costs that are an integral part of the EIR. The EIR amortisation is included in finance income in the Statement of Profit and Loss. The losses arising from impairment are recognised in the Statement of Profit and Loss. This category generally applies to trade and other receivables.
Financial assets included within the fair value through profit and loss (FVTPL) category are measured at fair value with all changes recognised.
(d) Derecognition: A financial asset (or, where applicable, a part
of a financial asset or part of a group of similar financial assets) is primarily derecognised (i.e. removed from the groups’ financial statements) when:
The rights to receive cash flows from The asset have expired, or
The Company has transferred its rights to receive cash flows from the asset or has assumed an obligation to pay the received cash flows in full without material delay to a third party under a ‘pass-through’ arrangement; and either:
(i) the Company has transferred substantially all the risks and rewards of the asset, or
(ii) the Company has neither transferred nor retained substantially all the risks and rewards of the asset, but has transferred control of the asset.
When the Company has transferred its rights to receive cash flows from an asset or has entered into a pass-through arrangement, it evaluates if and to what extent it has retained the risks and rewards of ownership. When it has neither transferred nor retained substantially all of the risks and rewards of the asset, nor transferred control of the
asset, the Company continues to recognise the transferred asset to the extent of the Companys’ continuing involvement. In that case, the Company also recognises an associated liability. The transferred asset and the associated liability are measured on a basis thatreflects the rights and obligations that the Company has retained.
Continuing involvement that takes the form of a guarantee over the transferred asset is measured at the lower of the original carrying amount of the asset and the maximum amount of consideration that the Company could be required to repay.
(e) Impairment of financial assets: In accordance with Ind AS 109, the Company
applies Expected Credit Loss (ECL) model for measurement and recognition of impairment loss on the following financial assets and credit risk exposure:
(i) financial assets that are debt instruments, and are measured at amortised cost e.g., loans, debt securities, deposits, and bank balance.
(ii) trade receivables: The Company follows ‘simplified
approach’ for recognition of impairment loss allowance on trade receivables which do not contain a significant financing component.
The application of simplified approach does not require the Company to track changes in credit risk. Rather, it recognises impairment loss allowance based on lifetime ECLs at each reporting date, right from its initial recognition.
(ii) financial liabilities: (a) Classification: The Company classifies all financial liabilities
as subsequently measured at amortised cost, except for financial liabilities measured at fair value through profit or loss. Such liabilities, including derivatives that are liabilities, shall be subsequently measured at fair value with changes in fair value being recognised in the Statement of Profit and Loss.
(b) Initial recognition and measurement: Financial liabilities are classified, at initial
recognition, as financial liabilities at fair value through profit or loss, at amortised cost (loans and borrowings, and payables), or as
Notes Forming Part of Consolidated Financial Statements for the year ended 31 March 2018
Hester Biosciences Limited
134
derivatives designated as hedging instruments in an effective hedge, as appropriate.
All financial liabilities are recognised initially at fair value and, in the case of loans and borrowings and payables, net of directly attributable transaction costs.
The Companys’ financial liabilities include trade and other payables, loans and borrowings including bank overdrafts, financial guarantee contracts and derivative financial instruments.
(c) Loans and borrowings: After initial recognition, interest-bearing loans
and borrowings are subsequently measured at amortised cost using the EIR method. Gains and losses are recognised in Statement of Profit and Loss when the liabilities are derecognised.
Amortised cost is calculated by taking into account any discount or premium on acquisition and fees or costs that are an integral part of the EIR. The EIR amortisation is included as finance costs in the Statement of Profit and Loss. This category generally applies to interest-bearing loans and borrowings.
(d) Derecognition: A financial liability is derecognised when the
obligation under the liability is discharged or cancelled or expires. When an existing financial liability is replaced by another from the same lender on substantially different terms, or the terms of an existing liability are substantially modified, such an exchange or modification is treated as the derecognition of the original liability and the recognition of a new liability. The difference in the respective carrying amounts is recognised in the Statement of Profit and Loss.
q. TaxaTION: i. current tax: Current tax is the expected tax payable on the
taxable income for the year, using tax rates enacted or substantively enacted at the reporting date, and any adjustment to tax payable in respect of previous years.
ii. deferred tax provision: Deferred tax is recognised on temporary differences
between the carrying amounts of assets and liabilities in the financial statements and the corresponding tax bases used in the computation of
taxable profit. Deferred tax liabilities and assets are measured at the tax rates that are expected to apply in the period in which the liability is settled or the asset realised, based on tax rates (and tax laws) that have been enacted or substantively enacted by the end of the reporting period. The carrying amount of deferred tax liabilities and assets are reviewed at the end of each reporting period.
iii. minimum Alternative tax (mAt): Minimum Alternative Tax (MAT) paid in accordance
with the tax laws in India which gives rise to future economic benefit in the form of MAT credit entitlement for adjustment of future income tax liability, is considered as an asset only when there is convincing evidence that the company will pay normal income tax within the specified period. Accordingly MAT is recognised as an asset in the balance sheet when the asset can be measured reliably and it is probable that the future economic benefit associated with it will fructify. Such assets are revised at each balance sheet date.
r. gRaNTS: Government grants are recognised when there is
reasonable assurance that the Company will comply with the conditions attached to them and the grants will be received. Government grants receivable are recognised as income over the periods necessary to match them with the related costs which they are intended to compensate, on a systematic basis.
s. pROvISIONS aND CONTINgENT LIaBILITIES: A provision is recognised when an enterprise has a
present obligation as a result of past event; it is probable that an outflow of resources will be required to settle the obligation, in respect of which a reliable estimate can be made. Provisions are not discounted to its present value and are determined based on best estimate required to settle the obligation at the balance sheet date. These are reviewed at each balance sheet date and adjusted to reflect the current best estimates. A Contingent Liability is a possible obligation that arises from past events whose existence will be confirmed by the occurrence or non-occurrence of one or more uncertain future events beyond the control of the Company or a present obligation that is not recognised because it is not probable that an outflow of resources will be required to settle the obligation. , A Contingent Liability also arises in extremely rare cases where there is a liability that cannot be recognised because it cannot be measured reliably. The Company does not recognise a contingent liability but discloses its existence in the financial statements.
Notes Forming Part of Consolidated Financial Statements for the year ended 31 March 2018
Financial StatementsConsolidated
06
31st Annual Report 2017-18 135
t. OpERaTINg CyCLE aND CuRRENT/NON-CuRRENT CLaSSIFICaTION:
All the assets and liabilities have been classified as current or non current as per the Companys’ normal operating cycle and other criteria set out in the Schedule III to the Companies Act, 2013.
An asset is current when it is: - Expected to be realised or intended to be sold or
consumed in normal operating cycle.
- Held primarily for the purpose of trading.
- Expected to be realised within twelve months after the reporting period, or
- Cash or cash equivalent unless restricted from being exchanged or used to settle a liability for at least twelve months after the reporting period
All other assets are classified as non-current.
A liability is current when:
- It is expected to be settled in normal operating cycle.
- It is held primarily for the purpose of trading.
- It is due to be settled within twelve months after the reporting period, or
- There is no unconditional right to defer the settlement of the liability for at least twelve months after the reporting period.
The Company classifies all other liabilities as non-current.
Deferred tax assets and liabilities are classified as non-current assets and liabilities.
u. BIOLOgICaL aSSETS: Biological assets are measured at fair value less costs to
sell, with any change therein recognised in Statement of Profit and Loss.
v. STaNDaRDS ISSuED BuT NOT EFFECTIvE: Appendix B to Ind AS 21, Foreign currency transactions
and advance consideration: On 28 March 2018, Ministry
of Corporate Affairs (“MCA”) has notified the Companies (Indian Accounting Standards) Amendment Rules, 2018 containing Appendix B to Ind AS 21, Foreign currency transactions and advance consideration which clarifies the date of the transaction for the purpose of determining the exchange rate to use on initial recognition of the related asset, expense or income, when an entity has received or paid advance consideration in a foreign currency. The amendment will come into force from 1 April 2018. The Company has evaluated the effect of this on the financial statements and the impact is not material.
Ind AS 115- Revenue from Contract with Customers: On 28 March 2018, Ministry of Corporate Affairs (“MCA”) has notified the Ind AS 115, Revenue from Contract with Customers. The core principle of the new standard is that an entity should recognise revenue to depict the transfer of promised goods or services to customers in an amount that reflects the consideration to which the entity expects to be entitled in exchange for those goods or services. Further the new standard requires enhanced disclosures about the nature, amount, timing and uncertainty of revenue and cash flows arising from the entitys’ contracts with customers.
The standard permits two possible methods of transition:
- Retrospective approach - Under this approach the standard will be applied retrospectively to each prior reporting period presented in accordance with Ind AS 8- Accounting Policies, Changes in Accounting Estimates and Errors.
- Retrospectively with cumulative effect of initially applying the standard recognised at the date of initial application (Cumulative catch-up approach).
The effective date for adoption of Ind AS 115 is financial periods beginning on or after 1 April 2018. The effect on adoption of Ind AS 115 is expected to be insignificant.
Notes Forming Part of Consolidated Financial Statements for the year ended 31 March 2018
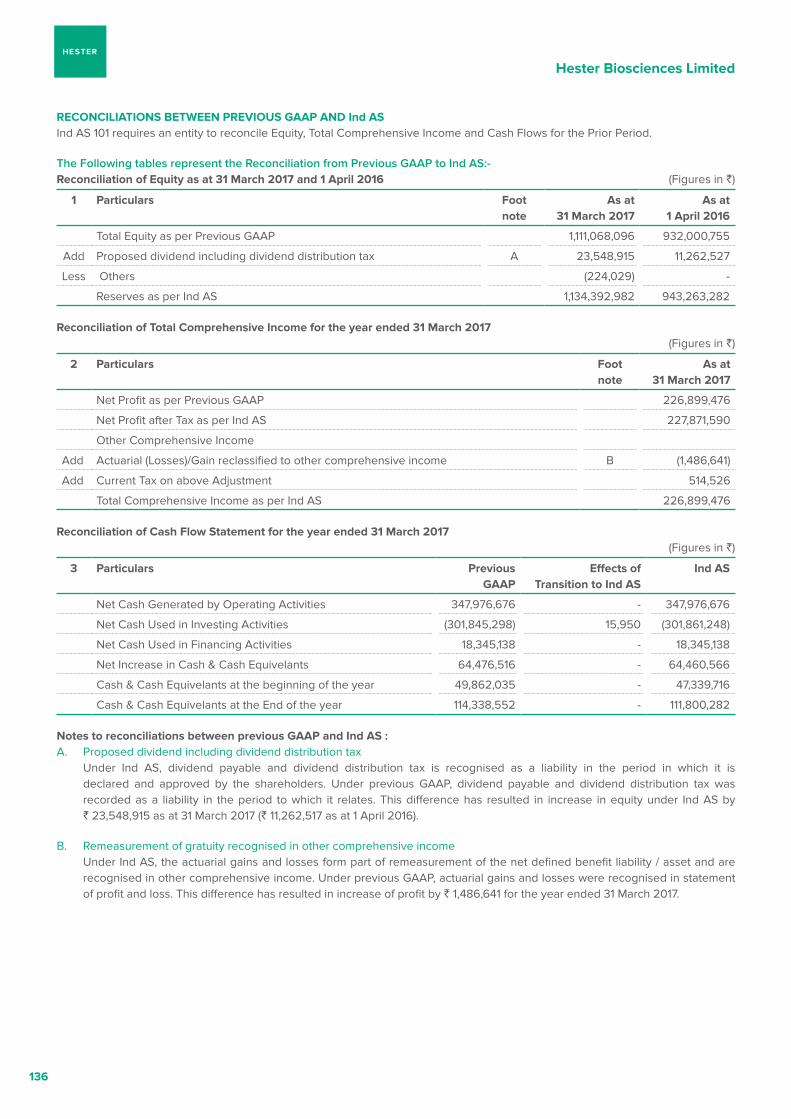
Hester Biosciences Limited
136
RECONCILIaTIONS BETWEEN pREvIOuS gaap aND Ind aS Ind AS 101 requires an entity to reconcile Equity, Total Comprehensive Income and Cash Flows for the Prior Period.
the following tables represent the reconciliation from previous gAAp to Ind As:- Reconciliation of Equity as at 31 March 2017 and 1 april 2016 (Figures in `)
1 particulars Foot note
as at 31 March 2017
as at1 april 2016
Total Equity as per Previous GAAP 1,111,068,096 932,000,755
Add Proposed dividend including dividend distribution tax A 23,548,915 11,262,527
Less Others (224,029) -
Reserves as per Ind AS 1,134,392,982 943,263,282
Reconciliation of Total Comprehensive Income for the year ended 31 March 2017 (Figures in `)
2 particulars Foot note
as at31 March 2017
Net Profit as per Previous GAAP 226,899,476
Net Profit after Tax as per Ind AS 227,871,590
Other Comprehensive Income
Add Actuarial (Losses)/Gain reclassified to other comprehensive income B (1,486,641)
Add Current Tax on above Adjustment 514,526
Total Comprehensive Income as per Ind AS 226,899,476
Reconciliation of Cash Flow Statement for the year ended 31 March 2017 (Figures in `)
3 particulars previous gaap
Effects of Transition to Ind aS
Ind aS
Net Cash Generated by Operating Activities 347,976,676 - 347,976,676
Net Cash Used in Investing Activities (301,845,298) 15,950 (301,861,248)
Net Cash Used in Financing Activities 18,345,138 - 18,345,138
Net Increase in Cash & Cash Equivelants 64,476,516 - 64,460,566
Cash & Cash Equivelants at the beginning of the year 49,862,035 - 47,339,716
Cash & Cash Equivelants at the End of the year 114,338,552 - 111,800,282
Notes to reconciliations between previous gaap and Ind aS : A. Proposed dividend including dividend distribution tax Under Ind AS, dividend payable and dividend distribution tax is recognised as a liability in the period in which it is
declared and approved by the shareholders. Under previous GAAP, dividend payable and dividend distribution tax was recorded as a liability in the period to which it relates. This difference has resulted in increase in equity under Ind AS by ` 23,548,915 as at 31 March 2017 (` 11,262,517 as at 1 April 2016).
B. Remeasurement of gratuity recognised in other comprehensive income Under Ind AS, the actuarial gains and losses form part of remeasurement of the net defined benefit liability / asset and are
recognised in other comprehensive income. Under previous GAAP, actuarial gains and losses were recognised in statement of profit and loss. This difference has resulted in increase of profit by ` 1,486,641 for the year ended 31 March 2017.
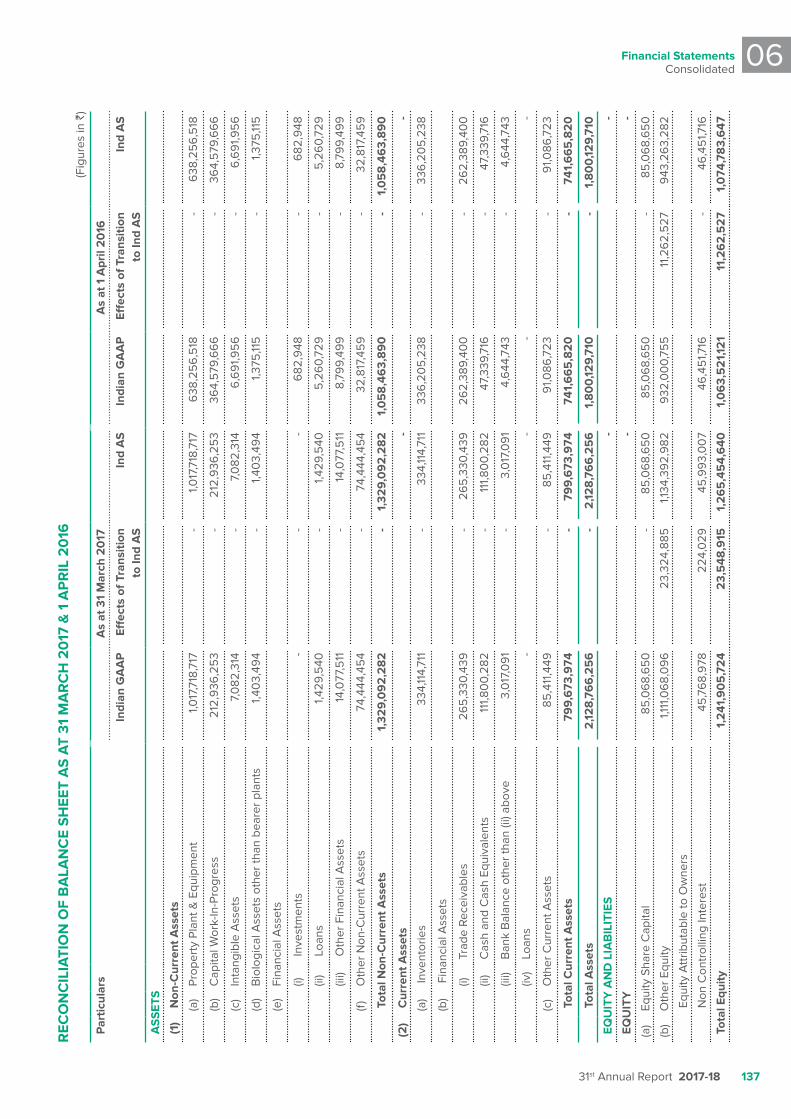
Financial StatementsConsolidated
06
31st Annual Report 2017-18 137
REC
ON
CIL
IaTI
ON
OF
Ba
LaN
CE
SH
EET
aS
aT
31 M
aR
CH
20
17 &
1 a
pR
IL 2
016
(Fig
ures
in `
)
par
ticul
ars
as
at 3
1 M
arch
20
17
as
at 1
apr
il 2
016
Indi
an g
aa
p
Eff
ects
of T
rans
ition
to
Ind
aS
In
d a
S
Indi
an g
aa
p
Eff
ects
of T
rans
ition
to
Ind
aS
In
d a
S
aS
SET
S
(1)
Non
-Cur
rent
ass
ets
(a)
Prop
erty
Pla
nt &
Equ
ipm
ent
1,0
17,7
18,7
17
- 1
,017
,718
,717
6
38,2
56
,518
-
638
,25
6,5
18
(b)
Cap
ital W
ork-
In-P
rogr
ess
212
,936
,25
3 -
212
,936
,25
3 3
64,
579
,66
6
- 3
64,
579
,66
6
(c)
Inta
ngib
le A
sset
s 7
,082
,314
-
7,0
82,3
14
6,6
91,9
56
-
6,6
91,9
56
(d)
Bio
logi
cal A
sset
s ot
her t
han
bear
er p
lant
s 1
,40
3,49
4 -
1,4
03,
494
1,3
75,11
5
- 1
,375
,115
(e)
Fina
ncia
l Ass
ets
(i) In
vest
men
ts
- -
- 6
82,9
48
- 6
82,9
48
(ii)
Loa
ns
1,4
29,5
40
- 1
,429
,540
5
,26
0,72
9
- 5
,26
0,72
9
(iii)
Oth
er F
inan
cial
Ass
ets
14,
077
,511
-
14,
077
,511
8
,79
9,49
9
- 8
,79
9,49
9
(f)
Oth
er N
on-C
urre
nt A
sset
s 7
4,44
4,45
4 -
74,
444,
454
32,
817,
459
-
32,
817,
459
Tot
al N
on-C
urre
nt a
sset
s 1
,32
9,0
92
,28
2
- 1
,32
9,0
92
,28
2
1,0
58
,46
3,8
90
-
1,0
58
,46
3,8
90
(2)
Cur
rent
ass
ets
- -
(a)
Inve
ntor
ies
334
,114,
711
- 3
34,11
4,71
1 3
36,2
05
,238
-
336
,20
5,2
38
(b)
Fin
anci
al A
sset
s
(i)Tr
ade
Rece
ivab
les
26
5,3
30,4
39
- 2
65
,330
,439
2
62,
389,
400
-
26
2,38
9,40
0
(ii)
Cas
h an
d C
ash
Equi
vale
nts
111
,80
0,28
2 -
111
,80
0,28
2 4
7,33
9,71
6
- 4
7,33
9,71
6
(iii)
Ban
k B
alan
ce o
ther
than
(ii)
abov
e 3
,017
,09
1 -
3,0
17,0
91
4,6
44,7
43
- 4
,644
,743
(iv)
Loan
s -
- -
-
(c)
Oth
er C
urre
nt A
sset
s 8
5,4
11,4
49
- 8
5,4
11,4
49
91,0
86,7
23
- 9
1,086
,723
Tot
al C
urre
nt a
sset
s 7
99,
673
,974
-
79
9,6
73,9
74
741
,66
5,8
20
-
741
,66
5,8
20
Tot
al a
sset
s 2
,128
,76
6,2
56
-
2,12
8,7
66
,25
6
1,8
00
,129,
710
-
1,8
00
,129,
710
Eq
uIT
y a
ND
LIa
BIL
ITIE
S
- -
Eq
uIT
y
- -
(a)
Equi
ty S
hare
Cap
ital
85
,06
8,6
50
-
85
,06
8,6
50
8
5,0
68,
65
0
- 8
5,0
68,
65
0
(b)
Oth
er E
quity
1
,111,0
68,
09
6
23,
324,
885
1
,134,
392,
982
9
32,0
00,
755
1
1,26
2,5
27
943
,26
3,28
2
Equ
ity A
ttrib
utab
le to
Ow
ners
Non
Con
trol
ling
Inte
rest
4
5,7
68,
978
2
24,0
29
45
,99
3,0
07
46
,45
1,716
-
46
,45
1,716
Tot
al E
quity
1
,241
,90
5,7
24
23,
548
,915
1
,26
5,4
54,
640
1
,06
3,5
21,1
21
11,
26
2,5
27
1,0
74,7
83,
647
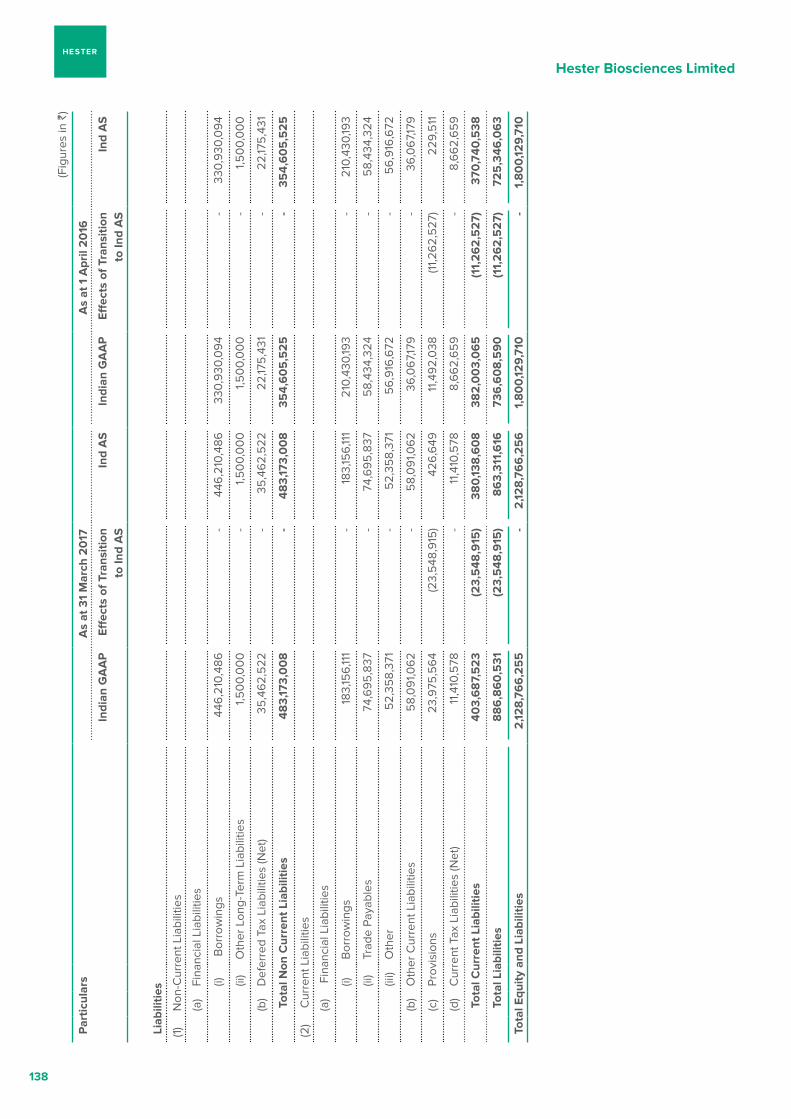
Hester Biosciences Limited
138
par
ticul
ars
as
at 3
1 M
arch
20
17
as
at 1
apr
il 2
016
Indi
an g
aa
p
Eff
ects
of T
rans
ition
to
Ind
aS
In
d a
S
Indi
an g
aa
p
Eff
ects
of T
rans
ition
to
Ind
aS
In
d a
S
Lia
bilit
ies
(1)N
on-C
urre
nt L
iabi
litie
s
(a)
Fina
ncia
l Lia
bilit
ies
(i) B
orro
win
gs
446
,210
,486
-
446
,210
,486
3
30,9
30,0
94
- 3
30,9
30,0
94
(ii)
Oth
er L
ong-
Term
Lia
bilit
ies
1,5
00,
00
0
- 1
,50
0,0
00
1
,50
0,0
00
-
1,5
00,
00
0
(b)
Def
erre
d Ta
x Li
abili
ties
(Net
) 3
5,4
62,
522
-
35
,46
2,5
22
22,
175
,431
-
22,
175
,431
Tot
al N
on C
urre
nt L
iabi
litie
s 4
83,
173,
00
8
- 4
83,
173,
00
8
35
4,6
05
,52
5
- 3
54,
60
5,5
25
(2)
Cur
rent
Lia
bilit
ies
(a)
Fin
anci
al L
iabi
litie
s
(i)B
orro
win
gs
183
,156
,111
- 1
83,15
6,11
1 2
10,4
30,19
3 -
210
,430
,193
(ii)
Trad
e Pa
yabl
es
74,
69
5,8
37
- 7
4,6
95
,837
5
8,43
4,32
4 -
58,
434,
324
(iii)
Oth
er
52,
358,
371
- 5
2,35
8,37
1 5
6,9
16,6
72
- 5
6,9
16,6
72
(b)
Oth
er C
urre
nt L
iabi
litie
s 5
8,0
91,0
62
- 5
8,0
91,0
62
36
,06
7,179
-
36
,06
7,179
(c)
Prov
isio
ns
23,
975
,56
4 (2
3,5
48,9
15)
426
,649
1
1,49
2,0
38
(11,2
62,
527
) 2
29,5
11
(d)
Cur
rent
Tax
Lia
bilit
ies
(Net
) 1
1,410
,578
-
11,4
10,5
78
8,6
62,
65
9 -
8,6
62,
65
9
Tot
al C
urre
nt L
iabi
litie
s 4
03,
68
7,5
23
(23,
548
,915
) 3
80
,138
,60
8
382
,00
3,0
65
(11,
26
2,5
27)
370
,740
,538
Tot
al L
iabi
litie
s 8
86
,86
0,5
31
(23,
548
,915
) 8
63,
311,
616
73
6,6
08
,59
0 (1
1,2
62
,52
7) 7
25
,346
,06
3
Tot
al E
quity
and
Lia
bilit
ies
2,12
8,7
66
,25
5
- 2
,128
,76
6,2
56
1,
80
0,12
9,71
0 -
1,8
00
,129,
710
(Fig
ures
in `
)
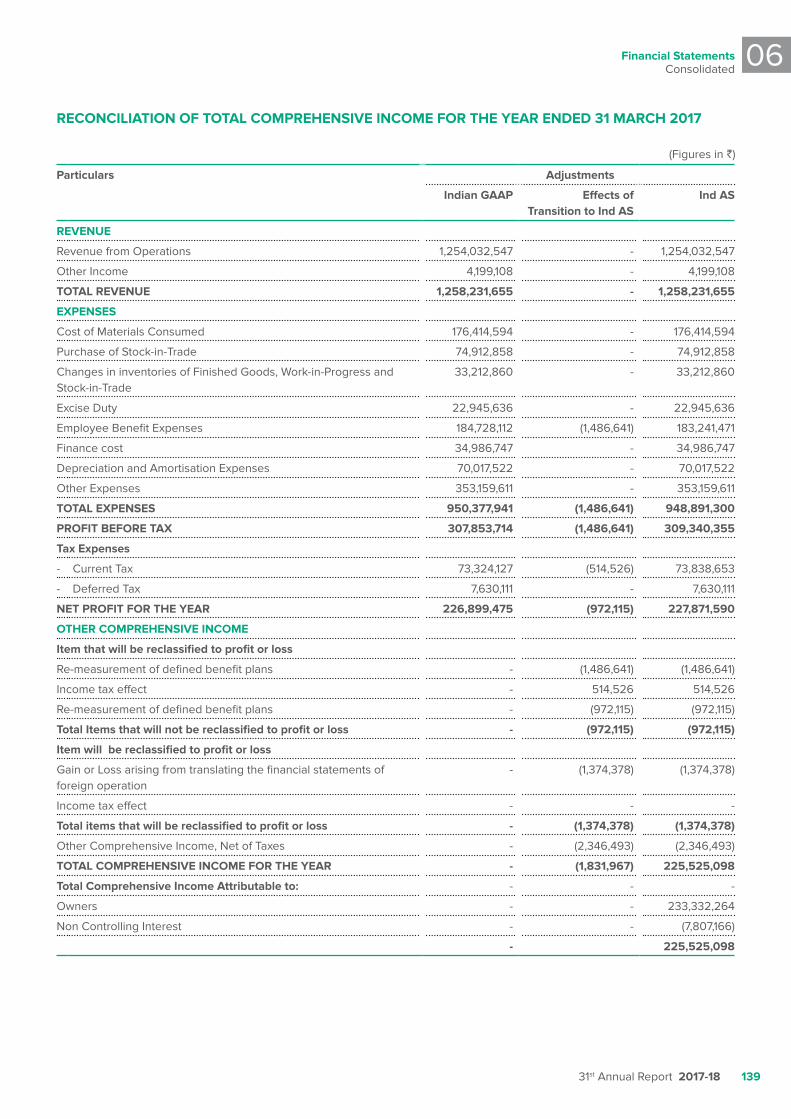
Financial StatementsConsolidated
06
31st Annual Report 2017-18 139
RECONCILIaTION OF TOTaL COMpREHENSIvE INCOME FOR THE yEaR ENDED 31 MaRCH 2017
(Figures in `)
particulars
adjustments
Indian gaap Effects of Transition to Ind aS
Ind aS
REvENuE
Revenue from Operations 1,254,032,547 - 1,254,032,547
Other Income 4,199,108 - 4,199,108
TOTaL REvENuE 1,258,231,655 - 1,258,231,655
ExpENSES
Cost of Materials Consumed 176,414,594 - 176,414,594
Purchase of Stock-in-Trade 74,912,858 - 74,912,858
Changes in inventories of Finished Goods, Work-in-Progress and Stock-in-Trade
33,212,860 - 33,212,860
Excise Duty 22,945,636 - 22,945,636
Employee Benefit Expenses 184,728,112 (1,486,641) 183,241,471
Finance cost 34,986,747 - 34,986,747
Depreciation and Amortisation Expenses 70,017,522 - 70,017,522
Other Expenses 353,159,611 - 353,159,611
TOTaL ExpENSES 950,377,941 (1,486,641) 948,891,300
pROFIT BEFORE Tax 307,853,714 (1,486,641) 309,340,355
Tax Expenses
- Current Tax 73,324,127 (514,526) 73,838,653
- Deferred Tax 7,630,111 - 7,630,111
NET pROFIT FOR THE yEaR 226,899,475 (972,115) 227,871,590
OTHER COMpREHENSIvE INCOME
Item that will be reclassified to profit or loss
Re-measurement of defined benefit plans - (1,486,641) (1,486,641)
Income tax effect - 514,526 514,526
Re-measurement of defined benefit plans - (972,115) (972,115)
Total Items that will not be reclassified to profit or loss - (972,115) (972,115)
Item will be reclassified to profit or loss
Gain or Loss arising from translating the financial statements of foreign operation
- (1,374,378) (1,374,378)
Income tax effect - - -
Total items that will be reclassified to profit or loss - (1,374,378) (1,374,378)
Other Comprehensive Income, Net of Taxes - (2,346,493) (2,346,493)
TOTaL COMpREHENSIvE INCOME FOR THE yEaR - (1,831,967) 225,525,098
Total Comprehensive Income attributable to: - - -
Owners - - 233,332,264
Non Controlling Interest - - (7,807,166)
- 225,525,098
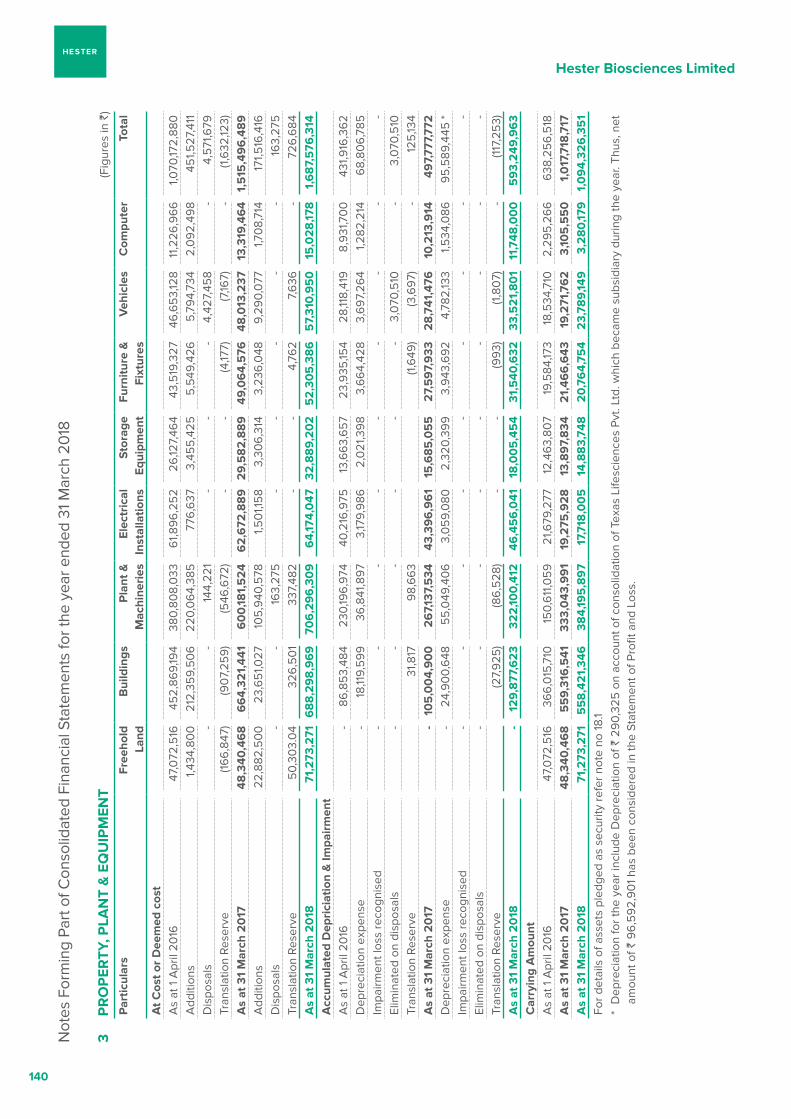
Hester Biosciences Limited
140
Not
es F
orm
ing
Part
of C
onso
lidat
ed F
inan
cial
Sta
tem
ents
for t
he y
ear e
nded
31 M
arch
20
18
3 p
RO
pER
Ty, p
LaN
T &
Eq
uIp
MEN
T (F
igur
es in
`)
par
ticul
ars
Fre
ehol
d La
nd
Bui
ldin
gs
pla
nt &
M
achi
neri
es
Ele
ctri
cal
Inst
alla
tions
S
tora
ge
Equi
pmen
t F
urni
ture
&
Fixt
ures
v
ehic
les
Com
pute
r T
otal
at C
ost o
r D
eem
ed c
ost
As
at 1
Apr
il 20
16 4
7,0
72,5
16
45
2,86
9,19
4 3
80,8
08,
033
6
1,89
6,2
52
26
,127,
464
43,
519
,327
4
6,6
53,
128
11,2
26,9
66
1
,070
,172,
880
A
dditi
ons
1,4
34,8
00
2
12,3
59,
50
6
220
,06
4,38
5
776
,637
3
,45
5,4
25
5,5
49,4
26
5,7
94,
734
2,0
92,
498
45
1,527
,411
D
ispo
sals
- -
144
,221
-
- -
4,4
27,4
58
- 4
,571
,679
Tr
ansl
atio
n Re
serv
e (1
66
,847
) (9
07,
259
) (5
46,6
72)
- -
(4,17
7) (7
,167)
- (1
,632
,123)
as
at 3
1 M
arch
20
1748
,340
,46
8
66
4,32
1,44
1 6
00
,181,
52
4 6
2,6
72,8
89
2
9,5
82
,88
9
49,
06
4,5
76
48
,013
,237
1
3,31
9,46
4 1,
515
,49
6,4
89
A
dditi
ons
22,
882,
50
0
23,
65
1,027
1
05
,940
,578
1
,50
1,15
8 3
,30
6,3
14
3,2
36,0
48
9,2
90,
077
1
,70
8,71
4 1
71,5
16,4
16
Dis
posa
ls -
- 1
63,
275
-
- -
- -
16
3,27
5
Tran
slat
ion
Rese
rve
50,
303.
04
326
,50
1 3
37,4
82
- -
4,7
62
7,6
36
- 7
26,6
84
as
at 3
1 M
arch
20
18 7
1,2
73,2
71
68
8,2
98
,96
9
70
6,2
96
,30
9
64,
174,
047
32
,88
9,2
02
5
2,3
05
,38
6
57,
310
,95
0
15
,02
8,17
8
1,6
87,
576
,314
a
ccum
ulat
ed D
epri
ciat
ion
& Im
pair
men
tA
s at
1 A
pril
2016
- 8
6,8
53,
484
230
,196
,974
4
0,21
6,9
75
13,
66
3,6
57
23,
935
,154
28,
118,
419
8
,931
,70
0
431
,916
,36
2 D
epre
ciat
ion
expe
nse
- 1
8,11
9,5
99
3
6,8
41,8
97
3,17
9,9
86
2,0
21,3
98
3,6
64,
428
3,6
97,
264
1,2
82,2
14
68,
806
,785
Im
pairm
ent l
oss
reco
gnis
ed -
- -
- -
- -
- -
Elim
inat
ed o
n di
spos
als
- -
- -
- -
3,0
70,5
10
- 3
,070
,510
Tr
ansl
atio
n Re
serv
e 3
1,817
9
8,6
63
(1,6
49)
(3,6
97)
- 1
25,13
4 a
s at
31
Mar
ch 2
017
- 1
05
,00
4,9
00
2
67,
137,
534
4
3,39
6,9
61
15
,68
5,0
55
2
7,5
97,
933
2
8,7
41,4
76
10
,213
,914
4
97,
777,
772
D
epre
ciat
ion
expe
nse
- 2
4,9
00,
648
5
5,0
49,4
06
3
,05
9,0
80
2,3
20,3
99
3
,943
,69
2 4
,782
,133
1,5
34,0
86
95
,589
,445
*Im
pairm
ent l
oss
reco
gnis
ed -
- -
- -
- -
- -
Elim
inat
ed o
n di
spos
als
- -
- -
- -
- -
- Tr
ansl
atio
n Re
serv
e (2
7,9
25)
(86
,528
) -
- (9
93)
(1,8
07)
- (1
17,2
53)
as
at 3
1 M
arch
20
18 -
12
9,8
77,6
23
32
2,10
0,4
12
46
,45
6,0
41
18
,00
5,4
54
31,
540
,632
3
3,5
21,
80
1 1
1,748
,00
0
59
3,2
49,9
63
Car
ryin
g a
mou
ntA
s at
1 A
pril
2016
47,
072
,516
3
66
,015
,710
1
50,
611
,05
9
21,6
79,2
77
12,
463,
807
19,
584
,173
18,
534
,710
2
,29
5,2
66
6
38,2
56
,518
a
s at
31
Mar
ch 2
017
48,3
40,4
68
5
59,
316
,541
3
33,0
43,9
91
19,
275
,92
8
13,
89
7,8
34
21,
466
,643
1
9,2
71,7
62
3
,105
,55
0
1,0
17,7
18,7
17
as
at 3
1 M
arch
20
18 7
1,2
73,2
71
55
8,4
21,
346
3
84,
195
,89
7 1
7,71
8,0
05
1
4,8
83,
748
2
0,7
64,
754
23,
789,
149
3
,28
0,17
9
1,0
94,
326
,35
1 Fo
r det
ails
of a
sset
s pl
edge
d as
sec
urity
refe
r not
e no
18.
1*
Dep
reci
atio
n fo
r the
yea
r inc
lude
Dep
reci
atio
n of
` 2
90,
325
on
acco
unt o
f con
solid
atio
n of
Tex
as L
ifesc
ienc
es P
vt. L
td. w
hich
bec
ame
subs
idia
ry d
urin
g th
e ye
ar. T
hus,
net
am
ount
of `
96
,59
2,9
01
has
been
con
side
red
in th
e St
atem
ent o
f Pro
fit a
nd L
oss.
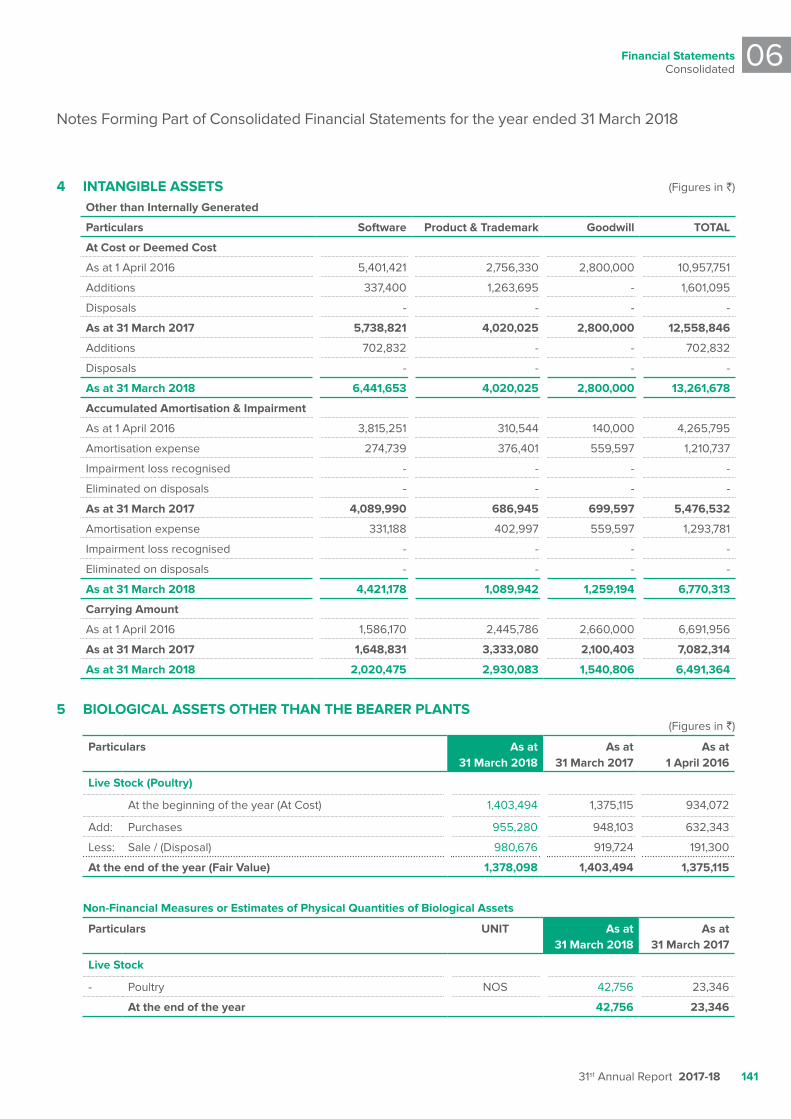
Financial StatementsConsolidated
06
31st Annual Report 2017-18 141
4 INTaNgIBLE aSSETS (Figures in `)
Other than Internally generated
particulars Software product & Trademark goodwill TOTaL
at Cost or Deemed Cost
As at 1 April 2016 5,401,421 2,756,330 2,800,000 10,957,751
Additions 337,400 1,263,695 - 1,601,095
Disposals - - - -
as at 31 March 2017 5,738,821 4,020,025 2,800,000 12,558,846
Additions 702,832 - - 702,832
Disposals - - - -
as at 31 March 2018 6,441,653 4,020,025 2,800,000 13,261,678
accumulated amortisation & Impairment
As at 1 April 2016 3,815,251 310,544 140,000 4,265,795
Amortisation expense 274,739 376,401 559,597 1,210,737
Impairment loss recognised - - - -
Eliminated on disposals - - - -
as at 31 March 2017 4,089,990 686,945 699,597 5,476,532
Amortisation expense 331,188 402,997 559,597 1,293,781
Impairment loss recognised - - - -
Eliminated on disposals - - - -
as at 31 March 2018 4,421,178 1,089,942 1,259,194 6,770,313
Carrying amount
As at 1 April 2016 1,586,170 2,445,786 2,660,000 6,691,956
as at 31 March 2017 1,648,831 3,333,080 2,100,403 7,082,314
as at 31 March 2018 2,020,475 2,930,083 1,540,806 6,491,364
5 BIOLOgICaL aSSETS OTHER THaN THE BEaRER pLaNTS(Figures in `)
particulars as at 31 March 2018
as at 31 March 2017
as at 1 april 2016
Live Stock (poultry)
At the beginning of the year (At Cost) 1,403,494 1,375,115 934,072
Add: Purchases 955,280 948,103 632,343
Less: Sale / (Disposal) 980,676 919,724 191,300
at the end of the year (Fair value) 1,378,098 1,403,494 1,375,115
Non-Financial Measures or Estimates of physical quantities of Biological assets
particulars uNIT as at 31 March 2018
as at 31 March 2017
Live Stock
- Poultry NOS 42,756 23,346
at the end of the year 42,756 23,346
Notes Forming Part of Consolidated Financial Statements for the year ended 31 March 2018
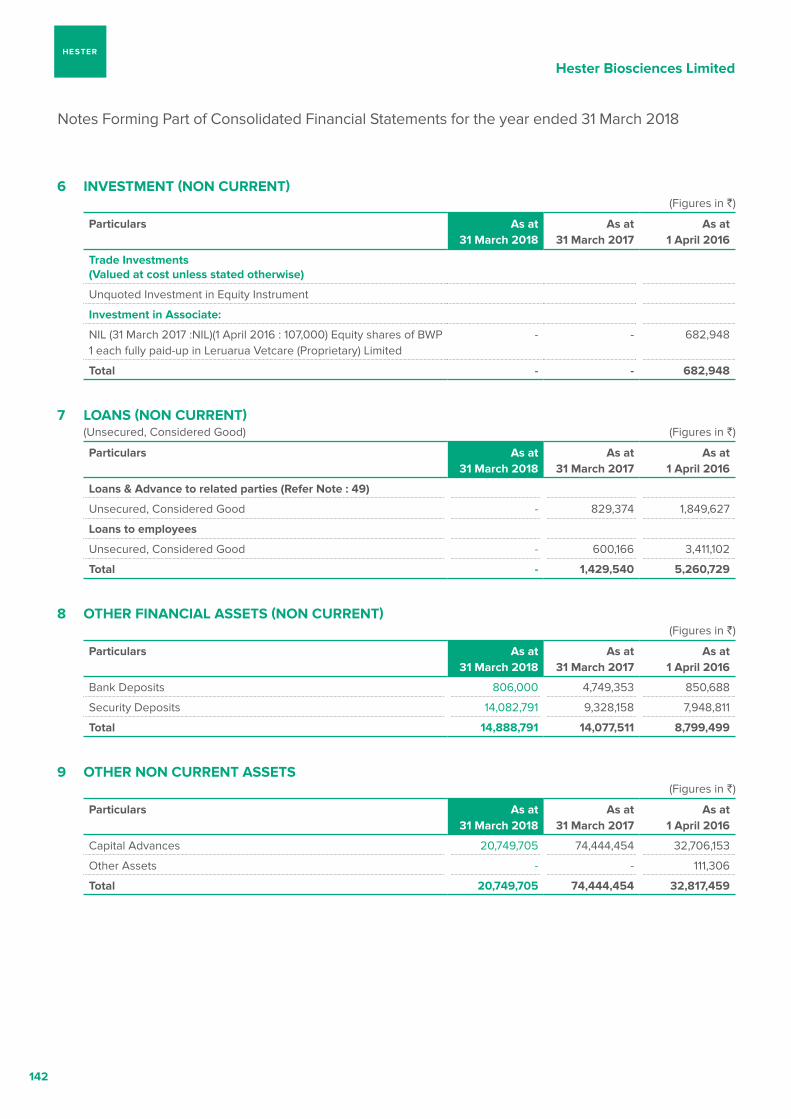
Hester Biosciences Limited
142
6 INvESTMENT (NON CuRRENT)(Figures in `)
particulars as at 31 March 2018
as at 31 March 2017
as at 1 april 2016
Trade Investments (valued at cost unless stated otherwise)
Unquoted Investment in Equity Instrument
Investment in associate:
NIL (31 March 2017 :NIL)(1 April 2016 : 107,000) Equity shares of BWP 1 each fully paid-up in Leruarua Vetcare (Proprietary) Limited
- - 682,948
Total - - 682,948
7 LOaNS (NON CuRRENT) (Unsecured, Considered Good) (Figures in `)
particulars as at 31 March 2018
as at 31 March 2017
as at 1 april 2016
Loans & advance to related parties (Refer Note : 49)
Unsecured, Considered Good - 829,374 1,849,627
Loans to employees
Unsecured, Considered Good - 600,166 3,411,102
Total - 1,429,540 5,260,729
8 OTHER FINaNCIaL aSSETS (NON CuRRENT)(Figures in `)
particulars as at 31 March 2018
as at 31 March 2017
as at 1 april 2016
Bank Deposits 806,000 4,749,353 850,688
Security Deposits 14,082,791 9,328,158 7,948,811
Total 14,888,791 14,077,511 8,799,499
9 OTHER NON CuRRENT aSSETS(Figures in `)
particulars as at 31 March 2018
as at 31 March 2017
as at 1 april 2016
Capital Advances 20,749,705 74,444,454 32,706,153
Other Assets - - 111,306
Total 20,749,705 74,444,454 32,817,459
Notes Forming Part of Consolidated Financial Statements for the year ended 31 March 2018
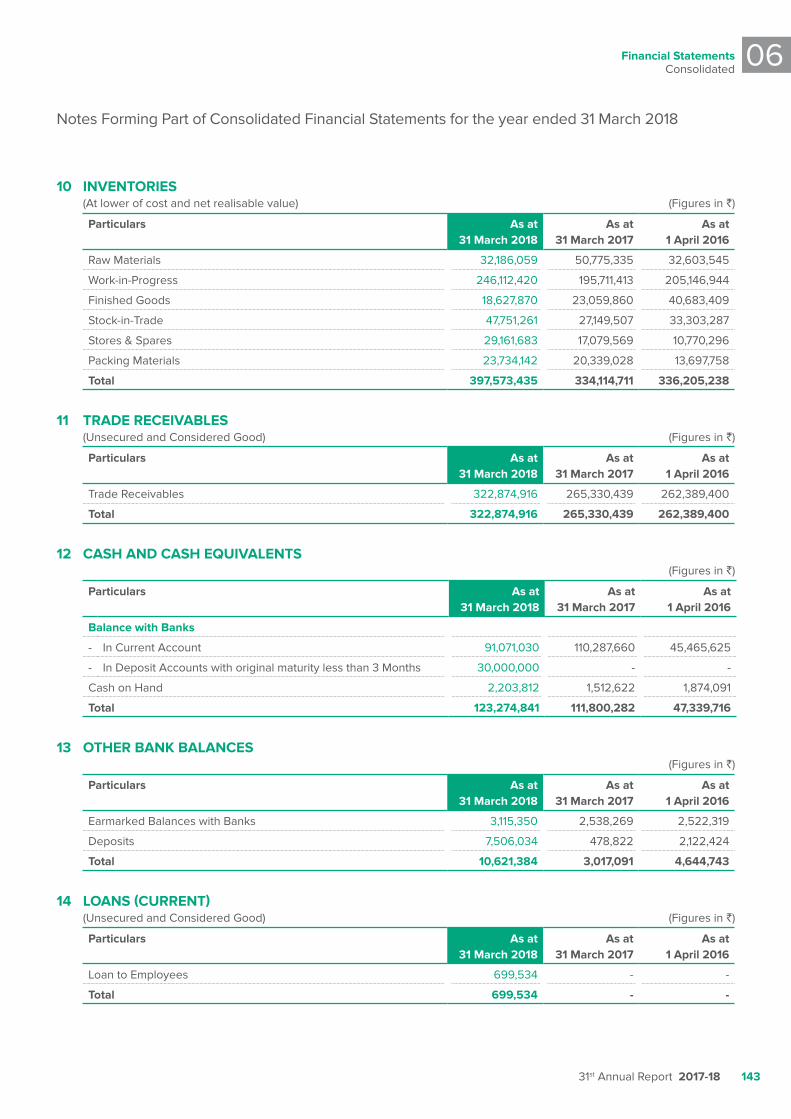
Financial StatementsConsolidated
06
31st Annual Report 2017-18 143
10 INvENTORIES (At lower of cost and net realisable value) (Figures in `)
particulars as at 31 March 2018
as at 31 March 2017
as at 1 april 2016
Raw Materials 32,186,059 50,775,335 32,603,545
Work-in-Progress 246,112,420 195,711,413 205,146,944
Finished Goods 18,627,870 23,059,860 40,683,409
Stock-in-Trade 47,751,261 27,149,507 33,303,287
Stores & Spares 29,161,683 17,079,569 10,770,296
Packing Materials 23,734,142 20,339,028 13,697,758
Total 397,573,435 334,114,711 336,205,238
11 TRaDE RECEIvaBLES (Unsecured and Considered Good) (Figures in `)
particulars as at 31 March 2018
as at 31 March 2017
as at 1 april 2016
Trade Receivables 322,874,916 265,330,439 262,389,400
Total 322,874,916 265,330,439 262,389,400
12 CaSH aND CaSH EquIvaLENTS(Figures in `)
particulars as at 31 March 2018
as at 31 March 2017
as at 1 april 2016
Balance with Banks
- In Current Account 91,071,030 110,287,660 45,465,625
- In Deposit Accounts with original maturity less than 3 Months 30,000,000 - -
Cash on Hand 2,203,812 1,512,622 1,874,091
Total 123,274,841 111,800,282 47,339,716
13 OTHER BaNk BaLaNCES(Figures in `)
particulars as at 31 March 2018
as at 31 March 2017
as at 1 april 2016
Earmarked Balances with Banks 3,115,350 2,538,269 2,522,319
Deposits 7,506,034 478,822 2,122,424
Total 10,621,384 3,017,091 4,644,743
14 LOaNS (CuRRENT) (Unsecured and Considered Good) (Figures in `)
particulars as at 31 March 2018
as at 31 March 2017
as at 1 april 2016
Loan to Employees 699,534 - -
Total 699,534 - -
Notes Forming Part of Consolidated Financial Statements for the year ended 31 March 2018
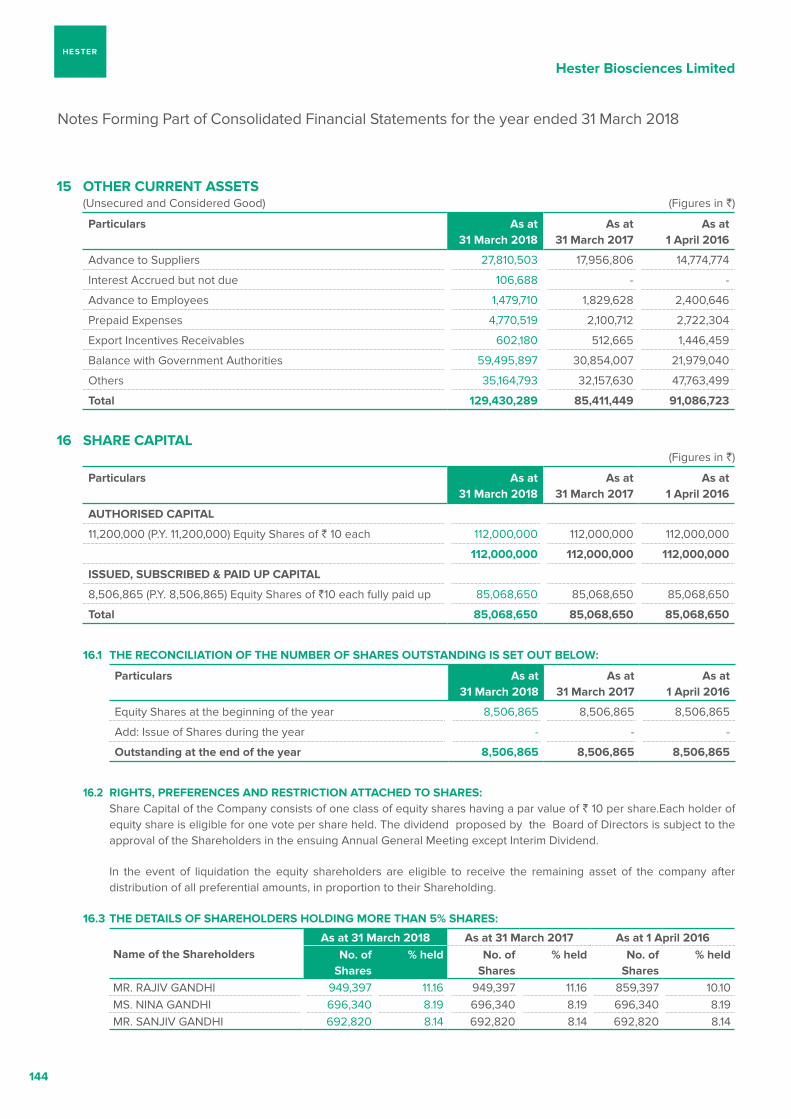
Hester Biosciences Limited
144
15 OTHER CuRRENT aSSETS (Unsecured and Considered Good) (Figures in `)
particulars as at 31 March 2018
as at 31 March 2017
as at 1 april 2016
Advance to Suppliers 27,810,503 17,956,806 14,774,774
Interest Accrued but not due 106,688 - -
Advance to Employees 1,479,710 1,829,628 2,400,646
Prepaid Expenses 4,770,519 2,100,712 2,722,304
Export Incentives Receivables 602,180 512,665 1,446,459
Balance with Government Authorities 59,495,897 30,854,007 21,979,040
Others 35,164,793 32,157,630 47,763,499
Total 129,430,289 85,411,449 91,086,723
16 SHaRE CapITaL(Figures in `)
particulars as at 31 March 2018
as at 31 March 2017
as at 1 april 2016
auTHORISED CapITaL
11,200,000 (P.Y. 11,200,000) Equity Shares of ` 10 each 112,000,000 112,000,000 112,000,000
112,000,000 112,000,000 112,000,000
ISSuED, SuBSCRIBED & paID up CapITaL
8,506,865 (P.Y. 8,506,865) Equity Shares of `10 each fully paid up 85,068,650 85,068,650 85,068,650
Total 85,068,650 85,068,650 85,068,650
16.1 THE RECONCILIaTION OF THE NuMBER OF SHaRES OuTSTaNDINg IS SET OuT BELOW:
particulars as at 31 March 2018
as at 31 March 2017
as at 1 april 2016
Equity Shares at the beginning of the year 8,506,865 8,506,865 8,506,865
Add: Issue of Shares during the year - - -
Outstanding at the end of the year 8,506,865 8,506,865 8,506,865
16.2 RIgHTS, pREFERENCES aND RESTRICTION aTTaCHED TO SHaRES: Share Capital of the Company consists of one class of equity shares having a par value of ` 10 per share.Each holder of
equity share is eligible for one vote per share held. The dividend proposed by the Board of Directors is subject to the approval of the Shareholders in the ensuing Annual General Meeting except Interim Dividend.
In the event of liquidation the equity shareholders are eligible to receive the remaining asset of the company after distribution of all preferential amounts, in proportion to their Shareholding.
16.3 THE DETaILS OF SHaREHOLDERS HOLDINg MORE THaN 5% SHaRES:
Name of the Shareholdersas at 31 March 2018 as at 31 March 2017 as at 1 april 2016
No. of Shares
% held No. of Shares
% held No. of Shares
% held
MR. RAJIV GANDHI 949,397 11.16 949,397 11.16 859,397 10.10MS. NINA GANDHI 696,340 8.19 696,340 8.19 696,340 8.19MR. SANJIV GANDHI 692,820 8.14 692,820 8.14 692,820 8.14
Notes Forming Part of Consolidated Financial Statements for the year ended 31 March 2018
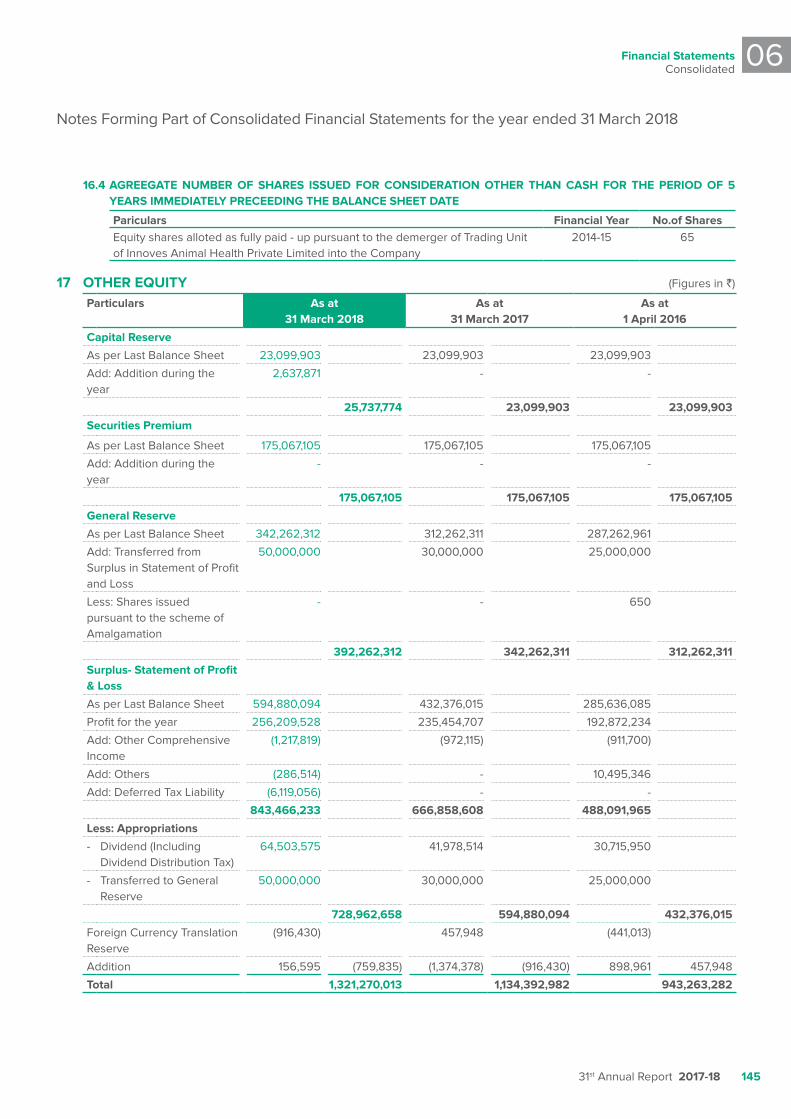
Financial StatementsConsolidated
06
31st Annual Report 2017-18 145
16.4 agREEgaTE NuMBER OF SHaRES ISSuED FOR CONSIDERaTION OTHER THaN CaSH FOR THE pERIOD OF 5 yEaRS IMMEDIaTELy pRECEEDINg THE BaLaNCE SHEET DaTE
pariculars Financial year No.of SharesEquity shares alloted as fully paid - up pursuant to the demerger of Trading Unit of Innoves Animal Health Private Limited into the Company
2014-15 65
17 OTHER EquITy (Figures in `)
particulars as at 31 March 2018
as at 31 March 2017
as at 1 april 2016
Capital Reserve
As per Last Balance Sheet 23,099,903 23,099,903 23,099,903
Add: Addition during the year
2,637,871 - -
25,737,774 23,099,903 23,099,903
Securities premium
As per Last Balance Sheet 175,067,105 175,067,105 175,067,105
Add: Addition during the year
- - -
175,067,105 175,067,105 175,067,105
general Reserve
As per Last Balance Sheet 342,262,312 312,262,311 287,262,961
Add: Transferred from Surplus in Statement of Profit and Loss
50,000,000 30,000,000 25,000,000
Less: Shares issued pursuant to the scheme of Amalgamation
- - 650
392,262,312 342,262,311 312,262,311
Surplus- Statement of profit & Loss
As per Last Balance Sheet 594,880,094 432,376,015 285,636,085
Profit for the year 256,209,528 235,454,707 192,872,234
Add: Other Comprehensive Income
(1,217,819) (972,115) (911,700)
Add: Others (286,514) - 10,495,346
Add: Deferred Tax Liability (6,119,056) - -
843,466,233 666,858,608 488,091,965
Less: appropriations
- Dividend (Including Dividend Distribution Tax)
64,503,575 41,978,514 30,715,950
- Transferred to General Reserve
50,000,000 30,000,000 25,000,000
728,962,658 594,880,094 432,376,015
Foreign Currency Translation Reserve
(916,430) 457,948 (441,013)
Addition 156,595 (759,835) (1,374,378) (916,430) 898,961 457,948
Total 1,321,270,013 1,134,392,982 943,263,282
Notes Forming Part of Consolidated Financial Statements for the year ended 31 March 2018
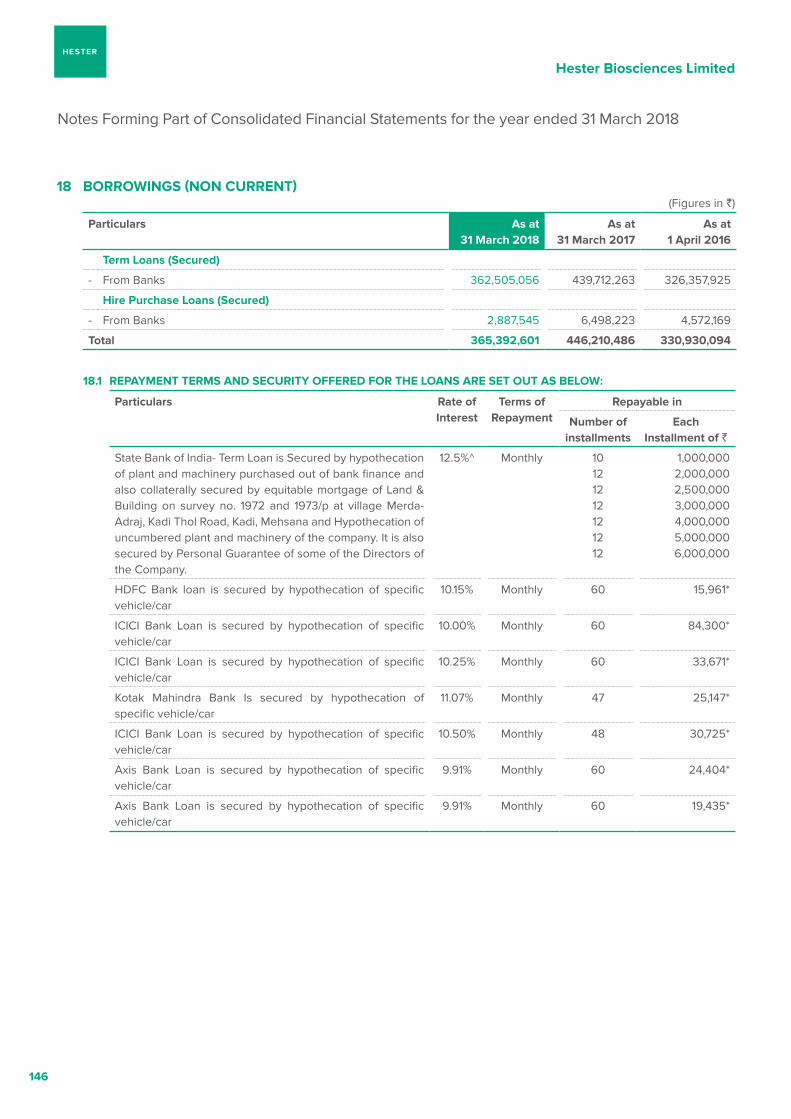
Hester Biosciences Limited
146
18 BORROWINgS (NON CuRRENT)(Figures in `)
particulars as at 31 March 2018
as at 31 March 2017
as at 1 april 2016
Term Loans (Secured)
- From Banks 362,505,056 439,712,263 326,357,925
Hire purchase Loans (Secured)
- From Banks 2,887,545 6,498,223 4,572,169
Total 365,392,601 446,210,486 330,930,094
18.1 REpayMENT TERMS aND SECuRITy OFFERED FOR THE LOaNS aRE SET OuT aS BELOW:
particulars Rate of Interest
Terms of Repayment
Repayable in
Number of installments
Each Installment of `
State Bank of India- Term Loan is Secured by hypothecation of plant and machinery purchased out of bank finance and also collaterally secured by equitable mortgage of Land & Building on survey no. 1972 and 1973/p at village Merda-Adraj, Kadi Thol Road, Kadi, Mehsana and Hypothecation of uncumbered plant and machinery of the company. It is also secured by Personal Guarantee of some of the Directors of the Company.
12.5%^ Monthly 10 12 12 12 12 12 12
1,000,000 2,000,000 2,500,000 3,000,000 4,000,000 5,000,000 6,000,000
HDFC Bank loan is secured by hypothecation of specific vehicle/car
10.15% Monthly 60 15,961*
ICICI Bank Loan is secured by hypothecation of specific vehicle/car
10.00% Monthly 60 84,300*
ICICI Bank Loan is secured by hypothecation of specific vehicle/car
10.25% Monthly 60 33,671*
Kotak Mahindra Bank Is secured by hypothecation of specific vehicle/car
11.07% Monthly 47 25,147*
ICICI Bank Loan is secured by hypothecation of specific vehicle/car
10.50% Monthly 48 30,725*
Axis Bank Loan is secured by hypothecation of specific vehicle/car
9.91% Monthly 60 24,404*
Axis Bank Loan is secured by hypothecation of specific vehicle/car
9.91% Monthly 60 19,435*
Notes Forming Part of Consolidated Financial Statements for the year ended 31 March 2018
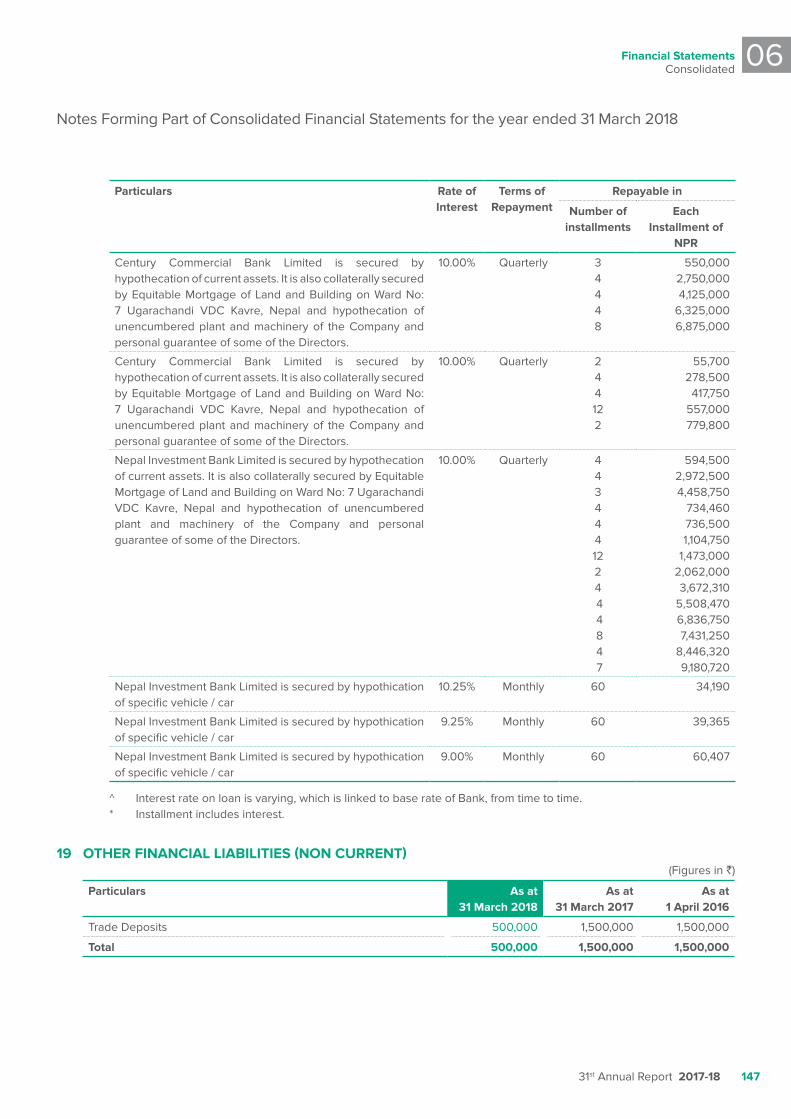
Financial StatementsConsolidated
06
31st Annual Report 2017-18 147
particulars Rate of Interest
Terms of Repayment
Repayable in
Number of installments
Each Installment of
NpR
Century Commercial Bank Limited is secured by hypothecation of current assets. It is also collaterally secured by Equitable Mortgage of Land and Building on Ward No: 7 Ugarachandi VDC Kavre, Nepal and hypothecation of unencumbered plant and machinery of the Company and personal guarantee of some of the Directors.
10.00% Quarterly 3 4 4 4 8
550,000 2,750,000 4,125,000
6,325,000 6,875,000
Century Commercial Bank Limited is secured by hypothecation of current assets. It is also collaterally secured by Equitable Mortgage of Land and Building on Ward No: 7 Ugarachandi VDC Kavre, Nepal and hypothecation of unencumbered plant and machinery of the Company and personal guarantee of some of the Directors.
10.00% Quarterly 2 4 4 12 2
55,700 278,500
417,750 557,000 779,800
Nepal Investment Bank Limited is secured by hypothecation of current assets. It is also collaterally secured by Equitable Mortgage of Land and Building on Ward No: 7 Ugarachandi VDC Kavre, Nepal and hypothecation of unencumbered plant and machinery of the Company and personal guarantee of some of the Directors.
10.00% Quarterly 4 4 34441224 4 4 8 4 7
594,500 2,972,500 4,458,750
734,460736,5001,104,750
1,473,0002,062,0003,672,310
5,508,4706,836,7507,431,250
8,446,3209,180,720
Nepal Investment Bank Limited is secured by hypothication of specific vehicle / car
10.25% Monthly 60 34,190
Nepal Investment Bank Limited is secured by hypothication of specific vehicle / car
9.25% Monthly 60 39,365
Nepal Investment Bank Limited is secured by hypothication of specific vehicle / car
9.00% Monthly 60 60,407
^ Interest rate on loan is varying, which is linked to base rate of Bank, from time to time. * Installment includes interest.
19 OTHER FINaNCIaL LIaBILITIES (NON CuRRENT)(Figures in `)
particulars as at 31 March 2018
as at 31 March 2017
as at 1 april 2016
Trade Deposits 500,000 1,500,000 1,500,000
Total 500,000 1,500,000 1,500,000
Notes Forming Part of Consolidated Financial Statements for the year ended 31 March 2018
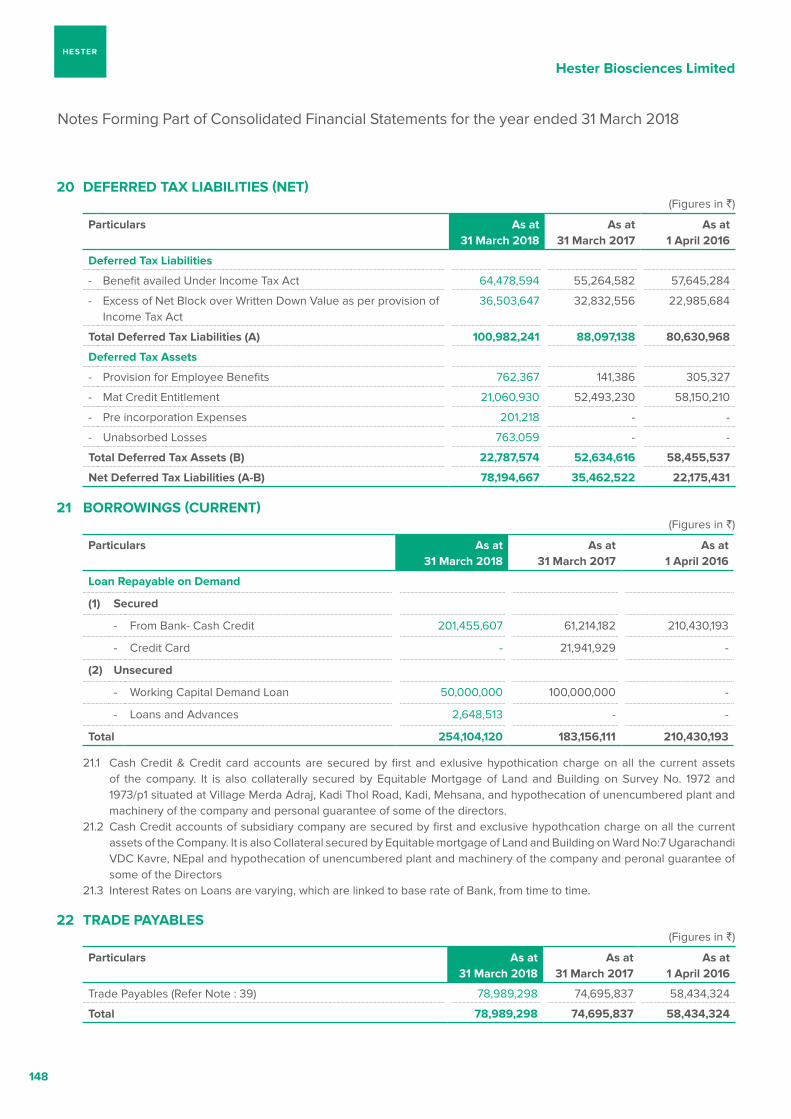
Hester Biosciences Limited
148
20 DEFERRED Tax LIaBILITIES (NET)(Figures in `)
particulars as at 31 March 2018
as at 31 March 2017
as at 1 april 2016
Deferred Tax Liabilities
- Benefit availed Under Income Tax Act 64,478,594 55,264,582 57,645,284
- Excess of Net Block over Written Down Value as per provision of Income Tax Act
36,503,647 32,832,556 22,985,684
Total Deferred Tax Liabilities (a) 100,982,241 88,097,138 80,630,968
Deferred Tax assets
- Provision for Employee Benefits 762,367 141,386 305,327
- Mat Credit Entitlement 21,060,930 52,493,230 58,150,210
- Pre incorporation Expenses 201,218 - -
- Unabsorbed Losses 763,059 - -
Total Deferred Tax assets (B) 22,787,574 52,634,616 58,455,537
Net Deferred Tax Liabilities (a-B) 78,194,667 35,462,522 22,175,431
21 BORROWINgS (CuRRENT) (Figures in `)
particulars as at 31 March 2018
as at 31 March 2017
as at 1 april 2016
Loan Repayable on Demand
(1) Secured
- From Bank- Cash Credit 201,455,607 61,214,182 210,430,193
- Credit Card - 21,941,929 -
(2) unsecured
- Working Capital Demand Loan 50,000,000 100,000,000 -
- Loans and Advances 2,648,513 - -
Total 254,104,120 183,156,111 210,430,193
21.1 Cash Credit & Credit card accounts are secured by first and exlusive hypothication charge on all the current assets of the company. It is also collaterally secured by Equitable Mortgage of Land and Building on Survey No. 1972 and 1973/p1 situated at Village Merda Adraj, Kadi Thol Road, Kadi, Mehsana, and hypothecation of unencumbered plant and machinery of the company and personal guarantee of some of the directors.
21.2 Cash Credit accounts of subsidiary company are secured by first and exclusive hypothcation charge on all the current assets of the Company. It is also Collateral secured by Equitable mortgage of Land and Building on Ward No:7 Ugarachandi VDC Kavre, NEpal and hypothecation of unencumbered plant and machinery of the company and peronal guarantee of some of the Directors
21.3 Interest Rates on Loans are varying, which are linked to base rate of Bank, from time to time.
22 TRaDE payaBLES(Figures in `)
particulars as at 31 March 2018
as at 31 March 2017
as at 1 april 2016
Trade Payables (Refer Note : 39) 78,989,298 74,695,837 58,434,324
Total 78,989,298 74,695,837 58,434,324
Notes Forming Part of Consolidated Financial Statements for the year ended 31 March 2018
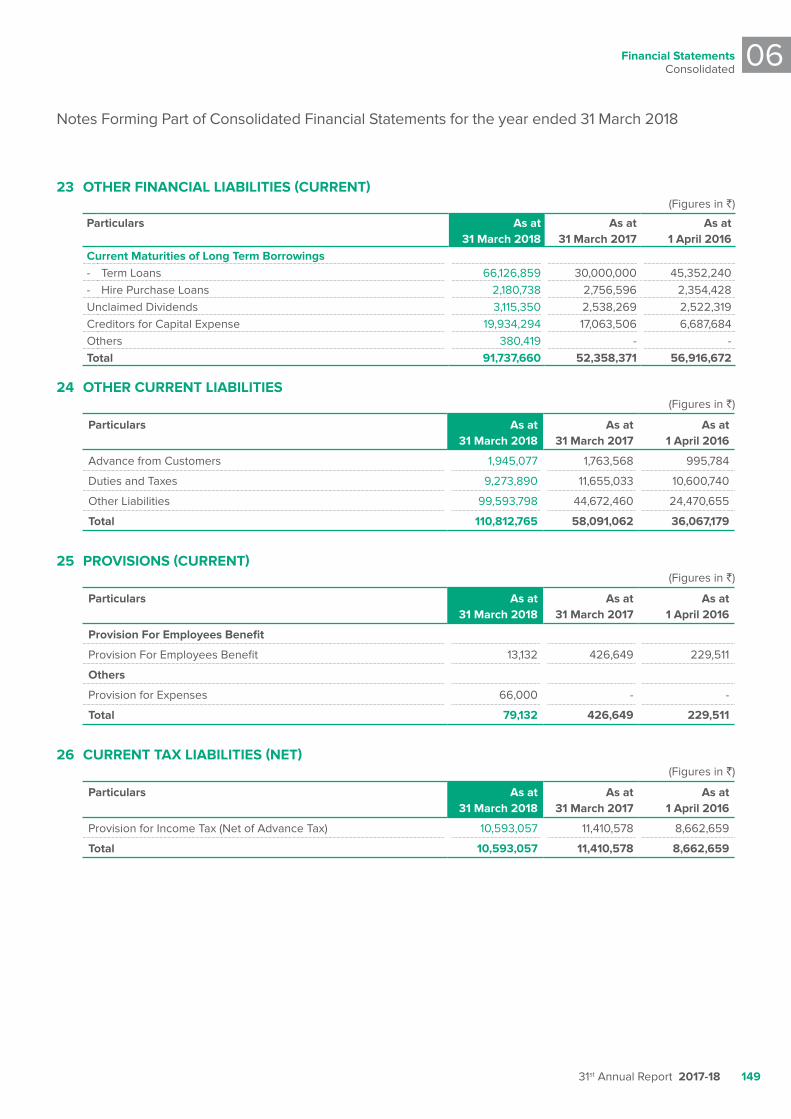
Financial StatementsConsolidated
06
31st Annual Report 2017-18 149
23 OTHER FINaNCIaL LIaBILITIES (CuRRENT)(Figures in `)
particulars as at 31 March 2018
as at 31 March 2017
as at 1 april 2016
Current Maturities of Long Term Borrowings- Term Loans 66,126,859 30,000,000 45,352,240 - Hire Purchase Loans 2,180,738 2,756,596 2,354,428 Unclaimed Dividends 3,115,350 2,538,269 2,522,319 Creditors for Capital Expense 19,934,294 17,063,506 6,687,684 Others 380,419 - - Total 91,737,660 52,358,371 56,916,672
24 OTHER CuRRENT LIaBILITIES(Figures in `)
particulars as at 31 March 2018
as at 31 March 2017
as at 1 april 2016
Advance from Customers 1,945,077 1,763,568 995,784
Duties and Taxes 9,273,890 11,655,033 10,600,740
Other Liabilities 99,593,798 44,672,460 24,470,655
Total 110,812,765 58,091,062 36,067,179
25 pROvISIONS (CuRRENT) (Figures in `)
particulars as at 31 March 2018
as at 31 March 2017
as at 1 april 2016
provision For Employees Benefit
Provision For Employees Benefit 13,132 426,649 229,511
Others
Provision for Expenses 66,000 - -
Total 79,132 426,649 229,511
26 CuRRENT Tax LIaBILITIES (NET)(Figures in `)
particulars as at 31 March 2018
as at 31 March 2017
as at 1 april 2016
Provision for Income Tax (Net of Advance Tax) 10,593,057 11,410,578 8,662,659
Total 10,593,057 11,410,578 8,662,659
Notes Forming Part of Consolidated Financial Statements for the year ended 31 March 2018
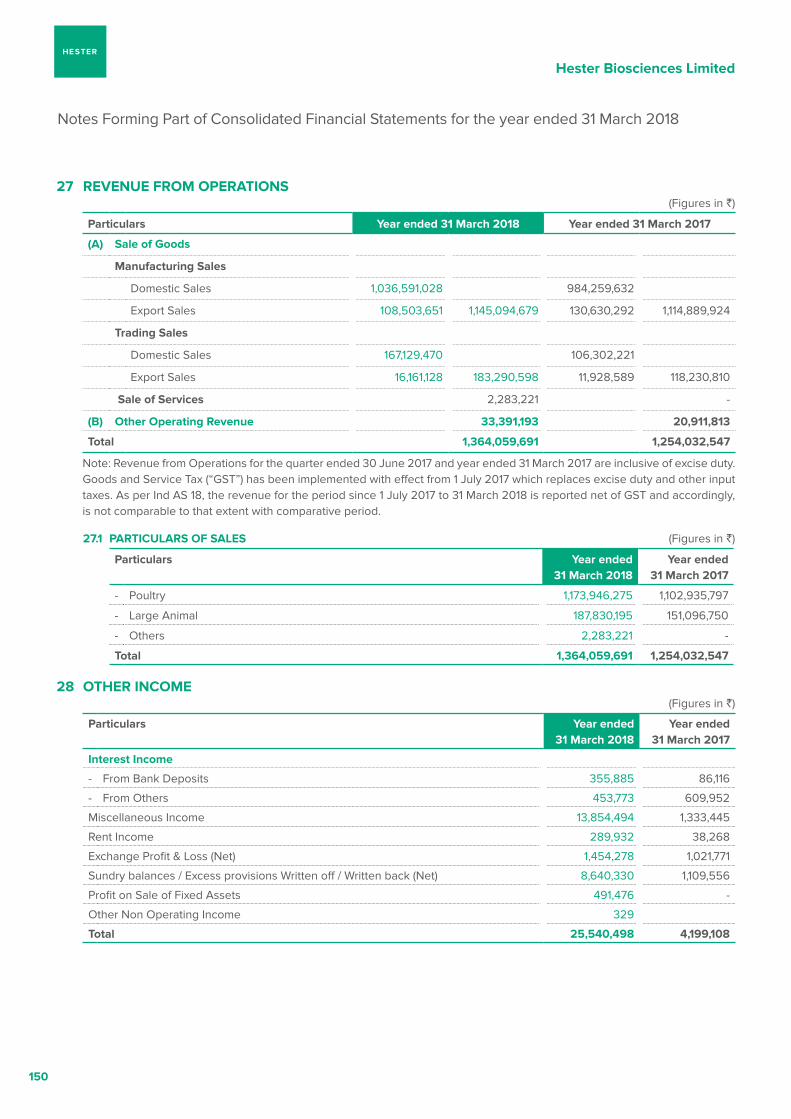
Hester Biosciences Limited
150
27 REvENuE FROM OpERaTIONS(Figures in `)
particulars year ended 31 March 2018 year ended 31 March 2017
(a) Sale of goods
Manufacturing Sales
Domestic Sales 1,036,591,028 984,259,632
Export Sales 108,503,651 1,145,094,679 130,630,292 1,114,889,924
Trading Sales
Domestic Sales 167,129,470 106,302,221
Export Sales 16,161,128 183,290,598 11,928,589 118,230,810
Sale of Services 2,283,221 -
(B) Other Operating Revenue 33,391,193 20,911,813
Total 1,364,059,691 1,254,032,547
Note: Revenue from Operations for the quarter ended 30 June 2017 and year ended 31 March 2017 are inclusive of excise duty. Goods and Service Tax (“GST”) has been implemented with effect from 1 July 2017 which replaces excise duty and other input taxes. As per Ind AS 18, the revenue for the period since 1 July 2017 to 31 March 2018 is reported net of GST and accordingly, is not comparable to that extent with comparative period.
27.1 paRTICuLaRS OF SaLES (Figures in `)
particulars year ended 31 March 2018
year ended 31 March 2017
- Poultry 1,173,946,275 1,102,935,797
- Large Animal 187,830,195 151,096,750
- Others 2,283,221 -
Total 1,364,059,691 1,254,032,547
28 OTHER INCOME(Figures in `)
particulars year ended 31 March 2018
year ended 31 March 2017
Interest Income
- From Bank Deposits 355,885 86,116
- From Others 453,773 609,952
Miscellaneous Income 13,854,494 1,333,445
Rent Income 289,932 38,268
Exchange Profit & Loss (Net) 1,454,278 1,021,771
Sundry balances / Excess provisions Written off / Written back (Net) 8,640,330 1,109,556
Profit on Sale of Fixed Assets 491,476 -
Other Non Operating Income 329
Total 25,540,498 4,199,108
Notes Forming Part of Consolidated Financial Statements for the year ended 31 March 2018
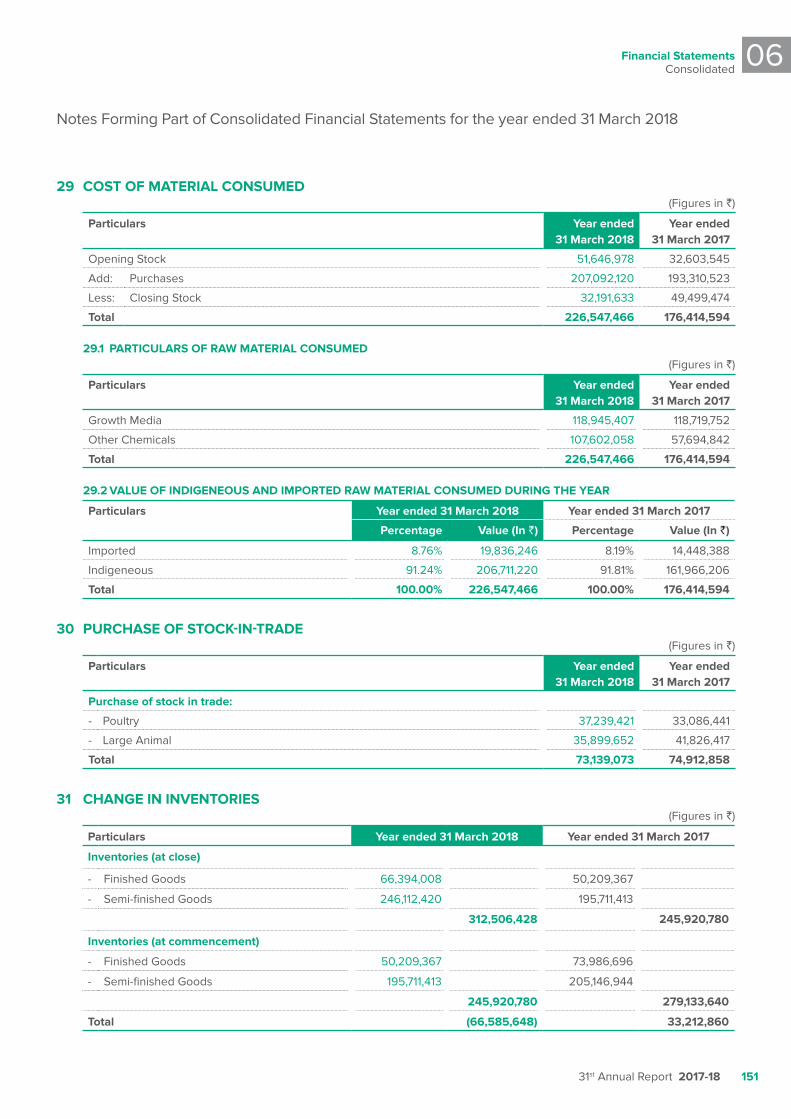
Financial StatementsConsolidated
06
31st Annual Report 2017-18 151
29 COST OF MaTERIaL CONSuMED(Figures in `)
particulars year ended 31 March 2018
year ended 31 March 2017
Opening Stock 51,646,978 32,603,545
Add: Purchases 207,092,120 193,310,523
Less: Closing Stock 32,191,633 49,499,474
Total 226,547,466 176,414,594
29.1 paRTICuLaRS OF RaW MaTERIaL CONSuMED(Figures in `)
particulars year ended 31 March 2018
year ended 31 March 2017
Growth Media 118,945,407 118,719,752
Other Chemicals 107,602,058 57,694,842
Total 226,547,466 176,414,594
29.2 vaLuE OF INDIgENEOuS aND IMpORTED RaW MaTERIaL CONSuMED DuRINg THE yEaR
particulars year ended 31 March 2018 year ended 31 March 2017
percentage value (In `) percentage value (In `)
Imported 8.76% 19,836,246 8.19% 14,448,388
Indigeneous 91.24% 206,711,220 91.81% 161,966,206
Total 100.00% 226,547,466 100.00% 176,414,594
30 puRCHaSE OF STOCk-IN-TRaDE(Figures in `)
particulars year ended 31 March 2018
year ended 31 March 2017
purchase of stock in trade:
- Poultry 37,239,421 33,086,441
- Large Animal 35,899,652 41,826,417
Total 73,139,073 74,912,858
31 CHaNgE IN INvENTORIES(Figures in `)
particulars year ended 31 March 2018 year ended 31 March 2017
Inventories (at close)
- Finished Goods 66,394,008 50,209,367
- Semi-finished Goods 246,112,420 195,711,413
312,506,428 245,920,780
Inventories (at commencement)
- Finished Goods 50,209,367 73,986,696
- Semi-finished Goods 195,711,413 205,146,944
245,920,780 279,133,640
Total (66,585,648) 33,212,860
Notes Forming Part of Consolidated Financial Statements for the year ended 31 March 2018
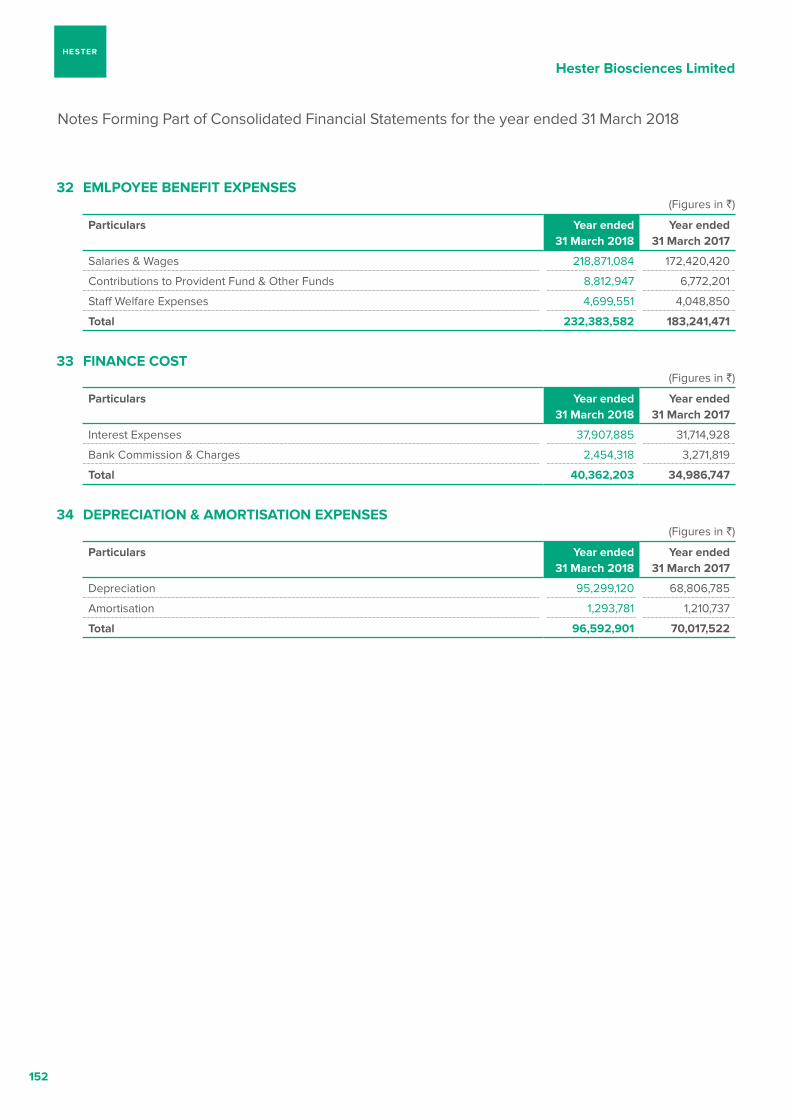
Hester Biosciences Limited
152
32 EMLpOyEE BENEFIT ExpENSES(Figures in `)
particulars year ended 31 March 2018
year ended 31 March 2017
Salaries & Wages 218,871,084 172,420,420
Contributions to Provident Fund & Other Funds 8,812,947 6,772,201
Staff Welfare Expenses 4,699,551 4,048,850
Total 232,383,582 183,241,471
33 FINaNCE COST(Figures in `)
particulars year ended 31 March 2018
year ended 31 March 2017
Interest Expenses 37,907,885 31,714,928
Bank Commission & Charges 2,454,318 3,271,819
Total 40,362,203 34,986,747
34 DEpRECIaTION & aMORTISaTION ExpENSES(Figures in `)
particulars year ended 31 March 2018
year ended 31 March 2017
Depreciation 95,299,120 68,806,785
Amortisation 1,293,781 1,210,737
Total 96,592,901 70,017,522
Notes Forming Part of Consolidated Financial Statements for the year ended 31 March 2018
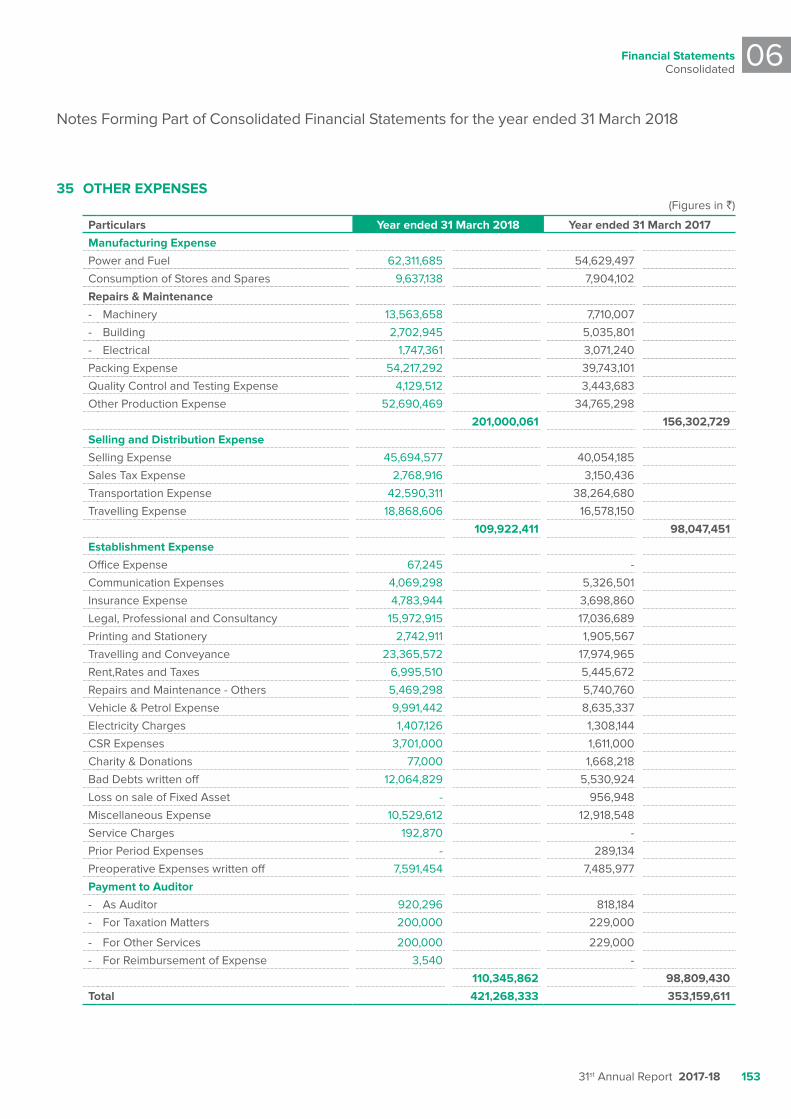
Financial StatementsConsolidated
06
31st Annual Report 2017-18 153
35 OTHER ExpENSES(Figures in `)
particulars year ended 31 March 2018 year ended 31 March 2017Manufacturing ExpensePower and Fuel 62,311,685 54,629,497
Consumption of Stores and Spares 9,637,138 7,904,102
Repairs & Maintenance- Machinery 13,563,658 7,710,007
- Building 2,702,945 5,035,801
- Electrical 1,747,361 3,071,240
Packing Expense 54,217,292 39,743,101
Quality Control and Testing Expense 4,129,512 3,443,683
Other Production Expense 52,690,469 34,765,298
201,000,061 156,302,729 Selling and Distribution ExpenseSelling Expense 45,694,577 40,054,185
Sales Tax Expense 2,768,916 3,150,436
Transportation Expense 42,590,311 38,264,680
Travelling Expense 18,868,606 16,578,150
109,922,411 98,047,451 Establishment ExpenseOffice Expense 67,245 -
Communication Expenses 4,069,298 5,326,501
Insurance Expense 4,783,944 3,698,860
Legal, Professional and Consultancy 15,972,915 17,036,689
Printing and Stationery 2,742,911 1,905,567
Travelling and Conveyance 23,365,572 17,974,965
Rent,Rates and Taxes 6,995,510 5,445,672
Repairs and Maintenance - Others 5,469,298 5,740,760
Vehicle & Petrol Expense 9,991,442 8,635,337
Electricity Charges 1,407,126 1,308,144
CSR Expenses 3,701,000 1,611,000
Charity & Donations 77,000 1,668,218
Bad Debts written off 12,064,829 5,530,924
Loss on sale of Fixed Asset - 956,948
Miscellaneous Expense 10,529,612 12,918,548
Service Charges 192,870 -
Prior Period Expenses - 289,134
Preoperative Expenses written off 7,591,454 7,485,977
payment to auditor- As Auditor 920,296 818,184
- For Taxation Matters 200,000 229,000
- For Other Services 200,000 229,000
- For Reimbursement of Expense 3,540 -
110,345,862 98,809,430 Total 421,268,333 353,159,611
Notes Forming Part of Consolidated Financial Statements for the year ended 31 March 2018
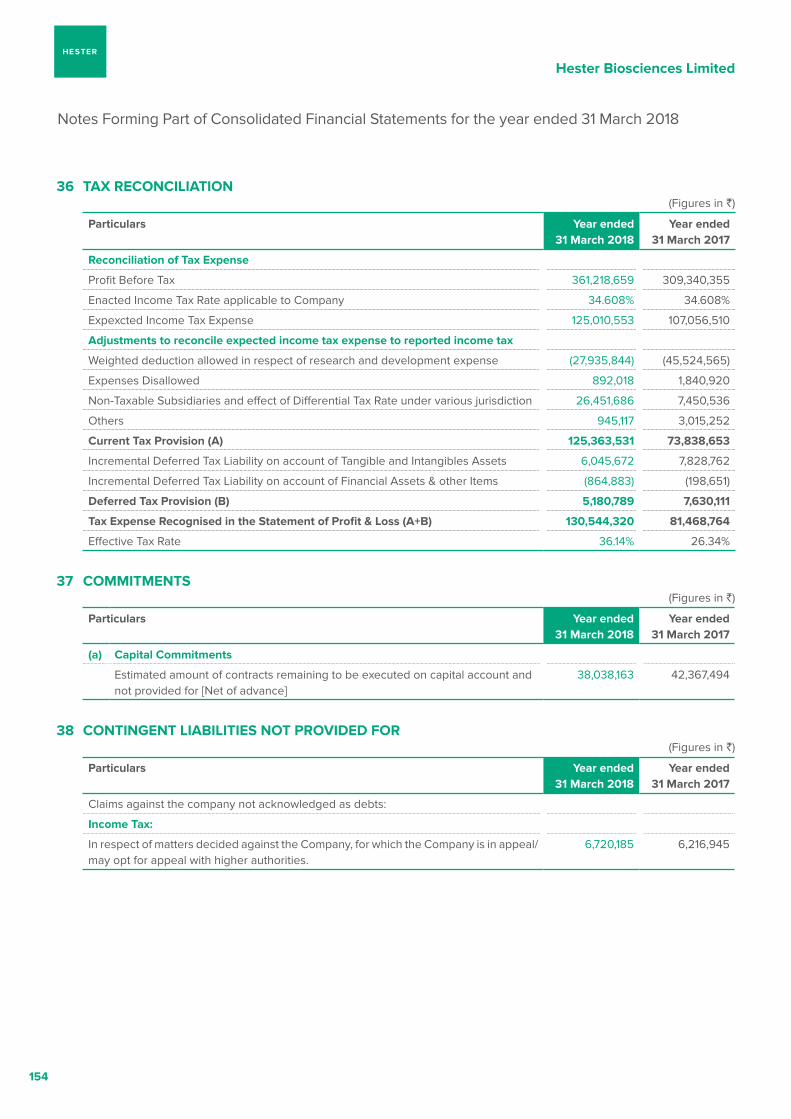
Hester Biosciences Limited
154
36 Tax RECONCILIaTION(Figures in `)
particulars year ended 31 March 2018
year ended 31 March 2017
Reconciliation of Tax Expense
Profit Before Tax 361,218,659 309,340,355
Enacted Income Tax Rate applicable to Company 34.608% 34.608%
Expexcted Income Tax Expense 125,010,553 107,056,510
adjustments to reconcile expected income tax expense to reported income tax
Weighted deduction allowed in respect of research and development expense (27,935,844) (45,524,565)
Expenses Disallowed 892,018 1,840,920
Non-Taxable Subsidiaries and effect of Differential Tax Rate under various jurisdiction 26,451,686 7,450,536
Others 945,117 3,015,252
Current Tax provision (a) 125,363,531 73,838,653
Incremental Deferred Tax Liability on account of Tangible and Intangibles Assets 6,045,672 7,828,762
Incremental Deferred Tax Liability on account of Financial Assets & other Items (864,883) (198,651)
Deferred Tax provision (B) 5,180,789 7,630,111
Tax Expense Recognised in the Statement of profit & Loss (a+B) 130,544,320 81,468,764
Effective Tax Rate 36.14% 26.34%
37 COMMITMENTS(Figures in `)
particulars year ended 31 March 2018
year ended 31 March 2017
(a) Capital Commitments
Estimated amount of contracts remaining to be executed on capital account and not provided for [Net of advance]
38,038,163 42,367,494
38 CONTINgENT LIaBILITIES NOT pROvIDED FOR(Figures in `)
particulars year ended 31 March 2018
year ended 31 March 2017
Claims against the company not acknowledged as debts:
Income Tax:
In respect of matters decided against the Company, for which the Company is in appeal/may opt for appeal with higher authorities.
6,720,185 6,216,945
Notes Forming Part of Consolidated Financial Statements for the year ended 31 March 2018
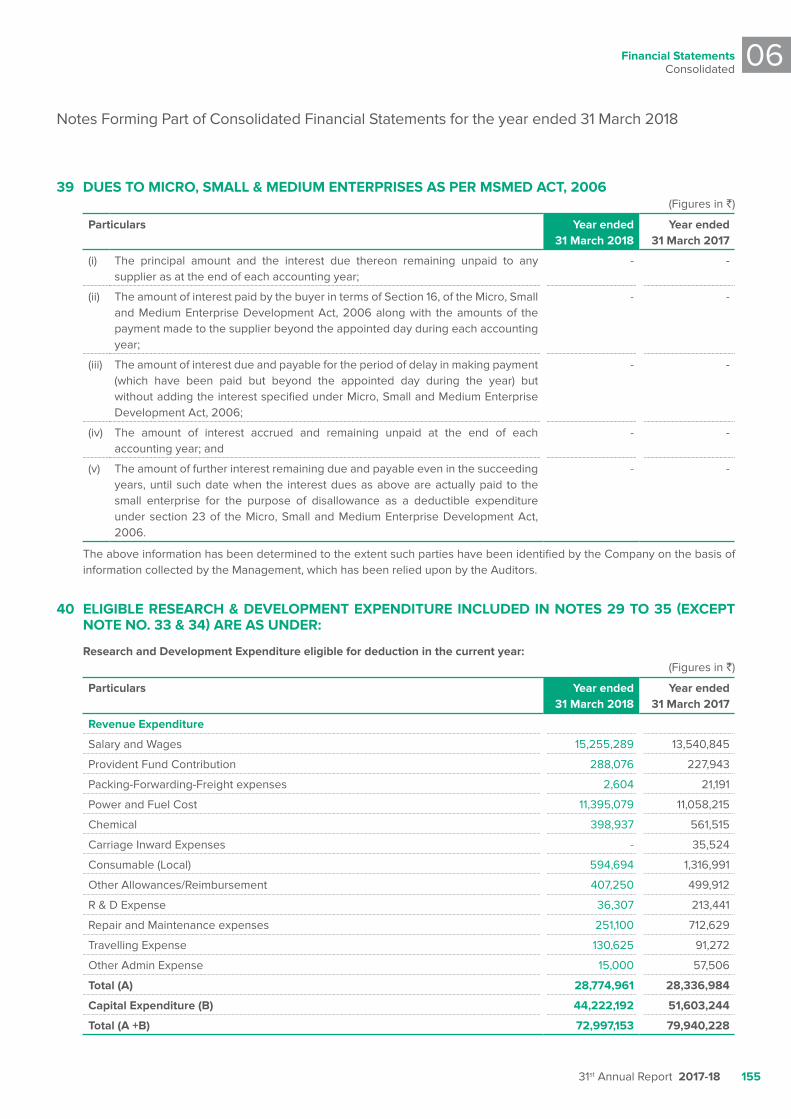
Financial StatementsConsolidated
06
31st Annual Report 2017-18 155
39 DuES TO MICRO, SMaLL & MEDIuM ENTERpRISES aS pER MSMED aCT, 2006(Figures in `)
particulars year ended 31 March 2018
year ended 31 March 2017
(i) The principal amount and the interest due thereon remaining unpaid to any supplier as at the end of each accounting year;
- -
(ii) The amount of interest paid by the buyer in terms of Section 16, of the Micro, Small and Medium Enterprise Development Act, 2006 along with the amounts of the payment made to the supplier beyond the appointed day during each accounting year;
- -
(iii) The amount of interest due and payable for the period of delay in making payment (which have been paid but beyond the appointed day during the year) but without adding the interest specified under Micro, Small and Medium Enterprise Development Act, 2006;
- -
(iv) The amount of interest accrued and remaining unpaid at the end of each accounting year; and
- -
(v) The amount of further interest remaining due and payable even in the succeeding years, until such date when the interest dues as above are actually paid to the small enterprise for the purpose of disallowance as a deductible expenditure under section 23 of the Micro, Small and Medium Enterprise Development Act, 2006.
- -
The above information has been determined to the extent such parties have been identified by the Company on the basis of information collected by the Management, which has been relied upon by the Auditors.
40 ELIgIBLE RESEaRCH & DEvELOpMENT ExpENDITuRE INCLuDED IN NOTES 29 TO 35 (ExCEpT NOTE NO. 33 & 34) aRE aS uNDER:
Research and Development Expenditure eligible for deduction in the current year:(Figures in `)
particulars year ended 31 March 2018
year ended 31 March 2017
Revenue Expenditure
Salary and Wages 15,255,289 13,540,845
Provident Fund Contribution 288,076 227,943
Packing-Forwarding-Freight expenses 2,604 21,191
Power and Fuel Cost 11,395,079 11,058,215
Chemical 398,937 561,515
Carriage Inward Expenses - 35,524
Consumable (Local) 594,694 1,316,991
Other Allowances/Reimbursement 407,250 499,912
R & D Expense 36,307 213,441
Repair and Maintenance expenses 251,100 712,629
Travelling Expense 130,625 91,272
Other Admin Expense 15,000 57,506
Total (a) 28,774,961 28,336,984
Capital Expenditure (B) 44,222,192 51,603,244
Total (a +B) 72,997,153 79,940,228
Notes Forming Part of Consolidated Financial Statements for the year ended 31 March 2018
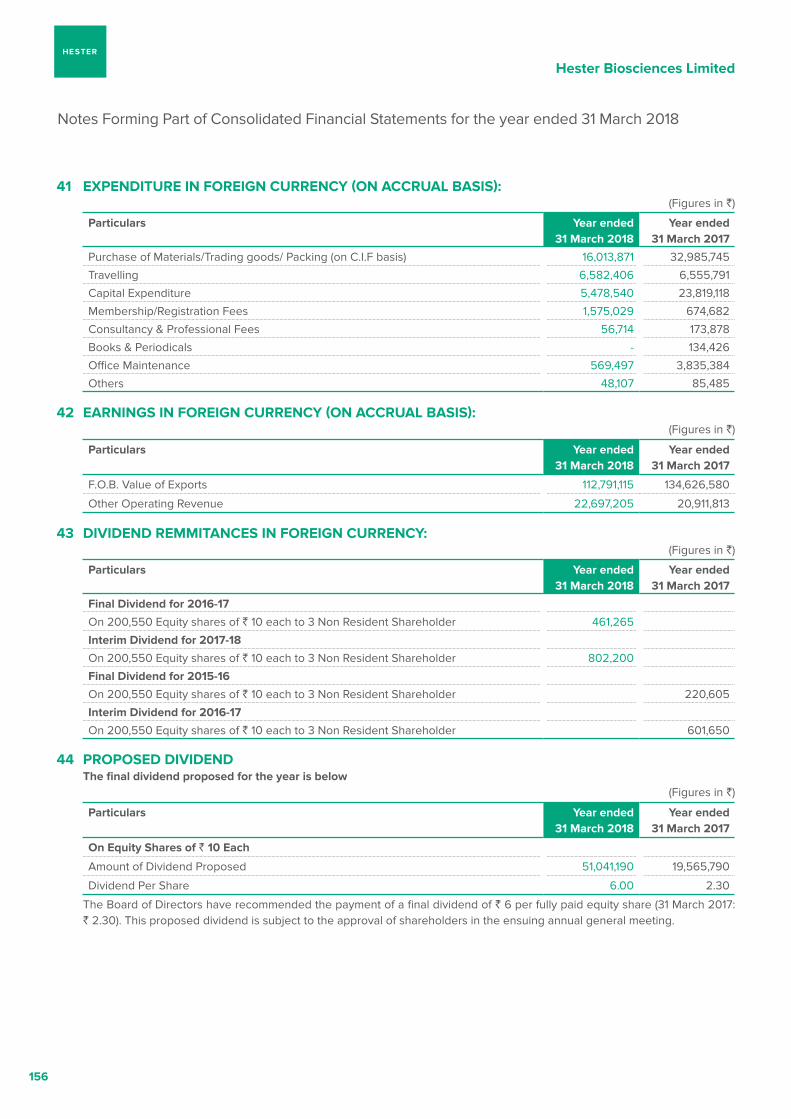
Hester Biosciences Limited
156
41 ExpENDITuRE IN FOREIgN CuRRENCy (ON aCCRuaL BaSIS):(Figures in `)
particulars year ended 31 March 2018
year ended 31 March 2017
Purchase of Materials/Trading goods/ Packing (on C.I.F basis) 16,013,871 32,985,745
Travelling 6,582,406 6,555,791
Capital Expenditure 5,478,540 23,819,118
Membership/Registration Fees 1,575,029 674,682
Consultancy & Professional Fees 56,714 173,878
Books & Periodicals - 134,426
Office Maintenance 569,497 3,835,384
Others 48,107 85,485
42 EaRNINgS IN FOREIgN CuRRENCy (ON aCCRuaL BaSIS):(Figures in `)
particulars year ended 31 March 2018
year ended 31 March 2017
F.O.B. Value of Exports 112,791,115 134,626,580
Other Operating Revenue 22,697,205 20,911,813
43 DIvIDEND REMMITaNCES IN FOREIgN CuRRENCy:(Figures in `)
particulars year ended 31 March 2018
year ended 31 March 2017
Final Dividend for 2016-17
On 200,550 Equity shares of ` 10 each to 3 Non Resident Shareholder 461,265
Interim Dividend for 2017-18
On 200,550 Equity shares of ` 10 each to 3 Non Resident Shareholder 802,200
Final Dividend for 2015-16
On 200,550 Equity shares of ` 10 each to 3 Non Resident Shareholder 220,605
Interim Dividend for 2016-17
On 200,550 Equity shares of ` 10 each to 3 Non Resident Shareholder 601,650
44 pROpOSED DIvIDEND The final dividend proposed for the year is below
(Figures in `)
particulars year ended 31 March 2018
year ended 31 March 2017
On Equity Shares of ` 10 Each
Amount of Dividend Proposed 51,041,190 19,565,790
Dividend Per Share 6.00 2.30
The Board of Directors have recommended the payment of a final dividend of ` 6 per fully paid equity share (31 March 2017: ` 2.30). This proposed dividend is subject to the approval of shareholders in the ensuing annual general meeting.
Notes Forming Part of Consolidated Financial Statements for the year ended 31 March 2018
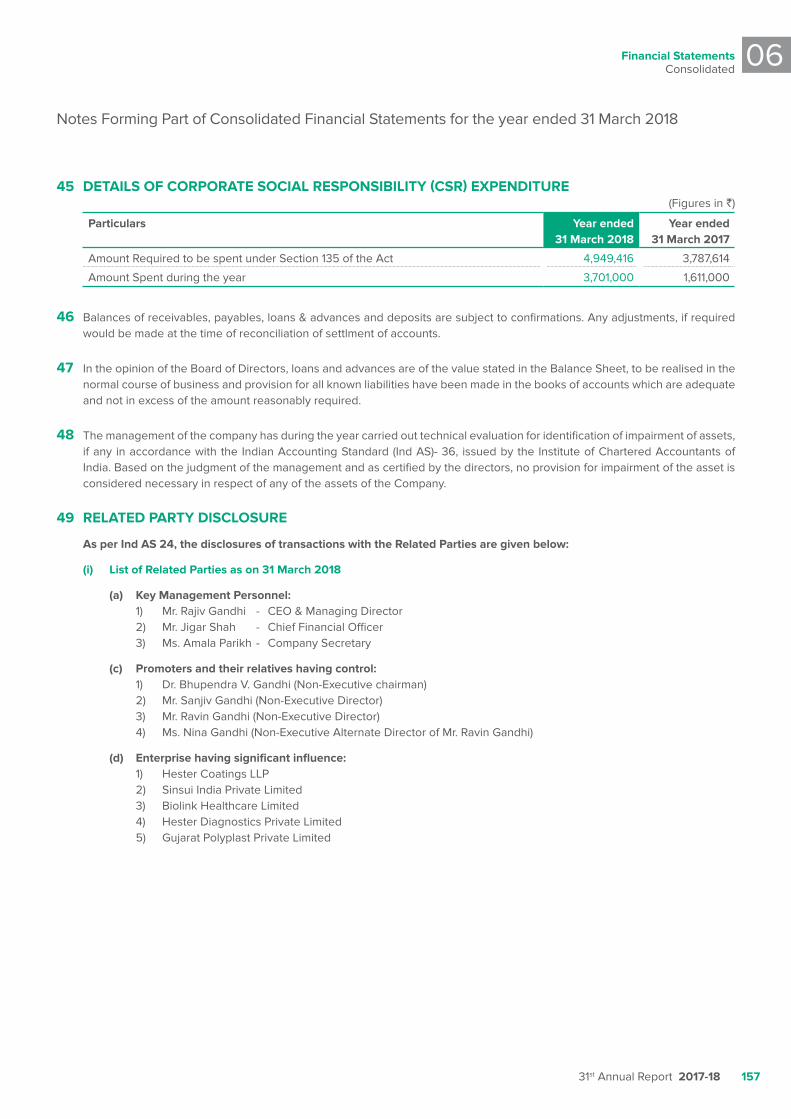
Financial StatementsConsolidated
06
31st Annual Report 2017-18 157
45 DETaILS OF CORpORaTE SOCIaL RESpONSIBILITy (CSR) ExpENDITuRE(Figures in `)
particulars year ended 31 March 2018
year ended 31 March 2017
Amount Required to be spent under Section 135 of the Act 4,949,416 3,787,614
Amount Spent during the year 3,701,000 1,611,000
46 Balances of receivables, payables, loans & advances and deposits are subject to confirmations. Any adjustments, if required would be made at the time of reconciliation of settlment of accounts.
47 In the opinion of the Board of Directors, loans and advances are of the value stated in the Balance Sheet, to be realised in the normal course of business and provision for all known liabilities have been made in the books of accounts which are adequate and not in excess of the amount reasonably required.
48 The management of the company has during the year carried out technical evaluation for identification of impairment of assets, if any in accordance with the Indian Accounting Standard (Ind AS)- 36, issued by the Institute of Chartered Accountants of India. Based on the judgment of the management and as certified by the directors, no provision for impairment of the asset is considered necessary in respect of any of the assets of the Company.
49 RELaTED paRTy DISCLOSuRE
as per Ind aS 24, the disclosures of transactions with the Related parties are given below:
(i) List of Related parties as on 31 March 2018
(a) key Management personnel: 1) Mr. Rajiv Gandhi - CEO & Managing Director 2) Mr. Jigar Shah - Chief Financial Officer 3) Ms. Amala Parikh - Company Secretary
(c) promoters and their relatives having control: 1) Dr. Bhupendra V. Gandhi (Non-Executive chairman) 2) Mr. Sanjiv Gandhi (Non-Executive Director) 3) Mr. Ravin Gandhi (Non-Executive Director) 4) Ms. Nina Gandhi (Non-Executive Alternate Director of Mr. Ravin Gandhi)
(d) Enterprise having significant influence: 1) Hester Coatings LLP 2) Sinsui India Private Limited 3) Biolink Healthcare Limited 4) Hester Diagnostics Private Limited 5) Gujarat Polyplast Private Limited
Notes Forming Part of Consolidated Financial Statements for the year ended 31 March 2018
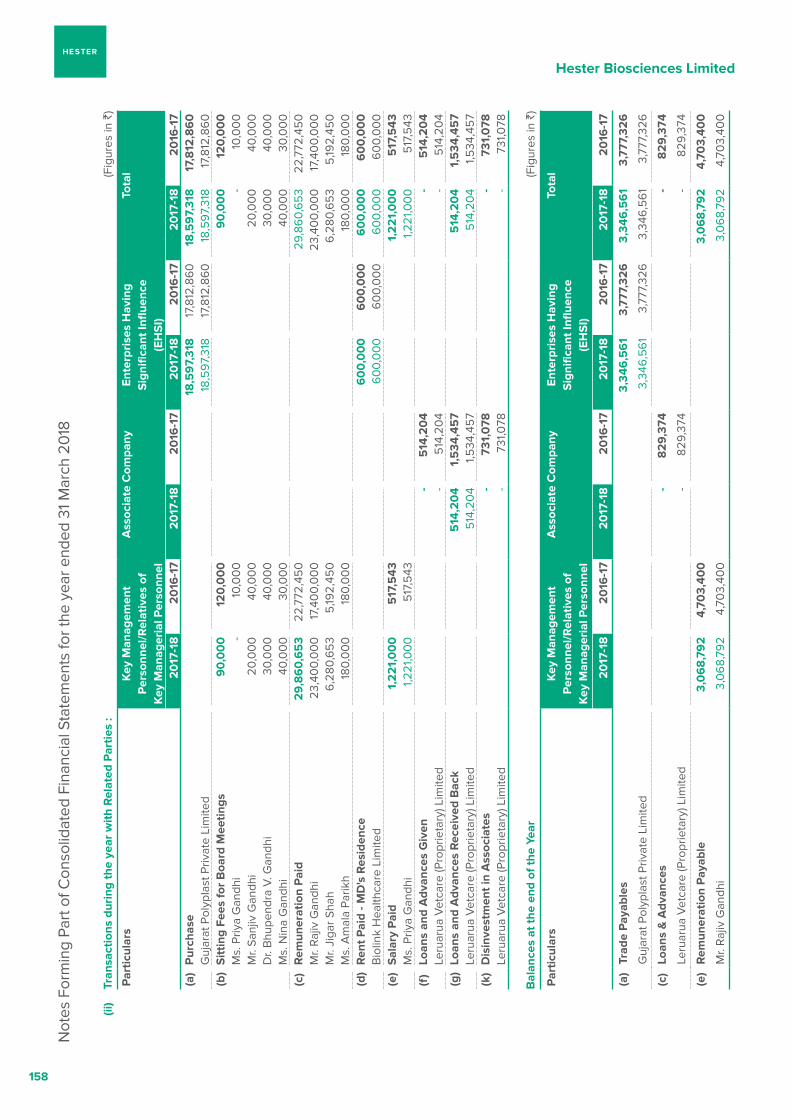
Hester Biosciences Limited
158
(ii
) Tr
ansa
ctio
ns d
urin
g th
e ye
ar w
ith R
elat
ed p
artie
s :
(Fig
ures
in `
)
par
ticul
ars
key
Man
agem
ent
per
sonn
el/R
elat
ives
of
key
Man
ager
ial p
erso
nnel
ass
ocia
te C
ompa
nyEn
terp
rise
s H
avin
g S
igni
fican
t Infl
uenc
e (E
HS
I)
Tota
l
20
17-1
82
016
-17
20
17-1
82
016
-17
20
17-1
82
016
-17
20
17-1
82
016
-17
(a)
pur
chas
e 1
8,5
97,
318
1
7,81
2,86
0
18
,59
7,31
8
17,
812
,86
0
Guj
arat
Pol
ypla
st P
rivat
e Li
mite
d 1
8,5
97,
318
17,
812,
860
1
8,5
97,
318
17,
812,
860
(b
)S
ittin
g Fe
es fo
r B
oard
Mee
tings
90
,00
0
12
0,0
00
9
0,0
00
1
20
,00
0
Ms.
Priy
a G
andh
i -
10,
00
0
- 1
0,0
00
M
r. Sa
njiv
Gan
dhi
20,
00
0
40,
00
0
20,
00
0
40,
00
0
Dr.
Bhu
pend
ra V
. Gan
dhi
30,
00
0
40,
00
0
30,
00
0
40,
00
0
Ms.
Nin
a G
andh
i 4
0,0
00
3
0,0
00
4
0,0
00
3
0,0
00
(c
)R
emun
erat
ion
pai
d 2
9,8
60
,65
3 2
2,77
2,45
0
29,
860,
65
3 2
2,77
2,45
0
Mr.
Rajiv
Gan
dhi
23,
400,
00
0
17,
400,
00
0
23,
400,
00
0
17,
400,
00
0
Mr.
Jiga
r Sha
h 6
,280
,65
3 5
,192,
450
6
,280
,65
3 5
,192,
450
M
s. A
mal
a Pa
rikh
180
,00
0
180
,00
0
180
,00
0
180
,00
0
(d)
Ren
t pai
d - M
D's
Res
iden
ce 6
00
,00
0
60
0,0
00
6
00
,00
0
60
0,0
00
B
iolin
k H
ealth
care
Lim
ited
60
0,0
00
6
00,
00
0
60
0,0
00
6
00,
00
0
(e)
Sal
ary
pai
d 1
,22
1,0
00
5
17,5
43
1,2
21,
00
0
517
,543
M
s. P
riya
Gan
dhi
1,2
21,0
00
5
17,5
43
1,2
21,0
00
5
17,5
43
(f)
Loan
s an
d a
dvan
ces
giv
en -
514
,20
4 -
514
,20
4 Le
ruar
ua V
etca
re (P
ropr
ieta
ry) L
imite
d -
514
,20
4 -
514
,20
4 (g
)Lo
ans
and
adv
ance
s R
ecei
ved
Bac
k 5
14,2
04
1,5
34,4
57
514
,20
4 1
,534
,45
7 Le
ruar
ua V
etca
re (P
ropr
ieta
ry) L
imite
d 5
14,2
04
1,5
34,4
57
514
,20
4 1
,534
,45
7 (k
)D
isin
vest
men
t in
ass
ocia
tes
- 7
31,0
78
- 7
31,0
78
Leru
arua
Vet
care
(Pro
prie
tary
) Lim
ited
- 7
31,0
78
- 7
31,0
78
Bal
ance
s at
the
end
of th
e ye
ar
(Fig
ures
in `
)
par
ticul
ars
key
Man
agem
ent
per
sonn
el/R
elat
ives
of
key
Man
ager
ial p
erso
nnel
ass
ocia
te C
ompa
nyEn
terp
rise
s H
avin
g S
igni
fican
t Infl
uenc
e (E
HS
I)
Tota
l
20
17-1
82
016
-17
20
17-1
82
016
-17
20
17-1
82
016
-17
20
17-1
82
016
-17
(a)
Trad
e p
ayab
les
3,3
46,5
61
3,7
77,3
26
3
,346
,56
1 3
,777
,32
6
Guj
arat
Pol
ypla
st P
rivat
e Li
mite
d 3
,346
,56
1 3
,777
,326
3
,346
,56
1 3
,777
,326
(c)
Loan
s &
adv
ance
s -
82
9,37
4 -
82
9,37
4
Leru
arua
Vet
care
(Pro
prie
tary
) Lim
ited
- 8
29,3
74
- 8
29,3
74
(e)
Rem
uner
atio
n p
ayab
le 3
,06
8,7
92
4
,70
3,40
0
3,0
68
,79
2
4,7
03,
400
Mr.
Rajiv
Gan
dhi
3,0
68,
792
4,7
03,
400
3
,06
8,79
2 4
,70
3,40
0
Not
es F
orm
ing
Part
of C
onso
lidat
ed F
inan
cial
Sta
tem
ents
for t
he y
ear e
nded
31 M
arch
20
18
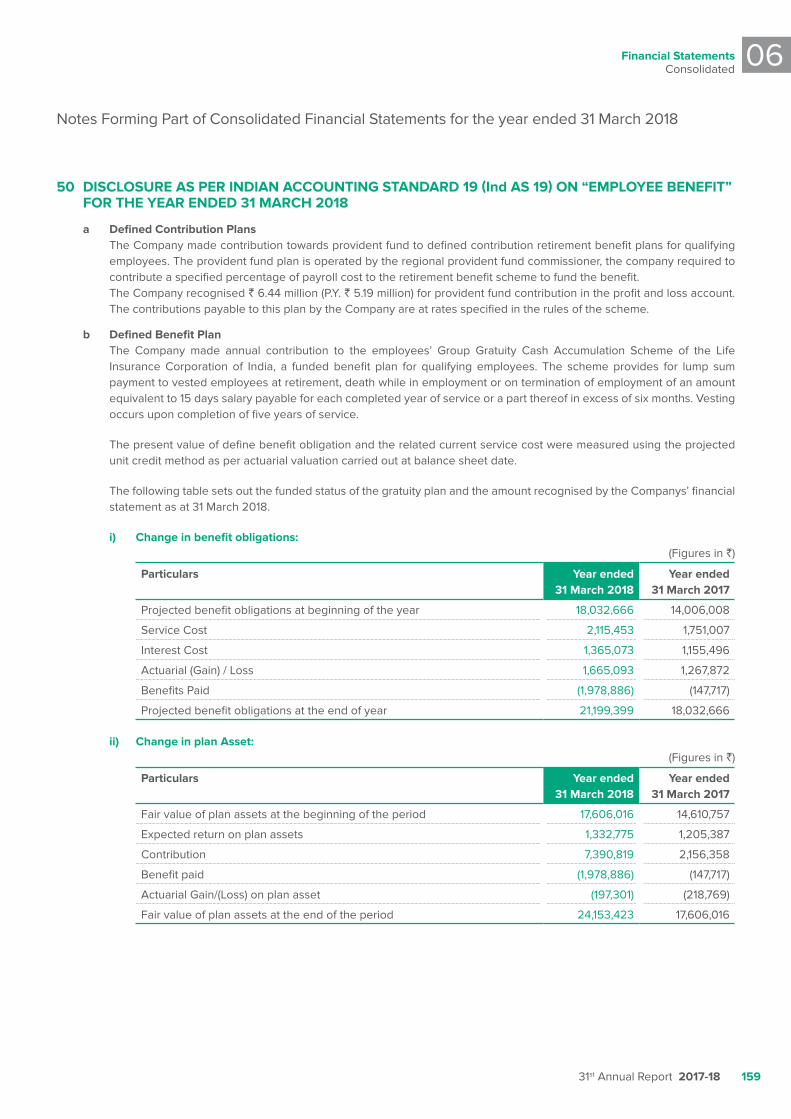
Financial StatementsConsolidated
06
31st Annual Report 2017-18 159
50 DISCLOSuRE aS pER INDIaN aCCOuNTINg STaNDaRD 19 (Ind aS 19) ON “EMpLOyEE BENEFIT” FOR THE yEaR ENDED 31 MaRCH 2018
a Defined Contribution plans The Company made contribution towards provident fund to defined contribution retirement benefit plans for qualifying
employees. The provident fund plan is operated by the regional provident fund commissioner, the company required to contribute a specified percentage of payroll cost to the retirement benefit scheme to fund the benefit.
The Company recognised ` 6.44 million (P.Y. ` 5.19 million) for provident fund contribution in the profit and loss account. The contributions payable to this plan by the Company are at rates specified in the rules of the scheme.
b Defined Benefit plan The Company made annual contribution to the employees’ Group Gratuity Cash Accumulation Scheme of the Life
Insurance Corporation of India, a funded benefit plan for qualifying employees. The scheme provides for lump sum payment to vested employees at retirement, death while in employment or on termination of employment of an amount equivalent to 15 days salary payable for each completed year of service or a part thereof in excess of six months. Vesting occurs upon completion of five years of service.
The present value of define benefit obligation and the related current service cost were measured using the projected unit credit method as per actuarial valuation carried out at balance sheet date.
The following table sets out the funded status of the gratuity plan and the amount recognised by the Companys’ financial statement as at 31 March 2018.
i) Change in benefit obligations: (Figures in `)
particulars year ended 31 March 2018
year ended 31 March 2017
Projected benefit obligations at beginning of the year 18,032,666 14,006,008
Service Cost 2,115,453 1,751,007
Interest Cost 1,365,073 1,155,496
Actuarial (Gain) / Loss 1,665,093 1,267,872
Benefits Paid (1,978,886) (147,717)
Projected benefit obligations at the end of year 21,199,399 18,032,666
ii) Change in plan asset:(Figures in `)
particulars year ended 31 March 2018
year ended 31 March 2017
Fair value of plan assets at the beginning of the period 17,606,016 14,610,757
Expected return on plan assets 1,332,775 1,205,387
Contribution 7,390,819 2,156,358
Benefit paid (1,978,886) (147,717)
Actuarial Gain/(Loss) on plan asset (197,301) (218,769)
Fair value of plan assets at the end of the period 24,153,423 17,606,016
Notes Forming Part of Consolidated Financial Statements for the year ended 31 March 2018
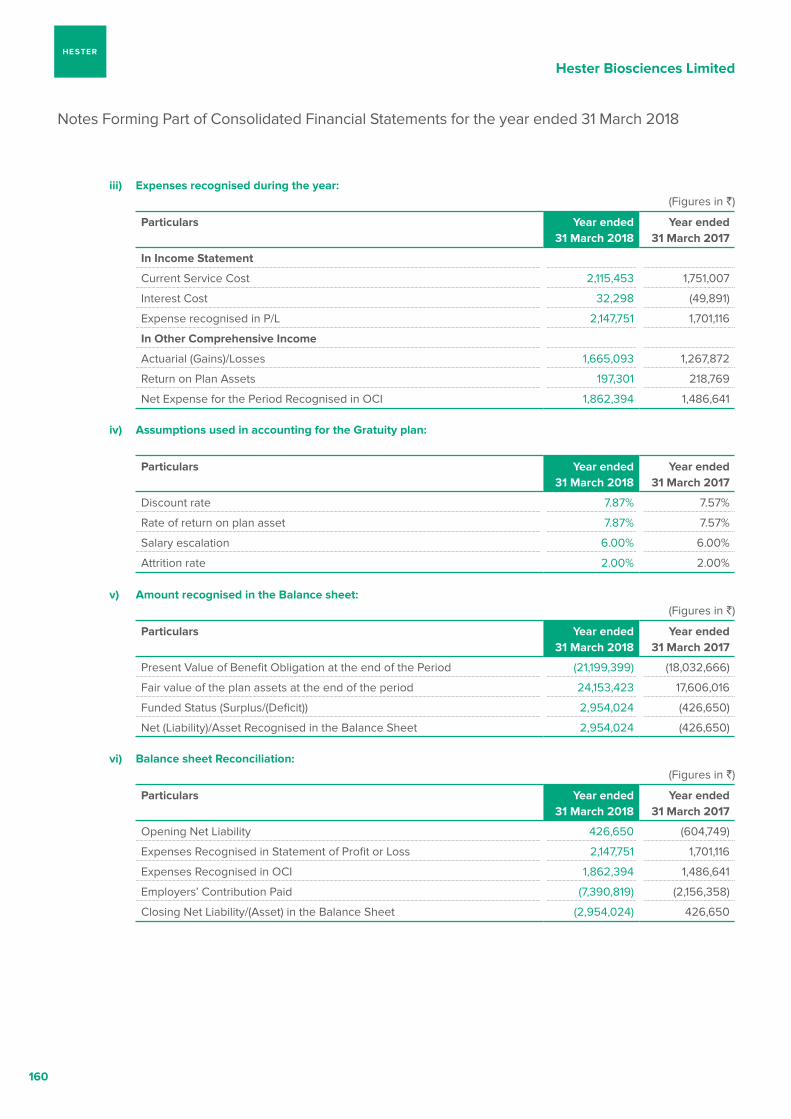
Hester Biosciences Limited
160
iii) Expenses recognised during the year: (Figures in `)
particulars year ended 31 March 2018
year ended 31 March 2017
In Income Statement
Current Service Cost 2,115,453 1,751,007
Interest Cost 32,298 (49,891)
Expense recognised in P/L 2,147,751 1,701,116
In Other Comprehensive Income
Actuarial (Gains)/Losses 1,665,093 1,267,872
Return on Plan Assets 197,301 218,769
Net Expense for the Period Recognised in OCI 1,862,394 1,486,641
iv) assumptions used in accounting for the gratuity plan:
particulars year ended 31 March 2018
year ended 31 March 2017
Discount rate 7.87% 7.57%
Rate of return on plan asset 7.87% 7.57%
Salary escalation 6.00% 6.00%
Attrition rate 2.00% 2.00%
v) amount recognised in the Balance sheet:(Figures in `)
particulars year ended 31 March 2018
year ended 31 March 2017
Present Value of Benefit Obligation at the end of the Period (21,199,399) (18,032,666)
Fair value of the plan assets at the end of the period 24,153,423 17,606,016
Funded Status (Surplus/(Deficit)) 2,954,024 (426,650)
Net (Liability)/Asset Recognised in the Balance Sheet 2,954,024 (426,650)
vi) Balance sheet Reconciliation: (Figures in `)
particulars year ended 31 March 2018
year ended 31 March 2017
Opening Net Liability 426,650 (604,749)
Expenses Recognised in Statement of Profit or Loss 2,147,751 1,701,116
Expenses Recognised in OCI 1,862,394 1,486,641
Employers’ Contribution Paid (7,390,819) (2,156,358)
Closing Net Liability/(Asset) in the Balance Sheet (2,954,024) 426,650
Notes Forming Part of Consolidated Financial Statements for the year ended 31 March 2018
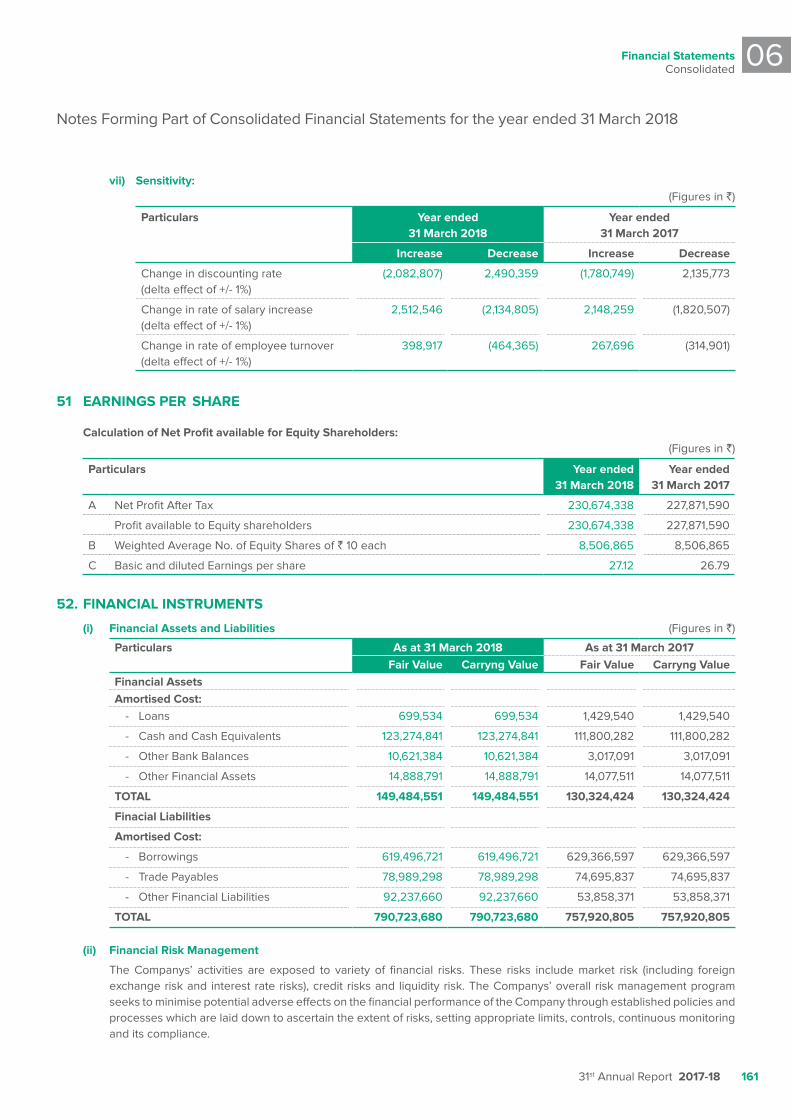
Financial StatementsConsolidated
06
31st Annual Report 2017-18 161
vii) Sensitivity: (Figures in `)
particulars year ended 31 March 2018
year ended 31 March 2017
Increase Decrease Increase Decrease
Change in discounting rate(delta effect of +/- 1%)
(2,082,807) 2,490,359 (1,780,749) 2,135,773
Change in rate of salary increase(delta effect of +/- 1%)
2,512,546 (2,134,805) 2,148,259 (1,820,507)
Change in rate of employee turnover(delta effect of +/- 1%)
398,917 (464,365) 267,696 (314,901)
51 EaRNINgS pER SHaRE
Calculation of Net profit available for Equity Shareholders: (Figures in `)
particulars year ended 31 March 2018
year ended 31 March 2017
A Net Profit After Tax 230,674,338 227,871,590
Profit available to Equity shareholders 230,674,338 227,871,590
B Weighted Average No. of Equity Shares of ` 10 each 8,506,865 8,506,865
C Basic and diluted Earnings per share 27.12 26.79
52. FINaNCIaL INSTRuMENTS
(i) Financial assets and Liabilities (Figures in `)
particulars as at 31 March 2018 as at 31 March 2017Fair value Carryng value Fair value Carryng value
Financial assetsamortised Cost: - Loans 699,534 699,534 1,429,540 1,429,540
- Cash and Cash Equivalents 123,274,841 123,274,841 111,800,282 111,800,282
- Other Bank Balances 10,621,384 10,621,384 3,017,091 3,017,091
- Other Financial Assets 14,888,791 14,888,791 14,077,511 14,077,511
TOTaL 149,484,551 149,484,551 130,324,424 130,324,424
Finacial Liabilities
amortised Cost:
- Borrowings 619,496,721 619,496,721 629,366,597 629,366,597
- Trade Payables 78,989,298 78,989,298 74,695,837 74,695,837
- Other Financial Liabilities 92,237,660 92,237,660 53,858,371 53,858,371
TOTaL 790,723,680 790,723,680 757,920,805 757,920,805
(ii) Financial Risk Management
The Companys’ activities are exposed to variety of financial risks. These risks include market risk (including foreign exchange risk and interest rate risks), credit risks and liquidity risk. The Companys’ overall risk management program seeks to minimise potential adverse effects on the financial performance of the Company through established policies and processes which are laid down to ascertain the extent of risks, setting appropriate limits, controls, continuous monitoring and its compliance.
Notes Forming Part of Consolidated Financial Statements for the year ended 31 March 2018
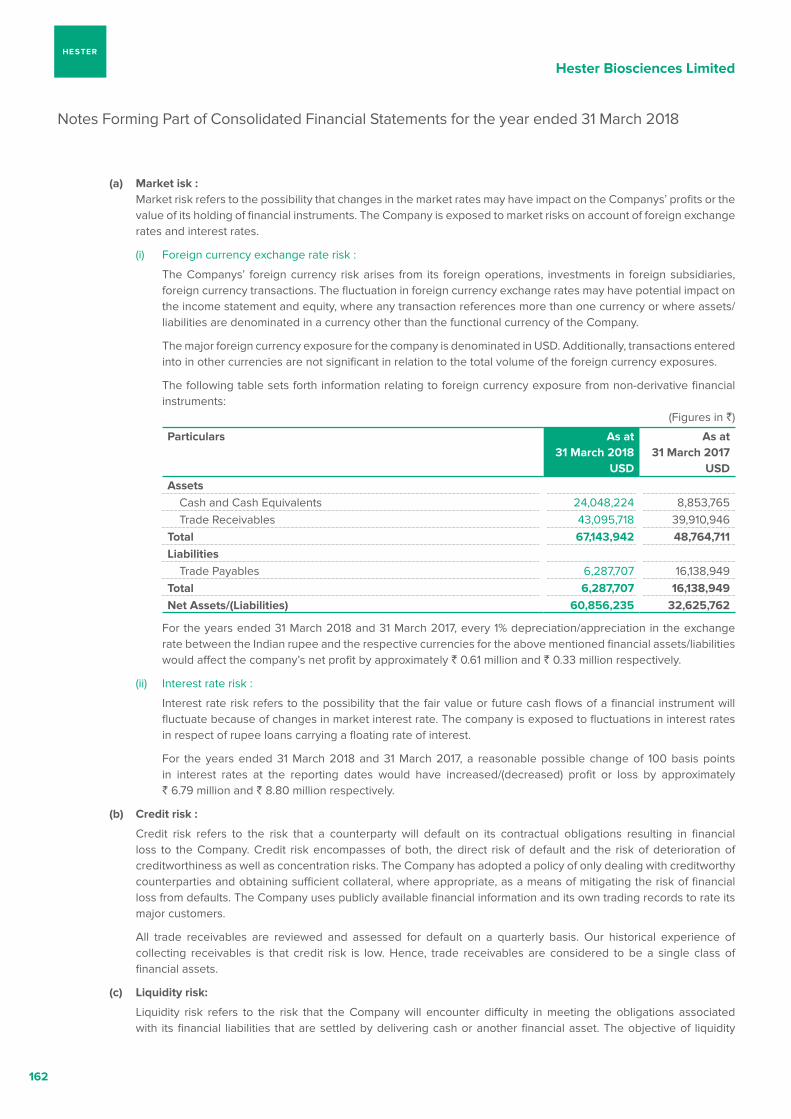
Hester Biosciences Limited
162
(a) Market isk : Market risk refers to the possibility that changes in the market rates may have impact on the Companys’ profits or the
value of its holding of financial instruments. The Company is exposed to market risks on account of foreign exchange rates and interest rates.
(i) Foreign currency exchange rate risk :
The Companys’ foreign currency risk arises from its foreign operations, investments in foreign subsidiaries, foreign currency transactions. The fluctuation in foreign currency exchange rates may have potential impact on the income statement and equity, where any transaction references more than one currency or where assets/liabilities are denominated in a currency other than the functional currency of the Company.
The major foreign currency exposure for the company is denominated in USD. Additionally, transactions entered into in other currencies are not significant in relation to the total volume of the foreign currency exposures.
The following table sets forth information relating to foreign currency exposure from non-derivative financial instruments:
(Figures in `)
particulars as at 31 March 2018
uSD
as at 31 March 2017
uSDassets Cash and Cash Equivalents 24,048,224 8,853,765 Trade Receivables 43,095,718 39,910,946 Total 67,143,942 48,764,711 Liabilities Trade Payables 6,287,707 16,138,949 Total 6,287,707 16,138,949 Net assets/(Liabilities) 60,856,235 32,625,762
For the years ended 31 March 2018 and 31 March 2017, every 1% depreciation/appreciation in the exchange rate between the Indian rupee and the respective currencies for the above mentioned financial assets/liabilities would affect the company’s net profit by approximately ` 0.61 million and ` 0.33 million respectively.
(ii) Interest rate risk :
Interest rate risk refers to the possibility that the fair value or future cash flows of a financial instrument will fluctuate because of changes in market interest rate. The company is exposed to fluctuations in interest rates in respect of rupee loans carrying a floating rate of interest.
For the years ended 31 March 2018 and 31 March 2017, a reasonable possible change of 100 basis points in interest rates at the reporting dates would have increased/(decreased) profit or loss by approximately ` 6.79 million and ` 8.80 million respectively.
(b) Credit risk :
Credit risk refers to the risk that a counterparty will default on its contractual obligations resulting in financial loss to the Company. Credit risk encompasses of both, the direct risk of default and the risk of deterioration of creditworthiness as well as concentration risks. The Company has adopted a policy of only dealing with creditworthy counterparties and obtaining sufficient collateral, where appropriate, as a means of mitigating the risk of financial loss from defaults. The Company uses publicly available financial information and its own trading records to rate its major customers.
All trade receivables are reviewed and assessed for default on a quarterly basis. Our historical experience of collecting receivables is that credit risk is low. Hence, trade receivables are considered to be a single class of financial assets.
(c) Liquidity risk:
Liquidity risk refers to the risk that the Company will encounter difficulty in meeting the obligations associated with its financial liabilities that are settled by delivering cash or another financial asset. The objective of liquidity
Notes Forming Part of Consolidated Financial Statements for the year ended 31 March 2018
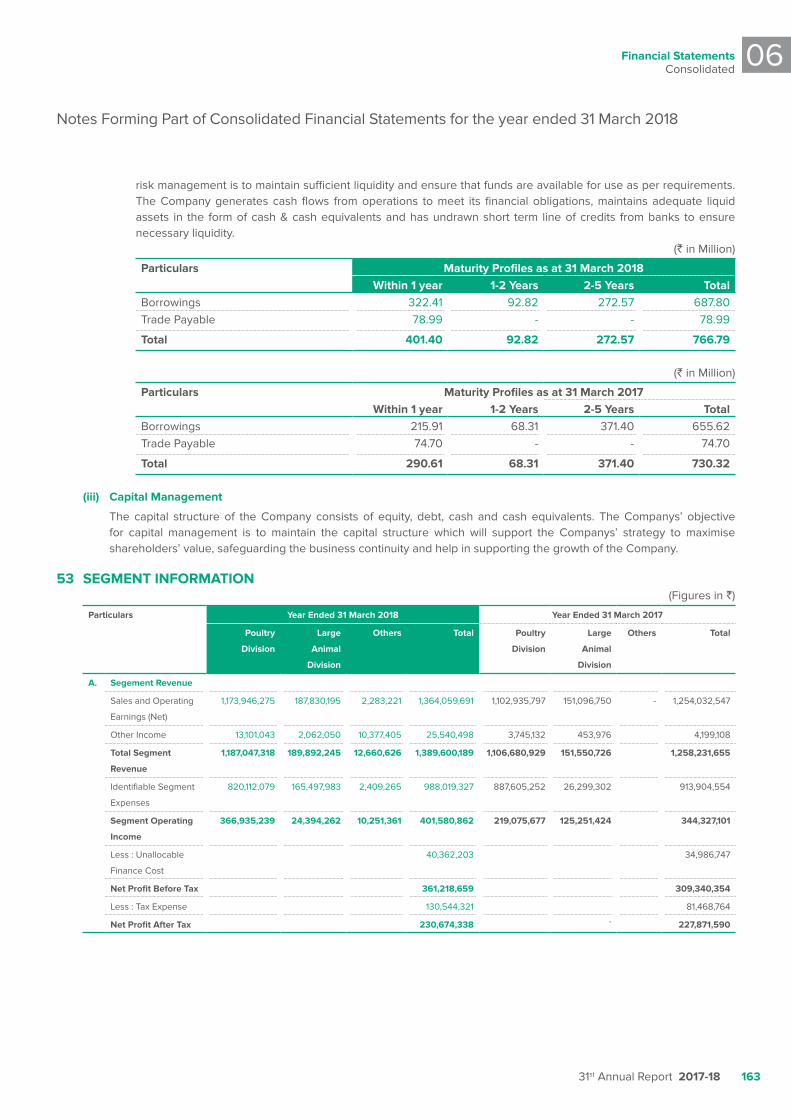
Financial StatementsConsolidated
06
31st Annual Report 2017-18 163
risk management is to maintain sufficient liquidity and ensure that funds are available for use as per requirements. The Company generates cash flows from operations to meet its financial obligations, maintains adequate liquid assets in the form of cash & cash equivalents and has undrawn short term line of credits from banks to ensure necessary liquidity.
(` in Million)
particulars Maturity profiles as at 31 March 2018Within 1 year 1-2 years 2-5 years Total
Borrowings 322.41 92.82 272.57 687.80Trade Payable 78.99 - - 78.99
Total 401.40 92.82 272.57 766.79
(` in Million)
particulars Maturity profiles as at 31 March 2017Within 1 year 1-2 years 2-5 years Total
Borrowings 215.91 68.31 371.40 655.62Trade Payable 74.70 - - 74.70
Total 290.61 68.31 371.40 730.32
(iii) Capital Management
The capital structure of the Company consists of equity, debt, cash and cash equivalents. The Companys’ objective for capital management is to maintain the capital structure which will support the Companys’ strategy to maximise shareholders’ value, safeguarding the business continuity and help in supporting the growth of the Company.
53 SEgMENT INFORMaTION(Figures in `)
particulars year Ended 31 March 2018 year Ended 31 March 2017
poultry
Division
Large
animal
Division
Others Total poultry
Division
Large
animal
Division
Others Total
a. Segement Revenue
Sales and Operating
Earnings (Net)
1,173,946,275 187,830,195 2,283,221 1,364,059,691 1,102,935,797 151,096,750 - 1,254,032,547
Other Income 13,101,043 2,062,050 10,377,405 25,540,498 3,745,132 453,976 4,199,108
Total Segment
Revenue
1,187,047,318 189,892,245 12,660,626 1,389,600,189 1,106,680,929 151,550,726 1,258,231,655
Identifiable Segment
Expenses
820,112,079 165,497,983 2,409,265 988,019,327 887,605,252 26,299,302 913,904,554
Segment Operating
Income
366,935,239 24,394,262 10,251,361 401,580,862 219,075,677 125,251,424 344,327,101
Less : Unallocable
Finance Cost
40,362,203 34,986,747
Net profit Before Tax 361,218,659 309,340,354
Less : Tax Expense 130,544,321 81,468,764
Net profit after Tax 230,674,338 ` 227,871,590
Notes Forming Part of Consolidated Financial Statements for the year ended 31 March 2018
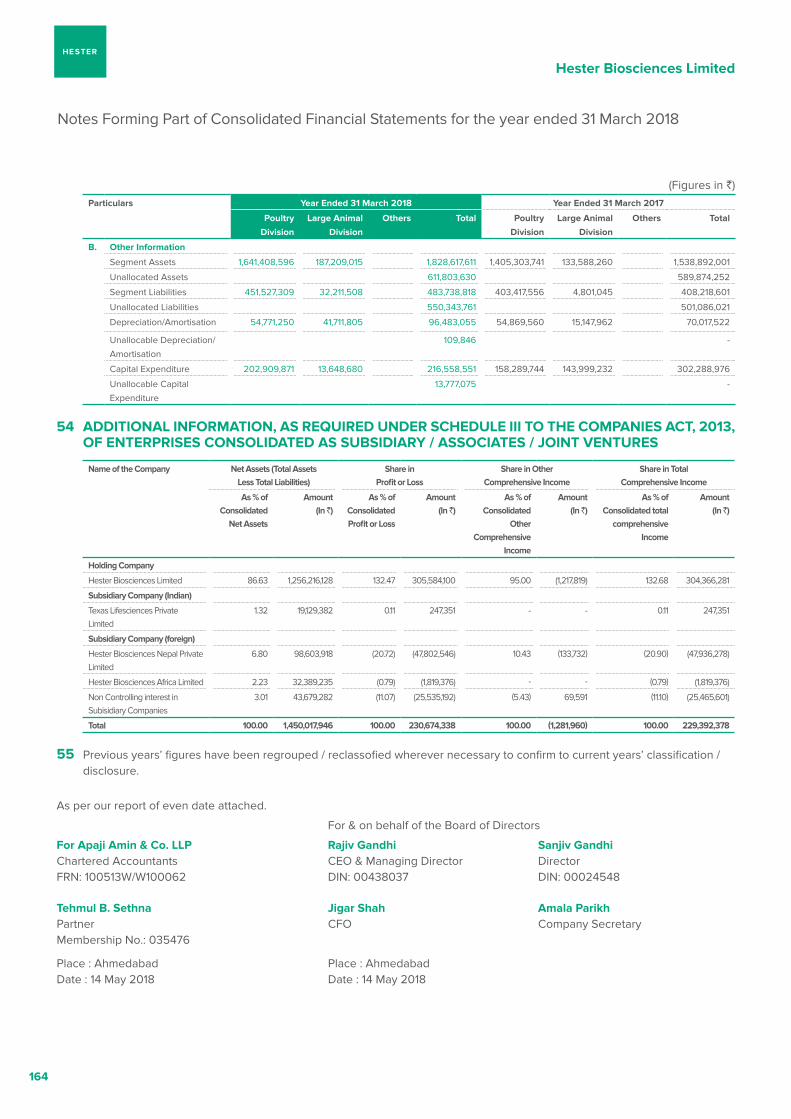
Hester Biosciences Limited
164
(Figures in `)particulars year Ended 31 March 2018 year Ended 31 March 2017
poultry
Division
Large animal
Division
Others Total poultry
Division
Large animal
Division
Others Total
B. Other Information
Segment Assets 1,641,408,596 187,209,015 1,828,617,611 1,405,303,741 133,588,260 1,538,892,001
Unallocated Assets 611,803,630 589,874,252
Segment Liabilities 451,527,309 32,211,508 483,738,818 403,417,556 4,801,045 408,218,601
Unallocated Liabilities 550,343,761 501,086,021
Depreciation/Amortisation 54,771,250 41,711,805 96,483,055 54,869,560 15,147,962 70,017,522
Unallocable Depreciation/
Amortisation
109,846 -
Capital Expenditure 202,909,871 13,648,680 216,558,551 158,289,744 143,999,232 302,288,976
Unallocable Capital
Expenditure
13,777,075 -
54 aDDITIONaL INFORMaTION, aS REquIRED uNDER SCHEDuLE III TO THE COMpaNIES aCT, 2013, OF ENTERpRISES CONSOLIDaTED aS SuBSIDIaRy / aSSOCIaTES / JOINT vENTuRES
Name of the Company Net assets (Total assets Less Total Liabilities)
Share in profit or Loss
Share in Other Comprehensive Income
Share in Total Comprehensive Income
as % of Consolidated
Net assets
amount (In ̀ )
as % of Consolidated profit or Loss
amount (In ̀ )
as % of Consolidated
Other Comprehensive
Income
amount (In ̀ )
as % of Consolidated total
comprehensive Income
amount (In ̀ )
Holding Company
Hester Biosciences Limited 86.63 1,256,216,128 132.47 305,584,100 95.00 (1,217,819) 132.68 304,366,281
Subsidiary Company (Indian)
Texas Lifesciences Private Limited
1.32 19,129,382 0.11 247,351 - - 0.11 247,351
Subsidiary Company (foreign)
Hester Biosciences Nepal Private Limited
6.80 98,603,918 (20.72) (47,802,546) 10.43 (133,732) (20.90) (47,936,278)
Hester Biosciences Africa Limited 2.23 32,389,235 (0.79) (1,819,376) - - (0.79) (1,819,376)
Non Controlling interest in Subisidiary Companies
3.01 43,679,282 (11.07) (25,535,192) (5.43) 69,591 (11.10) (25,465,601)
Total 100.00 1,450,017,946 100.00 230,674,338 100.00 (1,281,960) 100.00 229,392,378
55 Previous years’ figures have been regrouped / reclassofied wherever necessary to confirm to current years’ classification / disclosure.
As per our report of even date attached.
For & on behalf of the Board of Directors
For apaji amin & Co. LLp Rajiv gandhi Sanjiv gandhi Chartered Accountants CEO & Managing Director Director FRN: 100513W/W100062 DIN: 00438037 DIN: 00024548
Tehmul B. Sethna Jigar Shah amala parikh Partner CFO Company Secretary Membership No.: 035476
Place : Ahmedabad Place : Ahmedabad Date : 14 May 2018 Date : 14 May 2018
Notes Forming Part of Consolidated Financial Statements for the year ended 31 March 2018
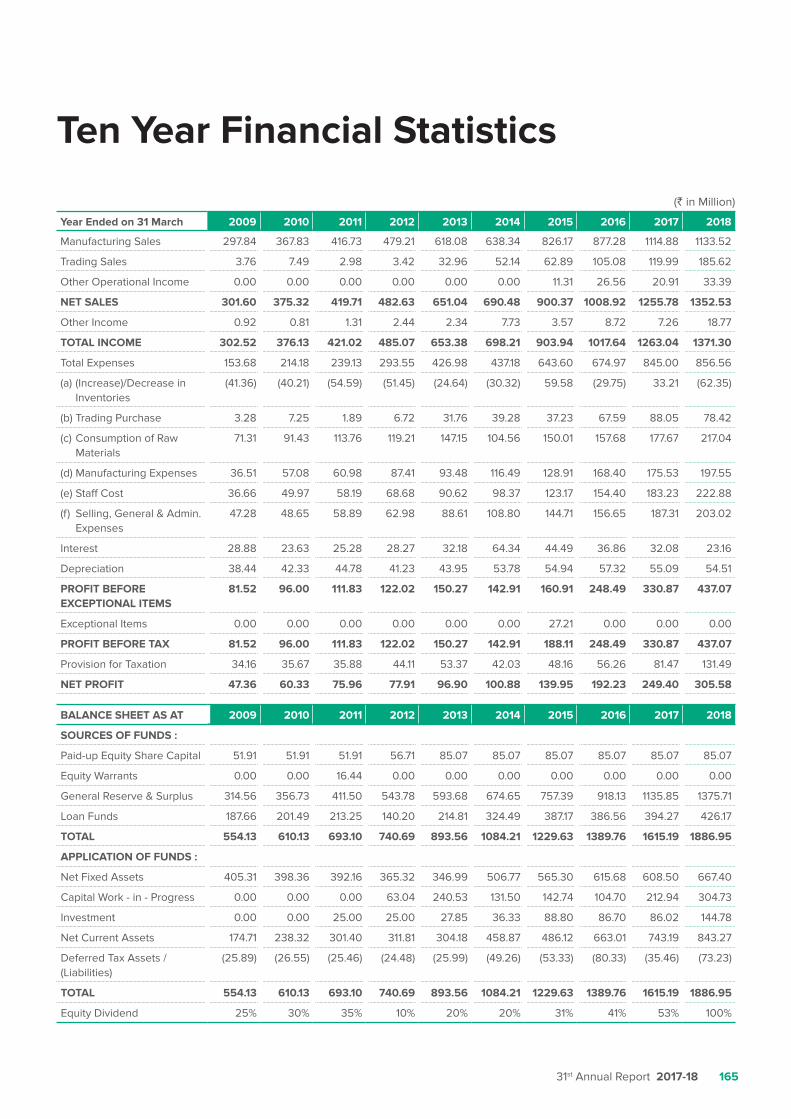
31st Annual Report 2017-18 165
Ten Year Financial Statistics
(` in Million)
Year Ended on 31 March 2009 2010 2011 2012 2013 2014 2015 2016 2017 2018
Manufacturing Sales 297.84 367.83 416.73 479.21 618.08 638.34 826.17 877.28 1114.88 1133.52
Trading Sales 3.76 7.49 2.98 3.42 32.96 52.14 62.89 105.08 119.99 185.62
Other Operational Income 0.00 0.00 0.00 0.00 0.00 0.00 11.31 26.56 20.91 33.39
NET SALES 301.60 375.32 419.71 482.63 651.04 690.48 900.37 1008.92 1255.78 1352.53
Other Income 0.92 0.81 1.31 2.44 2.34 7.73 3.57 8.72 7.26 18.77
TOTAL INCOME 302.52 376.13 421.02 485.07 653.38 698.21 903.94 1017.64 1263.04 1371.30
Total Expenses 153.68 214.18 239.13 293.55 426.98 437.18 643.60 674.97 845.00 856.56
(a) (Increase)/Decrease in Inventories
(41.36) (40.21) (54.59) (51.45) (24.64) (30.32) 59.58 (29.75) 33.21 (62.35)
(b) Trading Purchase 3.28 7.25 1.89 6.72 31.76 39.28 37.23 67.59 88.05 78.42
(c) Consumption of Raw Materials
71.31 91.43 113.76 119.21 147.15 104.56 150.01 157.68 177.67 217.04
(d) Manufacturing Expenses 36.51 57.08 60.98 87.41 93.48 116.49 128.91 168.40 175.53 197.55
(e) Staff Cost 36.66 49.97 58.19 68.68 90.62 98.37 123.17 154.40 183.23 222.88
(f) Selling, General & Admin.Expenses
47.28 48.65 58.89 62.98 88.61 108.80 144.71 156.65 187.31 203.02
Interest 28.88 23.63 25.28 28.27 32.18 64.34 44.49 36.86 32.08 23.16
Depreciation 38.44 42.33 44.78 41.23 43.95 53.78 54.94 57.32 55.09 54.51
PROFIT BEFORE EXCEPTIONAL ITEMS
81.52 96.00 111.83 122.02 150.27 142.91 160.91 248.49 330.87 437.07
Exceptional Items 0.00 0.00 0.00 0.00 0.00 0.00 27.21 0.00 0.00 0.00
PROFIT BEFORE TAX 81.52 96.00 111.83 122.02 150.27 142.91 188.11 248.49 330.87 437.07
Provision for Taxation 34.16 35.67 35.88 44.11 53.37 42.03 48.16 56.26 81.47 131.49
NET PROFIT 47.36 60.33 75.96 77.91 96.90 100.88 139.95 192.23 249.40 305.58
BALANCE SHEET AS AT 2009 2010 2011 2012 2013 2014 2015 2016 2017 2018
SOURCES OF FUNDS :
Paid-up Equity Share Capital 51.91 51.91 51.91 56.71 85.07 85.07 85.07 85.07 85.07 85.07
Equity Warrants 0.00 0.00 16.44 0.00 0.00 0.00 0.00 0.00 0.00 0.00
General Reserve & Surplus 314.56 356.73 411.50 543.78 593.68 674.65 757.39 918.13 1135.85 1375.71
Loan Funds 187.66 201.49 213.25 140.20 214.81 324.49 387.17 386.56 394.27 426.17
TOTAL 554.13 610.13 693.10 740.69 893.56 1084.21 1229.63 1389.76 1615.19 1886.95
APPLICATION OF FUNDS :
Net Fixed Assets 405.31 398.36 392.16 365.32 346.99 506.77 565.30 615.68 608.50 667.40
Capital Work - in - Progress 0.00 0.00 0.00 63.04 240.53 131.50 142.74 104.70 212.94 304.73
Investment 0.00 0.00 25.00 25.00 27.85 36.33 88.80 86.70 86.02 144.78
Net Current Assets 174.71 238.32 301.40 311.81 304.18 458.87 486.12 663.01 743.19 843.27
Deferred Tax Assets / (Liabilities)
(25.89) (26.55) (25.46) (24.48) (25.99) (49.26) (53.33) (80.33) (35.46) (73.23)
TOTAL 554.13 610.13 693.10 740.69 893.56 1084.21 1229.63 1389.76 1615.19 1886.95
Equity Dividend 25% 30% 35% 10% 20% 20% 31% 41% 53% 100%
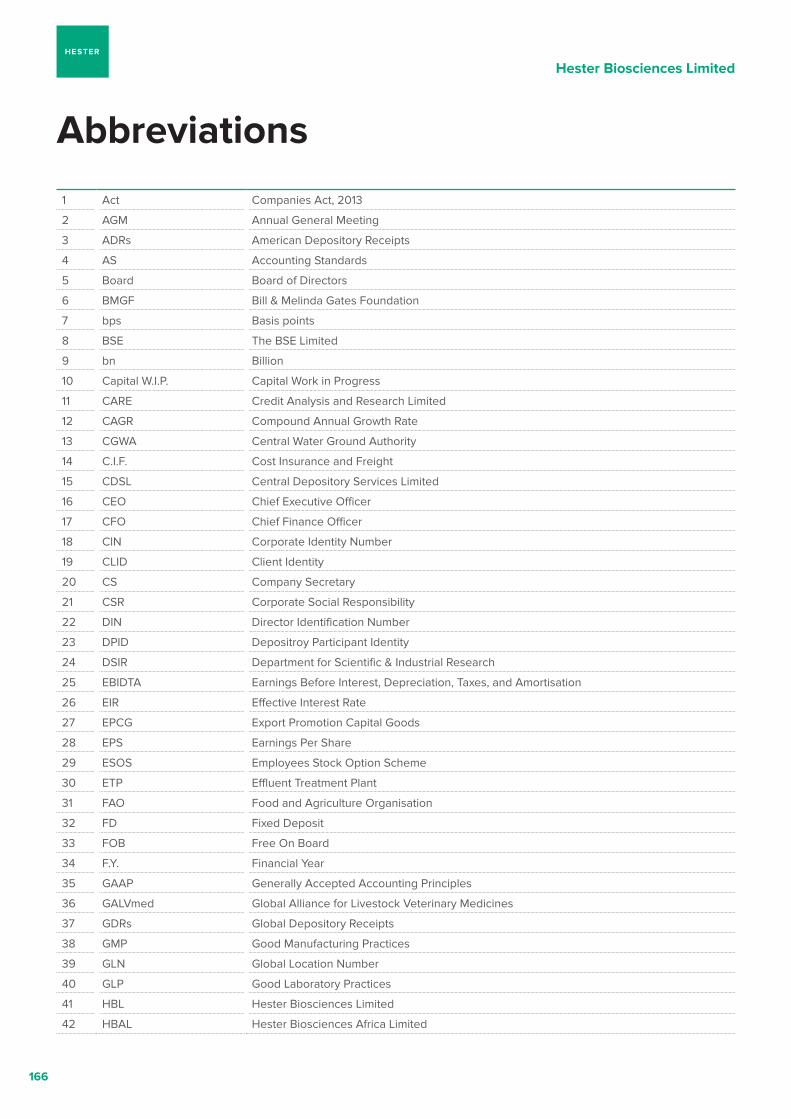
Hester Biosciences Limited
166
1 Act Companies Act, 2013
2 AGM Annual General Meeting
3 ADRs American Depository Receipts
4 AS Accounting Standards
5 Board Board of Directors
6 BMGF Bill & Melinda Gates Foundation
7 bps Basis points
8 BSE The BSE Limited
9 bn Billion
10 Capital W.I.P. Capital Work in Progress
11 CARE Credit Analysis and Research Limited
12 CAGR Compound Annual Growth Rate
13 CGWA Central Water Ground Authority
14 C.I.F. Cost Insurance and Freight
15 CDSL Central Depository Services Limited
16 CEO Chief Executive Officer
17 CFO Chief Finance Officer
18 CIN Corporate Identity Number
19 CLID Client Identity
20 CS Company Secretary
21 CSR Corporate Social Responsibility
22 DIN Director Identification Number
23 DPID Depositroy Participant Identity
24 DSIR Department for Scientific & Industrial Research
25 EBIDTA Earnings Before Interest, Depreciation, Taxes, and Amortisation
26 EIR Effective Interest Rate
27 EPCG Export Promotion Capital Goods
28 EPS Earnings Per Share
29 ESOS Employees Stock Option Scheme
30 ETP Effluent Treatment Plant
31 FAO Food and Agriculture Organisation
32 FD Fixed Deposit
33 FOB Free On Board
34 F.Y. Financial Year
35 GAAP Generally Accepted Accounting Principles
36 GALVmed Global Alliance for Livestock Veterinary Medicines
37 GDRs Global Depository Receipts
38 GMP Good Manufacturing Practices
39 GLN Global Location Number
40 GLP Good Laboratory Practices
41 HBL Hester Biosciences Limited
42 HBAL Hester Biosciences Africa Limited
Abbreviations
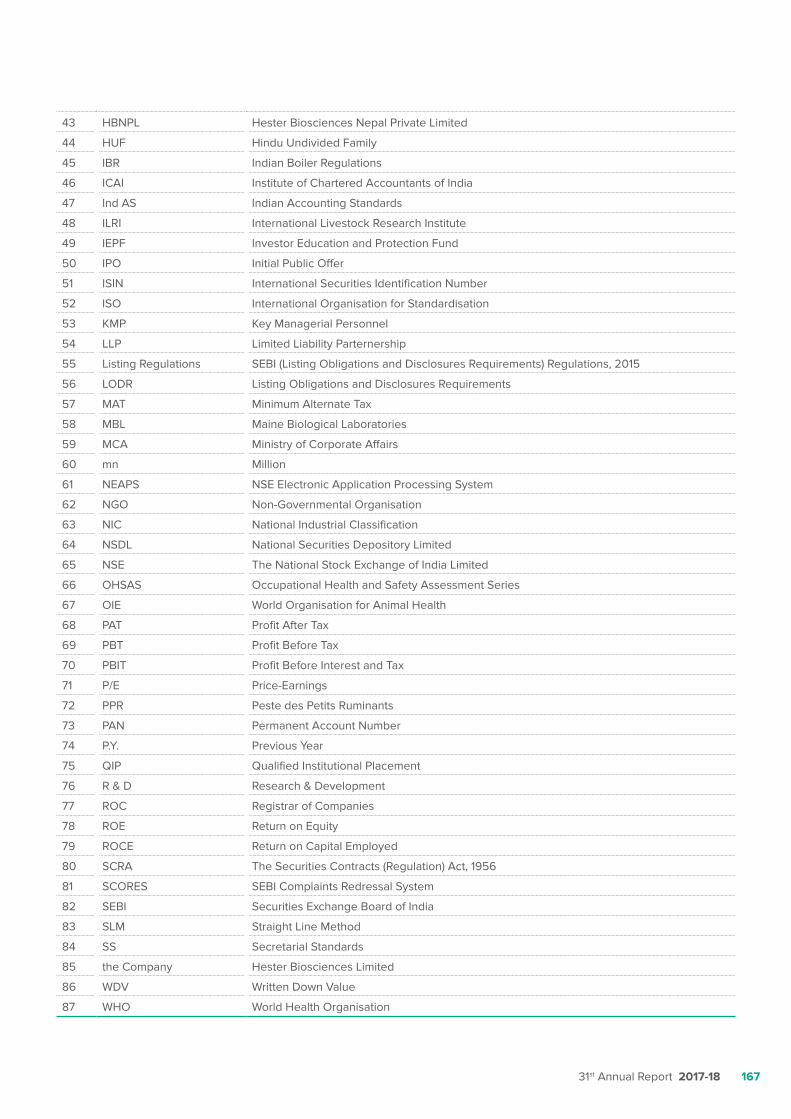
31st Annual Report 2017-18 167
43 HBNPL Hester Biosciences Nepal Private Limited
44 HUF Hindu Undivided Family
45 IBR Indian Boiler Regulations
46 ICAI Institute of Chartered Accountants of India
47 Ind AS Indian Accounting Standards
48 ILRI International Livestock Research Institute
49 IEPF Investor Education and Protection Fund
50 IPO Initial Public Offer
51 ISIN International Securities Identification Number
52 ISO International Organisation for Standardisation
53 KMP Key Managerial Personnel
54 LLP Limited Liability Parternership
55 Listing Regulations SEBI (Listing Obligations and Disclosures Requirements) Regulations, 2015
56 LODR Listing Obligations and Disclosures Requirements
57 MAT Minimum Alternate Tax
58 MBL Maine Biological Laboratories
59 MCA Ministry of Corporate Affairs
60 mn Million
61 NEAPS NSE Electronic Application Processing System
62 NGO Non-Governmental Organisation
63 NIC National Industrial Classification
64 NSDL National Securities Depository Limited
65 NSE The National Stock Exchange of India Limited
66 OHSAS Occupational Health and Safety Assessment Series
67 OIE World Organisation for Animal Health
68 PAT Profit After Tax
69 PBT Profit Before Tax
70 PBIT Profit Before Interest and Tax
71 P/E Price-Earnings
72 PPR Peste des Petits Ruminants
73 PAN Permanent Account Number
74 P.Y. Previous Year
75 QIP Qualified Institutional Placement
76 R & D Research & Development
77 ROC Registrar of Companies
78 ROE Return on Equity
79 ROCE Return on Capital Employed
80 SCRA The Securities Contracts (Regulation) Act, 1956
81 SCORES SEBI Complaints Redressal System
82 SEBI Securities Exchange Board of India
83 SLM Straight Line Method
84 SS Secretarial Standards
85 the Company Hester Biosciences Limited
86 WDV Written Down Value
87 WHO World Health Organisation

Hester Biosciences Limited
168
Notes


Hester Biosciences Limitedwww.hester.in


![Facile Fabrication of SingleCrystalDiamond … mechanical properties are poised ... include direct FIB machining, [8] ... The quartz handle is prepared for diamond](https://img.pdfslide.us/doc/110x75/5ac8a4d97f8b9a40728cf061/facile-fabrication-of-singlecrystaldiamond-mechanical-properties-are-poised.jpg)


![India Poised[1]](https://img.pdfslide.us/doc/110x75/54c0db9c4a7959ff248b45d2/india-poised1.jpg)