Embed Size (px)
Citation preview
PointCloudXplore 2: Visual Exploration of 3D GeneExpression
O. Rubel1,2,3, G.H. Weber3, M.-Y. Huang2, E.W. Bethel3 , S.V.E. Keranen4,C.C. Fowlkes5, C.L. Luengo Hendriks7, Angela H. DePace8, L. Simirenko4,
M.B. Eisen4, M.D. Biggin4, H. Hagen1, J. Malik6,D.W. Knowles7 and B. Hamann1,2,3
1 International Research Training Group Visualization of Large and UnstructuredData Sets, University of Kaiserslautern, Germany
2 Institute for Data Analysis and Visualization, University of California, Davis, CA3 Computational Research Division, Lawrence Berkeley National Laboratory
(LBNL), Berkeley, CA4 Genomics Division, LBNL
5 Computer Science Department, University of California, Irvine, CA6 Computer Science Division,University of California, Berkeley, CA
7 Life Sciences Division, LBNL8 Department of Molecular and Cellular Biology and the Center for Integrative
Genomics, University of California, Berkeley, CA
Abstract: To better understand how developmental regulatory networks are defined inthe genome sequence, theBerkeley Drosophila Transcription Network Project (BD-NTP ) has developed a suite of methods to describe 3D gene expression data, i.e.,the output of the network at cellular resolution for multiple time points. To allow re-searchers to explore these novel data sets we have developed PointCloudXplore (PCX).In PCX we have linked physical and information visualization views via the concept ofbrushing (cell selection). For each view dedicated operations for performing selectionof cells are available. In PCX, all cell selections are stored in a central managementsystem. Cells selected in one view can in this way be highlighted in any view allowingfurther cell subset properties to be determined. Complex cell queries can be definedby combining different cell selections using logical operations such as AND, OR, andNOT. Here we are going to provide an overview of PointCloudXplore 2 (PCX2), thelatest publicly available version of PCX. PCX2 has shown to be an effective tool forvisual exploration of 3D gene expression data. We discuss (i) all views available inPCX2, (ii) different strategies to perform cell selection, (iii) the basic architecture ofPCX2., and (iv) illustrate the usefulness of PCX2 using selected examples.

1 Introduction
Understanding how embryo development is controlled is a fundamental question in biol-ogy. Specific combinations of developmental regulatory factors –forming parts of complexgenetic regulatory networks– are responsible for determining the cell fates [Law92]. Bi-ologists have typically analyzed gene expression and morphology by visual inspection ofphotomicrographic images. In order to understand animal development, methods to com-putationally describe gene expression at cellular resolution are required. To address thischallenge, the BDTNP has developed image analysis methods to extract information aboutgene expression from 3D imaging data, using earlyDrosophila melanogaster embryos asa model [BDT]. Blastoderm stageDrosophila embryos are stained, mounted, and imagedusing laser microscopy. The image stacks are then converted into matrices specifying theposition of blastoderm nuclei and the expression levels of select genes in and around eachnucleus [LKF+06, KFL+06]. These novel, so called PointCloud datasets, promise to be aninvaluable resource for studying embryo development. Due to the limited number of dif-ferent fluorophores we can spectrally distinguish as well as the difficulty in adding multiplelabels to embryos it is, however, experimentally not practical to obtain the expression ofmore than a few genes in a single embryo. To make possible to compare the relationshipsbetween regulators and their many target genes in a common coordinate framework, a setof PointClouds are registered into one or more Virtual PointClouds [FLK+05, FLK+07].
To help biologists to compare and analyze 3D gene expression data, we developed Point-CloudXplore (PCX), a tool specifically designed for exploration of PointCloud data. InPCX, we have linked physical and information visualization views via the concept ofbrushing (cell selection). Here we are going to introduce PointCloudXplore 2 (PCX2),the next publicly available version of PCX. We are going to discuss all views availablein PCX2 and describe how linking of the views via cell selection is used for effectivedata exploration. Afterwards, we will explain different dedicated strategies for perform-ing cell selection and describe the basic architecture of PCX2. The following parts ofthis manuscript are structured as follows. In Section 2 we will provide an overview ofrelated work. The different visualization techniques available in PCX2 are then describedin Section 3. In Section 4.1 and 4.2, linking of the views via cell selection and all opera-tions for performing and combining cell selections will be explained. A brief overview ofthe implementation of PCX2 will be provided in Section 5. In Section 6 we present ourconclusions and describe future plans.
2 Previous Work
PCX2 makes use of the established concept of linking multiple views to visualize high-dimensional 3D gene expression data [BWK00]. In the WEAVE system, e.g., a combi-nation of linked physical views and information visualization views was used for explo-ration of cardiac simulation and measurement data [GRW+00]. Henze [Hen98] proposeda system of multiple views (called Portraits in his paper) for exploring time-varying com-putational fluid dynamics (CFD) data sets. Both Henze’s system for CFD data and the
WEAVE system use linked views to define features in a data set by refining queries basedon brushes. In PCX2, brushes are called cell selectors since this term is found to be moreintuitive by target users. Doleisch et al. formalized the concept of defining features viaqueries using information visualization views and utilizing logical operations to combineseveral brushes [DGH03] (see also Hauser et al. [HLD02]). A variety of extensions to3D scatter plots were proposed by Piringer et al. [PKH04] and Kosara et al. [KSH04]improving depth perception and perception of the sample distribution in all dimensions.
Parallel coordinates are a standard visualization for high-dimensional data while manyextensions to standard parallel coordinates have been developed to make them more useful.Wegman and Luor [WL97] proposed usage of transparency and “over-plotting” translucentdata points/lines to reveal inherent data characteristics by highlighting dense areas. Fua etal. [FWR99] proposed hierarchical parallel coordinates, including several techniques forvisualization of selected subsets of the data which are in part also available in PCX2.
3 Visualizing 3D Gene Expression
PCX2 provides different visualizations for 3D gene expression data. In physical views a3D model, or 2D projections of the 3D model, are used to visualize spatial gene expressionpatterns (Section 3.1). To support analysis of relationships between the expression of genesdirectly in expression space, PCX2 features scatter-plots (Section 3.2) as well as parallelcoordinates (Section 3.3) as abstract information visualization views. To allow comparisonof the expression of genes in a single cell, the Cell Magnifier shows the expression of allgenes in a user defined cell as bar-graph (Section 3.4).
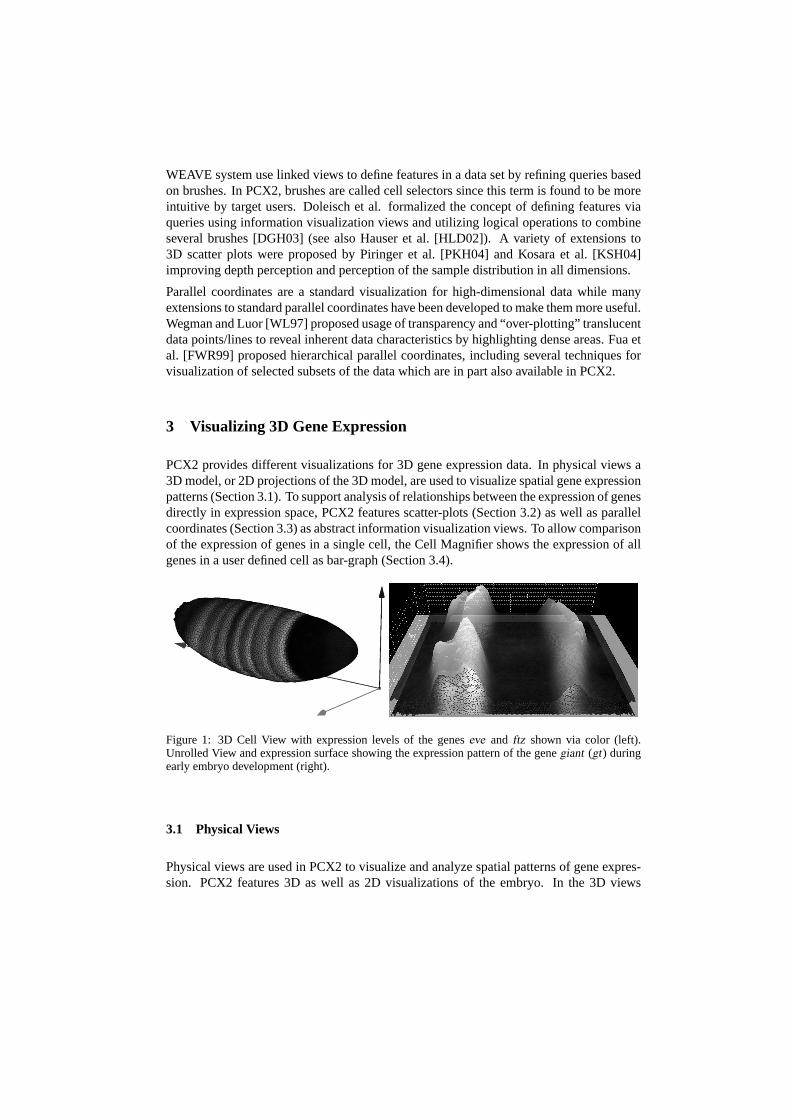
Figure 1: 3D Cell View with expression levels of the geneseve and ftz shown via color (left).Unrolled View and expression surface showing the expression pattern of the genegiant (gt) duringearly embryo development (right).
3.1 Physical Views
Physical views are used in PCX2 to visualize and analyze spatial patterns of gene expres-sion. PCX2 features 3D as well as 2D visualizations of the embryo. In the 3D views
spherical icons (not shown) or polygonal faces are used to represent individual cells (seeFigure 1 left). To also take the movement of cells over time into account the user canchoose which cell positions from which time-step should be used in the visualization. Byusing different projections of the 3D embryo model dedicated 2D visualizations of theembryo are created. Figure 1 (right) shows an embryo projected to a 2D plane using acylindrical projection. PCX2 also allows one to use orthographic projection to create threeadditional 2D views of the embryo described in more detail in Weber et al. [WRH+07].
In addition to providing an overview of the entire embryo, projecting the embryo to a planehas the advantage of freeing one dimension up for displaying additional information. InPCX2, this “free” dimension can be used to display gene expression values as surface plots.The height of an expression surface is determined by the expression values measured forthe gene it represents while thexy-position of surface points are defined by the position ofthe cells in the underlying 2D physical view. As shown in the right panel of Figure 1, suchsurface plots enable a more quantitative analysis of gene expression data than possiblewhen just using color. Multiple surfaces can be used to compare quantitative relationshipsbetween genes. More details about physical views and their use for the analysis of 3Dgene expression are provided in [RWK+06, WRH+07].
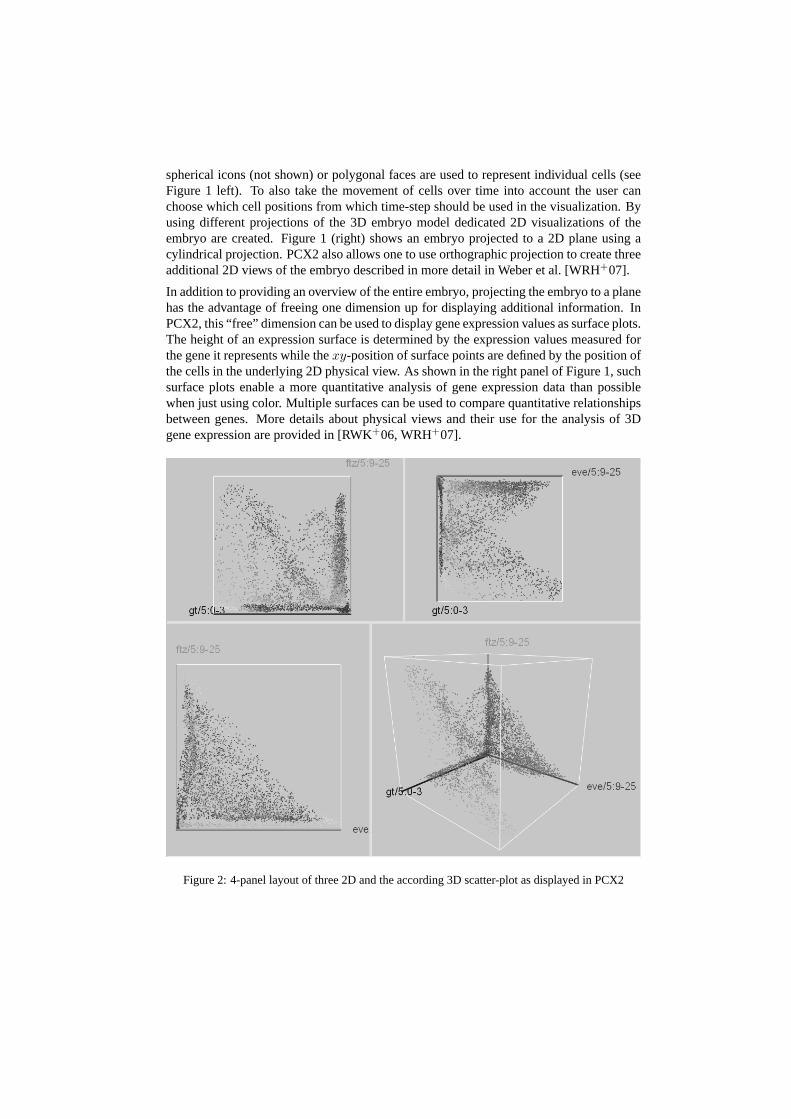
Figure 2: 4-panel layout of three 2D and the according 3D scatter-plot as displayed in PCX2
3.2 Scatter-plots
In contrast to physical views of the embryo, abstract views, such as scatter-plots, discardspatial information and show the quantitative relationships between multiple genes expres-sion in one or all cells. In a scatter-plot, three genes are selected and mapped to the threeaxes of the Cartesian coordinate system. Each of the axes represents the expression of onegene ranging from no expression at the origin to maximum relative expression. A singlepoint is used to represent each cell of the embryo while the location of the point is speci-fied according to the relative gene expression levels measured for the corresponding cell.To enhance depth perception and to better distinguish separate points we use color, halos,and alpha blending. As shown in Figure 2, in PCX2 we use a 4-panel layout in which a3D scatter-plot (lower-right panel) is augmented with a set of 2D scatter plots showing theexpression relationships between the three possible gene-pairs in the 3D plot. See Weberet al. [WRH+07] for more detailed information.
Scatter-plots are in general found to be an intuitive visualization and are used to revealinformation about relationships between genes. In the scatter-plot ofeve andftz (Figure 2lower-left panel), e.g., a clear anti-correlation between the two genes can be seen.
3.3 Parallel Coordinates
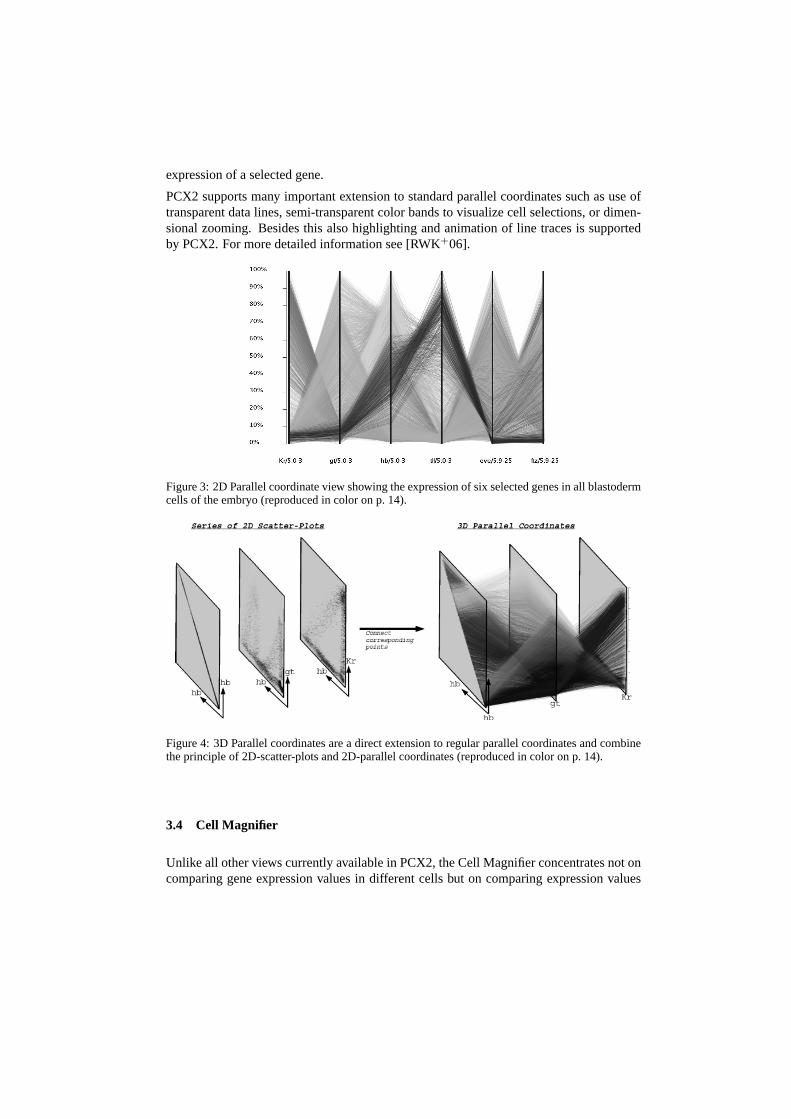
To make visualization of the expression of many genes in parallel possible, PCX2 fea-tures parallel coordinates. Parallel coordinates were proposed independently by Insel-berg [Ins84] and Wegman [Weg90] and are a common information visualization techniquefor high-dimensional data sets. Each data dimension (gene) is represented in parallel co-ordinates by one parallel axis. Each data sample (cell) has a set of associated expressionvalues defining a point on each parallel axis. By connecting the corresponding points ofneighboring axes each cell can be represented by a data line, i.e., a “zigzag” line connect-ing adjacent parallel axes. The intersection point of the data line with each vertical axiscorresponds to the value of the sample for the corresponding dimension (i.e., the relativeexpression level for the corresponding gene in that cell). In Figure 3, an example parallelcoordinate view is shown visualizing the expression of six selected genes in all cells of theembryo.
3D-parallel coordinates are a direct extension of 2D-parallel coordinates in which the par-allel axes are extruded into thez dimension. As illustrated in Figure 4, lines are sortedalong thez axis with respect to a selected data dimension so that each parallel axis isdefacto a 2D-scatter-plot. As in 2D-parallel coordinates, corresponding points of neighbor-ing axes are connected via line segments. In PCX2 the same information is displayedalong thez dimension for all axes, in this way a 3D-plot of non-intersecting parallel datalines is created each representing one cell. Data lines can be sorted in parallel coordi-nates according to the position of cells along the anterior-posterior axis (AP)(head to rear)or dorsal-ventral circumference (DV)(circumference around the embryo) which can bederived from the Unrolled View. Beside this, lines can also be sorted according to the
expression of a selected gene.
PCX2 supports many important extension to standard parallel coordinates such as use oftransparent data lines, semi-transparent color bands to visualize cell selections, or dimen-sional zooming. Besides this also highlighting and animation of line traces is supportedby PCX2. For more detailed information see [RWK+06].
Figure 3: 2D Parallel coordinate view showing the expression of six selected genes in all blastodermcells of the embryo (reproduced in color on p. 14).
Figure 4: 3D Parallel coordinates are a direct extension to regular parallel coordinates and combinethe principle of 2D-scatter-plots and 2D-parallel coordinates (reproduced in color on p. 14).
3.4 Cell Magnifier
Unlike all other views currently available in PCX2, the Cell Magnifier concentrates not oncomparing gene expression values in different cells but on comparing expression values
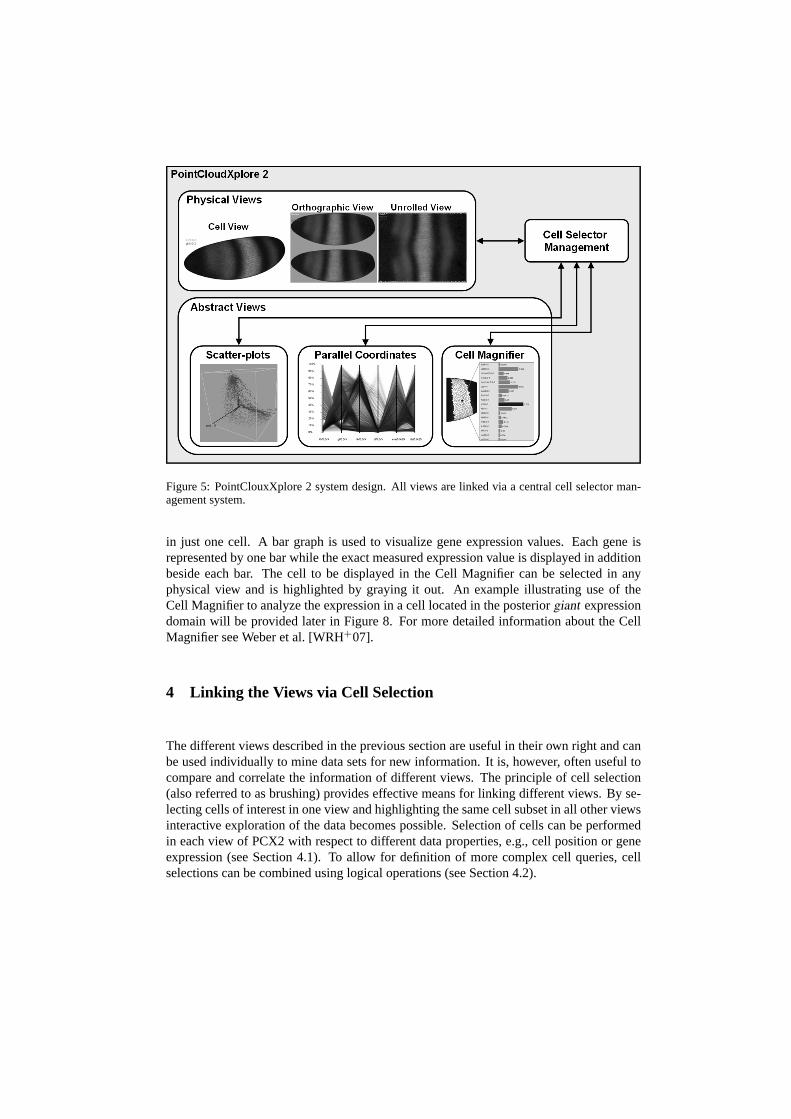
Figure 5: PointClouxXplore 2 system design. All views are linked via a central cell selector man-agement system.
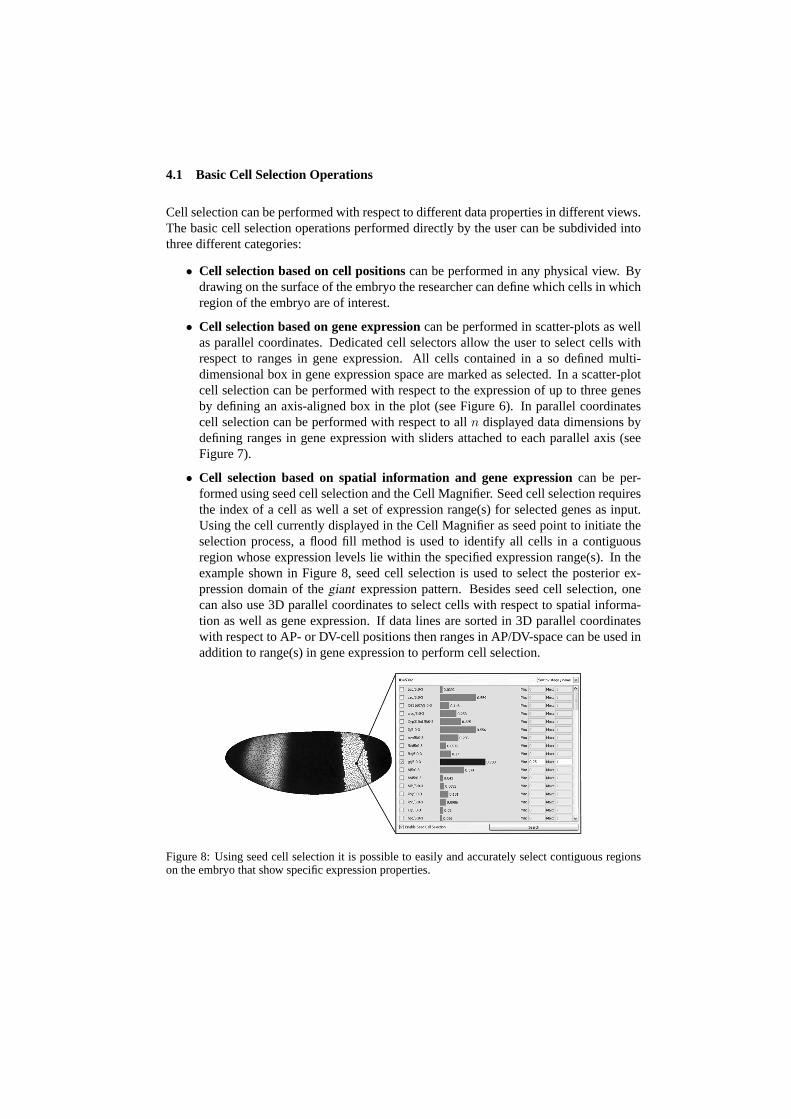
in just one cell. A bar graph is used to visualize gene expression values. Each gene isrepresented by one bar while the exact measured expression value is displayed in additionbeside each bar. The cell to be displayed in the Cell Magnifier can be selected in anyphysical view and is highlighted by graying it out. An example illustrating use of theCell Magnifier to analyze the expression in a cell located in the posteriorgiant expressiondomain will be provided later in Figure 8. For more detailed information about the CellMagnifier see Weber et al. [WRH+07].
4 Linking the Views via Cell Selection
The different views described in the previous section are useful in their own right and canbe used individually to mine data sets for new information. It is, however, often useful tocompare and correlate the information of different views. The principle of cell selection(also referred to as brushing) provides effective means for linking different views. By se-lecting cells of interest in one view and highlighting the same cell subset in all other viewsinteractive exploration of the data becomes possible. Selection of cells can be performedin each view of PCX2 with respect to different data properties, e.g., cell position or geneexpression (see Section 4.1). To allow for definition of more complex cell queries, cellselections can be combined using logical operations (see Section 4.2).
In PCX2 all cell selections are stored in dedicated so calledcell selector objects. All cellselectors are stored and managed in acentral cell selector management system. All viewshave access to the same set of cell selectors via this central management system. Thissimple but effective system design allows one to easily integrate new views in PCX2 andlink them to the already existing views. Figure 5 illustrates the basic system design ofPCX2. The different views are each independent of one another and are interconnectedonly indirectly via the central cell selector management. Independent of the criteria em-ployed to perform cell selection, each cell selector defines for each cell whether it is theselected or not. In addition, each cell selector is required to have a name, color, and aflag defining whether the cell selector should be displayed or not. Therefore, a commonbase class can be used to define properties common for all types of cell selectors. By usingsuch a common interface all types of cell selectors can be efficiently displayed in all views.Which types of cell selectors can be edited and created in the different views then dependson according to which data properties cell selection can be performed in a view.
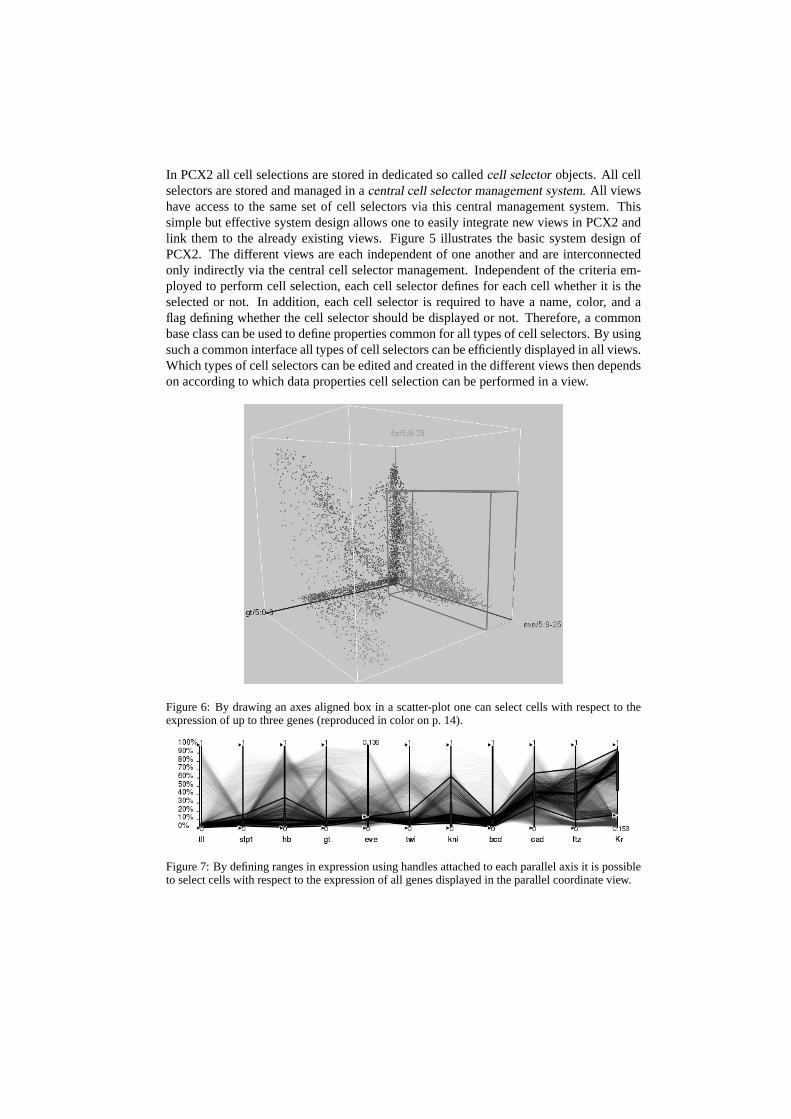
Figure 6: By drawing an axes aligned box in a scatter-plot one can select cells with respect to theexpression of up to three genes (reproduced in color on p. 14).
Figure 7: By defining ranges in expression using handles attached to each parallel axis it is possibleto select cells with respect to the expression of all genes displayed in the parallel coordinate view.
4.1 Basic Cell Selection Operations
Cell selection can be performed with respect to different data properties in different views.The basic cell selection operations performed directly by the user can be subdivided intothree different categories:
• Cell selection based on cell positionscan be performed in any physical view. Bydrawing on the surface of the embryo the researcher can define which cells in whichregion of the embryo are of interest.
• Cell selection based on gene expressioncan be performed in scatter-plots as wellas parallel coordinates. Dedicated cell selectors allow the user to select cells withrespect to ranges in gene expression. All cells contained in a so defined multi-dimensional box in gene expression space are marked as selected. In a scatter-plotcell selection can be performed with respect to the expression of up to three genesby defining an axis-aligned box in the plot (see Figure 6). In parallel coordinatescell selection can be performed with respect to alln displayed data dimensions bydefining ranges in gene expression with sliders attached to each parallel axis (seeFigure 7).
• Cell selection based on spatial information and gene expressioncan be per-formed using seed cell selection and the Cell Magnifier. Seed cell selection requiresthe index of a cell as well a set of expression range(s) for selected genes as input.Using the cell currently displayed in the Cell Magnifier as seed point to initiate theselection process, a flood fill method is used to identify all cells in a contiguousregion whose expression levels lie within the specified expression range(s). In theexample shown in Figure 8, seed cell selection is used to select the posterior ex-pression domain of thegiant expression pattern. Besides seed cell selection, onecan also use 3D parallel coordinates to select cells with respect to spatial informa-tion as well as gene expression. If data lines are sorted in 3D parallel coordinateswith respect to AP- or DV-cell positions then ranges in AP/DV-space can be used inaddition to range(s) in gene expression to perform cell selection.
Figure 8: Using seed cell selection it is possible to easily and accurately select contiguous regionson the embryo that show specific expression properties.
4.2 Combining Cell Selections
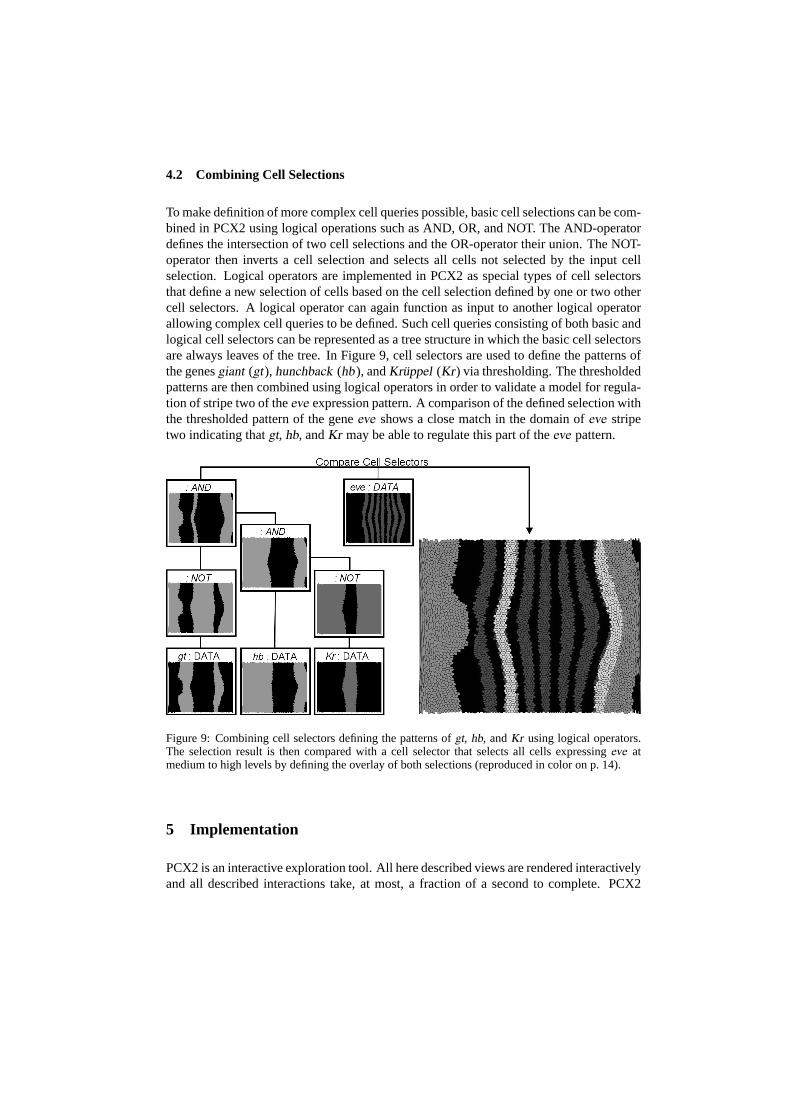
To make definition of more complex cell queries possible, basic cell selections can be com-bined in PCX2 using logical operations such as AND, OR, and NOT. The AND-operatordefines the intersection of two cell selections and the OR-operator their union. The NOT-operator then inverts a cell selection and selects all cells not selected by the input cellselection. Logical operators are implemented in PCX2 as special types of cell selectorsthat define a new selection of cells based on the cell selection defined by one or two othercell selectors. A logical operator can again function as input to another logical operatorallowing complex cell queries to be defined. Such cell queries consisting of both basic andlogical cell selectors can be represented as a tree structure in which the basic cell selectorsare always leaves of the tree. In Figure 9, cell selectors are used to define the patterns ofthe genesgiant (gt), hunchback (hb ), andKruppel (Kr) via thresholding. The thresholdedpatterns are then combined using logical operators in order to validate a model for regula-tion of stripe two of theeve expression pattern. A comparison of the defined selection withthe thresholded pattern of the geneeve shows a close match in the domain ofeve stripetwo indicating thatgt, hb, andKr may be able to regulate this part of theeve pattern.
Figure 9: Combining cell selectors defining the patterns ofgt, hb, andKr using logical operators.The selection result is then compared with a cell selector that selects all cells expressingeve atmedium to high levels by defining the overlay of both selections (reproduced in color on p. 14).
5 Implementation
PCX2 is an interactive exploration tool. All here described views are rendered interactivelyand all described interactions take, at most, a fraction of a second to complete. PCX2
is implemented as C++ stand-alone application using Trolltechs Qt 4.2 library (http://www.trolltech.com/ ) and OpenGL (http://www.opengl.org/ ) as cross-platform widget and graphics libraries. PCX2 is available for Linux, MacOS and Win-dows. An earlier version of PCX has already been released to the public and can bedownloaded free of charge from the BDTNPs web pagehttp://bdtnp.lbl.gov/Fly-Net/bioimaging.jsp?w=pcx . The full version of PCX2 as described herewill also be made available for free soon via the BDTNPs web page. PCX2 is usedas a means to view the BDTNP’s release data sets describing spatial gene expression inDrosophila blastoderms [BDT].
6 Conclusions and Future Work
PCX has already shown to be a valuable tool to members of the BDTNP as well as usersof the publicly available 3D gene expression database of the BDTNP. Along with thenext release of the database we will also make PCX2 available for free public download.PCX2 provides all features of PCX and includes additional extension such as 3D parallelcoordinates and supports visualization of the latest 3D gene expression data created bythe BDTNP. Scatter-plots and parallel coordinates should allow researchers to examinerelationships between 20-30 genes.
Here we have provided an overview of all views available in PCX2 and shown how linkingof the views via cell selection can be used for effective data exploration. Using selected ex-amples, we have shown how one can analyze the spatial expression pattern of genes usingphysical views and expression surfaces. Information visualization views, such as scatter-plots and parallel coordinates, then enable analysis of gene inter-relationships directly ingene expression space. We have illustrated how dedicated cell selection operations such asseed cell selection can be used to effectively define cells of interest, such as an expressiondomain of a selected gene. We have also shown how binary logical models of geneticinteractions can be analyzed by combining thresholded patterns of selected genes usinglogical operations.
As the BDTNP continues to collect data for many more genes, this imposes several newchallenges for future work. For example, with our current approach it is possible to ef-fectively visualize expression levels of five to six genes simultaneously in a physical view.(The exact number depends on the spatial distribution of the patterns.) Mapping an evenlarger number of genes to color will be one of the challenges arising from the increasingnumber of genes. By integrating automated data analysis methods, such as clustering anddedicated dimension reduction techniques into PCX, we hope to address the arising needto examine the expression of several hundred genes.
Acknowledgment
This work was supported by the National Institutes of Health through grant GM70444, by the National Science
Foundation through award ACI 9624034 (CAREER Award) as part of the Large Scientific and Software Data
Set Visualization (LSSDSV) program under contract ACI 9982251, by the LBNL Laboratory Directed Research
Development (LDRD) program; and by a large Information Technology Research (ITR) grant. Work at Lawrence
Berkeley National Laboratory is conducted under Department of Energy contract DE-AC02-05CH11231 We
thank the members of the Visualization and Computer Graphics Research Group at the Institute for Data Analysis
and Visualization (IDAV) at the University of California, Davis; the members of the BDTNP at the Lawrence
Berkeley National Laboratory (LBNL), the members of the Visualization Group at LBNL, and the International
Research Training Group 1131 at the University of Kaiserslautern.
References
[BDT] BDTNP. http://bdtnp.lbl.gov/Fly-Net/bioimaging.jsp.[BWK00] M. Q. Wang Baldonado, A. Woodruff, and A. Kuchinsky. Guidelines for using multiple
views in information visualization. InAVI ’00: Proceedings of the working conferenceon Advanced visual interfaces, pages 110–119, New York, NY, USA, 2000. ACM Press.
[DGH03] H. Doleisch, M. Gasser, and H. Hauser. Interactive Feature Specification for Fo-cus+Context Visualization of ComplexSimulation Data. In G.-P. Bonneau, S. Hah-mann, and C. D. Hansen, editors,Data Visualization 2003 (Proceedings of the Euro-graphics/IEEE TCVG Symposimon Visualization), 2003.
[FLK+05] C. C. Fowlkes, C. L. Luengo Hendriks, S. V. E. Keranen, M. D. Biggin, D. W. Knowles,D. Sudar, and J. Malik. RegisteringDrosophila embryos at cellular resolution to builda quantitative3d map of gene expression patterns and morphology. InCSB 2005 Work-shop on BioImage Data Minning and Informatics, August 2005.
[FLK+07] C. C. Fowlkes, C. L. Luengo Hendriks, S. V. E. Keranen, G. H. Weber, O. Rubel,M.-Y. Huang, S. Chatoor, L. Simirenko, M. B. Eisen, B. Hamann, D. W. Knowles,M. D. Biggin, and J.Malik. Constructing a quantitative spatio-temporal atlas of geneexpression in Drosophila blastoderm. to appear in: Cell (Accepted January 2008).
[FWR99] Y.-H. Fua, M. O. Ward, and E. A. Rundensteiner. Hierarchical parallel coordinates forexploration of large datasets. InIEEE Visualization 1999, pages 43–50. IEEE ComputerSociety Press, 1999.
[GRW+00] D. L. Gresh, B. E. Rogowitz, R. L. Winslow, D. F. Scollan, and C. K. Yung. WEAVE:A system for visually linking 3-D and statistical visualizations,applied to cardiac sim-ulation and measurement data. In Thomas Ertl, Bernd Hamann, and Amitabh Varsh-ney, editors,Proceedings IEEE Visualization 2000, pages 489–492, Los Alamitos, CA,USA, 2000. IEEE Computer Society Press.
[Hen98] Chris Henze. Feature detection in linked derived spaces. In David Ebert, Holly Rush-meier, and Hans Hagen, editors,Proceedings IEEE Visualization ’98, pages 87–94, LosAlamitos, CA, USA, 1998. IEEE Computer Society Press.
[HLD02] Helwig Hauser, Florian Ledermann, and Helmut Doleisch. Angular Brushing of Ex-tended Parallel Coordinates. InIEEE Symposium on Information Visualization (Info-Vis’02), pages 127–130. IEEE Computer Society Press, 2002.
[Ins84] Alfred Inselberg. Parallel Coordinates for Multidimensional Displays. InSpatial In-formation Technologies for Remote Sensing Today and Tomorrow, The Ninth William T.Pecora Memorial Remote Sensing Symposium, pages 312–324. IEEE Computer SocietyPress, 1984.
[KFL+06] S. V. E. Keranen, C. C. Fowlkes, C. L. Luengo Hendriks, D. Sudar, D. W. Knowles,J. Malik, and M. D. Biggin. Three-Dimensional Morphology and Gene Expressionin the Drosophila blastoderm at Cellular Resolution I: Dynamics.Genome Biology,7(12):R124, 2006.
[KSH04] R. Kosara, G. N. Sahling, and H. Hauser. Linking Scientific and Information Visual-ization with Interactive 3D Scatterplots. InShort Communication Papers Proceedingsof the 12th International Conferencein Central Europe on Computer Graphics, Visual-ization, and Computer Vision (WSCG), pages 133–140, 2004.
[Law92] P. A. Lawrence. The Making of a Fly: The Genetics of Animal Design. BlackwellPublishing, Inc., 1992.
[LKF+06] C. L. Luengo Hendriks, S. V. E. Keranen, C. C. Fowlkes, L. Simirenko, G. H. Weber,A. H. DePace, C. Henriquez, D. W. Kaszuba, B. Hamann, M.l B. Eisen, J. Malik,D. Sudar, M. D. Biggin, and D. W. Knowles. Three-Dimensional Morphology and GeneExpression in the Drosophila blastoderm at Cellular Resolution I: Data AcquisitionPipeline.Genome Biology, 7(12):R123, 2006.
[PKH04] H. Piringer, R. Kosara, and H. Hauser. Interactive Focus+Context Visualization withLinked 2D/3D Scatterplots. InProceedings of the Second International Conference onCoordinated & Multiple Views in Exploratory Visualization (CMV’04), pages 49–60,Washington, DC, USA, 2004. IEEE Computer Society.
[RWK+06] O. Rubel, G. H. Weber, S. V. E. Keranen, C. C. Fowlkes, C. L. Luengo Hendriks,L. Simirenko, N. Y. Shah, M. B. Eisen, M. D. Biggin, H. Hagen, J. D. Sudar, J. Malik,D. W. Knowles, and B. Hamann. PointCloudXplore: Visual analysis of 3D gene ex-pression data using physical views and parallel coordinates. In B. Sousa Santos, T. Ertl,and K.I Joy, editors,Data Visualization 2006 (Proceedings of EuroVis 2006), pages203–210, Aire-la-Ville, Switzerland, 2006.
[Weg90] Edward J. Wegman. Hyperdimensional Data Analysis Using Parallel Coordinates.Journal of the American Statistical Association, 85(411):664–675, September 1990.
[WL97] Edward J. Wegman and Qiang Luo. High dimensional clustering using parallel coordi-nates and the grand tour.Computing Science and Statistics, 28:361–368, 1997.
[WRH+07] G. H. Weber, O. Rubel, M.-Y. Huang, A. H. DePace, C. C. Fowlkes, S. V. E. Keranen,C. L. Luengo Hendriks, H. Hagen, D. W. Knowles, J. Malik, M. D. Biggin, andB. Hamann. Visual Exploration of Three-dimensional Gene Expression Using Phys-ical Views and Linked Abstract Views.Accepted for Publication in IEEE Transactionson Computational Biology and Bioinformatics, 2007.
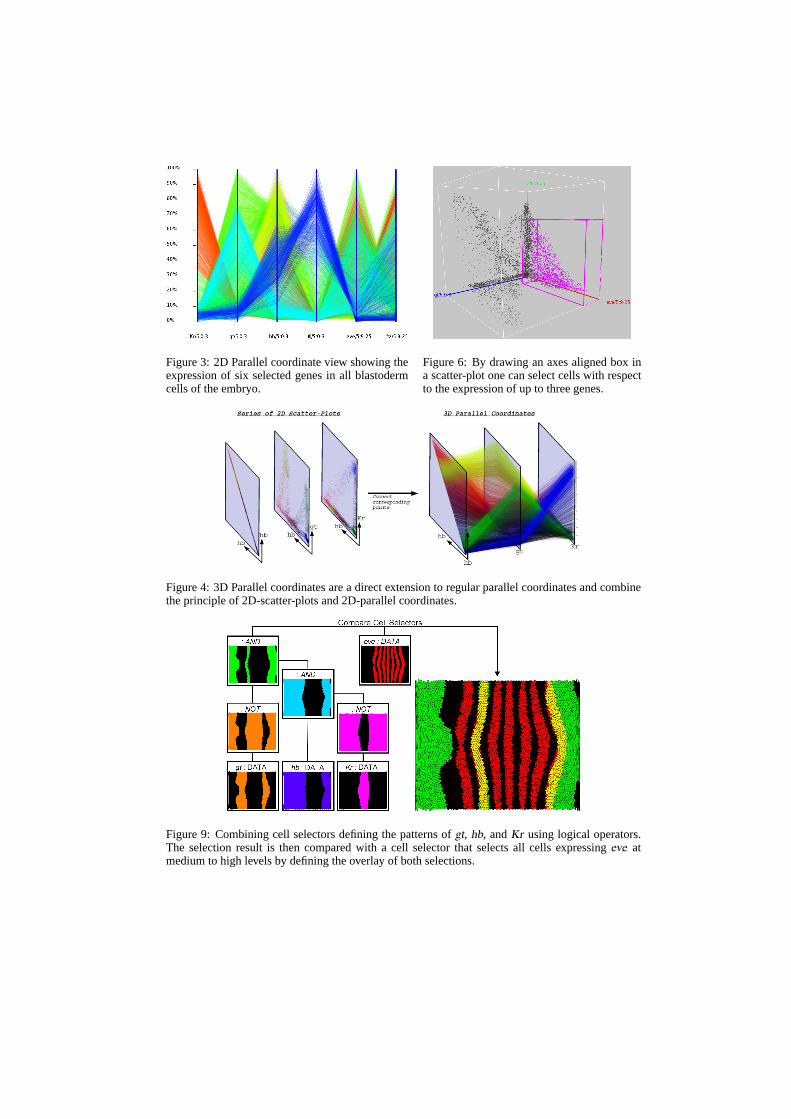
Figure 3: 2D Parallel coordinate view showing theexpression of six selected genes in all blastodermcells of the embryo.
Figure 6: By drawing an axes aligned box ina scatter-plot one can select cells with respectto the expression of up to three genes.
Figure 4: 3D Parallel coordinates are a direct extension to regular parallel coordinates and combinethe principle of 2D-scatter-plots and 2D-parallel coordinates.
Figure 9: Combining cell selectors defining the patterns ofgt, hb, andKr using logical operators.The selection result is then compared with a cell selector that selects all cells expressingeve atmedium to high levels by defining the overlay of both selections.