Embed Size (px)
Citation preview
Water Redeterminations 2020
Choosing a point estimate for the Cost of Capital –Working Paper

© Crown copyright 2021
You may reuse this information (not including logos) free of charge in any format or medium, under the terms of the Open Government Licence.
To view this licence, visit www.nationalarchives.gov.uk/doc/open-government-licence/ or write to the Information Policy Team, The National Archives, Kew, London TW9 4DU, or email: [email protected].
1
Contents 1. Introduction and Executive Summary ..................................................................... 2
2. A background to determining a point estimate for the WACC ................................ 2
Relevant considerations when setting the point estimate for the WACC ............. 7 3. The CMA’s approach in the PFs............................................................................. 8
3. Is there evidence to aim up in the case of water to promote investment? ............ 11
Parties Views ..................................................................................................... 12 CMA Analysis .................................................................................................... 13
4. Asymmetry in the choice of parameters ......................................................... 19
5. Balance of risk in the package ............................................................................. 24
6. Cross-checks on the level of the WACC, after aiming up ..................................... 26
7. Overall assessment of a point estimate for the cost of capital .............................. 30
Updated choice of a point estimate ....................................................................... 34
2
1. Introduction and Executive Summary
1. In the Provisional Findings (PFs), we provisionally decided to choose an
estimate for the cost of equity from the upper end of the range. This paper sets out our further consideration of this matter, taking into account the responses to the PFs and evidence from the hearings.
2. The paper provides our updated assessment both of the relevant factors to take into account when setting a point estimate, and of the potential consequences for the cost of capital. It should be read alongside our update paper on the cost of debt, which describes how we propose to set a point estimate for the cost of debt.
3. Our updated view is that we should in our Final Determinations take the following approach:
• we will use the approach described in the cost of debt paper to determine a point estimate for the cost of debt;
• we will determine a range for the cost of equity following the PFs approach, updated to reflect, where appropriate, responses to PFs;
• we will set a point estimate for the cost of equity at around 0.25% above the mid-point of that range, subject to our financeability analysis.
2. A background to determining a point estimate for the WACC
4. There is a history of setting the cost of capital by using a range, and then setting the point estimate from the top half of that range, both in the UK and internationally. An approach of picking a point estimate higher than the midpoint was used in previous determinations by each of Ofwat, Ofgem and the CC/CMA. In the PFs, we used a higher than mid-point estimate for the cost of equity, and one of the supporting arguments was that there were benefits to consistency, including ensuring investor confidence in the sector.
3
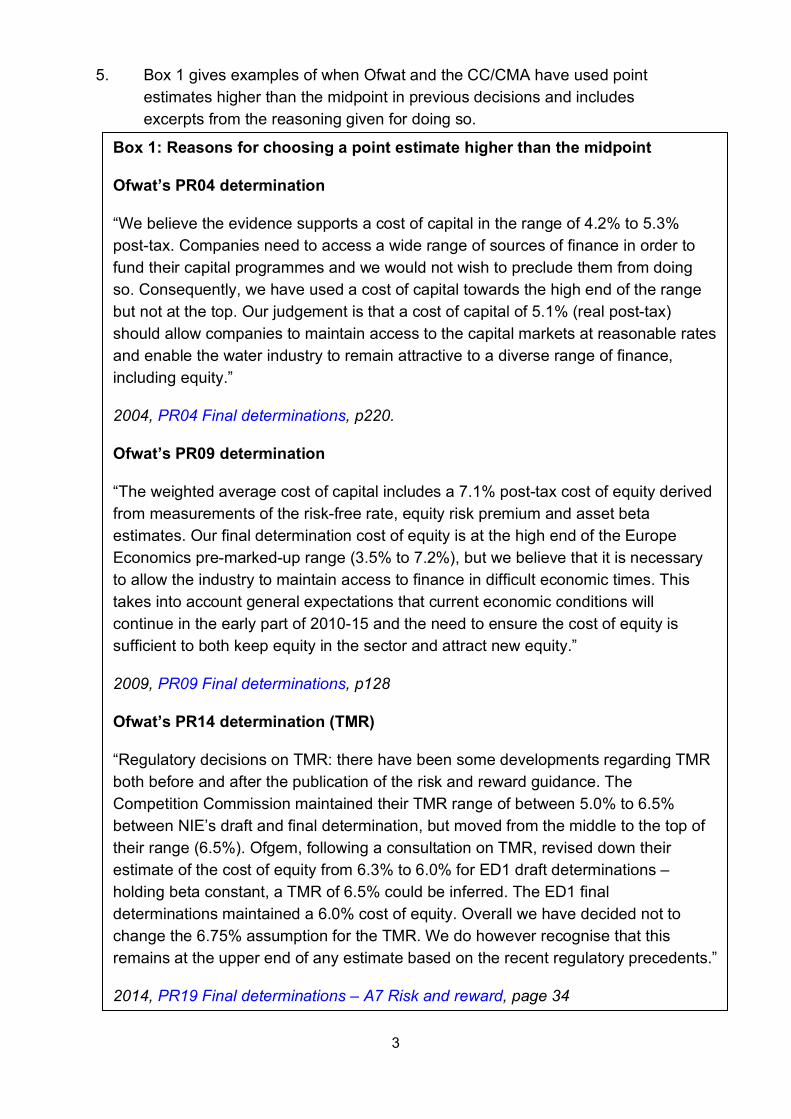
5. Box 1 gives examples of when Ofwat and the CC/CMA have used point estimates higher than the midpoint in previous decisions and includes excerpts from the reasoning given for doing so.
Box 1: Reasons for choosing a point estimate higher than the midpoint
Ofwat’s PR04 determination
“We believe the evidence supports a cost of capital in the range of 4.2% to 5.3% post-tax. Companies need to access a wide range of sources of finance in order to fund their capital programmes and we would not wish to preclude them from doing so. Consequently, we have used a cost of capital towards the high end of the range but not at the top. Our judgement is that a cost of capital of 5.1% (real post-tax) should allow companies to maintain access to the capital markets at reasonable rates and enable the water industry to remain attractive to a diverse range of finance, including equity.”
2004, PR04 Final determinations, p220.
Ofwat’s PR09 determination
“The weighted average cost of capital includes a 7.1% post-tax cost of equity derived from measurements of the risk-free rate, equity risk premium and asset beta estimates. Our final determination cost of equity is at the high end of the Europe Economics pre-marked-up range (3.5% to 7.2%), but we believe that it is necessary to allow the industry to maintain access to finance in difficult economic times. This takes into account general expectations that current economic conditions will continue in the early part of 2010-15 and the need to ensure the cost of equity is sufficient to both keep equity in the sector and attract new equity.”
2009, PR09 Final determinations, p128
Ofwat’s PR14 determination (TMR)
“Regulatory decisions on TMR: there have been some developments regarding TMR both before and after the publication of the risk and reward guidance. The Competition Commission maintained their TMR range of between 5.0% to 6.5% between NIE’s draft and final determination, but moved from the middle to the top of their range (6.5%). Ofgem, following a consultation on TMR, revised down their estimate of the cost of equity from 6.3% to 6.0% for ED1 draft determinations – holding beta constant, a TMR of 6.5% could be inferred. The ED1 final determinations maintained a 6.0% cost of equity. Overall we have decided not to change the 6.75% assumption for the TMR. We do however recognise that this remains at the upper end of any estimate based on the recent regulatory precedents.”
2014, PR19 Final determinations – A7 Risk and reward, page 34
4
CMA NIE determination in 2014 – the last full CMA redetermination
“We consider that the lower bound of 5 per cent for the expected return on the market was less well supported than the upper end of the range of 6.5 per cent. We consider that the weight of evidence tended to support numbers between 5.5 and 6.5 per cent for the expected market return. While we decided to retain 5 per cent as a possibility, we were less confident with this estimate and, as a corollary, with numbers at the low end of the WACC range.
Additionally we noted that the inflation assumption that we adopted in computing the cost of debt, based on OBR forecast inflation, was higher than indicated by some market-based forecasts. (See paragraph 13.24) While we considered that our use of the OBR forecast was reasonable and consistent with its use in other aspects of the price control, we acknowledge that the OBR estimate may be towards the upper end of the range. Given that a lower inflation forecast would tend to increase the real cost of debt and thus the WACC, we consider that this supports the choice of a number towards the upper end of the WACC range.
Bearing in mind the available evidence and other aspects of our final determination (see Section 17), we adopted the upper end of this range, 4.1 per cent, as the WACC for RP5.”
2014, NIE Final determination, paragraphs 13.187-13.189
6. We also note that, while the UKRN report from 20181 focussed on the cost of equity, the report explicitly identified reasoning for choosing a point estimate at a higher percentile than the 50th percentile in the range where the benefits of promoting efficient investment outweighed the costs. The authors did not identify any specific measures for determining the point estimate but provided a framework for calculating the point estimate. The views in the UKRN report can be summarised as that there is a case for a higher cost of equity where appropriate to promote investment, but this is more limited than indicated in a number of past regulatory decisions in the UK. This is, in their view, in part because the case is limited further by the extent to which regulators are able
1 Wright, Burns, Mason and Pickford (2018), Estimating the cost of capital for implementation of price controls by UK Regulators
5
to incentivise investment through means other than setting the regulatory allowed return (RAR).2
7. A summary given in the UKRN report of the approach to assessing the case for aiming up is:3
“… if the regulator was only interested in incentivising new investment, for a range of different assumptions on the nature of demand for the regulated good, the RAR would be set at a value such that the regulatory expected return (RER)4 was above the 90th percentile of the regulator’s range of estimates of the true WACC. However, it also argues that for sunk investment future financeability simply requires that existing capital earns the expected WACC— of which our best estimate is the midpoint of the range. So the target value of the RER should reflect the balance between new and sunk investment.”
Two of the UKRN report authors (Wright and Mason) have indicated in response to the PFs that they do not support the CMA’s approach in this case, as discussed in paragraph 89 below.
8. In the recent round of price reviews, there is less direct evidence of regulators selecting a wide range and then deciding where in that range to choose the point estimate, in other words, whether to choose the midpoint or, as per the examples above, a point estimate in the top half of the range. Both Ofwat’s PR19 cost of capital assessment and the CAA approach which we reviewed in NATS do not appear to comment on the question of where within the estimated range to set the WACC or cost of equity, focussing on identifying a suitable point estimate.5 Although there is no explicit reasoning provided, we note the following background to the Ofwat and CAA decisions:
• First, as suggested by Ofwat, that there has been extensive evidence from market prices of publicly traded shares and private transactions, commonly described as Market Asset Ratios (MARs). Ofwat said that these trading prices indicate that actual returns through the cost of capital allowance are at least as high, and likely to be higher than required by investors, including following Ofwat’s announcement of its cost of capital.6
2 The regulatory allowed return (RAR) is described by the UKRN report authors as corresponding to what has in the past typically been referred to as the “allowed WACC”. The RAR is described as the return on the regulatory asset base before allowing for the impact of outperformance or underperformance on cost or service level. 3 Wright, Burns, Mason and Pickford (2018), Estimating the cost of capital for implementation of price controls by UK Regulators, p72 4 RER is the regulatory expected return. It is defined by the authors as the regulatory allowed return (RAR) “plus any expected increase to returns, mostly arising from outperforming the cost and service targets set by the regulator”. 5 Ofwat (2019) PR19 final determination: Allowed return on capital technical appendix, section 1.1 6 Ofwat’s response to the provisional findings – risk and return, paragraphs 2.8-2.11
6
We noted the evidence from MARs in our PFs, but we concluded it was not sufficient to counteract the arguments for aiming up, for reasons discussed below.
• Second, that the level of detail associated with the calculation of the individual parameters comprising the estimation of the regulatory allowed WACC, combined with experience over multiple price control calculations, should mean, other things being equal, that there is greater confidence over time that the level of the cost of capital has not been set too low; and
• Third, that following multiple periods of what appear to have been strong returns to investors, there is greater confidence in the regime and less need to ‘aim up’ with the broad aim of providing reassurance to investors. In the context of perceived high returns to investors, external reviews of regulators’ performance including by NAO7 and Citizens’ Advice8 have put more pressure on the regulators to ensure value for money when setting the cost of capital. At the same time, we note that the NAO identified that Ofwat had set the cost of equity at PR09 towards the top of the range, and does not appear to have raised concerns about this: its concerns were about the approaches to debt, inflation and taxation, all of which had led to windfall gains for the companies.
9. The decision on the point estimate can take one of two forms:
a) At the overall level of the cost of capital (or overall cost of equity and/or debt allowances); or
b) At the individual metric level.
10. Both approaches have the same impact on companies and customers in that they move the cost of capital allowance away from the midpoint estimate of allowed return.
11. New Zealand energy regulation contains one of the clearest examples of explicitly adjusting the overall WACC outcome (rather than the individual metrics). The New Zealand Commerce Commission (NZCC) follows a policy of setting regulatory price controls in energy based on the 67th percentile of the WACC range. The NZCC suggest that it is appropriate to use a WACC significantly above the mid-point estimate for price-quality path regulation, stating that the potential costs of under-investment from a WACC that is too
7 National Audit Office (2015) The economic regulation of the water sector 8 Citizens Advice (2019) Monopoly Money: How consumers overpaid by billions
7
low are likely to outweigh the harm to consumers (including any over investment) arising from a WACC that is too high.9
12. NZCC states that the main reason to set a WACC percentile above the mid-point is to mitigate against the risk of under-investment relating to service quality generally, and of under-investment contributing to major supply outages in particular. However, compared to setting the WACC at the mid-point, a WACC uplift should also reduce the risk of under-investment in other types of investment as well.
13. NZCC also notes that overseas regulators often exercise judgement by adopting a WACC above the mid-point of the range, sometimes by using estimates of individual parameters which are generous in favour of suppliers.10
14. We note that the New Zealand example pertains to energy rather than the water sector. Water and sanitation remain public services in New Zealand, so there are no comparable water price controls using the 67th percentile approach. The UKRN report also noted the New Zealand example, and did not identify any other practical examples where regulators had sought to measure the right level in a range using an analytical framework, rather than using judgment to determine the right level.
Relevant considerations when setting the point estimate for the WACC
15. The key considerations for the CMA in setting a point estimate for the WACC are:
a) The financing duty: the cost of capital needs to be sufficient for an efficient firm to finance the performance of their statutory functions;
b) The consumer objective: the protection of consumers
9 In the UK, Dobbs’ 2011 paper ‘Modeling welfare loss asymmetries arising from uncertainty in the regulatory cost of finance’ forms the foundation for much of the customer harm debate. Dobbs concludes that there are two reasons for setting the appropriate allowed rate of return (AROR) above the mean value of the WACC distribution– firstly, because the value that maximizes economic welfare generally lies to the right of the mean of the WACC distribution – and secondly, because expected economic welfare is an asymmetric function; given the precise value of the optimal AROR is uncertain, for each percentage point the AROR is inadvertently set above the optimum, the welfare loss is less than that which arises from setting it an equal number of percentage points too low. It follows that the allowed rate of return on new investments should generally be set at a significantly higher percentile value of the WACC distribution – that is, at percentile values in the high 80s or 90s. Where the AROR is likely to be applied to business which involves a mix of both new and old assets, the proportions of sunk vis a vis new investment potential within the RRP will naturally influence the extent of uplift in the optimal choice of AROR compared to the WACC mean. However, the asymmetry in the welfare function for new investment (vis a vis that for sunk investment) is so strong that even if the proportions of potential new investment are quite small, this can still induce a significant uplift in the optimal choice for the AROR compared to the WACC mean. 10 Commerce Commission New Zealand, (2014), Amendment to the WACC percentile for price-quality regulation for electricity lines services and gas pipeline services, paragraphs X17-X20
8
c) The resilience objective: if significant investment is required in resilience, the cost of capital needs to be sufficient to provide incentives to the firms to meet those investment requirements
16. In balancing these considerations, the CMA must determine what level of cost of capital is sufficient to achieve the benefits associated with the financing and resilience duties without being over-generous (and therefore potentially conflicting with the consumer objective which may be better served by a lower cost of capital resulting in lower bills).
17. In the PFs, we explained the benefits that would be achieved from setting a point estimate for the cost of equity above the mid-point and concluded that these benefits would more than outweigh the costs to consumers. In this working paper, we have expanded our analysis of both the benefits and the costs to address comments made by the Parties and third parties on the PFs.
3. The CMA’s approach in the PFs
18. In the PFs11, for reasons described at 9.667-9.673 we decided to set a point estimate above the midpoint of the range for the WACC:
a) We applied a cost of equity of 50bp higher than the midpoint, equal to 0.2% on WACC. We said that this was halfway between the midpoint and the upper end of the range for the cost of equity, ie. the 75th percentile of the range for the cost of equity;
b) We offset this by choosing the lower end of the range for the cost of debt, equal to 0.1% of WACC;
c) We therefore said that we set an allowance at the 58th percentile, implying ‘aiming up’ of 0.1%
19. In response, Ofwat, Ofgem and Citizens Advice all separated out the question of the level of the cost of debt, where they said that the lower estimate was justified in any case, from the level of the cost of equity, where we had particularly highlighted measurement uncertainty rather than a view that the higher point estimate represented a more accurate assessment of the cost of equity.
11 CMA Provisional findings.
9
20. In the Final Determination we are likely to change our approach to measuring the costs of debt. Our updated thinking on cost of debt is set out in the accompanying paper published at the same time. In this paper we focus on the choice of a point estimate for the cost of equity.
Background – parameter uncertainty
21. The aim of any cost of capital determination is to set a point estimate for the cost of capital, which is then translated directly into returns for investors. We consider that the best approach to doing so is to use the capital asset pricing model (CAPM). but note that use of this model comes with parameter uncertainty. The CAPM cost of equity is not directly measurable and the parameters are subject to both theoretical debate and statistical uncertainty.
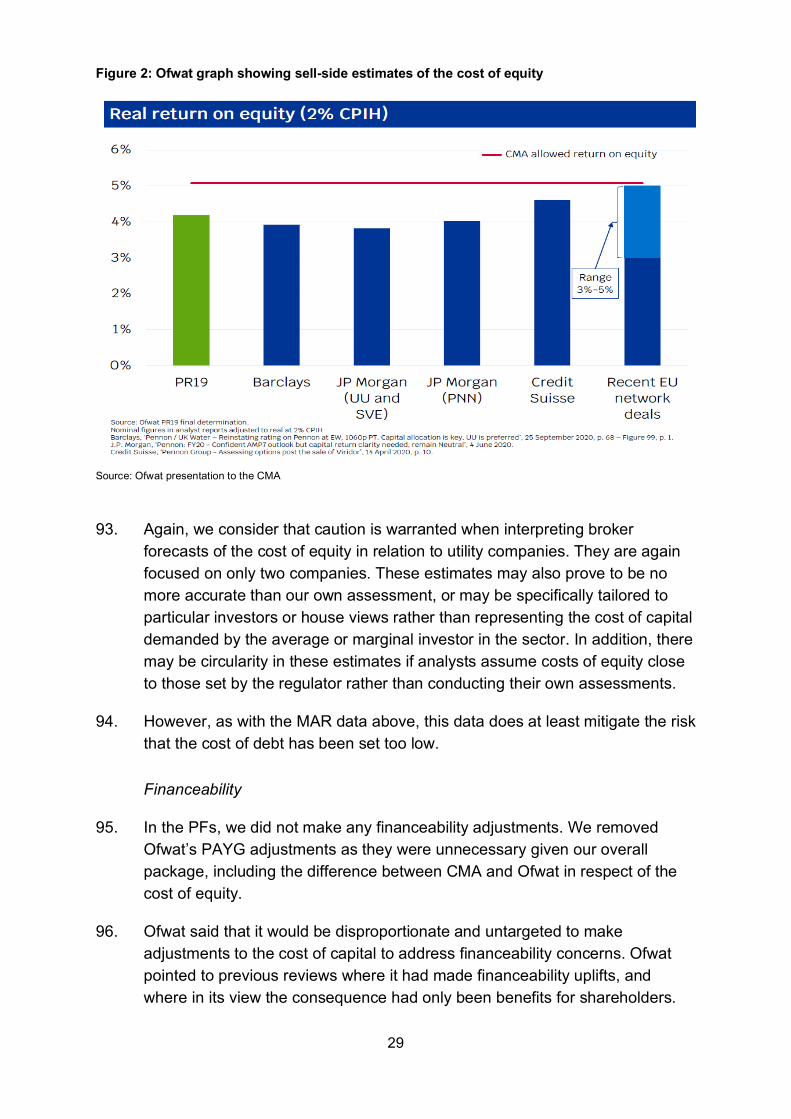
22. We followed the approach of all previous CMA redeterminations of recognising this parameter uncertainty by selecting a range for the key parameters. In the PFs we proposed the following reasons for choosing a point estimate from the upper end of that range:
a) To promote long-term investment in the water sector, and address the risk of an exit of capital if the cost of equity is set too low; (9.667)
b) To reflect structural asymmetry in the overall determination, specifically around the definition of ODIs; (9.671) and
c) To take into account a cross-check on financeability ratios. (9.673)
23. We decided not to give weight to:
a) The need to promote investment directly in the current price control period; (9.666) and
b) Other cross-checks on the WACC, including market asset ratios, where we identified that there were conflicting views in submissions to the investigation.
24. In response to PFs, respondents gave their views on the points above and also some additional points on symmetry. We discuss the points below in the individual sections on each area.
25. Ofwat also made a background point that we had not undertaken a cost-benefits analysis of our decision to set the cost of equity 50bp higher than the midpoint. Ofwat quantified the impact of the CMA’s aiming up approach as equivalent to £1.9 billion across AMP7 if applied across the sector. Ofwat said that any benefits from doing so have not been demonstrated, and in any case
10
that any positive impact has not been shown to be enough to outweigh this cost.12
26. On this specific point, we disagree with Ofwat’s assessment of the implied sector-level cost of the CMA’s decision to aim away from the midpoint of the range. Specifically, we note that:
a) in isolation, the cost of equity was set 50bps above the midpoint. As equity represents 40% of the total capital of the notional company structure on which the WACC is set, this represents an uplift to the WACC of 20bps. Assuming a March 2020 industry RCV of approximately £77.5bn13, this would equate to roughly £150m a year or £755m over the life of the price control. Given expected RCV growth over the 2020-2025, the total impact would equate to around £800m; and
b) as the cost of debt point estimate was below the midpoint, the CMA’s point estimate of total WACC was only 10bps higher than the midpoint suggested by the calculated ranges. On this basis, the increase in costs as the result of aiming (if applied to the entire sector) would have been approximately £76m annually or £378m across the price control based on RCV values at the start of the price control period. As above, after RCV growth the figure would be closer to £400m over the period.
27. Our assessment in the PFs was on the basis that the benefits as summarised in paragraph 22 above were sufficient to offset the costs to consumers. There is a risk of setting the cost of capital too low, and this creates costs to consumers both through its effects on the financial resilience of the companies, and through its effects on longer-term financing costs. Our reading of Ofwat’s response is that it does not agree with our analysis of the benefits of setting a higher cost of equity. We review the different elements of Ofwat’s response to our analysis of these benefits below.
28. We also note that Ofwat’s and Citizens Advice’s analysis does not fully reflect the effect of our provisional approach regarding the cost of capital on bills. We provisionally concluded that the change to the cost of equity supported financeability and meant that the PAYG adjustments made by Ofwat were unnecessary. Taking the two adjustments together, bills using our PF approach to the cost of capital would actually have been lower for some customers than under Ofwat’s approach, and the net effect across the sector
12 Ofwat’s response to the provisional findings – risk and return, paragraph 3.12 13 Based on Ofwat’s March 2020 RCV of £77.479bn referenced in its Regulator capital values 2020 data. We note that Ofwat’s analysis would roughly correspond to the total difference in WACC at the PFs (3.50%) and Ofwat’s PF19 FD (2.96%) – however, this difference would incorporate both the ‘aiming’ impact discussed above and broader differences in estimated WACC parameters.
11
of our PF approach would have been much smaller than implied by Ofwat’s calculations. Whilst it is possible that Ofwat’s approach to PAYG adjustments could be fully reversed in future periods, we have not seen any analysis that suggests that this can be assumed with confidence.
29. Ofwat and Ofgem also highlighted the level of the cost of equity used in financing infrastructure in other countries as a relevant benchmark when considering incentives for investors to put new capital into the sector.14 In support, we were told that many of the current and potential water investors are infrastructure capital specialists who will compare the risks and returns available to them in the UK water sector with those available to them from investments elsewhere.
30. Whilst it is feasible that some level of international comparisons could be included in the cross-checks to be made when testing whether an appropriate cost of capital has been set, we were not persuaded that the comparisons provided by Ofwat and Ofgem were particularly useful. A number of the comparator levels of return provided were not like-for-like, and in any case the regulatory frameworks are very different. We also noted that some higher comparators were not included in the data. Overall, we do not agree that the international comparisons help in setting the cost of equity for AMP7.
31. In this paper we consider these issues as follows:
a) In section 4, we consider the issues relating to the setting of the cost of capital to promote investment;
b) In section 5, we consider the issues relating to symmetry of returns; and
c) In section 6, we consider the issues relating to cross-checks on the cost of equity.
32. Finally, in section 7 we revisit the implications of the new evidence for the choice of a point estimate of the cost of equity.
3. Is there evidence to aim up in the case of water to promote investment?
33. In this paper we focus particularly on the question of whether there is evidence to aim up to promote investment. This was the first of three reasons stated in the PFs.
14 Ofgem’s response to the provisional findings, paragraph 10 including Figure 1. Ofwat’s response to the provisional findings – risk and return, paragraphs 2.16 – 2.17, including Figure 2.4
12
Parties Views
Ofwat
34. Ofwat made the broadest submissions15 on aiming up to promote investment in response to the PFs. It also provided evidence from its supporting expert advisers. Ofwat made two complementary arguments:
a) First, that the CMA has not provided evidence to demonstrate that the benefits of aiming up are sufficient to offset the cost to consumers; and
b) Second, that there are some countervailing adverse effects on incentives for efficient investment which are not reflected in the CMA’s analysis.
35. Ofwat said that there is no benefit in water from providing enhanced incentives for investors to put money into the businesses, either now or over the longer term. Ofwat said that there are clear mechanisms to encourage investment within the price control process, and that there is limited or no evidence that companies will do more if it sets a higher cost of capital.16
36. In support of this, Ofwat commissioned a report from Brian Williamson, a telecoms consultant. Williamson summarised the relevant consideration for using a higher cost of capital to promote investment as follows:17
“To promote investment where the consumer and social costs of more versus less investment are asymmetric, for example where insufficient investment might involve insufficient supply leading to shortages or significant environmental harm. In this case aiming up is one way of compensating for the asymmetry of consequences of not investing.”
37. In Williamson’s view, the reasons for aiming up on this basis in the water sector are insufficient because:
a) There is extensive external scrutiny of water investments, by the Environment Agency as well as Ofwat and others;
b) In the current period, this suggests that investment is optimal, and anything that results in a WACC above the expected level will result in over-investment;
15 Ofwat’s response to the provisional findings – risk and return, Section 3 16 Ofwat’s response to the provisional findings – risk and return, paragraph 3.11 17 Williamson (2020), Aiming up on the WACC and prices: the welfare and incentive impacts for the water industry
13
c) Beyond the current period, or even in the case of a significant shock during the current period, there are existing levers which could be triggered to promote investment;
d) Whilst there is a theoretical risk that setting the WACC estimate too low could lead to a collapse in investment involving asymmetric welfare costs, in practice this seems most unlikely, given existing approaches to estimation of the WACC and aiming straight in setting price controls.
38. Ofwat made an additional point relating to the additional risk that can arise if the cost of capital is set too high. A high return on existing assets may result in a premium for current shareholders, if it is expected to continue over multiple periods. If current shareholders sell out to a new investor on that basis, then the new investor gets no benefit from the aiming up, as it has been reflected in the asset price, and also faces the additional risk that the level of aiming up changes over time. In other words, a higher cost of capital in AMP7 is less likely to have a benefit in terms of attracting new investors to acquire stakes in the companies, although it provides incentives for existing investors to put in new equity or forego dividends and grow the RCV.
Disputing companies
39. The companies’ primary submissions were that the CMA had not aimed up in practice, based on breaking down the parameter estimates. Otherwise the companies agreed with the proposed approach of aiming up on the cost of equity. Anglian made reference to the Department for Environment, Food and Rural Affairs (Defra)’s strategic policy statement (SPS), which it considered requires us to “sustain long term investor confidence in the sector with the aim of protecting customer interest”.18
CMA Analysis
40. In our PFs we included in our reasons for the choice of point estimate for the cost of capital the risk of an exit of capital if the cost of capital were set too low. In this section, we consider two potential mechanisms where a higher cost of capital could affect the level of investment and bring benefits to customers.
a) The first is that investors will be unwilling to put money in to deliver specific and large new investments which will provide benefits to
18 Anglian’s response to the provisional findings, paragraph 381
14
customers but require extra capital, for example as occurred with the construction of the Thames Tideway; and
b) The second is to address the risk of a move towards a low-investment environment, with investors seeking to remove capital and shrink rather than grow or maintain the RCV;
41. Much of Ofwat’s response on promoting investment focussed on the first point, which is more comparable to the mechanism described in the UKRN report and we start with this point.
Identifying a mechanism for the effect of the point estimate on future investment levels
42. The argument for aiming up to ensure capital availability for future investments is as follows:
a) That there is substantial uncertainty over the level of the WACC, as recognised in the estimated ranges around the cost of equity;19
b) That there is also uncertainty around the optimal level of investment that may be required, now and in the future, but with a material probability that companies will need to design and invest in an enhanced capital programme in the coming periods, in particular to meet the challenges raised by climate change;
c) That if investors do not expect to be fully compensated for future investments over their life, then they may be unwilling to invest in the future to meet these requirements, with two possible scenarios with an adverse effect on consumers:
(i) That investors choose to exit the sector or are unwilling to put in further capital at the allowed WACC, resulting in a higher cost of capital from new investors who are willing to put money into the sector, or a need to pay a premium in future price controls; or
(ii) That the wider social benefits of investment are lost, either because companies do not identify investments or put resources into planning for them, or because the finance to deliver those investments is unavailable.
19 For example, the CMA’s PF (CPIH real) range for the cost of equity was 3.56 to 5.60%, a high-low spread of 2.04%. By comparison, Ofwat’s risk and reward guidance for PR14 suggested a (RPI real) cost of equity range of 4.9% to 5.7% (a spread of 0.8%), while the PR19 final methodology included an (RPI real) cost of equity range of 3.41% to 4.69% (a spread of 1.28%).
15
43. The majority of submissions from Ofwat and its advisors appear to focus on (ii) above. This appears to be the scenario which Brian Williamson describes as “most unlikely”, and which Ofwat and Brian Williamson flag as being addressed by the existence of processes designed to incentivise long-term water planning, and authorities able to secure they take place, such as the EA.
44. They stress the difference between the risks associated with lack of investment in the water sector and other sectors like the energy sector, pointing to a lack of similar societal risks arising from extreme adverse events, like those associated with ‘blackouts’ and other extreme events in the energy sector.20
45. They argue there is more limited evidence that this is an important concern in water in the UK, where the network is enhanced incrementally over time consistent with long-term plans developed following wide stakeholder consultation. Major ‘one-off’ projects are rare, the technology is well understood, and there are 17 companies designing and sharing best practice. The wider obligations imposed by the government and regulators on the sector to develop long-term investment plans should create sufficient incentives to maintain and improve services without an additional financial incentive through an adjustment to the cost of capital. There are alternative mechanisms to ensure that investment is maintained with a lower cost to consumers, such as:
a) Making adjustments to price controls and/or performance commitments to ensure long-term resilience and provide incentives to deliver the investment required; or
b) Changes to the wider framework for promoting resilience, including the statutory obligations on the water companies, and the WRMP and WINEP processes.
46. We recognise that if the cost of capital is set too low, this may only have a limited effect on investment in the short term. This is why we provisionally concluded that there would not be a link between the WACC in AMP7 and previously agreed investment in AMP7.21 However, the cost of capital today may have a knock-on impact on investment planning during AMP7 that will be actioned (or not) in subsequent price controls. As discussed in the next section, expectations of insufficient investment returns based on the current
20 Commerce Commission New Zealand, (2014), Amendment to the WACC percentile for price-quality regulation for electricity lines services and gas pipeline services, paragraph 5.63 21 Provisional findings report, paragraph 9.666.
16
cost of capital may discourage companies from identifying and proposing otherwise desirable investment projects. If overall water asset health deteriorates as a result, this may lead to higher required investment (and so higher investor returns) in future periods. In this way, the current cost of capital can have a direct impact on the level of future investment and the future costs to customers.
47. We also agree that the existence of the long-term planning mechanisms designed to address the risk of under-investment will mitigate some of the risks to resilience of the networks. The risks associated with water are different to energy, and there is no direct comparator to the cost of ‘blackouts’. However, water is an essential service and there are long-term risks to water customers (and the environment) associated with the performance of deteriorating or inadequate water infrastructure. The nature of water infrastructure means that there are additional challenges in measuring water asset health effectively. We therefore do not agree that long-term planning mechanisms address these risks entirely, as is suggested by Ofwat’s submissions. We consider this further in the next section
Risk of an exit of capital over time from the sector
48. Potentially more important than the risk of under-investment in specified projects or areas of network resilience is that a low WACC over multiple periods will lead to an opex bias and a gradual reduction in investment, with limited RCV growth. The mechanism by which a cost of capital set too low could have adverse effects would be:
a) Investors have a choice of options in where to invest their capital;
b) Where the cost of capital is low, the preference will be to withdraw capital rather than to increase the level of invested capital over time. This might be achieved, for example, through a high dividend pay-out policy;
c) In water, there is likely to be some flexibility around the balance between capex and opex, and the sector as a whole will prefer solutions requiring less investment when returns are assumed to be low;
d) New investments can often bring wider benefits to customers and society, particularly during a period of change, such as is expected with climate change over the coming periods;
e) Therefore, there will be a risk associated with the cost of capital being too low over time that there will be foregone benefits.
17
49. The effects on customers if there is an actual reduction in investment over time are likely to be higher, because investment can bring additional wider benefits. For example, if a low cost of capital environment resulted in a lower level of investment in climate change resilience over time across the sector, and more of a focus on existing assets, then the lost benefits would include the broader externalities associated with the foregone investment.
50. On the other hand, this effect could be symmetric as highlighted in Brian Williamson’s submissions. In other words, a higher cost of capital could lead to over-investment and customers may pay for investments which do not bring sufficient benefits and therefore destroy value. This applies where the wider benefits (or positive externalities) from more capital investment are assumed to be small, and accordingly any diversion from the actual cost of capital will destroy value for customers.
51. As with much of the analysis of the level of the point estimate, this indicates that regulators, including the CMA in this determination, are making a series of complex and difficult value judgements when making a decision on a single parameter. It is not practical to estimate the extent of bias between new investment and exploitation of current assets from a small adjustment in the cost of capital. Nor is it practical to measure the size of externalities. However, these externalities do not have to be large to justify a small difference in the WACC of, say, 0.1%, if that is expected over time to result in more investment.
52. We understand from Ofwat’s submissions that it concludes there are a number of reasons why this scenario is not realistic. The processes for identifying investments and the balance of capital and operating costs are extensive and involve the companies, their customers and multiple regulatory bodies. Ofwat has put in place totex regulation for the purpose of addressing the risk of distortion between one form of spend and another and has signalled this is expected to continue over multiple periods.
53. However, it is our view that there is also some flexibility for the companies, and it is not realistic to expect that the regulator can perfectly measure the balance between capital investment and managing the existing assets. More specifically, while a resource constrained regulator may be effective in conducting cost-benefit analysis of a project explicitly proposed in a company business plan, it is unlikely that such a regulator would have sufficient resources or location-specific knowledge in order to consistently identify where projects should be included in business plans, but have been excluded due to a perception of insufficient returns. Given the expected scale of investment needed to address climate change, there can be expected to be a
18
long-term benefit where the expected returns are sufficient to provide incentives to identify investments over time.
54. We agree that this is a matter of judgement, and the benefits cannot be accurately measured. However, the current context of a sharp reduction in the cost of equity at the same time as a growth in investment points to a need to proactively address the risks associated with setting the cost of capital too low. On balance, while we agree that the size of the effect may be modest in the context of the longer-term plans for the sector, we also acknowledge that there are some benefits from a more cautious approach to setting the point estimate of the cost of capital.
55. The UKRN paper which supported aiming up in principle highlighted that in practice the benefits from a higher cost of capital will be optimised if they apply only to new investment.22 We also noted the risk of over-rewarding investment in existing assets in our provisional NATS determination.23 Under Ofwat’s framework, in common with that generally followed by other regulators, there is no way to separate the returns on new and existing assets as the same return is applied to all RCV assets. In practice, undertaking new investments is likely to incur additional risks over managing existing assets if cost targets are set in a way which provides strong efficiency incentives.
56. The use of a single, average cost of capital assumes that these effects will balance out over time, but there is no evidence to show that this will be the case in practice. Another way to address the risk of under-investment in future periods would therefore be through an alternative mechanism to reward investors for the additional risk associated with new investments. We have not considered this in our redetermination, as it would require wider changes to the regulatory framework, and for AMP7 as a standalone period would not change incentives.
Proposed approach to aiming up to promote investment
57. We have reviewed Ofwat and its expert advisers’ submissions on the relevance of the WACC in promoting investment. We agree that there are a wide range of other mechanisms to provide incentives to the companies to invest, and that with perfect foresight the choice of WACC should have only a limited effect on the level of investment. However, as noted by Ofwat, regulatory price controls suffer from unavoidable uncertainty and information asymmetry. We also consider that Ofwat’s approaches do not directly address
22 Wright, Burns, Mason and Pickford (2018), Estimating the cost of capital for implementation of price controls by UK Regulators, p72 23 CMA (2020), NATS (En Route) Plc/CAA Regulatory Appeal - Final Report (NATS/CAA), paragraph 13.296
19
the long-term concerns we raised about an exit of capital from the sector over time, if the cost of capital is set too low. This is potentially important at a time when there has been a sharp decline in returns and there remains significant uncertainty over the measurement of the cost of equity. We consider this as part of our overall assessment in section 8 below.
4. Asymmetry in the choice of parameters
58. Part of our provisional assessment of the reasons for aiming up included our view that, taken in the round, we considered that the overall package was asymmetric, and that there was uncertainty over the level of the cost of capital parameters which meant that there was a risk of setting the cost of capital too low.
59. Although these were different reasons to those in the PFs for the decision on a point estimate, they are linked in that parameter uncertainty was highlighted by respondents to the PFs as an area where asymmetry might also be a relevant consideration when making an overall assessment of the level of the cost of capital.
Background point: is uncertainty relevant to aiming up?
60. As a starting point, Ofwat highlighted that uncertainty over the cost of capital does not in itself require aiming up. As indicated in Ofwat’s response,24 as long as the regulator aims straight on a consistent basis over multiple periods, the expected return over these multiple periods will be equal to the required return. The uncertainty does not in itself mean that the allowed return is insufficient to meet the financing duty, and this was the approach taken in NATS, where we concluded that the midpoint was appropriate.
61. Ofwat’s view assumes that the reasons for the cost of capital being different to the midpoint are ones which will in practice average out over time. For example, it is possible that beta may be higher or lower than indicated by a regression of historical data, and that this will average out over time.
62. Some measures, such as risk-free rate and TMR, are subject to more uncertainty about the right theoretical approach, and in practice different investors may have different required returns that reflect this uncertainty. It is therefore possible that some of the potential reasons that the cost of capital may be too high or low might persist over multiple periods. This can be
24 Ofwat’s response to the provisional findings – risk and return, paragraph 3.14.
20
observed in practice with the approach to risk-free rate and TMR in current determinations both being structurally lower than in past periods.
Parties views – parameter uncertainty
63. Ofwat said that our level was aimed up by more than we had said, as a result of the cost of cost equity estimate ranges being above those suggested by its determination. Ofgem also considered that we had effectively aimed up on the cost of debt.
64. Ofgem also provided some Monte Carlo analysis which indicates that the cost of equity estimate is likely to be normally (or close to normally) distributed and therefore that the 75th percentile will be much closer to the midpoint. Its analysis suggested that 20bp would be sufficient to represent the 75th percentile and that the CMA’s uplift of 51bp was really the 96th percentile.25
65. Northumbrian said that we were at the 47th percentile26, not the 58th. Anglian said that we were around the midpoint.27 Yorkshire said that it would be more appropriate to set the individual parameters at an appropriate level, and in its view, the CMA’s point estimates for each of RFR, TMR and beta were the right point estimates, rather than being high “aimed up” levels.28
66. These points are therefore primarily around the definition of the range for the WACC.
67. There are two contributing factors to these responses.
a) First, whether we have really picked a range which has the ‘most likely’ number as its mid-point. In other words, if we used a range of 6.2%-7.2%, is 6.7% really the most likely point?; and
b) Second, whether there is an equal chance of all points in the range. Ofgem provide some Monte Carlo analysis which indicates that the cost of equity parameters are more likely to be normally distributed and therefore that the 75th percentile will be much closer to the mid-point.
68. While Monte Carlo-type calculations alone may not provide a suitable rationale for picking a point estimate from ranges of non-normally disturbed data, we do acknowledge that this type of analysis may provide useful additional evidence in this area. The approach followed by Ofgem indicates
25 Ofgem’s response to the provisional findings, para 63-69 26 Northumbrian’s response to the provisional findings, paragraph 258 27 Anglian’s response to the provisional findings, paragraph 383 28 Yorkshire’s response to the provisional findings, paragraphs 3.3.17 to 3.3.18
21
that if we are trying to identify the 75th percentile, namely, the level at which the probability that the cost of equity is “too low” is only 25%, then the cost of equity premium should be 20-30bp, rather than the 50bp used in the PFs. This analysis assumes that we were really trying to calculate the 75th percentile, rather than using our judgement on the reasonable level of the cost of equity from a range.
69. We have replicated Ofgem’s analysis and have reached broadly comparable results. Our modelling suggests that a cost of equity of around 25bp above the mid-point would in practice be around the 82nd percentile on a probability-weighted basis.29 In other words, if we chose a value 25bp above the midpoint, that there is only around a 20% risk of the cost of capital being set too low.
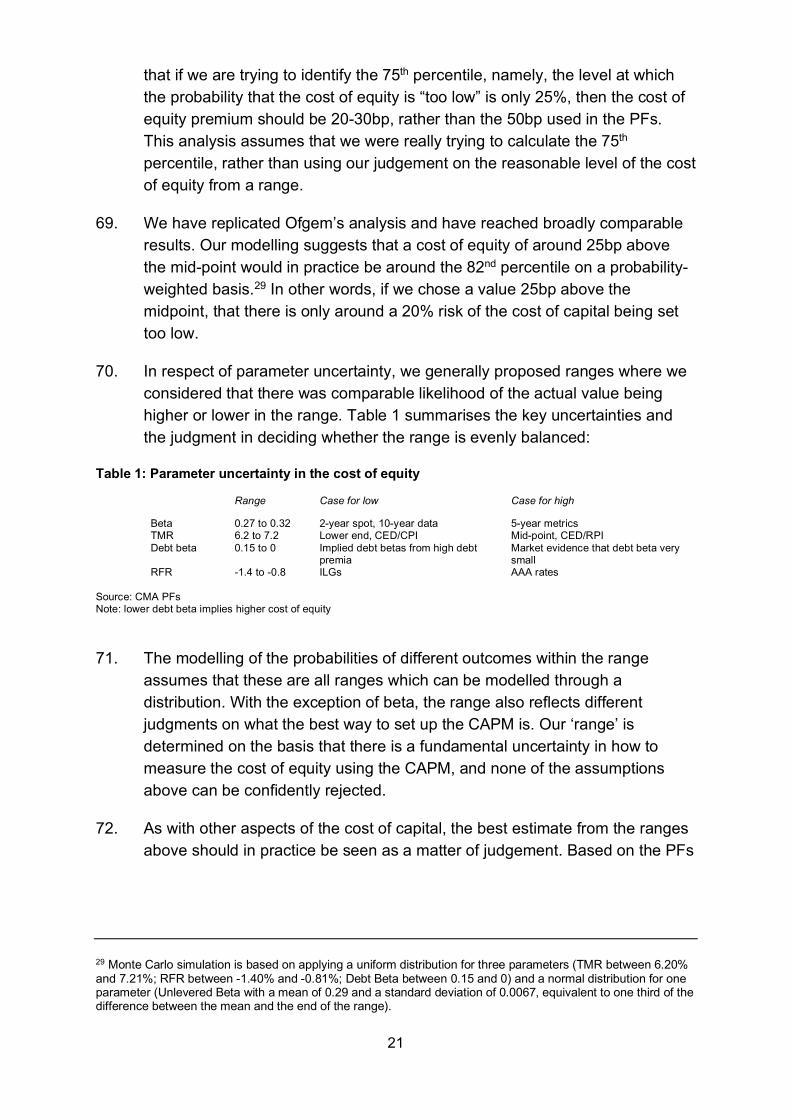
70. In respect of parameter uncertainty, we generally proposed ranges where we considered that there was comparable likelihood of the actual value being higher or lower in the range. Table 1 summarises the key uncertainties and the judgment in deciding whether the range is evenly balanced:
Table 1: Parameter uncertainty in the cost of equity
Range Case for low Case for high
Beta 0.27 to 0.32 2-year spot, 10-year data 5-year metrics TMR 6.2 to 7.2 Lower end, CED/CPI Mid-point, CED/RPI Debt beta 0.15 to 0 Implied debt betas from high debt
premia Market evidence that debt beta very small
RFR -1.4 to -0.8 ILGs AAA rates Source: CMA PFs Note: lower debt beta implies higher cost of equity 71. The modelling of the probabilities of different outcomes within the range
assumes that these are all ranges which can be modelled through a distribution. With the exception of beta, the range also reflects different judgments on what the best way to set up the CAPM is. Our ‘range’ is determined on the basis that there is a fundamental uncertainty in how to measure the cost of equity using the CAPM, and none of the assumptions above can be confidently rejected.
72. As with other aspects of the cost of capital, the best estimate from the ranges above should in practice be seen as a matter of judgement. Based on the PFs
29 Monte Carlo simulation is based on applying a uniform distribution for three parameters (TMR between 6.20% and 7.21%; RFR between -1.40% and -0.81%; Debt Beta between 0.15 and 0) and a normal distribution for one parameter (Unlevered Beta with a mean of 0.29 and a standard deviation of 0.0067, equivalent to one third of the difference between the mean and the end of the range).
22
analysis, we would suggest that the following factors should influence whether the range really is symmetric.
a) For TMR the range was primarily based on the historic ex post estimation methodology, with the historic ex ante and forward-looking approaches considered as cross-checks. From the historical evidence, the low end of the range was based on CED/CPI-deflated data while the high end of the range was based on CED/RPI-deflated data. The CMA updated its assessment of CED/RPI data relative to its previous assessment (in advance of NATS PFs without post-PF assessment) and decided that some weight should be placed on CED/RPI data alongside the CED/CPI data. As a result of this move, and the judgement applied on forward-looking estimates, the range increased by 25bps at both ends (in RPI terms) in relation to NATS PFs.
b) For Debt Beta we noted that there was no one approach to estimating debt betas that dominates all others. The high end of the range is based on decompositional analysis and is perhaps best supported by the beneficial impact that higher estimates have on the stability of the WACC model at different levels of gearing. The low end of the range is best supported by regression methodologies and appears to better match the intuitive exposure to systematic risk for bondholders in highly regulated industries. In our PFs, the CMA considered that, on balance, estimates from the lower end of the range (comprising estimates that would result in a higher cost of equity following re-gearing) were more likely to be accurate.
c) For Unlevered Beta, the CMA preferred an approach that considered a range of data across time horizons and frequencies. The high end of the ranges was based on 5-year and longer rolling average approaches, while the low end of the range was based on 10-year monthly estimates. However, the CMA removed outliers the majority of which were ‘low’ outliers. The CMA assessed averages across approaches of 0.27 to 0.32, with the range considered to be broadly symmetric.
d) For RFR, the CMA set the low end of the range on the basis of the commonly used ILG yield, but measured over 6-months rather than Ofwat’s 1-month. The top of the range was based on evidence that the ILG rate may suggest an RFR that was inappropriately low, and used AAA corporate bonds as a proxy of a RFR that was available to all market participants. At the PF-stage, the CMA thought that the RFR was more likely to be closer to the AAA than to the ILG rate. Taking a conservative view of a default risk premium for ILGS of 20bps suggested an RFR of -1.01%, c10bps higher than the midpoint of the -1.40% to -0.81% range.
23
73. In summary, our view on parameter uncertainty is that outside of TMR there may be a mild bias for the assumptions that indicate a higher cost of equity than suggested by the midpoint of our stated range.
74. Our approach to TMR, and the approach generally adopted by regulators, assumes a broadly constant TMR over time – with a falling RFR translating into a higher equity risk premium (ERP). While the historic evidence suggests that this assumption is an oversimplification in light of a certain degree of cyclicality in returns, we agree with the authors of the UKRN Report that it remains preferable to the alternative approach that assumes a constant ERP. The use of this methodology may provide an upward biased TMR estimate in the current low RFR environment. The forward-looking evidence also supports the view that the historic average achieved returns exceed current expectations for returns over the next few years.
75. Overall, although it is a matter of judgment, we consider that we have picked ranges which, taken together, balance close to the mid-point for the cost of equity.
76. An additional point made in submissions was that, for TMR and RFR in particular, our approach results in a much lower cost of equity than in previous periods. Although market rates have fallen, the majority of this reduction relates to the change in weight given to different data sources. Whilst, in theory, this should have no effect on the right choice of a cost of capital, if there is clear evidence in support of the change, this sharp reduction in the level of the cost of equity makes the interpretation of market data used as a cross-check more difficult. It would be normal regulatory practice to implement such significant changes gradually over time, or at least to recognise that there can be risks from implementing sharp changes too quickly.
77. A related concern is that some of the analysis put to us suggests that the use of ranges may in itself be the wrong approach if the consequence is that regulators are expected to only give weight to the midpoint of the range. In other words, if the implication of the submissions from Ofwat, Ofgem and Citizens Advice is that the right level of the cost of capital should always be the midpoint, then this implies that the only decision that matters is the choice of the two ends of the range, and ensuring that they are of identical probability. This is not how we have constructed our ranges, and if this had been the intention it would be better to start with a point estimate for clarity and transparency. We discuss this further as part of the overall assessment below.
24
5. Balance of risk in the package
78. In the PFs, we said that the ODI package was asymmetric, as it included significant asymmetric (largely penalty-only) incentives. We assumed that the rest of the package was broadly symmetric, although in practice this is a balanced judgement, since there are other aspects of asymmetry, such as the cost sharing incentives. In response, the Disputing Companies responded that they would not be able to achieve the package of ODI targets, and therefore that the asymmetry was worse than we had assumed. They provided a range of evidence supporting different levels of asymmetry. As indicated by Ofwat at its hearing, much of this analysis was based on the assumption that the companies would not be able to outperform their business plans to meet the targets that Ofwat had set and we had largely supported based on industry comparisons.
79. Ofwat said that in practice, supported by past performance, Disputing Companies would overachieve, and in particular that they would focus effort on areas where they could achieve rewards and that this would offset the penalties associated with underperformance.
80. Ofgem agreed with us that the cost of capital could be adjusted for asymmetry and noted at its hearing that it has also adjusted the cost of capital for asymmetry, although in the energy sector it expects company outperformance. It agreed with Ofwat that in practice it was likely that, given the existence of incentives for outperformance, companies would not face net penalties.
CMA analysis
81. Overall, the evidence does not persuade us to adopt a different position from the PFs on asymmetry. We accept the premise that management might respond to incentives and this might result in outperformance for at least some companies against an expectation of penalties. However:
a) Incentives are part of normal regulation and operational outperformance is a desirable outcome. If companies are able to outperform, this delivers benefits to customers both from the actual improvements and from Ofwat being able to use the evidence in its comparisons in future periods.
b) The approach to PCs in PR19 is very different to previous periods, and includes extensive analysis from customers, overlaid by comparisons across the companies. The analysis of the PCs suggests that they have been deliberately set at stretching levels to produce benefits for consumers. We are not persuaded it is consistent for Ofwat to both set
25
new and increasingly stretching targets for PCs in PR19 and also to assume that companies will outperform against those targets.
c) We would also note that Ofgem said that it had taken an approach of assuming outperformance based on historical performance, and that its approach differed from Ofwat’s which had explicitly decided not to assume any outperformance.
d) Similarly, we are not persuaded by the Disputing Companies’ arguments that they face a structural expectation of underperformance. We have responded to certain challenges on individual ODIs, but overall the framework has been designed to provide a stretching but achievable challenge across the portfolio. We recognise that the companies’ plans suggest that they need to outperform to achieve the ODIs across the group. Again, it is normal regulatory practice to set stretching targets on costs and outputs and there is no reason to believe in this case that this cannot be applied here.
e) There might be individual companies that are unable to achieve the same level of performance as others. All the companies have told us that they are not able to achieve the target levels. We are considering this evidence, but at the moment we are not persuaded that any of the individual companies are exposed to a particularly unfair balance on the ODIs, and in any case a company-specific imbalance would be better addressed in the ODI package than a company-specific cost of capital adjustment.
82. Overall, we conclude that expected returns on ODIs should reflect the balance of rewards and penalties Accordingly, we would expect negative ODI-related returns on average. Therefore, for the expected return to be consistent with the cost of capital, we would expect a small premium to be required.
83. Ofwat also criticised our measurement of the size of asymmetry (0.1%-0.2%). Our analysis was based on an indicative assumption, where we gave a 10% weighting to a 10% downside scenario for all asymmetric incentives. In theory, this should be supported by more complex analysis, including:
a) The additional probability of smaller penalties on penalty-only incentives;
b) The potential for an asymmetric distribution of outperformance and underperformance on particular PCs;
c) A more critical scrutiny of the calculation of P10s.
26
84. We recognise that our estimate of 0.1%-0.2% RORE was a broad estimate of scale of the structural asymmetry resulting from ODIs, to be included in an ‘in-the-round’ assessment of the cost of capital. We have no basis on which to form a view of more accurate probability distributions which could be used to perform a more granular assessment. Our view is that a more detailed analysis will not in practice better inform the overall assessment.
85. An adjustment to the cost of capital is not the only option to address asymmetry – this could be done in other ways, either through an adjustment to allowed revenue which is not characterised as a cost of capital change, or through a change to the structure of ODIs. At this stage, having consulted on retaining the Ofwat approach of including extensive penalty-only or asymmetric ODIs, we consider that a change to the structure of ODIs would be very difficult to implement effectively.
Proposed approach to asymmetry
86. Based on the analysis above, we consider that asymmetry continues to be potentially relevant to the choice of a point estimate for the cost of capital. Overall, the assessment in this section illustrates the importance of retaining a measure of judgement in the choice of the point estimate for the cost of capital. We recommend that the overall degree of structural asymmetry in the ODIs, and otherwise in the determination, should be reflected in the choice of point estimate of the cost of capital.
6. Cross-checks on the level of the WACC, after aiming up
87. In this section we consider three cross-checks on the level of the WACC, and their implications for the point estimate on the cost of capital. These are market prices for assets (described as market to asset ratios or MARs), broker estimates and financeability.
Market to asset ratios
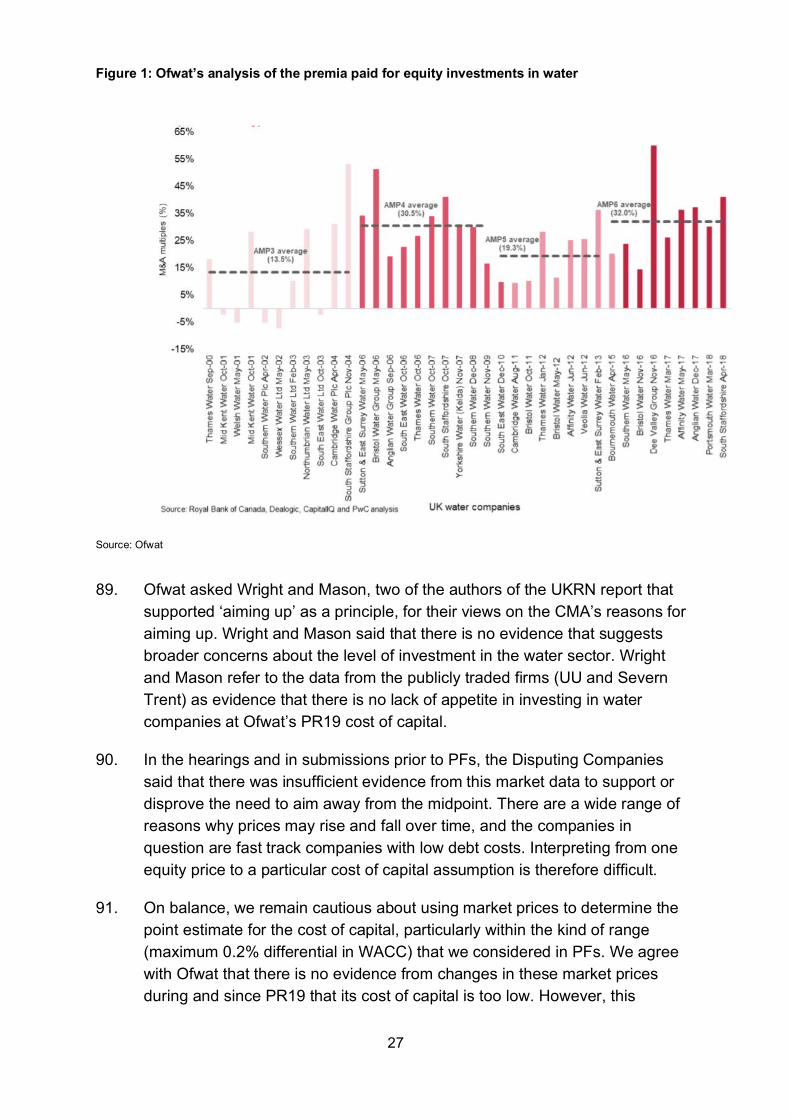
88. In its response, Ofwat said that cross-checks on the market prices of assets counter the risk that the cost of capital is too low. Ofwat provided evidence from 20 years of transactions illustrating that, over time, investors’ willingness to pay premia for the assets has gradually increased. Figure 1 reproduces Ofwat’s analysis of MARs over the last 20 years.
27
Figure 1: Ofwat’s analysis of the premia paid for equity investments in water
Source: Ofwat 89. Ofwat asked Wright and Mason, two of the authors of the UKRN report that
supported ‘aiming up’ as a principle, for their views on the CMA’s reasons for aiming up. Wright and Mason said that there is no evidence that suggests broader concerns about the level of investment in the water sector. Wright and Mason refer to the data from the publicly traded firms (UU and Severn Trent) as evidence that there is no lack of appetite in investing in water companies at Ofwat’s PR19 cost of capital.
90. In the hearings and in submissions prior to PFs, the Disputing Companies said that there was insufficient evidence from this market data to support or disprove the need to aim away from the midpoint. There are a wide range of reasons why prices may rise and fall over time, and the companies in question are fast track companies with low debt costs. Interpreting from one equity price to a particular cost of capital assumption is therefore difficult.
91. On balance, we remain cautious about using market prices to determine the point estimate for the cost of capital, particularly within the kind of range (maximum 0.2% differential in WACC) that we considered in PFs. We agree with Ofwat that there is no evidence from changes in these market prices during and since PR19 that its cost of capital is too low. However, this
28
evidence relies on the market view of only two companies, both of which have lower than average embedded debt costs. This is not sufficient evidence of the WACC estimate’s appropriateness for the entire water sector, nor to arbitrate between an allowance that is at the midpoint or 0.1%-0.2% higher in WACC terms.
Broker forecasts
92. In its response to the CMA’s provisional findings, Ofwat stated that assumptions used by market analysts indicated an allowed cost of equity consistent with its nominal allowance of 6.27% rather than the CMA’s 7.18%. Ofwat noted that30:
a) Barclays suggests a 6.0% nominal cost of equity is sufficient with an expectation that listed companies should trade at 25-30% premia to RCV based on a nominal achieved return on regulatory equity of 9-10%.
b) In June 2020, J.P. Morgan based its valuation of United Utilities on a cost of equity of 5.9%, Severn Trent on 5.9% and Pennon on 6.1%, and that all of these figures were lower than Ofwat’s PR19 figure.
c) Bank of America’s May 2020 assumption of a 6.2% nominal investor cost of equity for valuation purposes (while also factoring in 2.8% annual asset base growth and 1% RORE outperformance).
d) Credit Suisse used a nominal 6.7% cost of equity and a 4.8% WACC when assessing Pennon in April 2020, and that both of these figures were below the CMA’s estimates.
30 Ofwat’s response to the provisional findings – risk and return, paragraph 2.18
29
Figure 2: Ofwat graph showing sell-side estimates of the cost of equity
Source: Ofwat presentation to the CMA
93. Again, we consider that caution is warranted when interpreting broker forecasts of the cost of equity in relation to utility companies. They are again focused on only two companies. These estimates may also prove to be no more accurate than our own assessment, or may be specifically tailored to particular investors or house views rather than representing the cost of capital demanded by the average or marginal investor in the sector. In addition, there may be circularity in these estimates if analysts assume costs of equity close to those set by the regulator rather than conducting their own assessments.
94. However, as with the MAR data above, this data does at least mitigate the risk that the cost of debt has been set too low.
Financeability
95. In the PFs, we did not make any financeability adjustments. We removed Ofwat’s PAYG adjustments as they were unnecessary given our overall package, including the difference between CMA and Ofwat in respect of the cost of equity.
96. Ofwat said that it would be disproportionate and untargeted to make adjustments to the cost of capital to address financeability concerns. Ofwat pointed to previous reviews where it had made financeability uplifts, and where in its view the consequence had only been benefits for shareholders.
30
However, our analysis of Ofwat’s financeability adjustments suggests that they also result in higher bills for customers, without actually improving credit quality according to at least some of the credit rating agencies.
97. Our analysis of the cost of equity illustrates that the CAPM model could be used to derive a wide range of potential options for the cost of equity which would be too low to support investment-grade credit metrics. The overall determination, in the round, needs to include a consideration of whether the WACC assumptions are consistent with the credit rating assumed. Whether or not Ofwat needed to make the adjustment in this case, we disagree that the need to maintain credit metrics can never be part of the WACC assessment. As flagged in the previous paragraph, if the alternative solution is a repeating scenario of accelerating revenues from future price controls (through the use of financeability levers), then customers may face the same uplift to bills while companies are more likely to be downgraded by the rating agencies.
98. We therefore continue to assume that financeability should be a valuable cross-check.
7. Overall assessment of a point estimate for the cost of capital
99. In the PFs we chose a cost of equity 50bp above the midpoint. We also set the cost of debt at the bottom of the range. Taken together, these two decisions resulted in a point estimate 0.1% above the midpoint for the WACC.
100. We now propose to set separate point estimates for the cost of debt and for the cost of equity.
101. Based on the submissions following the PFs discussed above, we also have considered the following additional points:
a) The mechanisms by which the choice of point estimate might affect the level of investment in the water sector;
b) Whether there is asymmetry within the WACC range; and
c) What is the correct interpretation of the distribution of parameter uncertainty when setting a point estimate for the WACC?
Updated view on effect on investment
102. Our assessment is that many of the points made in response to the PFs around the effects on investment are not directly relevant to the reasons that
31
we stated in the PFs for choosing a point estimate for the cost of equity in the top half of the range. In our PFs we expressed concern about the longer-term risks associated with an exit of capital from the sector, should the cost of capital be set too low. In the context of expected increases in the need for new capital over the coming AMPs, we continue to be of the view that this is a relevant consideration.
103. Our concerns in respect of the level of investment relate to two, related issues:
a) First, that regulation should create a supportive long-term investment environment. The long-term investors in infrastructure that the companies need to attract to support a long-term low cost of capital will not be attracted if there are frequent sharp changes to the way regulators determine the cost of capital. An approach which is both cautious in responding too quickly to market fluctuations and is consistent over time should ultimately deliver benefits to both investors and, through a low cost of capital, to customers.
b) Second, that the allowed return needs to be set in a way that encourages the right level of new investment. If the WACC is set too low, companies will not have the incentive to identify, develop and implement new and often complex investment programmes. This was the point identified in the analytical framework supporting the UKRN report and previous studies on the approach to the WACC. However, we agree with Ofwat that there are risks if the WACC is set too high (which we consider could relate to over-investment or excess returns to shareholders), and that the challenge is getting an appropriate balance between these two risks.
104. We have considered further how these considerations might affect the choice of a point estimate for the cost of equity for AMP7. On balance, our updated view is that the level of the point estimate we proposed at PFs was higher than necessary to meet these objectives.
105. We continue to be concerned that there needs to be an appropriate level of caution in making significant changes to the cost of capital. The midpoint of our cost of equity range in PFs was around 30% lower than in AMP6, with much of this reduction due to changes in the methodology for calculating the cost of equity. However, we have also considered further evidence on market prices and broker forecasts, all of which indicates that the range which we proposed in the PFs, at least at this point, appears to be in line with market expectations. There is also evidence that there continues to be significant availability of new capital for further investment in infrastructure, should it
32
become necessary. We therefore consider that the risk of an exit of capital is relatively low over AMP7.
106. In respect of the incentives on firms to identify new capital and grow the RCV where it benefits customers, there remains a risk that a WACC that is too low will not provide these incentives. We continue to be of the view that, at the margin, owners and their management will have some discretion in how appropriate capital projects are identified and designed, and that there needs to be sufficient financial incentives to sure that this is done at a desirable level. This would be particularly the case if Ofwat required a step change in investment to meet changing resilience requirements in the face of climate change challenges or other stresses on existing infrastructure.
107. We recognise, as highlighted in the NATS review and also the UKRN report, that these incentives are created most directly by the expected return on new investment, whereas the WACC applies to existing and new investment. whilst in theory the incentives for new investment should also be created by the choice of WACC over the life of the new assets, this relies on a consistency of approach over multiple periods.
108. Accordingly, we consider that the need to promote investment should be a consideration in setting the point estimate, but that there are balancing factors which mean that the effect on the choice of point estimate in AMP7 would be small. In summary:
a) We continue to be of the view that there are risks of an exit of capital from the long-term investors in the sector, should the cost of capital be set too low;
b) We also expect that there are risks that there will be underinvestment in new assets, if the expected return on capital to new investment in AMP8 and beyond does not provide incentives to reinvest capital and maintain or grow the asset base over time; and
c) Balanced against this, we consider that the market evidence on investors’ expectations indicates that the risks from a) and b) during AMP7 are relatively low, and therefore that the CMA should be able to take an approach that is suitably cautious without setting the point estimate materially above the mid-point in AMP7.
Asymmetry
109. We continue to be of the view that setting a point estimate for the cost of capital should be considered ‘in-the-round’, and that this includes a view on the overall balance of the settlement. We said in the PFs that we were of a
33
provisional view that the use of large penalty-only ODIs and other asymmetric incentives meant that the package of incentives was asymmetric, and this would be relevant to the choice of the cost of capital. Our updated view continues to be that a package of asymmetric incentives should be considered as part of an ‘in-the-round’ assessment of the package, including the cost of capital.
110. We note that Ofgem has taken a comparable view that the symmetry of the package of incentives is relevant to the final assessment of allowed returns on the regulated asset base, although it did not take the same view on the balance of risk in its recent determination – instead calibrating the allowed return in relation to the higher likelihood of outperformance in the energy sector.31
111. One potential form of asymmetry is in the definition of the range for the cost of capital; the risk that it is too high may be different to the risk it is too low, because there is asymmetry within the ranges for the parameters chosen. We have considered further and largely consider that these are symmetric, at least in respect of the risks that the actual measure may be at the higher and lower points in the range.
112. We have some concern about the risks associated with the size of reduction in the estimates of the risk-free rate and total market return since AMP6. Given that the majority of these changes do not relate to changes in market data, there remains a residual risk around how we have updated this analysis of the cost of equity. We recognise that there are also risks that we have not gone far enough – but given our concerns about consistency and caution across regulatory decisions, our view is that this is better addressed in future periods when more evidence on the effects of the decisions in PR19 and this redetermination becomes available.
Financeability
113. We continue to be of the view that financeability provides a relevant cross-check on the choice of the cost of equity. The use of credit ratios at least provides a check on whether the cost of equity appears to be of a level which is broadly consistent with the high-quality credit ratings required by Ofwat and implied in the cost of debt.
114. In this case we note that our proposed approach to the WACC is likely to result in the notional company achieving acceptable credit ratings without
31 Ofgem (2020), RIIO-2 Final Determinations – Finance Annex, paragraph 3.155
34
accelerating PAYG from future periods. Setting the WACC at our updated point estimate, but without the need to accelerate PAYG, should result in lower bills in AMP7 than Ofwat’s approach for those companies which had large PAYG adjustments, whilst maintaining ratios which are consistent, albeit in some cases marginally, with the investment-grade ratings required by the licence.
Updated choice of a point estimate
115. As described above, our updated view remains that there are a number of benefits from choosing a point estimate above the middle of the range. Our view is that this will result in an appropriate balance of risk in the round across the determination, including:
a) addressing the level of risk associated with setting the cost of equity too low in the context of a sharp reduction since AMP6;
b) addressing asymmetry in the broader financial settlement; and
c) addressing the risks to financeability from setting the cost of capital at lower levels within the range.
116. We have also accepted that the supporting evidence suggests that the risk of an exit of capital in AMP7 is relatively low, given current market conditions, and that this reduces the size of the risks from setting the cost of capital too low. We also agree with evidence from Ofgem that the risk of setting the cost of capital too low is not as high as we had implied in our PFs, since there is a greater probability that the right estimate is towards the middle of the range.
117. Taking these considerations together, our updated judgement is to use a cost of equity of around 0.25% above the middle of our range. The final figure for the cost of equity will take account of our updated analysis of the risk-free rate, beta and the total market return as well as consideration of the responses to this consultation. The final cost of equity will also be considered in the context of any wider changes to our ‘in-the-round’ assessment which will take account of all our duties, including our final analysis of financeability.