Embed Size (px)
Citation preview
3361 ROUSE ROAD, SUITE 235 · ORLANDO, FLORIDA 32817 · TEL 407-380-8633 · FAX 407 -380-7399
www.shorecrestreta i l . com
FOR SALE
1.5 ACRE COMMERCIAL PARCEL
PLEASANT HILL ROAD,
just North of
POINCIANA BOULEVARD
OSCEOLA COUNTY
POINCIANA, FLORIDA
For additional information contact:
Tanya Solomon
(407) 380-8633
No warranty or representation, expressed or implied, is made as to the accuracy of the information contained herein, and same is submitted subject to errors, omissions, change in price or other conditions, withdrawal without notice and to any special listing condition imposed by our principal.
EXECUTIVE SUMMARY
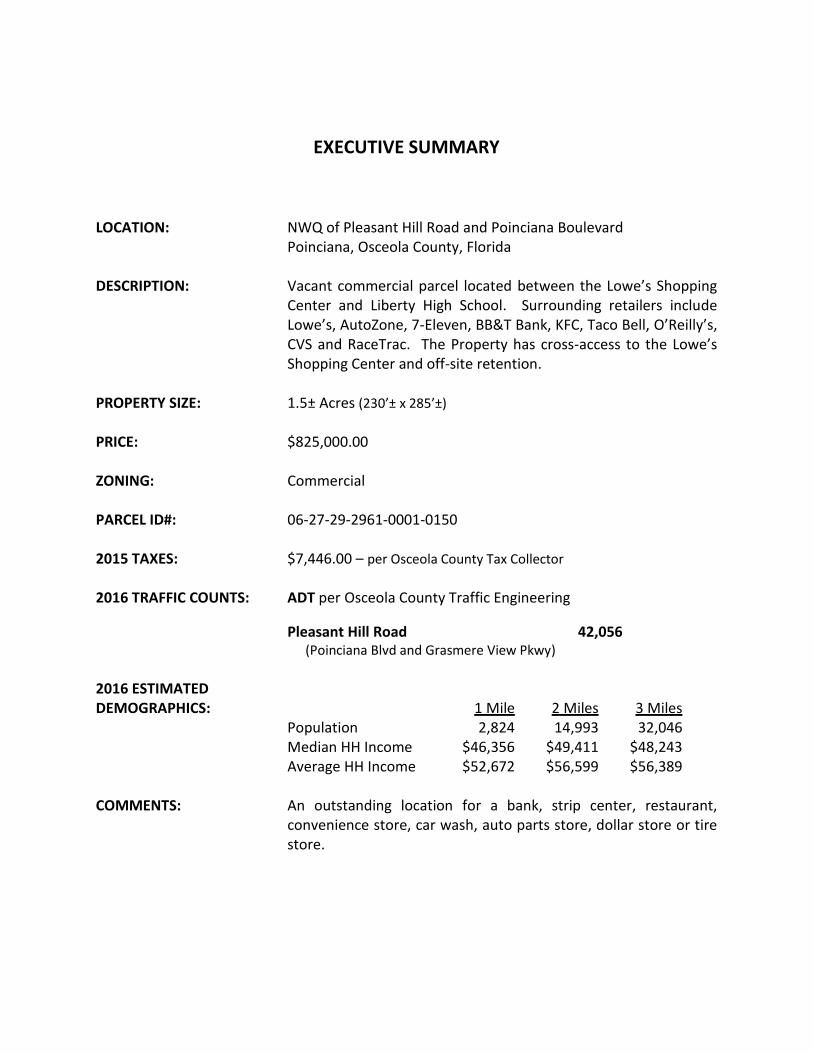
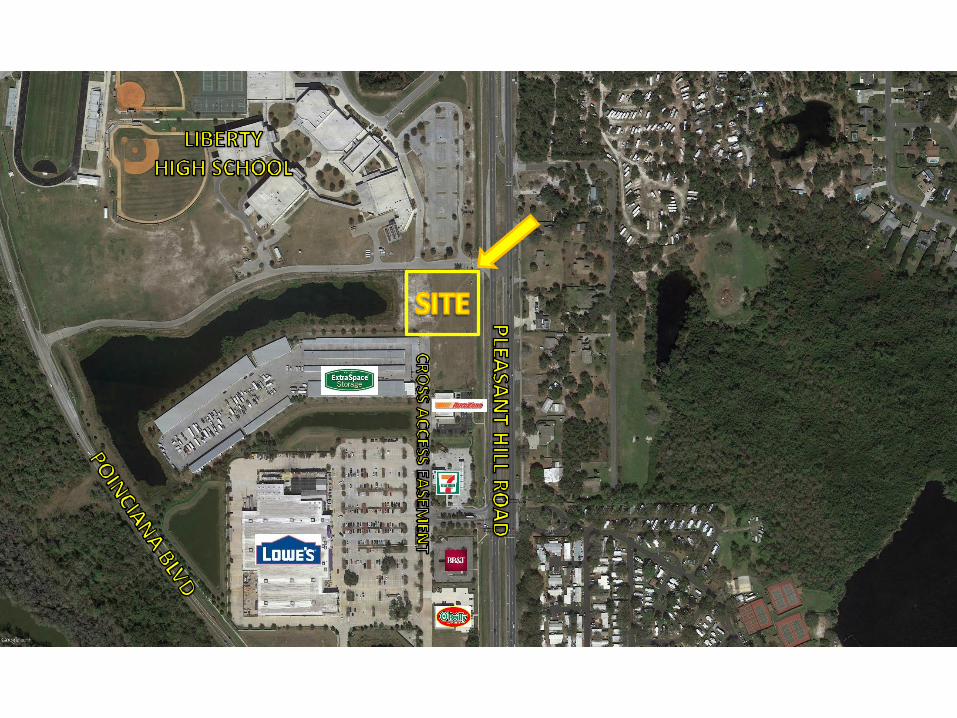
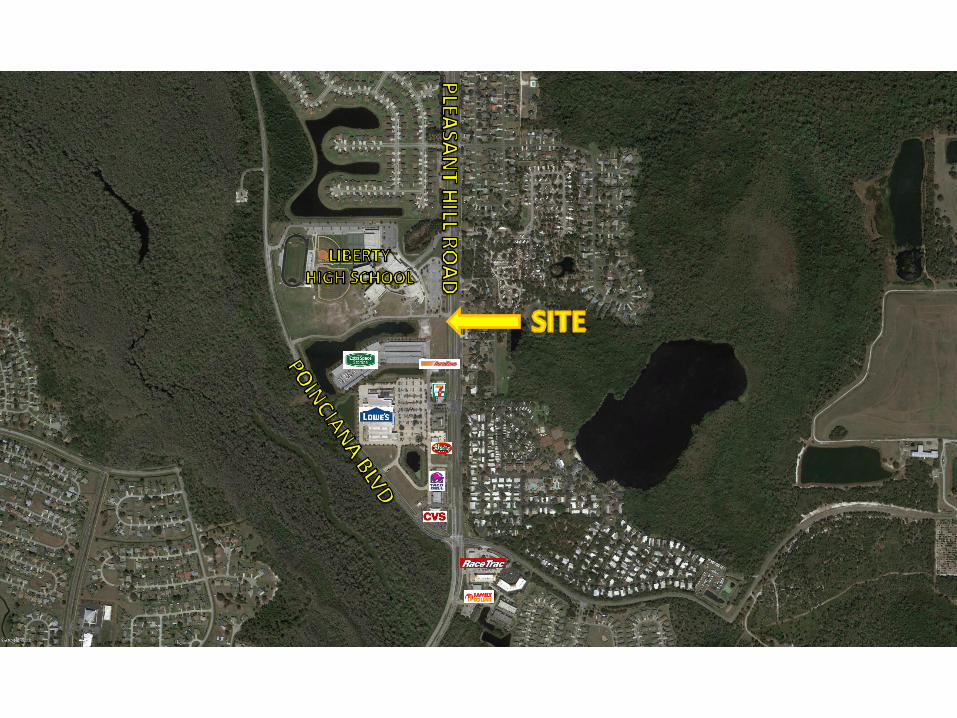
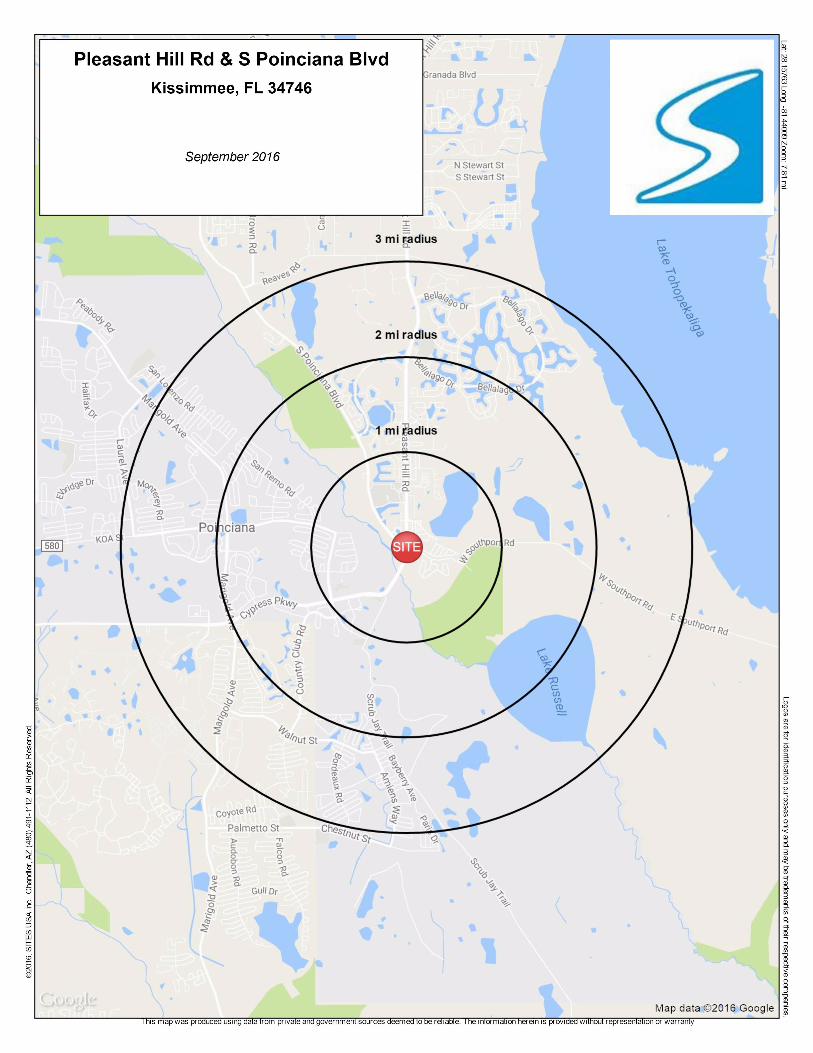
LOCATION: NWQ of Pleasant Hill Road and Poinciana Boulevard Poinciana, Osceola County, Florida DESCRIPTION: Vacant commercial parcel located between the Lowe’s Shopping
Center and Liberty High School. Surrounding retailers include Lowe’s, AutoZone, 7-Eleven, BB&T Bank, KFC, Taco Bell, O’Reilly’s, CVS and RaceTrac. The Property has cross-access to the Lowe’s Shopping Center and off-site retention.
PROPERTY SIZE: 1.5± Acres (230’± x 285’±) PRICE: $825,000.00 ZONING: Commercial PARCEL ID#: 06-27-29-2961-0001-0150 2015 TAXES: $7,446.00 – per Osceola County Tax Collector 2016 TRAFFIC COUNTS: ADT per Osceola County Traffic Engineering
Pleasant Hill Road 42,056 (Poinciana Blvd and Grasmere View Pkwy)
2016 ESTIMATED DEMOGRAPHICS: 1 Mile 2 Miles 3 Miles Population 2,824 14,993 32,046 Median HH Income $46,356 $49,411 $48,243 Average HH Income $52,672 $56,599 $56,389 COMMENTS: An outstanding location for a bank, strip center, restaurant,
convenience store, car wash, auto parts store, dollar store or tire store.
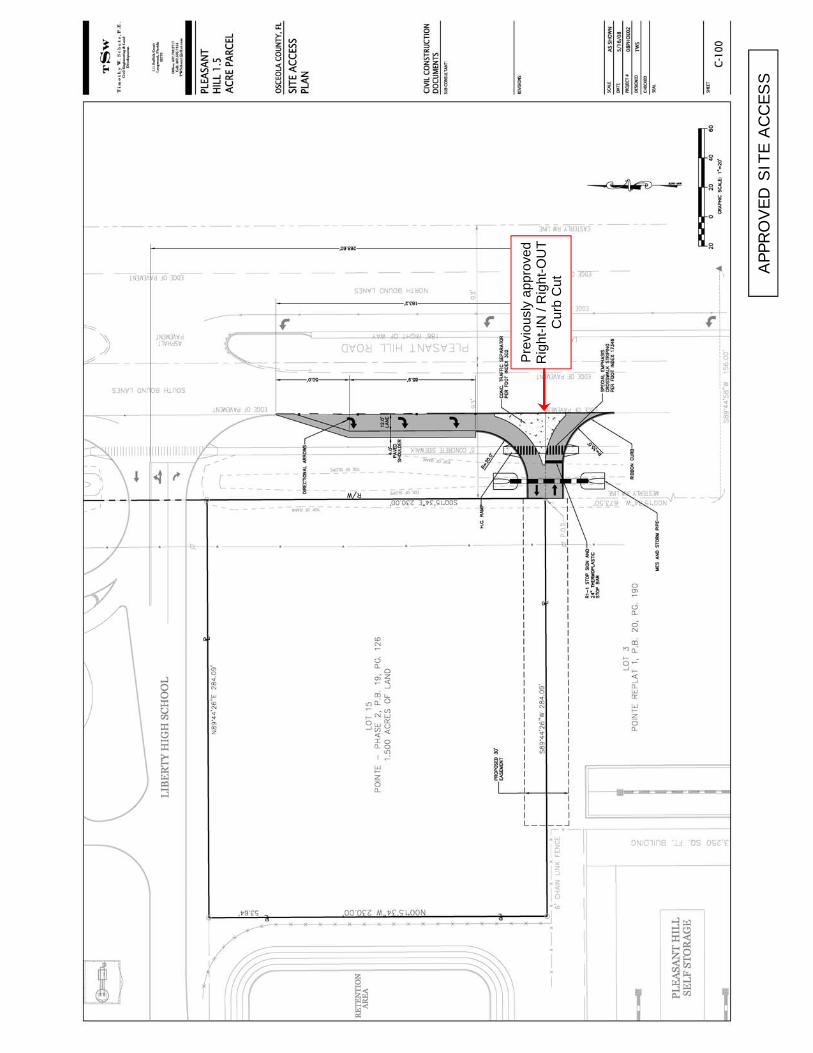
APP
RO
VED
SIT
E A
CCESS
Pre
viou
sly
appr
oved
R
ight
-IN /
Rig
ht-O
UT
Cur
b C
ut
Demographic Source: Applied Geographic Solutions 04/2016, TIGER Geography page 1 of 3©2016, Sites USA, Chandler, Arizona, 480-491-1112
Th
is r
ep
ort
wa
s p
rod
uce
d u
sin
g d
ata
fro
m p
riva
te a
nd
go
vern
me
nt
sou
rce
s d
ee
me
d t
o b
e r
elia
ble
. T
he
info
rma
tio
n h
ere
in is
pro
vid
ed
with
ou
t re
pre
sen
tatio
n o
r w
arr
an
ty.
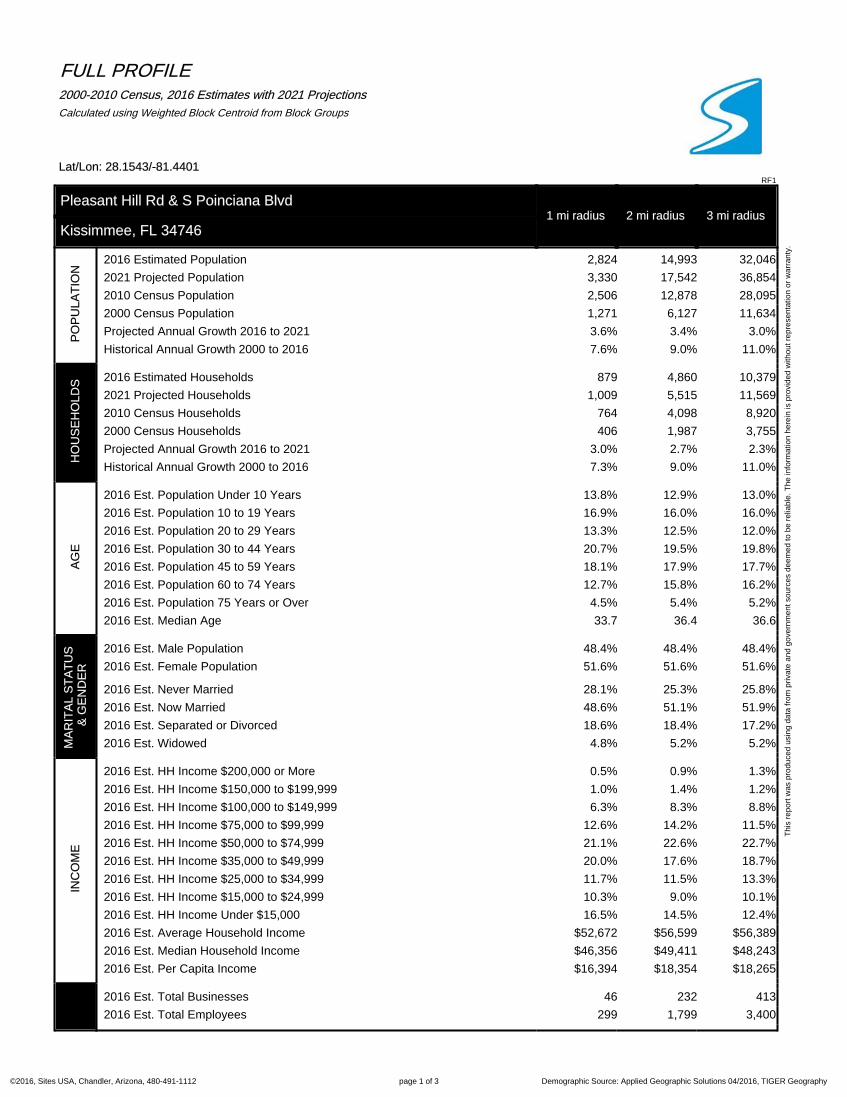
FULL PROFILE2000-2010 Census, 2016 Estimates with 2021 Projections
Calculated using Weighted Block Centroid from Block Groups
Lat/Lon: 28.1543/-81.4401RF1
Pleasant Hill Rd & S Poinciana Blvd1 mi radius 2 mi radius 3 mi radius
Kissimmee, FL 34746
PO
PU
LA
TIO
N
2016 Estimated Population 2,824 14,993 32,046
2021 Projected Population 3,330 17,542 36,854
2010 Census Population 2,506 12,878 28,095
2000 Census Population 1,271 6,127 11,634
Projected Annual Growth 2016 to 2021 3.6% 3.4% 3.0%
Historical Annual Growth 2000 to 2016 7.6% 9.0% 11.0%
HO
US
EH
OL
DS
2016 Estimated Households 879 4,860 10,379
2021 Projected Households 1,009 5,515 11,569
2010 Census Households 764 4,098 8,920
2000 Census Households 406 1,987 3,755
Projected Annual Growth 2016 to 2021 3.0% 2.7% 2.3%
Historical Annual Growth 2000 to 2016 7.3% 9.0% 11.0%
AG
E
2016 Est. Population Under 10 Years 13.8% 12.9% 13.0%
2016 Est. Population 10 to 19 Years 16.9% 16.0% 16.0%
2016 Est. Population 20 to 29 Years 13.3% 12.5% 12.0%
2016 Est. Population 30 to 44 Years 20.7% 19.5% 19.8%
2016 Est. Population 45 to 59 Years 18.1% 17.9% 17.7%
2016 Est. Population 60 to 74 Years 12.7% 15.8% 16.2%
2016 Est. Population 75 Years or Over 4.5% 5.4% 5.2%
2016 Est. Median Age 33.7 36.4 36.6
MA
RIT
AL
ST
AT
US
&
GE
ND
ER
2016 Est. Male Population 48.4% 48.4% 48.4%
2016 Est. Female Population 51.6% 51.6% 51.6%
2016 Est. Never Married 28.1% 25.3% 25.8%
2016 Est. Now Married 48.6% 51.1% 51.9%
2016 Est. Separated or Divorced 18.6% 18.4% 17.2%
2016 Est. Widowed 4.8% 5.2% 5.2%
INC
OM
E
2016 Est. HH Income $200,000 or More 0.5% 0.9% 1.3%
2016 Est. HH Income $150,000 to $199,999 1.0% 1.4% 1.2%
2016 Est. HH Income $100,000 to $149,999 6.3% 8.3% 8.8%
2016 Est. HH Income $75,000 to $99,999 12.6% 14.2% 11.5%
2016 Est. HH Income $50,000 to $74,999 21.1% 22.6% 22.7%
2016 Est. HH Income $35,000 to $49,999 20.0% 17.6% 18.7%
2016 Est. HH Income $25,000 to $34,999 11.7% 11.5% 13.3%
2016 Est. HH Income $15,000 to $24,999 10.3% 9.0% 10.1%
2016 Est. HH Income Under $15,000 16.5% 14.5% 12.4%
2016 Est. Average Household Income $52,672 $56,599 $56,389
2016 Est. Median Household Income $46,356 $49,411 $48,243
2016 Est. Per Capita Income $16,394 $18,354 $18,265
2016 Est. Total Businesses 46 232 413
2016 Est. Total Employees 299 1,799 3,400
Demographic Source: Applied Geographic Solutions 04/2016, TIGER Geography page 2 of 3©2016, Sites USA, Chandler, Arizona, 480-491-1112
Th
is r
ep
ort
wa
s p
rod
uce
d u
sin
g d
ata
fro
m p
riva
te a
nd
go
vern
me
nt
sou
rce
s d
ee
me
d t
o b
e r
elia
ble
. T
he
info
rma
tio
n h
ere
in is
pro
vid
ed
with
ou
t re
pre
sen
tatio
n o
r w
arr
an
ty.
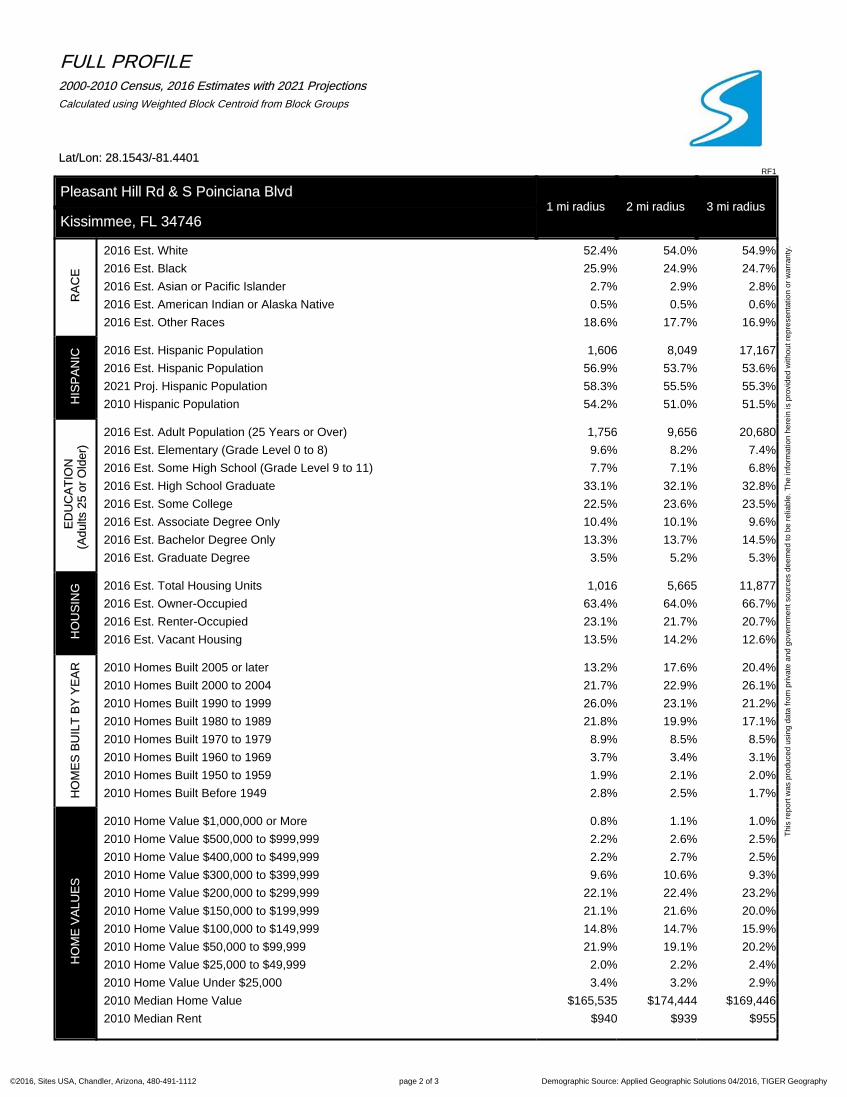
FULL PROFILE2000-2010 Census, 2016 Estimates with 2021 Projections
Calculated using Weighted Block Centroid from Block Groups
Lat/Lon: 28.1543/-81.4401RF1
Pleasant Hill Rd & S Poinciana Blvd1 mi radius 2 mi radius 3 mi radius
Kissimmee, FL 34746
RA
CE
2016 Est. White 52.4% 54.0% 54.9%
2016 Est. Black 25.9% 24.9% 24.7%
2016 Est. Asian or Pacific Islander 2.7% 2.9% 2.8%
2016 Est. American Indian or Alaska Native 0.5% 0.5% 0.6%
2016 Est. Other Races 18.6% 17.7% 16.9%
HIS
PA
NIC 2016 Est. Hispanic Population 1,606 8,049 17,167
2016 Est. Hispanic Population 56.9% 53.7% 53.6%
2021 Proj. Hispanic Population 58.3% 55.5% 55.3%
2010 Hispanic Population 54.2% 51.0% 51.5%
ED
UC
AT
ION
(Ad
ults
25
or
Old
er)
2016 Est. Adult Population (25 Years or Over) 1,756 9,656 20,680
2016 Est. Elementary (Grade Level 0 to 8) 9.6% 8.2% 7.4%
2016 Est. Some High School (Grade Level 9 to 11) 7.7% 7.1% 6.8%
2016 Est. High School Graduate 33.1% 32.1% 32.8%
2016 Est. Some College 22.5% 23.6% 23.5%
2016 Est. Associate Degree Only 10.4% 10.1% 9.6%
2016 Est. Bachelor Degree Only 13.3% 13.7% 14.5%
2016 Est. Graduate Degree 3.5% 5.2% 5.3%
HO
US
ING 2016 Est. Total Housing Units 1,016 5,665 11,877
2016 Est. Owner-Occupied 63.4% 64.0% 66.7%
2016 Est. Renter-Occupied 23.1% 21.7% 20.7%
2016 Est. Vacant Housing 13.5% 14.2% 12.6%
HO
ME
S B
UIL
T B
Y Y
EA
R 2010 Homes Built 2005 or later 13.2% 17.6% 20.4%
2010 Homes Built 2000 to 2004 21.7% 22.9% 26.1%
2010 Homes Built 1990 to 1999 26.0% 23.1% 21.2%
2010 Homes Built 1980 to 1989 21.8% 19.9% 17.1%
2010 Homes Built 1970 to 1979 8.9% 8.5% 8.5%
2010 Homes Built 1960 to 1969 3.7% 3.4% 3.1%
2010 Homes Built 1950 to 1959 1.9% 2.1% 2.0%
2010 Homes Built Before 1949 2.8% 2.5% 1.7%
HO
ME
VA
LU
ES
2010 Home Value $1,000,000 or More 0.8% 1.1% 1.0%
2010 Home Value $500,000 to $999,999 2.2% 2.6% 2.5%
2010 Home Value $400,000 to $499,999 2.2% 2.7% 2.5%
2010 Home Value $300,000 to $399,999 9.6% 10.6% 9.3%
2010 Home Value $200,000 to $299,999 22.1% 22.4% 23.2%
2010 Home Value $150,000 to $199,999 21.1% 21.6% 20.0%
2010 Home Value $100,000 to $149,999 14.8% 14.7% 15.9%
2010 Home Value $50,000 to $99,999 21.9% 19.1% 20.2%
2010 Home Value $25,000 to $49,999 2.0% 2.2% 2.4%
2010 Home Value Under $25,000 3.4% 3.2% 2.9%
2010 Median Home Value $165,535 $174,444 $169,446
2010 Median Rent $940 $939 $955
Demographic Source: Applied Geographic Solutions 04/2016, TIGER Geography page 3 of 3©2016, Sites USA, Chandler, Arizona, 480-491-1112
Th
is r
ep
ort
wa
s p
rod
uce
d u
sin
g d
ata
fro
m p
riva
te a
nd
go
vern
me
nt
sou
rce
s d
ee
me
d t
o b
e r
elia
ble
. T
he
info
rma
tio
n h
ere
in is
pro
vid
ed
with
ou
t re
pre
sen
tatio
n o
r w
arr
an
ty.
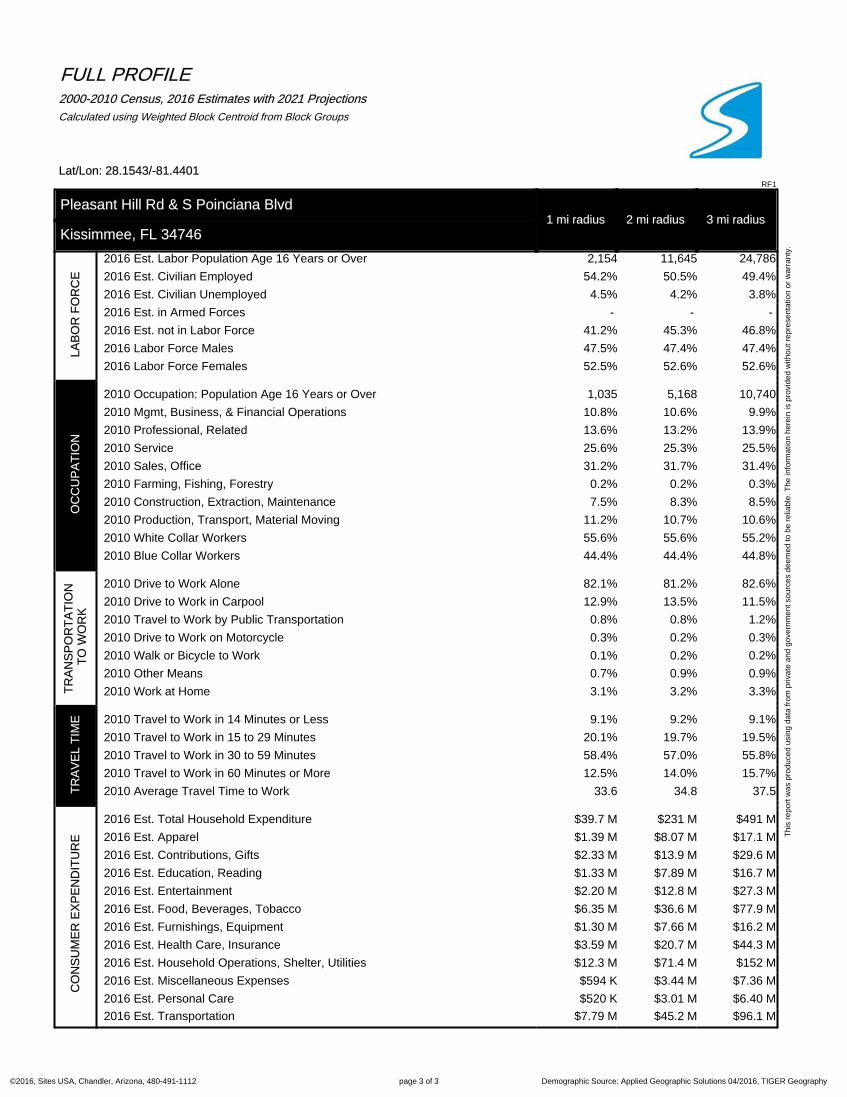
FULL PROFILE2000-2010 Census, 2016 Estimates with 2021 Projections
Calculated using Weighted Block Centroid from Block Groups
Lat/Lon: 28.1543/-81.4401RF1
Pleasant Hill Rd & S Poinciana Blvd1 mi radius 2 mi radius 3 mi radius
Kissimmee, FL 34746
LA
BO
R F
OR
CE
2016 Est. Labor Population Age 16 Years or Over 2,154 11,645 24,786
2016 Est. Civilian Employed 54.2% 50.5% 49.4%
2016 Est. Civilian Unemployed 4.5% 4.2% 3.8%
2016 Est. in Armed Forces - - -
2016 Est. not in Labor Force 41.2% 45.3% 46.8%
2016 Labor Force Males 47.5% 47.4% 47.4%
2016 Labor Force Females 52.5% 52.6% 52.6%
OC
CU
PA
TIO
N
2010 Occupation: Population Age 16 Years or Over 1,035 5,168 10,740
2010 Mgmt, Business, & Financial Operations 10.8% 10.6% 9.9%
2010 Professional, Related 13.6% 13.2% 13.9%
2010 Service 25.6% 25.3% 25.5%
2010 Sales, Office 31.2% 31.7% 31.4%
2010 Farming, Fishing, Forestry 0.2% 0.2% 0.3%
2010 Construction, Extraction, Maintenance 7.5% 8.3% 8.5%
2010 Production, Transport, Material Moving 11.2% 10.7% 10.6%
2010 White Collar Workers 55.6% 55.6% 55.2%
2010 Blue Collar Workers 44.4% 44.4% 44.8%
TR
AN
SP
OR
TA
TIO
N
TO
WO
RK
2010 Drive to Work Alone 82.1% 81.2% 82.6%
2010 Drive to Work in Carpool 12.9% 13.5% 11.5%
2010 Travel to Work by Public Transportation 0.8% 0.8% 1.2%
2010 Drive to Work on Motorcycle 0.3% 0.2% 0.3%
2010 Walk or Bicycle to Work 0.1% 0.2% 0.2%
2010 Other Means 0.7% 0.9% 0.9%
2010 Work at Home 3.1% 3.2% 3.3%
TR
AV
EL
TIM
E 2010 Travel to Work in 14 Minutes or Less 9.1% 9.2% 9.1%
2010 Travel to Work in 15 to 29 Minutes 20.1% 19.7% 19.5%
2010 Travel to Work in 30 to 59 Minutes 58.4% 57.0% 55.8%
2010 Travel to Work in 60 Minutes or More 12.5% 14.0% 15.7%
2010 Average Travel Time to Work 33.6 34.8 37.5
CO
NS
UM
ER
EX
PE
ND
ITU
RE
2016 Est. Total Household Expenditure $39.7 M $231 M $491 M
2016 Est. Apparel $1.39 M $8.07 M $17.1 M
2016 Est. Contributions, Gifts $2.33 M $13.9 M $29.6 M
2016 Est. Education, Reading $1.33 M $7.89 M $16.7 M
2016 Est. Entertainment $2.20 M $12.8 M $27.3 M
2016 Est. Food, Beverages, Tobacco $6.35 M $36.6 M $77.9 M
2016 Est. Furnishings, Equipment $1.30 M $7.66 M $16.2 M
2016 Est. Health Care, Insurance $3.59 M $20.7 M $44.3 M
2016 Est. Household Operations, Shelter, Utilities $12.3 M $71.4 M $152 M
2016 Est. Miscellaneous Expenses $594 K $3.44 M $7.36 M
2016 Est. Personal Care $520 K $3.01 M $6.40 M
2016 Est. Transportation $7.79 M $45.2 M $96.1 M