Embed Size (px)
Citation preview
1 3/7/14
Low Carbon Fuel Standard Re-Adoption Concept Paper I. Introduction Transportation fuels play a key role in California’s economic success as well as the lifestyle of its residents. Traditional fuels, like gasoline and diesel, will continue to play a role in supporting California’s transportation needs for many years to come. At the same time, the production and use of traditional fuels is responsible for nearly half of the state’s greenhouse gas emissions. The Low Carbon Fuel Standard (LCFS) is a key part of a comprehensive set of programs in California to cut greenhouse gas emissions and other smog-forming and toxic air pollutants by improving vehicle technology, reducing fuel consumption, and increasing transportation mobility options. The LCFS is designed to decrease the carbon intensity of California’s transportation pool and provide an increasing range of low-carbon and renewable alternatives. This paper includes a set of options for consideration to strengthen the LCFS in achieving this objective. The California Air Resources Board (ARB/Board) approved the LCFS regulation in 2009 to reduce greenhouse gas (GHG) emissions by achieving a ten percent reduction in the carbon intensity of transportation fuels used in California by 2020. Carbon intensity (CI) is a measure of the GHG emissions associated with the various production, distribution, and consumption steps in the “life cycle” of a transportation fuel. The LCFS is designed to reduce GHG emissions by encouraging the use of low-carbon fuels in California and their production in California and elsewhere. The LCFS is performance-based and fuel-neutral, allowing the market to determine how the carbon intensity of California’s transportation fuels will be reduced. ARB approved some amendments to the LCFS in December 2011, which became effective on November 26, 2012, and were implemented by ARB on January 1, 2013. The current and complete regulatory text is available at http://www.arb.ca.gov/fuels/lcfs/CleanFinalRegOrder_112612.pdf. On July 15, 2013, the State of California Court of Appeal, Fifth Appellate District (Court) issued its opinion in POET, LLC versus California Air Resources Board (2013) 218 Cal.App.4th 681. The Court held that the LCFS would remain in effect and that ARB can continue to implement and enforce the 2013 regulatory standards while it takes steps to cure California Environmental Quality Act and Administrative Procedure Act issues associated with the original adoption of the regulation. To address the ruling and provide lasting market certainty, ARB staff is proposing that the Board re-adopt the LCFS regulation in 2014. Additionally, ARB staff is proposing a suite of amendments to provide a stronger signal for investments in and production of the cleanest fuels, offer additional flexibility, update critical technical information, and provide for improved efficiency and enforcement of the regulation. It has been nearly five years since the Board’s original action, and the core principles and policies of the LCFS regulation remain valid. The basic framework of the current LCFS, including the use of life cycle analysis, the LCFS credit market, and the LCFS Reporting Tool (LRT), among other aspects, are working and will continue. This
2 3/7/14
concept paper provides an overview of new elements being considered as part of the 2014 LCFS rulemaking effort. The concepts being considered reflect a range of potential changes, including straightforward updates to the regulation to more significant proposals for improving its overall effectiveness and long-term ability to support the production of increasingly lower-carbon fuels. The concepts will be discussed during a public process over the next several months. Based on stakeholder input, we may make adjustments to the proposals in this paper or recommend alternatives should they be determined to be more effective at realizing the objectives. II. Status of the LCFS
Since the regulation went into effect, regulated parties have successfully operated under the LCFS program. In short, the LCFS is working as designed and intended. Regulated parties as a whole continue to over-comply with the regulation, providing significant “excess” credits that can be used for future compliance. The requirements (i.e., one percent reduction in CI) are modest at this stage; staff believes that the current developments on clean fuels support compliance for years to come but recognize increasingly larger volumes of low-CI fuels will be needed to meet the targets as we approach 2020. Credits have been generated primarily from ethanol (62 percent), but also from renewable diesel (15 percent), biodiesel (12 percent), and from natural gas (9 percent). Approximately 270 LCFS credits transactions were recorded through February 2014, demonstrating a robust credit market. The LCFS credit prices, which started at $10 to $15/metric ton (MT) CO2e, have risen to $50 to $85/MT CO2e. Further, fuel producers are innovating and achieving significant reductions in the carbon intensities of their fuel pathways, an effect the LCFS regulation is expressly designed to encourage. So far, over 200 innovative fuel pathways (Method 2A/2B applications) have been reviewed and posted by staff.1 III. Timeline and Process
Staff will conduct an initial public workshop on March 11, 2014, to discuss potential amendments to the LCFS for 2014 and receive feedback from stakeholders. Other public workshops will be scheduled following the initial public workshop. Staff is also willing to meet with interested stakeholders to discuss staff’s proposal via conference calls and one-on-one meetings. Staff will propose a comprehensive LCFS package to the Board in the fall of 2014. IV. LCFS Re-adoption Although implementation of the LCFS has gone smoothly, there are opportunities to improve the regulation. Staff had planned to propose amendments to the Board in October 2013 and again in 2014, but in light of the lawsuit, staff determined it would be most efficient to consolidate amendments and return to the Board once in 2014.
1 See http://www.arb.ca.gov/fuels/lcfs/122310lcfs-rep-adv.pdf.
3 3/7/14
Therefore, many of the proposed revisions have already been identified and discussed in workshops with stakeholders. These proposed amendments will now be part of the consolidated regulation re-adoption package that responds to the Court’s decision.
a. Rationale for Amendments There are several factors driving the staff’s proposed amendments. First, based on stakeholder comments received in both the original 2009 rulemaking and 2011 amendments, the Board directed staff in Resolutions 09-31 and 11-39 to consider revisions to the regulation in a number of specific areas. These include updates to the electricity provisions, developing low-energy-use refinery provisions, evaluating a refinery-specific incremental deficit option, and approval of additional fuel pathways.
Second, staff has received feedback from regulated parties and other stakeholders throughout the implementation of the LCFS. This feedback informed the staff’s refinements contained in this proposal, such as incentives for petroleum refinery modernization projects and updates to the indirect land use change (iLUC) values. Finally, staff conducted internal reviews of lessons learned and has been assessing what has changed since the initial implementation of the LCFS. As part of this ongoing assessment, several broad themes have emerged. These include a need to consider developing a compliance schedule that goes beyond 2020 in order to meet California’s long-term climate goals. It is also clear that the LCFS would benefit from a greater focus on the long-term goal of ultra-low CI fuels to ensure the long-term effectiveness of the program, and some of the changes below reflect this emphasis. In addition, it is evident that certain aspects of implementing and improving the LCFS regulation, such as evaluating fuel pathways and improving iLUC values, are very resource intensive. In response, some modest changes may allow greater “bang for the buck” and provide additional resources to be put toward greater enforcement, consideration of significant innovations in the fuels sector, and ensuring accountability. Staff is interested in feedback on the proposed concepts and amendments outlined below, but staff is also interested in additional ideas to achieve the policy objectives of the LCFS and the themes described above.
b. New Concepts Being Considered The following four concepts are being introduced for feedback: GHG Emissions Reductions at Refineries ARB is proposing to allow refineries to generate credits for investments at the refinery that reduce GHG emissions. This provision is consistent with full life cycle analyses, but instead of reducing the CI of the fuels produced—as is done with biofuel production facilities—the CI for CARBOB and CARB diesel will remain the same for market fungibility purposes, so credits will need to be the mechanism for recognizing GHG
4 3/7/14
emission reductions at the refineries. These investments would also reduce associated toxic and criteria air pollutants. Refineries would submit a project plan to ARB for approval and staff would determine the difference between the refinery’s baseline CI of their transportation fuel and the new CI of their transportation fuels with the project in place. The difference will be used to calculate credits for the refinery. These credits would be eligible for sale to other regulated parties. Each refinery that generates a Refinery Investment Credit will have the CI of its transportation fuel reviewed periodically to ensure that the calculated difference has remained the same. Changes in the CI could result in an increase, decrease, or elimination of the credit in future years. Modification of Compliance Curves for Gasoline and Diesel Standards Staff is anticipating the rulemaking process for re-adoption of the LCFS to be concluded in 2015. This will likely keep LCFS regulatory standards at 2013 levels through 2015. Staff currently has no proposal to change the average carbon intensity target of 10 percent by 2020; however, staff believes that some post-2015 “curve-smoothing” will be appropriate. Staff is conducting an in-depth analysis of projected fuel availability that will inform the 2016 - 2020 compliance targets. Achieving the GHG and air quality goals outlined in the draft Scoping Plan Update will require a renewable portfolio of transportation fuels well beyond the current policy trajectories. Accordingly, in 2014 ARB will consider revising the LCFS with post-2020 targets that call for CI reductions greater than 10 percent. This additional analysis will also include the effects of proposed changes to the LCFS, such as potential revisions to the calculation of ILUC values, options for refineries to generate credits via a refinery credit provisions, provisions for electricity credits for off-road applications, and a cost containment provision, which may affect the volumes and types of fuels needed for compliance. Over the past several years, some stakeholders have raised concerns regarding the availability of low-CI fuels in quantities sufficient for compliance in future years. While staff disagrees with many of the fundamental assumptions leading to these concerns, we believe it is important to draw on the most up-to-date information to assess if there is sufficient progress towards meeting the regulation’s future carbon intensity reduction targets. As a result, ARB is analyzing what low-CI fuels are likely to be available for compliance by 2020 as well as the 2030 timeframe, based on industry, academic, and government sources. Staff is developing low-CI fuel projections that take into account the effect of petroleum prices on the production of biofuels which will result in low, medium, and high projections. Staff is also in the process of identifying which of these fuels are likely to come to California to be used for compliance with the LCFS, based on the demand-pull incentive structure of the program (i.e., lowest-cost compliance). ARB staff will continue to work on the analysis as it will help to inform any appropriate regulatory improvements.
5 3/7/14
Refinery-Specific Crude Oil Incremental Deficit Accounting Based on the fact that smaller refineries can be affected by the California Average crude oil incremental deficit, but cannot affect the Annual Crude Average carbon intensity, ARB is proposing to allow low-complexity/low-energy-use refineries to opt out of the California Average Crude Provision in the current LCFS regulation and instead have their crude oil incremental deficit calculated on a refinery-specific basis. The large, complex refineries would continue to operate under the California Average crude oil provision. The low-complexity/low-energy-use refineries would be allowed a one-time, irreversible opportunity to opt for refinery-specific accounting. Interested refineries would have an incremental deficit assessed if their refinery Annual Crude Carbon Intensity exceeds their refinery 2010 Baseline Crude Carbon Intensity. Participating refineries would also be required to:
Work with staff to properly characterize all crudes supplied to the refinery;
Provide detailed descriptions, sources, and volumes of refinery intermediate feedstocks and petroleum-based blendstocks that are supplied to the refinery; and
Provide sources and volumes of finished products supplied by outside refineries.
These additional requirements will help to ensure accurate accounting of crude oil carbon intensity for these low volume refineries. Fuel Pathways and Producer Facility Registration LCFS stakeholders have expressed concerns that many of the Method 2 pathways in the Lookup Table and on the Method 2 web site are not available for wider use by regulated parties. In response to those concerns, as well as to the need to focus the program on the promotion of innovation, staff proposes to restructure the certification and registration functions. We are proposing a two-tiered system in which conventionally produced first-generation fuels, such as starch- and sugar-based ethanol, would fall into the first tier, while next-generation fuels, such as cellulosic alcohols, would fall into the second tier. Any fuel (first or next generation) produced using an innovative method, such as carbon capture and sequestration, would fall into the second tier. Producers of first-tier fuels would be registered into CI bins using an application process that is similar to the existing Method 2 process. The bins would consist of simple carbon intensity ranges. The CI of all fuels in a given bin would be the midpoint of the range that defines that bin. The same registration process fuel providers would use to obtain a first-time tier-one CI would be used to move from one bin to another. This
6 3/7/14
single, uniform tier-one registration process would replace the existing Methods 1, 2A, and 2B processes. Producers of second-tier fuels would apply for fuel pathways using a modified version of the existing Method 2 process. Staff would also have the ability to develop and post tier-two pathways for the use of qualifying fuel providers. When the new LCFS regulation goes into effect, staff would classify all pathways in use at that time into either tier one or tier two. If the new regulation contains provisions requiring that existing CIs be recalculated, those recalculations would have to be completed and approved by staff before the existing pathways could be registered into the new system. Staff also proposes to adopt a new model for calculating life cycle CIs under the LCFS. That new model would most likely be based upon one of two current versions of the Greenhouse gases, Regulated Emissions, and Energy use in Transportation (GREET) spreadsheet from Argonne National Laboratory. One is the latest spreadsheet version of the model, and the other is the new non-spreadsheet version of the model, GREET.net Details of the staff proposal along with a discussion of alternative approaches considered are presented in Appendix A.
c. Proposed Amendments from 2013
In addition to the above proposals, a number of proposals have already been workshopped and discussed with stakeholders in 2013. Staff is reintroducing these proposals along with our current recommendations. Cost Containment Provision Staff proposes the creation of a cost containment provision that would increase market certainty about the maximum costs of compliance, strengthen incentives to invest in and produce low-CI fuels, and provide additional compliance options. Staff drafted a white paper on LCFS cost containment ideas in 2013 and discussed the concept at a May 24, 2013, workshop. Staff is continuing to evaluate the following two options from that white paper but remain open to alternatives that more effectively achieve the same objectives:
1. Credit Clearance Option
Under the credit clearance option, regulated parties would be allowed to carry over deficits to the next compliance period, provided that they purchase their pro rata share of all credits made available for sale during a “credit clearance” period. Credit clearance periods would occur at the end of compliance years in which some regulated parties are
7 3/7/14
unable to obtain the credits on the open market that are required for compliance. At the beginning of the credit clearance period, regulated parties with excess credits would be asked to pledge any credits that they would like to sell at or below a pre-determined price ceiling. Deficit-holding regulated parties’ pro rata share would then be calculated based on the size of each party’s deficit, and the total number of credits pledged by sellers. Once a regulated party purchases its pro rata share of credits, it would be able to carry its remaining deficit over into the following compliance year. Deficits that are carried over would become part of that regulated party’s cumulative compliance obligation and incur interest, to be repaid in subsequent compliance years.
2. Credit Window Option
Under a credit window concept, compliance-only credits would be available for purchase from ARB at a pre-determined price if regulated parties are unable to obtain sufficient credits on the open market. The proceeds from the sale of LCFS credits would go into the Air Pollution Control Fund, unless directed by the Legislature to expend the funds in some other manner. Staff is evaluating these two options for their potential to:
• Send a strong and transparent market signal to investors regarding the value of low-CI fuels;
• Provide additional options for economical paths to compliance; and • Minimize the potential for unintended, negative market consequences.
The credit clearance option is the preferred approach because it ensures that credit shortages or price spikes do not destabilize the LCFS credit market, and it strengthens the incentives to invest in low-CI fuels by providing a strong and transparent price signal. The credit clearance option also minimizes the potential for unintended negative market consequences, and enables conventional fuel suppliers to comply with the program without paying for credits or fuels that the market has failed to produce. Revised iLUC Values Indirect Land Use Change values for corn ethanol, sugarcane ethanol, and soy biodiesel were included in the LCFS when the Board approved it in 2009 and 2010. Published literature and knowledge in this area has continued to evolve. The Board directed staff to refine the iLUC analysis, taking into account advancements in methodology, data, and scientific understanding. Based on recommendations provided by an Expert Working Group (EWG, established per the Board’s directive) and other stakeholders, staff contracted with experts to refine and improve the iLUC analysis. Accordingly, staff, working cooperatively with the academic researchers, has incorporated significant changes in the estimation of iLUC for biofuels. In addition, a new carbon emission factor model was developed to provide
8 3/7/14
better estimates of carbon released upon land conversion. Updates to the GTAP2 model include the addition of data and parameters to estimate iLUC for two new biofuels (canola biodiesel and sorghum ethanol), and necessary refinements in methodology and structure to address recommendations of the EWG and stakeholders. Staff contracted with experts and performed uncertainty evaluations using the Monte Carlo analysis. Staff is also proposing to include impacts related to irrigation and forestry sector into the iLUC analysis in the near-term. Preliminary results indicate reductions in the iLUC values for soy biodiesel, sugarcane ethanol, and corn ethanol. Staff is proposing to present the results at the March 11 workshop to solicit feedback from stakeholders. Details of the staff draft proposal are presented in Appendix B. Electricity Provisions Staff has worked with stakeholders to develop a proposal to add electricity used in fixed guideway systems and electric forklifts to the regulation as eligible to generate credits. The addition of electricity credits would provide greater compliance flexibility to the regulation and be consistent with the objective of promoting low carbon fuel alternatives in a broader spectrum of technologies. Staff held meetings of the LCFS Electricity Workgroup in November 2012 and January 2013 to discuss these concepts. Staff presented the results of the analysis at a public workshop in April 2013 and recommended the proposed concepts at a public workshop in May 2013. Details of the staff proposal along with a discussion of alternative approaches considered are presented in Appendix C. Low-Energy-Use Refinery Provisions On December 16, 2011, the Board directed staff in Resolution 11-39 to consider provisions to the LCFS to address low-energy-use refining processes. This Resolution language was meant to address concerns from refineries that use simple processes to refine transportation fuels to account for the low energy inherently embedded into their fuels. ARB staff investigated the complexity of each California refinery using the Nelson Complexity Score as well as the total energy use of each refinery. Staff is proposing that in order to be considered low-energy-use, a refinery must have a modified Nelson Complexity score of five or less and that the annual energy usage would have to be five million MMBtu or less. Each refinery would have to comply with both parts of the metric to be considered a low-complexity and low-energy-use refinery. Staff has been working to quantify the difference in transportation fuel carbon intensities between low-complexity/low-energy use refineries and the complex refineries. Staff is proposing to recognize this CI difference within the LRT.
2 GTAP stands for Global Trade Analysis Project, a global economic model used by staff to estimate
iLUC.
9 3/7/14
Details of the staff proposal are presented in Appendix D. Innovative Technologies for Crude Oil Production Currently, the LCFS has a provision for awarding additional credits to refiners who purchase crude oil produced in an innovative manner that lowers greenhouse gas emissions (i.e., carbon capture and sequestration and solar-generated steam for injection). Responding to stakeholder feedback, staff proposed in a workshop last year to instead award the crude producers with the innovative production credit, as this would send a stronger economic signal to the producers who are investing in these technologies. A properly designed provision to reward oil producers for implementing innovative greenhouse gas reduction technologies can provide substantial environmental and economic benefits3. Staff will also propose to:
include biomass-based steam as an innovative technique;
include onsite solar, wind, and biomass-based electricity as innovative techniques;
include carbon capture coupled with carbon dioxide enhanced oil recovery as an innovative technique under certain circumstances;
remove the minimum threshold of 1.0 g/MJ carbon intensity reduction to qualify as an innovative technique; and
simplify the application process and calculation of innovative method credit for solar steam and solar- or wind-based electricity.
Revisions to OPGEE and Updates to the Crude Lookup Table 8 In March 2013, staff presented draft revisions to the Oil Production Greenhouse Gas Emissions Estimator (OPGEE v1.1 Draft A) and an expanded and updated Crude Oil Lookup Table (Table 8). OPGEE v1.1 Draft A incorporated several small revisions to the model, which were made in response to stakeholder feedback during and following the 2011 amendment process. Based on feedback received on OPGEE v1.1 Draft A, staff is presenting OPGEE v1.1 Draft B and related model documentation for feedback at the workshop on March 11, 2014. Proposed revisions to Table 8 will include both updated carbon intensity values for listed crudes and expansion of the table to include carbon intensity values for all crudes supplied to California refineries from 2010 to 2013, as well as additional crudes of interest to California refiners. This expanded Lookup Table will list carbon intensity values for over 100 internationally and nationally marketed crudes and nearly 200 California oil fields. Table 8 will also include a limited number of default carbon
3 A white paper discussing Innovative Technologies for Crude Oil Production will posted at a later date.
10 3/7/14
intensity values to be used in the event a refinery purchases crude not listed in the table. The default carbon intensity will be used until the crude carbon intensity is included in the table as part of a subsequent update. Finally, staff is proposing that subsequent revisions to OPGEE and Table 8 occur no more frequently than on a three-year cycle and be considered through an Executive Officer hearing process given the administrative nature of the updates. Updating OPGEE and Table 8 on a three-year cycle rather than annually will provide more certainty to refineries for crude purchases as well as allowing limited staff resources to be redirected to other LCFS tasks. Enhancements to Reporting and Recordkeeping Requirements Staff intends to propose several amendments to various reporting requirements under LCFS to provide clarity and tighten the implementation of the program. Staff expects to work with stakeholders to refine the concepts discussed below and identify other appropriate changes. Record retention is another issue that will be addressed in the revised provisions. Staff is proposing to align the record retention requirements applied to the ARB Cap and Trade Program to the LCFS Program. In order to improve the traceability of fuels to the source, staff is proposing to add a provision that requires reporting of all Transaction Types identified in the regulation, including transactions without obligation transfer. There are other proposed enhancements to the reporting requirements associated with the chain of custody for fuels being produced or imported into the State. Further, to substantiate the validity of companies that register in the LRT as a regulated party, a modified registration process will be identified, enabling ARB staff to do a more thorough pre-registration check of each company. Staff will also propose enhancements to LCFS Product Transfer Documents (PTDs) to include fuel production facility information. Additionally, it would be required to include a statement on the PTD that clearly identifies that the fuel has been reported under California’s LCFS. Once reported in the LCFS, it may not be re-imported and reported a second time for additional credits. Finally, the opt-in/opt-out provisions of the regulation would be modified to enable the opt-out process to be implemented online, replacing the current paper-based process. Enhancements to LCFS Credit Provisions Staff intends to propose several amendments to LCFS credit provisions to clarify and tighten the implementation of the program. Some of these provisions were discussed with stakeholders last year. Key elements of the changes being proposed are discussed below.
11 3/7/14
Staff is proposing to require use of the online LCFS Reporting Tool and Credit Bank & Transfer System (LRT-CBTS) for performing all credit transfers. Although the current regulatory text does not explicitly require use of the online system, it has become the de facto standard for recording credit transfers, and staff’s proposal would simply formalize this. In addition, staff’s proposal will provide details of the automated processes as well as authorization protocols for the use of brokers that represent regulated parties. A hierarchy for how credits are to be retired will also be provided. Finally, a provision to allow voluntary posting of credits available for sale/transfer will be provided to facilitate communication between prospective credit buyers and sellers. Staff also intends to clarify LCFS requirements pertaining to credit retroactivity. Currently, the regulation does not allow credit retroactivity except under limited circumstances (the physical pathway demonstration provision). Staff believes that there is some merit in allowing for a limited expansion of the retroactivity of credits. For example, limited retroactive credits could be issued to a Method 2 applicant considering specified conditions are met. In those cases where there is retroactive credit generation, to the extent that it is allowed, this will be limited to no greater than the two full quarters immediately prior to the quarter in which retroactive credits are requested by a regulated party. Other amendments include clarifying language stating that all LCFS credits are to be calculated in the LRT-CBTS. The provisions for placing credits on hold for lack of physical pathway demonstration purposes would be revised to clarify the process and the Credits on Hold process used in the LRT-CBTS to ensure they remain consistent. Finally, staff proposes to clarify the procedures to address situations where more than one regulated party is claiming LCFS credits for the same volume of fuel. In addition, language to provide ARB Executive Officer authority to retire credits found to be invalid will be added. Enforcement Provisions Staff discussed with stakeholders last year preliminary enforcement concepts to be incorporated into the LCFS. The primary goal of this provision is to provide clarity in the enforcement provisions to ensure that penalties are fair and effective at maintaining compliance and deterring noncompliance. Staff expects to work with stakeholders to come up with specific provisions that align with these criteria. In addition to the above items, staff has identified miscellaneous textual revisions in the LCFS based on stakeholder questions and recommendations. We expect to workshop these through the public process.
i
3/7/14
APPENDICES List of Appendices Appendix A: Fuel Pathways and Producer Facility Registration Appendix B: Revised Indirect Land Use Change Values Appendix C: Electricity Provisions Appendix D: Low-Energy-Use Refinery Provisions
A-1
3/7/14
Appendix A Fuel Pathways and Producer Facility Registration
This Appendix contains additional information regarding staff’s proposal to restructure the fuel pathways and producer facility registration functions. In this rulemaking, staff proposes to restructure the fuel pathway certification and registration functions to accomplish two important goals:
To streamline and simplify these two functions; and
To refocus our efforts on the development and certification of next generation fuels, and on the adoption of innovative production methods in all types of fuel pathways.
In order to achieve these two goals, the certification and registration functions would be restructured to create a two-tiered system. Conventionally produced first generation fuels—starch- and sugar-based ethanol, biodiesel, renewable diesel, natural gas, and electricity—would fall into tier one, while next generation fuels—cellulosic alcohols, biomethane, hydrogen, drop-in fuels, etc.—and innovatively produced first-generation fuels would fall into tier two. Under the proposed tier one process, fuels will be registered into carbon intensity (CI) bins. Staff will create a series of bins for each tier one fuel using life cycle inventory data obtained from various sources, including existing Method 2 applications. Each bin will consist of a mutually exclusive CI range. The CIs at the top, bottom and midpoint of each bin range will be integers. Tier one CIs will have no decimal places. When a producer registers a tier one fuel pathway, that fuel will be assigned the CI at the middle of the range for the bin into which it falls. Producers of first-tier fuels would be registered into CI bins using an application process that is similar to the existing Method 2 process. The same registration process fuel providers use to obtain a first-time tier-one CI would be used to move from one bin to another. This single, uniform registration process would replace the existing Methods 1, 2A, and 2B processes now in place for all fuels. Registration application packets will include, but will not be limited to, the following:
1. Energy consumption data covering a full two-year period. All forms of thermal and electrical process energy consumed during this period will be accounted for. This data will normally be in the form of energy purchase invoices or receipts.
2. A comprehensive list of the types and quantities of all chemicals, organisms,
and feedstocks used in the production process. Users of atypical chemicals, organisms, or feedstocks (e.g., newly developed enzymes, acids or buffering agents for which staff possess no life cycle inventory data, genetically modified microorganism or feedstock strains, etc.) may be required to submit
A-2
3/7/14
life cycle inventory data on those materials in order to determine whether they contribute significantly to a fuel’s life cycle carbon intensity.
3. If two or more pathway CIs are being sought based on how co-products are
processed, data on the processing of co-products would be required. One such co-product is distiller’s grains with solubles (DGS), which is co-produced with corn and sorghum ethanol. DGS may or may not be dried before it is consumed by livestock. Due to the energy used in the drying process, ethanol associated with dry DGS has a higher life cycle CI than ethanol associated with wet DGS. In order to apply for two or more CIs based on co-product processing, the plant must submit third-party-validated, plant-specific data definitively demonstrating the energy use differential between the co-products. Any other relevant life cycle inventory data will also be required. In the absence of such data, the fuel will receive a single CI reflecting its total two-year energy consumption record.
4. Feedstock production information. If the CA-GREET default feedstock
production CI is claimed, no additional information would be required. If a lower feedstock production CI is claimed, feedstock-specific life cycle data would be required. If the feedstock is covered by LCFS audit and certification protocols, a lower feedstock production CI would be certified only after the audit and certification protocols have been satisfied.
Tier one fuels produced using qualifying innovative methods would be considered under the tier two process. Use of an innovative method, including but not limited to one of the following, would allow a producer to apply for a producer-specific CI under the tier two process:
1. Use of one or more low-CI process energy sources. In order to qualify as an innovative, low-CI energy source, energy from that source must be directly consumed in the production process. No indirect accounting mechanisms, such as the use of renewable energy certificates, can be used to reduce an energy source’s CI. Innovative, low-CI energy sources include, but are not limited to, the following:
a. Biogas or biomethane;
b. Waste (as defined below) or residual4 biomass; c. Renewable electricity from a dedicated (non-grid) form of generation
i. Wind turbines,
4 Residual biomass consists of agricultural, forest, or other types of residues. To qualify for consideration
under the tier two process, such residues will have to be certified as having been sustainably harvested.
A-3
3/7/14
ii. Photovoltaic arrays,
iii. Fuel cells using a renewably-produced fuel (e.g., biomethane or hydrogen produced from biomethane or from solar-powered electrolysis);
2. Carbon Capture and Sequestration; and
3. A production process innovation that results in a significant decrease in CI.
Fuels would be required to register under the tier one process unless:
1. They are produced using one or more innovative methods such as those described above; and
2. Their CI is below a tier-two threshold CI, to be established by the Executive
Officer. Thresholds would be specific to fuel families (e.g., sugar-based ethanol, tallow-based biodiesel, etc.)
The fuels that would be required to register under the tier one process (absent the innovative methods discussed above) include, but are not limited to:
1. Ethanol produced from starch and sugar crops (corn, grain sorghum, sweet sorghum, sugar cane, etc.);
2. Biodiesel produced from used cooking oil, tallow, corn oil, soy oil, canola oil, or camelina oil. Biodiesel produced from other feedstocks that are substantially similar those in this list would also be required to register under the tier one process.
3. Renewable diesel produced from cooking oil, tallow, corn oil, soy oil, canola
oil, or camelina oil. Renewable diesel produced from other feedstocks that are substantially similar to those in this list would also be required to register under the tier one process.
4. Fossil-natural-gas-based CNG, LNG, and L-CNG5; and
5. Grid electricity used to charge electric vehicles, including plug-in hybrid
electric vehicles. The use of renewable energy certificate or other “green portfolio” designations could not be used to reduce the CI of grid electricity. When used to charge battery-electric vehicles, electricity from dedicated, low-CI, off-grid sources would qualify as a tier two fuel.
5 L-CNG is LNG that is vaporized and then compressed into (and dispensed as) CNG.
A-4
3/7/14
When the new LCFS regulation goes into effect, staff would classify all Method 2 pathways in use at that time into either tier one or tier two. If the new regulation contains provisions requiring that existing CIs be recalculated, those recalculations would have to be completed and approved by staff before the existing pathways could registered into the new system. Recalculating and registering the existing pathways into tier-one bins is expected to take some time. Staff proposes establishing a three-to-six-month registration phase-in period to accomplish this task. The Method 2 process to which tier two fuels would be subject would be a more intensive version of the tier one registration process just described. Although the same basic categories of pathway information would be required under both processes, staff is relatively unfamiliar with the life cycles of tier two fuels. Life cycle inventory data covering tier two pathways may, if it exists at all, be of questionable applicability to the specific Method 2 applications staff is evaluating. Staff will need to work with applicants to verify the data that applicants submit. Verification through third-party audits may be necessary in some cases. These audits may be performed in connection with the enforcement and quality assurance provisions discussed elsewhere in this document. Compared to the existing Method 2 certification process, therefore, the proposed tier 2 process will require applicants to provide more and higher quality data. Data quality will be largely a function of how well that data has been verified. Applicants should be prepared to provide independent, third-party verification of the data they submit. Increased data quantity requirements will be met either through the submission of verified data sets from sophisticated plant data-logging systems, or by similarly verified empirical data gathered through fully controlled in-plant experimental testing. Given the increasing value of the low-carbon fuels falling into the second tier, investments in data collection and verification will more than pay for themselves through the premiums these fuels will command in the market and the credits they will earn. In order to ensure that all material and energy inputs into the production process are fully and completely accounted for under the tier-two application process, staff will develop clear guidelines covering input accounting. These guidelines will specify that no input can be designated as a “waste” unless its current and foreseeable future alternative fate is final disposal. Final disposal is defined as either landfilling or destruction (through, e.g., incineration). The CIs of inputs that receive “waste” designations under the LCFS will include only the transportation, conveyance, handling, and processing steps to which those inputs are subject. Waste inputs would inherit no CI increment from the processes that originally generated them. As energy and other markets diversify over time, however, fewer and fewer materials and energy sources are sent to final disposal. As a result, staff will require extensive, thorough, and third-party-verified data before granting a “waste” designation to any input. Most Inputs that are not designated as wastes, will inherit their share of the CI associated with the processes that generated them. Fuel pathways in which steam from other, unrelated processes (e.g., power plants) is used, for example, will inherit the full CI from the process that generated that steam (e.g., a natural gas boiler).
A-5
3/7/14
Some inputs may receive “low-value byproduct” designations. Although these inputs are not wastes, the markets into which they are sold (when they are not used as fuel production inputs) are limited, and the market prices they receive are low. An example is molasses from sugar production in Indonesia. This substance has traditionally been used as a low-value poultry feed supplement. Its value is too low to allow it to be profitably exported. When this substance is diverted into ethanol production, it must come into that process with a non-zero CI. Given its low-value byproduct status, however, it should not inherit its full share of the GHG emissions from the production of sugar. It should, instead, receive the CI of the product that replaces it in the poultry feed market after it is diverted into ethanol production. This “displacement” method will be the preferred approach to account for low-value byproducts used as fuel production inputs. Staff also proposes to adopt a new model for calculating life cycle CIs under the LCFS. That new model would most likely be based upon one of two current versions of the Greenhouse gases, Regulated Emissions, and Energy use in Transportation (GREET) spreadsheet from Argonne National Laboratory. One is the latest spreadsheet version of the model, and the other is the new non-spreadsheet version of the model, GREET.net
B-1
3/7/14
Appendix B Revised Indirect Land Use Change Values
This Appendix contains additional information regarding staff’s proposal to the revised indirect land use change (iLUC) values. Chapter IV and Appendix C of the original LCFS Initial Statement Of Reasons (March 5, 2009) provide an overview of the concept of iLUC, methodology used in performing the iLUC modeling, results and discussion of the iLUC effects, and a brief discussion of ongoing analysis and uncertainties in the iLUC estimates. This material provides the basis for comparing the changes to the iLUC analysis to be discussed in this section. Topics covered include the LCFS Expert Working Group (EWG) and recommendations made by its subgroups and independent experts, updates to the iLUC analysis included in this round of modeling revisions, and potential longer-term model updates to be addressed in the future. In Resolution 09-31, the Board directed the Executive Officer to convene an Expert Working Group (EWG) to assist the Board in refining and improving the land use and indirect effect analysis of transportation fuels. This workgroup was tasked with evaluating factors that might impact the land use values for biofuels, including agricultural yield improvements, co-product credits, land emission factors, yield price elasticity, and other relevant factors. The EWG presented their recommendations in November 2010, which were later summarized in a report to the Board in December 2010. The reports can be accessed at http://www.arb.ca.gov/fuels/lcfs/workgroups/ewg/expertworkgroup.htm ARB staff conducted a review of recommendations from the EWG and other independent reviewers (who participated in the EWG process) to determine which recommendations were appropriate and set about prioritizing the model revisions. Both ARB staff and its expert consultants received and considered additional input and feedback from stakeholders and subject matter experts after the completion of the EWG process. Specific model and data updates that were incorporated in draft modeling presented in 2011 include:
1) Use of the GTAP 7 database (moving from 2001 to 2004 baseline data) 2) Addition of cropland pasture category in the U.S. and Brazil 3) Re-estimated energy sector demand and supply elasticity values 4) Improved treatment of corn ethanol co-product (DDGS) 5) Improved treatment of soy meal, soy oil, and soy biodiesel 6) Modified structure of the livestock sector 7) Improved method of estimating the productivity of new cropland 8) Adopting a consistent model version and set of model inputs for all biofuel
pathways 9) Revised yield response to price 10) Revised demand response to price 11) Increased flexibility of crop switching in response to price signals
B-2
3/7/14
12) Incorporation of an endogenous yield adjustment for cropland pasture6
Most of the GTAP model and data modifications above are described in detail in the report provided to ARB by its expert consultant, Wallace Tyner of Purdue University.7 For the 2009 regulation, the GTAP model used endogenous carbon emission factors (from Woods-Hole) to estimate iLUC by modeling biofuel expansion. These were aggregated and did not conform to the region/agro-ecological zone (AEZ) framework of the GTAP model. In 2010, ARB contracted with researchers to refine the emission factor framework to match the GTAP model and to also update the factors based on current data. The researchers utilizing data sources and methodology from the IPCC, FAO, and other published literature, developed a spatially explicit emission factor model to conform to the GTAP structure of region/AEZ. This model is called the agro-ecological zone emission factor (AEZ-EF) model. The workshop on September 24, 2011, presented details, documents, and the AEZ-EF model.8,9,10 The results for land conversion from the GTAP model were combined with the corresponding AEZ/Region and land transition type to calculate total carbon emissions. Since 2011, there have been updates to the AEZ-EF model. The changes include:
1) Contributions to carbon emissions from Harvested Wood Products (HWP) was updated in the model using data compiled by Earles et al.11
2) Additional modifications to HWP were performed using above-ground live biomass (AGLB) after 30 years in each region.
3) Peat emission factor was updated to 95 Mg CO2/ha/yr using the ICCT report12 4) Added OilPalmCarbonStock based on Winrock update to RFS2 analysis.13,14 5) Updated forest biomass carbon, forest area, and forest soil carbon data using
latest data from Gibbs et al.15
6 Taheripour, F., Tyner, W., and Wang, M., August 2011, Global Land Use Changes due to the U.S.
Cellulosic Biofuel Program Simulated with the GTAP Model 7 Tyner, W., September 2011, Interim Report: Calculation of Indirect Land Use Change (ILUC) Values for
Low Carbon Fuel Standard (LCFS) Fuel Pathways, posted online at http://www.arb.ca.gov/fuels/lcfs/09142011_iluc_wtreport.pdf 8 http://www.arb.ca.gov/fuels/lcfs/lcfs_meetings/lcfs_meetings_2011.htm
9 Gibbs, H., and Yui, S., September 2011. Preliminary Report: New Geographically-Explicit Estimates of
Soil and Biomass Carbon Stocks by GTAP Region and AEZ, posted online at http://www.arb.ca.gov/fuels/lcfs/09142011_iluc_hgreport.pdf 10
Plevin, R., Gibbs, H., Duffy, J., Yui, S. and Yeh, S., September 2011. Preliminary Report: Agro-ecological Zone Emission Factor Model, posted online at http://www.arb.ca.gov/fuels/lcfs/09142011_aez_ef_model_v15.pdf 11
Earles J. M., Yeh, S., and Skog, K. E., Timing of carbon emissions from global forest clearance, Nature Climate Change, 2012; DOI: 10.1038/nclimate1535 12 Page, S. E., Morrison, R., Malins, C., Hooijer, A., Rieley, J. O., and Jauhiainen, J., Review of Peat
Surface Greenhouse Gas Emissions from Oil Palm Plantations in Southeast Asia, White Paper Number 15, September 2011, www.theicct.org 13
Harris, N., and Grimland, S., 2011a. Spatial Modeling of Future Oil Palm Expansion in Indonesia, 2000 to 2022. Winrock International. Draft report submitted to EPA. 14 Harris, N., and Grimland, S., 2011b. Spatial Modeling of Future Oil Palm Expansion in Malaysia, 2003
to 2022. Winrock International. Draft report submitted to EPA.
B-3
3/7/14
6) Updated IPCC_GRASSLAND_BIOMASS_TABLE with data from Gibbs et al.16 7) Other minor changes in the model.
In the 2012-2014 timeframe, staff working with Purdue University added additional biofuel modeling capabilities, made changes to the structural elements, and completed extensive evaluations of certain parameters in the GTAP model. The changes include:
1) Disaggregated sorghum from the coarse grains sector to allow for modeling iLUC impacts for sorghum ethanol;
2) Disaggregated canola (rapeseed) from the oilseeds sector to facilitate modeling of iLUC for canola based biodiesel; and
3) Developed regionalized land transformation elasticities for the model using recent evidence for land transformation.17
Parameters and structural elements that were reviewed in detail include:
1) Completed exhaustive review of literature on yield price elasticity; 2) Compared DDGS exports predicted by the model to real-world export data; 3) Reviewed model outputs for biodiesel to study impacts on marginal vegetable
oil in the global markets due to ‘removal’ of vegetable oils for biofuel production; 4) Worked with Purdue to tune regional land transformation elasticities to address
land conversion related to managed versus unmanaged forests; 5) Studied impacts of land transformation elasticities on land conversion estimates
in general and forestland in particular; 6) Evaluated impacts of varying Armington elasticity on model outputs; 7) Researched Purdue’s use of TEM results to develop ETA values; and 8) Investigated time accounting methods including reviewing updated literature
articles. Based on staff review, necessary modifications were made to the model for some of these issues. It was determined that some issues require structural modifications or methodological changes (e.g., use of dynamic version) and will be addressed in the future. Based on staff assessment of various parameters, methodology, and modeling framework, staff proposed to use a matrix of scenarios by varying values for YDEL18, ETL119, ETL220, PAEL21, and ETA22. These parameters were also identified by the
15 Gibbs, H., Yui, S., and Plevin, R. J., in review. Improved Estimates of Soil and Biomass Carbon
Stocks for Global Economic Models. West Lafayette, Indiana: Purdue University. 16
Ibid. 17
Taheripour, F., and Tyner, W. Biofuels and Land Use Change: Applying Recent Evidence to Model
estimates, Appl. Sci. 2013, 3, 14-38; doi:10.3390/app3010014 18
Price yield elasticity 19
Land transformation elasticity that governs land conversion between forest, cropland, and pasture land 20
Land transformation elasticity that distributes available cropland between crops 21
Cropland pasture elasticity
B-4
3/7/14
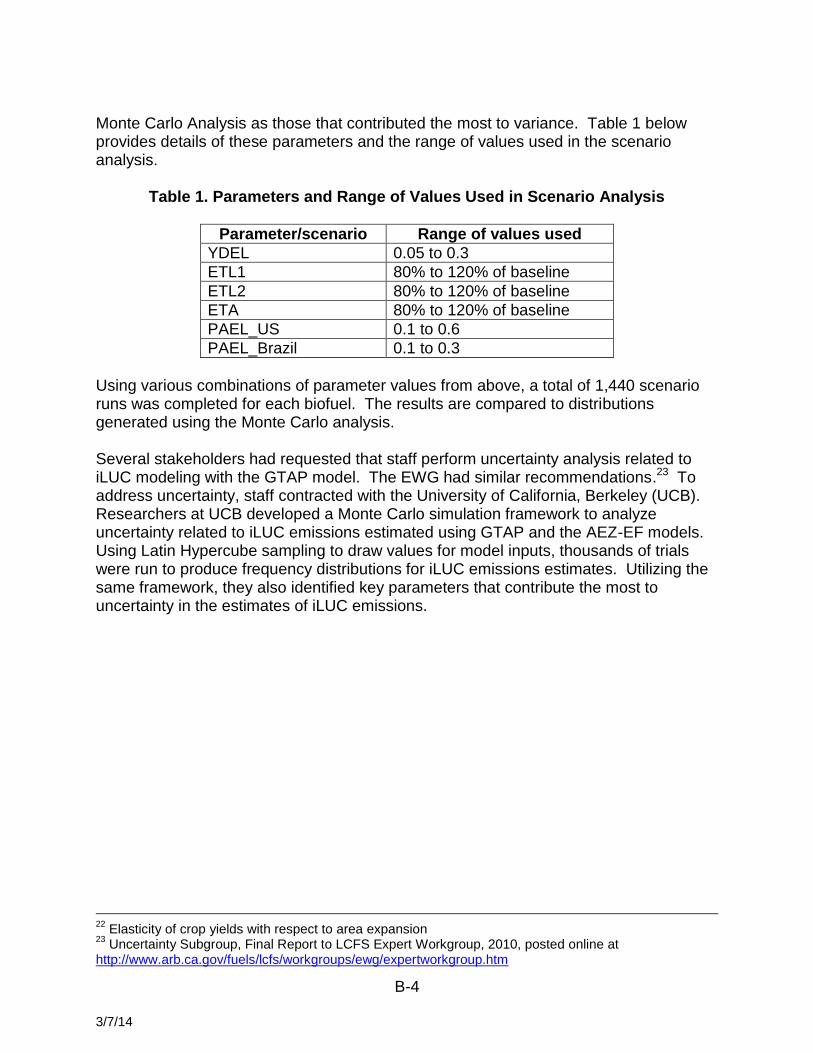
Monte Carlo Analysis as those that contributed the most to variance. Table 1 below provides details of these parameters and the range of values used in the scenario analysis.
Table 1. Parameters and Range of Values Used in Scenario Analysis
Parameter/scenario Range of values used
YDEL 0.05 to 0.3
ETL1 80% to 120% of baseline
ETL2 80% to 120% of baseline
ETA 80% to 120% of baseline
PAEL_US 0.1 to 0.6
PAEL_Brazil 0.1 to 0.3
Using various combinations of parameter values from above, a total of 1,440 scenario runs was completed for each biofuel. The results are compared to distributions generated using the Monte Carlo analysis. Several stakeholders had requested that staff perform uncertainty analysis related to iLUC modeling with the GTAP model. The EWG had similar recommendations.23 To address uncertainty, staff contracted with the University of California, Berkeley (UCB). Researchers at UCB developed a Monte Carlo simulation framework to analyze uncertainty related to iLUC emissions estimated using GTAP and the AEZ-EF models. Using Latin Hypercube sampling to draw values for model inputs, thousands of trials were run to produce frequency distributions for iLUC emissions estimates. Utilizing the same framework, they also identified key parameters that contribute the most to uncertainty in the estimates of iLUC emissions.
22
Elasticity of crop yields with respect to area expansion 23
Uncertainty Subgroup, Final Report to LCFS Expert Workgroup, 2010, posted online at http://www.arb.ca.gov/fuels/lcfs/workgroups/ewg/expertworkgroup.htm

B-5
3/7/14
Short-Term and Long-Term Model Updates
Researchers at Purdue University are under contract to explore model changes, some of which were recommended by the EWG. These issues are listed below and some have references made to the EWG subgroup or independent reviewer final report which describes the recommendation in detail: Short-Term Updates
1) Split crop production into irrigated versus rain-fed and develop datasets and metrics to assess impacts related to water-constraints in agriculture across the world.
2) Continue to update and improve the land pools within GTAP deemed to be accessible for conversion to cropland. Additional land pools may include “inaccessible” forests; unmanaged shrub land, grassland, and savanna; idle/fallow/abandoned cropland; and other marginal (low productivity) lands.24 Split existing forestland into managed/unmanaged forestry sectors.
Long-Term Updates:
1) Consider a broader range of significant indirect emissions from land use changes such as, but not limited to, those related to fertilizer, livestock and rice production and from crop switching.25
2) Consider accounting for the effects of non-Kyoto climate forcing gases and particles (e.g., black carbon) in addition to carbon dioxide, methane, and nitrous oxide.26
3) Adopt a modeling framework that allows for the dynamic nature of land use change that can incorporate time dependent changes such as technology driven yield improvements and food demand (influenced by the dynamics of economic and demographic change). This will likely involve switching to a dynamic version of GTAP.27
4) Evaluate alternative approaches to calculating yields on new agricultural lands based on statistical analysis of climate and management factors using updated datasets.28 Estimates of yields on newly converted lands should also factor in economics of land selection.29
5) Evaluate alternative approaches to how the model determines which land types (e.g., forest or pasture lands) are converted to cropland. This either involves a
24
Land Cover Types Subgroup, Final Report to the LCFS Expert Workgroup, November 22, 2010, posted online at http://www.arb.ca.gov/fuels/lcfs/workgroups/ewg/expertworkgroup.htm 25
Carbon Emission Factors Subgroup, Final Report to the LCFS Expert Workgroup, November 19, 2010, posted online at http://www.arb.ca.gov/fuels/lcfs/workgroups/ewg/expertworkgroup.htm 26
Ibid. 27
Land Cover Types Subgroup, Final Report to the LCFS Expert Workgroup, November 22, 2010, posted online at http://www.arb.ca.gov/fuels/lcfs/workgroups/ewg/expertworkgroup.htm 28
Ibid. 29
Berry, S., January 4, 2011. Report to ARB: Biofuels Policy and the Empirical Inputs to GTAP Models. Posted online at http://www.arb.ca.gov/fuels/lcfs/workgroups/ewg/expertworkgroup.htm
B-6
3/7/14
significant change in model structure or the use of land conversion probabilities for each region of the world which are exogenous to the model. Currently the model estimates both the amount of land converted to crops and the type of land converted. Observed land conversion probabilities could be used to better calibrate the model estimates of type of land converted (i.e., calibrate the CET function parameter on a regional level). Alternatively, the model could be used to predict only the amount of land converted and observed data for land conversion probabilities could be used to estimate the type of land converted.30,31
6) Evaluate the use of Armington versus Heckschler-Ohlin structures for modeling international trade. The use of Armington structure for trade in GTAP, although appropriate in the short term, may be unrealistic over the long term. Armington assumptions give greater preference to meeting increased demand with domestic production or from normal trading partners. In contrast, the Heckschler-Ohlin structure assumes similar crops of different origin are nearly perfect substitutes. 32,33
30
Ibid. 31
Elasticity Values Subgroup, Final Report to the LCFS Expert Workgroup, 2010, posted online at http://www.arb.ca.gov/fuels/lcfs/workgroups/ewg/expertworkgroup.htm 32
Berry, S., January 4, 2011. Report to ARB: Biofuels Policy and the Empirical Inputs to GTAP Models. Posted online at http://www.arb.ca.gov/fuels/lcfs/workgroups/ewg/expertworkgroup.htm 33
Reilly, J., November 4, 2010, Report to ARB: GTAP-BIO-ADV and Land Use Emissions from Expanded Biofuels Production, Posted online at http://www.arb.ca.gov/fuels/lcfs/workgroups/ewg/expertworkgroup.htm
C-1
3/7/14
Appendix C Electricity Provisions
This Appendix contains additional information regarding staff’s proposal to the electricity provisions.
1. Off–Road Categories for Credit Generation The current regulation allows regulated parties to generate credits for electricity used in on-road vehicles only. However, credit generation could potentially be expanded to electricity used in off-road vehicles. The Board directed staff in Resolutions 09-31 and 11-39 to evaluate the feasibility of issuing credits for non-road electricity-based transportation sources, including mass transit, and propose amendments, if appropriate, to the regulation. As a result, staff has worked with stakeholders to develop a proposal to add electricity used in fixed guideway systems and electric forklifts to the regulation as eligible to generate credits. In considering potential off-road categories to add to the regulation, staff selected fixed guideway systems and electric forklifts as categories of electric transportation that use significant amounts of electricity and have been identified as eligible to voluntarily opt into the LCFS program.
Fixed Guideway Systems
For the purposes of the LCFS regulation, a fixed guideway system is a system of public transit electric vehicles that can operate only on its own guideway constructed specifically for that purpose, such as light rail or heavy rail, exclusive right-of-way bus operations, and trolley coaches. In California, these systems provided lower carbon transportation for over 340 million passenger trips in 2012 (American Public Transportation Association 2013). Providing an opportunity for credit generation for use of electricity as a transportation fuel supports the overall purpose of the LCFS to reduce GHG emissions from the transportation sector, reduce California’s dependence on petroleum, create a lasting market for clean transportation technology, and stimulate the production and use of alternative, low-carbon fuels in California. Staff proposes that transit agencies operating fixed guideway systems be eligible to opt-into the program and become regulated parties, and therefore qualify to generate credits, for electricity used to propel fixed guideway systems. There are six transit agencies in the state reporting electricity use for transit propulsion annually to the National Transit Database (National Transit Database 2012). Staff further proposes to allow Electrical Distribution Utilities (EDUs) to be regulated parties for electricity used for propulsion in fixed guideway systems in their service area if the transit agency is unable or unwilling to participate in the program. To calculate the number of credits generated for electricity use in fixed guideway systems, the Energy Efficiency Ratio (EER) must first be determined. The EER is the efficiency of the system compared to the efficiency of the mode of transport riders would have taken if the system was not available. EERs are often in units of
C-2
3/7/14
fuel energy (MJ)/mile; however, for mass transit it is necessary to take into account the number of passengers riding. Therefore, EERs for fixed guideway systems calculated for the LCFS program are as follows:
EER = annual propulsion energy (MJ)/(total passengers) (total miles traveled) This method accounts for the fact that transit cars that operate with a full load of passengers are more efficient, in general, than transit cars that carry few passengers. Staff determined EER values for systems compared to both a passenger car and a diesel transit bus. Transit surveys suggest that approximately one-third of passengers would have otherwise taken their trip using a car and one-third would have taken a bus (the remaining one-third gave a variety of answers, including not taking the trip, carpooling, or unknown) (Bay Area Rapid Transit 2012). There is little difference between the two EER values, and staff chose to compare the energy use of the fixed guideway system to the energy use of a diesel bus. Electricity use for transit is available in the National Transit Database program and ridership data is available in the Public Transportation Ridership Report. EER values vary significantly among fixed guideway systems in the state. For this reason, staff is proposing to use the most recent information available to calculate EER values for input into the LCFS Reporting Tool (LRT) for credit calculation. EER values will be updated in the LRT as deemed appropriate. All of the fixed guideway systems in California operating today were also operating in 2010, the LCFS baseline year. Because the displacement of diesel fuel cannot be attributed to the LCFS for the electricity used on transit lines that were also operating in 2010, staff proposes to use a modified credit formula that does not give credit for diesel fuel displacement. The modified credit formula is:
( ) ( )
where:
is the carbon intensity requirement of diesel fuel for a given year; is the adjusted carbon intensity value of electricity, in gCO2e/MJ,
calculated as per Section 95484(a)(3)(B); is the total amount of energy used for fixed guideway transit
propulsion, in MJ; and
( ) ( ) For credits associated with future fixed guideway system expansion that includes extension to existing track, staff proposes to use the credit formula in Section 95485(a)(3) which provides for diesel displacement credit. Staff estimates that during the 2015-2020 time period, total credit generation for fixed guideway transportation could potentially be as high as 900,000 credits (MTCO2e) if all regulated parties opted into the program and reported all electricity used for propulsion.
C-3
3/7/14
Based on an estimated credit value range of $40 to $100, these credits could be valued at $36M to $89M. If all fixed guideway transportation credits were generated and all credits were sold to satisfy program obligations, the impact on the LCFS program could be one percent of the total program GHG reductions.
Electric Forklifts Nationwide, electric forklifts, including motorized hand trucks, have taken a larger market share than internal combustion engine (ICE) forklifts powered by gasoline, propane, compressed natural gas, or diesel fuel in recent years (Industrial Truck Association 2013). Staff estimates the number of Class 1, 2, and 3 electric forklift shipments to California in 2012 was approximately 11,500 (Industrial Truck Association 2013, U.S. Census Bureau 2013). An increase in electric forklift use coupled with a decrease in ICE forklift use will result in decreased GHG emissions and contribute to meeting the goals of the LCFS program. Staff proposes that EDUs be the regulated parties, and therefore qualify to generate credits, for electricity used to charge forklifts. Many EDUs are currently submitting quarterly LCFS reports for electricity used in on-road EVs, and could also include forklift electricity use in quarterly submittals. Many electric forklifts are charged without the use of a dedicated meter to measure electricity use. Facilities often charge batteries used in multiple equipment types using the same charging equipment and meter. In addition, tracking down metered data for thousands of forklifts would likely be cost prohibitive. For these reasons, staff proposes to estimate the amount of electricity used to charge electric forklifts in each utility service area. The number of forklifts used in California and the amount of electricity used by the fleet can be estimated using national shipment data, battery size, assumed annual operating hours and load factor. Further, each utility’s share can be approximated based on their share of the state’s non-residential (business/commercial) accounts. It is likely that many of the electric forklifts that are operating in California today were also operating in 2010, the LCFS baseline year. Because the displacement of diesel fuel cannot be attributed to the LCFS for the electricity used in forklifts that were also operating in 2010, staff proposes to use a modified credit formula that does not give credit for diesel fuel displacement. The modified credit formula is:
( ) ( )
where:
is the carbon intensity requirement of diesel fuel for a given year; is the adjusted carbon intensity value of electricity, in gCO2e/MJ,
calculated as per Section 95484(a)(3)(B); is the total amount of energy used for electric forklifts, in MJ; and
C-4
3/7/14
( ) ( ) Furthermore, staff estimates that during the 2015-2020 time period, total credit generation for electric forklifts could potentially be as high as 200,000 credits (MTCO2e) if all regulated parties opted into the program and reported all electricity used for forklifts. Based on an estimated credit value range of $40 to $100, these credits could be valued at $8M to $20M. If all electric forklift credits were generated and all credits were sold to satisfy program obligations, the impact on the LCFS program could be 0.2 percent of the total program GHG reductions.
Alternative Approaches Staff considered two alternative approaches to allowing fixed guideway transportation and electric forklifts to participate in the program and generate credits as explained above. The alternatives are 1) to propose no amendments to address credit generation from these sources, and 2) to modify the 2010 LCFS baseline to include alternative fuels. Simply, the electricity used in fixed-guideway transportation and electric forklifts is a transportation fuel. Therefore, that electricity should be eligible as an opt-in fuel in the LCFS. There are additional benefits for recognizing this electricity under the LCFS. If no action is taken to include fixed guideway transportation and electric forklifts as eligible to generate LCFS credits, the result would be no change in the number of credits that would otherwise be available on the LCFS market. The larger credit pool that would result from additional available credits could hold credit prices at a lower level; conversely, not offering a credit opportunity for fixed guideway transportation and electric forklifts would remove this potential effect on the credit price. Further, the additional revenue from credit sales for transit agencies could result in increased ridership due to added transit lines, stops, or public outreach efforts. Higher fixed rail ridership could result in additional displacement of gasoline and diesel fuel use, thereby improving air quality as well as providing additional GHG emission benefits. Credit revenue from electric forklift use may be used to educate fleet operators on the benefits of electric forklifts or to provide lower electricity rates to fleet operators. Such benefits would not be realized if no action is taken. The second alternative considered by staff involves modifying the 2010 baseline to include alternative fuel use. In this analysis, staff first determined the fuel use of transit and non-transit natural gas, transit electricity and electric forklifts in 2010. Next the carbon intensity of these fuels was incorporated into the 2010 diesel standard based on each fuel’s portion of the total fuel pool (diesel and diesel replacements). A revised diesel standard was determined, and corresponding annual standards calculated, to reflect the revision. Including alternative fuel use in the baseline lowers the 2010 diesel standard by approximately 2 gCO2e/MJ and subsequent standards for 2015-2020 by approximately 1 gCO2e/MJ. This standard adjustment would increase diesel deficits and decrease alternative fuel credits compared to the current program. Staff presented the results of this analysis at a public workshop in April 2013 and thereafter considered
C-5
3/7/14
stakeholder feedback. Staff chose not to pursue the baseline approach because compliance with the diesel standard would become more difficult with no corresponding benefit to the alternative fuel market. In addition, because these credits would be generated only if regulated parties opt-in to the program and report electricity use, a change to standards based on potential credit generation would be unfair to diesel regulated parties. This recommendation was subsequently presented at a public workshop in May 2013.
2. Modification of Requirement for all Electricity Reporting to be Metered Data Staff is proposing to modify the requirement that all reporting of electricity used in residential EV charging after January 1, 2015, is based on direct metering. The modification would allow for an approved electricity estimation method to be used, where metered data was not available, after January 1, 2015. To date, many EV drivers have elected not to install direct EV metering at their residences. Therefore, a provision has been included in the regulation to allow regulated parties to, upon Executive Officer approval, use an estimation method to approximate residential EV charging electricity. The estimation method currently being used by some utilities34 is based on all available directly metered data in each utility’s service territory and California Department of Motor Vehicles registration data. The number of credits generated through an estimation method is not expected to differ significantly from the number of credits generated solely through the reporting of metered data (if all EV drivers employed direct metering to measure their charging electricity). Staff considered the no action alternative to the staff proposal. No modification to the metering requirement would significantly decrease the number of available credits in the market and likely increase the cost of complying for those needing to purchase credits. For this reason, staff believes that an amendment is necessary to continue providing credit generation opportunity from estimated electricity use.
34
http://www.arb.ca.gov/fuels/lcfs/workgroups/elect/04122013-caletc-letter.pdf
D-1
3/7/14
Appendix D Low-Complexity/Low-Energy-Use Refinery Provisions
This Appendix contains additional information regarding staff’s proposal to the low-complexity/low-energy-use refinery provisions. On December 16, 2011, the Board directed staff in Resolution 11-39 to consider provisions to the LCFS to address low-energy-use refining processes. This Resolution language was meant to address concerns from refineries that use simple processes to refine transportation fuels to account for the low energy inherently embedded into their fuels. ARB staff investigated the complexity of each California refinery using the Nelson Complexity Score as well as the total energy use of each refinery.
1. Modified Nelson Complexity Score
The Nelson Complexity Score was first developed in 1960 by W. L. Nelson. It is a metric that compares the cost of a process unit as compared to a distillation unit. The relative capacity of each unit as compared to the distillation unit is used to calculate the overall complexity of the refinery (Nelson, 1976). For example, one barrel of crude is sent through the distillation unit, but only a fraction of that barrel is sent through the subsequent “downstream” processing units. Each fraction is multiplied by the complexity index for each process unit and then summed. That sum is the complexity of the refinery. The complexity of California refineries was calculated using the 2010 World Wide Refining Survey (OGJ, 2010). This survey included updated Nelson Complexity factors as well as process unit capacities. Since the LCFS deals with transportation fuels, the Nelson Complexity Score was modified to exclude asphalt and lube oil production. Equation 1 shows the calculation for the modified Nelson Complexity Score. Table 1 contains all the indices.
∑ ( ) (
)
Eq. 1
where: = 2012 Nelson Complexity Index listed in Table 1;
= capacity of each unit listed in Table 1;
= capacity of distillation unit;
= process unit; and = total number of process units.
D-2
3/7/14
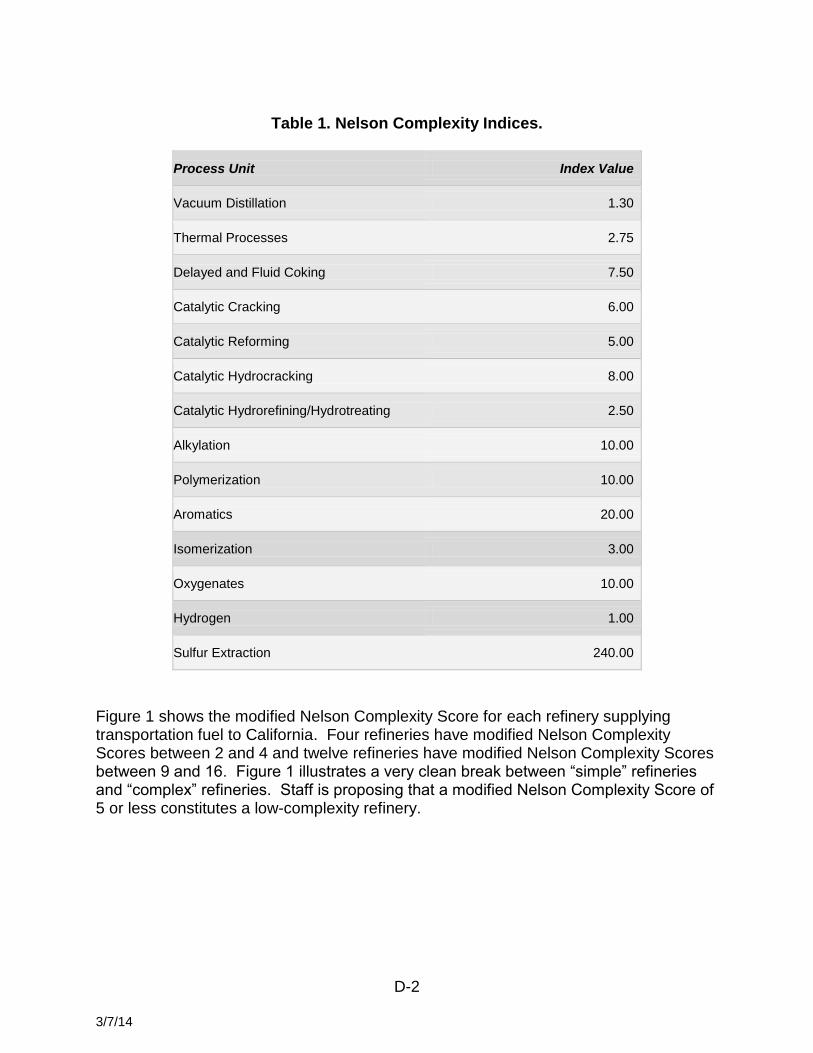
Table 1. Nelson Complexity Indices.
Process Unit Index Value
Vacuum Distillation 1.30
Thermal Processes 2.75
Delayed and Fluid Coking 7.50
Catalytic Cracking 6.00
Catalytic Reforming 5.00
Catalytic Hydrocracking 8.00
Catalytic Hydrorefining/Hydrotreating 2.50
Alkylation 10.00
Polymerization 10.00
Aromatics 20.00
Isomerization 3.00
Oxygenates 10.00
Hydrogen 1.00
Sulfur Extraction 240.00
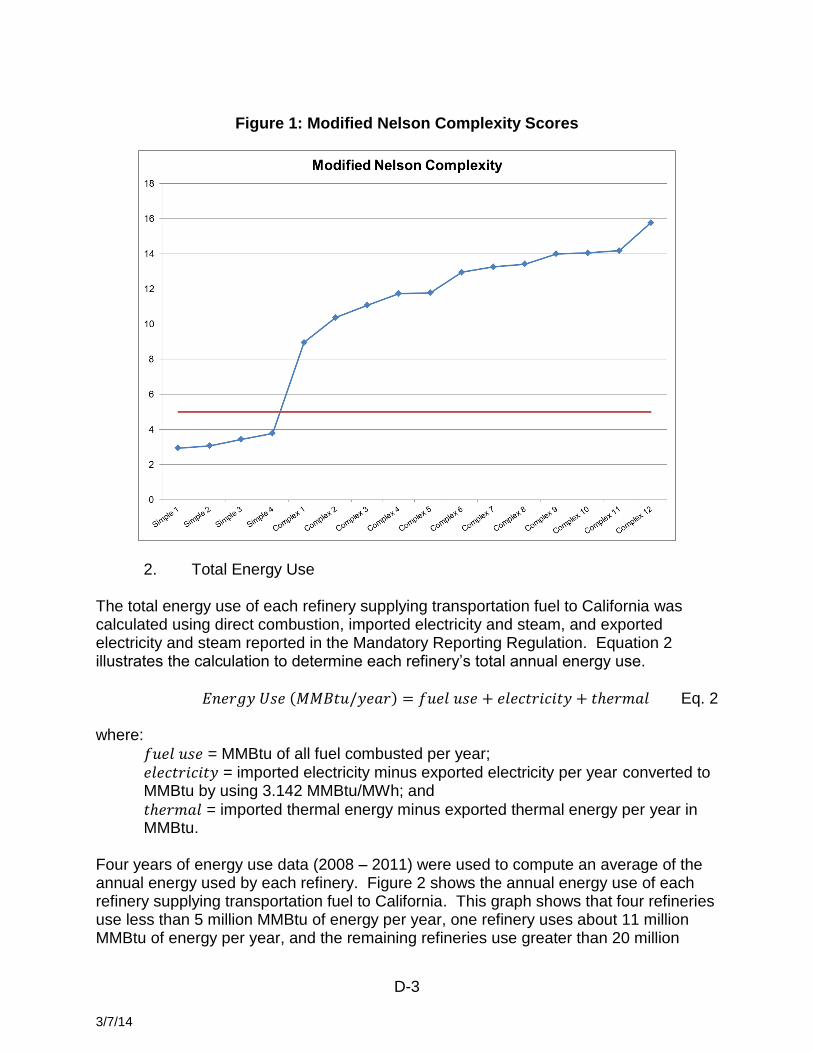
Figure 1 shows the modified Nelson Complexity Score for each refinery supplying transportation fuel to California. Four refineries have modified Nelson Complexity Scores between 2 and 4 and twelve refineries have modified Nelson Complexity Scores between 9 and 16. Figure 1 illustrates a very clean break between “simple” refineries and “complex” refineries. Staff is proposing that a modified Nelson Complexity Score of 5 or less constitutes a low-complexity refinery.
D-3
3/7/14
Figure 1: Modified Nelson Complexity Scores
2. Total Energy Use
The total energy use of each refinery supplying transportation fuel to California was calculated using direct combustion, imported electricity and steam, and exported electricity and steam reported in the Mandatory Reporting Regulation. Equation 2 illustrates the calculation to determine each refinery’s total annual energy use.
( ) Eq. 2 where:
= MMBtu of all fuel combusted per year; = imported electricity minus exported electricity per year converted to MMBtu by using 3.142 MMBtu/MWh; and
= imported thermal energy minus exported thermal energy per year in MMBtu.
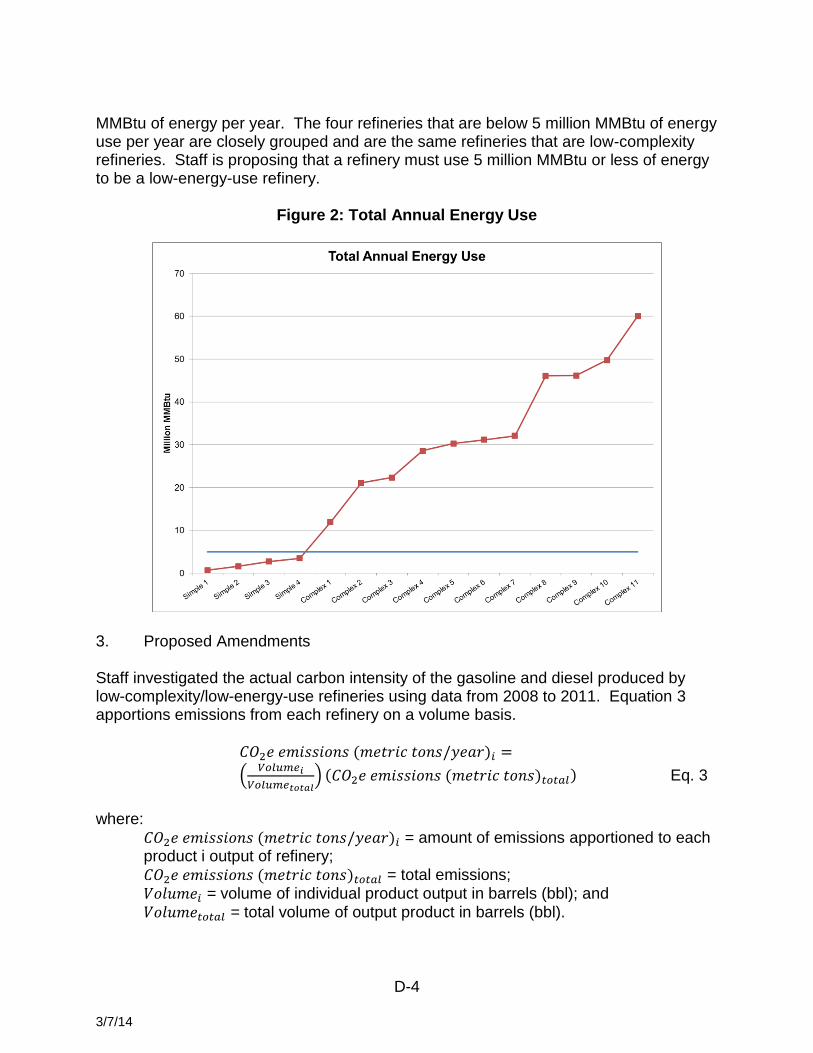
Four years of energy use data (2008 – 2011) were used to compute an average of the annual energy used by each refinery. Figure 2 shows the annual energy use of each refinery supplying transportation fuel to California. This graph shows that four refineries use less than 5 million MMBtu of energy per year, one refinery uses about 11 million MMBtu of energy per year, and the remaining refineries use greater than 20 million
D-4
3/7/14
MMBtu of energy per year. The four refineries that are below 5 million MMBtu of energy use per year are closely grouped and are the same refineries that are low-complexity refineries. Staff is proposing that a refinery must use 5 million MMBtu or less of energy to be a low-energy-use refinery.
Figure 2: Total Annual Energy Use
3. Proposed Amendments Staff investigated the actual carbon intensity of the gasoline and diesel produced by low-complexity/low-energy-use refineries using data from 2008 to 2011. Equation 3 apportions emissions from each refinery on a volume basis.
( )
(
) ( ( ) ) Eq. 3
where:
( ) = amount of emissions apportioned to each product i output of refinery; ( ) = total emissions; = volume of individual product output in barrels (bbl); and = total volume of output product in barrels (bbl).
D-5
3/7/14
Each product was converted to total energy content using the Equation 4.
( ) ( ) ( (
)) ( (
)) Eq. 4
where:
( ) = total energy for each product output; = volume of individual product output in barrels (bbl); and
(
) = total energy content for each type of product.
Lastly, the total apportioned emissions for each product was divided by the total energy content for the volume of product produced. This renders the gCO2e/MJ for each product.
(
⁄ ) [ ( )
( ) ] (
) Eq. 5
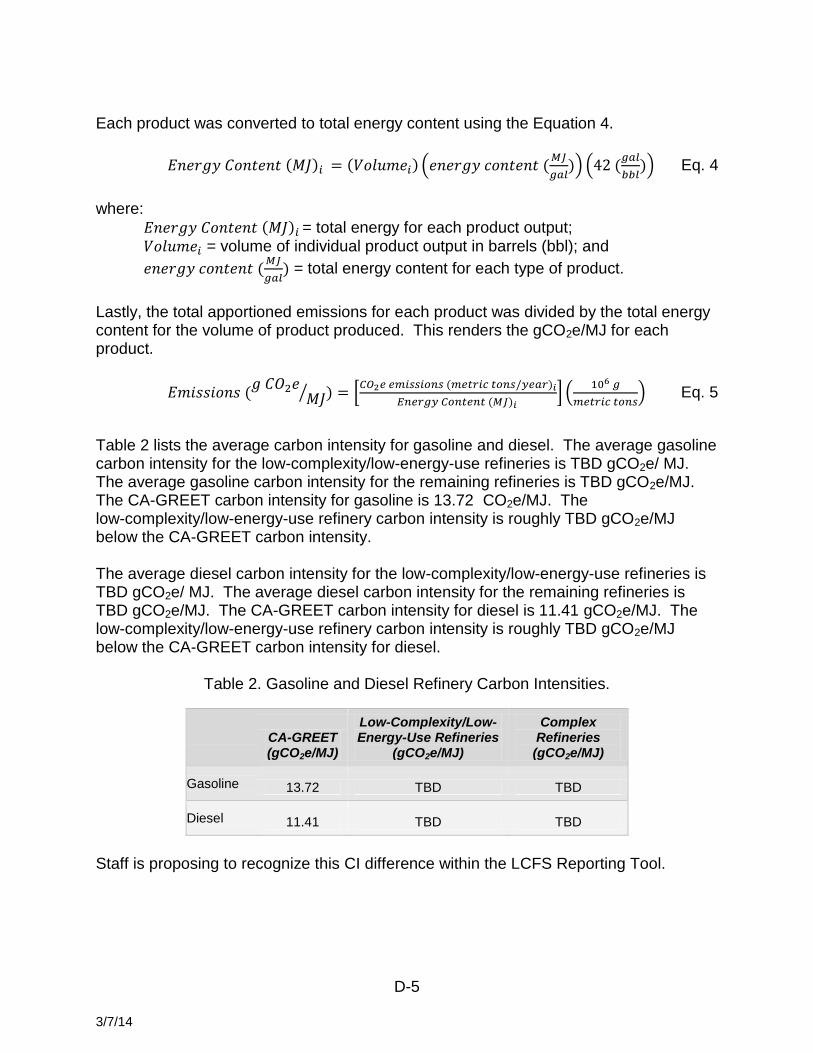
Table 2 lists the average carbon intensity for gasoline and diesel. The average gasoline carbon intensity for the low-complexity/low-energy-use refineries is TBD gCO2e/ MJ. The average gasoline carbon intensity for the remaining refineries is TBD gCO2e/MJ. The CA-GREET carbon intensity for gasoline is 13.72 CO2e/MJ. The low-complexity/low-energy-use refinery carbon intensity is roughly TBD gCO2e/MJ below the CA-GREET carbon intensity. The average diesel carbon intensity for the low-complexity/low-energy-use refineries is TBD gCO2e/ MJ. The average diesel carbon intensity for the remaining refineries is TBD gCO2e/MJ. The CA-GREET carbon intensity for diesel is 11.41 gCO2e/MJ. The low-complexity/low-energy-use refinery carbon intensity is roughly TBD gCO2e/MJ below the CA-GREET carbon intensity for diesel.
Table 2. Gasoline and Diesel Refinery Carbon Intensities.
CA-GREET (gCO2e/MJ)
Low-Complexity/Low-Energy-Use Refineries
(gCO2e/MJ)
Complex Refineries (gCO2e/MJ)
Gasoline 13.72 TBD TBD
Diesel 11.41 TBD TBD
Staff is proposing to recognize this CI difference within the LCFS Reporting Tool.