Embed Size (px)
Citation preview
Y
PO Box 1163 Billings, Montana 591 03-1 163 406 657 5380 Telephone --.e-.- .Ad* ,-*,n .F..%*
406 657 5374 Facsimile "'*
B 1. g
March 20, 2006
United States Nuclear Regulatory Commission Region IV ATTN: Mr. Robert Evans 61 1 Ryan Plaza Drive, Suite 400 Arlington, TX 7601 1
Re: Termination NRC Radioactive Materials License Number SUB-I 382, NRC Docket Number 040-08769
Dear Mr. Evans:
Please accept this letter as the ExxonMobil Billings refinery's official request for you to review and approve the revised version of the report entitled Radiological Survey and Dose Modeling for Termination of License SUB-I 382 that has been submitted to you via PDF file by Mr. Mark Garcia of Weston Solutions, Incorporated of Albuquerque, New Mexico.
This report contains the additional information and other revisions requested by your office's resources. It is our hope that you will approve the report and allow us to further our efforts in the termination of NRC Radioactive Materials License SUB-I 382. Should you have any questions or require any additional information, please contact me at (406) 657-5218 or Mr. Garcia at (505) 837-6586.
Thank you for your time and consideration in this matter
Since re1 y , /
Radiation Safety Officfer
S JClsjc
OVERNIGHT DELIVERY
cc: Robert Schoenfelder, Weston Solutions, Inc. Mark Garcia, Weston Solutions, Inc.

bcc: D. W. DeBats D. C. Parker J. R. Marshall M. R. Shaffer SHE File No. EN35-001-EG-G
Prepared for:
ExxonMobil Refining and Supply Company Billings, Montana
March 2006
Prepared by:
3840 Commons Ave., NE Albuquerque, New Mexico 87109
Mark Garcia, CMP, Technical Manager
Document Number: 1 3 0 1 4 ~ 0 1 0 ~ D ~ 0 1 9 ~ 0 6
TABLE OF CONTENTS
Section Page
1 . INTRODUCTION ......................................................................................................................... 1 1.1 OBJECTIVE ....................................................................................................................... 1 1.2 EXECUTIVE SUMMARY OF CONCLUSIONS ............................................................. 1 1.3 SITE HISTORICAL INFORMATION .............................................................................. 1
RADIOLOGICAL SURVEYS ...................................................................................................... 2 2.1
2 . SURVEY DESCRIPTION AND ESTIMATES OF RESIDUAL RADIOACTIVITY ............................................................................................................. 3 2.1.1 Instrumentation ................................................................................................... 3 2.1.2 F55 1 Furnace and Associated Process Equipment ............................................. 3 2.1.3 Potentially Impacted Areas ................................................................................. 6 2.1.4 Material Cleared for Release ............................................................................ 10 CONTAMINATED MATERIALS DISPOSAL .............................................................. 13 2.2.1 Bottom end flanges (Survey Unit #2) ............................................................... 13 2.2.2 Pipe Elbow from D503 (Survey Unit #4) ......................................................... 14 2.2.3 Catalyst Support Cones .................................................................................... 15 2.2.4 Catalyst Removed from Use ............................................................................. 16
2.2
3 . DOSE MODELING ..................................................................................................................... 16 3.1 SCENARIO - BUILDING OCCUPANCY ...................................................................... 17
3.1.1 Exposure Pathways Considered ........................................................................ 18 3.1.2 D and D General Parameters ............................................................................ 18 3.1.3 Building Occupaiicy Modeling Results ............................................................ 19 SCENARIO - RESIDENT FARMER .............................................................................. 19 3.2.1 Exposure Pathways Considered ........................................................................ 20 3.2.2 D and D General Parameters ............................................................................ 20 3.2.3 Resident Farmer Dose Modeling Results ......................................................... 20
4 . CONCLUSION ............................................................................................................................ 21
5 . REFERENCES ............................................................................................................................. 23
3.2
.. 11
LIST OF TABLlES
Table Page
1 2 3 4 5 6 7 8 9 10 11
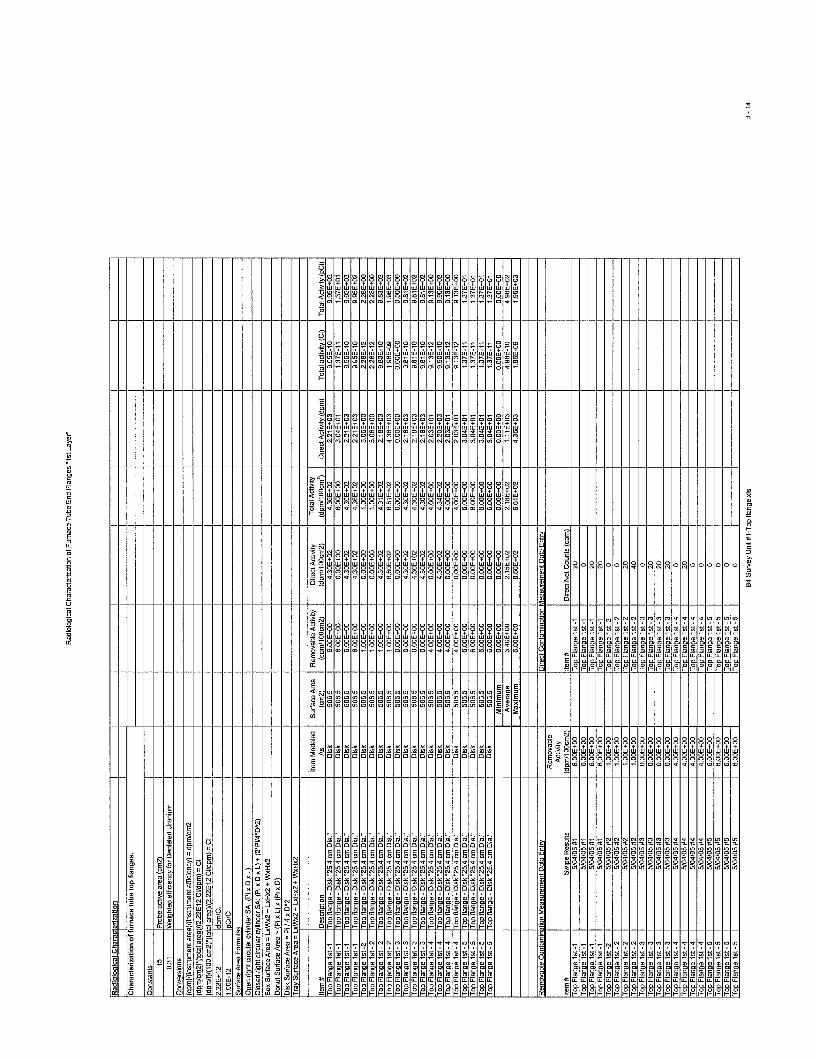
Furnace tube attaclment points and downstream equipment sumnary ........................................... 4 Results for Samples from Potentially Impacted Areas .................................................................... 7 Data Summary for Furnace Tubes Removed from F55 1 ............................................................... 11 Data Summary for Top End Flanges (Survey Unit #1) ................................................................. 12
Uranium Concentrations in Catalyst Samples ............................................................................... 16 Survey Data for the Building Occupancy Scenario ....................................................................... 17
Modeling Results for Building Occupancy Scenario ..................................................................... 19
Summary Data for Flange Nuts and Bolts (Survey Unit #3) ......................................................... 13
Determiiiation of Loose Fraction ................................................................................................... 18
Survey Data for the Resident Farmer Scenario .............................................................................. 20 Modeling Results for Resident Farmer Sceiiario ........................................................................... 20
LIST OF FIGURES
Figure Paqe
1 2 3 4 5 6 7 8 9 10 11 12 13 14 15 16
Process Schematic ............................................................................................................................ 5 Pigtail attachment points .................................................................................................................. 6
Spent Catalyst Storage area ............................................................................................................. 8 Mechanical Garage .......................................................................................................................... 8 F551 Sump ....................................................................................................................................... 9
Background location # 1 ................................................................................................................ 10
F55 1 furnace tubes itlid survey tool ............................................................................................... 11 Top end flanges Survey Unit # 1 ................................................................................................... 12 Hardware nuts and bolts Survey Unit # 3 ...................................................................................... 13 Bottom end flanges Survey Unit # 2 .............................................................................................. 14 D503 Pipe Elbow Survey Unit # 4 ................................................................................................. 15
Catalyst support cones inside radiological waste box .................................................................... 16
Downstream processing equipment - D503 ..................................................................................... 6
F55 1 perimeter ................................................................................................................................. 9
Background location # 2 ................................................................................................................ 10
Survey of catalyst support cones .................................................................................................... 15
LIST OF APPENDlClES
Appendix A Calculation of input source term to D and D model ........................................................... A-1 Appendix B Calculation of Source Tenn Inputs for Dose Modeling ....................................................... B-1 Appendix C Dose Modeling Report Summaries for . Building Occupancy Scenario ............................ C-1
Appendix E Minimum Detectable Concentration (MDC) Calculations ................................................... E-1 Appendix D Dose Modeling Report Sunmaries for . Resident Farmer Scenario .................................. D-1
... 111
XXONMOBIL DOSE MODELING
I. INTRODUCTION
This report was prepared by Weston Solutions, Inc. for the ExxonMobil Refining and Supply Co. ExxonMobil) refinery at Billings, Montana. The work was completed in conjunction with ExxonMobil’s decision to terminate its radioactive materials license no. SUB-1382 granted by the US. Nuclear Regulatory Commission, Region IV.
1.1 OBJECTIVE
The objective of the dose modeling is to determine if the materials remaining onsite are contaminated with depleted uranium to a level that would result in a dose to an individual in excess of 25 millirem (mrein). The 25 mrem dose limit has been established by the U.S. Nuclear Regulatory Commission (NRC) as the maximum dose to the average member of the critical group resulting from the unrestricted release of a site following license termination.
1.2 EXECUTIVE SUMMARY OF CONCLUSIONS
Depleted uranium (DU) consists of the uranium isotopes U-238, U-235, and U-234 in equilibrium with their associated decay products. Although DU consists of these isotopes, 99% of its mass is from U-238 and therefore, in this report the radionuclides of concern are U-238 and its associated decay products. WESTON defined the following five areas of interest at tlie facility to be addressed in the license termination:
The F55 1 furnace and associated downstreaiii equipment, . The spent catalyst storage area, . The mechanical building (garage), The F55 1 Furnace sump, and . The F55 1 fiirnace perimeter.
An average value is determined for each area of interest and used as tlie source tenn for the NRC- approved D and D version 2.1.0 computer model to determine if the license niay be terminated without restrictions, commonly known as unrestricted release.
Two modeling scenarios were used; one for building occupancy and one for a resident farmer. Although neither scenario is likely to happen, they were selected to provide a set of very conservative assumptions and ensure an over-estimate of the potential doses to the critical groups. The results of the surveying, sample collection, and dose modeling indicate that the residual contamination present at the site would result in a potential dose of 2.52 mrem per year to the resident farmer and 9.06 mredyr to the building occupant. These values are well below the 25 mrein per year limit for license termination with unrestricted use.
1.3 SITE HISTORICAL INFORMATION
From 1980 to 1986 the F551 Hydrogen Reformer furnace used 84 furnace tubes that contained a DU catalyst. The furnace tubes were approximately 40 feet long with an outside diameter (OD) of 6 inches, an inside diameter (ID) of 4.5 inches, and a wall thickness of 0.75 inches. Each tube had two 4-inch diameter pigtails, both located approximately 3 feet from the bottom of the tube. The catalyst s~ipport cones, known as “bullets,” were placed inside the bottom end of the tubes with the catalyst loaded on top. Although there were three different bullet designs, base dimensions were approximately 3 feet long, with
13014-01 0-D-019-06 RadSurvOoseMod-03-06.doc 1
4.5-inch OD and 4-inch ID, and one end of the bullet was tapered. Each fiirnace tube had an end cap flange approximately 1 inch thick and 10 inches in diameter at each end.
The DU catalyst was removed from each hibe in 1986, slipped off-site, and replaced with a non- radioactive nickel-molybdenum catalyst. A survey of several tubes conducted in 1988 led to the determination that the tubes would be managed as radioactively contaminated material. However, measurements performed in 1995 indicated that a large portion of each fiirnace tube (approximately 37 feet) was not contaminated above background levels and could have been released with no fiirther concern about radiation levels (free released) and disposed of as industrial waste or recycled.
In Febmary and March of 1995, all furnace tubes were removed for metallurgical inspection. Prior to inspection or disassembly, the fiirnace tubes were surveyed for fixed and removable radioactivity. Although the results generally demonstrated background levels at tube tops and at pigtails, some furnace tube bottom openings showed elevated levels above background. To remove this residual activity, workers wearing personal protective equipment (PPE) removed and cleaned all blind flanges and catalyst support cones using glove bags.
When surveys showed successful decontamination to a free release limit of less than 5,000 disintegrations per minute per 100 centimeters squared (dpd100 cm2), a confirmatory measurement for total (fixed and removable) contamination and removable contamination was conducted. Survey data from the 1995 tube refurbishment and decontamination indicate that the fiirnace tubes were all decontaminated to less than 5000 dpd100 cm2, at which time they were internally sandblasted, and no further surveys were conducted to document the final contamination levels. The tubes were placed back into service at that time.
During the 2002 Hydrocracker turnaround, five furnace tubes were removed (furnace tube numbers 62, 77, 81, 82, and 83). Approximately 3-foot sections of tube were cut from the ends of each tube. In addition, 17 catalyst s~ipport cones were removed. The end cap flanges from each of the five tube were removed as well. These tubes, cones, and flanges are stored on site in a wooden box within a secured area with appropriate labeling in place. Surveys performed at the time confirmed that contamination levels were less than 5,000 dpd100 cm2.
In 2005, during another Hydrocracker hirnaround that iiicluded replacement of all the tubes with new ones, ExxonMobil contracted WESTON to provide radiation safety support and perform radiation surveys and monitoring to characterize potentially contaminated equipment and areas, arrange for appropriate transportation and disposal of contaminated materials, and document final conditions to support termination of the NRC license. This report presents the dose modeling results, which are based on data from radiological surveys conducted at the site during this turnaround. Section 2 describes the areas surveyed and presents the results used in the modeling. Section 3 describes the modeling. Section 4 contains the conclusions reached through the modeling.
2. RADIOLOGICAL SURVEYS
Instrument surveys conducted during the 2005 turnaround indicated where residual contamination existed and which potentially contaminated areas were clean. Measurements were performed to meet two objectives. First, measurements were taken of potentially impacted areas and accessible sections of process equipment that were to remain in place after the turnaround was completed to provide input data for dose modeling to support license termination and release of the site for unrestricted use, and disposal of the materials cleared for release from the site. Second, measurements were taken of contaminated items for use in characterizing the waste to be disposed at a license radioactive waste disposal site.
2
During the Hydrocracker turnaround, radiological surveys were performed at the points where each individual fiirnace tube was attached to other process equipment and where related equipment were accessible to determine if upstream or downstream equipment had been contaminated during the use of radioactive materials. The surface radiological surveys included direct static surveys with handheld pancake GM survey meters and swipe samples for removable contamination. The swipe samples were analyzed for gross alpha activity.
Once the tubes were removed from the furnace and placed in a remote lay-down area, surveys were performed of the tubes, the equipment that was removed along with the tubes, and the potentially impacted areas where the catalyst was stored or equipment was handled. Survey results were used to segregate the items that would require disposal at a licensed radioactive waste site and to characterize the radioactive contents of the waste. Additional measurements were performed of the tubes, which were to remain at the site as uncontaminated items, for input to the dose models.
2.1 SURVEY DESCRIPTION AND ESTIMATES OF RESIDUAL RADIOACTIVITY
WESTON’s health physicist reviewed a process flow diagram for the F551 furnace and discussed it with ExxonMobil’s process engineer to determine the potential for residual contamination in various parts of the furnace and related process equipment. Parts of the equipment that could reasonably be contaminated were identified and plans were made to access them during the tube removal activities. Surveys were conducted of the accessible internal and external areas.
In addition, four potentially impacted areas of the site were identified based on WESTON’s review of the procedures for handling the catalyst and the furnace equipment. Those four areas were monitored for residual contamination on floor surfaces and in surrounding soils.
2.1 .I Instrumentation
The following instruments were used to perform the surveys described above.
Internal tube monitor -- Two pancake Geiger-Mueller (GM) detectors mounted back to back and attached to two data loggers were used to monitor the internal surfaces of the tubes. This unit is 22% efficient for SrN-90, which is similar in energy to the Th-234/Pa-234m decay product of U-238. Instrument efficiency and function tests were performed daily with a SrN90 source.
Surface monitor - Surfaces of equipment were scanned using a handheld pancake GM survey meter. This unit is 22% efficient for SrN-90, with energies similar to Th-234/Pa-2341n. Instrument efficiency and function checks were performed daily with a SrN90 source.
The rationale and mathematical formulas used to convert counts per minute (CPM) detected by these instruments to dpm/100 cm’ of DU is presented in Appendix A. The method of calculating the static and scanning miniinum detectable concentrations for the GM detector is presented in Appendix E. The MDC static is approximately 1900 dpm/lOO cin’, and the MDC scan is approximately 2200 dpinA00 cm’.
Removable contamination monitor - Swipes were counted on a commercial alpha swipe counter with a 37.5% efficiency for U-238 and a 36.3% efficiency for Th-230. Instrument efficiency and function checks performed daily with a Th-230 source.
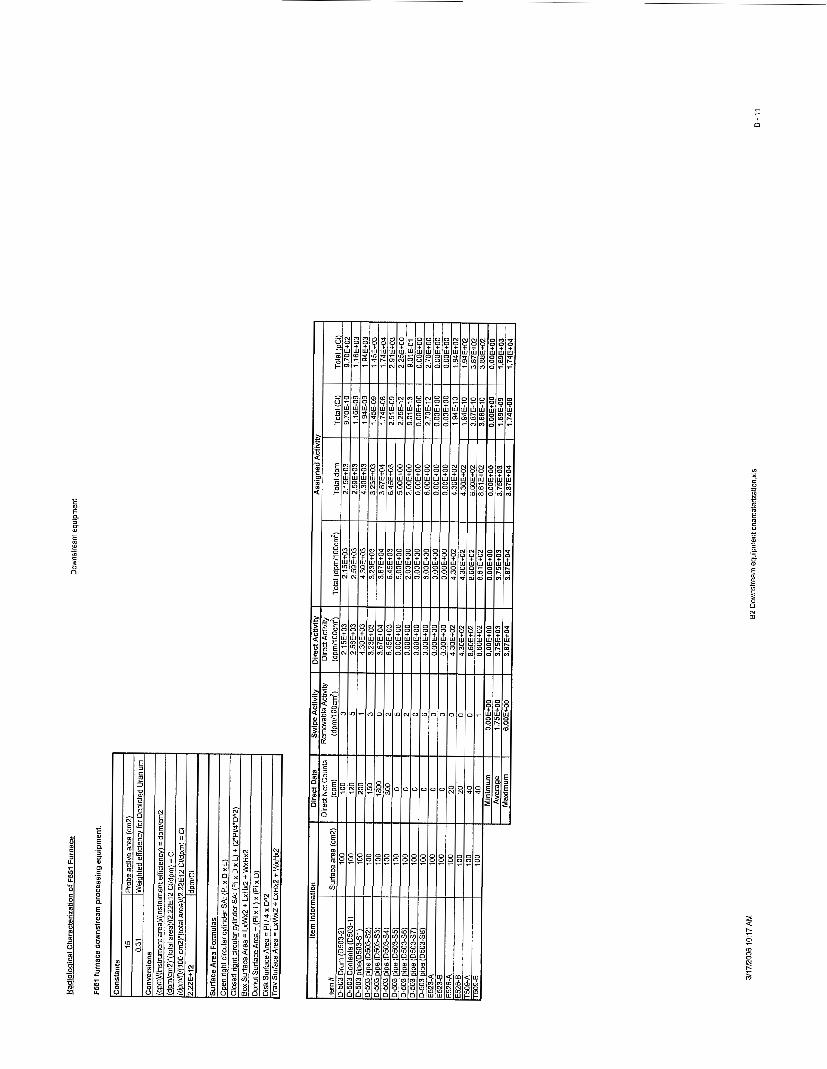
2.1.2 F551 Furnace and Associated Process Equipment
The fiirnace tubes that previously contained the uranium catalyst were permanently removed and replaced with new tubes during the turnaround in 2005. However, the rest of the furnace components and other process equipment in the furnace circuit remained in place. WESTON conducted instrument surveys and
13014~010~D~019~06 RadSurvDoseMod-03-ffi.doc 3
collected swipe samples while the tubes were removed and the fiirnace was inoperable, which allowed access to critical areas that cannot be accessed when the fiirnace is in use. The surveys and sampling activities focused on the following components:
E Top pigtails (curved tubes) that attach each tube to the inlet stream
Bottom pigtails that attach each tube to the process and draw product from the tubes to a collection basin refractory druni (D503)
0503 collection basin refractory drum where radiological contamination would pool because the velocity of the system is at its lowest at that point, therefore facilitating deposition of entrained material
Additional downstream processing equipment with accessible internal surfaces (E523, E526, and T509).
E
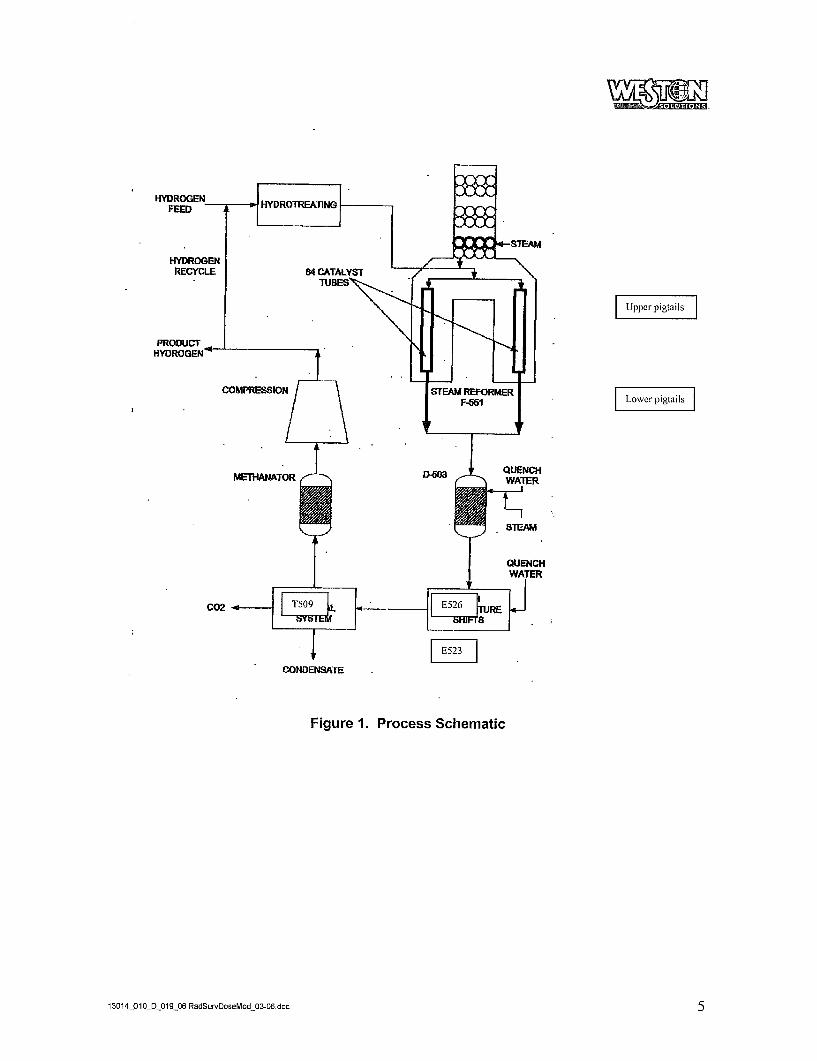
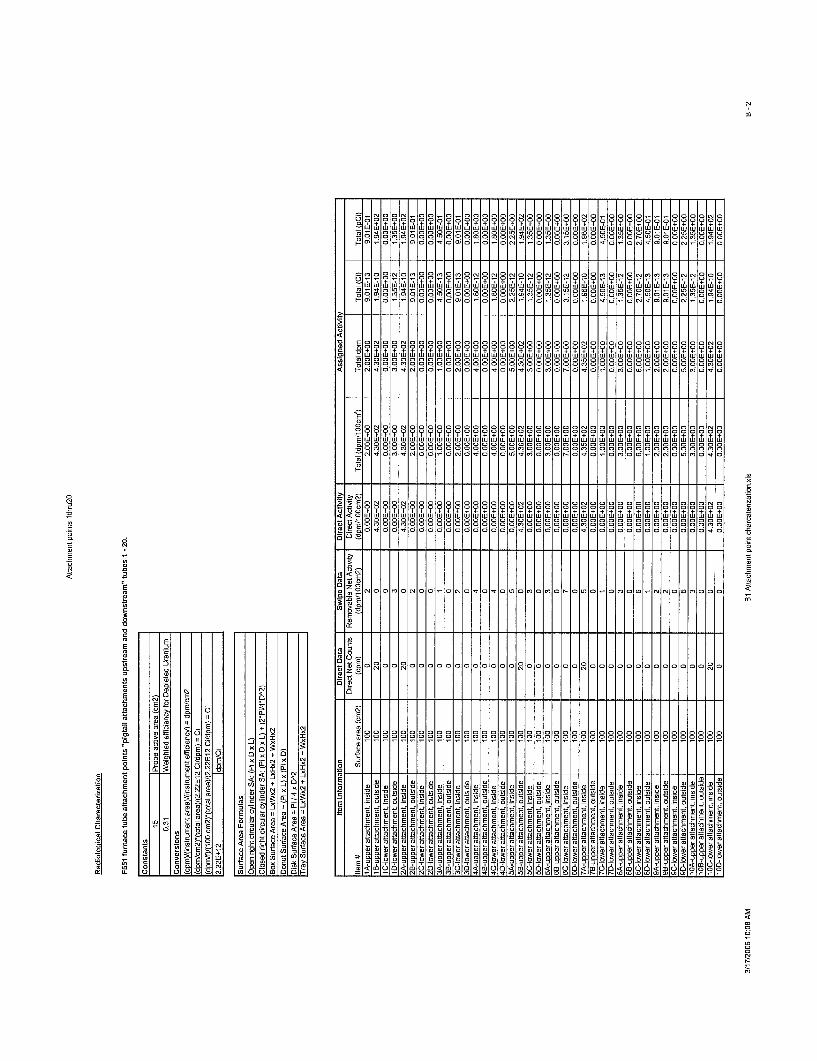
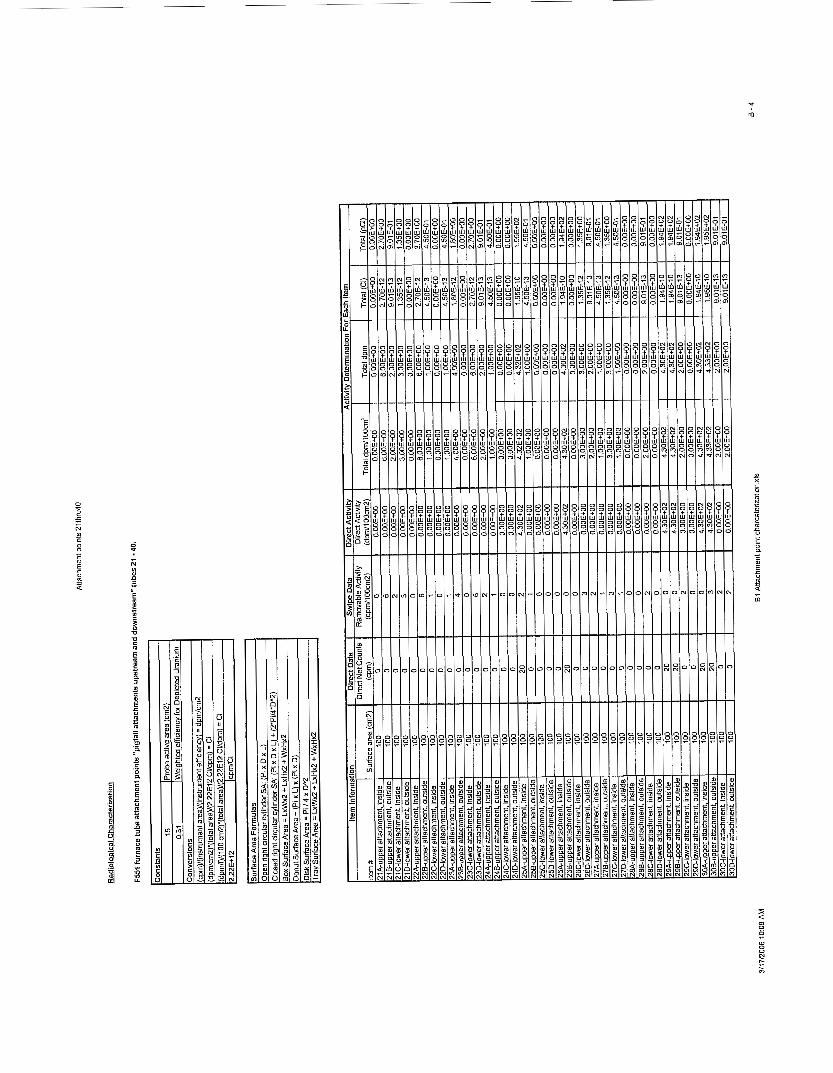
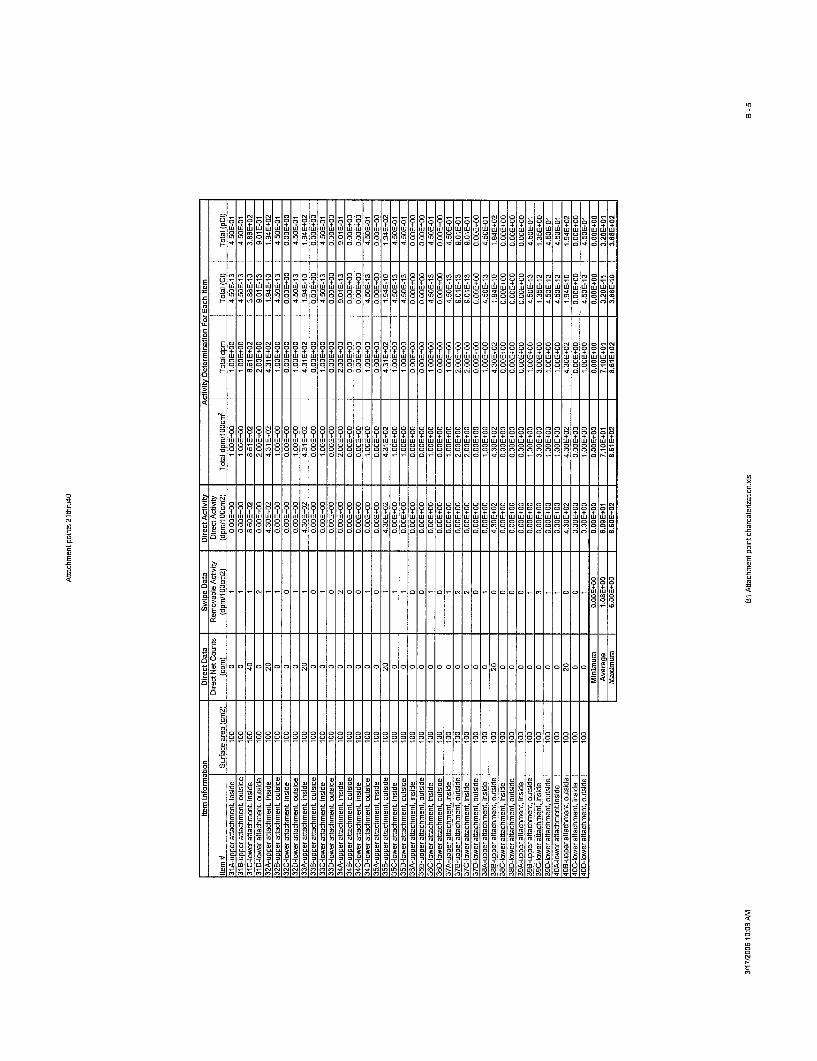
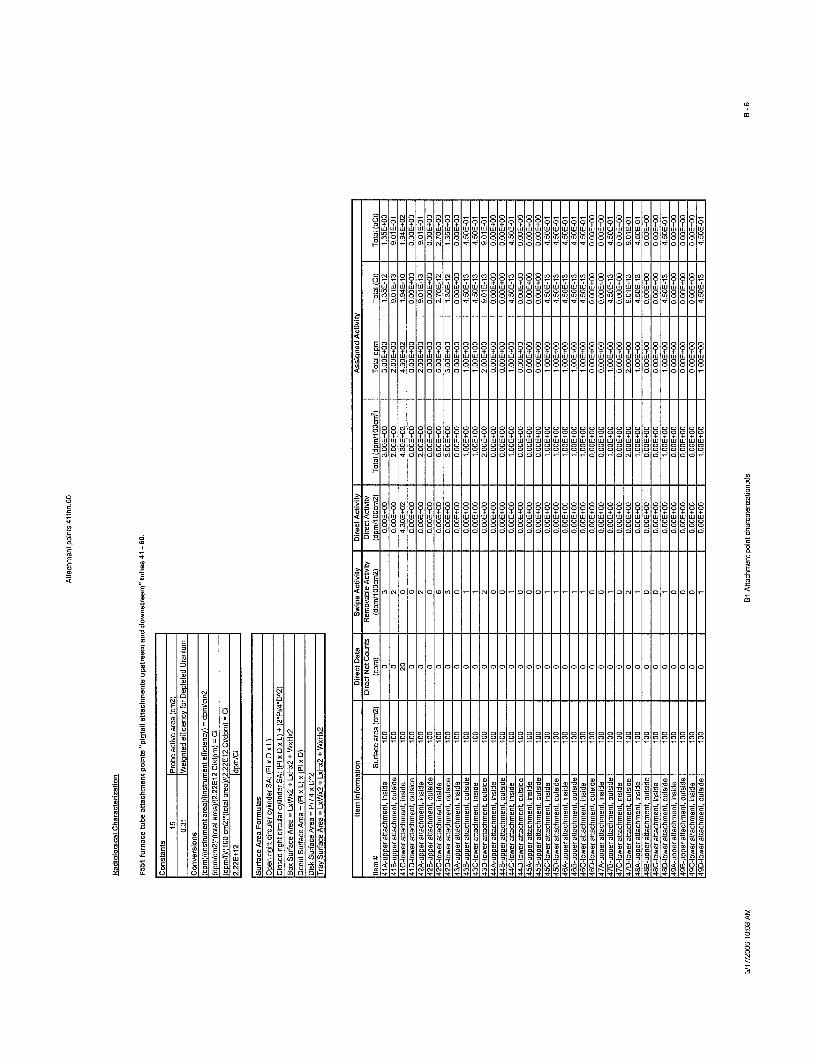
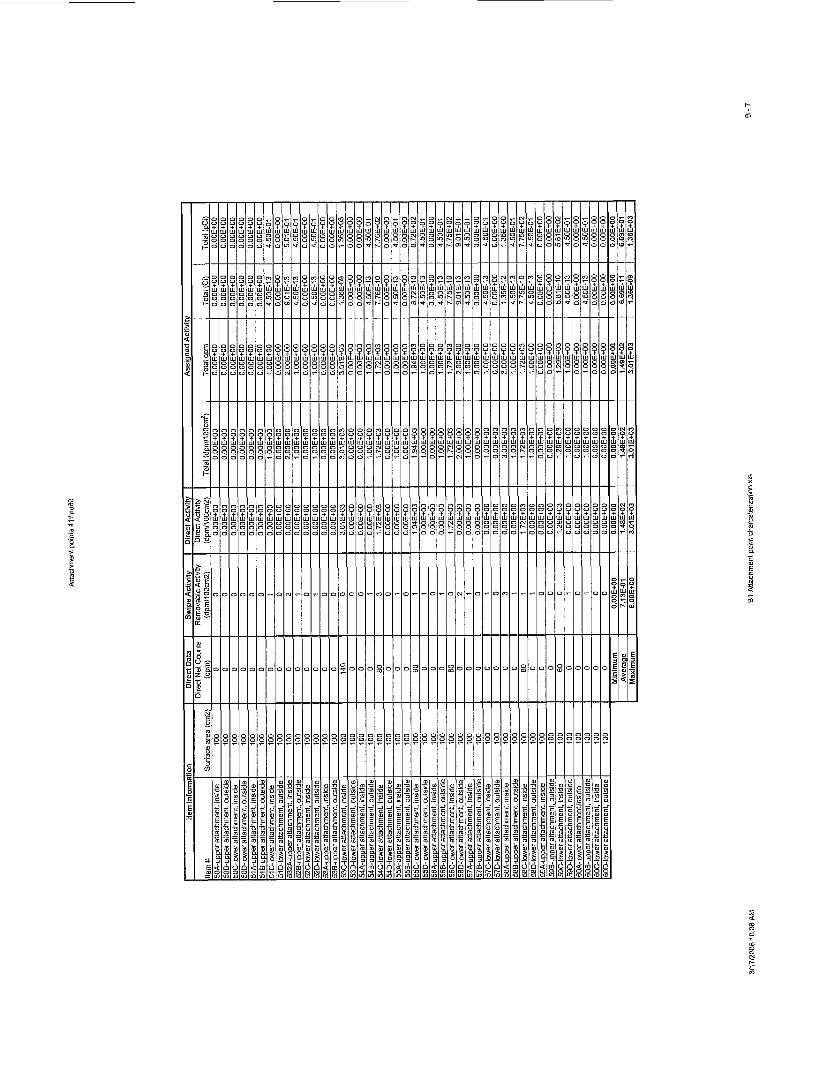
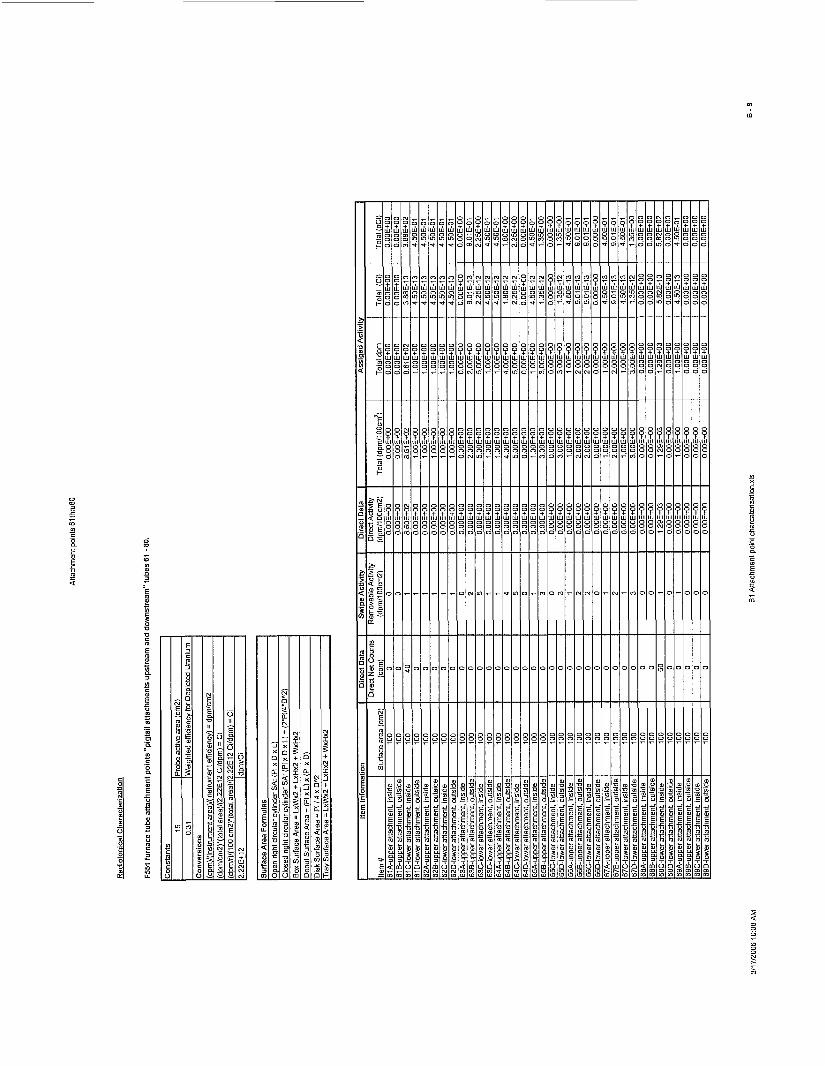
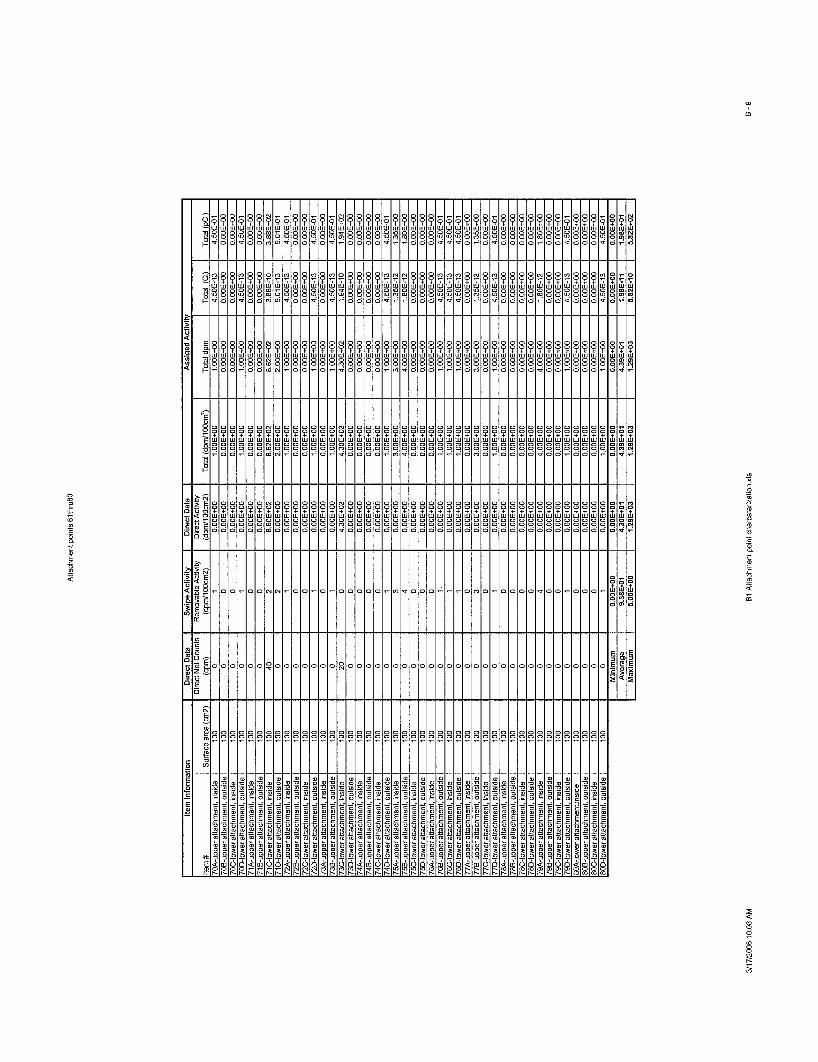
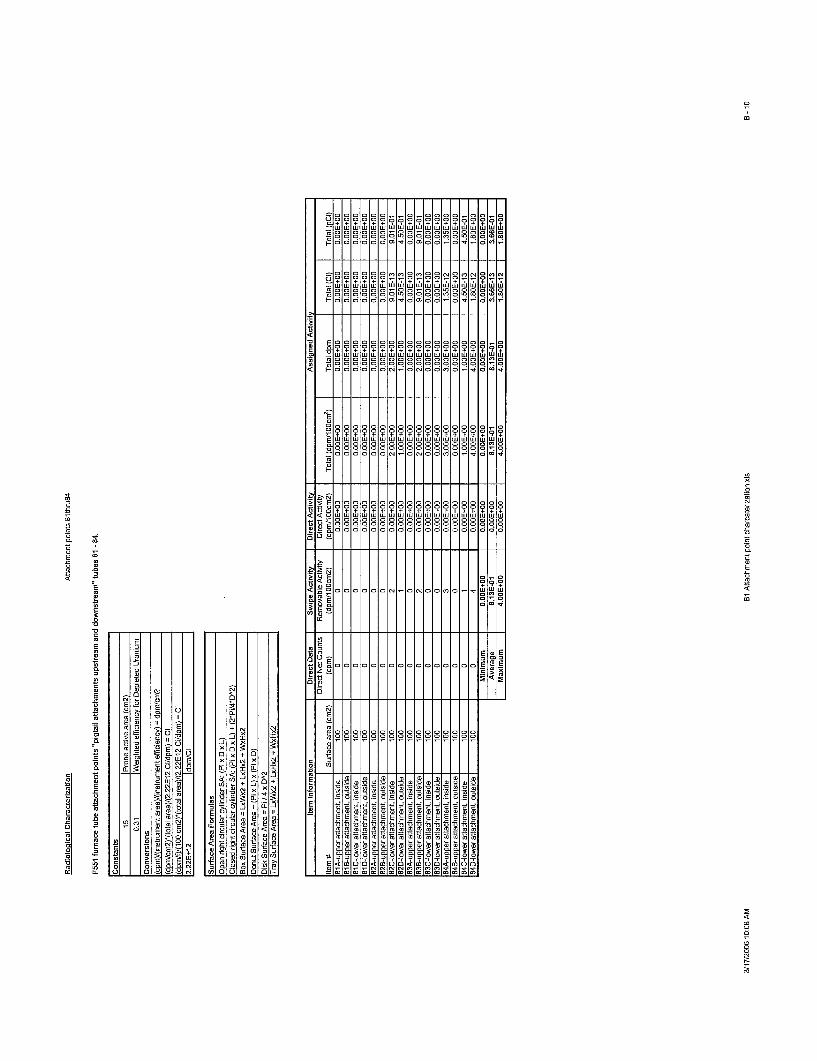
The furnace tube attachment points (pigtails) and accessible downstream processing equipment (D503, E523, E526 and T509) are shown in Figure 1. Figure 2 demonstrates the technique used for surveying the pigtail attachment points. The furnace tubes have all been removed and relocated to a low background area, known as the catalyst storage area, for surveying. Figure 3 shows the pipe inlet to the D503 refractory drum. A section of the elbow was removed and replaced with a new section. The elbow will be disposed of as radioactive waste.
Survey Results
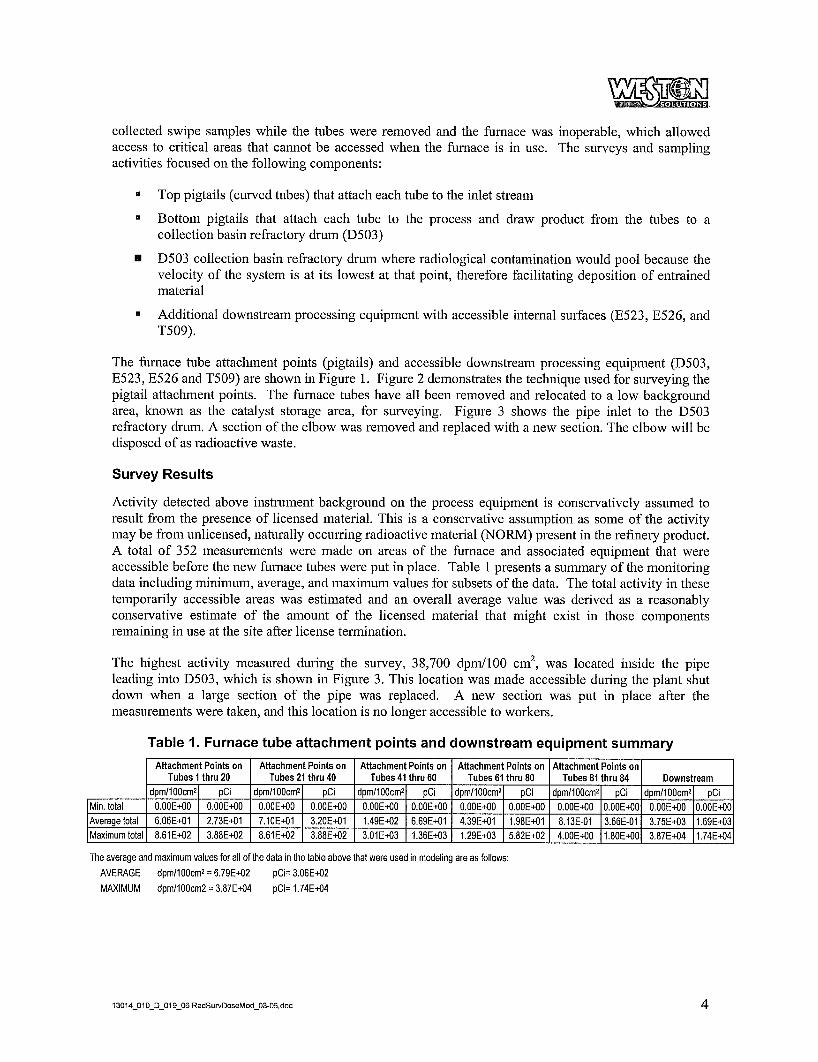
Activity detected above instrument background on the process equipment is conservatively assumed to result from the presence of licensed material. This is a conservative assumption as some of the activity may be from unlicensed, naturally occurring radioactive material (NORM) present in the refinery product. A total of 352 measurements were made on areas of the fiirnace and associated equipment that were accessible before the new furnace tubes were put in place. Table 1 presents a summary of the monitoring data including minimum, average, and maximum values for subsets of the data. The total activity in these temporarily accessible areas was estimated and an overall average value was derived as a reasonably conservative estimate of the amount of the licensed material that might exist in those components remaining in use at the site after license termination.
The highest activity measured during the survey, 38,700 dpd100 cm’, was located inside the pipe leading into D503, which is shown in Figure 3. This location was made accessible during the plant shut down when a large section of the pipe was replaced. A new section was put in place after the measurements were taken, and this location is no longer accessible to workers.
Table I. Furnace tube attachment points and downstream equipment summary I Attachment Points on I Attachment Points on I Attachment Points on I Attachment Points on I Attachment Points on1 I
Tubes I thru 20 I Tubes 21 thru 40 I Tubes 41 thru 60 I Tubes 61 thru 80 I Tubes 81 thru 84 I Downstream dom1100cm21 oCi I dom1100cm21 oCi I dom1100cm21 oCi I dom1100cm21 nCi I dorn1100cm21 oCi I dnrn1100crn21 nCi
I S , I - 1-r - - - I r - 1-r - - - , r -
IMin. total I 0.00E40 I 0.00E40 I 0.00E40 I 0.00E40 I 0.00E40 I 0.00E40 I 0.00E40 I 0.00E40 I 0.00E40 IO.OOE401 0.00E40 IO.OOE401 Average total I 6.06E.101 I 2.73E41 I 7.10E41 I 3.20E41 I 1.49E.102 1 6.69E.101 I 4.39E-41 I 1.98E41 I 8.13E-01 I3.66E-01 I 3.75E43 I1.69E43 Maximumtotall 8.61E.102 I 3.88E.102 I 8.61E42 I 3.88E42 I 3.01E43 I 1.36E.103 I 1.29E43 I 5.82E42 I 400E40 I1 80E401 3 87E44 11 74F44
The average and maximum values for all of the data in the table above that were used in modeling are as follows: AVERAGE dpm1100cm2 = 6.79E42 pCi= 3.06E42 MAXIMUM dprn1100cm2 = 3.87E44 pCi= 1.74E44
4
HYDROGEN pROlnJ= J-----7
I
't'
STEAM REFORMER
1 -
I Upper pigtails I
Lower pigtails 0
Figure 1. Process Schematic
5
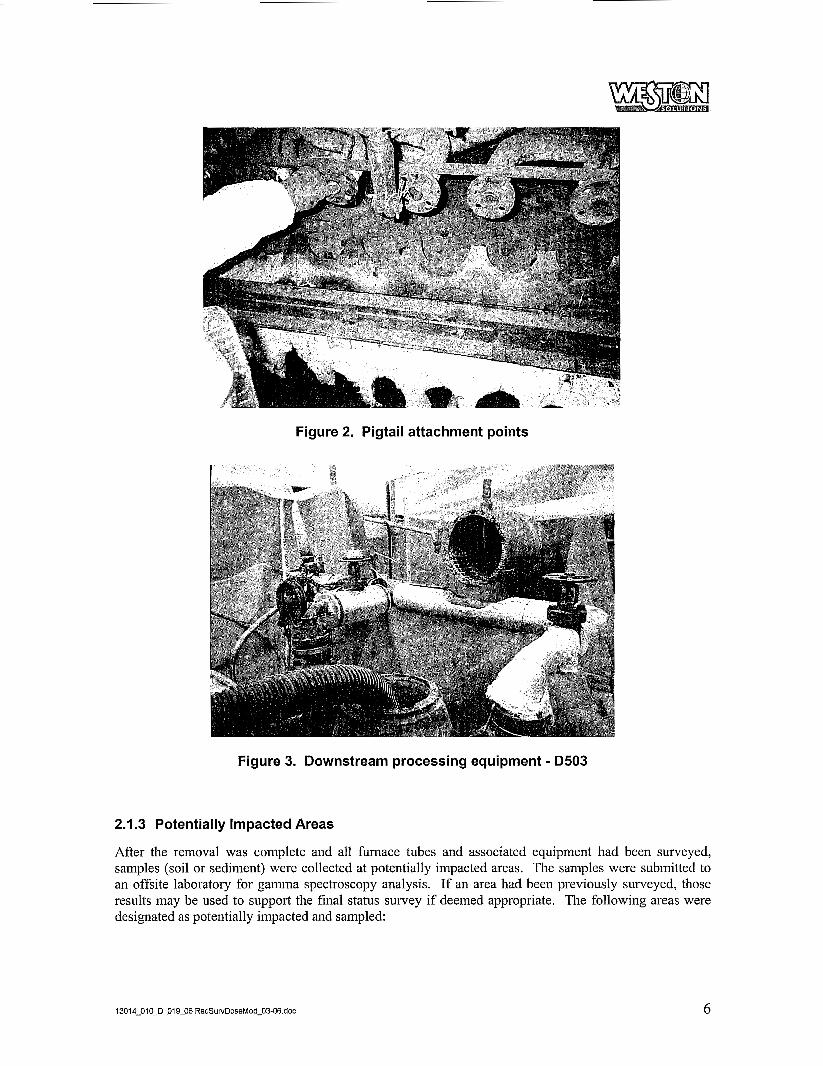
Figure 2. Pigtail attachment points
Figure 3. Downstream processing equipment - D503
2.1.3 Potentially Impacted Areas
After the removal was complete and all furnace tubes and associated equipment had been surveyed, samples (soil or sediment) were collected at potentially impacted areas. The samples were submitted to an offsite laboratory for g a m a spectroscopy analysis. If an area had been previously surveyed, those results may be used to support the final status survey if deemed appropriate. The following areas were designated as potentially impacted and sampled:
6
E
0
E
E
0
Spent catalyst storage area - sump in the center of the staging area. Mechanical building (garage) - sump that nins the length of the garage. F55 1 furnace sump - sunip below the fiirnace. F55 1 fiirnace perimeter- the perimeter of the foundation Background samples - samples collected in the parking lot outside of the fenced area of the plant.
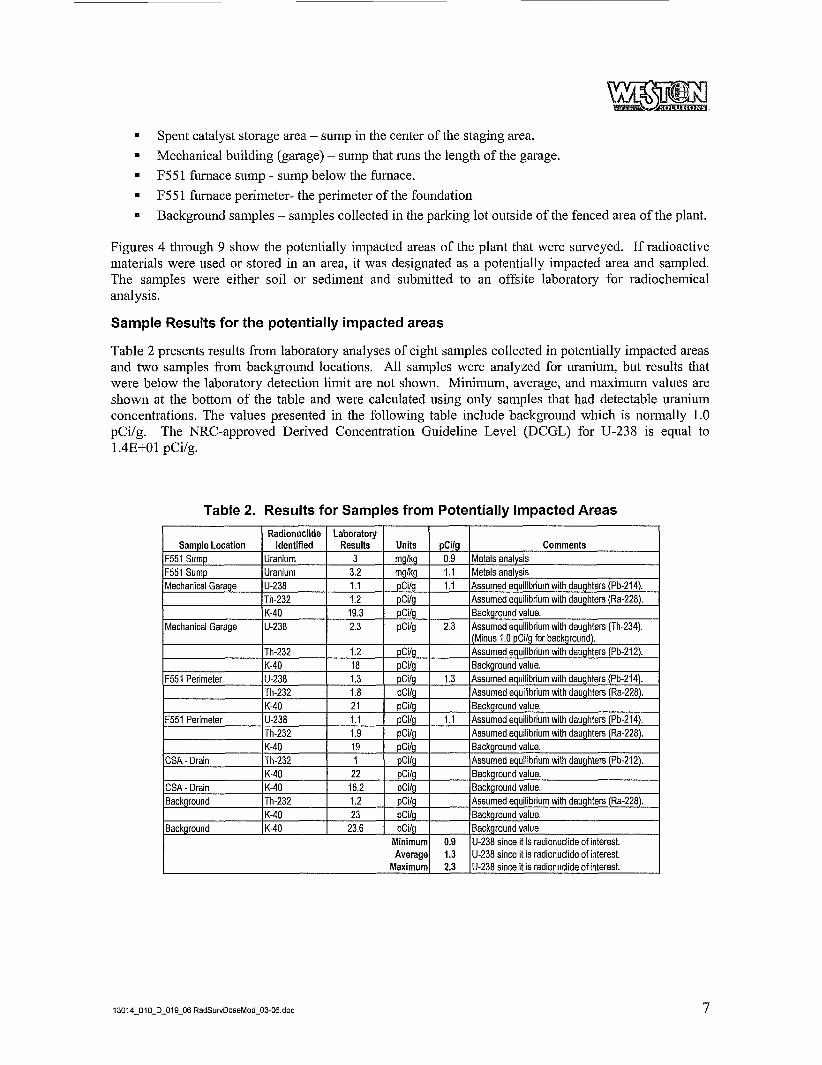
Figures 4 through 9 show the potentially impacted areas of the plant that were surveyed. If radioactive materials were used or stored in an area, it was designated as a potentially impacted area and sampled. The samples were either soil or sediment and submitted to an offsite laboratory for radiochemical analysis.
Sample Results for the potentially impacted areas
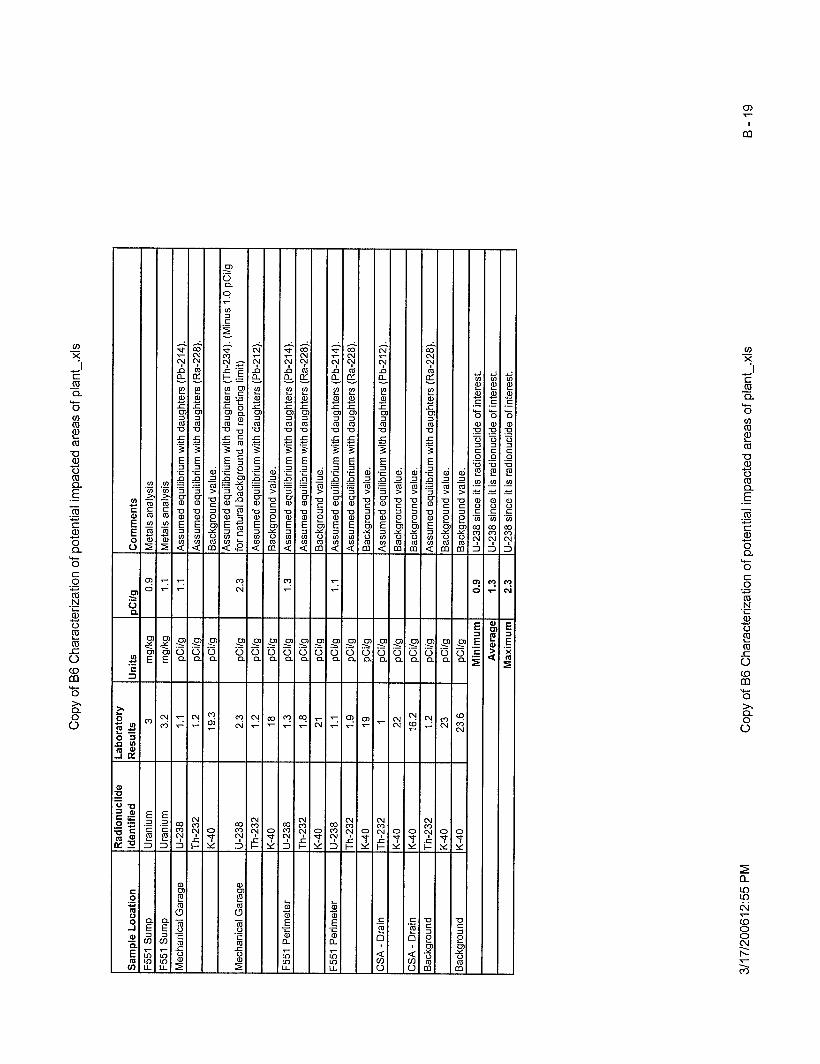
Table 2 presents results from laboratory analyses of eight samples collected in potentially impacted areas and two samples from background locations. All samples were analyzed for manium, but results that were below the laboratory detection limit are not shown. Minimum, average, and maximum values are shown at the bottom of the table and were calculated using only samples that had detectable uranium concentrations. The values presented in the following table include background which is nonnally 1 .O pCi/g. The NRC-approved Derived Concentration Guideline Level (DCGL) for U-238 is eqiial to 1.4Et-01 pCi/g.
Table 2. Results for Samples from Potentially Impacted Areas
13014-010-D-019-06 RadSurvDoseMod-03-06.doc 7
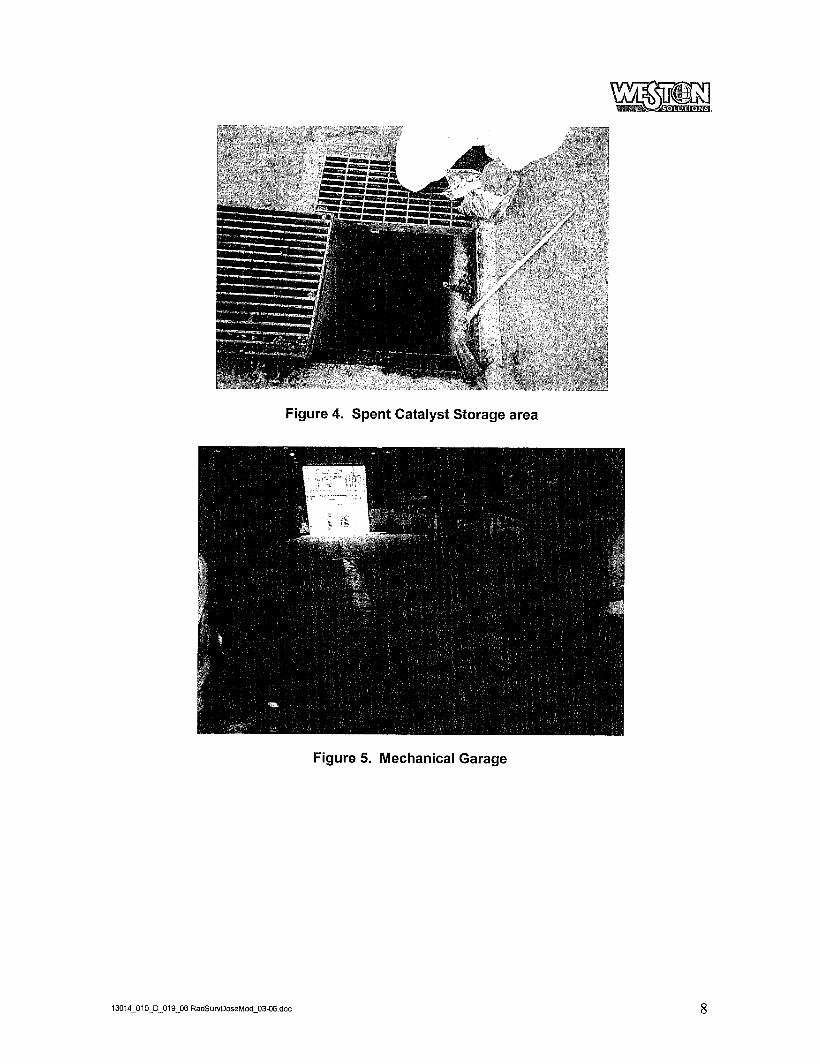
Figure 4. Spent Catalyst Storage area
Figure 5. Mechanical Garage
8
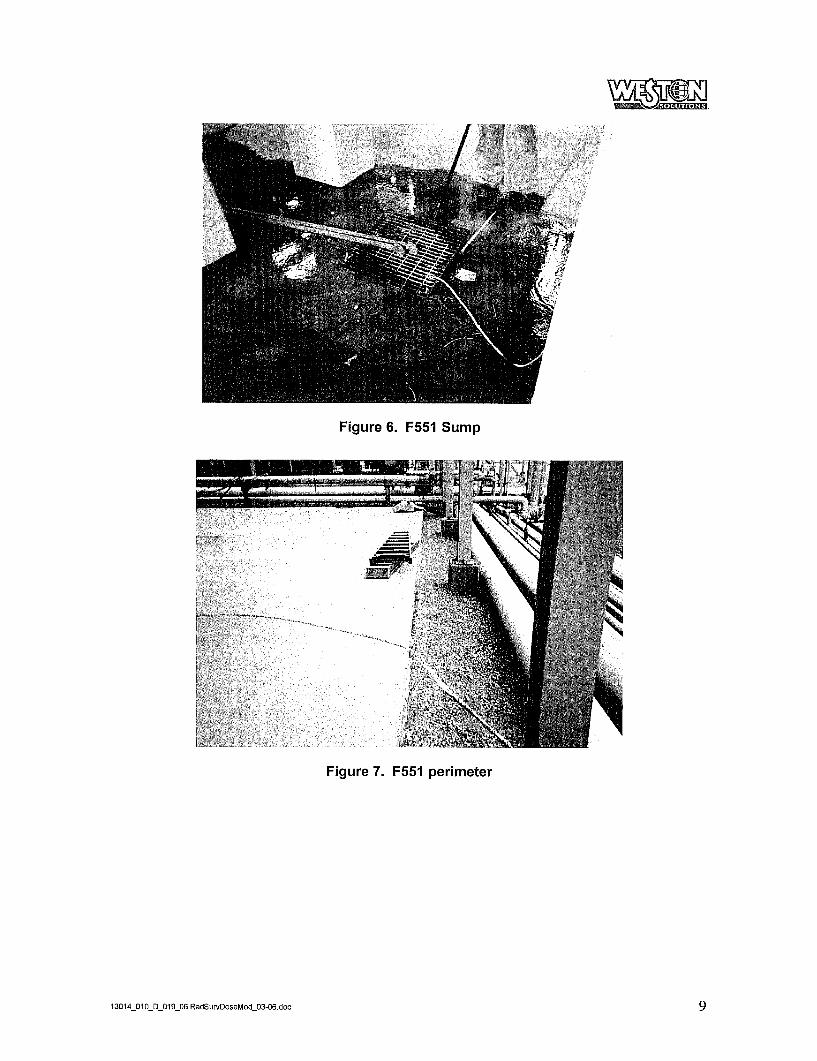
Figure 6. F551 Sump
Figure 7. F551 perimeter
9
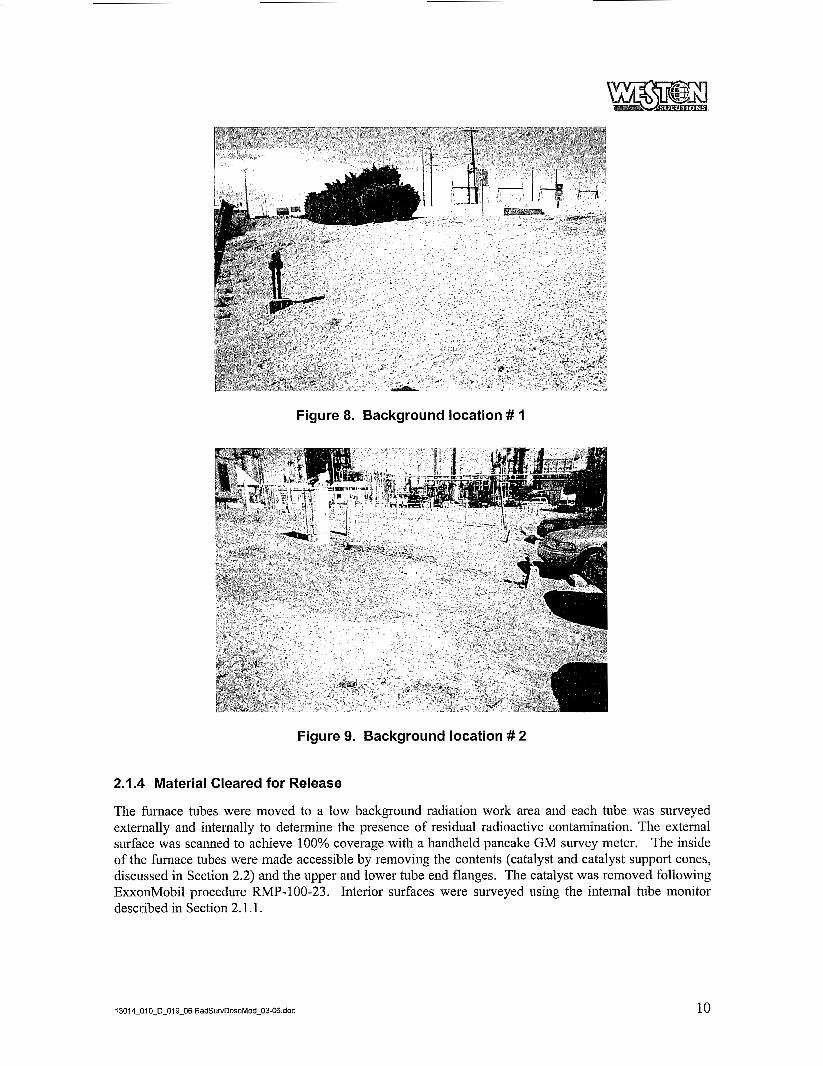
Figure 8. Background location # I
Figure 9. Background location # 2
2.1.4 Material Cleared for Release
The furnace tubes were moved to a low background radiation work area and each tube was surveyed externally and internally to determine the presence of residual radioactive contamination. The external surface was scanned to achieve 100% coverage with a handheld pancake GM survey meter. The inside of the furnace tubes were made accessible by removing the contents (catalyst and catalyst support cones, discussed in Section 2.2) and the upper and lower tube end flanges. The catalyst was removed following ExxonMobil procedure RMP-100-23. Interior surfaces were surveyed using the internal tube monitor described in Section 2.1.1.
10
The upper and lower tube end flanges and hardware (nuts and bolts) where segregated, placed on pallets, and designated as a survey units. The survey units were scanned to achieve 100% coverage with a hand- held pancake GM detector, followed by collection of swipe samples for removable contamination.
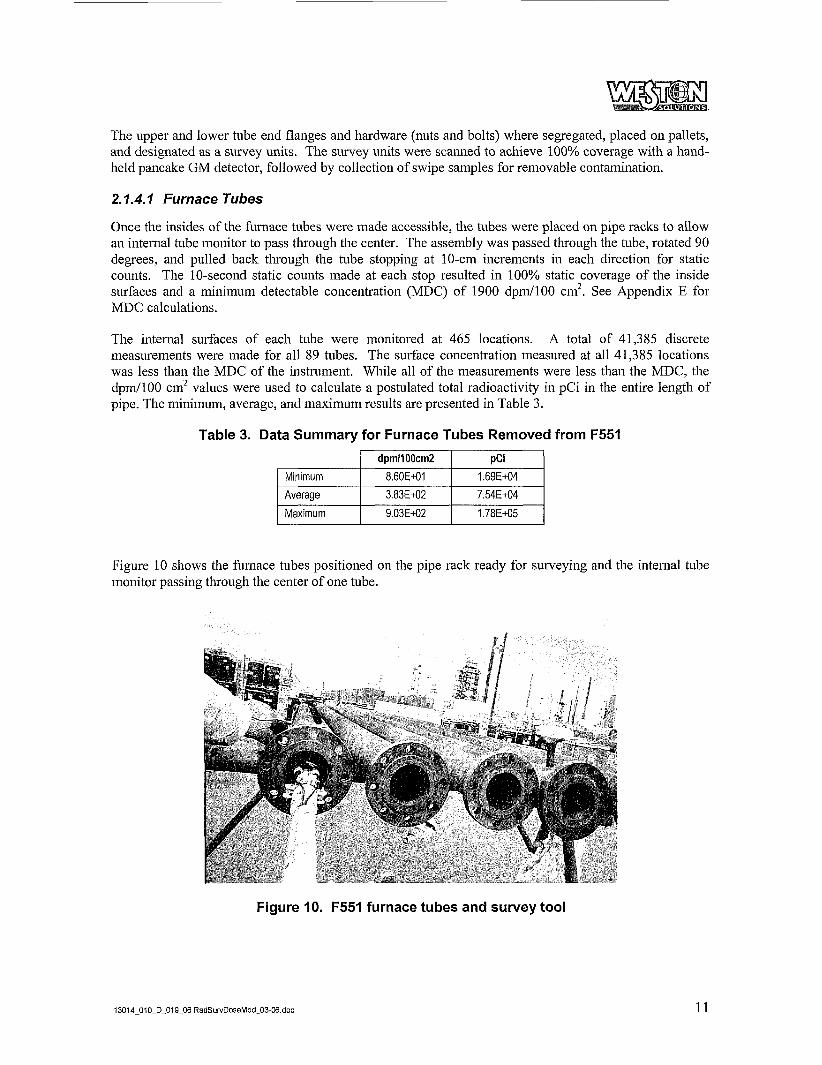
Average
Maximum
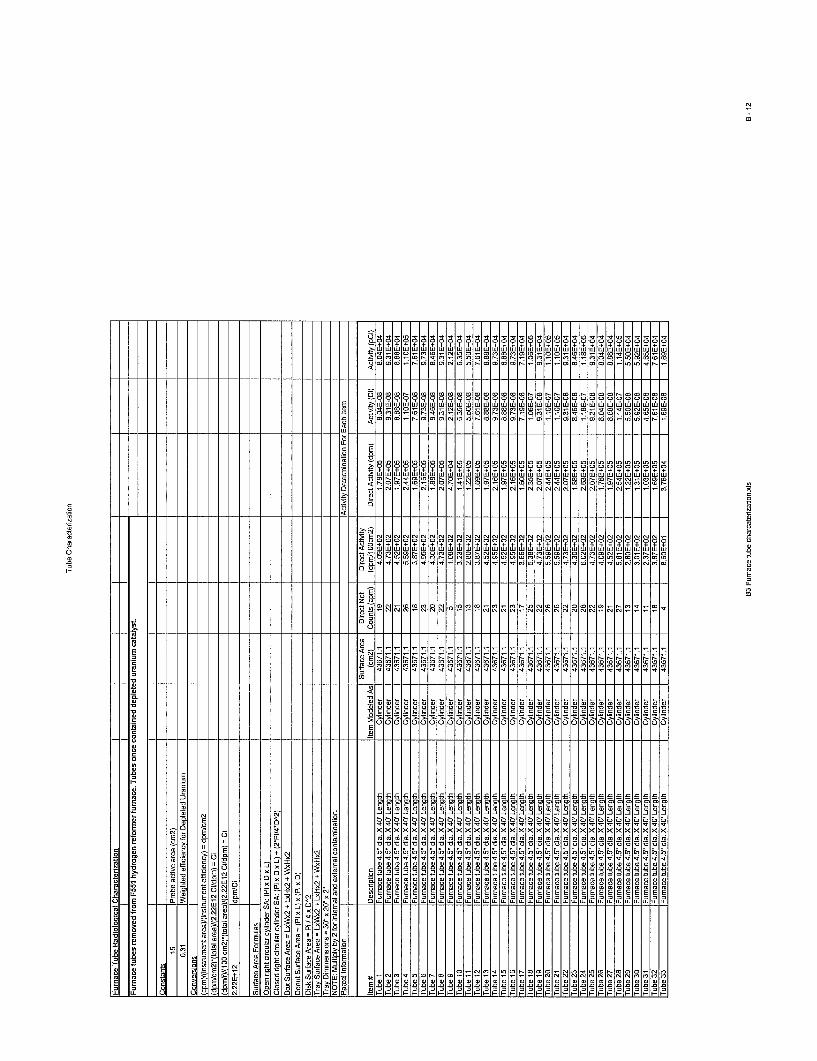
2.1.4. I Furnace Tubes
3.83E42 7.54E44
9.03E42 1.78E45
Once the insides of the flirnace tubes were made accessible, the tubes were placed on pipe racks to allow an internal tube monitor to pass through the center. The assembly was passed through the tube, rotated 90 degrees, and pulled back through the tube stopping at 10-cm increments in each direction for static counts. The 10-second static counts made at each stop resulted in 100% static coverage of the inside surfaces and a minimum detectable concentration (MDC) of 1900 dpd100 cm2. See Appendix E for MDC calculations.
The internal surfaces of each tube were monitored at 465 locations. A total of 41,385 discrete measurements were made for all 89 tubes. The surface concentration measured at all 41,385 locations was less than the MDC of the instrument. While all of the measurements were less than the MDC, the dpnd100 cm2 values were used to calculate a postulated total radioactivity in pCi in the entire length of pipe. The minimum, average, and maximum results are presented in Table 3.
Table 3. Data Summary for Furnace Tubes Removed from F551
I dpmllOOcm2 I pCi I I M' inimum ' I 8.60E41 I 1.69E44 I
Figure 10 shows the furnace tubes positioned on the pipe rack ready for surveying and the internal tube monitor passing through the center of one tube.
Figure 10. F551 furnace tubes and survey tool
11
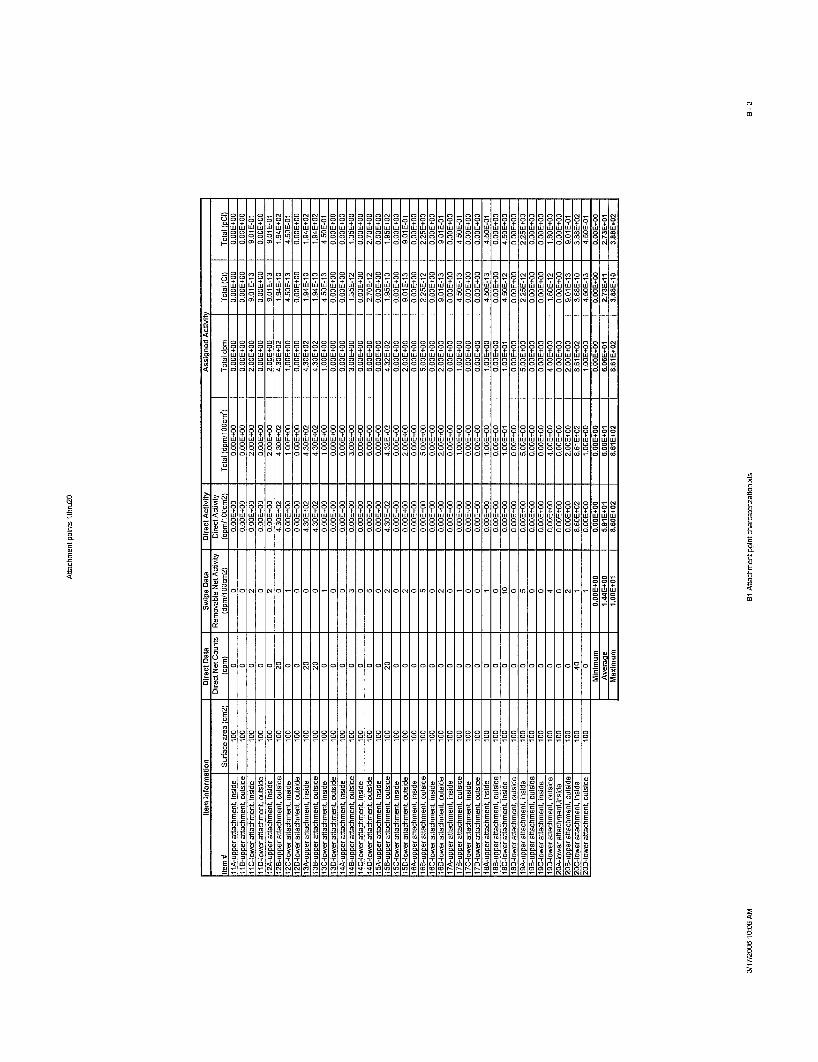
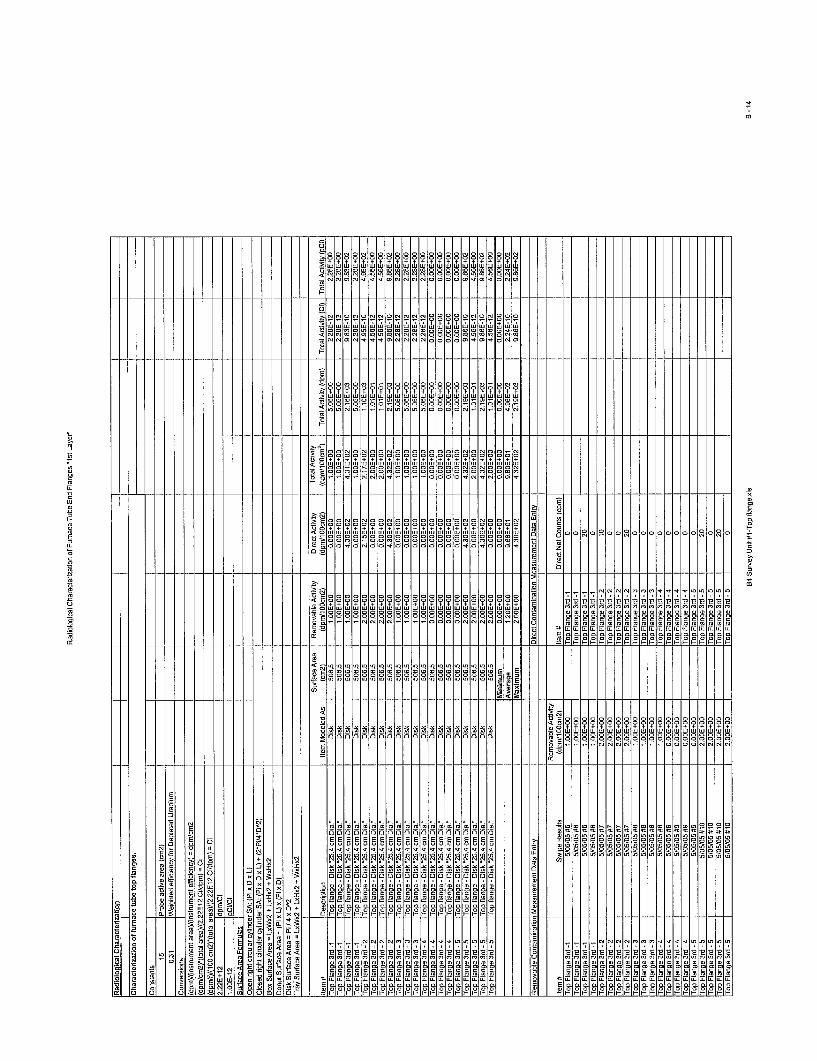
2.1.4.2 Top end flanges (Survey Unit # I)
The top end flanges were placed on a wooden pallet lined with Herculite. M e r a single layer was completed, the layer was surveyed for removable and fixed contamination and another layer was placed on top of the first and monitored in the same manner. The process was repeated until all the end flanges on the pallet were surveyed. The results from the survey were combined, averaged, and reported in dpm/100cm2 and picocuries.
There were four layers of flanges and 20 measurements were made on each layer for a total of 80 measurements. The minimum, average, and maximum values for each layer are presented in Table 4. The overall average and maximum values are presented in the table footnote. Again, all 80 measured values were less than the MDC.
Table 4. Data Summary for Top End Flanges (Survey Unit #I)
The average and maximum values for all of the data in the table above that were used in modeling are as follows: Average dpm/100cm2= 1.47E42 pCi= 3.36E42 Maximum dpm/100cm2= 8.61E42 pCi= 1.96E43
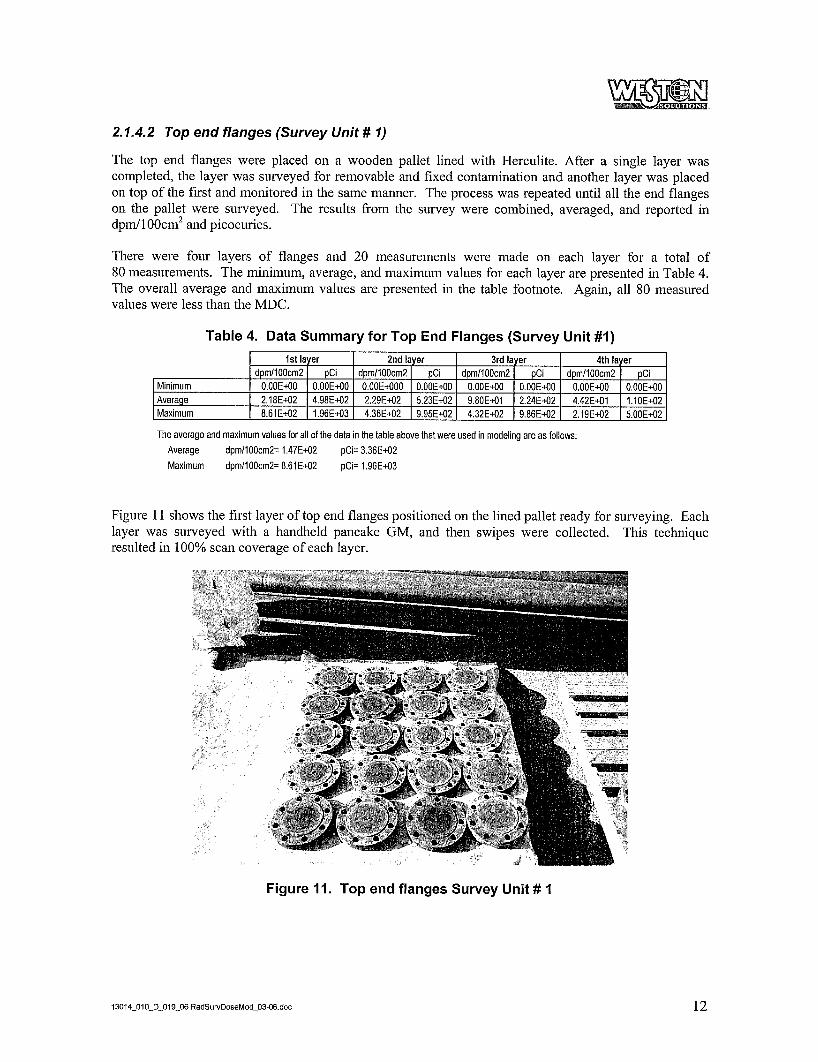
Figure 11 shows the first layer of top end flanges positioned on the lined pallet ready for surveying. Each layer was surveyed with a handheld pancake GM, and then swipes were collected. This technique resulted in 100% scan coverage of each layer.
Figure 11. Top end flanges Survey Unit # 1
13014-01 0-D-019-06 RadSu~vDoseMod-03-ffi.doc 12
2.7.4.3 Hardware Nuts and Bolts (Survey Unit # 3)
The nuts and bolts were placed on a wooden pallet lined with Herculite. After a single layer was completed, the layer was surveyed for removable and fixed contamination. The process was repeated until all the nuts and bolts were on the pallet and surveyed. The results from the survey were combined, averaged, and reported in dpm/100cm2 and picocuries. In order to determine surface area and report in dpm/100cm2, each layer was modeled as a tray with the dimensions of the pallet (4 ft long by 4 ft wide by 4 in. high).
Average
Maximum
Eight distinct measurements were recorded for the layer of bolts. The minimum, average, and maximum values are presented in Table 5. All measured values were less than the MDC.
1.08E42 I .69E44
4.30E42 6.75E44
Table 5. Summary Data for Flange Nuts and Bolts (Survey Unit #3)
I dprnllOOcrn2 I pCi I Minimum I 0.00E40 I 0.00E40 I
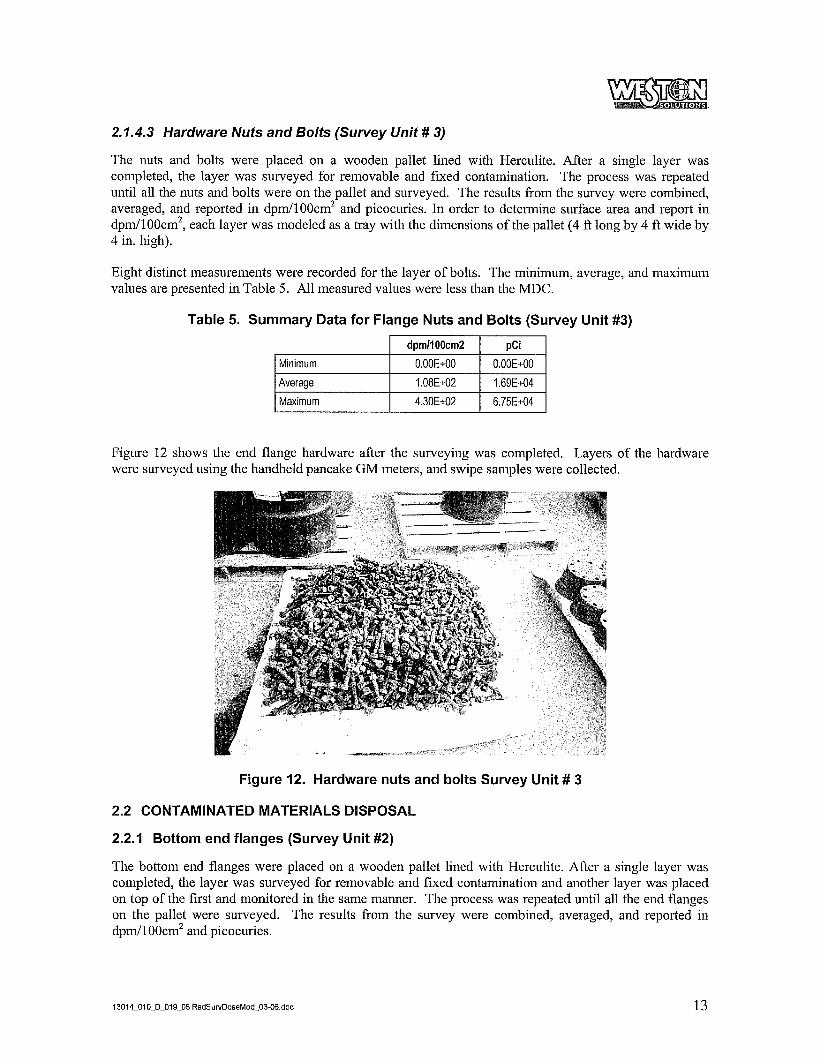
Figure 12 shows the end flange hardware after the surveying was Completed. Layers of the hardware were surveyed using the handheld pancake GM meters, and swipe samples were collected.
Figure 12. Hardware nuts and bolts Survey Unit # 3
2.2 CONTAMINATED MATERIALS DISPOSAL
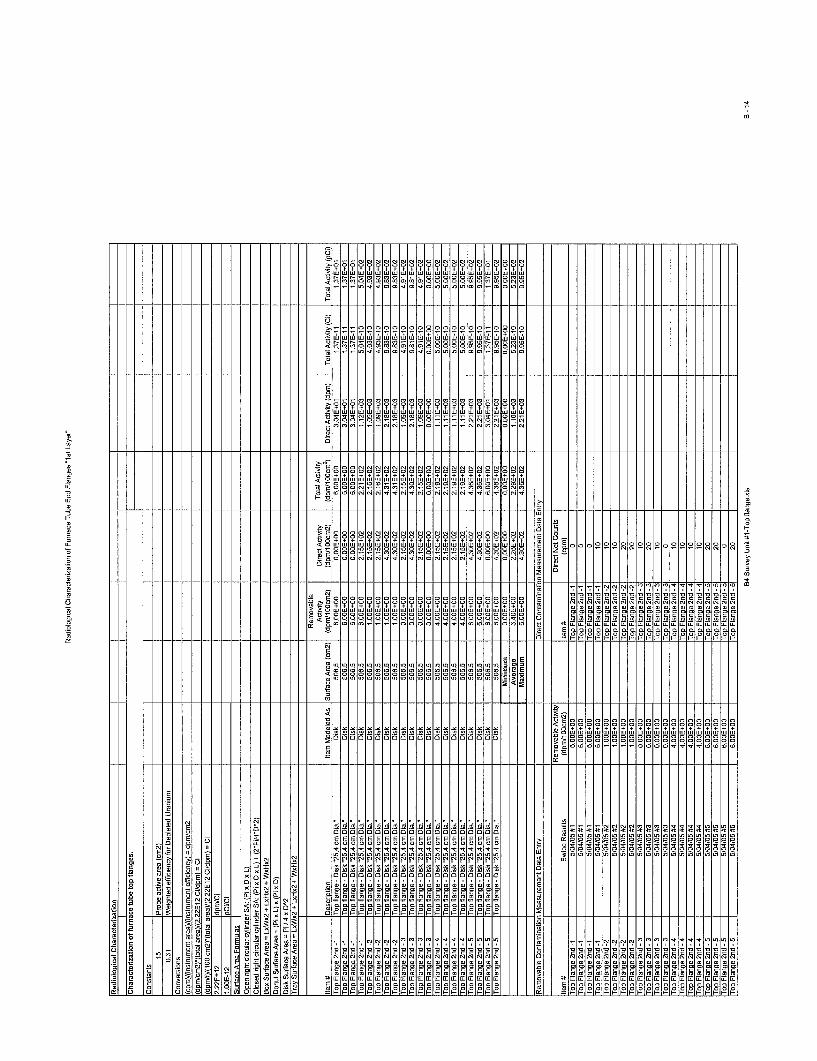
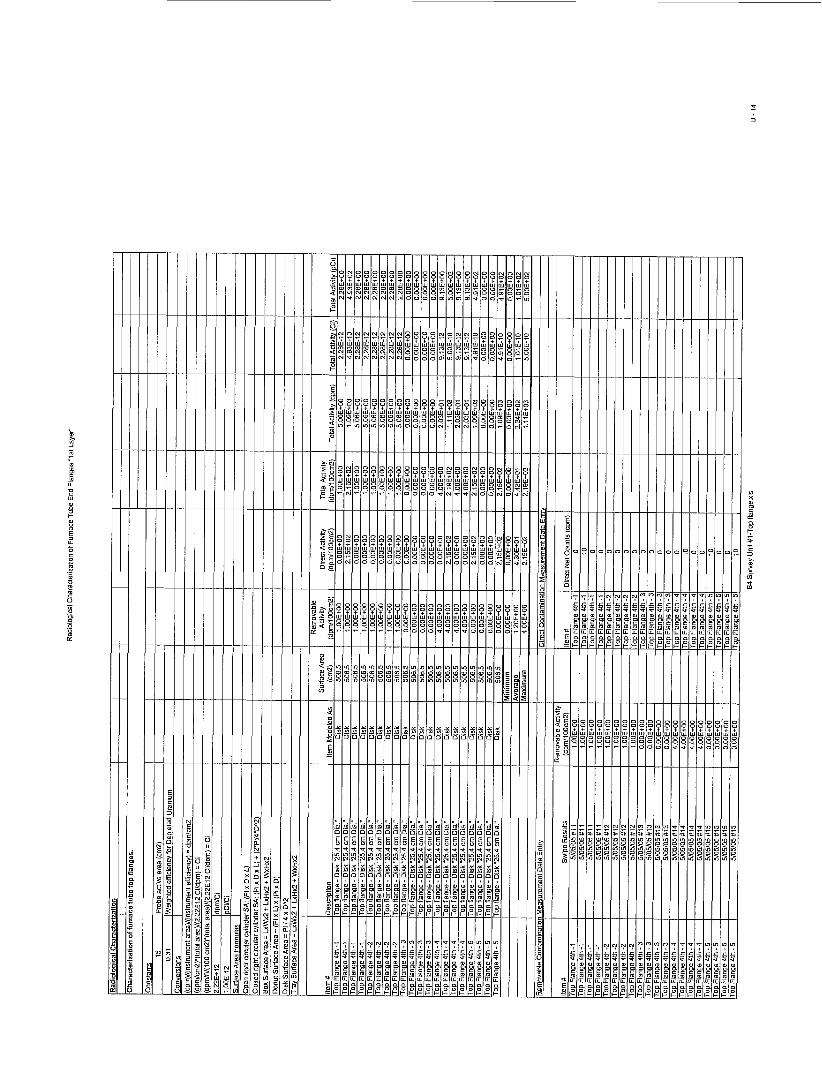
2.2.1 Bottom end flanges (Survey Unit #2)
The bottom end flanges were placed on a wooden pallet lined with Herculite. After a single layer was completed, the layer was surveyed for removable and fixed Contamination and another layer was placed on top of the first and monitored in the same manner. The process was repeated until all the end flanges on the pallet were surveyed. The results from the survey were combined, averaged, and reported in dpmn/100cm2 and picocmies.
13
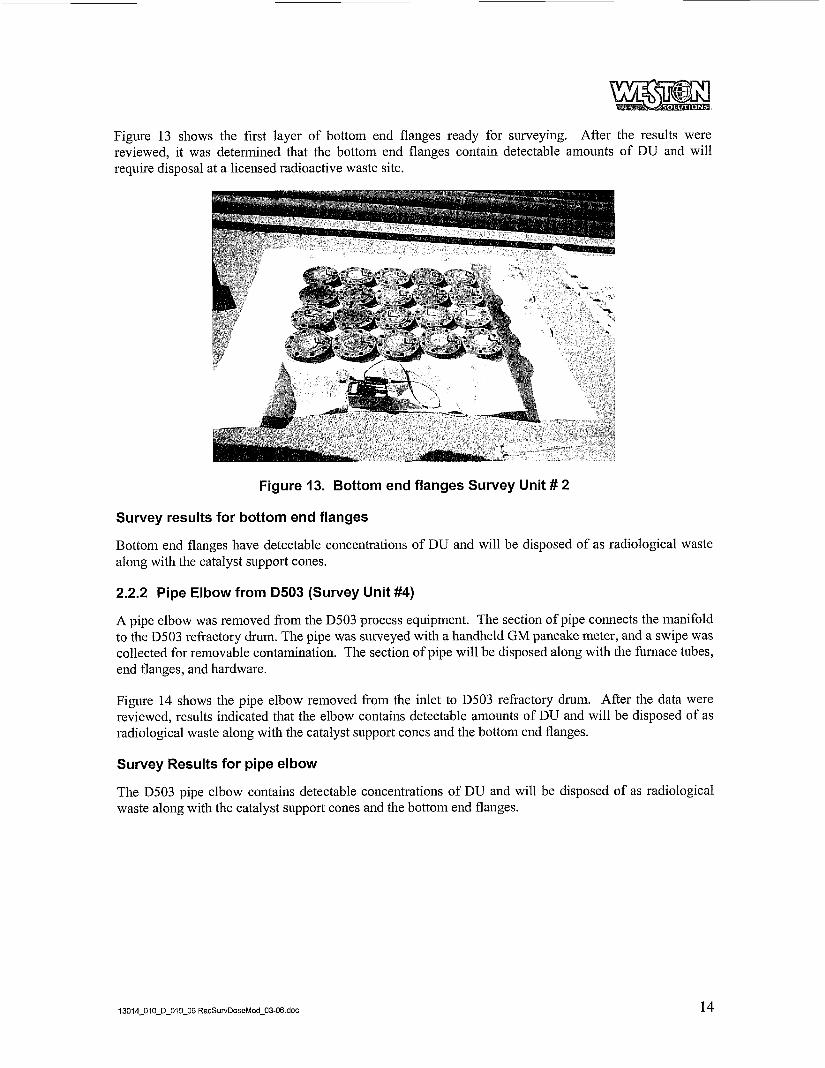
Figure 13 shows the first layer of bottom end flanges ready for surveying. After the results were reviewed, it was determined that the bottom end flanges contain detectable amounts of DU and will require disposal at a licensed radioactive waste site.
Figure 13. Bottom end flanges Survey Unit # 2
Survey results for bottom end flanges
Bottom end flanges have detectable concentrations of DU and will be disposed of as radiological waste along with the catalyst support cones.
2.2.2 Pipe Elbow from D503 (Survey Unit #4)
A pipe elbow was removed from the 0503 process equipment. The section of pipe connects the manifold to the D503 refractory dnim. The pipe was surveyed with a handheld GM pancake meter, and a swipe was collected for reiiiovable contamination. The section of pipe will be disposed along with the fiirnace tubes, end flanges, and hardware.
Figme 14 shows the pipe elbow removed from the inlet to D503 refractory drum. After the data were reviewed, results indicated that the elbow contains detectable amounts of DU and will be disposed of as radiological waste along with the catalyst support cones and the bottom elid flanges.
Survey Results for pipe elbow
The D503 pipe elbow contains detectable concentrations of DU and will be disposed of as radiological waste along with the catalyst support cones and the bottom end flanges.
14
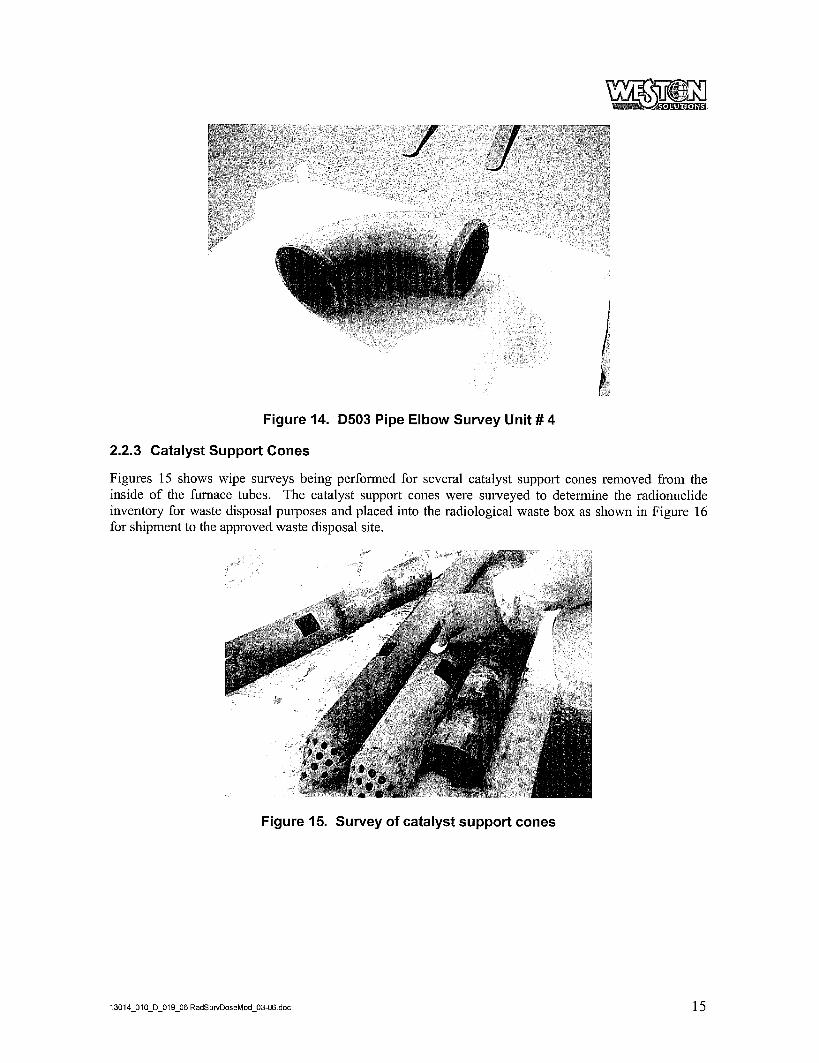
Figure 14. 0503 Pipe Elbow Survey Unit # 4
2.2.3 Catalyst Support Cones
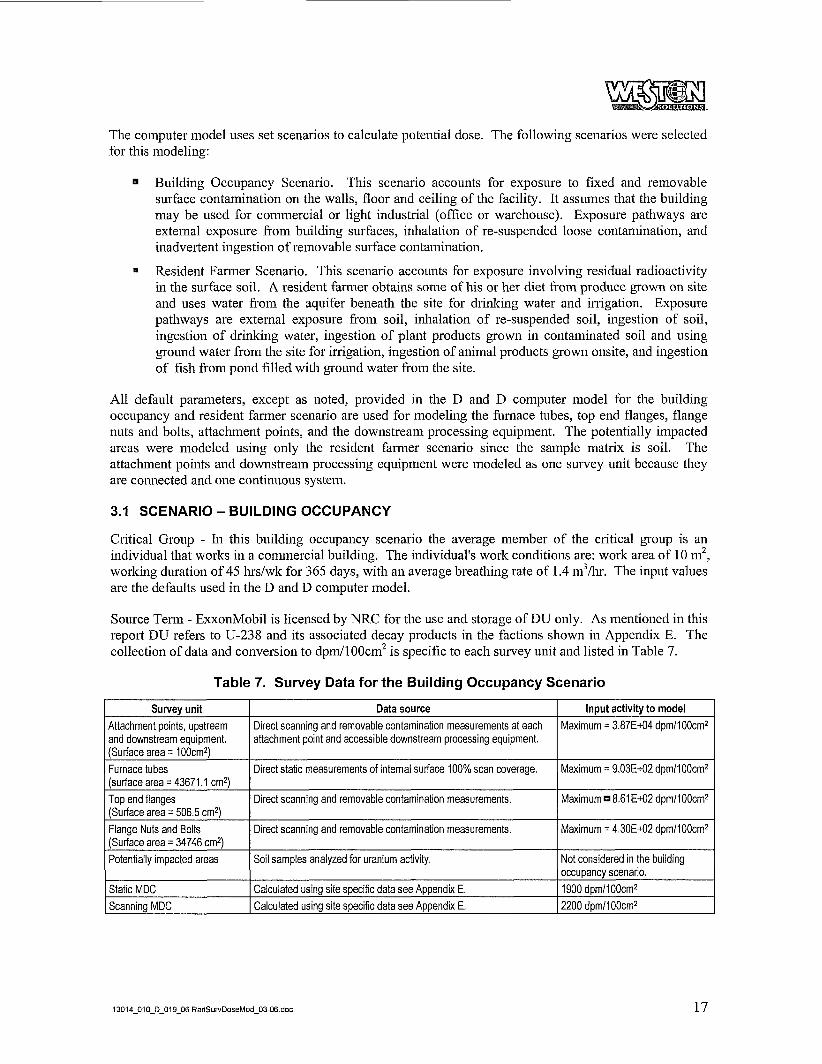
Figures 15 shows wipe surveys being performed for several catalyst support cones removed from the inside of the fiirnace tubes. The catalyst support cones were surveyed to determine the radionuclide inventory for waste disposal purposes and placed into the radiological waste box as shown in Figure 16 for shipment to the approved waste disposal site.
Figure 15. Survey of catalyst support cones
15
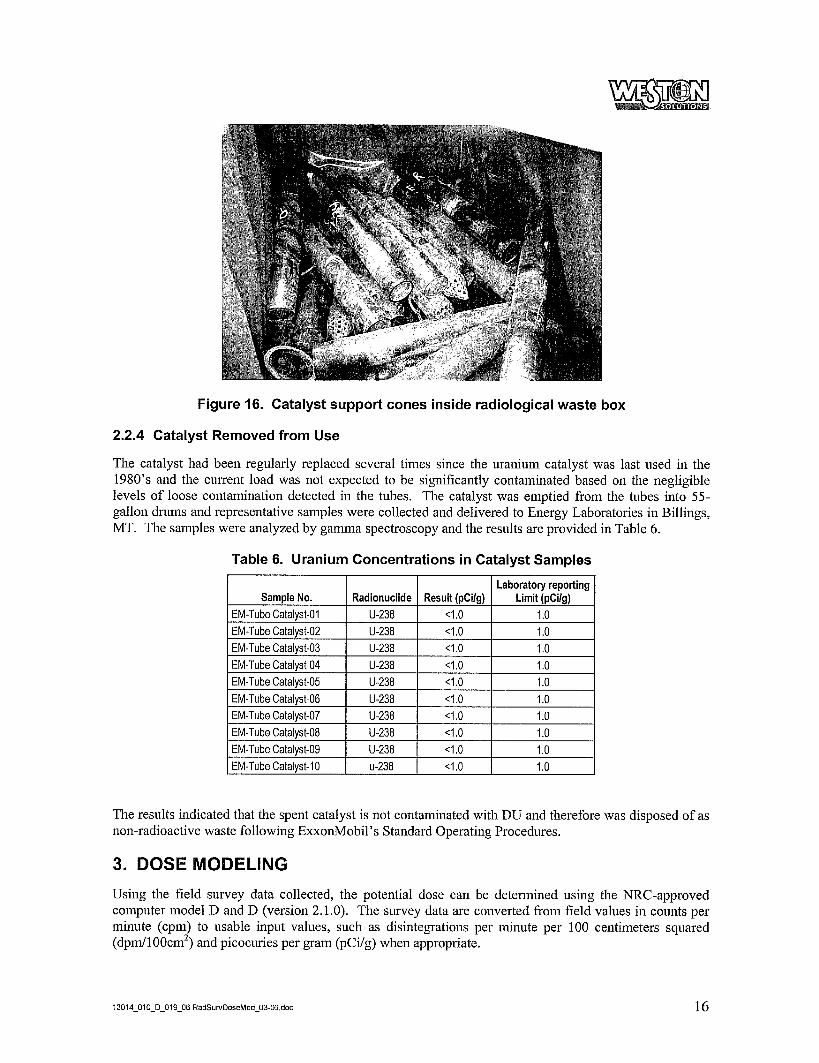
Figure 16. Catalyst support cones inside radiological waste box
Sample No.
2.2.4 Catalyst Removed from Use
The catalyst had been regularly replaced several times since the uranium catalyst was last used in the 1980’s and the current load was not expected to be significantly contaminated based on the negligible levels of loose contamination detected in the tubes. The catalyst was emptied from the tubes into 55- gallon dnims and representative samples were collected and delivered to Energy Laboratories in Billings, MT. The samples were analyzed by gamma spectroscopy and the results are provided in Table 6.
Laboratory reporting Radionuclide Result (pcilg) Limit (pcilg)
Table 6. Uranium Concentrations in Catalyst Samples
EM-Tube Catalyst-01 I U-238 I (1.0 EM-Tube Catalyst-02 I U-238 I 4 . 0
1 .o 1 .o
EM-Tube Catalyst-03 I U-238 I 4 . 0 1 .o EM-Tube Catalyst-04 I U-238 I (1.0 1 .o
I EM-TubeCatalvst-08 I U-238 I (1.0 I 1 .o I
EM-Tube Catalvst-05 I U-238 I (1.0 1 .o
The results indicated that the spent catalyst is not contaminated with DU and therefore was disposed of as non-radioactive waste following ExxonMobil’s Standard Operating Procedures.
EM-Tube Catalyst-06 EM-Tube Catalyst-07
3. DOSE MODELING
U-238 I (1.0 1 .o U-238 I (1 .o 1 .o
Using the field survey data collected, the potential dose can be determined using the NRC-approved computer model D and D (version 2.1.0). The survey data are converted from field values in counts per minute (cpin) to usable input values, such as disintegrations per minute per 100 centimeters squared (dpm/100cm2) and picocuries per gram (pCi/g) when appropriate.
EM-Tube Catalyst-09 I U-238 I (1 .o
16
1 .o
The computer model uses set scenarios to calculate potential dose. The following scenarios were selected for this modeling:
Survey unit Attachment points, upstream and downstream equipment.
Building Occupancy Scenario. This scenario accounts for exposure to fixed and removable surface contamination on the walls, floor and ceiling of the facility. It assumes that the building may be used for commercial or light industrial (office or warehouse). Exposure pathways are external exposure from building surfaces, inhalation of re-suspended loose contamination, and inadvertent ingestion of removable surface contamination.
Resident Farmer Scenario. This scenario accounts for exposure involving residual radioactivity in the surface soil. A resident farmer obtains some of his or her diet from produce grown on site and uses water from the aquifer beneath the site for drinking water and irrigation. Exposure pathways are external exposure from soil, inhalation of re-suspended soil, ingestion of soil, ingestion of drinking water, ingestion of plant products grown in contaminated soil and using ground water from tlie site for irrigation, ingestion of animal products grown onsite, and ingestion of fish from pond filled with ground water from the site.
'
Data source Input activity to model Maximum = 3.87E-44 dpmllOOcm2 Direct scanning and removable contamination measurements at each
attachment point and accessible downstream processing equipment.
All default parameters, except as noted, provided in the D and D computer model for the building occupancy and resident farmer scenario are used for modeling the fiirnace tubes, top end flanges, flange nuts and bolts, attachment points, and the downstream processing equipment. The potentially impacted areas were modeled using only the resident farmer scenario since the sample matrix is soil. The attachment points and downstream processing equipment were modeled as one survey unit because they are connected and one continuous system.
(surface area = 43671.1 cmz) Top end flanges (Surface area = 506.5 cm2)
3.1 SCENARIO - BUILDING OCCUPANCY
Direct scanning and removable contamination measurements. Maximum 8.61E-42 dpml100cm2
Critical Group - In this building occupancy scenario the average member of the critical group is an individual that works in a commercial building. The individual's work conditions are: work area of 10 m2, working duration of 45 hrs/wk for 365 days, with an average breathing rate of 1.4 m3/hr. The input values are the defaults used in the D and D computer model.
Flange Nuts and Bolts (Surface area = 34746 cm2) Potentially impacted areas
Static MDC Scanning MDC
Source Tern1 - ExxonMobil is licensed by NRC for the use and storage of DU only. As mentioned in this report DU refers to U-238 and its associated decay products in the factions shown in Appendix E. The collection of data and conversion to dpnd100cm2 is specific to each survey unit and listed in Table 7.
Direct scanning and removable contamination measurements.
Soil samples analyzed for uranium activity.
Calculated using site specific data see Appendix E. Calculated using site specific data see Appendix E.
Maximum = 4.30E-42 dpm/100cm2
Not considered in the building occupancy scenario. 1900 dpm/100cm2 2200 dpm/100cm2
Table 7. Survey Data for the Building Occupancy Scenario
(Surface area = 100cm2) Furnace tubes I Direct static measurements of internal surface 100% scan coverage. 1 Maximum = 9.03E-42 dpm/100cm2
17
While all scanning measurements for the hrnace tubes, top end flanges, and flange nuts and bolts were less than the MDC, the maximum measured values were used in the dose model. The maximum value detected on the downstream equipment was also used as the source term. As all of the static measurements and most of the scanning measurements were below the MDC, the dose was also calculated assuming a source term equal to the MDC scan and MDC static.
3.1 .I Exposure Pathways Considered
The following exposure pathways in the building occupancy scenario model are defined in NUREGKR- 5512 Volume 1.
External exposure to penetrating radiation from surface sources, Inhalation of resuspended surface contamination, and Inadvertent ingestion of surface contamination.
8
8
3.1.2 D and D General Parameters
The default values provided in D and D version 2.1.0 for the following general input parameters are used with the exception of the resuspension factor for loose contamination (Rfo). This value was modified (constant value of 9.6E-07 me’) as recommended in NUREG 1720 because the building occupancy scenario is dominated by the inhalation of the single radionuclide (U-238). The use of this modified resuspension factor was deemed appropriate after review of the five studies used in the development of NUREG 1720. The contamination present at this site has similar characteristic to that of the five studies used to re-evaluate the resuspension factor, with the most significant being aged mostly fixed contamination.
The other D and D default value that was not used in the model is the loose fraction. The maxiniuin direct measurement from the attachment points and upstream and downstream equipment survey unit (38,700 dpd100 cm2) was collected at location D503-S3. This location is where the D503 pipe elbow was removed (Figure 3). Four measurements were collected from the inside surface of the pipe loading to D503 around the circumference of the pipe cut. These measurement locations were D503-S1, S2, S3, and S4. In addition to direct measurements at these four locations, swipes were also collected. The direct measurement and swipe results for these four locations are summarized in Table 8.
Table 8. Determination of Loose Fraction
The default value for the loose fraction in D and D is 0.1 or 10%. Actual site data collected at these sampling locations reveal loose or removable fraction all less than 0.001 or 0.1%. A conservative value of 0.01 or 1%, whch is 10 times the site-specific data, was used in the dose model.
This use of the site-specific loose fraction is reasonable since the depleted uranium has not been in use in the system for 15 years, and the process requires the product “crude oil” to flow through the system at extreme temperatures and pressures. The probability of depleted uranium depositing and being readily removable on the inside of the process equipment is not high. The abrasive action caused by the high velocity, pressure and temperature flow would have either caused the depleted uranium to be washed out
13014~010~0~019~06 RadSuwOoseMod-03-06.doc 18
conipletely or firmly attached to the surface of the process equipment, which was demonstrated by direct and removable contamination surveys.
Top end flanges. End flange nuts and bolts. Potentiallv imoacted areas
The location where depleted uranium would deposit is likely to be the refractory drum due to the fact that the velocity, temperature and pressure are decreased at this location, which would facilitate deposition of material. This location was surveyed and demonstrated no observable fixed or removable contamination.
1.74E-40 mremlyr 8.70E-01 mremlyr. Not modeled in this scenario
Therefore, the dose modeling input parameters were modified to reflect the fact that the surface contamination is fixed with very little removable. The input parameters that were changed were the loose fraction (changed from 10% to 1%, which is consistent with the survey results) and the resuspended loose fraction that was changed to 9.6E-09 taken from NUREGl720.
Static MDC Scanning MDC
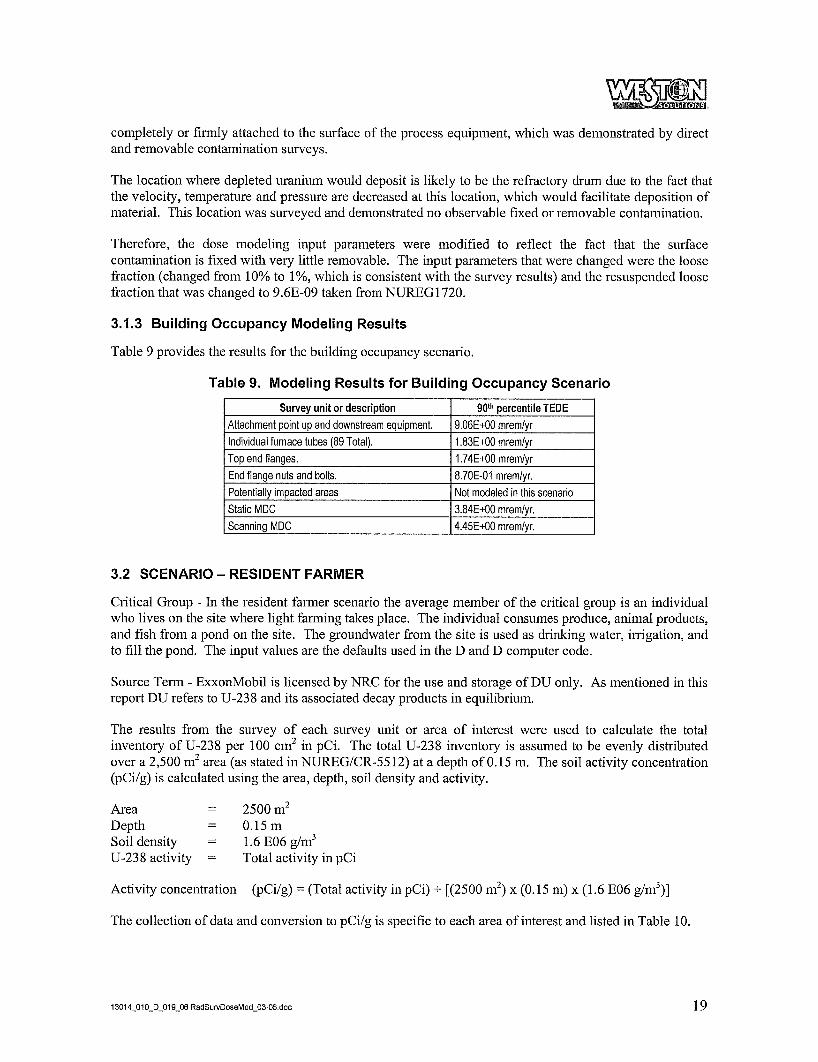
3.1.3 Building Occupancy Modeling Results
3.84E-40 mremlyr. 4.45E-40 mremlyr.
Table 9 provides the results for the building occupancy scenario.
Table 9. Modeling Results for Building Occupancy Scenario
I Sunrev unit or descriotion I 90h oercentile TEDE I Attachment point up and downstream equipment. Individual furnace tubes (89 Total).
I 9.06E-40 mremlyr I 1.83E40 mremlvr
3.2 SCENARIO - RESIDENT FARMER
Critical Group - In the resident farmer scenario the average member of the critical group is an individual who lives on the site where light farming takes place. The individual consumes produce, animal products, and fish from a pond on the site. The groundwater from the site is used as drinking water, irrigation, and to fill the pond. The input values are the defaults used in the D and D computer code.
Source Term - ExxonMobil is licensed by NRC for the use and storage of DU only. As mentioned in this report DU refers to U-238 and its associated decay products in equilibrium.
The results from the survey of each survey unit or area of interest were used to calculate the total inventory of U-238 per 100 cm’ in pCi. The total U-238 inventory is assumed to be evenly distributed over a 2,500 m2 area (as stated in NUREG/CR-5512) at a depth of 0.15 in. The soil activity concentration (pCi/g) is calculated using the area, depth, soil density and activity.
Area = 2500m’ Depth = 0.15m Soil density = 1.6 E06 g/m3 U-238 activity = Total activity in pCi
Activity concentration (pCi/g) = (Total activity in pCi) +- [(2500 in’) x (0.15 in) x (1.6 E06 g/m’)]
The collection of data and conversion to pCi/g is specific to each area of interest and listed in Table 10.
13014-010-D-019-06 RadSurvDoseMod-03-ffi.doc 19
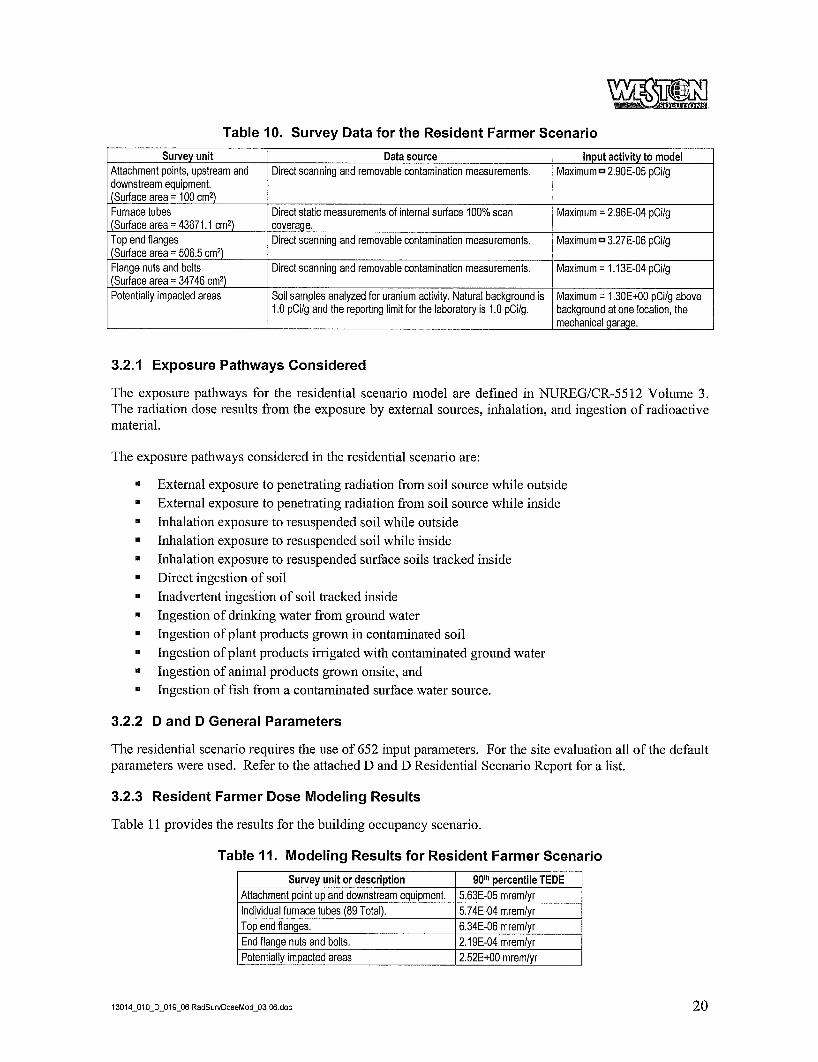
Table I O . Survey Data for the Resident Farmer Scenario
Survey unit Attachment points, upstream and downstream equipment. (Surface area = 100 cm2) Furnace tubes (Surface area = 43671.1 cm2) Top end flanges (Surface area = 506.5 cm2) Flange nuts and bolts (Surface area = 34746 cm2) Potentially impacted areas
Data source Input activity to model Direct scanning and removable contamination measurements. Maximum 2.90E-05 pCilg
Direct static measurements of internal surface 100% scan Maximum = 2.96E-04 pCilg coverage. Direct scanning and removable contamination measurements. Maximum 3.27E-06 pCilg
Direct scanning and removable contamination measurements. Maximum = 1.13E-04 pCilg
Soil samples analyzed for uranium activity. Natural background is Maximum = 1.30E40 pCilg above 1.0 pCilg and the reporting limit for the laboratory is 1.0 pCilg. background at one location, the
mechanical garage.
3.2.1 Exposure Pathways Considered
The exposure pathways for the residential scenario model are defined in NUREG/CR-5512 Volume 3. The radiation dose results from the exposure by external sources, inhalation, and ingestion of radioactive material.
Attachment point up and downstream equipment. Individual furnace tubes (89 Total). TOD end flames.
The exposure pathways considered in the residential scenario are:
5.63E-05 mremlyr 5.74E-04 mremlyr 6.34E-06 mremlvr
External exposure to penetrating radiation from soil source while outside External exposure to penetrating radiation from soil source while inside Inhalation exposure to resuspended soil while outside Inhalation exposure to resuspended soil while inside Inhalation exposure to resuspended surface soils tracked inside Direct ingestion of soil Inadvertent ingestion of soil tracked inside Ingestion of drinking water from ground water Ingestion of plant products grown in contaminated soil Ingestion of plant products irrigated with contaminated ground water Ingestion of animal products grown onsite, and Ingestion of fish from a contaminated surface water source.
3.2.2 D and D General Parameters
The residential scenario requires the use of 652 input parameters. For the site evaluation all of the default parameters were used. Refer to the attached D and D Residential Scenario Report for a list.
3.2.3 Resident Farmer Dose Modeling Results
Table 11 provides the results for the building occupancy scenario.
Table 11. Modeling Results for Resident Farmer Scenario
Survey unit or description I 90" percentile TEDE]
- End flange nuts and bolts. I2.19E-04 mremlyr Potentiallv imDacted areas 12.52E40 mremlvr
13014-010-D-019-06 RadSurvDoseMod-03-06.doc 20
4. CONCLUSION
The results of the surveying, samp,: collection, and dose modeling indicate that the residual contamination present at the site would result in a potential dose of 2.52 nlrem per year to the resident farnier and a maximum potential dose of 9.06 mrendyr to the building occupant. These values are well below the 25 m e m per year limit for license termination with unrestricted use.
The location where the maximum potential dose to the building occupant occurs was inside the pipe leading into D503 (refer to Figure 1 for a diagram of the process stream and location of D503 in relation to the furnace tubes and to Figure 3 for the actual survey location.) Under normal operating conditions, this location is not accessible to workers and therefore the potential that a plant worker would actually receive this dose is very low.
21
5. REFERENCES
NUREG-1720. R.M. Abu-Eic R.B. Codell, N.A. Eisenberg, T.E. Harris, S. McGuire. 2002. Re- evaluation of the Indoor Resuspeiision Factor for the Screening Analysis of the Bzrildiiig Occzipancy Scenario for NRCs License Terininatioiz Rule, Division of Waste Management Office of Nuclear Material Safety and Safeguards, U.S. Nuclear Regulatory Commission, Washington D.C. 20555-0001. June 2002.
NUREG-1757, Vol 2. D.W. Schmidt, J.J. Kottan, C.A. McKeimy, and S. Schneider. 2003. Consolidated NMSS Decominissioning Guidance - Characterization, Survey and Determination of Radiological Criteria, Division of Waste Management, Office of Nuclear Material Safety and Safeguards, U.S. Nuclear Regulatory Commission, Washington D.C. 20555-0001. September 2003.
NUREG-1761. E.W Abelquist, T.J. Bower, C.V. Gogolak, P. Shebell, R. Colman, G.E. Powers. 2002. Radiological Sziweys for Coiitrolling Release of Solid Materials, Division of Systems Analysis and Regulatory Effectiveness, Office of Nuclear Regulatory Research, U.S. Nuclear Regulatory Comnissioii, Washington D.C. 20555-0001. J ~ l y 2002.
NUREG/CR-55 12, Vol. 1. W.E. Kennedy, D.L. Strenge. 1992. Residual Radioactive Containinationfi’oni Decoininissioniiig: Technical Basis for Translating Containiitatioii Levels to Anniial Total Effective Dose Equivalent, U.S. Nuclear Regulatory Commission, Washington D.C. 20555-0001. 1992.
ICRP. 1977. Recommendations of the ICRP. ICRP Publication 26. Ann. ICRP 1, No. 3, Pergainon Press, Oxford. Reprinted (with additions) in 1987. Superseded by ICRP Publication 60.
ICRP. 199 1. 1990 Recommendations of the International Commission on Radiological Protection. ICRP Publication 60. Ann. ICRP 2 1 (1 -3), Pergamon Press, Oxford.
10 CFR 20.1003. Code of Federal Regulations, Title 10, Energy, Part 20, Standards for Protection against Radiation, December 3 1,2003.
U.S. Environmental Protection Agency (EPA). 1977. Exposure Factors Handbook, EPA/600/P-95/002Fa, Washington, DC.
23
APPENDIX A CALCULATION OF INPUT SOURCE TERMS TO D AND D MODEL
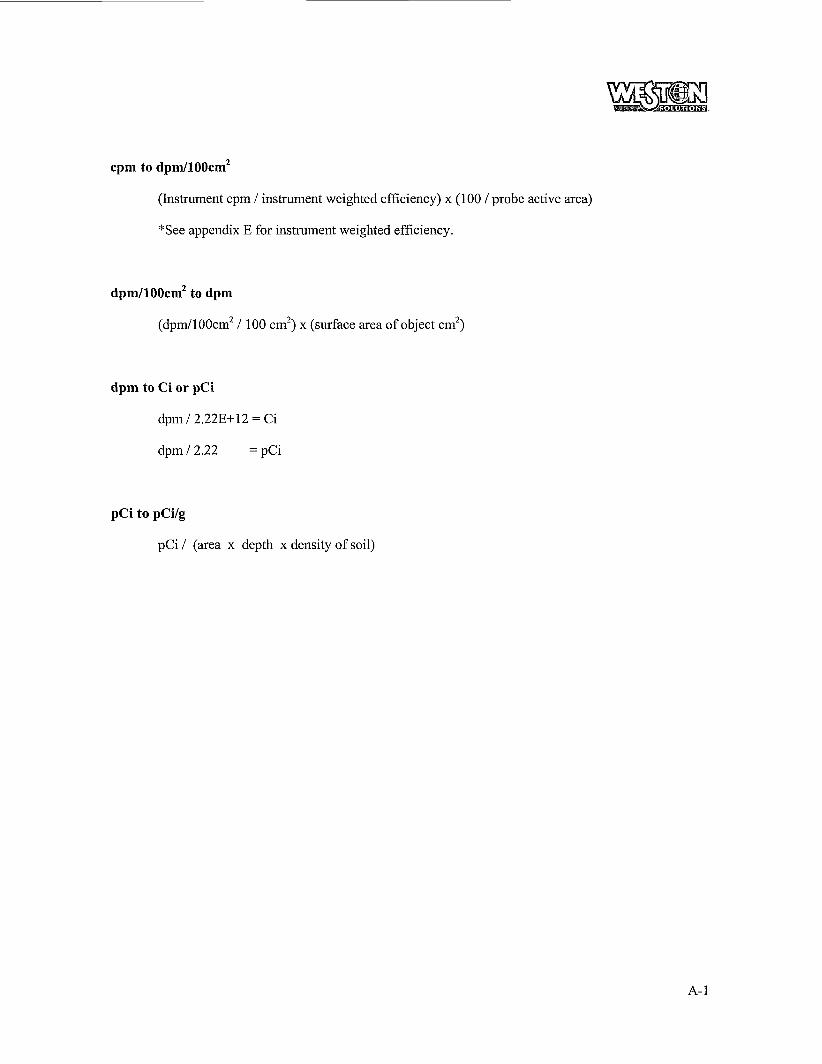
cpm to dpm/100cm2
(Instrument cpm / instrument weighted efficiency) x (100 I probe active area)
*See appendix E for instrument weighted efficiency.
dpm/100cm2 to dpm
(dpm/100cm2 / 100 cm’) x (surface area of object cm2)
dpm to Ci or pCi
dprn / 2.22E+12 = Ci
dpni 12.22 = pCi
pCi to pCi/g
pCi / (area x depth x density of soil)
A- 1
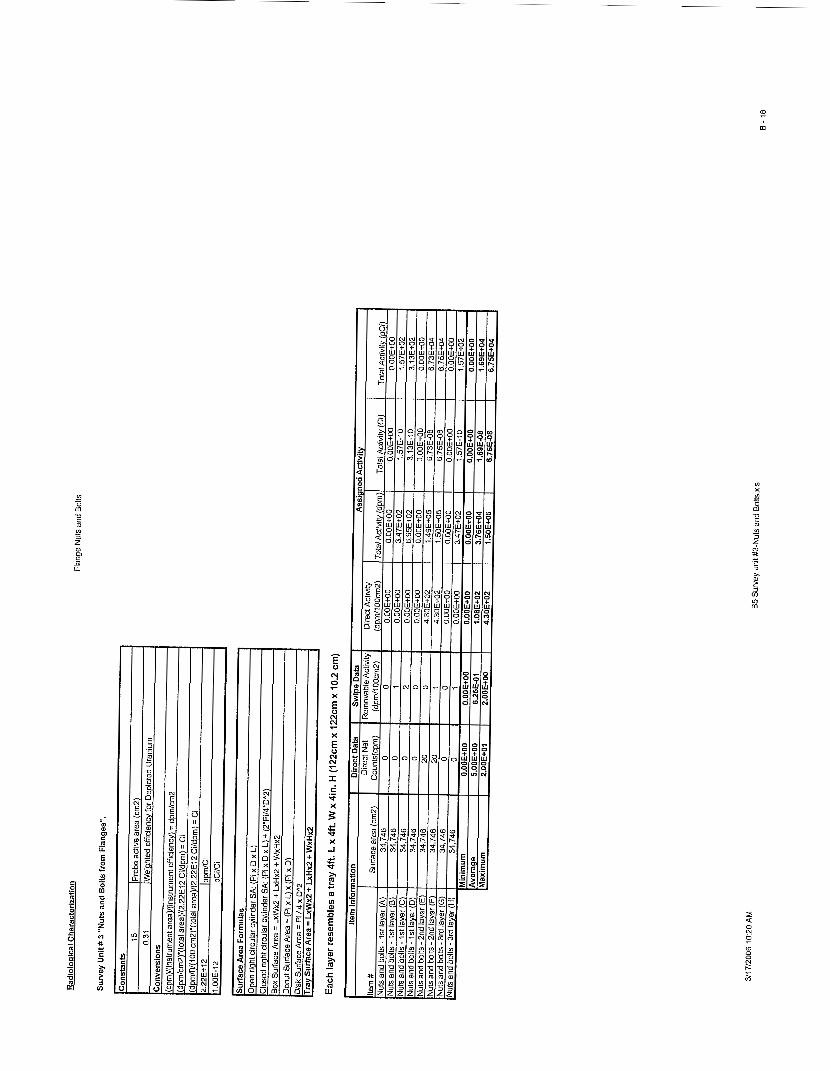
APPENDIX B CALCULATION OF SOURCE TERM INPUTS FOR DOSE MODELING
Appendix B contains the spreadsheets used to convert the fie I data results for each survey unit or area of interest, into the correct input source term values (i.e., counts per minute to disintegrations per minute or picoCuries). The following spreadsheets are contained in Appendix B.
Attachment point characterization ' Downstream equipment characterization ' Furnace tube characterization . . .
Survey Unit #1 - Top end flange characterization Survey Unit #3 - Nuts and bolts Characterization of potentially impacted areas of plant
B-1
m
m
I
C
E 5 I .=l
YI x c
ij rn C
m
-
I
2 0
c I
:: E I
I C
0
-r
m
m
m
m
r-
m
r m
m m
0
2 r z VI
c 0 a c
- .-
E H c
4
m
m
0
2 5 ID .. 0 I
E 5 9
r (0
In n ... B E
3 In
0 n
N m
m 0
d m
9 m
m m
(0 0 0
cn - x .I-1 K m Q
0 cn m m -a a, 0 m
- Lc
p!
.I-
.- E" - m K a, 0 n. 0 K 0 m N
0
m
.-
.I-
.I-
b
.-
.I-
.- ij e c1
6 co
0 x Q
m b
6
I
b e
i a E i
E c !
?
I
!
c
1
\
\
T I
cn m m p! 7J a, 0 m .I-
.- 2 - m K a, 0 Q
0
.-
.I-
-c-l
Lc
K 0 m N
.-
.I-
.- ij .I- V
6 6 CD
0 m 'c
x Q
6
2 a In Ln 2 co 0 0 N h . .r . m
APPENDIX C
BUILDING OCCUPANCY SCENARIO DOSE MODELING REPORT SUMMARIES FOR -

Appendix C contains the D and D dose modeling summary reports for each of the survey units and areas of interest evaluated using the building resident scenario. Appendix C has the following dose modeling summary reports attached:
m
ExxonMobil Attachment and downstream building occupancy ExxonMobil Fuiiiace tube building occupancy ExxonMobil Top flange building occuipancy ExxonMobil Nuts and bolts building occupancy ExxonMobil Static MDC Building Occupancy ExxonMobil Scanning MDC Building Occupancy
m
c- 1
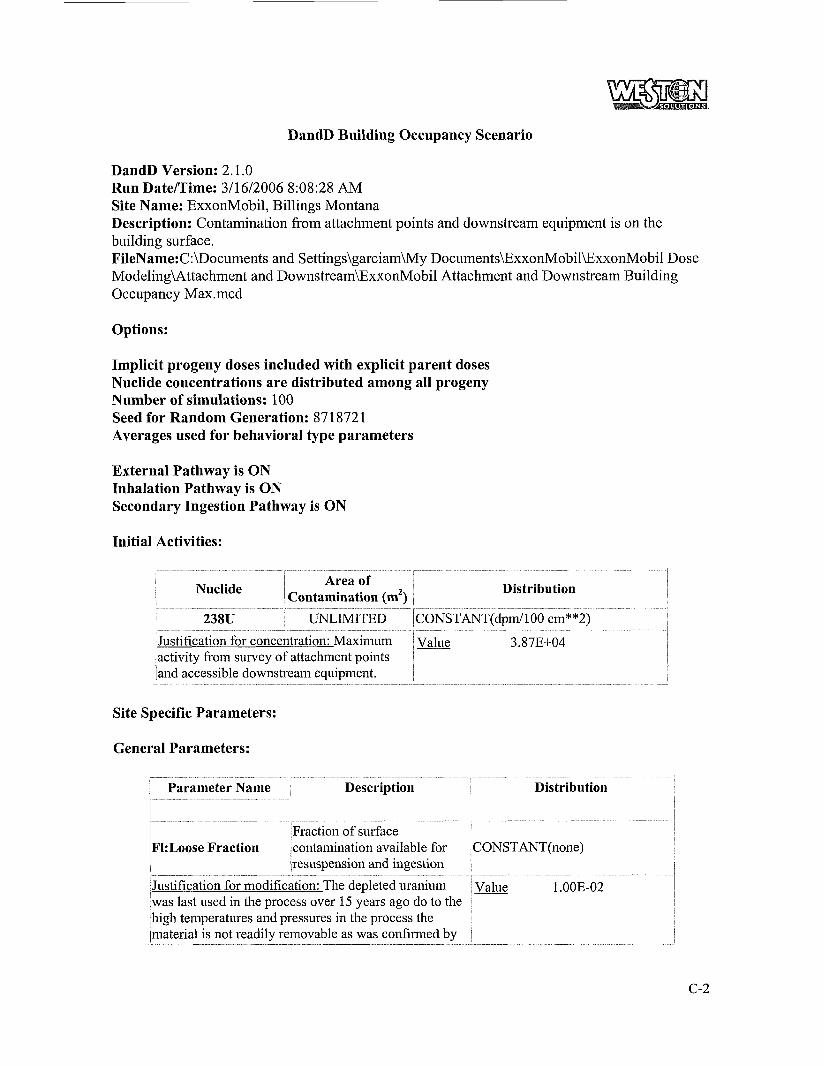
DandD Building Occupancy Scenario
i activity from survey of attachment points and accessible downstream equipment. !
DandD Version: 2.1.0 Run Date/Time: 3/16/2006 8:08:28 AM Site Name: ExxonMobil, Billings Montana Description: Contamination fiom attachment points and downstream equipment is on the building surface. FileName: C:\Documents and Settings\garciam\My Documents\ExxonMobil\ExxonMobil Dose ModelingMttachment and Downstream\ExxonMobil Attachment and Downstream Building Occupancy Max.mcd
Options:
Implicit progeny doses included with explicit parent doses Nuclide concentrations are distributed among all progeny Number of simulations: 100 Seed for Random Generation: 87 1872 1 Averages used for behavioral type parameters
External Pathway is ON Inhalation Pathway is ON Secondary Ingestion Pathway is ON
Initial Activities:
I i Area of i j Contamination (m2) i Nuclide I Distribution
~ 238U 1 UNLIMITED /CONSTANT(dpm/lOO cm**2)
Site Specific Parameters:
General Parameters:
, I 1 ParameterNarne ~ Description I I Distribution __
I
I
1 lFraction of surface /Fl:Loose Fraction contamination available for CONSTANT(none) i jresuspensioii and ingestion ~
jJustification for modification: The depleted uranium iwas last used in the process over 15 years ago do to the high temperatures and pressures in the process the I material is not readily removable as was confirmed by
Value 1.00E-02
c -2
direct versus reniovable measurements which indicated I
less than 1% is removable. -
1- - - ~ - - - ~ _ - _ _ ~ ~- _ _ __ _ _ ~ __ _ _ _ _ _ iDefault CONSTANT(none)
' Value 1.00E-01 I-
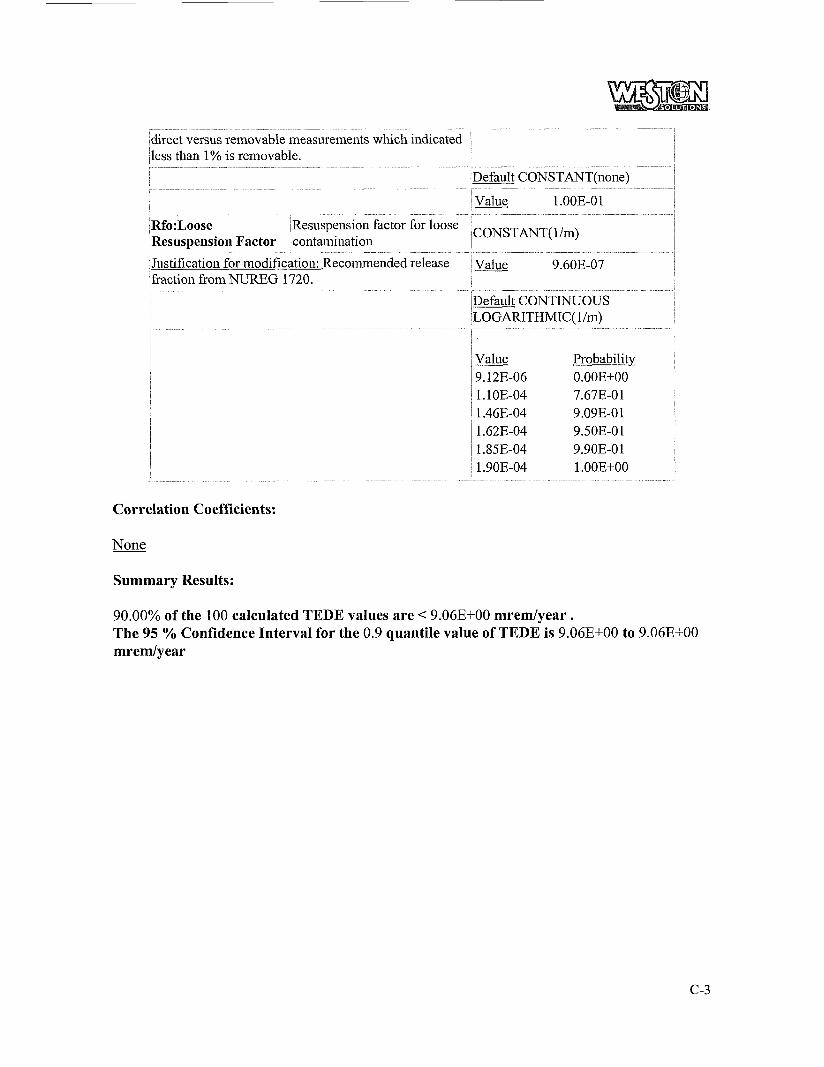
, CONSTANT( 1 /m) Rfo:Loose ,Resuspension factor for loose ,Resuspension Factor Icontamination
'Justification for modification: Recommended release 'fraction from NUREG 1720.
Value 9.60E-07
jDefault CONTINUOUS i LOGARITHMIC( 1 /m)
Value Probability 9.12E-06 O.OOE+OO 1.10E-04 7.67E-01 1.46E-04 9.09E-01 1.62E-04 9.50E-01 1.85E-04 9.90E-0 1 1.90E-04 l.OOE+OO
Correlation Coefficients:
None
Summary Results:
90.00% of the 100 calculated TEDE values are The 95 % Confidence Interval for the 0.9 quantile value of TEDE is 9.06E+00 to 9.06E+00 mr em/y ear
9.06E+00 mrem/year .
DandD Building Occupancy Scenario
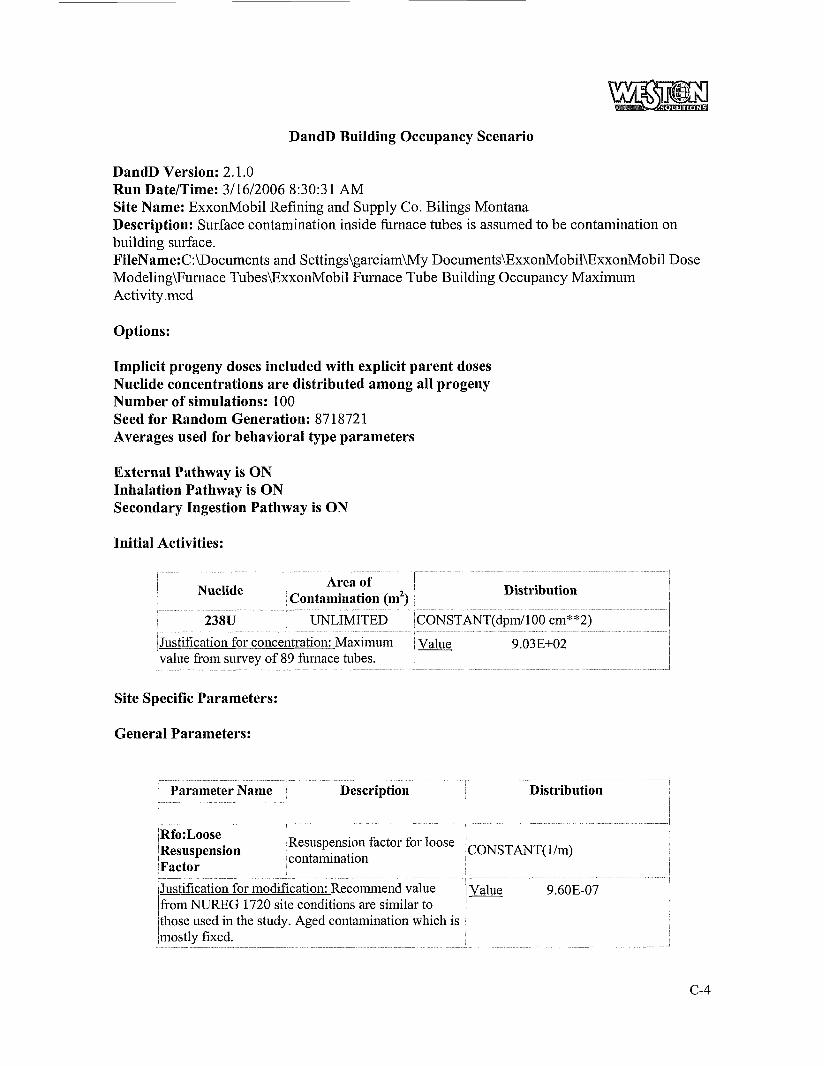
DandD Version: 2.1 .O Run Date/Time: 3/16/2006 8:30:31 AM Site Name: ExxonMobil Refining and Supply Co. Bilings Montana Description: Surface contamination inside furnace tubes is assumed to be contamination on building surface. FileName:C:\Documents and Settings\garciam\My Documents\ExxonMobil\ExxonMobil Dose Modeling\Furnace Tubes\ExxonMobil Furnace Tube Building Occupancy Maximum Activity .mcd
Options:
Implicit progeny doses included with explicit parent doses Nuclide concentrations are distributed among all progeny Number of simulations: 100 Seed for Random Generation: 87 1872 1 Averages used for behavioral type parameters
External Pathway is ON Inhalation Pathway is ON Secondary Ingestion Pathway is ON
Initial Activities:
I I Area of 1 1 m contamination (m2) 1 Nuclide Distribution
238U I UNLIMITED ~CONSTANT(dpiJ100 cm**2) I
justification for concentration: Maximum 1 Value Ivalue from survey of 89 furnace tubes.
9.03E+02
Site Specific Parameters:
General Parameters:
I ParameterName 1 Description i Distribution I ~
Resuspension factor for loose I ,CONSTANT( l/m) contamination I
I
:Rfo:Loose 'Resuspension :Factor I Justification for modification: Recoinmend value 1 Value 9.60E-07 ' fiom NUREG 1720 site conditions are similar to jthose used in the study. Aged contamination which is imostly fixed.
c-4
IDefault CONTINUOUS iLOGARITHMIC( Urn)
Value 9.12E-06 1.1 OE-04 1.46E-04 1.62E-04 1.85E-04 1.90E-04
Probabilitv 0.00E-i-00 7.67E-01 9.09E-01 9.50E-0 1 9.90E-01 l.OOE+OO
Correlation Coefficients:
None
Summary Results:
90.00% of the 100 calculated TEDE values are < 1.83E+00 mrem/year.
The 95 % Confidence Interval for the 0.9 quantile value of TEDE is 1.83E+00 to 1.83E+00 mrem/year
c-5
DandD Building Occupancy Scenario
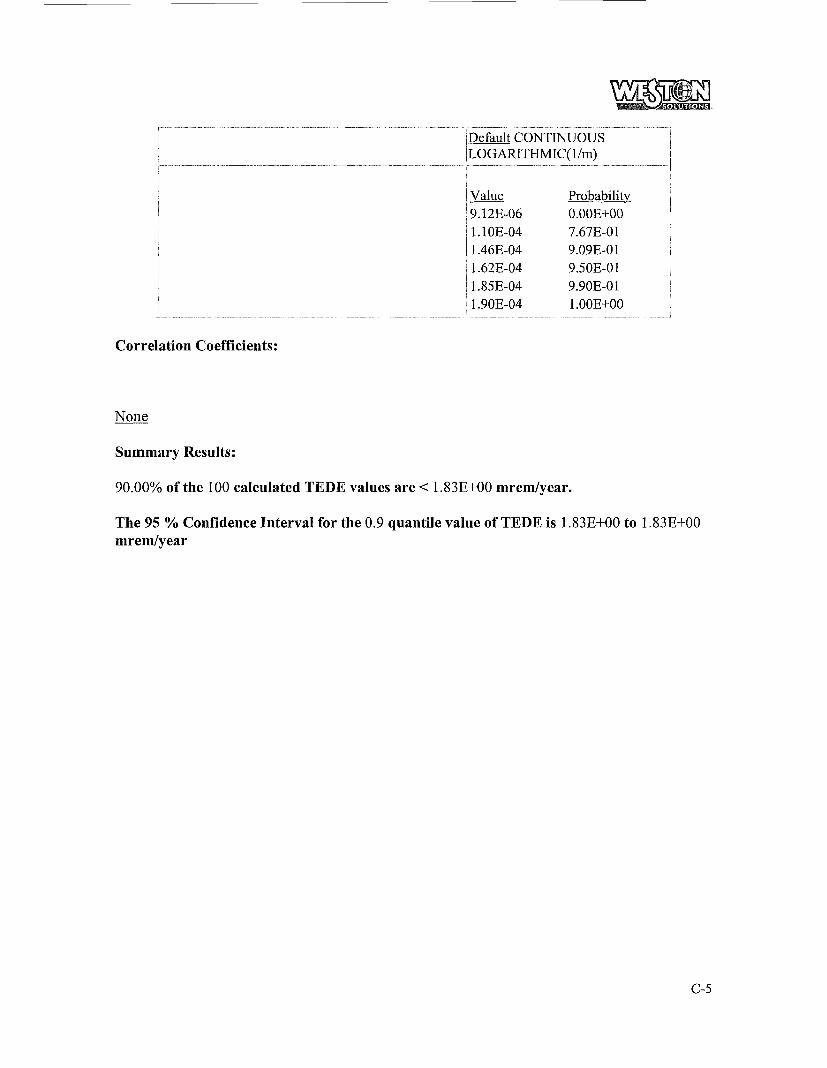
DandD Version: 2.1.0 Run Date/Time: 3/16/2006 11:30:47 AM Site Name: ExxonMobil, Billings Montana Description: Contamination fiom top end flanges is on the building surface. FileName: C:\Documents and Settings\garciam\My Documents\ExxonMobil\ExxonMobil Dose Modeling\Top Flanges\ExxonMobil Top Flange Building Occupancy Maximum Activity.mcd
Options:
Implicit progeny doses included with explicit parent doses Nuclide concentrations are distributed among all progeny Number of simulations: 100 Seed for Random Generation: 87 1872 1 Averages used for behavioral type parameters
External Pathway is ON Inhalation Pathway is ON Secondary Ingestion Pathway is ON
Initial Activities:
I I Nuclide Area of
Contamination (mZ) Distribution I I I 238U I UNLIMITED kONSTANT(dpd100 cin""2) I
'Justification for concentration: Maximum activity from survey of top end flanges.
Value_ I
8.61Et-02 ~
I
Site Specific Parameters:
General Parameters:
I ~ ParameterName Description I Distribution
~ c o w r . m T ( u 1 ) /Rfo:Loose Resuspension /Resuspension factor for loose [Factor /contamination ~
I
/Justification for modification: Recommended release fraction ~ Value
\from NUREG 1720. l- 9.60E-07
'Default CONTINUOUS LOGARITHMIC( l/m)
I I ~ Value Probability !
C-6
9.12E-06 O.OOE+OO 1.1 OE-04 7.67E-0 1 1.46E-04 9.09E-01 1.62E-04 9.50E-0 1 1.85E-04 9.90E-01 1.90E-04 1.00Et-00
Correlation Coefficients:
None
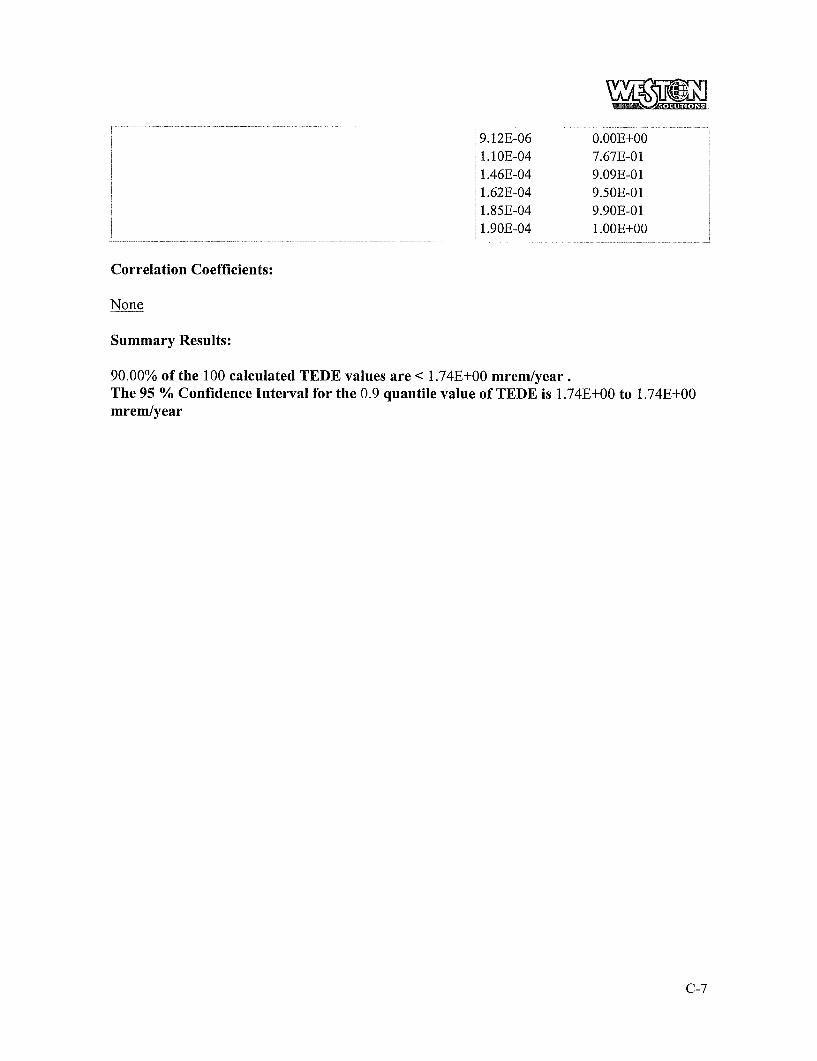
Summary Results:
90.00% of the 100 calculated TEDE values are The 95 % Confidence Interval for the 0.9 quantile value of TEDE is 1.74E+00 to 1.74Et-00 mrem/year
1.74E+00 mrem/year .
c-7
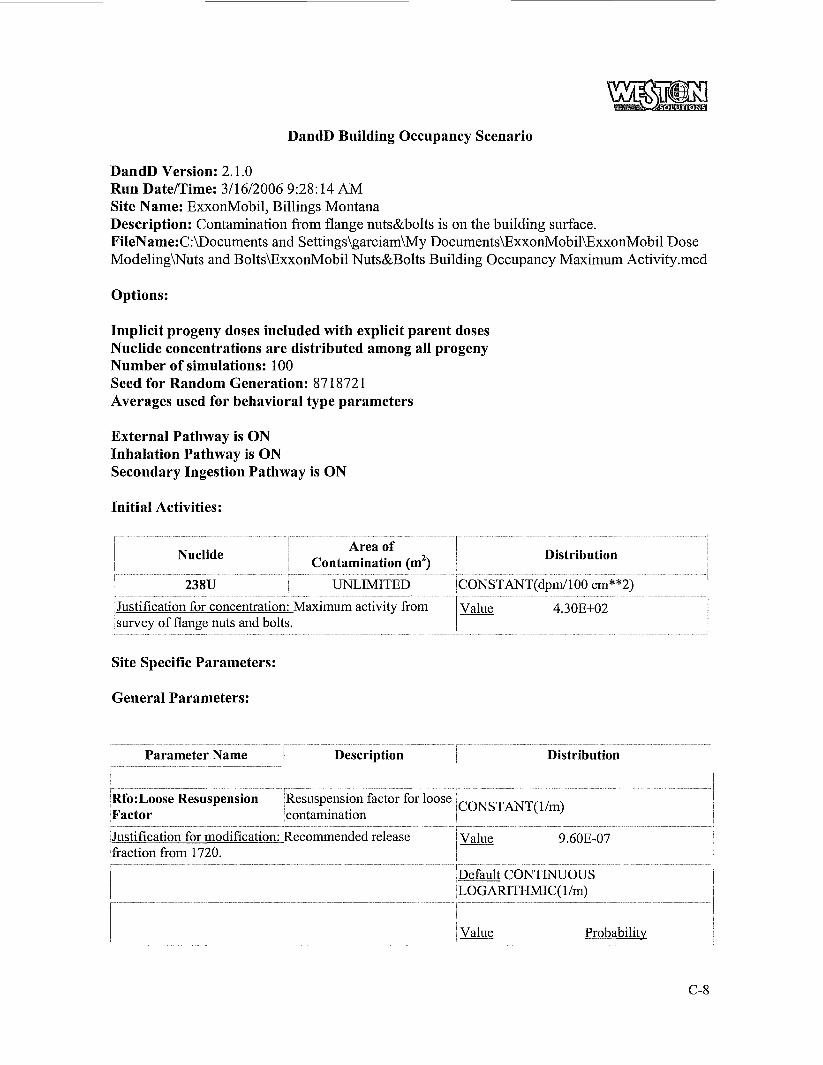
DandD Building Occupancy Scenario
DandD Version: 2.1.0 Run Date/Time: 3/16/2006 9:28: 14 AM Site Name: ExxonMobil, Billings Montana Description: Contamination from flange nuts&bolts is on the building surface. Fi1eName:C:Documents and Settings\garciam\My Documents\ExxonMobil\ExxonMobil Dose Modeling\Nuts and Bolts\ExxonMobil Nuts&Bolts Building Occupancy Maximum Activity.mcd
Options:
Implicit progeny doses included with explicit parent doses Nuclide concentrations are distributed among all progeny Number of simulations: 100 Seed for Random Generation: 87 1872 1 Averages used for behavioral type parameters
External Pathway is ON Inhalation Pathway is ON Secondary Ingestion Pathway is ON
Initial Activities:
i Nuclide !
! ~ Area of ~
~ Contamination (m2) ~
Distribution I , 238U , UNLIMITED ! CONSTANT(dpm/ 1 00 cm* *2) i I
Justification for concentration: Maximum activity from Value 4.30E+02 ,survey of flange nuts and bolts.
Site Specific Parameters:
General Parameters:
i Parameter Name I 1 Description ~ Distribution
1Rfo:Loose Resuspension /Resuspension factor for loose ,CONSTANT( 1/m) [Factor 1 contamination I ! 1 Justification for modification: Recommended release lfiaction from 1720.
1 I- Value 9.60E-07
/Default CONTINUOUS /LOGARITHMIC( 1 /m)
I I ! 1 ~ Value Probability I
C-8
9.12E-06 1.1 OE-04 1.46E-04 1.62E-04 1.85E-04 1.90E-04
O.OOE+OO 7.67E-01 9.09E-01 9.50E-01 9.90E-01 l.OOE+OO
Correlation Coefficients:
None
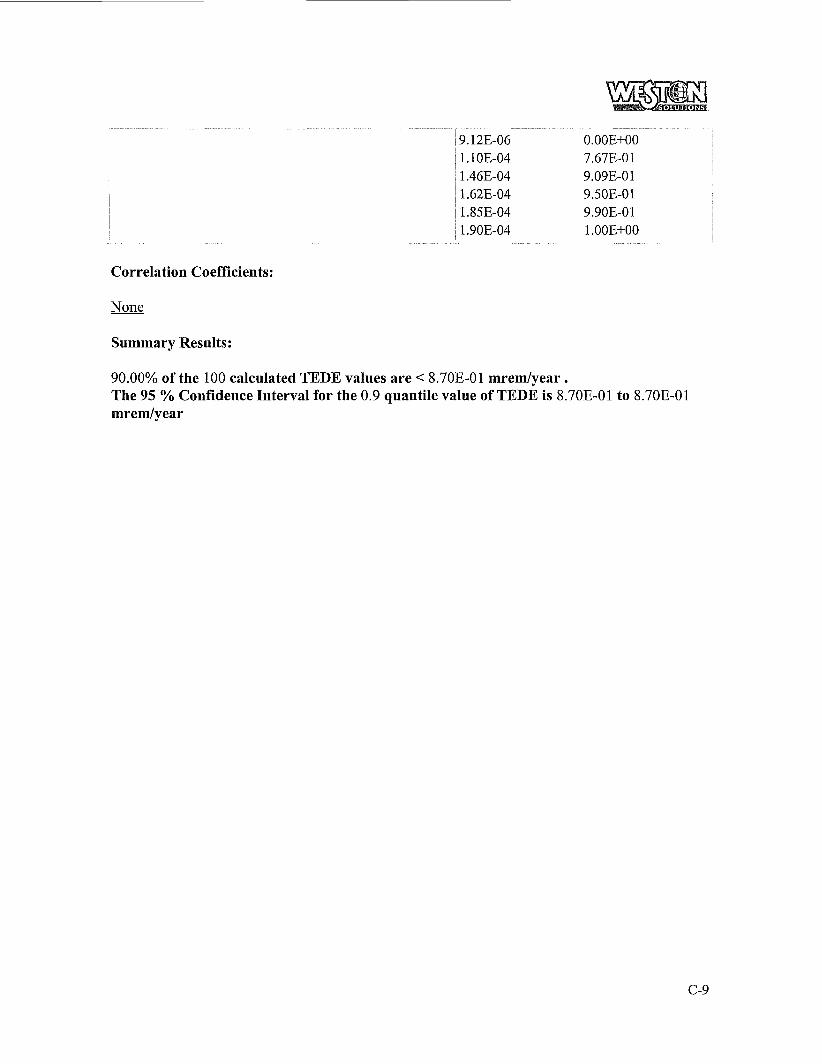
Summary Results:
90.00% of the 100 calculated TEDE values are < 8.70E-01 mrem/year . The 95 % Confidence Interval for the 0.9 quantile value of TEDE is 8.70E-01 to 8.70E-01 mrem/year
c-9
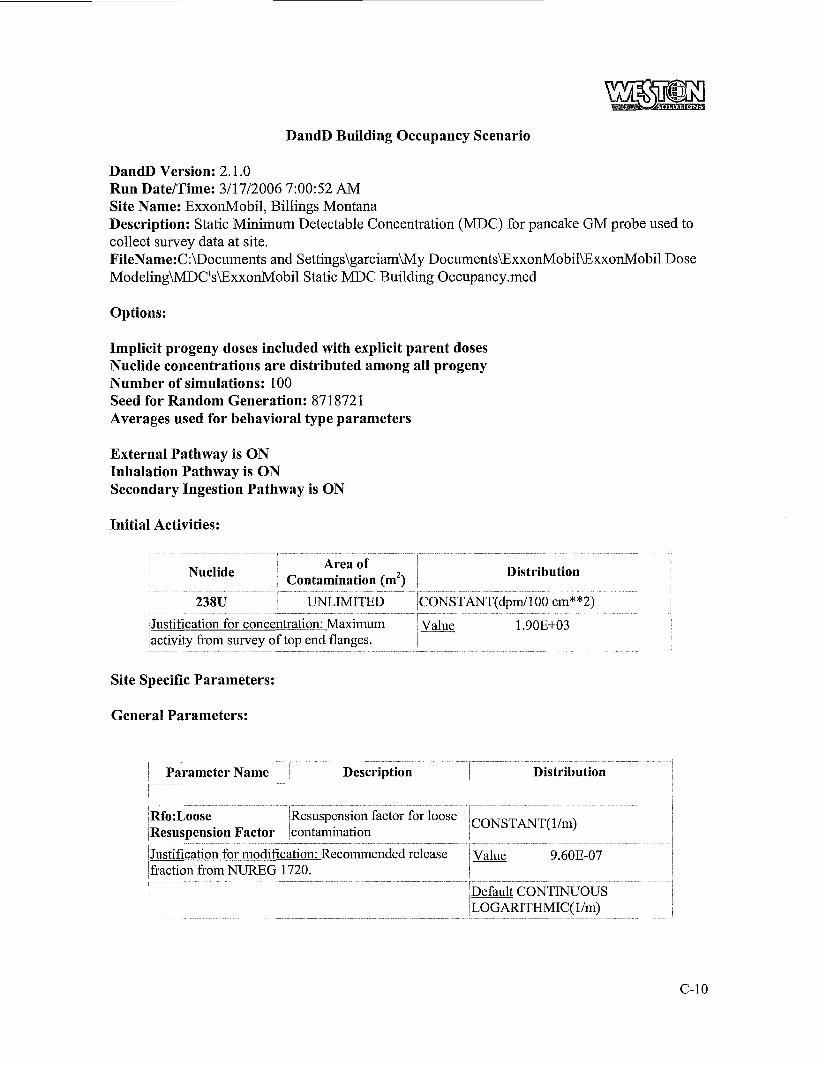
DandD Building Occupancy Scenario
DandD Version: 2.1 .O Run Date/Time: 3/17/2006 7:00:52 AM Site Name: ExxonMobil, Billings Montana Description: Static Minimum Detectable Concentration (MDC) for pancake GM probe used to collect survey data at site. FileName: C:\Documents and Settings\garciamWly Documents\ExxonMobil\ExxonMobil Dose ModelingWDC'sExxonMobil Static MDC Building 0ccupancy.mcd
Options:
Implicit progeny doses included with explicit parent doses Nuclide concentrations are distributed among all progeny Number of simulations: 100 Seed for Random Generation: 87 18721 Averages used for behavioral type parameters
External Pathway is ON Inhalation Pathway is ON Secondary Ingestion Pathway is ON
Initial Activities:
Nuclide
238U
I
~
Area of I Contamination (mZ) I Distribution
. . I
I UNLIMITED CONSTANT(dpm/lOO cm**2) ,
Justification for concentration: Maximum Value 1.90E1-03 ,activity from survey of top end flanges.
Site Specific Parameters:
General Parameters:
~ ParameterName ~ Description ~ Distribution
/Rfo:Loose IResuspension Factor icontamination
/Resuspension factor for loose /CONSTANT( 1/m)
- - _ _ - - ~ _ _ - __ - Justification for modification: Recommended release ~ Value 9.60E-07 'fraction from NUREG 1720. i
/Default CONTINUOUS /LOGARITHMIC( l/m)
c-10
Value 9.12E-06
' l.lOE-04 ' 1.46E-04 i 1.62E-04 I 1.85E-04 1 1.90E-04
1
Probabilitv 0.00E"rOO 7.67E-01 9.09E-0 1 9.50E-0 1 9.90E-01 I.OOE+OO
Correlation Coefficients:
None
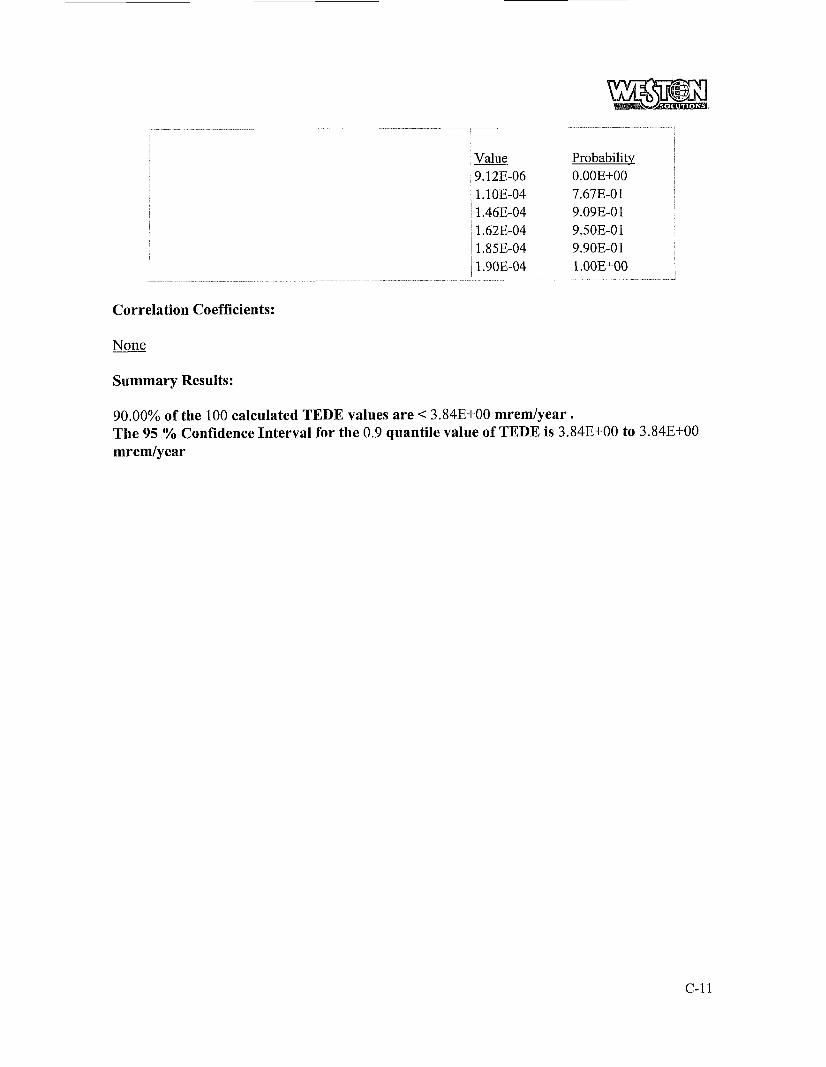
Summary Results:
90.00% of the 100 calculated TEDE values are The 95 % Confidence Interval for the 0.9 quantile value of TEDE is 3.84Et-00 to 3.84Et-00 mremlyear
3.84E+00 mrem/year .
c- I1
DandD Building Occupancy Scenario
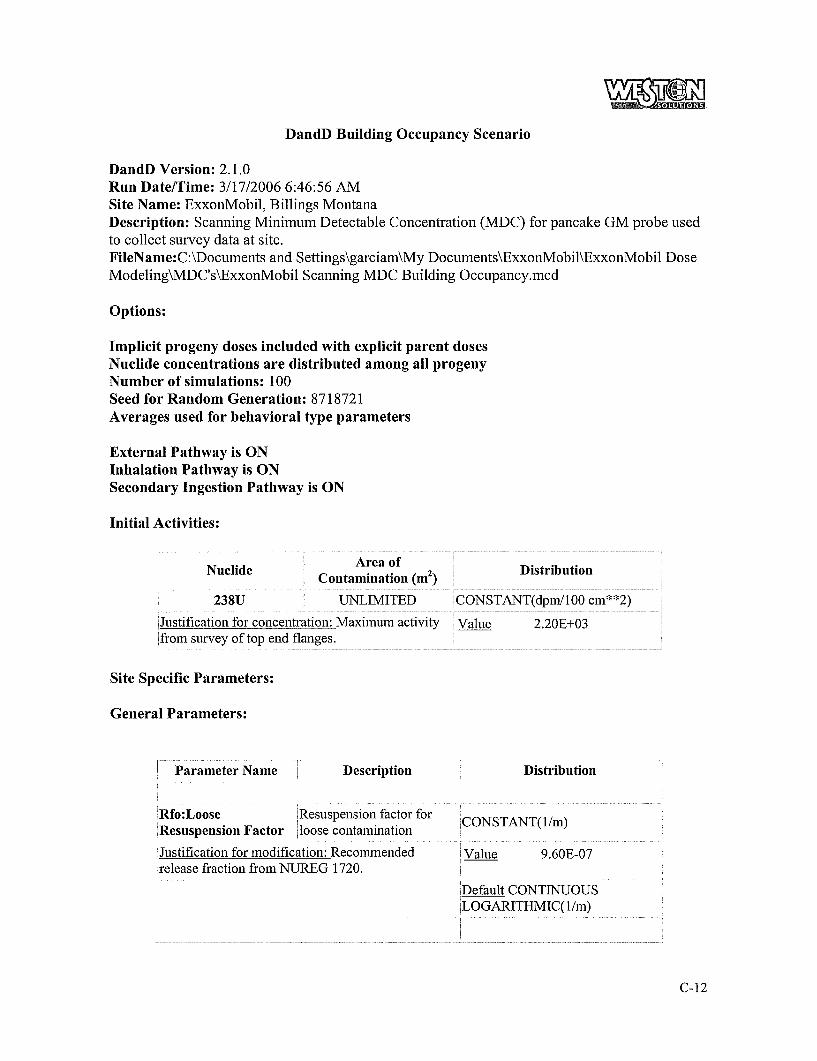
DandD Version: 2.1 .O Run Date/Time: 3/17/2006 6:46:56 AM Site Name: ExxonMobil, Billings Montana Description: Scanning Minimum Detectable Concentration (MDC) for pancake GM probe used to collect survey data at site. FileName: C:\Documents and Settings\garciam\My Documents\ExxonMobil\ExxonMobil Dose ModelingWDC'sExxonMobil Scanning MDC Building 0ccupancy.mcd
Options:
Implicit progeny doses included with explicit parent doses Nuclide concentrations are distributed among all progeny Number of simulations: 100 Seed for Random Generation: 87 1872 1 Averages used for behavioral type parameters
External Pathway is ON Inhalation Pathway is ON Secondary Ingestion Pathway is ON
Initial Activities:
I I I Area of I
1 Contamination (m2> Nuclide i I Distribution
I 238U 1 UNLIMITED 'CONSTANT(dpm/lOO cm**2) , I
i Justification for concentration: Maxiinurn activity ~ Value I I
I 2.20E+03 i lfrom survey of top end flanges. I I
Site Specific Parameters:
General Parameters:
Parameter Name I Description j Distribution
I
I
Resuspension factor for CONSTANT( 1 /m) ~ - _- - ~ ~ ~ ~ ~ ~ ~ i o n ~- Factor - - _ - 'loose contamination - - - -
Justification for modification: Recommended ~ Value 9.60E-07 release fraction from NUREG 1720.
I - i I ILOGARITHMIC( l/m)
- - _ /Default CONTINUOUS
c-12
Value Probabilitv 9.12E-06 O.OOE+OO 1.10E-04 7.67E-01 1.46E-04 9.09E-0 1 1.62E-04 9.50E-01 1.85E-04 9.90E-01 1.90E-04 1.00E+00
Correlation Coefficients:
None
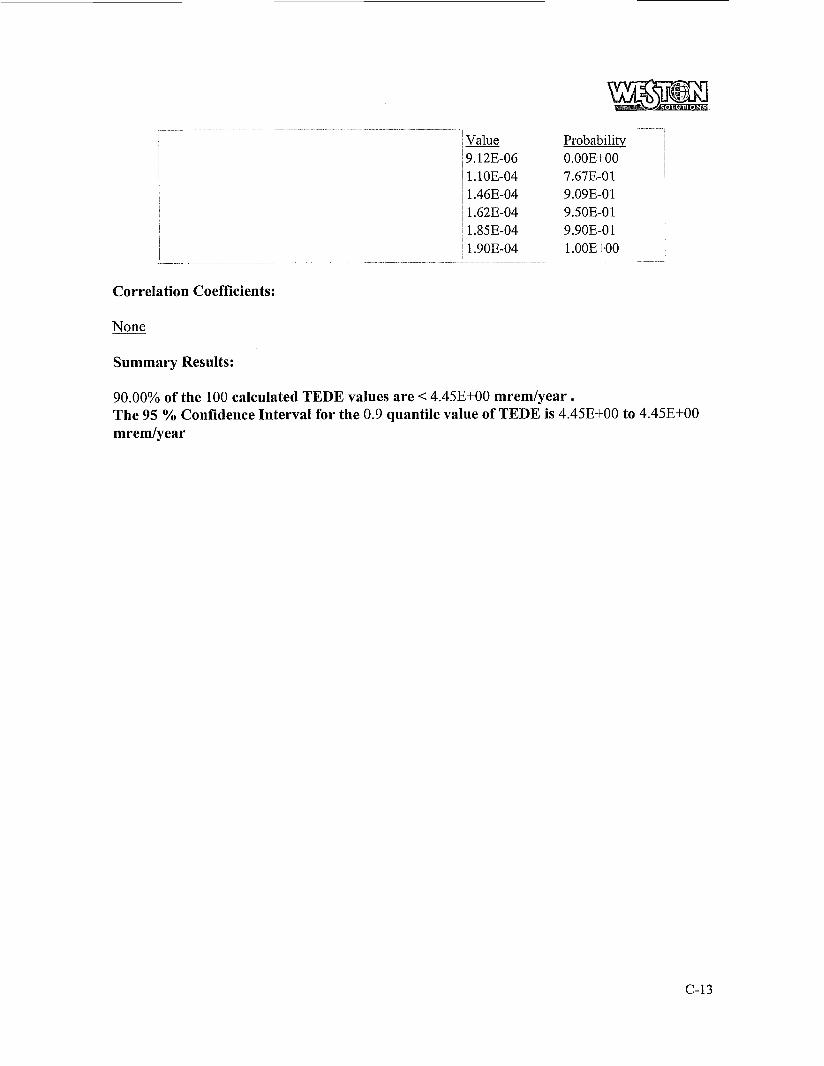
Summary Results:
90.00% of the 100 calculated TEDE values are The 95 % Confidence Interval for the 0.9 quantile value of TEDE is 4.45E"rOO to 4.45E-tOO mrem/year
4.45E+00 mrem/year .
C-13
APPENDIX D
RESIDENT FARMER SCENARIO DOSE MODELING REPORT SUMMARIES FOR -
Appendix D contains the D and D dose modeling summary reports for each of the survey units and areas of interest evaluated using the resident farmer scenario. Appendix D has the following dose inodeling summary reports attached:
ExxonMobil Attachment and downstream residential
ExxonMobil Top flange residential ExxonMobil Nuts and bolts residential ExxonMobil potentially impacted areas residential
ExxonMobil Furnace tube residential
.
D-1
DandD Residential Scenario
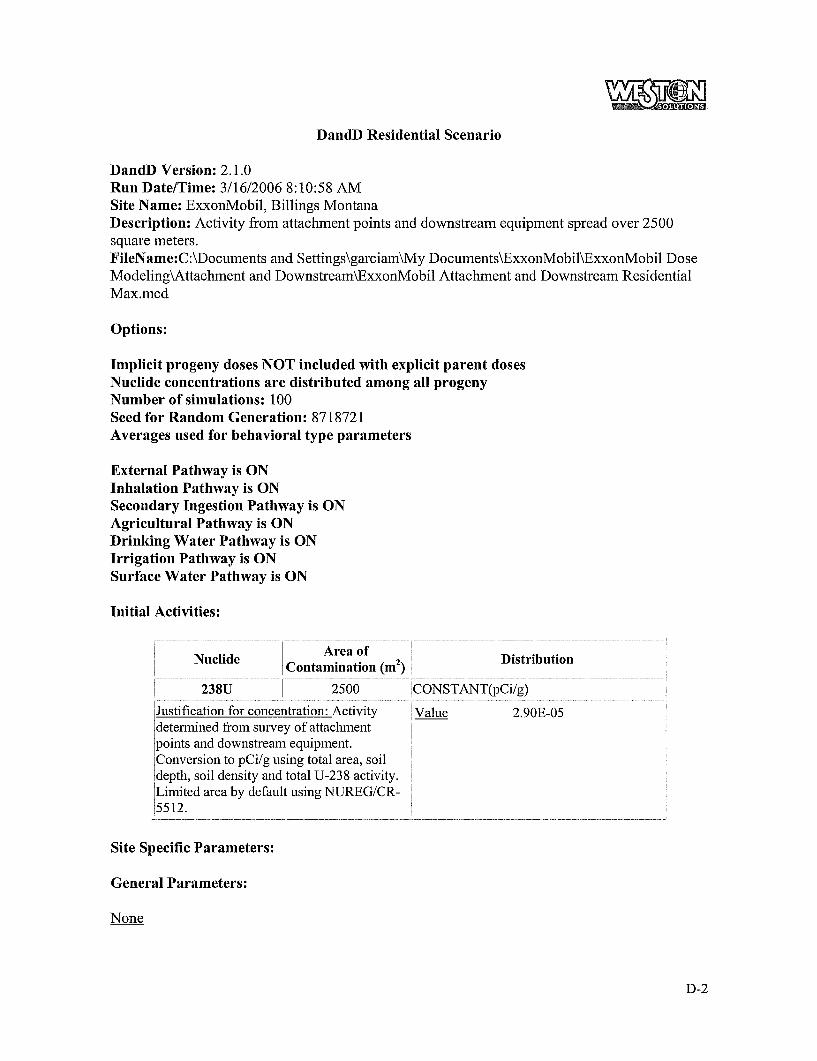
DandD Version: 2.1 .O Run Date/Time: 3/16/2006 8:10:58 AM Site Name: ExxonMobil, Billings Montana Description: Activity from attachment points and downstream equipment spread over 2500 square meters. FileName: C:\Documents and Settings\garciam\My Documents\ExxonMobil\ExxonMobil Dose Modelingkttachment and Downstream\ExxonMobil Attachment and Downstream Residential Max.mcd
Options:
Implicit progeny doses NOT included with explicit parent doses Nuclide concentrations are distributed among all progeny Number of simulations: 100 Seed for Random Generation: 87 1872 1 Averages used for behavioral type parameters
External Pathway is ON Inhalation Pathway is ON Secondary Ingestion Pathway is ON Agricultural Pathway is ON Drinking Water Pathway is ON Irrigation Pathway is ON Surface Water Pathway is ON
Initial Activities:
I ! Area of
Contamination (m2) 1 i
Nuclide I Distribution
1 238U I 2500 /CONSTANT@Ci/g) I
I- Value 2.90E-05 j Justification for concentration: Activity ldetennined from survey of attachment
~ /points and downstream equipment. Conversion to pCi/g using total area, soil , depth, soil density and total U-238 activity. I
Iliinit ed area by default using NUREG/CR- 1
i
15512. I I
Site Specific Parameters:
General Parameters:
None
D-2

Element Dependant Parameters
None
Correlation Coefficients:
None
Summary Results:
90.00% of the 100 calculated TEDE values are < 5.63E-05 mrem/year . The 95 % Confidence Interval for the 0.9 quantile value of TEDE is 3.46E-05 to 1 .%E-04 mrem/year
D-3
DandD Residential Scenario
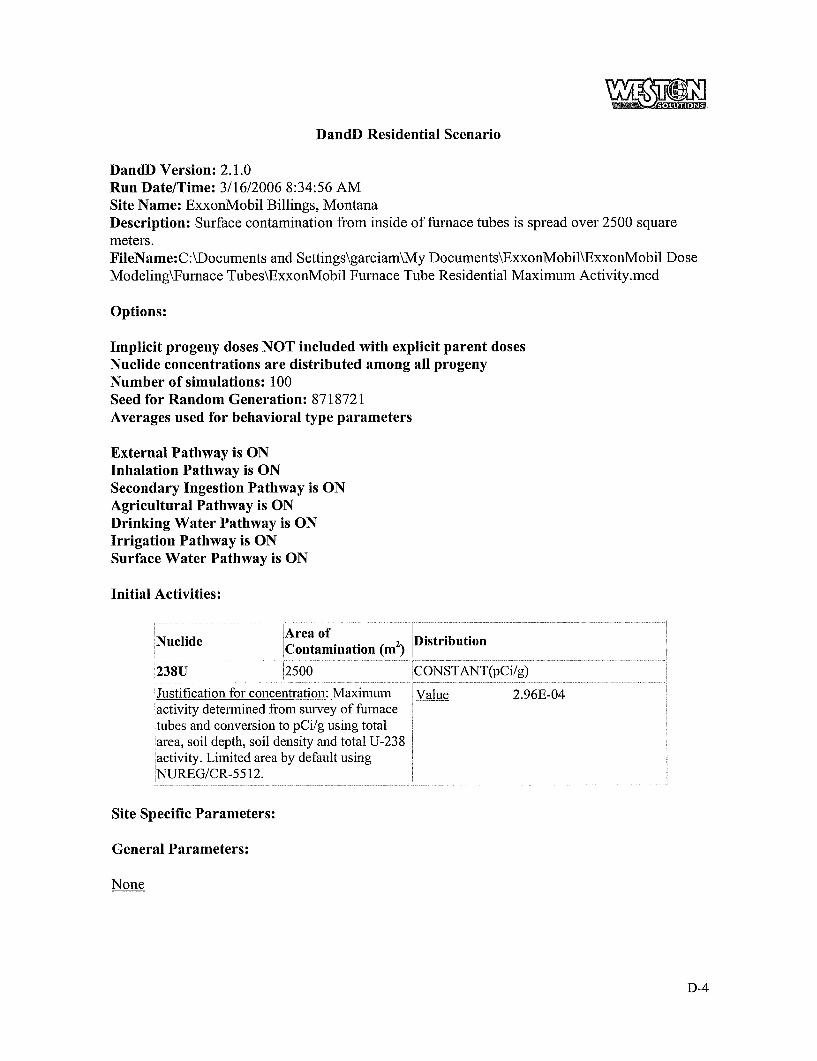
DandD Version: 2.1 .O Run Date/Time: 3/16/2006 8:34:56 AM Site Name: ExxonMobil Billings, Montana Description: Surface contamination from inside of furnace tubes is spread over 2500 square meters. FileName:C:\Documents and Settings\garciam\My Documents\ExxonMobil\ExxonMobil Dose Modeling\Fui+nace Tubes\ExxonMobil FLirnace Tube Residential Maximum Activity.mcd
Options:
Implicit progeny doses NOT included with explicit parent doses Nuclide concentrations are distributed among all progeny Number of simulations: 100 Seed for Random Generation: 87 1872 1 Averages used for behavioral type parameters
External Pathway is ON Inhalation Pathway is ON Secondary Ingestion Pathway is ON Agricultural Pathway is ON Drinking Water Pathway is ON Irrigation Pathway is ON Surface Water Pathway is ON
Initial Activities :
I ;Nuclide I
Area Contamination of (mZ) IDistribution
i238U 12500 1 CONSTANT@Ci/g) I Justification for concentration: Maximum ;activity determined from survey of furnace ltubes and conversion to pCi/g using total ;area, soil depth, soil density and total U-238 /activity. Limited area by default using INUREG/CR-~~ 12.
Value 2.96E-04
Site Specific Parameters:
General Parameters:
None
D-4
Element Dependant Parameters
None
Correlation Coefficients:
None
Summary Results:
90.00% of the 100 calculated TEDE values are The 95 % Confidence Interval for the 0.9 quantile value of TEDE is 3.53E-04 to 1.58E-03 mremlyear
5.74E-04 mrem/year .
D-5
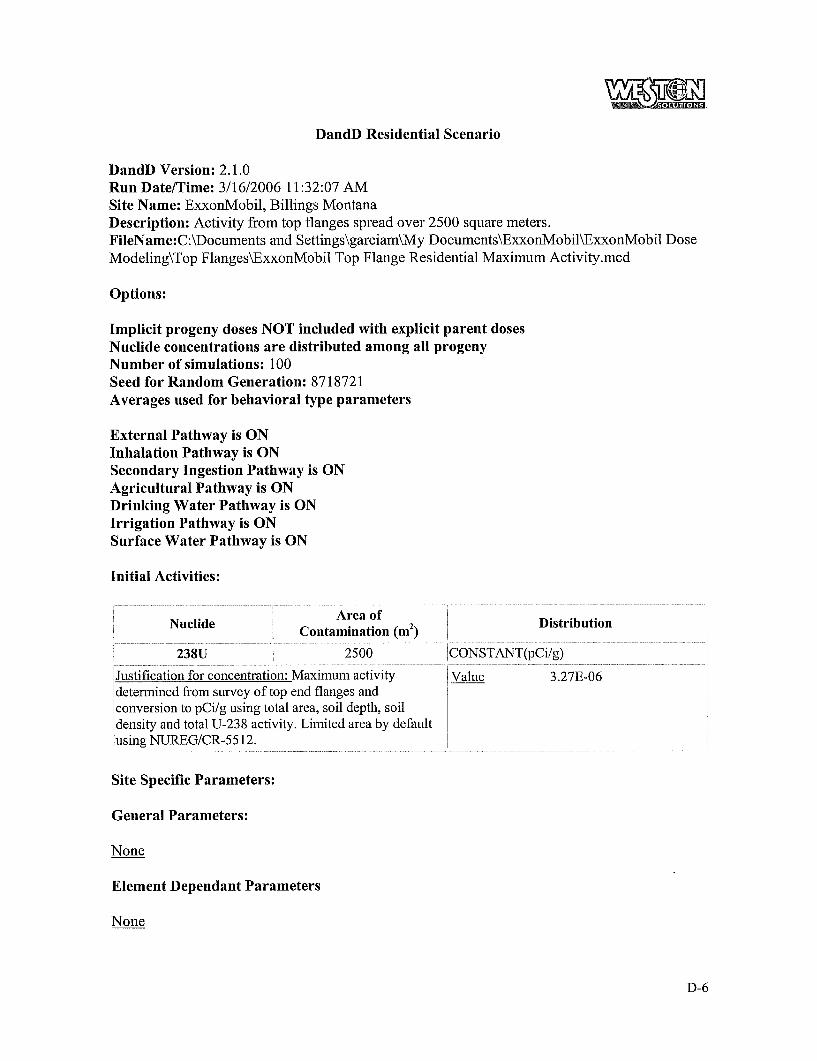
DandD Residential Scenario
'conversion to pCi/g using total area, soil depth, soil density and total U-238 activity. Limited area by default using NUREG/CR-55 12.
DandD Version: 2.1 .O Run Date/Time: 3/16/2006 11:32:07 AM Site Name: ExxonMobil, Billings Montana Description: Activity fiom top flanges spread over 2500 square meters. FileName:C:\Documents and Settings\garciam\My Documents\ExxonMobilExxonMobil Dose Modeling\Top FlangesExxonMobil Top Flange Residential Maximum Activity.mcd
Options:
Implicit progeny doses NOT included with explicit parent doses Nuclide concentrations are distributed among all progeny Number of simulations: 100 Seed for Random Generation: 871 872 1 Averages used for behavioral type parameters
External Pathway is ON Inhalation Pathway is ON Secondary Ingestion Pathway is ON Agricultural Pathway is ON Drinking Water Pathway is ON Irrigation Pathway is ON Surface Water Pathway is ON
Initial Activities:
Nuclide ~ Area of Distribution
Site Specific Parameters:
General Parameters:
None
Element Dependant Parameters
None
D-6

Correlation Coefficients:
None
Summary Results:
90.00% of the 100 calculated TEDE values are The 95 % Confidence Interval for the 0.9 quantile value of TEDE is 3.90E-06 to 1.74E-05 mrem/year
6.34E-06 mrem/year .
D-7
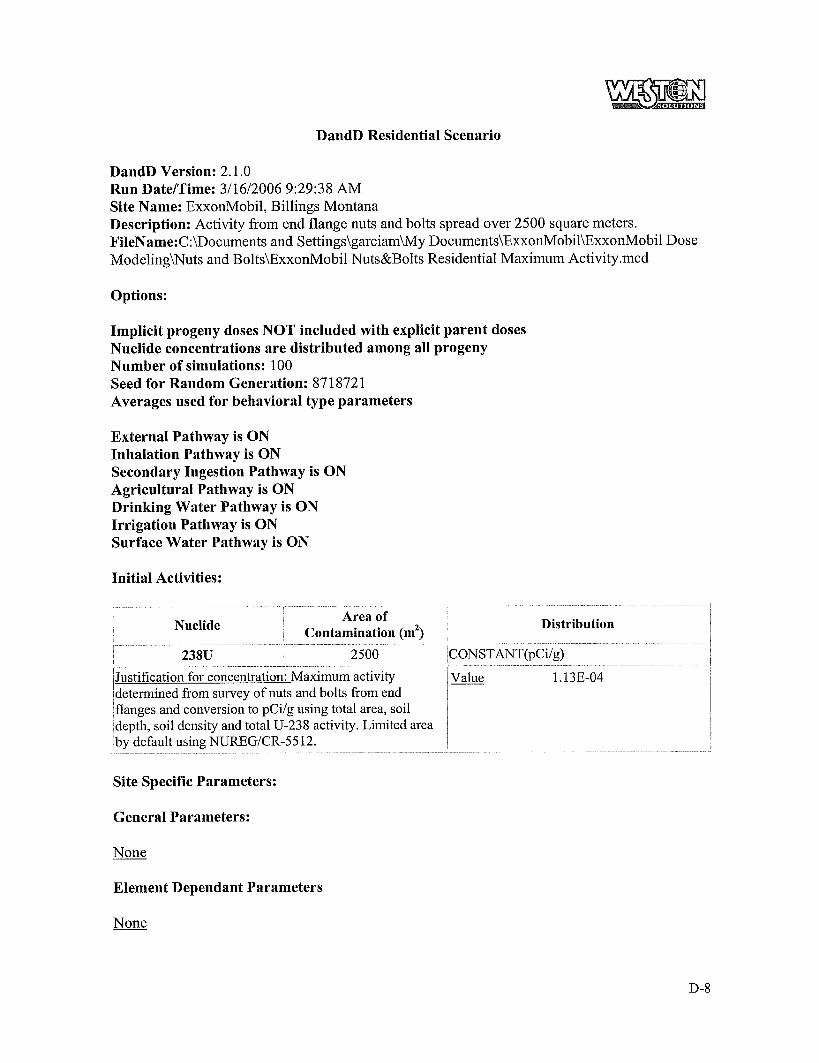
DandD Residential Scenario
DandD Version: 2.1 .O Run Date/Time: 3/16/2006 9:29:38 AM Site Name: ExxonMobil, Billings Montana Description: Activity from end flange nuts and bolts spread over 2500 square meters. FileName:C:\Documents and Settings\garciam\My Documents\ExxonMobil\ExxonMobil Dose ModelingWuts and Bolts\ExxonMobil Nuts&Bolts Residential Maximum Activity.mcd
Options:
Implicit progeny doses NOT included with explicit parent doses Nuclide concentrations are distributed among all progeny Number of simulations: 100 Seed for Random Generation: 87 1872 1 Averages used for behavioral type parameters
External Pathway is ON Inhalation Pathway is ON Secondary Ingestion Pathway is O N Agricultural Pathway is ON Drinking Water Pathway is ON Irrigation Pathway is ON Surface Water Pathway is ON
Initial Activities:
Nuclide Area of I
1 Contamination (mZ) ~
Distribution I
238U I I 2500 ~ CONSTANT(pCi/g) -
~
I
iJustification for concentration: Maximum activity I Value 1.13E-04 1 [determined from survey of nuts and bolts from end , I flanges and conversion to pCi/g using total area, soil ldepth, soil density and total U-238 activity. Limited area '
1 /by default using NUREG/CR-55 12. ~
Site Specific Parameters:
General Parameters:
None
Element Dependant Parameters
None
D-8
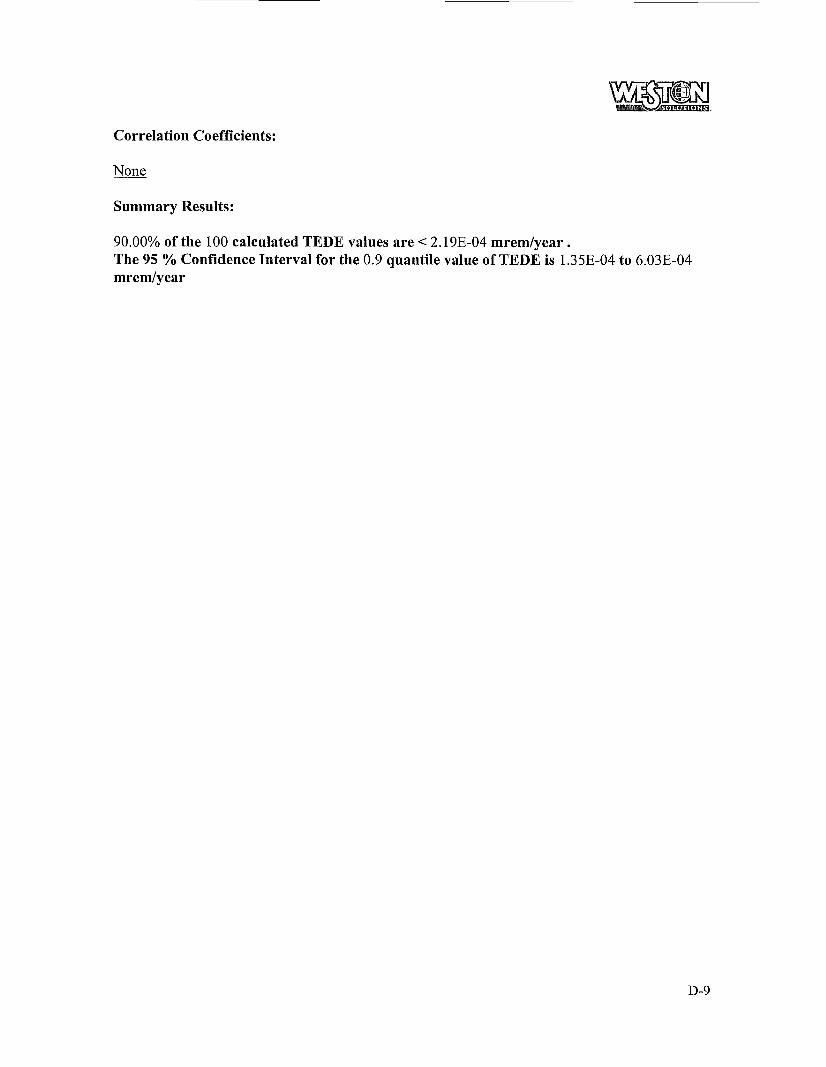
Correlation Coefficients:
None
Summary Results:
90.00% of the 100 calculated TEDE values are < 2.19E-04 mremjyear . The 95 % Confidence Interval for the 0.9 quantile value of TEDE is 1.35E-04 to 6.03E-04 mrem/year
D-9
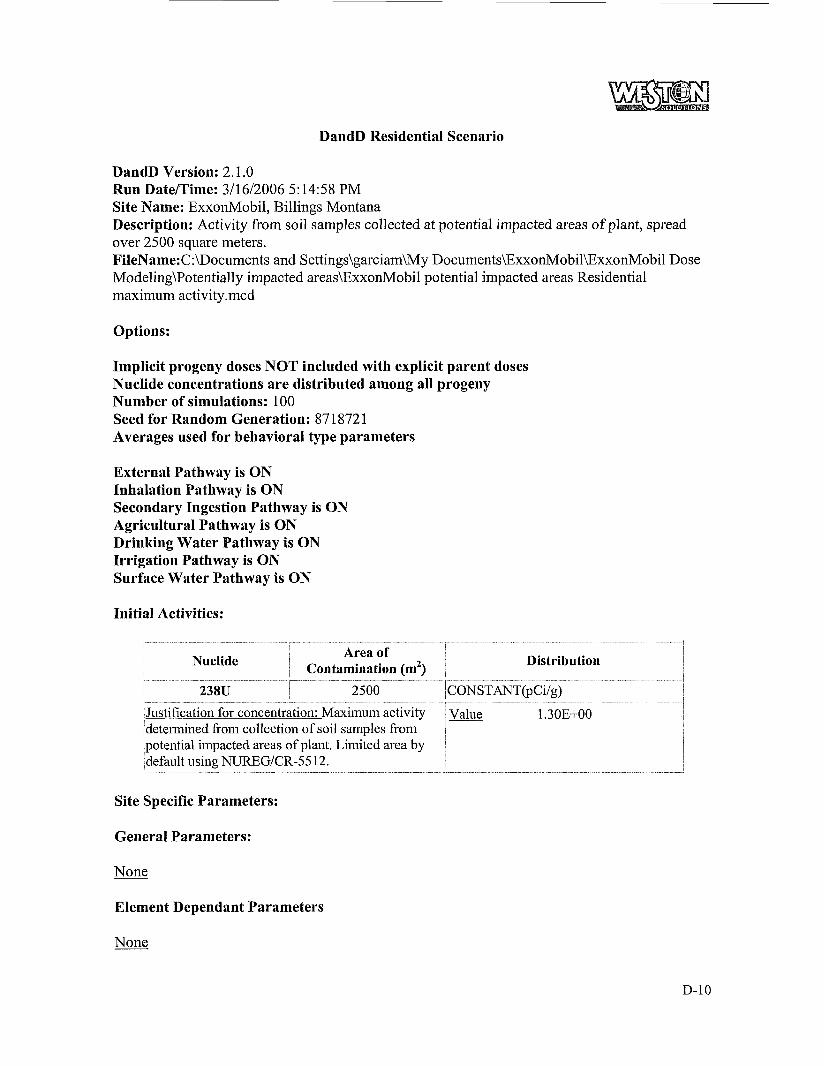
DandD Residential Scenario
DandD Version: 2.1 .O Run Date/Time: 3/16/2006 5:14:58 PM Site Name: ExxonMobil, Billings Montana Description: Activity from soil samples collected at potential impacted areas of plant, spread over 2500 square meters. FileName: C:\Documents and Settings\garciam\My Documents\ExxonMobil\ExxonMobil Dose Modeling\Potentially impacted areas\ExxonMobil potential impacted areas Residential maximum activity.mcd
Options:
Implicit progeny doses NOT included with explicit parent doses Nuclide concentrations are distributed among all progeny Number of simulations: 100 Seed for Random Generation: 87 1872 1 Averages used for behavioral type parameters
External Pathway is ON Inhalation Pathway is ON Secondary Ingestion Pathway is ON Agricultural Pathway is ON Drinking Water Pathway is ON Irrigation Pathway is ON Surface Water Pathway is ON
Initial Activities:
j Nuclide I
Area of i j Contamination (m2> j Distribution
I 238U I I 2500 /CONSTANT@Ci/g)
1.30Et-00 I lJustification for concentration: Maximum activity determined from collection of soil samples from
,default using NUREG/CR-55 12.
1 Value
i ,potential impacted areas of plant. Limited area by I
Site Specific Parameters:
General Parameters:
None
Element Dependant Parameters
None
D-10
Correlation Coefficients:
None
Summary Results:
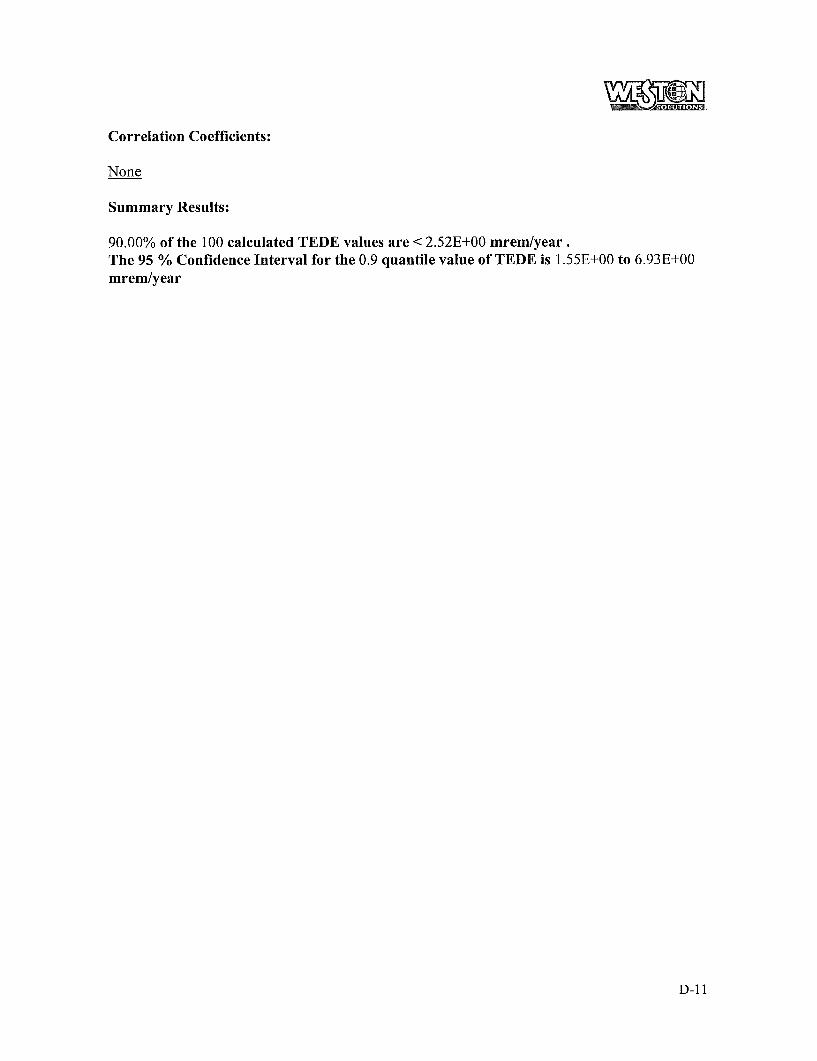
90.00% of the 100 calculated TEDE values are The 95 % Confidence Interval for the 0.9 quantile value of TEDE is 1.55E+00 to 6.93E+00 mrem/year
2.52E+00 mrem/year .
D-11
APPENDIX E IMUM DETECTABLE CONCENTRATION (MDC) CALCULATIONS
APPENDIX E
Activity Radionuclide fraction ei U-238 0.8751 0.1 Th-234 0.8751 0.125 Pa-234m 0.8751 0.6
U-235 1 .I 3E-02 0.1 U-234 1.14E-01 0.1
Th-231 1 .I 3E-02 0.225
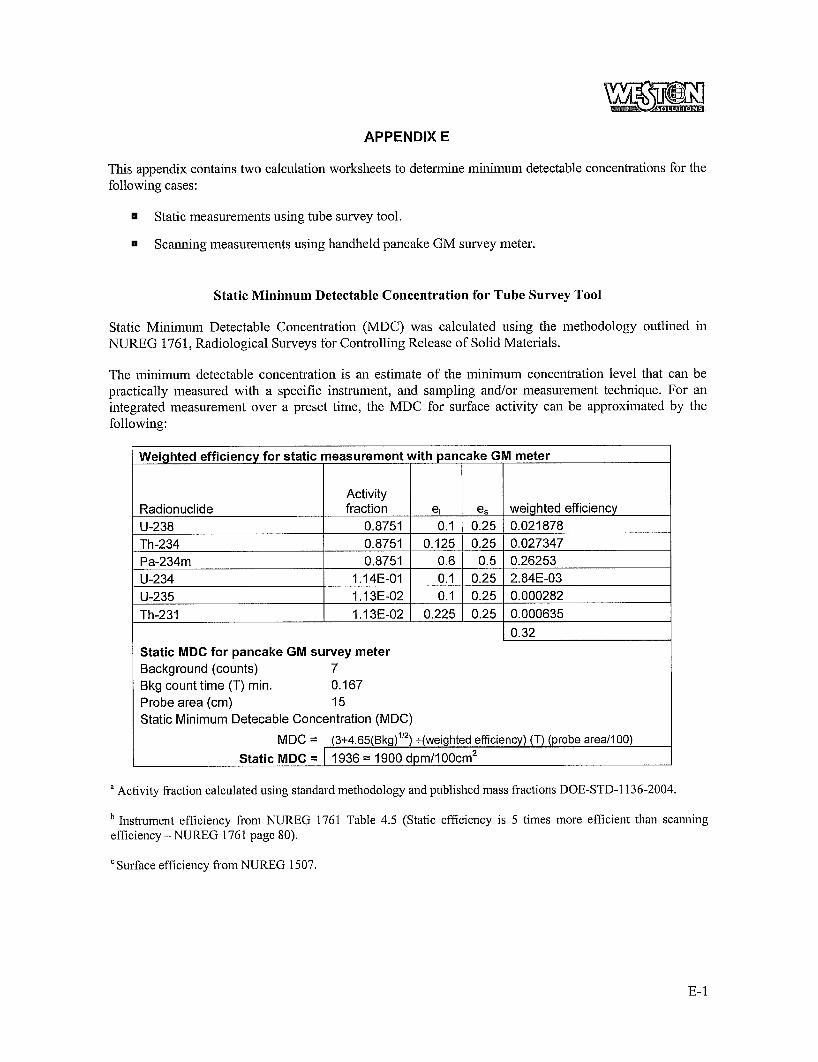
This appendix contains two calculation worksheets to determine minimum detectable concentrations for the following cases:
e, weighted efficiency 0.25 0.021878 0.25 0.027347 0.5 0.26253
0.25 0.000282 0.25 2.84E-03
0.25 0.000635
Static measurements using tube survey tool.
Scanning measurements using handheld pancake GM survey meter.
Static Minimum Detectable Concentration for Tube Survey Tool
Static Minimum Detectable Concentration (MDC) was calculated using the methodology outlined in NUREG 1761, Radiological Surveys for Controlling Release of Solid Mateiials.
The miiiimum detectable concentration is an estimate of the minimum concentration level that can be practically measured with a specific instrument, and sampling andor measurement technique. For an integrated measurement over a preset time, the MDC for surface activity can be approximated by the following:
Static MDC for pancake GM survey meter
Bkg count time (T) min. Probe area (cm) 15 Static Minimum Detecable Concentration (MDC)
Background (counts) 7 0.167
MDC = (3+4,65(Bkg)”’) +(weighted efficiency) (T) (probe areal1 00) Static MDC = I 1936 = 1900 dpm/l 00cm’
a Activity fraction calculated using standard methodology and published mass fractions DOE-STD-1136-2004.
Instrument efficiency from NUREG 1761 Table 4.5 (Static efficiency is 5 times more efficient than scanning efficiency - NUREG 176 1 page 80).
Surface efficiency from NUREG 1507.
E- 1
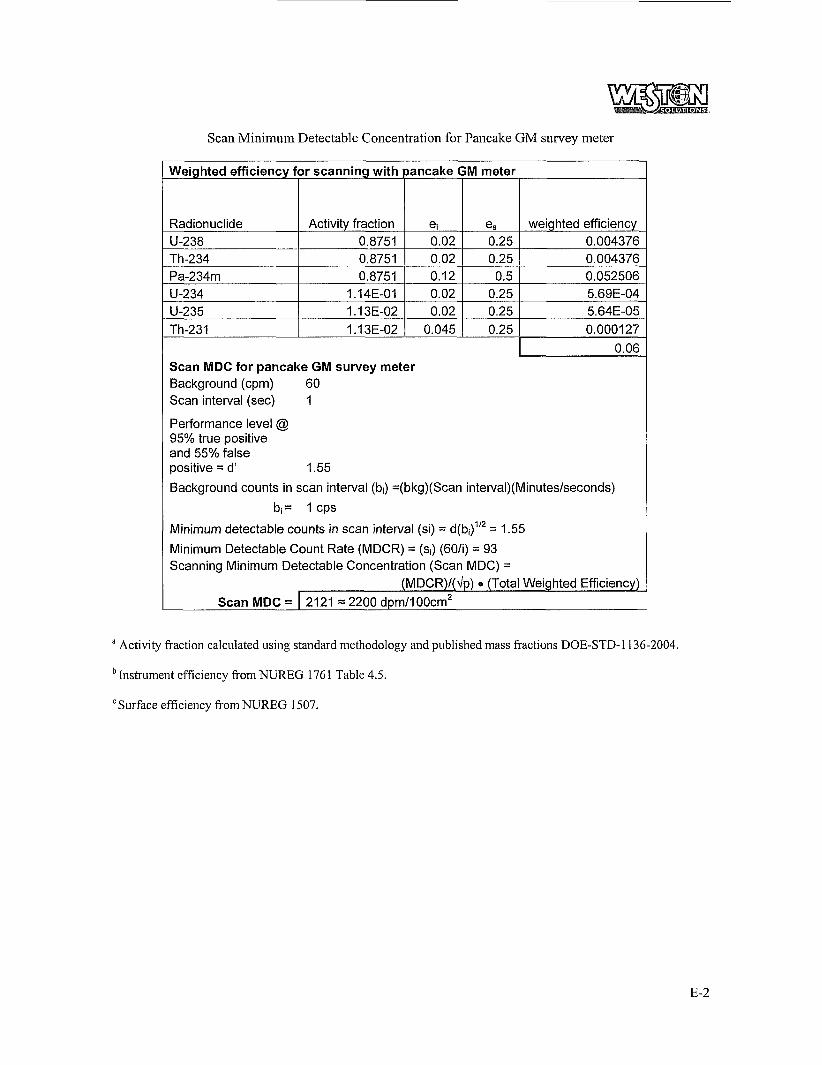
Scan Minimum Detectable Concentration for Pancake GM survey meter
Weighted efficiency for scanning with
Radionuclide Activity fraction U-238 0.8751 Th-234 0.8751 Pa-234m 0.8751 U-234 1.14E-01 U-235 1.13E-02 Th-231 1 .I 3E-02
pancake GM meter
ei e, weighted efficiency 0.02 0.25 0.004376 0.02 0.25 0.004376 0.12 0.5 0.052506 0.02 0.25 5.69E-04 0.02 0.25 5.64E-05
0.045 0.25 0.000127
a Activity fraction calculated using standard methodology and published mass fractions DOE-STD-1136-2004.
Instrument efficiency from NUREG 1761 Table 4.5.
'Surface efficiency from NUREG 1507.
E-2
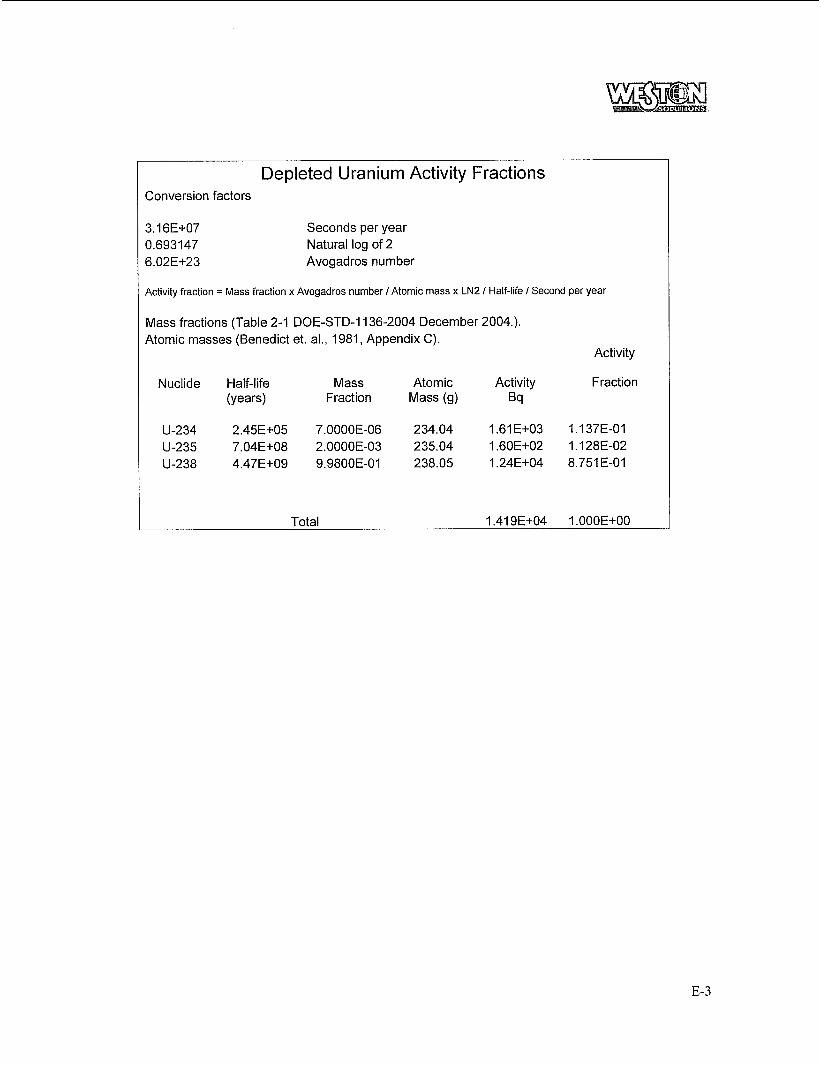
Depleted Uranium Activity Fractions Conversion factors
3.16E+07 Seconds per year 0.693 147 6.02E+23 Avogadros number
Activity fraction = Mass fraction x Avogadros number I Atomic mass x LN2 I Half-life I Second per year
Mass fractions (Table 2-1 DOE-STD-1136-2004 December 2004.). Atomic masses (Benedict et. al., 1981, Appendix C).
Natural log of 2
Activit:
Nuclide Half-life Mass Atomic Activity Fraction (years) Fraction Mass (9) Bq
U-234 2.45E+05 7.0000E-06 234.04 1.61 E+03 1 .I 37E-01 U-235 7.04E+08 2.0000E-03 235.04 1.60E+02 1 . I 28E-02 U-238 4.47E+09 9.9800E-01 238.05 1.24E+04 8.751 E-01
Total 1.41 9E+04 l.OOOE+OO
E-3


![Identity-based Hierarchical Key-insulated Encryption ... · (HIBE) [18], only applying techniques used in the HIBE context is ffit for constructing secure (in particular, strongly](https://img.pdfslide.us/doc/110x75/6033a567993a845c3e2b777a/identity-based-hierarchical-key-insulated-encryption-hibe-18-only-applying.jpg)