Embed Size (px)
Citation preview
PNNL-SA-103898
Rooftop Unit AFDD: Smart Monitoring and Diagnostic System and Proactive Diagnostics
Srinivas Katipamula, Ph.D.
Workshop on FDD for RTUs – Moving from R&D to Commercialization, July 13, 2014, West Lafayette, IN
1
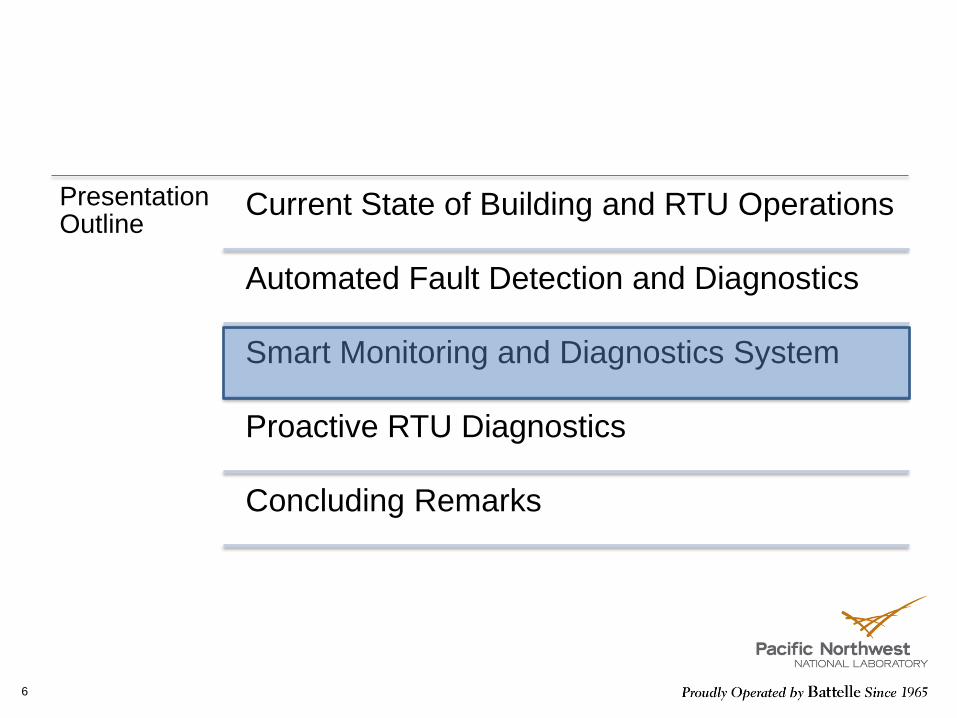
Presentation Outline
Current State of Building and RTU Operations
Automated Fault Detection and Diagnostics
Smart Monitoring and Diagnostics System
Proactive RTU Diagnostics
Concluding Remarks
2
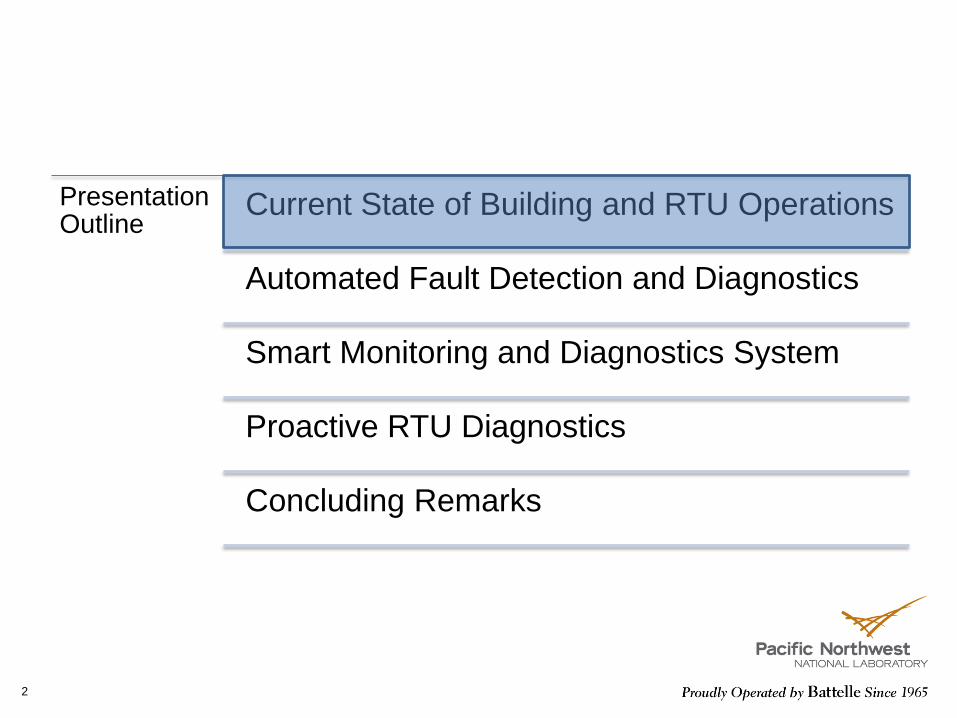
Current State of Building Operations
3
Energy waste is caused
by
Lack of use of energy-savings control strategies
Override of automatic controls
Improper actions
Incorrect original installation
Lack of cost-effective controls
solutions for small
buildings
Poor operations
and maintenance
practices
Results in up to 30%
energy waste in buildings
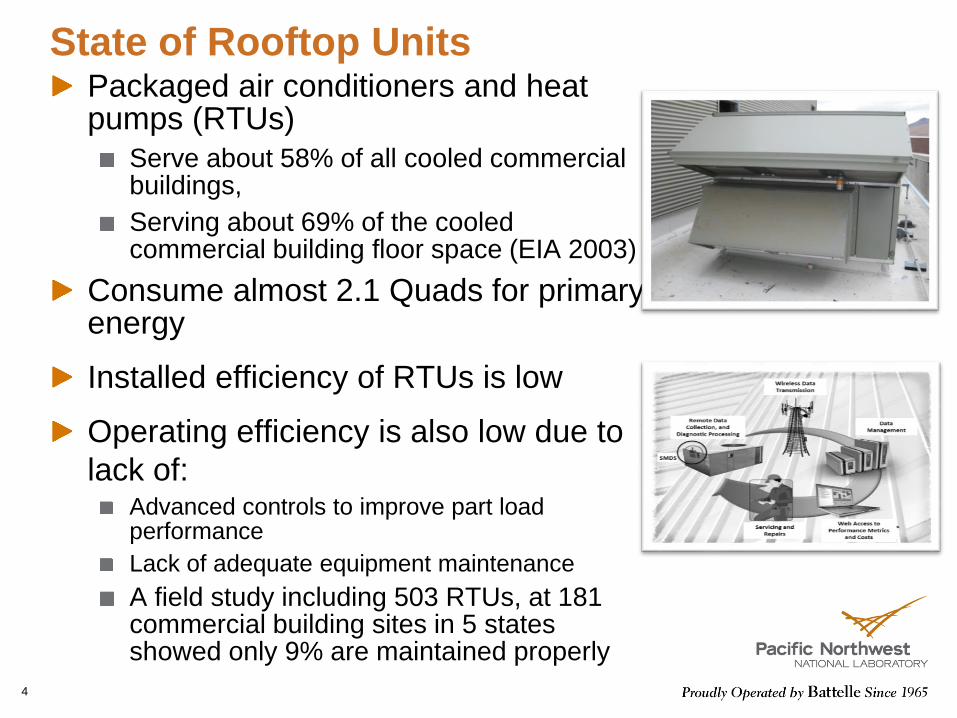
State of Rooftop UnitsPackaged air conditioners and heat pumps (RTUs)
Serve about 58% of all cooled commercial buildings,
Serving about 69% of the cooled commercial building floor space (EIA 2003)
Consume almost 2.1 Quads for primary energy
Installed efficiency of RTUs is low
Operating efficiency is also low due to
lack of:Advanced controls to improve part load performance
Lack of adequate equipment maintenance
A field study including 503 RTUs, at 181 commercial building sites in 5 states showed only 9% are maintained properly
4
Automated Fault Detection and Diagnostics
There is need for automated fault detection and diagnostics (AFDD) tool
Process to automatically detect, diagnose and evaluate the impact of the fault
Generate actionable information
Can be passive or proactive
Passive approaches work in most cases, but sometimes active approach will identify the fault quickly
Widespread use of AFDD can improve the efficiency of the building stock and support condition-based maintenance practices for RTUs
5
Presentation Outline
Current State of Building and RTU Operations
Automated Fault Detection and Diagnostics
Smart Monitoring and Diagnostics System
Proactive RTU Diagnostics
Concluding Remarks
6
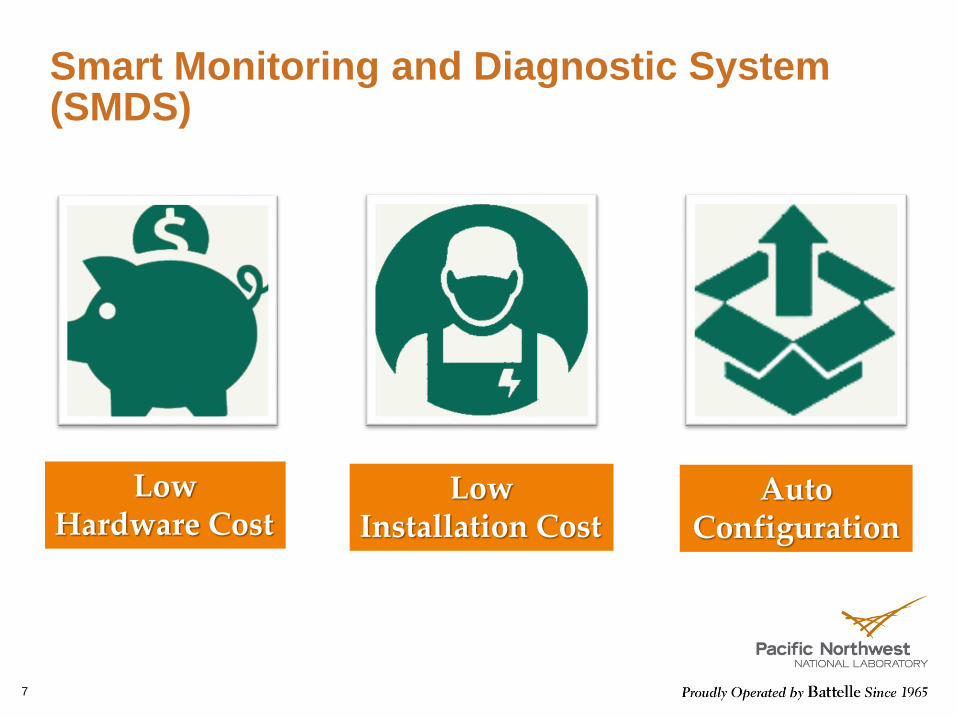
Smart Monitoring and Diagnostic System (SMDS)
7
LowHardware Cost
LowInstallation Cost
AutoConfiguration
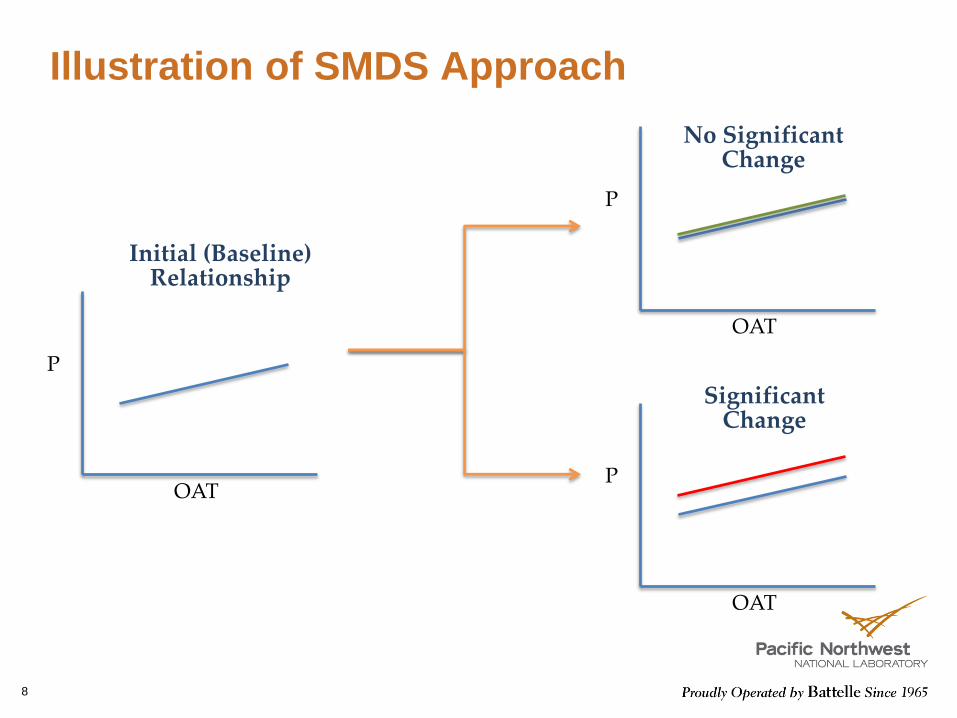
Illustration of SMDS Approach
8
P
OAT
Initial (Baseline)Relationship
P
OAT
No Significant Change
Significant Change
P
OAT
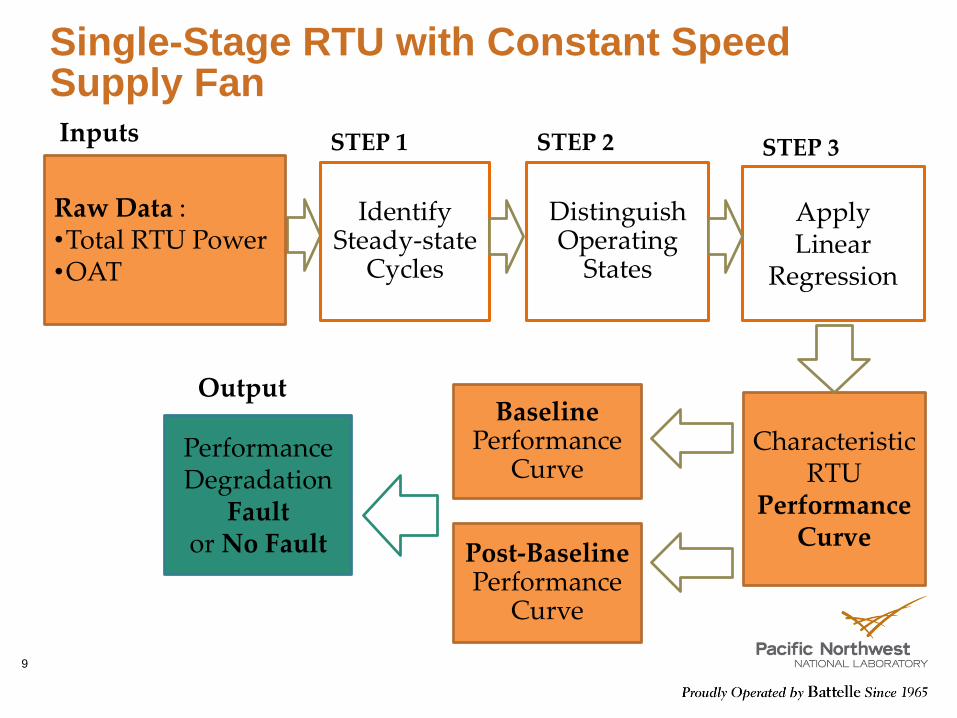
Single-Stage RTU with Constant Speed Supply Fan
9
Characteristic RTU
Performance Curve
BaselinePerformance
Curve
Post-BaselinePerformance
Curve
Performance Degradation
Fault or No Fault
Output
Identify Steady-state
Cycles
STEP 1
Distinguish Operating
States
STEP 2 STEP 3
Raw Data :•Total RTU Power•OAT
Inputs
ApplyLinear
Regression
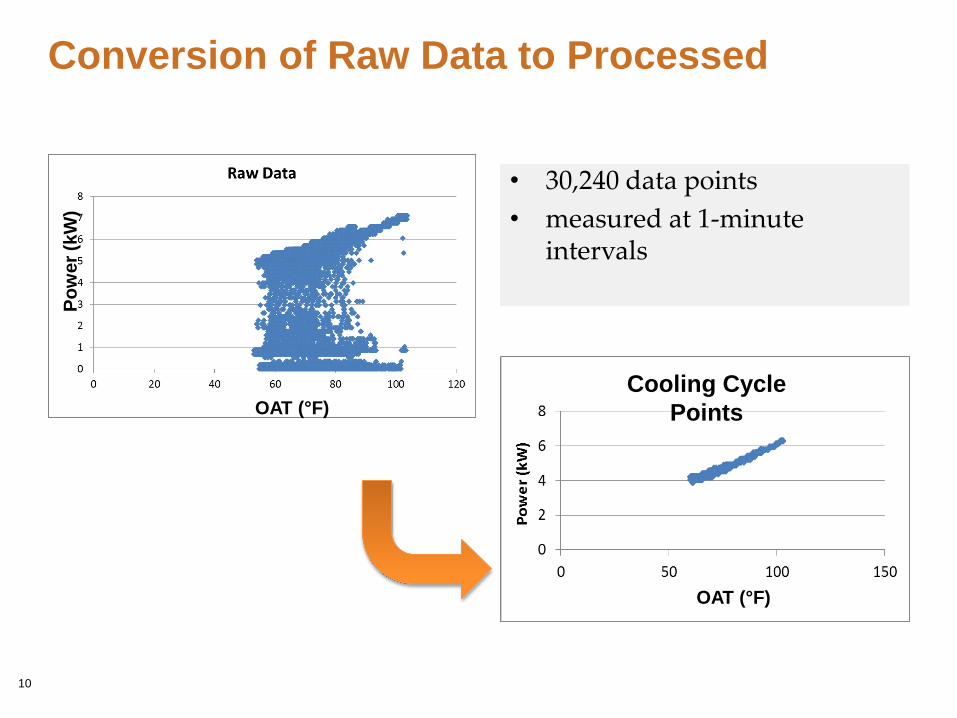
Conversion of Raw Data to Processed
10
• 30,240 data points
• measured at 1-minute intervals
Po
wer
(kW
)
OAT (°F)
Cooling Cycle
Points
OAT (°F)
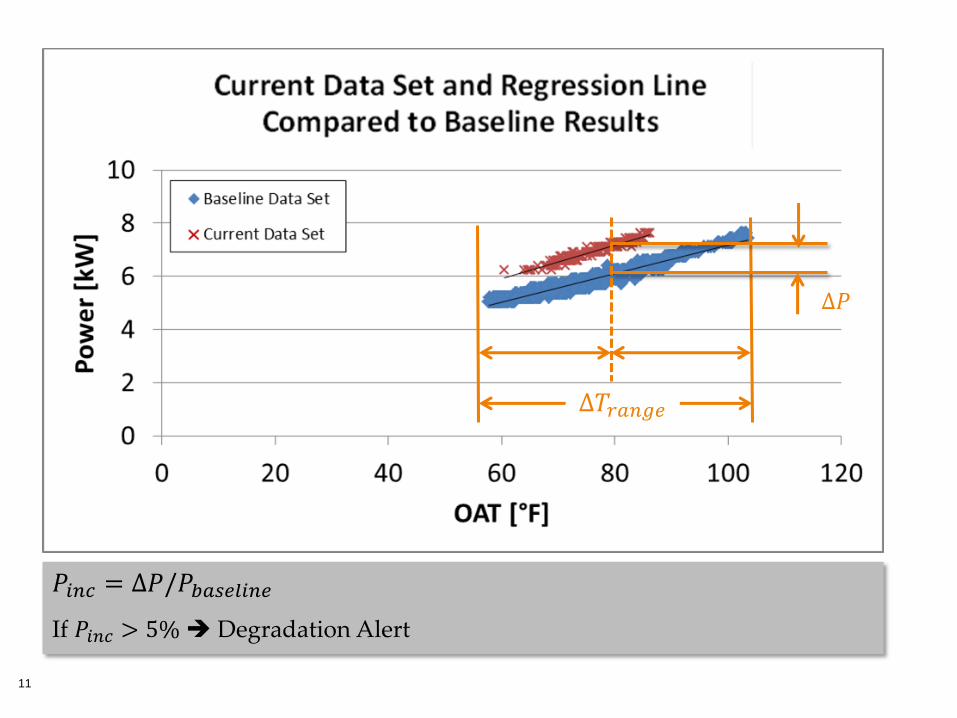
Determine Magnitude of
Change
11
∆𝑇𝑟𝑎𝑛𝑔𝑒
∆𝑃
𝑃𝑖𝑛𝑐 = ∆𝑃/𝑃𝑏𝑎𝑠𝑒𝑙𝑖𝑛𝑒
If 𝑃𝑖𝑛𝑐 > 5% Degradation Alert
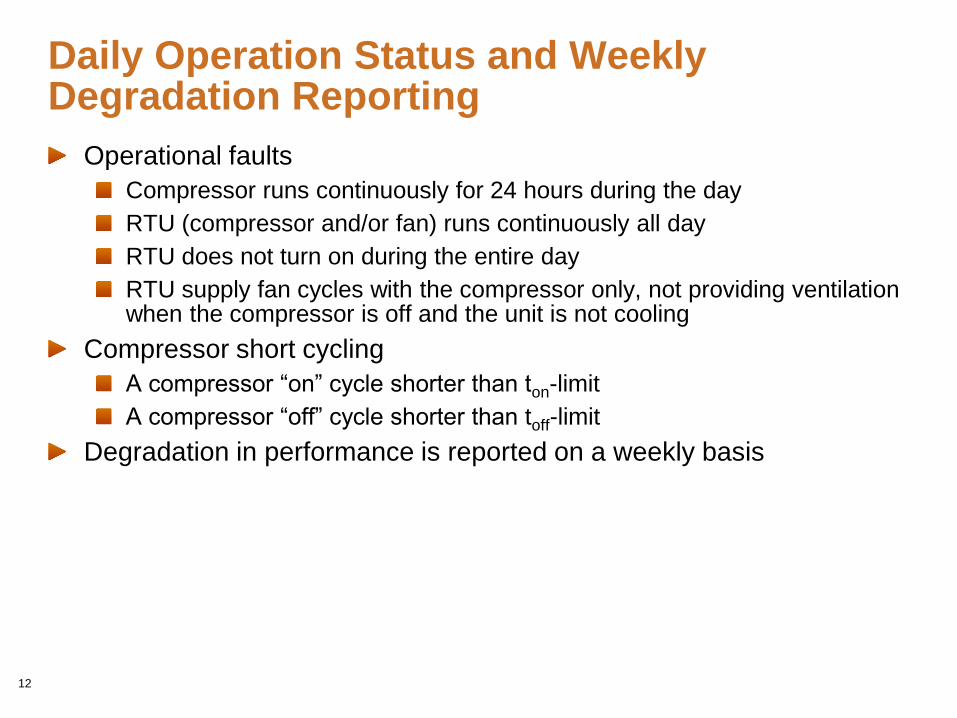
Daily Operation Status and Weekly Degradation Reporting
Operational faults
Compressor runs continuously for 24 hours during the day
RTU (compressor and/or fan) runs continuously all day
RTU does not turn on during the entire day
RTU supply fan cycles with the compressor only, not providing ventilation when the compressor is off and the unit is not cooling
Compressor short cycling
A compressor “on” cycle shorter than ton-limit
A compressor “off” cycle shorter than toff-limit
Degradation in performance is reported on a weekly basis
12
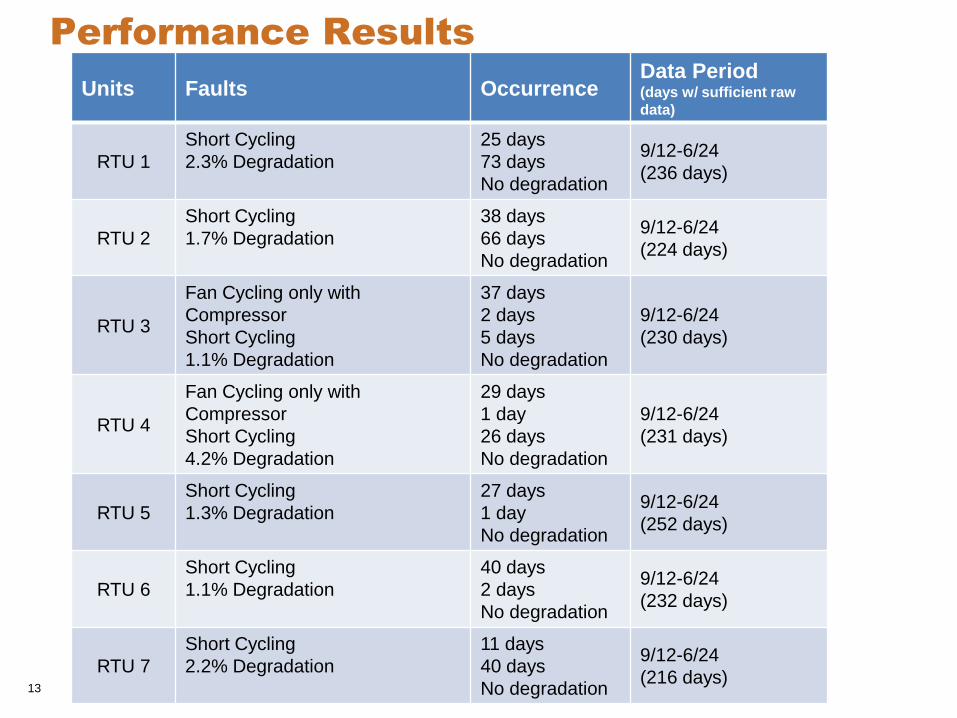
Performance Results
13
Units Faults OccurrenceData Period(days w/ sufficient raw
data)
RTU 1
Short Cycling
2.3% Degradation
25 days
73 days
No degradation
9/12-6/24
(236 days)
RTU 2
Short Cycling
1.7% Degradation
38 days
66 days
No degradation
9/12-6/24
(224 days)
RTU 3
Fan Cycling only with
Compressor
Short Cycling
1.1% Degradation
37 days
2 days
5 days
No degradation
9/12-6/24
(230 days)
RTU 4
Fan Cycling only with
Compressor
Short Cycling
4.2% Degradation
29 days
1 day
26 days
No degradation
9/12-6/24
(231 days)
RTU 5
Short Cycling
1.3% Degradation
27 days
1 day
No degradation
9/12-6/24
(252 days)
RTU 6
Short Cycling
1.1% Degradation
40 days
2 days
No degradation
9/12-6/24
(232 days)
RTU 7
Short Cycling
2.2% Degradation
11 days
40 days
No degradation
9/12-6/24
(216 days)13
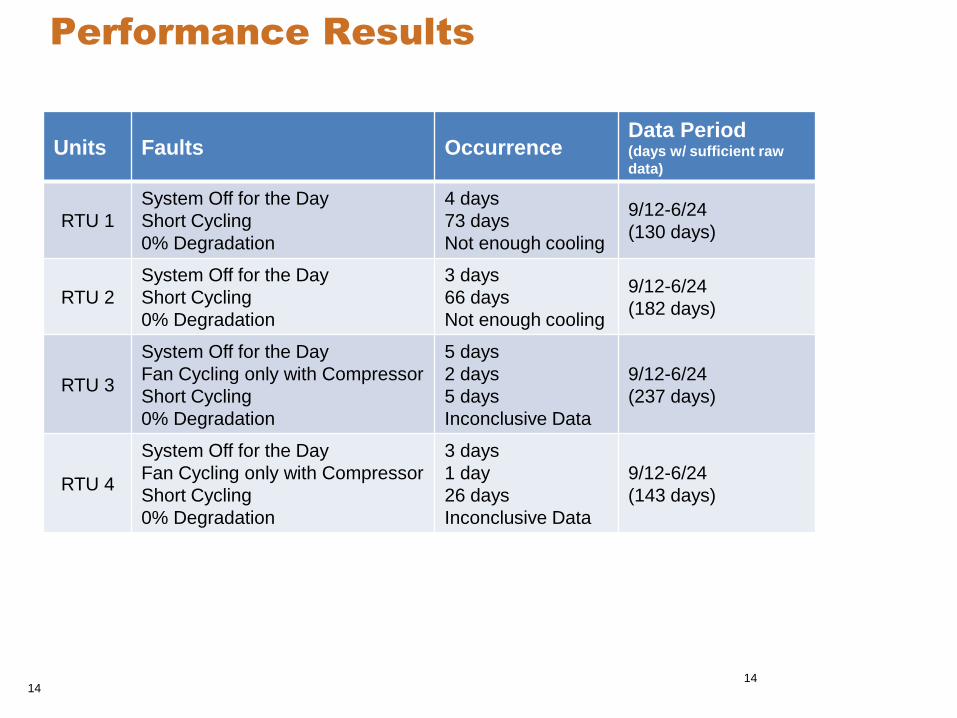
Performance Results
1414
Units Faults OccurrenceData Period(days w/ sufficient raw
data)
RTU 1
System Off for the Day
Short Cycling
0% Degradation
4 days
73 days
Not enough cooling
9/12-6/24
(130 days)
RTU 2
System Off for the Day
Short Cycling
0% Degradation
3 days
66 days
Not enough cooling
9/12-6/24
(182 days)
RTU 3
System Off for the Day
Fan Cycling only with Compressor
Short Cycling
0% Degradation
5 days
2 days
5 days
Inconclusive Data
9/12-6/24
(237 days)
RTU 4
System Off for the Day
Fan Cycling only with Compressor
Short Cycling
0% Degradation
3 days
1 day
26 days
Inconclusive Data
9/12-6/24
(143 days)
Presentation Outline
Current State of Building and RTU Operations
Automated Fault Detection and Diagnostics
Smart Monitoring and Diagnostics System
Proactive RTU Diagnostics
Concluding Remarks
15
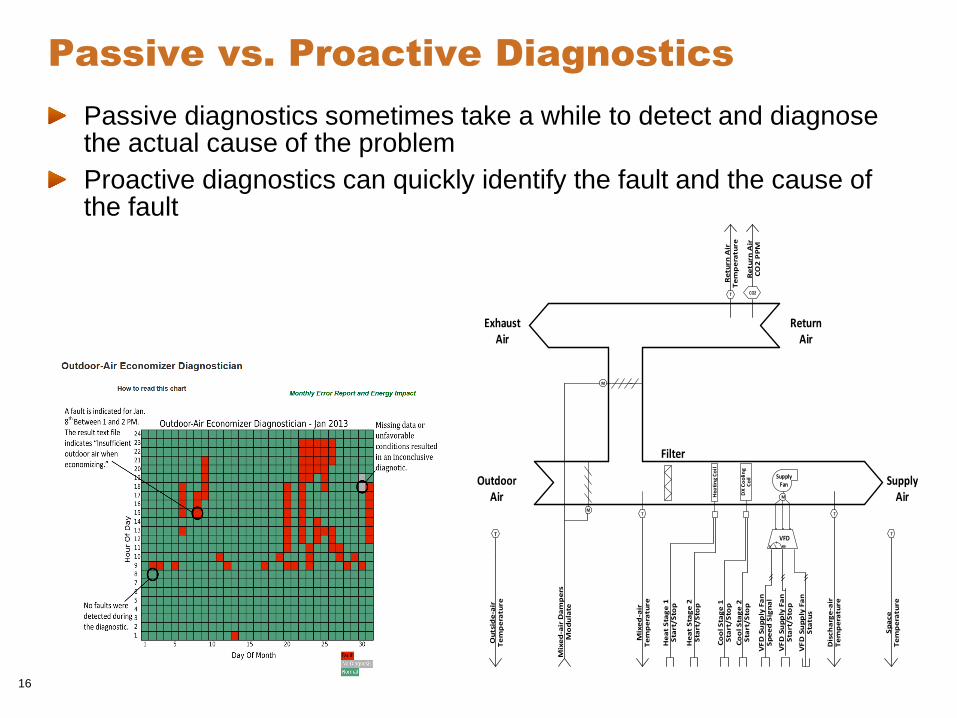
Passive vs. Proactive Diagnostics
Passive diagnostics sometimes take a while to detect and diagnose the actual cause of the problem
Proactive diagnostics can quickly identify the fault and the cause of the fault
16
He
at
Sta
ge
1S
tart
/S
top
He
at
Sta
ge
2S
tart
/S
top
Co
ol S
tag
e 1
Sta
rt/S
top
Co
ol S
tag
e 2
Sta
rt/S
top
Mix
ed
-air
Te
mp
era
ture
Mix
ed
-air
Da
mp
ers
M
od
ula
te
OutdoorAir
SupplyAir
ReturnAir
ExhaustAir
M
M
T
TT
Filter
SupplyFan
M
M
T
Sp
ace
Te
mp
era
ture
T
Ou
tsid
e-a
irT
em
pe
ratu
re
VFD
VF
D S
up
ply
Fa
n
Sta
rt/S
top
VF
D S
up
ply
Fa
nS
pe
ed
Sig
na
l
VF
D S
up
ply
Fa
nS
tatu
s
Dis
ch
arg
e-a
irT
em
pe
ratu
re
CO2
Re
turn
Air
Te
mp
era
ture
Re
turn
Air
CO
2 P
PM
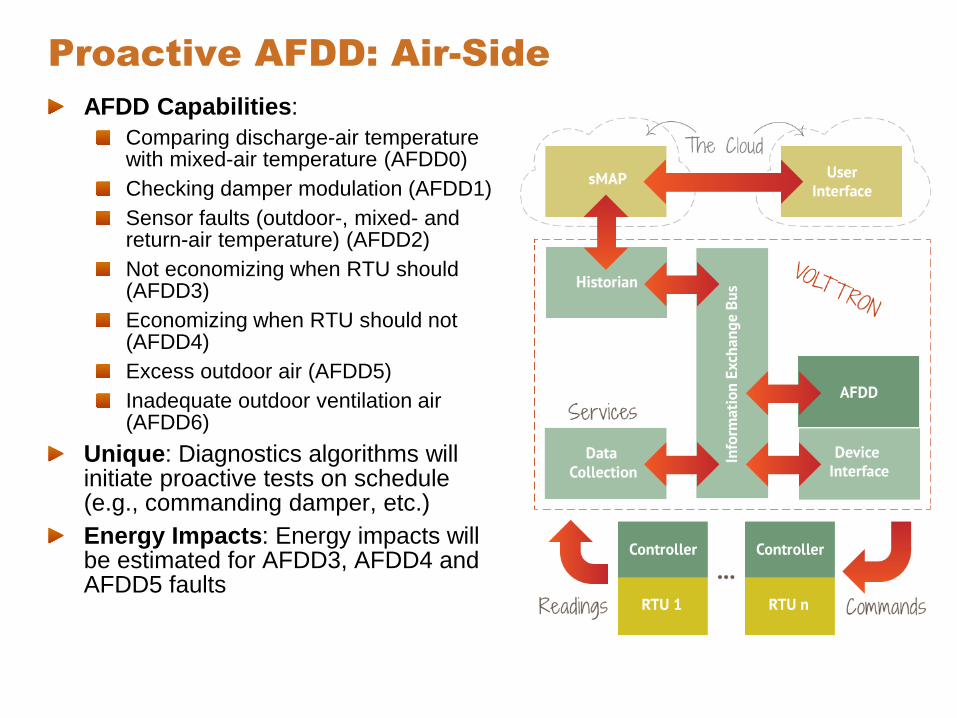
Proactive AFDD: Air-Side
AFDD Capabilities:
Comparing discharge-air temperature with mixed-air temperature (AFDD0)
Checking damper modulation (AFDD1)
Sensor faults (outdoor-, mixed- and return-air temperature) (AFDD2)
Not economizing when RTU should (AFDD3)
Economizing when RTU should not (AFDD4)
Excess outdoor air (AFDD5)
Inadequate outdoor ventilation air (AFDD6)
Unique: Diagnostics algorithms will initiate proactive tests on schedule (e.g., commanding damper, etc.)
Energy Impacts: Energy impacts will be estimated for AFDD3, AFDD4 and AFDD5 faults
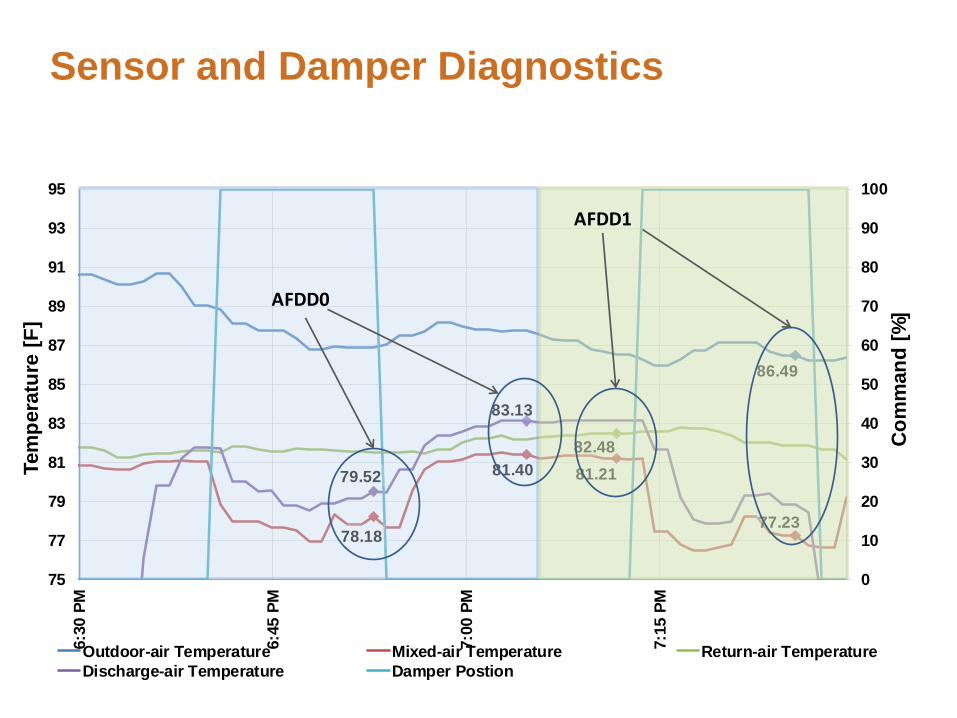
Sensor and Damper Diagnostics
86.49
77.23
81.2181.40
78.18
82.48
83.13
79.52
0
10
20
30
40
50
60
70
80
90
100
75
77
79
81
83
85
87
89
91
93
95
6:3
0 P
M
6:4
5 P
M
7:0
0 P
M
7:1
5 P
M
Co
mm
an
d [
%]
Tem
pera
ture
[F
]
Outdoor-air Temperature Mixed-air Temperature Return-air Temperature
Discharge-air Temperature Damper Postion
AFDD0
AFDD1
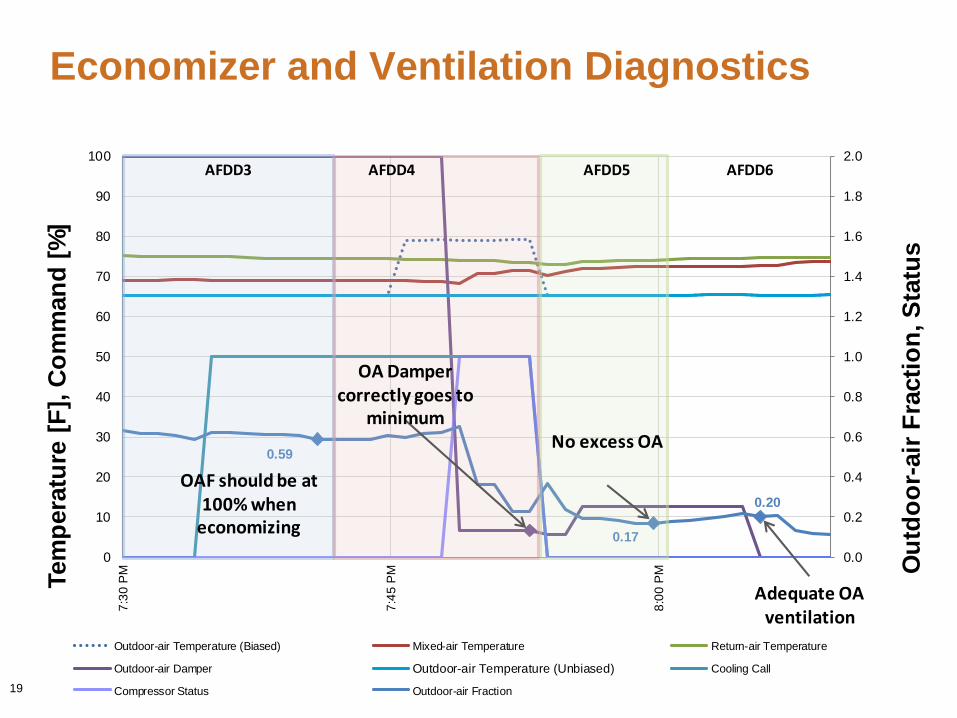
Economizer and Ventilation Diagnostics
19
0.20
0.17
0.59
0.0
0.2
0.4
0.6
0.8
1.0
1.2
1.4
1.6
1.8
2.0
0
10
20
30
40
50
60
70
80
90
100
7:3
0 P
M
7:4
5 P
M
8:0
0 P
M Ou
tdo
or-
air
Fra
cti
on
, S
tatu
s
Tem
pera
ture
[F
], C
om
man
d [
%]
Outdoor-air Temperature (Biased) Mixed-air Temperature Return-air Temperature
Outdoor-air Damper Outdoor-air Temperature (Unbiased) Cooling Call
Compressor Status Outdoor-air Fraction
Adequate OA ventilation
OAF should be at 100% when
economizing
OA Dampercorrectly goes to
minimum No excess OA
AFDD3 AFDD4 AFDD5 AFDD6
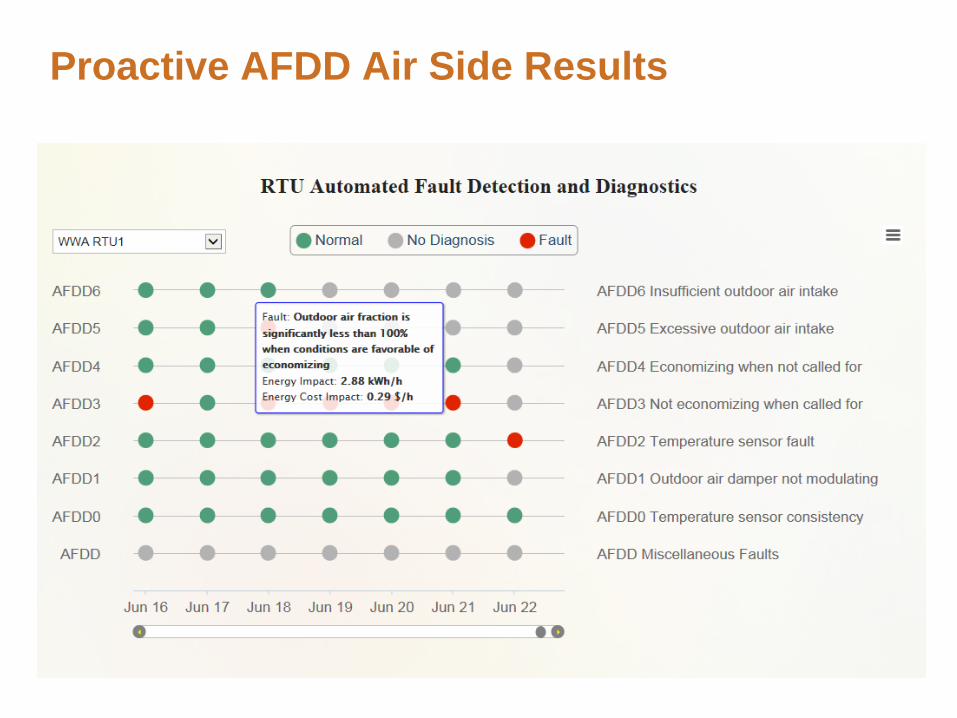
Proactive AFDD Air Side Results
Presentation Outline
Current State of Building and RTU Operations
Automated Fault Detection and Diagnostics
Smart Monitoring and Diagnostics System
Proactive RTU Diagnostics
Concluding Remarks
21
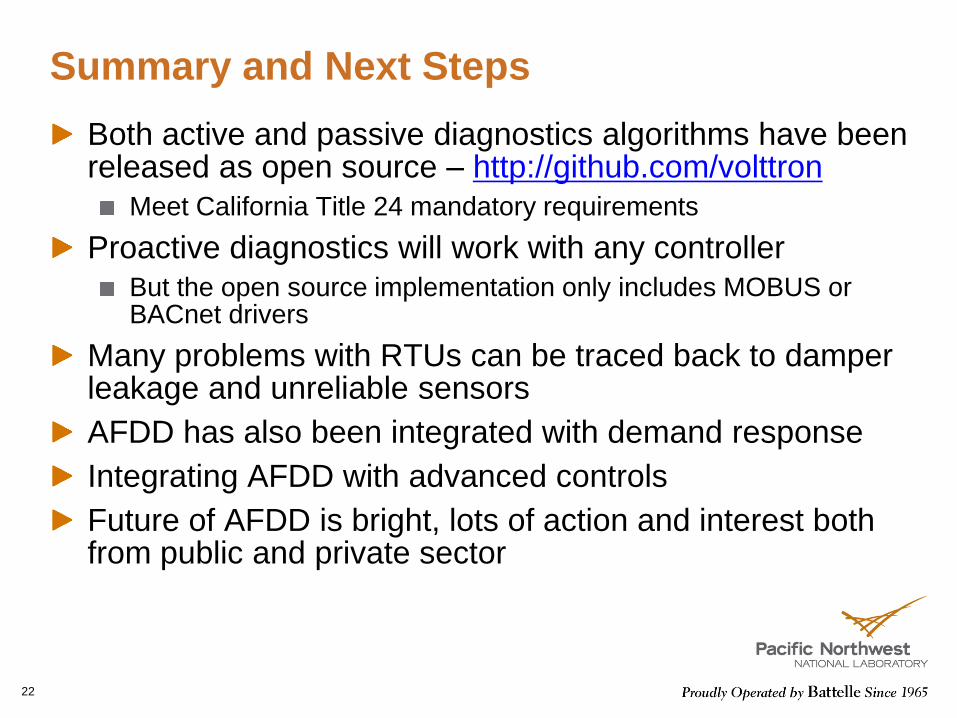
Summary and Next Steps
Both active and passive diagnostics algorithms have been released as open source – http://github.com/volttron
Meet California Title 24 mandatory requirements
Proactive diagnostics will work with any controller
But the open source implementation only includes MOBUS or BACnet drivers
Many problems with RTUs can be traced back to damper leakage and unreliable sensors
AFDD has also been integrated with demand response
Integrating AFDD with advanced controls
Future of AFDD is bright, lots of action and interest both from public and private sector
22
SMDS -http://buildingsystems.pnnl.gov/building/smds.stmProactive Diagnostics -http://buildingsystems.pnnl.gov/building/afdd.stmAutomated RTU DR -http://buildingsystems.pnnl.gov/building/adr.stmVOLTTRON - https://transactionalnetwork.org/
http://github.com/volttron
23