Embed Size (px)
Citation preview

1
Pneumonia prevention using topical antibiotics in the Intensive Care
Unit (ICU). Another variation on control group variability.
…..or…..
Confidence ellipses: an application of ellip to model the relation
between control group rate and intervention effect size within
controlled trials.
James C Hurley1
1Melbourne Medical School,
University of Melbourne
2015 Australia and New Zealand
Stata Users Group meeting
Canberra
2
Meta-analysis
Definition
• the application of statistical techniques
• to the analysis of multiple studies
• to derive summary results
• and to contrast results
i.e. beyond the summary result
• why are the studies so different?
• Control group rate?
3
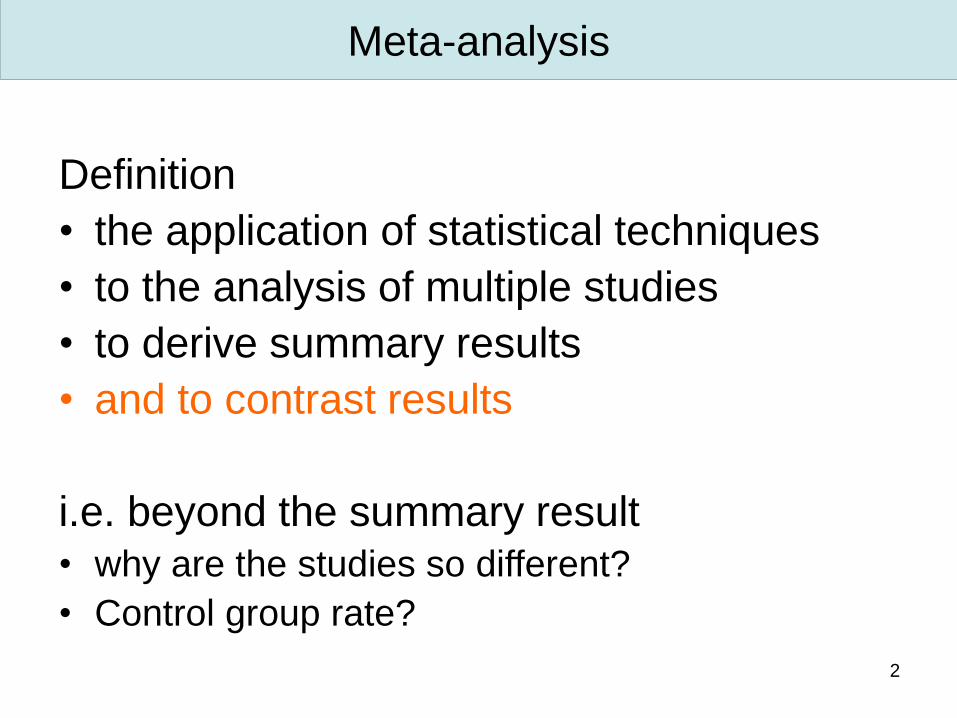
This talk
Conflicting results among studies of-
1. Diagnostic test • Endotoxin detection
• 90 studies
2. Controlled trials• Pneumonia prevention in ICU
• >200 studies
4
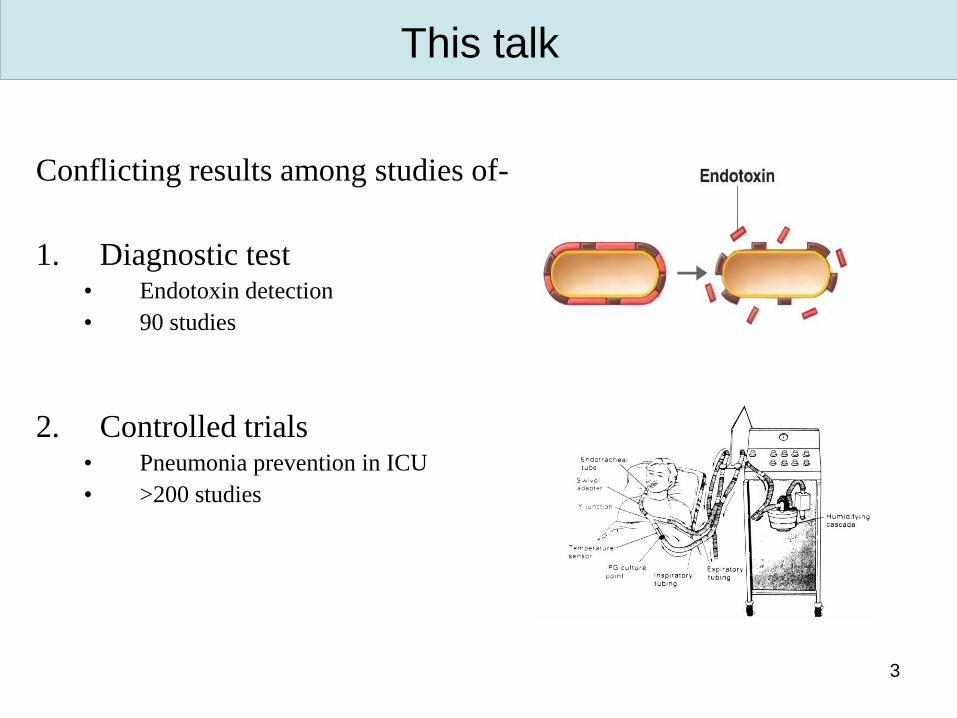
Control group rate…..?
Analytic considerations
• Choice of– Effect size
• RR / OR / RD?
– Scale• Linear / other
• Effect size versus control group rate (confounded relationship)
• Low or zero event rate issues
• Linear regression?
• Ecological fallacy
Interest
• Higher risk = Greater benefit?
• Lower risk = adverse effects (“J curve”)?
• Contextual effects?
0
.2
.4
.6
.8
1
inte
rvention g
roup r
ate
0.2.4.6.81
control group rate
study OR
y=x RR
RD
5
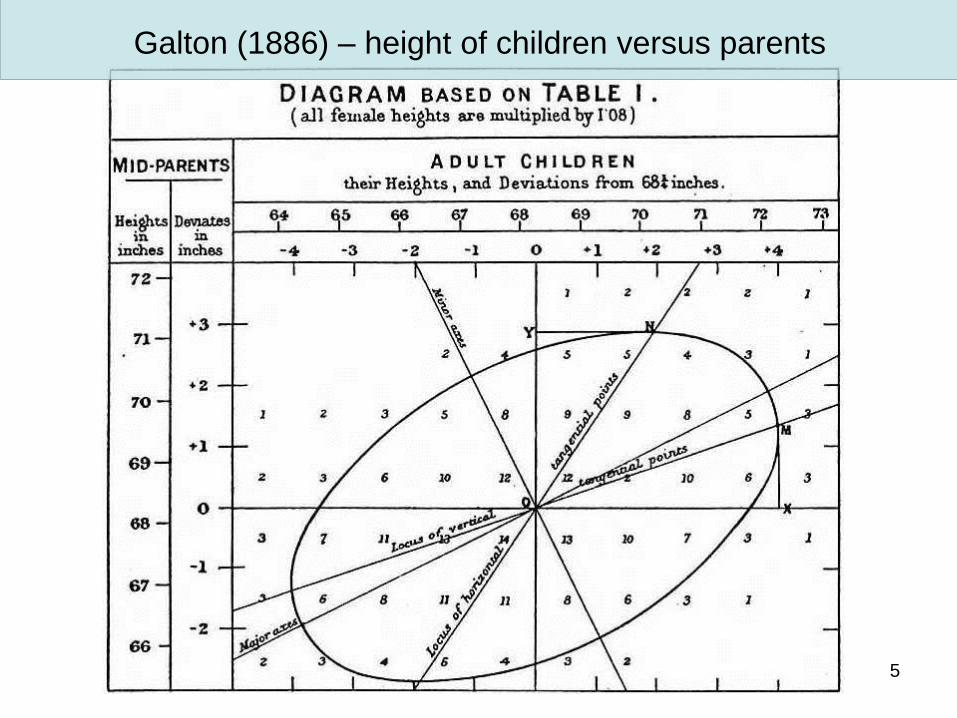
Galton (1886) – height of children versus parents
6
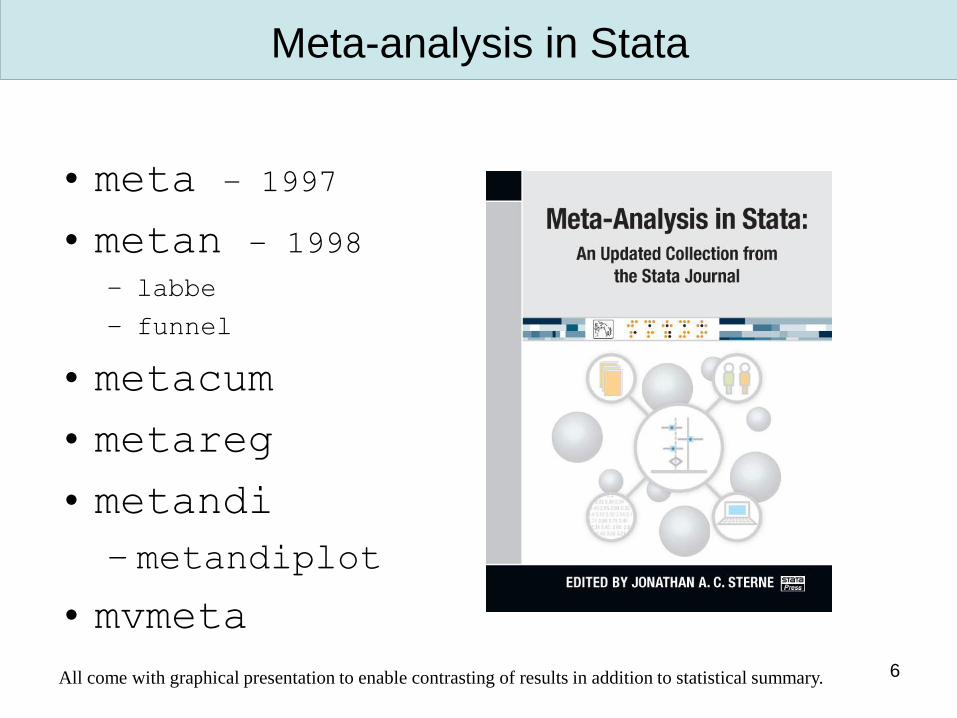
Meta-analysis in Stata
• meta – 1997
• metan – 1998
– labbe
– funnel
• metacum
• metareg
• metandi
– metandiplot
• mvmeta
All come with graphical presentation to enable contrasting of results in addition to statistical summary.
7
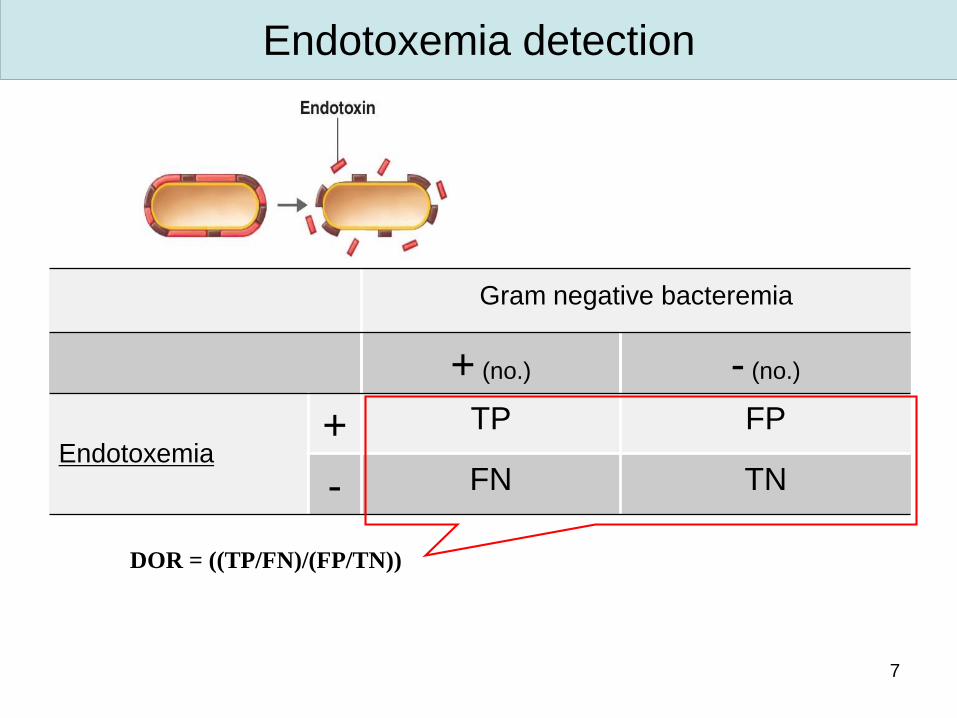
Gram negative bacteremia
+ (no.) - (no.)
Endotoxemia+ TP FP
- FN TN
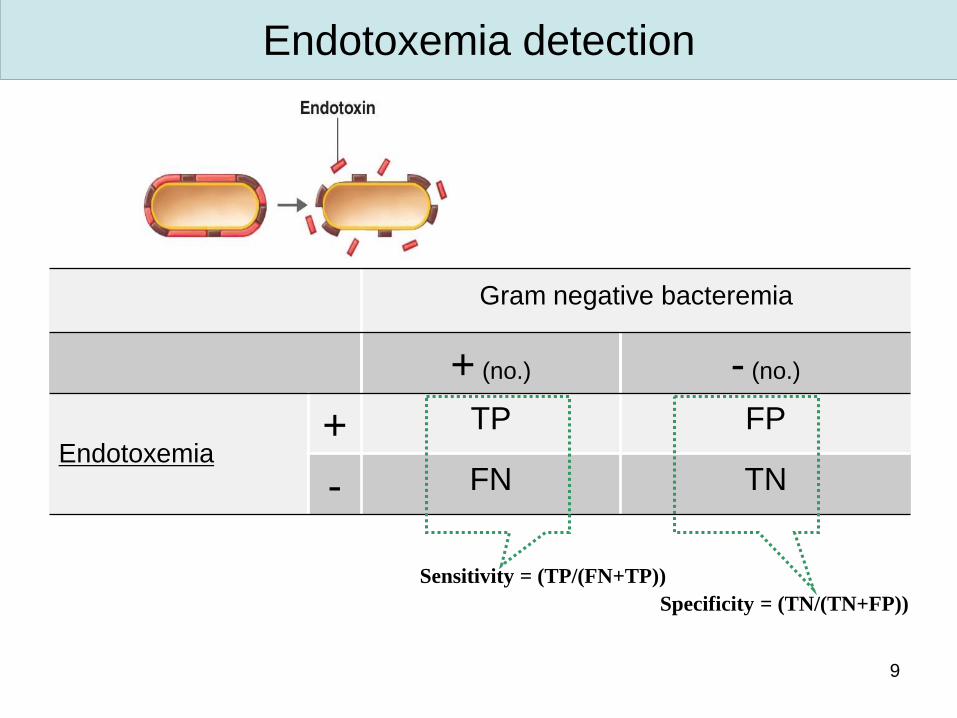
Endotoxemia detection
DOR = ((TP/FN)/(FP/TN))
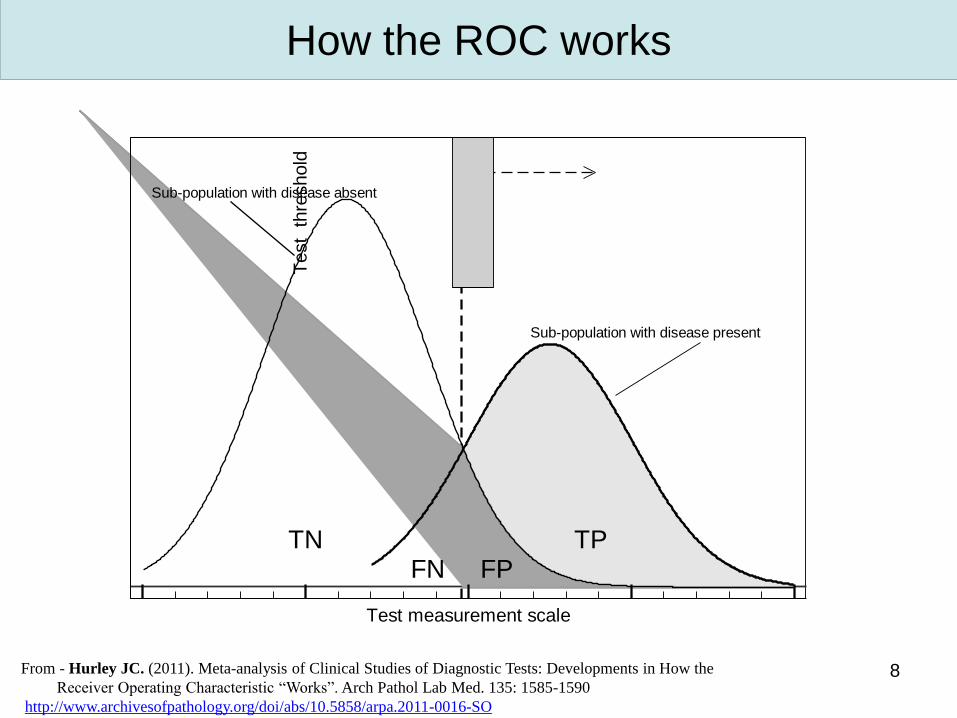
8
TNFN FP
TP
Sub-population with disease absent
Sub-population with disease present
num
ber
of
test
results
Test measurement scale
Test
thre
shold
From - Hurley JC. (2011). Meta-analysis of Clinical Studies of Diagnostic Tests: Developments in How the
Receiver Operating Characteristic “Works”. Arch Pathol Lab Med. 135: 1585-1590
http://www.archivesofpathology.org/doi/abs/10.5858/arpa.2011-0016-SO
How the ROC works
9
Gram negative bacteremia
+ (no.) - (no.)
Endotoxemia+ TP FP
- FN TN
Endotoxemia detection
Sensitivity = (TP/(FN+TP))
Specificity = (TN/(TN+FP))
10
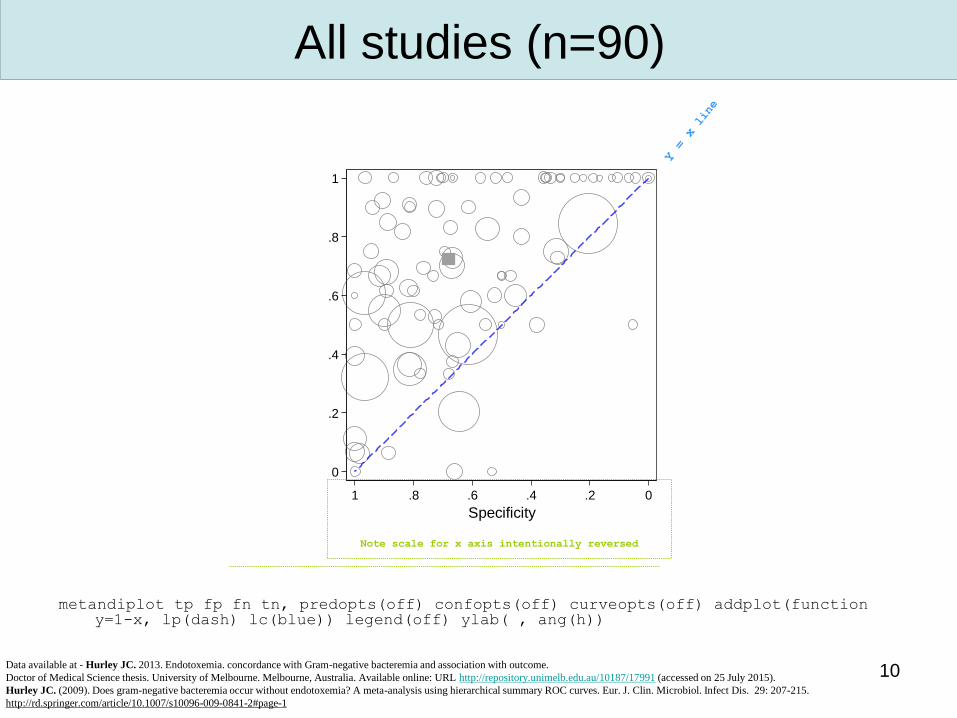
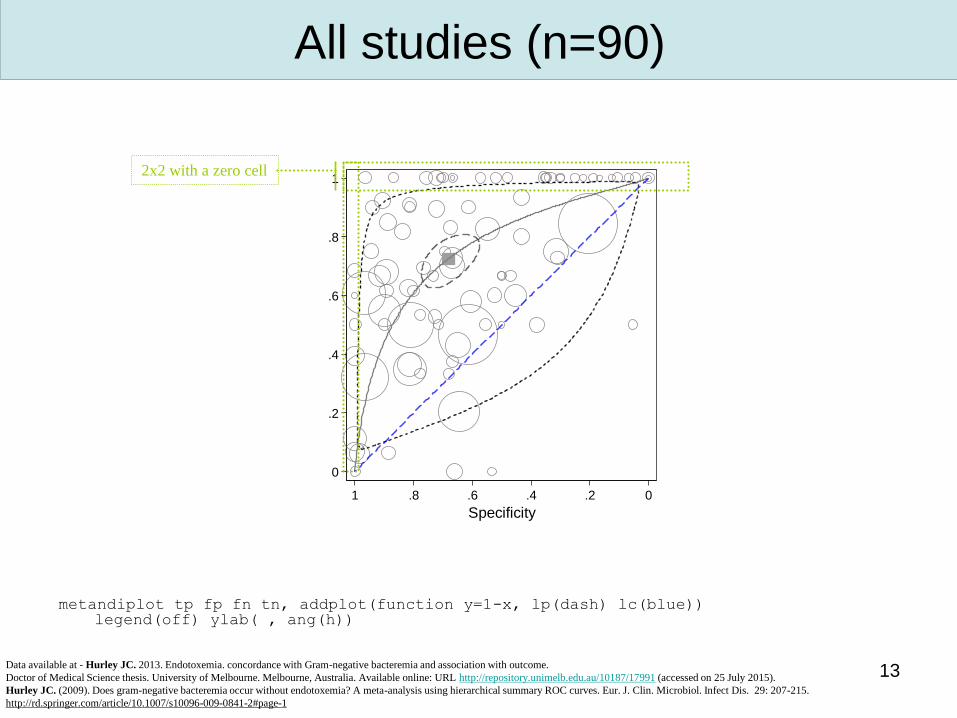
All studies (n=90)
metandiplot tp fp fn tn, predopts(off) confopts(off) curveopts(off) addplot(function y=1-x, lp(dash) lc(blue)) legend(off) ylab( , ang(h))
Data available at - Hurley JC. 2013. Endotoxemia. concordance with Gram-negative bacteremia and association with outcome.
Doctor of Medical Science thesis. University of Melbourne. Melbourne, Australia. Available online: URL http://repository.unimelb.edu.au/10187/17991 (accessed on 25 July 2015).
Hurley JC. (2009). Does gram-negative bacteremia occur without endotoxemia? A meta-analysis using hierarchical summary ROC curves. Eur. J. Clin. Microbiol. Infect Dis. 29: 207-215.
http://rd.springer.com/article/10.1007/s10096-009-0841-2#page-1
0
.2
.4
.6
.8
1
Sensitiv
ity
0.2.4.6.81
Specificity
Note scale for x axis intentionally reversed
11
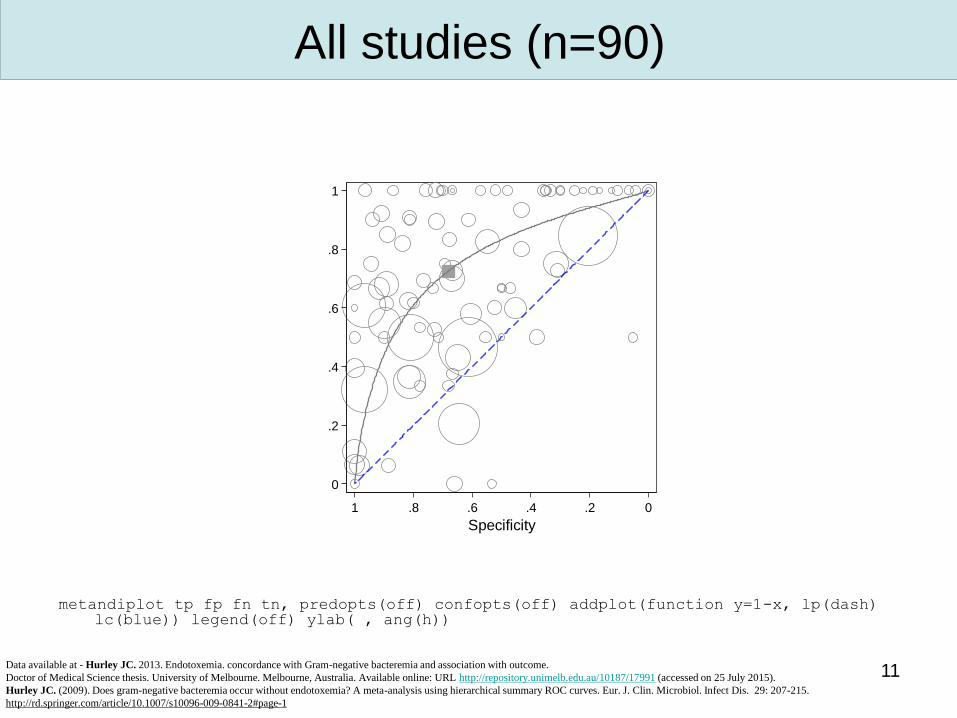
All studies (n=90)
metandiplot tp fp fn tn, predopts(off) confopts(off) addplot(function y=1-x, lp(dash) lc(blue)) legend(off) ylab( , ang(h))
0
.2
.4
.6
.8
1S
ensitiv
ity
0.2.4.6.81
Specificity
Data available at - Hurley JC. 2013. Endotoxemia. concordance with Gram-negative bacteremia and association with outcome.
Doctor of Medical Science thesis. University of Melbourne. Melbourne, Australia. Available online: URL http://repository.unimelb.edu.au/10187/17991 (accessed on 25 July 2015).
Hurley JC. (2009). Does gram-negative bacteremia occur without endotoxemia? A meta-analysis using hierarchical summary ROC curves. Eur. J. Clin. Microbiol. Infect Dis. 29: 207-215.
http://rd.springer.com/article/10.1007/s10096-009-0841-2#page-1
12
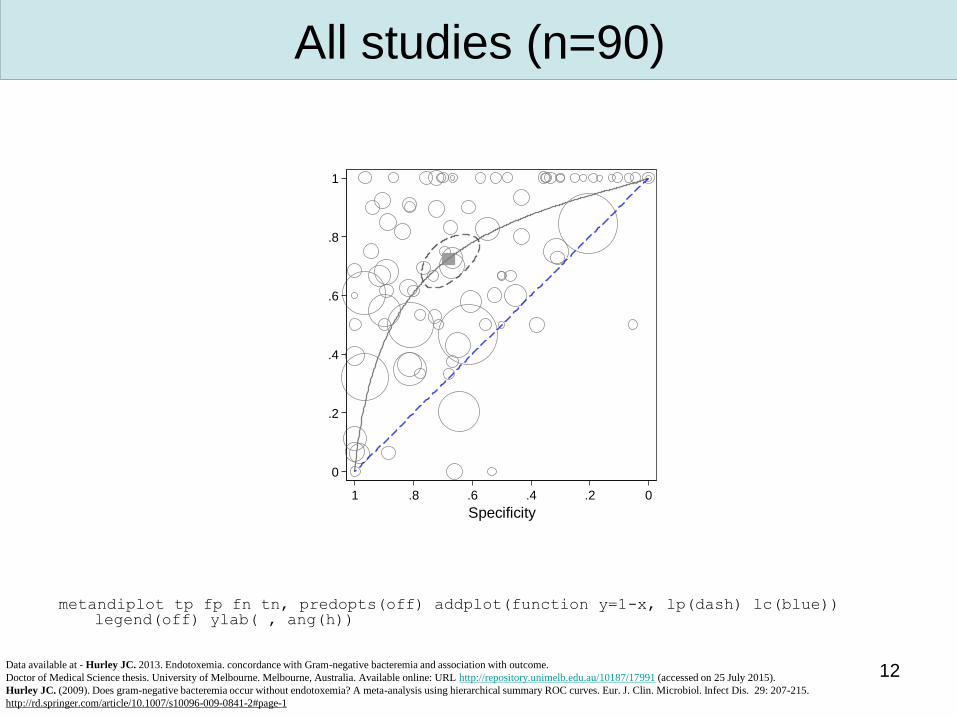
All studies (n=90)
metandiplot tp fp fn tn, predopts(off) addplot(function y=1-x, lp(dash) lc(blue)) legend(off) ylab( , ang(h))
0
.2
.4
.6
.8
1
Sensitiv
ity
0.2.4.6.81
Specificity
Data available at - Hurley JC. 2013. Endotoxemia. concordance with Gram-negative bacteremia and association with outcome.
Doctor of Medical Science thesis. University of Melbourne. Melbourne, Australia. Available online: URL http://repository.unimelb.edu.au/10187/17991 (accessed on 25 July 2015).
Hurley JC. (2009). Does gram-negative bacteremia occur without endotoxemia? A meta-analysis using hierarchical summary ROC curves. Eur. J. Clin. Microbiol. Infect Dis. 29: 207-215.
http://rd.springer.com/article/10.1007/s10096-009-0841-2#page-1
13
All studies (n=90)
metandiplot tp fp fn tn, addplot(function y=1-x, lp(dash) lc(blue)) legend(off) ylab( , ang(h))
0
.2
.4
.6
.8
1
Sensitiv
ity
0.2.4.6.81
Specificity
Data available at - Hurley JC. 2013. Endotoxemia. concordance with Gram-negative bacteremia and association with outcome.
Doctor of Medical Science thesis. University of Melbourne. Melbourne, Australia. Available online: URL http://repository.unimelb.edu.au/10187/17991 (accessed on 25 July 2015).
Hurley JC. (2009). Does gram-negative bacteremia occur without endotoxemia? A meta-analysis using hierarchical summary ROC curves. Eur. J. Clin. Microbiol. Infect Dis. 29: 207-215.
http://rd.springer.com/article/10.1007/s10096-009-0841-2#page-1
2x2 with a zero cell
14
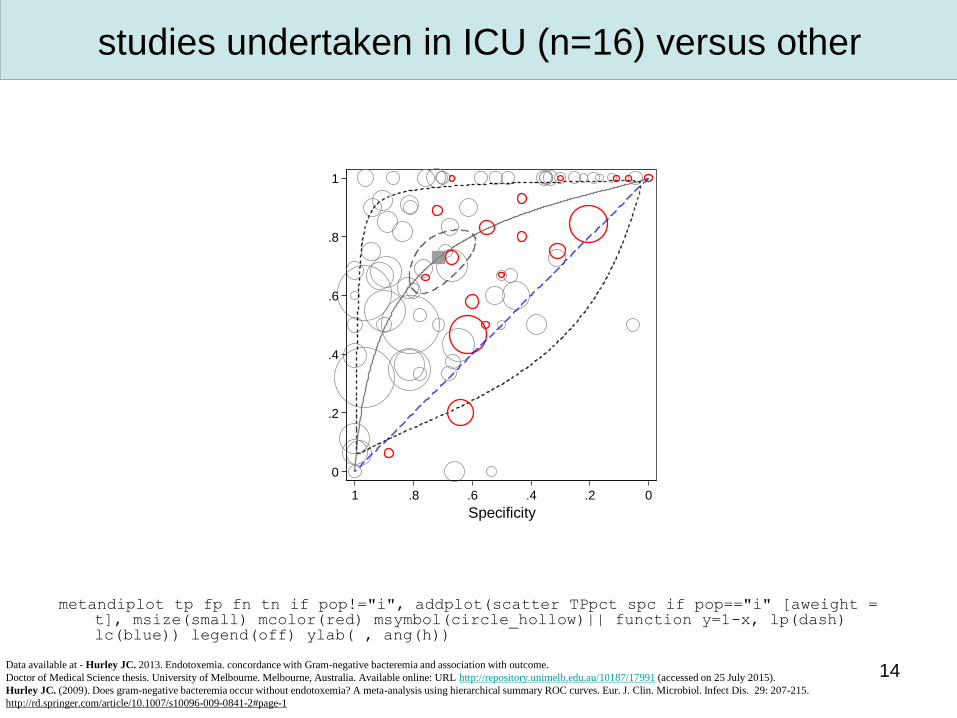
studies undertaken in ICU (n=16) versus other
metandiplot tp fp fn tn if pop!="i", addplot(scatter TPpct spc if pop=="i" [aweight = t], msize(small) mcolor(red) msymbol(circle_hollow)|| function y=1-x, lp(dash) lc(blue)) legend(off) ylab( , ang(h))
0
.2
.4
.6
.8
1
Sensitiv
ity
0.2.4.6.81
Specificity
Data available at - Hurley JC. 2013. Endotoxemia. concordance with Gram-negative bacteremia and association with outcome.
Doctor of Medical Science thesis. University of Melbourne. Melbourne, Australia. Available online: URL http://repository.unimelb.edu.au/10187/17991 (accessed on 25 July 2015).
Hurley JC. (2009). Does gram-negative bacteremia occur without endotoxemia? A meta-analysis using hierarchical summary ROC curves. Eur. J. Clin. Microbiol. Infect Dis. 29: 207-215.
http://rd.springer.com/article/10.1007/s10096-009-0841-2#page-1
15
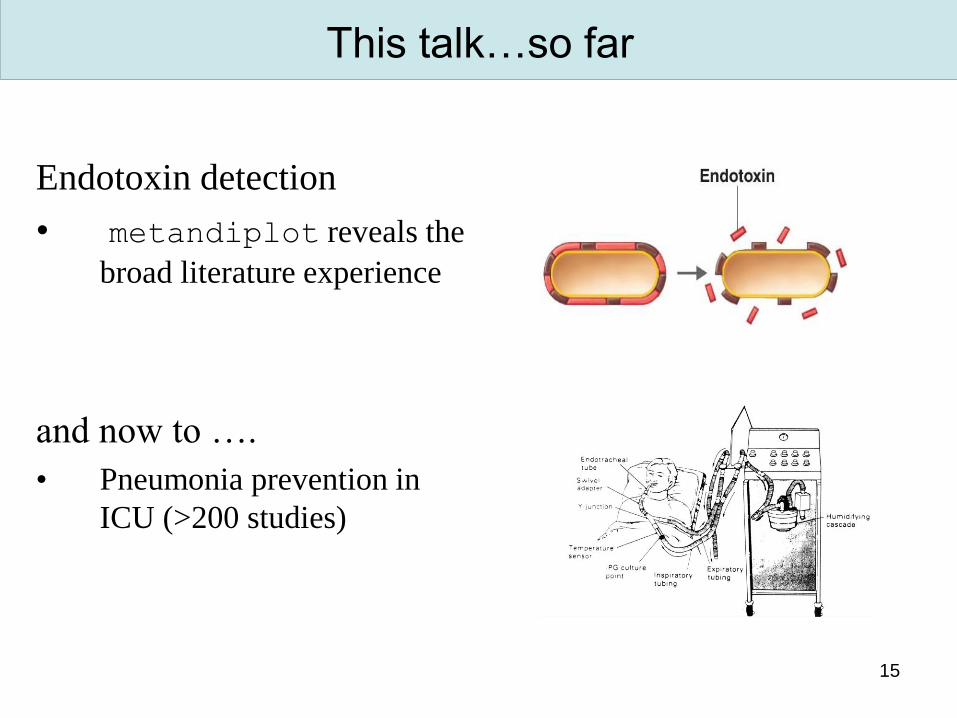
This talk…so far
Endotoxin detection
• metandiplot reveals the
broad literature experience
and now to ….
• Pneumonia prevention in
ICU (>200 studies)
16
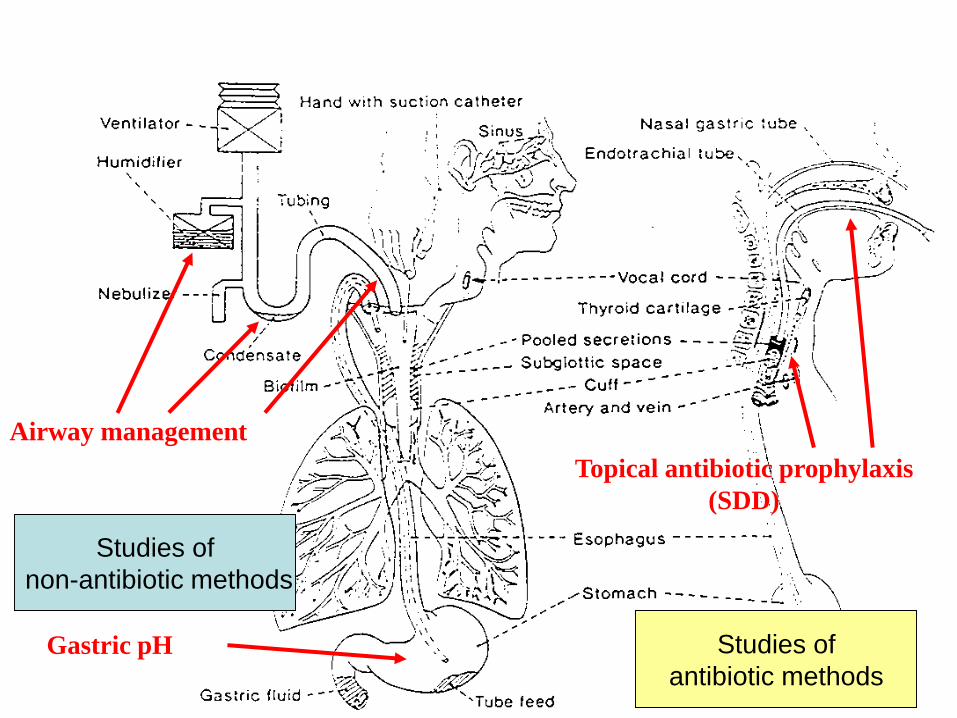
Gastric pH
Airway management
Topical antibiotic prophylaxis
(SDD)
Studies of
non-antibiotic methods
Studies of
antibiotic methods
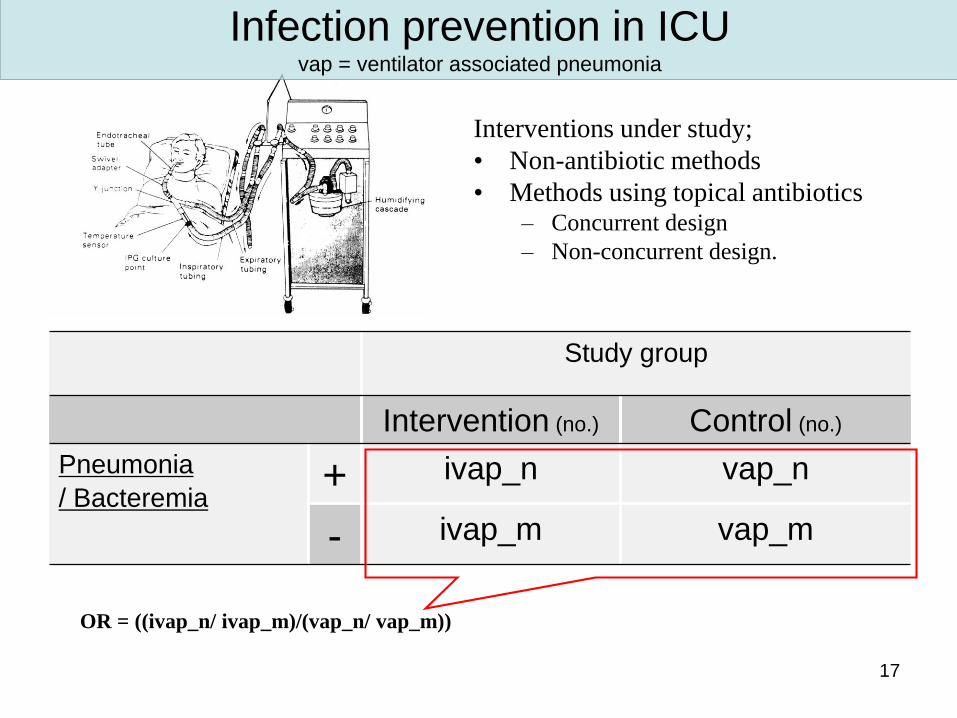
17
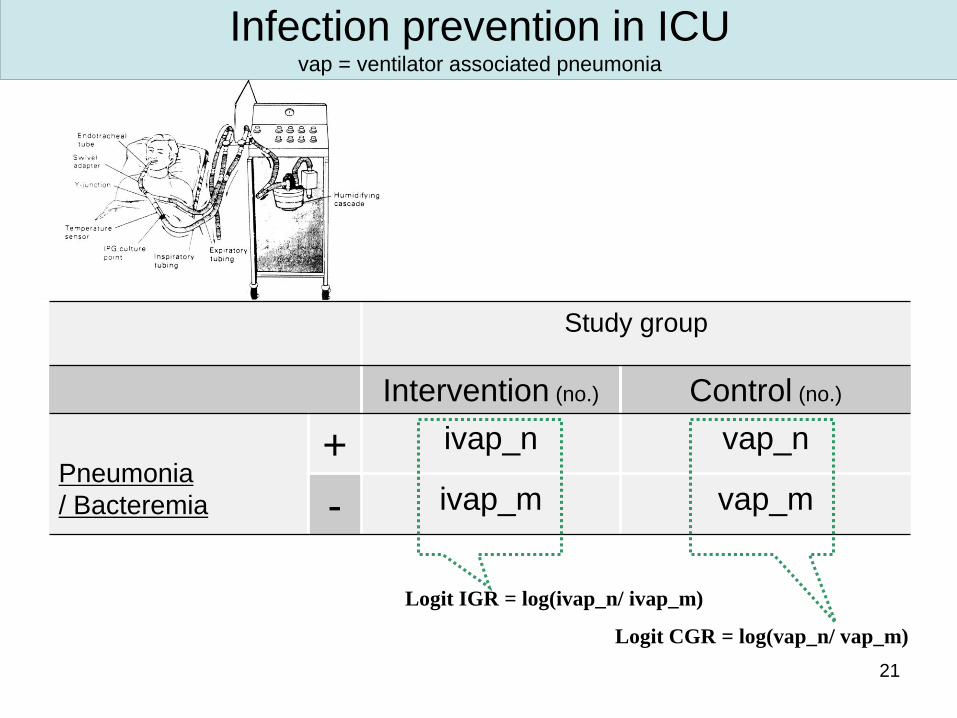
Study group
Intervention (no.) Control (no.)
Pneumonia
/ Bacteremia+ ivap_n vap_n
- ivap_m vap_m
Infection prevention in ICUvap = ventilator associated pneumonia
OR = ((ivap_n/ ivap_m)/(vap_n/ vap_m))
Interventions under study;
• Non-antibiotic methods
• Methods using topical antibiotics– Concurrent design
– Non-concurrent design.
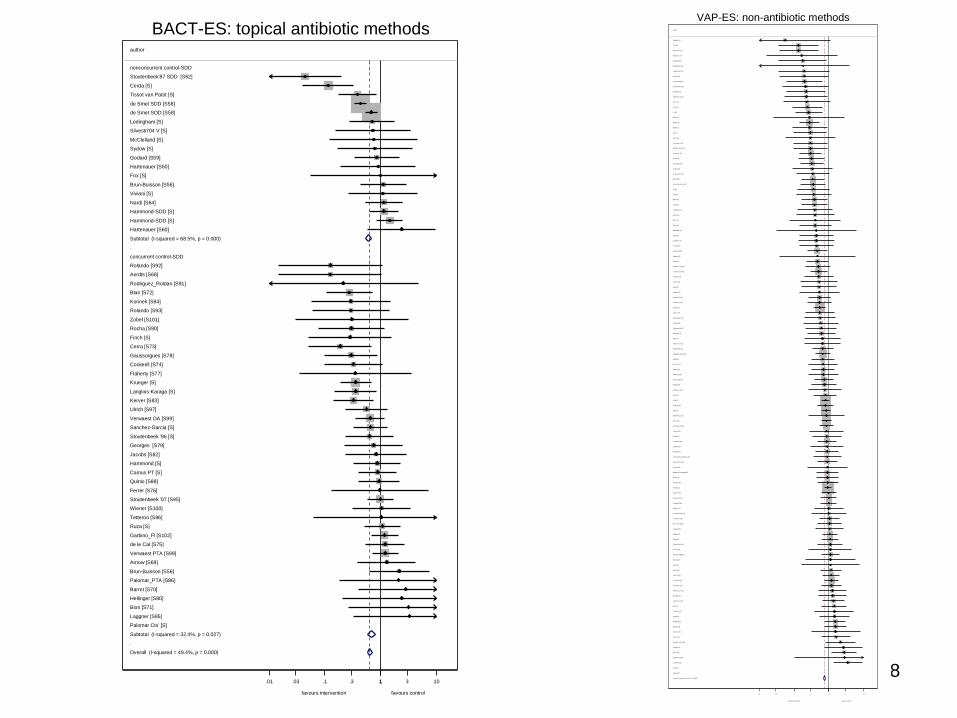
18Overall (I-squared = 41.6%, p = 0.000)
Girou [S]
Beuret [S]
Bonten '95 [S39]
O'Keefe [S]
Reigneir [S]
Tan [S]
Fourr ier '05 [S42]
Laggner [S]
MacNaughton [S]
Branson [S]
De Riso [S]
Forestier [S]
Voggenreiter [S]
Metz [S]
Prakash [S]
Hanisch_plac [S]
Kantorova S [S]
Hurni [S]
Fink [S]
Montecalvo_J [S]
Hsu [S]
Liu [S]
Lorente'06 [S]
Mancebo [S]
Panchachai [S]
Traver [S]
Martin [S]
Pickworth [S]
Apte [S]
Giamarellos-Bourboulis [S]
Prod'hom_R [S]
Kollef'98 [S]
Holzapfel_I_99 [S44]
Yao [S]
Besselink [S]
Chan [S]
White [S]
Harvey [S]
Combes [S]
Kearns_I [S]
Lacherade '05 [S]
Ben-Menachem [S]
Scannapieco [S]
Lacherade '10 [S]
Spindler-Vessel [S]
Dreyfuss [S]
Bellissimo-Rodrigues [S]
Whiteman [S]
Dreyfuss [S]
Klar in [S]
Yang [S]
Kantorova P [S]
Cook [S]
Boots'06_HME [S]
Doig [S]
Demarest [S]
Davies [S]
KoemanChC [S]
Eddleston '91 [S]
Holzapfel_I_93 [S]
Seguin [S]
Kortbeek [S]
Watanabe [S]
Mustafa [S]
Barraud [S]
Eddleston '94 [S]
Koeman-Ch [S]
MacIntyre [S]
Ibrahim '02 [S]
Lorente '04 [S]
Kirschenbaum [S]
Adams [S]
Segers [S]
Montejo [S]
Long_all [S]
Ben-Menachem [S]
Scannapieco [S]
Zeitoun [S]
Thomason [S]
Lorente'06 [S]
Guerin [S]
Smulders [S]
Conrad [S]
Camus MCh [S]
Knight [S]
Ahrens [S]
Deppe [S]
Acosta-escribano [S]
Zheng [S]
Valles [S]
Seguin-PVI [S]
Bo [S]
Mahul [S]
Memish [S]
Prod'hom_S [S]
Pobo [S]
Morrow [S]
de Boisblanc [S]
Welte [S]
Kollef '97 [S]
Gentilello [S]
Johnson [S]
Thomason [S]
Sirvent [S]
Tantipong [S]
Bonten '96_I [S]
Munro [S]
Kotzampassi [S]
Darvas [S]
Metz [S]
Kollef '95 [S]
Fourr ier '00 [S41]
Summer [S]
Hanisch [S]
Lorente'12 [S]
Roustan [S]
author
Lorente'05 [S]
Kir ton [S]
Drakulovic [S]
Valencia [S]
Boots [S]
Lorente'07 [S]
Rabitsch [S]
Topeli [S]
favours intervention favours control
1.01 .03 .1 .3 1 3 10
VAP-ES: non-antibiotic methods
.
.
Overall (I-squared = 49.4%, p = 0.000)
Tetteroo [S96]
Bion [S71]
Stoutenbeek '07 [S95]
Verwaest PTA [S99]
Rodriguez_Roldan [S91]
Cerra [S73]
Krueger [S]
Langlois-Karaga [S]
Jacobs [S82]
Hellinger [S80]
Rocha [S90]
McClelland [S]
Gaussorgues [S78]
Tissot van Patot [S]
de Smet SDD [S58]
Palomar_PTA [S86]
Hartenauer [S60]
Brun-Buisson [S56]
Sydow [S]
Arnow [S69]
Hammond-SDD [S]
Garbino_Fl [S102]
Flaherty [S77]
Quinio [S88]
Nardi [S64]
Verwaest OA [S99]
Palomar Ctx' [S]
Ruza [S]
de le Cal [S75]
Barret [S70]
Laggner [S85]
Brun-Buisson [S56]
Camus PT [S]
Cockerill [S74]
Sanchez-Garcia [S]
Hammond-SDD [S]
Cerda [S]
Korinek [S84]
Stoutenbeek '96 [S]
Wiener [S100]
nonconcurrent control-SDD
Rolando [S92]
concurrent control-SDD
Aerdts [S68]
Subtotal (I-squared = 68.5%, p = 0.000)
Kerver [S83]
Rolando [S93]
Blair [S72]
Fox [S]
Georges [S79]
Ledingham [S]
Hartenauer [S60]
Godard [S59]
de Smet SOD [S58]
Ferrer [S76]
Silvestri'04 V [S]
Hammond [S]
Viviani [S]
Subtotal (I-squared = 32.4%, p = 0.027)
Finch [S]
Zobel [S101]
Stoutenbeek'87 SDD [S62]
Ulrich [S97]
author
favours intervention favours control
1.01 .03 .1 .3 1 3 10
BACT-ES: topical antibiotic methods
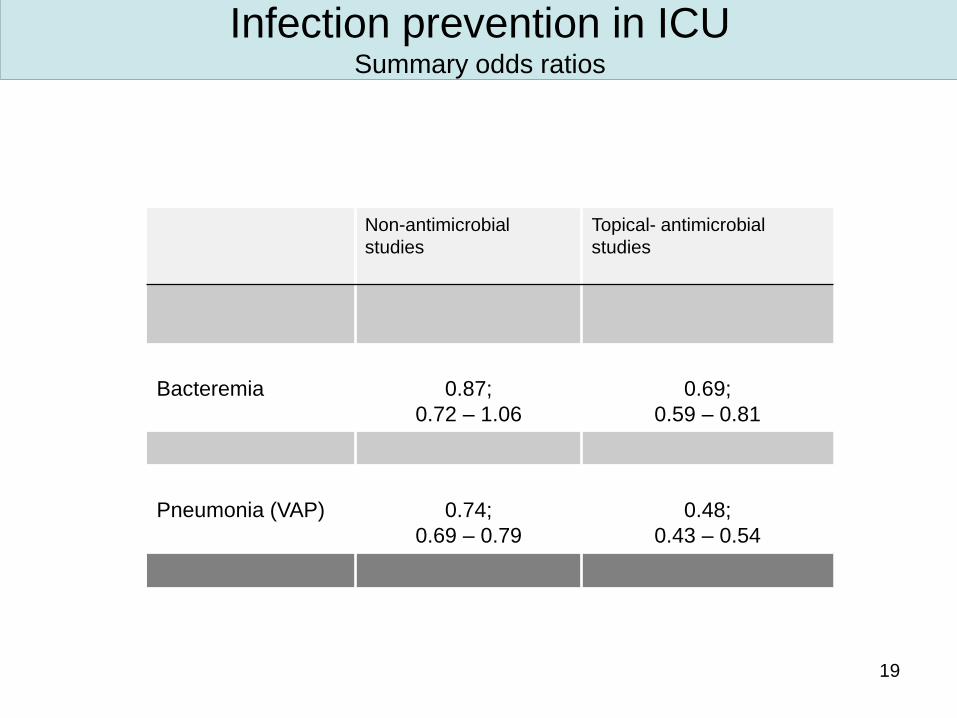
19
Non-antimicrobial
studies
Topical- antimicrobial
studies
Bacteremia 0.87;
0.72 – 1.06
0.69;
0.59 – 0.81
Pneumonia (VAP) 0.74;
0.69 – 0.79
0.48;
0.43 – 0.54
Infection prevention in ICUSummary odds ratios
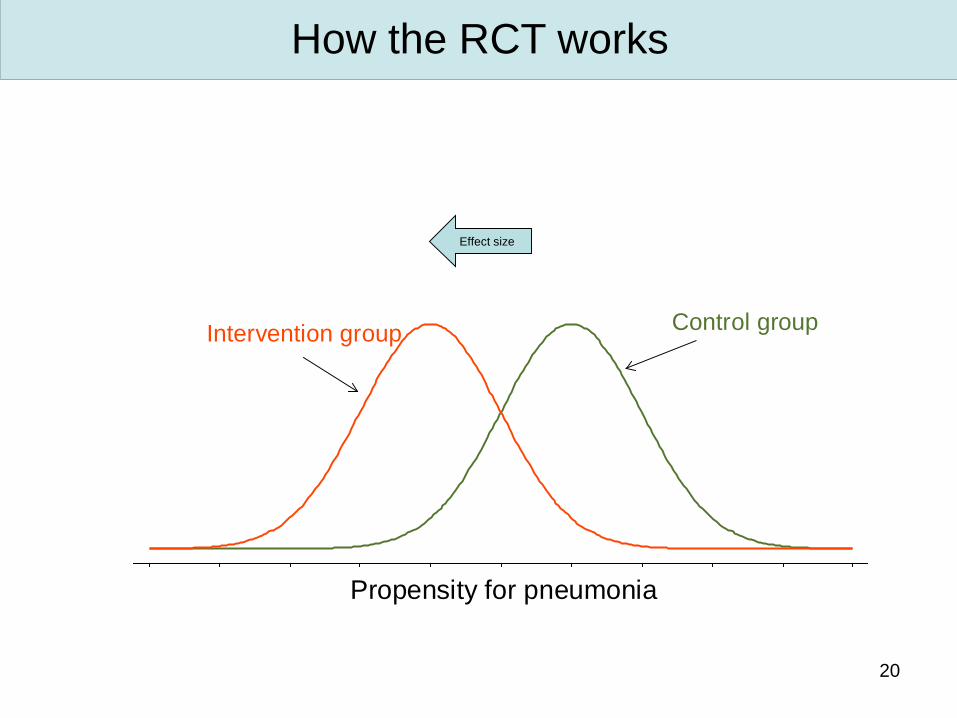
20
Intervention groupControl group
Propensity for pneumonia
How the RCT works
Effect size
21
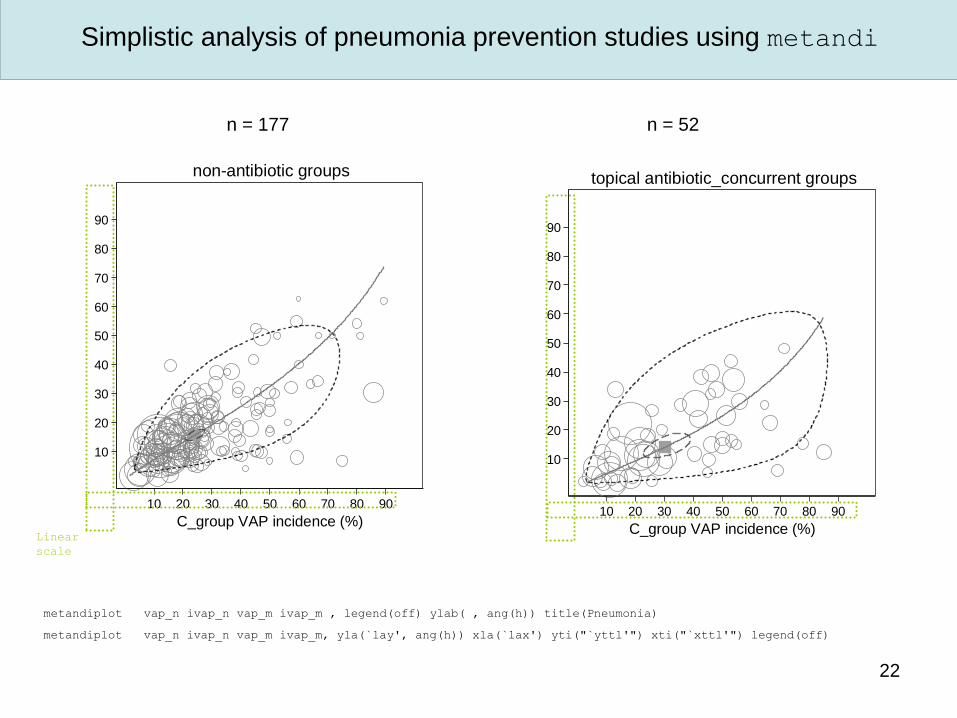
Study group
Intervention (no.) Control (no.)
Pneumonia
/ Bacteremia
+ ivap_n vap_n
- ivap_m vap_m
Infection prevention in ICUvap = ventilator associated pneumonia
Logit IGR = log(ivap_n/ ivap_m)
Logit CGR = log(vap_n/ vap_m)
22
10
20
30
40
50
60
70
80
90
I_gro
up V
AP
incid
ence (
%)
908070605040302010
C_group VAP incidence (%)
topical antibiotic_concurrent groups
Simplistic analysis of pneumonia prevention studies using metandi
10
20
30
40
50
60
70
80
90
I_gro
up V
AP
incid
ence (
%)
908070605040302010
C_group VAP incidence (%)
non-antibiotic groups
n = 52n = 177
metandiplot vap_n ivap_n vap_m ivap_m , legend(off) ylab( , ang(h)) title(Pneumonia)
metandiplot vap_n ivap_n vap_m ivap_m, yla(`lay', ang(h)) xla(`lax') yti("`yttl'") xti("`xttl'") legend(off)
Linear
scale
23
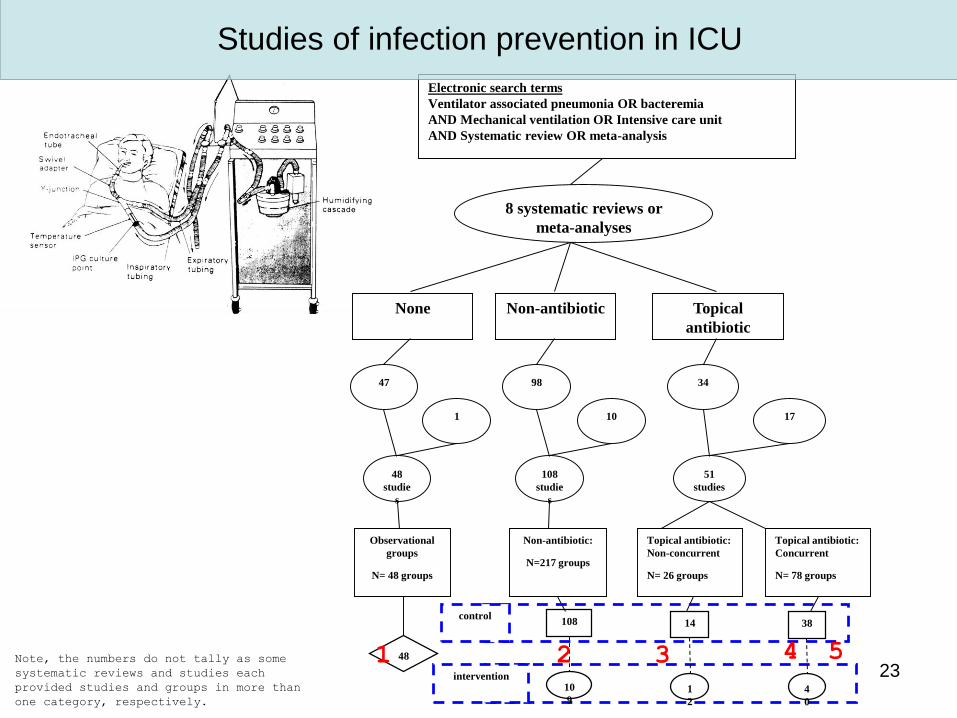
Electronic search terms
Ventilator associated pneumonia OR bacteremia
AND Mechanical ventilation OR Intensive care unit
AND Systematic review OR meta-analysis
Non-antibiotic Topical
antibiotic
None
8 systematic reviews or
meta-analyses
47
1
48
studie
s
98
10
108
studie
s
Observational
groups
N= 48 groups
48
intervention
Non-antibiotic:
N=217 groups
108
10
9
34
51
studies
17
Topical antibiotic:
Non-concurrent
N= 26 groups
14
1
2
Topical antibiotic:
Concurrent
N= 78 groups
38
4
0
control
Note, the numbers do not tally as some
systematic reviews and studies each
provided studies and groups in more than
one category, respectively.
Studies of infection prevention in ICU
1 2 3 4 5
24
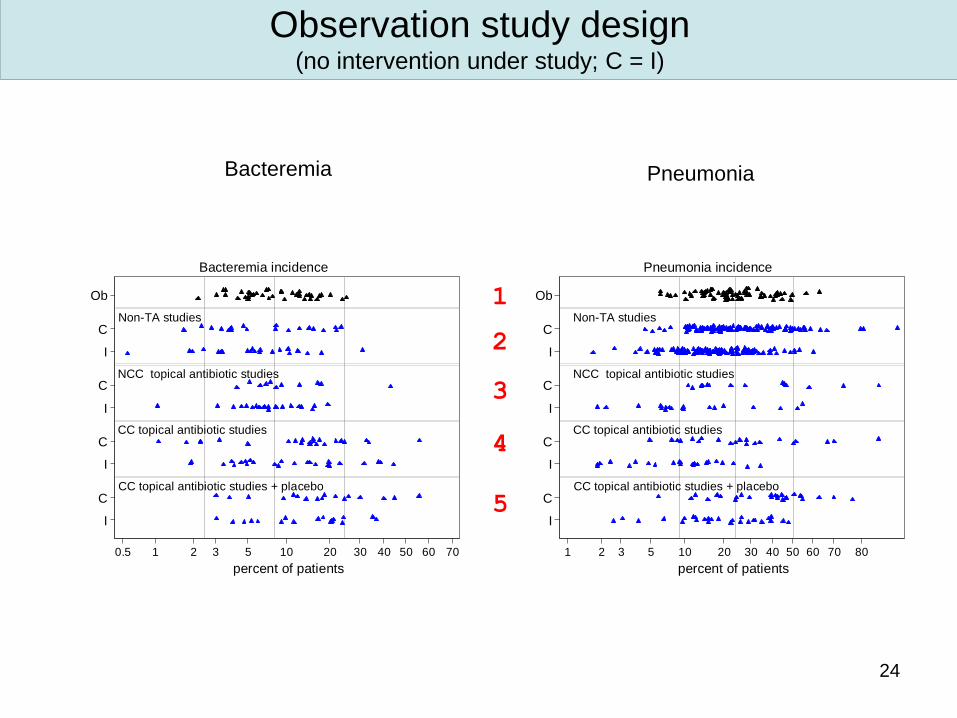
Observation study design(no intervention under study; C = I)
PneumoniaBacteremia
Non-TA studies
NCC topical antibiotic studies
CC topical antibiotic studies
CC topical antibiotic studies + placebo
Ob
C
C
C
C
I
I
I
I
com
po
ne
nt
gro
up
s
0.5 1 2 3 5 10 20 30 40 50 60 70
percent of patients
Bacteremia incidence
Non-TA studies
NCC topical antibiotic studies
CC topical antibiotic studies
CC topical antibiotic studies + placebo
Ob
C
C
C
C
I
I
I
I
com
po
ne
nt
gro
up
s
1 2 3 5 10 20 30 40 50 60 70 80
percent of patients
Pneumonia incidence
1
2
3
4
5
25
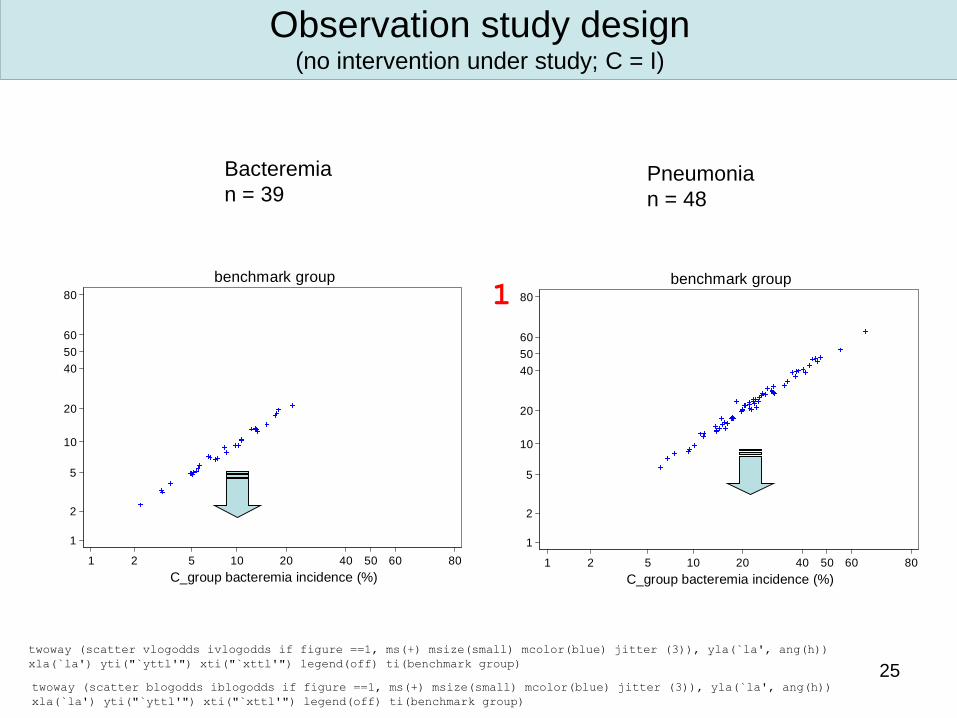
Observation study design(no intervention under study; C = I)
Pneumonia
n = 48
Bacteremia
n = 39
1
2
5
10
20
40
50
60
80
I_g
roup
ba
cte
rem
ia in
cid
ence
(%
)
1 2 5 10 20 40 50 60 80
C_group bacteremia incidence (%)
benchmark group
1
2
5
10
20
40
50
60
80
I_g
roup
ba
cte
rem
ia in
cid
ence
(%
)
1 2 5 10 20 40 50 60 80
C_group bacteremia incidence (%)
benchmark group
twoway (scatter vlogodds ivlogodds if figure ==1, ms(+) msize(small) mcolor(blue) jitter (3)), yla(`la', ang(h))
xla(`la') yti("`yttl'") xti("`xttl'") legend(off) ti(benchmark group)
twoway (scatter blogodds iblogodds if figure ==1, ms(+) msize(small) mcolor(blue) jitter (3)), yla(`la', ang(h))
xla(`la') yti("`yttl'") xti("`xttl'") legend(off) ti(benchmark group)
1
26
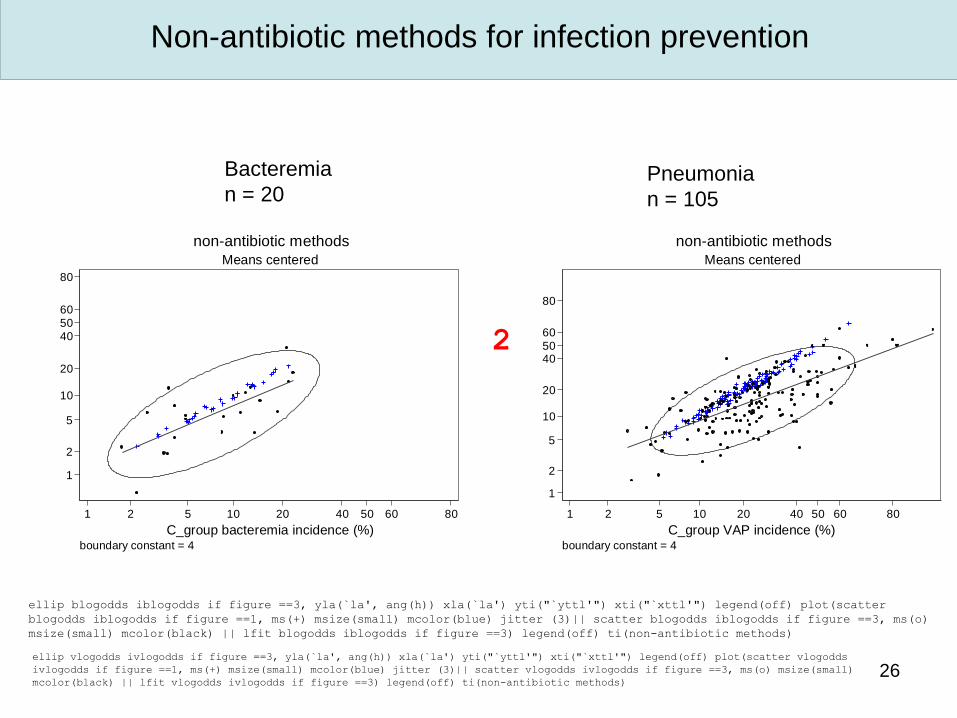
Non-antibiotic methods for infection prevention
Pneumonia
n = 105
Bacteremia
n = 20
1
2
5
10
20
405060
80I_
gro
up
VA
P in
cid
ence
(%
)
1 2 5 10 20 40 50 60 80
C_group VAP incidence (%)boundary constant = 4
Means centered
non-antibiotic methods
1
2
5
10
20
405060
80
I_g
roup
ba
cte
rem
ia in
cid
ence
(%
)
1 2 5 10 20 40 50 60 80
C_group bacteremia incidence (%)boundary constant = 4
Means centered
non-antibiotic methods
ellip vlogodds ivlogodds if figure ==3, yla(`la', ang(h)) xla(`la') yti("`yttl'") xti("`xttl'") legend(off) plot(scatter vlogodds
ivlogodds if figure ==1, ms(+) msize(small) mcolor(blue) jitter (3)|| scatter vlogodds ivlogodds if figure ==3, ms(o) msize(small)
mcolor(black) || lfit vlogodds ivlogodds if figure ==3) legend(off) ti(non-antibiotic methods)
ellip blogodds iblogodds if figure ==3, yla(`la', ang(h)) xla(`la') yti("`yttl'") xti("`xttl'") legend(off) plot(scatter
blogodds iblogodds if figure ==1, ms(+) msize(small) mcolor(blue) jitter (3)|| scatter blogodds iblogodds if figure ==3, ms(o)
msize(small) mcolor(black) || lfit blogodds iblogodds if figure ==3) legend(off) ti(non-antibiotic methods)
2
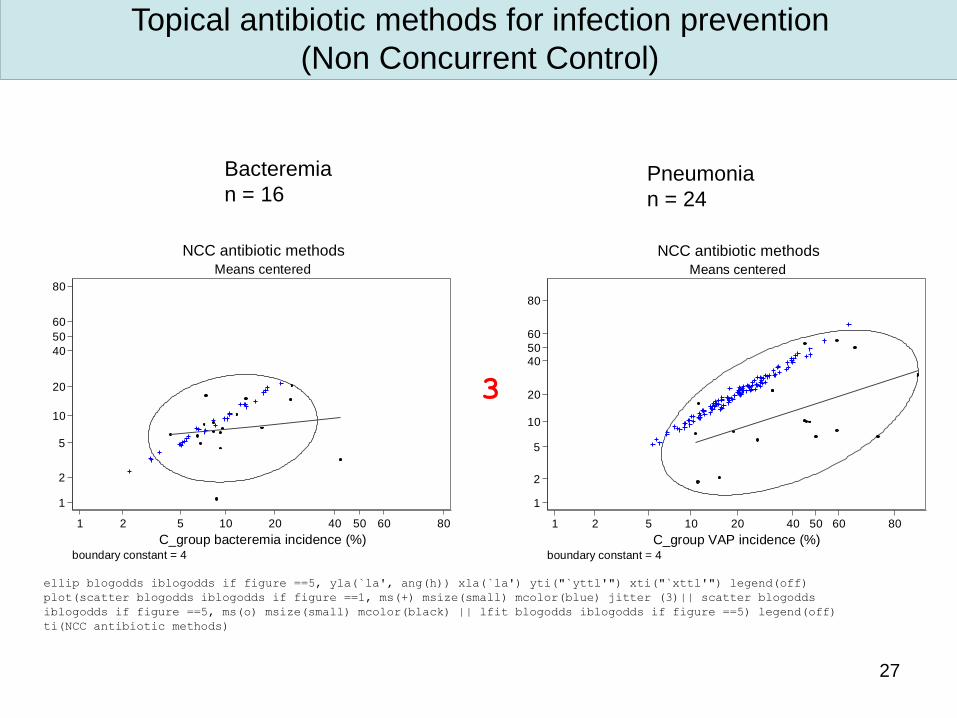
27
Topical antibiotic methods for infection prevention
(Non Concurrent Control)
Pneumonia
n = 24
Bacteremia
n = 16
1
2
5
10
20
40
50
60
80
I_g
roup
ba
cte
rem
ia in
cid
ence
(%
)
1 2 5 10 20 40 50 60 80
C_group bacteremia incidence (%)boundary constant = 4
Means centered
NCC antibiotic methods
1
2
5
10
20
4050
60
80I_
gro
up
VA
P in
cid
ence
(%
)
1 2 5 10 20 40 50 60 80
C_group VAP incidence (%)boundary constant = 4
Means centered
NCC antibiotic methods
ellip blogodds iblogodds if figure ==5, yla(`la', ang(h)) xla(`la') yti("`yttl'") xti("`xttl'") legend(off)
plot(scatter blogodds iblogodds if figure ==1, ms(+) msize(small) mcolor(blue) jitter (3)|| scatter blogodds
iblogodds if figure ==5, ms(o) msize(small) mcolor(black) || lfit blogodds iblogodds if figure ==5) legend(off)
ti(NCC antibiotic methods)
3
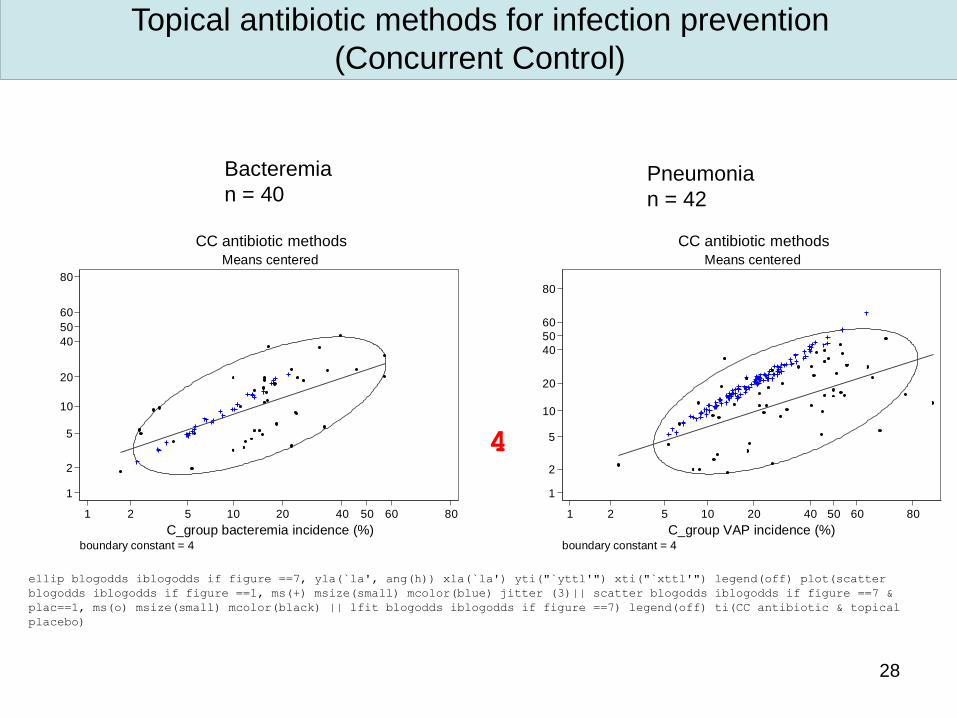
28
Topical antibiotic methods for infection prevention
(Concurrent Control)
Pneumonia
n = 42
Bacteremia
n = 40
1
2
5
10
20
40
50
60
80
I_g
roup
VA
P in
cid
ence
(%
)
1 2 5 10 20 40 50 60 80
C_group VAP incidence (%)boundary constant = 4
Means centered
CC antibiotic methods
1
2
5
10
20
40
50
60
80
I_g
roup
ba
cte
rem
ia in
cid
ence
(%
)
1 2 5 10 20 40 50 60 80
C_group bacteremia incidence (%)boundary constant = 4
Means centered
CC antibiotic methods
ellip blogodds iblogodds if figure ==7, yla(`la', ang(h)) xla(`la') yti("`yttl'") xti("`xttl'") legend(off) plot(scatter
blogodds iblogodds if figure ==1, ms(+) msize(small) mcolor(blue) jitter (3)|| scatter blogodds iblogodds if figure ==7 &
plac==1, ms(o) msize(small) mcolor(black) || lfit blogodds iblogodds if figure ==7) legend(off) ti(CC antibiotic & topical
placebo)
4
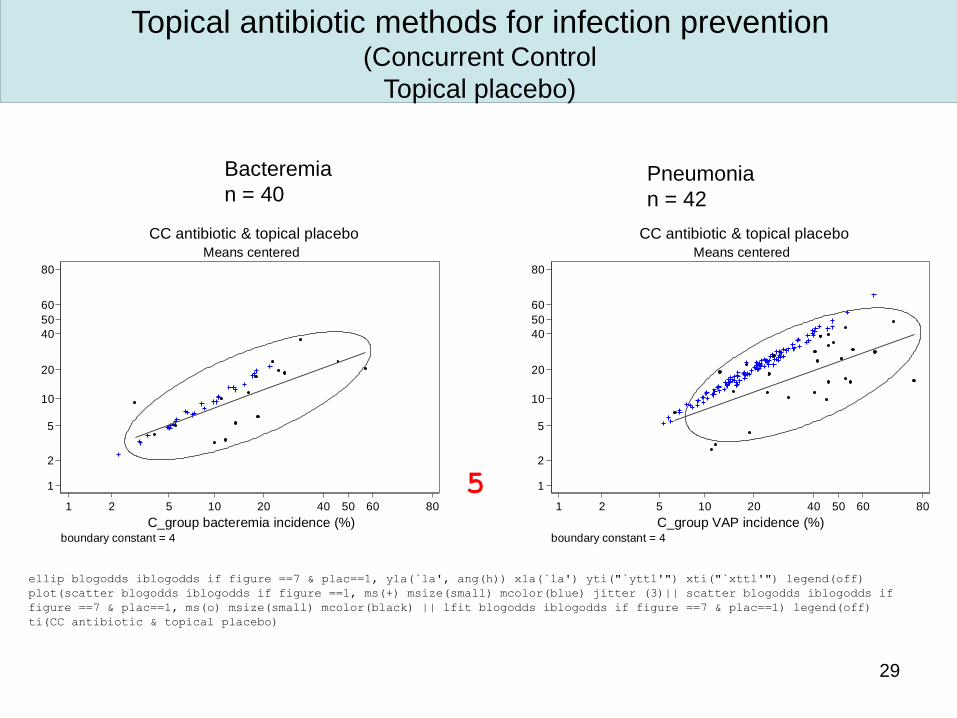
29
Topical antibiotic methods for infection prevention (Concurrent Control
Topical placebo)
Pneumonia
n = 42
Bacteremia
n = 40
1
2
5
10
20
40
50
60
80
I_g
roup
ba
cte
rem
ia in
cid
ence
(%
)
1 2 5 10 20 40 50 60 80
C_group bacteremia incidence (%)boundary constant = 4
Means centered
CC antibiotic & topical placebo
1
2
5
10
20
40
50
60
80
I_g
roup
VA
P in
cid
ence
(%
)
1 2 5 10 20 40 50 60 80
C_group VAP incidence (%)boundary constant = 4
Means centered
CC antibiotic & topical placebo
ellip blogodds iblogodds if figure ==7 & plac==1, yla(`la', ang(h)) xla(`la') yti("`yttl'") xti("`xttl'") legend(off)
plot(scatter blogodds iblogodds if figure ==1, ms(+) msize(small) mcolor(blue) jitter (3)|| scatter blogodds iblogodds if
figure ==7 & plac==1, ms(o) msize(small) mcolor(black) || lfit blogodds iblogodds if figure ==7 & plac==1) legend(off)
ti(CC antibiotic & topical placebo)
5
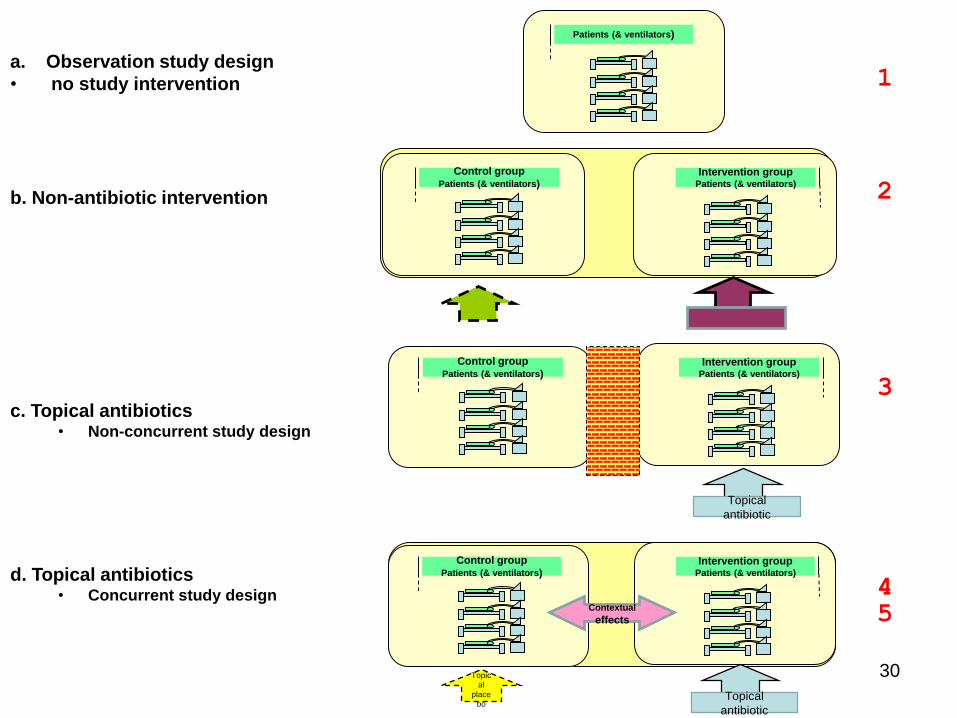
30
Patients (& ventilators)
a. Observation study design
• no study intervention
b. Non-antibiotic intervention
Control groupPatients (& ventilators)
Intervention groupPatients (& ventilators)
Control groupPatients (& ventilators)
Contextual
effects
Topic
al
place
bo
Intervention groupPatients (& ventilators)
Topical
antibiotic
c. Topical antibiotics • Non-concurrent study design
Control groupPatients (& ventilators)
Topical
antibiotic
Intervention groupPatients (& ventilators)
d. Topical antibiotics • Concurrent study design
1
2
3
45
31
Summary
• Meta-analysis capabilities in Stata• derivation of summary effect sizes
• a ‘visual’ of the relationships of
– component studies (as individual or sub-groups) to overall effect sizes.
– component groups within studies to overall effect sizes.
• Relationship of effect size to control group variability– A range of approaches (pro & con for each).
– Graphics within metan & metandi offer novel insights
– Ellipse versus linear regression
– “Tea leaf reading” or enabling the data to speak for themselves?

![Charles Darwin University Antibiotics versus topical …...[Intervention Protocol] Antibiotics versus topical antiseptics for chronic suppurative otitis media Karen Head 1, Lee-Yee](https://img.pdfslide.us/doc/110x75/5e6a4977165ec131497be825/charles-darwin-university-antibiotics-versus-topical-intervention-protocol.jpg)


![Antibiotics for community acquired pneumonia in adult ... · [Intervention Review] Antibiotics for community acquired pneumonia in adult outpatients Lise M Bjerre1, Theo JM Verheij2,](https://img.pdfslide.us/doc/110x75/5d624b2388c993825e8bcc17/antibiotics-for-community-acquired-pneumonia-in-adult-intervention-review.jpg)