Embed Size (px)
Citation preview

Monthly Fund Performance May 2017 Edition
ULIP Fund
THE LINKED INSURANCE PRODUCTS DO NOT OFFER ANY LIQUIDITY DURING THE FIRST FIVE YEARS OF THE CONTRACT.THE POLICYHOLDER WILL NOT BE ABLE TO
SURRENDER/WITHDRAW THE MONIES INVESTED IN LINKED INSURANCE PRODUCTS COMPLETELY OR PARTIALLY TILL THE END OF THE FIFTH YEAR.

Glossary
Sanjay Kumar
Chief Investment Officer
Month gone by – A snapshot
Emerging market equities rallied for the fifth consecutive month. While the developed market index rose
by 9% YTD, the emerging market index outperformed with 17% return. India also followed led by
improving trend in corporate earnings and strong flows by domestic and foreign institutional investors
(FIIs). The GST rates for majority of the categories were on expected lines. Fixed income market ended
the month on positive note amid strong FII inflows. Going forward, stance of RBI and Fed in the upcoming
policy meetings and impact of GST implementation are crucial factors for equity as well as fixed income
markets.
Demonetisation hits Q4 FY17 GDP growth
India’s Q4 FY17 GDP growth slowed to 6.1% y-y from 7.0% in Q3, reflecting the lagged effect of demonetisation. This was led by
contraction in construction sector growth and slowdown in manufacturing and private services sectors. While private consumption
growth moderated, fixed capital formation contracted for the first time in three years. The FY17 GDP growth was unchanged at 7.1%
led by upward revision in previous quarters. We expect GDP growth to revive in FY18 led by pick-up in consumption and higher
public spending, notwithstanding transitory negative impact due to GST implementation.
Q4 FY17 corporate earnings show an improving trend
Aggregate corporate earnings in Q4 FY17 showed an improvement largely led by strong growth in Banking, Energy and Metals
sectors. Further, pick-up in volumes for Consumer sector signals moderate normalisation post demonetisation. On the negative side,
Pharmaceuticals, Technology and Telecom saw weak earnings growth. We expect corporate earnings to improve in FY18 led by pick-
up in economic activity and higher public spending.
Fixed income market performance
Fixed income market rallies: After a sell-off in April, fixed income market ended May on a positive note amid strong FII inflows
(May: $3bn; YTD: $11bn). The declining inflation trajectory and expectations of a normal monsoon, coupled with decline in global
bond yields, boosted market sentiments. The 10-year g-sec yield ended the month at 6.7% vs. 7.0% in April-end.
Outlook: The recent inflation trajectory, coupled with timely onset of monsoon, is expected to keep market sentiments positive.
Inflation is likely to undershoot RBI’s average estimate of 4.5% in H1 FY18 amid positive domestic developments and abating global
risks. This, along with weak Q4 GDP growth, may lead to RBI softening its stance in the upcoming policy meeting on June 7th.
However, adverse domestic risks to inflation arising from full implementation of 7th Pay Commission recommendations, transitory
impact of GST and possibility of a weak monsoon (in terms of temporal and spatial distribution) still persist. As such, RBI is likely to
keep rates on hold in the near-term.
Equity market performance
Equity market continues the strong show: Indian equity markets rallied for the fifth consecutive month facilitated by strong
inflows from FIIs and domestic institutional investors (DIIs). The rally was led by 1) improving trend in Q4 FY17 corporate earnings,
2) expectations of a normal monsoon and 3) announcement of GST rates on expected lines. The FIIs turned buyers in May with net
inflows at $1.5bn (YTD: $8bn). While Nifty Index rose by 3.4% in May (18% YTD), the mid-cap index declined by 1.2% (22% YTD).
Outlook: While the underlying momentum remains strong, rich valuations may result in equity markets consolidating in the near-
term. On the global front, US trade and fiscal policies as well as monetary policies of global central banks remain crucial factors for
equity markets. On the domestic front, progress of monsoon and impact of GST implementation are likely to determine equity
market trajectory in the near-term. Our medium-term outlook on the market remains strong on account of 1) pick-up in economic
activity led by consumption and higher public spending and 2) continued revival in corporate earnings.
Back
From the CIO’s desk

Economic indicators
Wholesale Price Index (WPI) Inflation (%) -1.1 4.3 3.9 -0.4 5.0
Consumer Price Index (CPI) Inflation (%) 5.5 3.2 3.0 -0.2 -2.5
Gross Domestic product (GDP Growth) (%) 9.2 7.0 6.1 -0.9 -3.1
Index of Industrial Production (IIP) (%) 5.5 2.6 2.7 0.1 -2.8
Domestic Markets
Nifty 50 Index 8,160 8,880 9,621 8% 18%
BSE Mid-cap Index 11,366 13,552 14,625 8% 29%
10-year G-Sec Yield (%) 7.5 6.9 6.7 -20 bps -80 bps
10-year AAA PSU Corporate Bond Yield (%) 8.2 7.7 7.7 0 bps -50 bps
30-year G-Sec Yield (%) 7.9 7.4 7.4 0 bps -50 bps
Exchange rate (USD/INR) 67.3 66.7 64.5 -3% -4%
Global Markets
Dow Jones (U.S.) 17,787 20,812 21,009 1% 18%
FTSE (U.K.) 6,231 7,263 7,520 4% 21%
Shanghai Stock Exchange Composite Index (China) 2,917 3,242 3,117 -4% 7%
Brent crude oil (USD/barrel) 50 56 50 -9% 1%
Source: Central Statistics Organisation (CSO), RBI, Bloomberg
Q-o-Q Variation
May-17Feb-17May-16IndicatorsY-o-Y
Variation
Glossary
10-year government bond yield trend
Equity Market performance
Back
Economic and market snapshot
7.5
6.2
7.0
6.7
6.0
6.2
6.4
6.6
6.8
7.0
7.2
7.4
7.6
7.8
8.0
May-16 Jul-16 Sep-16 Nov-16 Jan-17 Mar-17 May-17
10-year benchmark yield(%)
Source: Bloomberg
8,867
7.986
9,621
13,550
11,506
14,625
6,000
7,600
9,200
10,800
12,400
14,000
15,600
May-16 Jul-16 Sep-16 Nov-16 Jan-17 Mar-17 May-17
NIFTY BSE Mid-cap Index
Source: Bloomberg


How can an insurance policy help protect and bolster your future investments?Have you thought about how your family will continue with their current lifestyle if you were not there tomorrow? Will your spouse
be able to pay the children’s school fees? Will your parents be able to get the medical attention they require? If not, its not late even
now. The primary reason for investing in an insurance plan should be to ensure that the family income is protected even if something
unfortunate were to happen to the breadwinner. With the evolution of the financial services category, the insurance plans also serve
an important objective of creating a corpus for planned expenses like retirement, prepayment of loans or child’s education or
marriage. Interestingly, as per Nielsen Life 2013 research, while 51% have quoted protection as the key reason for investing in life
insurance, close to 46% are investing for their child’s future and 43% for retirement.
Now let’s look at various options available for you to build a robust financial portfolio. To begin with, you should look at a term plan to
ensure that your family receives a lump-sum incase something unfortunate were to happen impacting the regular income flow. There
are income protection plans also available to ensure regular income for your family. After reviewing your financial portfolio and life-
stage, you should consider investing towards retirement to protect your golden years. If you have children, it is advisable to consider
investing in an insurance plan at an early stage to build a corpus. While there are many instruments available for savings in the
market, insurance is the only product that ensures that the savings you planned for is available for your child/ family whether you are
around or not. This is possible due to the ‘life cover’ attached to your policy which ensures a lump-sum incase of death of the primary
wage earner. Some select child plans also come with the ‘waiver of premium’ feature which ensures that all premiums are paid by the
insurance company incase something happens to the parent and the child gets the corpus planned on maturity.
The key to ensuring that your family is financially secure is to start early and to understand your financial goals before choosing
products.

MARKET OVERVIEW FUND PERFORMANCE OUR POPULAR PRODUCTS
MetInvestMonthly Fund Performance Newsletter
FUND CATEGORY
EQUITY BALANCED
Balancer II
DEBT
Protector IIFlexicap
Multiplier II
Multiplier III
Virtue II
Multiplier
Virtue
Accelerator
Balancer
Moderator
Preserver II
Liquid
Protector
Preserver
Discontinued Policy
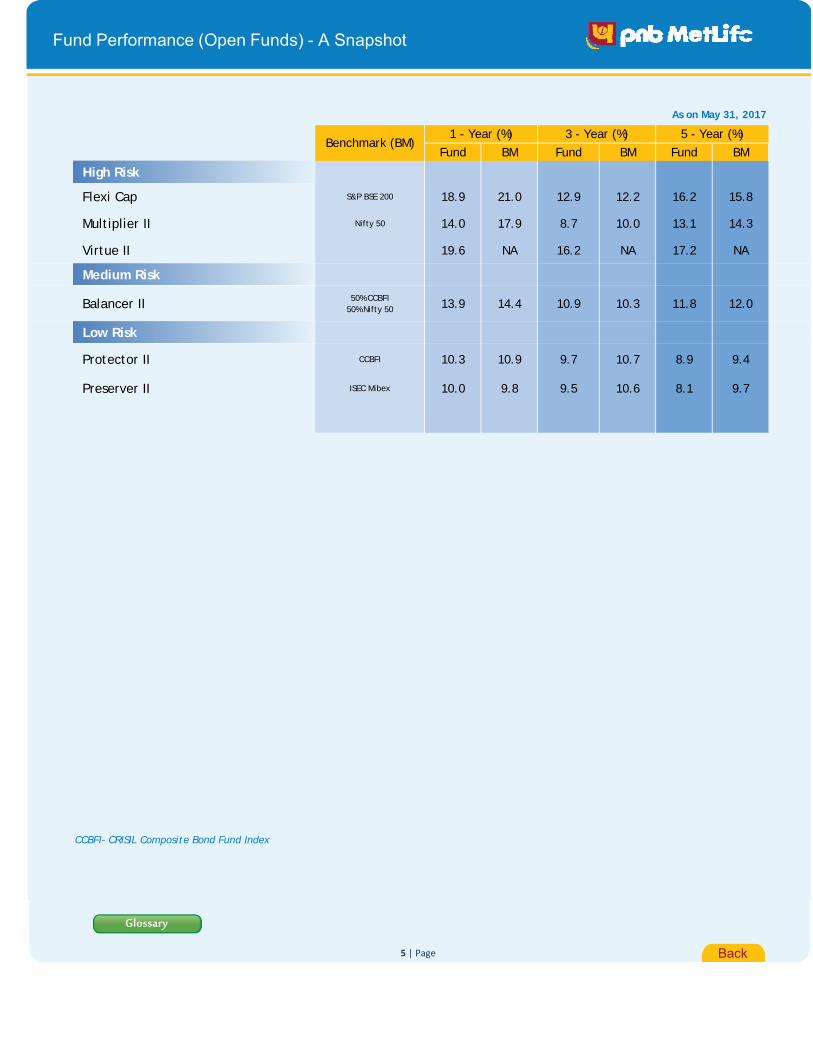
As on May 31, 2017
Fund BM Fund BM Fund BM
High Risk
Flexi Cap S&P BSE 200 18.9 21.0 12.9 12.2 16.2 15.8
Multiplier II Nifty 50 14.0 17.9 8.7 10.0 13.1 14.3
Virtue II 19.6 NA 16.2 NA 17.2 NA
Medium Risk
Balancer II 50% CCBFI50% Nifty 50 13.9 14.4 10.9 10.3 11.8 12.0
Low Risk
Protector II CCBFI 10.3 10.9 9.7 10.7 8.9 9.4
Preserver II ISEC Mibex 10.0 9.8 9.5 10.6 8.1 9.7
CCBFI- CRISIL Composite Bond Fund Index
Benchmark (BM)1 - Year (%) 3 - Year (%) 5 - Year (%)
Back
Glossary
5 | Page
Fund Performance (Open Funds) - A Snapshot

Glossary Back
PreserverII
ProtectorII
Balancer II
MultiplierII
Virtue II
Flexicap
LOW MEDIUM HIGH
Ret
urn
Risk
Open Funds - Funds that are open for sales to new customers
Preserver
Protector
Moderator
Balancer
Accelerator
Multiplier
Virtue
LOW MEDIUM HIGH
Risk
Ret
urn
Closed Funds - Funds that are closed for sales to new customers
6 | Page
MultiplierIII
Liquid
Risk - Return Matrix

Flexi Cap (Open Fund)
Fund Details
AUM as on 31-05-2017
Portfolio Return Asset Classes F&U Actual
Equity 60-100%Cash & Money Market 0-40%
Portfolio ComponentsPortfolio return 1.9% 16.3% 18.9% 7.9% 12.9% 9.6%Benchmark* 2.0% 17.1% 21.0% 8.6% 12.2% 8.9% Security Net Assets
Note: Past returns are not indicative of future performance. TOP 10 EQUITY SECURITIESI T C LTD. 6.6%H D F C BANK LTD. 5.6%
Asset Under Management (AUM) (Rs crores) RELIANCE INDUSTRIES LTD. 4.7%INFOSYS LTD. 3.9%I C I C I BANK LTD. 3.9%R*SHARES BANK BEES ETF 3.8%MARUTI SUZUKI INDIA LTD. 3.1%LARSEN & TOUBRO LTD. 2.7%HOUSING DEVELOPMENT FINANCE CORPN. LTD. 2.7%KOTAK BANKING ETF 2.7%Others 57.2%TOTAL 97.0%
CASH AND MONEY MARKET 3.0%PORTFOLIO TOTAL 100.0%
Sector Allocation (As per NIC Classification*)
NAV Movement
*NIC Classification – Industrial sectors as defined under National Industrial Classification 2008
Fund Manager Funds managed by the Fund Manager
Since Inception
9.7%9.6%
Amit Shah Equity - 4 | Debt - 0 | Balanced - 2
Rs. 605 crore
As on May 31, 2017
As on May 31, 2017
SFIN No: ULIF01315/12/09FLEXICAPFN117
* Benchmark return has been computed by applying benchmark weightages on S&P BSE 200 index for Equity
NAV as on 31-05-2017
Rs. 19.8998
Last 3 Years
Date of Inception: December 22,2009
NA
V (
In R
s.)
Last 6 Months
Last 1Year
Last 2Years
Since05-Jan-10
ReturnsAbsolute Return CAGR Return
97.0%3.0%
Last 1 Month
UNIT-LINKED Fund
Investment Objective: To generate long-term capital appreciation from an actively
managed portfolio of diversified stocks across the market capitalization spectrum.
Investment Philosophy: The fund will target 100% investments in Equities to meet the
stated objectives.
Cash and Money Market
18(3%)
Equity587
(97%)
25%
10%
8%
7%7%
6%
6%
5%
4%
3%
19%
FINANCIAL AND INSURANCE ACTIVITIES
MANUFACTURE OF MOTOR VEHICLES,TRAILERS AND SEMI-TRAILERS
MANUFACTURE OF COKE AND REFINEDPETROLEUM PRODUCTS
COMPUTER PROGRAMMING, CONSULTANCYAND RELATED ACTIVITIES
MANUFACTURE OF TOBACCO PRODUCTS
MUTUAL FUND
INFRASTRUCTURE SECTOR
MANUFACTURE OF CHEMICALS ANDCHEMICAL PRODUCTS
MANUFACTURE OF BASIC METALS
CIVIL ENGINEERING
Others
8
10
12
14
16
18
20
22
Dec-09 Mar-11 Jun-12 Sep-13 Dec-14 Feb-16 May-17
7 | Page
Multiplier II (Open Fund)
Fund Details
AUM as on 31-05-2017
Portfolio Return Asset Classes F&U Actual
Equities 60-100%Money Market Instruments 0-40%
Portfolio ComponentsPortfolio return 2.6% 14.9% 14.0% 5.3% 8.7% 7.9%Benchmark* 3.4% 17.0% 17.9% 6.8% 10.0% 8.4% Security Net Assets
Note: Past returns are not indicative of future performance. TOP 10 EQUITY SECURITIESI T C LTD. 7.8%H D F C BANK LTD. 7.1%
Asset Under Management (AUM) (Rs crores) RELIANCE INDUSTRIES LTD. 6.3%INFOSYS LTD. 5.1%HOUSING DEVELOPMENT FINANCE CORPN. LTD. 4.9%KOTAK BANKING ETF 4.8%LARSEN & TOUBRO LTD. 4.5%I C I C I BANK LTD. 3.9%MARUTI SUZUKI INDIA LTD. 3.6%MAHINDRA & MAHINDRA LTD. 2.6%Others 47.7%TOTAL 98.5%
CASH AND MONEY MARKET 1.5%PORTFOLIO TOTAL 100.0%
Sector Allocation (As per NIC Classification*)
NAV Movement
*NIC Classification – Industrial sectors as defined under National Industrial Classification 2008
Fund Manager Funds managed by the Fund Manager
Since Inception
7.9%9.2%
Amit Shah Equity - 4 | Debt - 0 | Balanced - 2
Rs. 755 crore
As on May 31, 2017
As on May 31, 2017
SFIN No: ULIF01115/12/09MULTIPLIE2117
* Benchmark return has been computed by applying benchmark weightages on Nifty 50 index for Equity
NAV as on 31-05-2017
Rs. 17.5654
Last 3 Years
Date of Inception: December 21,2009
NA
V (
In R
s.)
Last 6 Months
Last 1Year
Last 2Years
Since05-Jan-10
ReturnsAbsolute Return CAGR Return
98.5%1.5%
Last 1 Month
UNIT-LINKED Fund
Investment Objective: To generate long term capital appreciation by investing in
diversified equities.
Investment Philosophy: The fund will target 100% investments in Equities to meet the
stated objectives.
Cash and Money Market
11(2%)
Equity744
(98%)
25%
10%
10%
9%
8%
7%
6%
5%
4%
3%
13%
FINANCIAL AND INSURANCE ACTIVITIES
MANUFACTURE OF MOTOR VEHICLES,TRAILERS AND SEMI-TRAILERS
COMPUTER PROGRAMMING, CONSULTANCYAND RELATED ACTIVITIES
MANUFACTURE OF COKE AND REFINEDPETROLEUM PRODUCTS
MANUFACTURE OF TOBACCO PRODUCTS
MUTUAL FUND
MANUFACTURE OF CHEMICALS AND CHEMICALPRODUCTS
INFRASTRUCTURE SECTOR
CIVIL ENGINEERING
MANUFACTURE OF PHARMACEUTICALS,MEDICINAL CHEMICAL AND BOTANICALPRODUCTSOthers
8
10
12
14
16
18
20
Dec-09 Mar-11 Jun-12 Sep-13 Dec-14 Feb-16 May-17
8 | Page

Multiplier III Fund (Open Fund)
Fund Details
AUM as on 31-05-2017
Portfolio Return Asset Classes F&U Actual
Equities 60-100%Money Market Instruments 0-40%
Portfolio ComponentsPortfolio return 2.6% 14.6% - - - 10.2%Benchmark* 3.4% 17.0% - - - 12.0% Security Net Assets
Note: Past returns are not indicative of future performance. TOP 10 EQUITY SECURITIESI T C LTD. 8.0%H D F C BANK LTD. 6.9%
Asset Under Management (AUM) (Rs crores) RELIANCE INDUSTRIES LTD. 6.3%INFOSYS LTD. 5.1%KOTAK BANKING ETF 4.9%HOUSING DEVELOPMENT FINANCE CORPN. LTD. 4.7%LARSEN & TOUBRO LTD. 4.6%I C I C I BANK LTD. 4.0%MARUTI SUZUKI INDIA LTD. 3.8%MAHINDRA & MAHINDRA LTD. 2.7%Others 45.9%TOTAL 96.9%
CASH AND MONEY MARKET 3.1%PORTFOLIO TOTAL 100.0%
Sector Allocation (As per NIC Classification*)
NAV Movement
*NIC Classification – Industrial sectors as defined under National Industrial Classification 2008
Fund Manager Funds managed by the Fund Manager
* Benchmark return has been computed by applying benchmark weightages on Nifty 50 index for Equity
As on May 31, 2017
SFIN No: ULIF01809/10/15MULTIPLIE3117
Amit Shah Equity - 4 | Debt - 0 | Balanced - 2
Rs. 2.48 crore
As on May 31, 2017
ReturnsAbsolute Return CAGR Return
96.9%3.1%
Last 1 Month
NAV as on 31-05-2017
Rs. 11.0191
Date of Inception: July 26,2016
NA
V (
In R
s.)
Last 6 Months
Last 1Year
Last 2Years
Last 3Years
Since Inception
UNIT-LINKED Fund
Investment Objective: To generate long term capital appreciation by investing in
diversified equities (predominantly large caps).
Investment Philosophy: The fund will target 100% investments in Equities to meet
the stated objectives.
Cash and Money Market0.08(3%)
Equity2.40
(97%)
24%
10%
10%
9%8%
7%
5%
4%
4%
3%
16%
FINANCIAL AND INSURANCE ACTIVITIES
MANUFACTURE OF MOTOR VEHICLES,TRAILERS AND SEMI-TRAILERS
COMPUTER PROGRAMMING, CONSULTANCYAND RELATED ACTIVITIES
MANUFACTURE OF COKE AND REFINEDPETROLEUM PRODUCTS
MANUFACTURE OF TOBACCO PRODUCTS
MUTUAL FUND
CIVIL ENGINEERING
MANUFACTURE OF CHEMICALS ANDCHEMICAL PRODUCTS
INFRASTRUCTURE SECTOR
MANUFACTURE OF BASIC METALS
Others
8
9
10
11
12
Jul-16 Sep-16 Nov-16 Dec-16 Feb-17 Apr-17 May-17
9 | Page
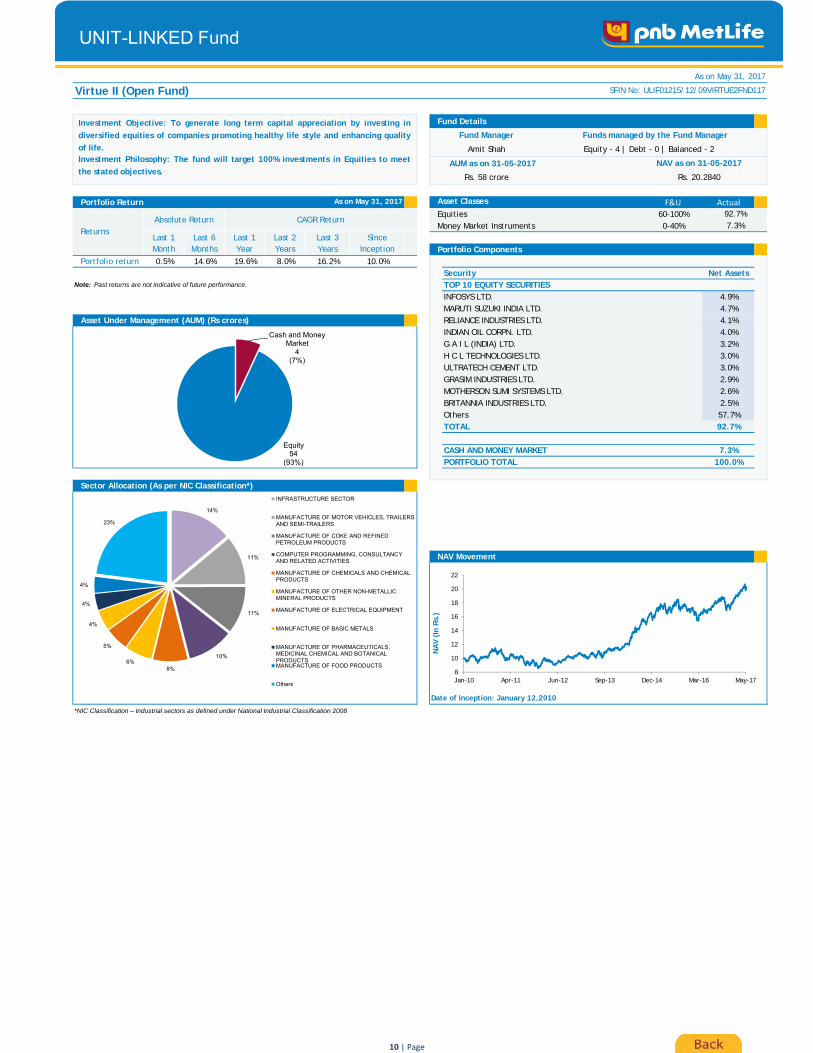
Virtue II (Open Fund)
Fund Details
AUM as on 31-05-2017
Portfolio Return Asset Classes F&U Actual
Equities 60-100%Money Market Instruments 0-40%
Portfolio ComponentsPortfolio return 0.5% 14.6% 19.6% 8.0% 16.2% 10.0%
Security Net AssetsNote: Past returns are not indicative of future performance. TOP 10 EQUITY SECURITIES
INFOSYS LTD. 4.9%MARUTI SUZUKI INDIA LTD. 4.7%
Asset Under Management (AUM) (Rs crores) RELIANCE INDUSTRIES LTD. 4.1%INDIAN OIL CORPN. LTD. 4.0%G A I L (INDIA) LTD. 3.2%H C L TECHNOLOGIES LTD. 3.0%ULTRATECH CEMENT LTD. 3.0%GRASIM INDUSTRIES LTD. 2.9%MOTHERSON SUMI SYSTEMS LTD. 2.6%BRITANNIA INDUSTRIES LTD. 2.5%Others 57.7%TOTAL 92.7%
CASH AND MONEY MARKET 7.3%PORTFOLIO TOTAL 100.0%
Sector Allocation (As per NIC Classification*)
NAV Movement
*NIC Classification – Industrial sectors as defined under National Industrial Classification 2008
Fund Manager Funds managed by the Fund Manager
As on May 31, 2017
SFIN No: ULIF01215/12/09VIRTUE2FND117
Amit Shah Equity - 4 | Debt - 0 | Balanced - 2
Rs. 58 crore
As on May 31, 2017
ReturnsAbsolute Return CAGR Return
92.7%7.3%
Last 1 Month
NAV as on 31-05-2017
Rs. 20.2840
Date of Inception: January 12,2010
NA
V (
In R
s.)
Last 6 Months
Last 1Year
Last 2Years
Last 3Years
Since Inception
UNIT-LINKED Fund
Investment Objective: To generate long term capital appreciation by investing in
diversified equities of companies promoting healthy life style and enhancing quality
of life.Investment Philosophy: The fund will target 100% investments in Equities to meet
the stated objectives.
Cash and Money Market
4(7%)
Equity54
(93%)
14%
11%
11%
10%
8%6%
5%
4%
4%
4%
23%
INFRASTRUCTURE SECTOR
MANUFACTURE OF MOTOR VEHICLES, TRAILERSAND SEMI-TRAILERS
MANUFACTURE OF COKE AND REFINEDPETROLEUM PRODUCTS
COMPUTER PROGRAMMING, CONSULTANCYAND RELATED ACTIVITIES
MANUFACTURE OF CHEMICALS AND CHEMICALPRODUCTS
MANUFACTURE OF OTHER NON-METALLICMINERAL PRODUCTS
MANUFACTURE OF ELECTRICAL EQUIPMENT
MANUFACTURE OF BASIC METALS
MANUFACTURE OF PHARMACEUTICALS,MEDICINAL CHEMICAL AND BOTANICALPRODUCTSMANUFACTURE OF FOOD PRODUCTS
Others
8
10
12
14
16
18
20
22
Jan-10 Apr-11 Jun-12 Sep-13 Dec-14 Mar-16 May-17
10 | Page

Balancer II (Open Fund)
Fund Details
AUM as on 31-05-2017 NAV as on 31-05-2017
Rs. 18.1815Portfolio Return
Asset Classes F&U Actual
Government & Other Debt Securities 0-60%Equity 0-60%Cash & Money Market 0-40%
Portfolio return 1.9% 7.9% 13.9% 8.3% 10.9% 8.4%Benchmark* 2.4% 8.9% 14.4% 8.4% 10.3% 8.4% Portfolio Components
Note: Past returns are not indicative of future performance.
Security Rating Net AssetsTOP 10 GOVERNMENT SECURITIES
Asset Under Management (AUM) (Rs crores) 9.2% GOI 2030 Sovereign 3.2%9.23% GOI 2043 Sovereign 3.0%7.61% GOI 2030 Sovereign 2.4%8.17% GOI 2044 Sovereign 2.2%8.38% SDL 2026 Sovereign 1.4%8.27% SDL 2026 Sovereign 1.4%8.25% SDL 2025 Sovereign 1.4%7.59% GOI 2029 Sovereign 1.4%6.79% GOI 2027 Sovereign 1.4%6.79% GOI 2029 Sovereign 1.4%Others 1.5%TOTAL 20.7%
TOP 10 CORPORATE BONDSSector Allocation (As per NIC Classification*) RURAL ELECTRIFICATION CORPN. LTD. AAA 5.9%
POWER GRID CORPN. OF INDIA LTD. AAA 5.2%RELIANCE GAS TRANSPORTATION INFRASTRUCTURE AAA 1.8%L I C HOUSING FINANCE LTD. AAA 1.5%POWER FINANCE CORPN. LTD. AAA 1.4%G A I L (INDIA) LTD. AAA 1.4%SUNDARAM FINANCE LTD AA+ 0.6%HOUSING DEVELOPMENT FINANCE CORPN. LTD. AAA 0.5%IDFC BANK LIMITED AAA 0.4%INFRASTRUCTURE LEASING & FINANCIAL SERVICES AAA 0.3%Others 0.3%TOTAL 19.4%
TOP 10 EQUITY SECURITIESH D F C BANK LTD. 4.3%I T C LTD. 4.0%RELIANCE INDUSTRIES LTD. 2.9%HOUSING DEVELOPMENT FINANCE CORPN. LTD. 2.8%I C I C I BANK LTD. 2.5%
*NIC Classification – Industrial sectors as defined under National Industrial Classification 2008 INFOSYS LTD. 2.3%Credit Rating Profile LARSEN & TOUBRO LTD. 2.1%
MARUTI SUZUKI INDIA LTD. 2.0%STATE BANK OF INDIA 1.5%MAHINDRA & MAHINDRA LTD. 1.5%Others 27.2%TOTAL 52.9%
CASH AND MONEY MARKET 7.0%PORTFOLIO TOTAL 100.0%
Maturity by Profile NAV Movement
8.4%8.9%
Equity - 0 | Debt - 7 | Balanced - 5
Rs. 365 croreAs on May 31, 2017
CAGR Return40.1%52.9%Last 1
Month
As on May 31, 2017
SFIN No: ULIF01015/12/09BALANCER2F117
Fund Manager Funds managed by the Fund Manager
Since Inception
Date of Inception: December 20,2009
NA
V (
In R
s.)
* Benchmark return has been computed by applying benchmark weightages on CRISIL Composite Bond Fund Index index for Debt and Nifty 50 index for Equity
Amit Shah Equity - 4 | Debt - 0 | Balanced - 2
Modified Duration(Debt and Money Market)
5.2
7.0%Last 3 Years
Last 6 Months
Last 1Year
Last 2Years
Since05-Jan-10
Himanshu Shethia
ReturnsAbsolute Return
UNIT-LINKED Fund
Investment Objective: To generate capital appreciation and current income, through
a judicious mix of investments in equities and fixed income securities.
Investment Philosophy: The fund will target 50% investments in Equities and 50%
investments in Government & other debt securities to meet the stated objectives.
Cash and Money Market
26(7%)
Debt146
(40%)
Equity193
(53%)
21%
19%
19%
6%
5%
4%
4%
2%
2%
2%
16%
GOVERNMENT OF INDIA
INFRASTRUCTURE SECTOR
FINANCIAL AND INSURANCE ACTIVITIES
MANUFACTURE OF MOTOR VEHICLES,TRAILERS AND SEMI-TRAILERS
COMPUTER PROGRAMMING, CONSULTANCYAND RELATED ACTIVITIES
MANUFACTURE OF COKE AND REFINEDPETROLEUM PRODUCTS
MANUFACTURE OF TOBACCO PRODUCTS
MANUFACTURE OF CHEMICALS ANDCHEMICAL PRODUCTS
CIVIL ENGINEERING
HOUSING SECTOR
Others
Government Securities
52%
AAA47%
AA+1%
< 1 Year13%
1 to 3 years4%
3 to 7 Years9%
> 7 Years74%
9
10
11
12
13
14
15
16
17
18
19
Dec-09 Mar-11 Jun-12 Sep-13 Dec-14 Feb-16 May-17
11 | Page
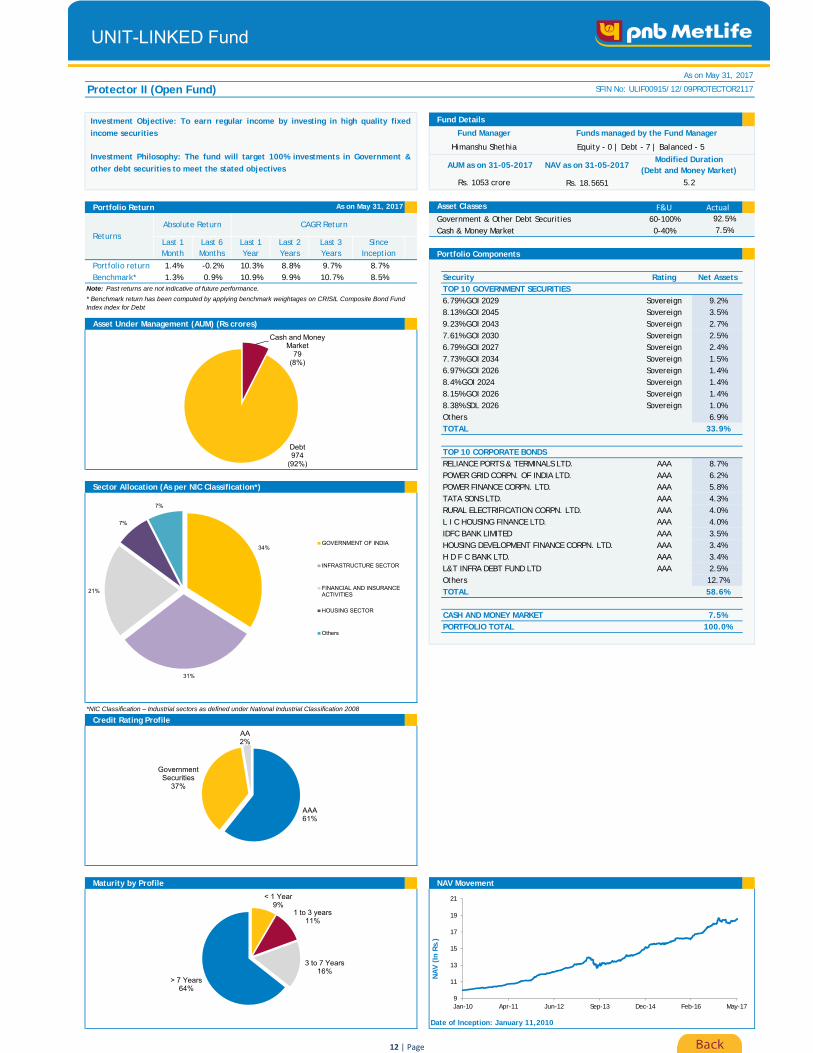
Protector II (Open Fund)
Fund Details
AUM as on 31-05-2017 NAV as on 31-05-2017
Rs. 18.5651
Portfolio Return Asset Classes F&U Actual
Government & Other Debt Securities 60-100%Cash & Money Market 0-40%
Portfolio ComponentsPortfolio return 1.4% -0.2% 10.3% 8.8% 9.7% 8.7%Benchmark* 1.3% 0.9% 10.9% 9.9% 10.7% 8.5% Security Rating Net Assets
Note: Past returns are not indicative of future performance. TOP 10 GOVERNMENT SECURITIES6.79% GOI 2029 Sovereign 9.2%8.13% GOI 2045 Sovereign 3.5%
Asset Under Management (AUM) (Rs crores) 9.23% GOI 2043 Sovereign 2.7%7.61% GOI 2030 Sovereign 2.5%6.79% GOI 2027 Sovereign 2.4%7.73% GOI 2034 Sovereign 1.5%6.97% GOI 2026 Sovereign 1.4%8.4% GOI 2024 Sovereign 1.4%8.15% GOI 2026 Sovereign 1.4%8.38% SDL 2026 Sovereign 1.0%Others 6.9%TOTAL 33.9%
TOP 10 CORPORATE BONDSRELIANCE PORTS & TERMINALS LTD. AAA 8.7%POWER GRID CORPN. OF INDIA LTD. AAA 6.2%
Sector Allocation (As per NIC Classification*) POWER FINANCE CORPN. LTD. AAA 5.8%TATA SONS LTD. AAA 4.3%RURAL ELECTRIFICATION CORPN. LTD. AAA 4.0%L I C HOUSING FINANCE LTD. AAA 4.0%IDFC BANK LIMITED AAA 3.5%HOUSING DEVELOPMENT FINANCE CORPN. LTD. AAA 3.4%H D F C BANK LTD. AAA 3.4%L&T INFRA DEBT FUND LTD AAA 2.5%Others 12.7%TOTAL 58.6%
CASH AND MONEY MARKET 7.5%PORTFOLIO TOTAL 100.0%
*NIC Classification – Industrial sectors as defined under National Industrial Classification 2008
Credit Rating Profile
Maturity by Profile NAV Movement
Fund Manager Funds managed by the Fund Manager
As on May 31, 2017
SFIN No: ULIF00915/12/09PROTECTOR2117
Himanshu Shethia Equity - 0 | Debt - 7 | Balanced - 5
Rs. 1053 crore
As on May 31, 2017
ReturnsAbsolute Return CAGR Return
92.5%7.5%
Last 1 Month
* Benchmark return has been computed by applying benchmark weightages on CRISIL Composite Bond Fund Index index for Debt
Modified Duration(Debt and Money Market)
5.2
Date of Inception: January 11,2010
NA
V (
In R
s.)
Last 6 Months
Last 1Year
Last 2Years
Last 3Years
Since Inception
UNIT-LINKED Fund
Investment Objective: To earn regular income by investing in high quality fixed
income securities
Investment Philosophy: The fund will target 100% investments in Government &
other debt securities to meet the stated objectives
Cash and Money Market
79(8%)
Debt974
(92%)
34%
31%
21%
7%
7%
GOVERNMENT OF INDIA
INFRASTRUCTURE SECTOR
FINANCIAL AND INSURANCEACTIVITIES
HOUSING SECTOR
Others
AAA61%
Government Securities
37%
AA2%
< 1 Year9%
1 to 3 years11%
3 to 7 Years16%
> 7 Years64%
9
11
13
15
17
19
21
Jan-10 Apr-11 Jun-12 Sep-13 Dec-14 Feb-16 May-17
12 | Page
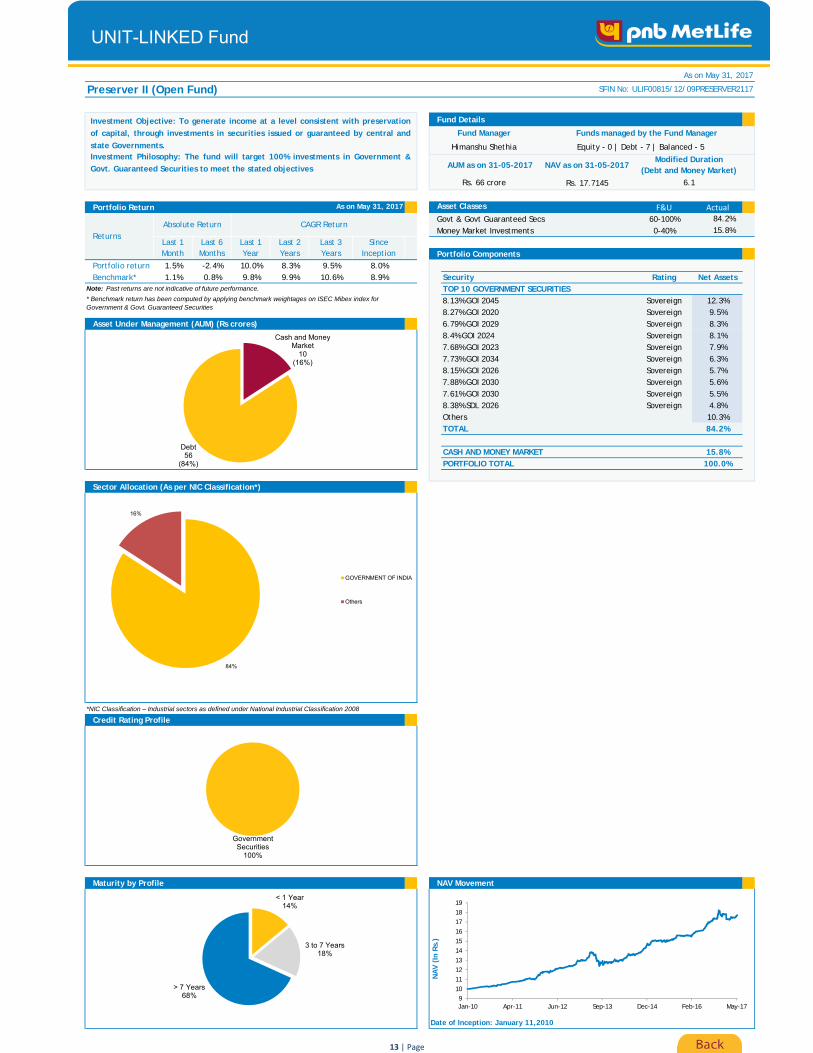
Preserver II (Open Fund)
Fund Details
AUM as on 31-05-2017 NAV as on 31-05-2017
Rs. 17.7145
Portfolio Return Asset Classes F&U Actual
Govt & Govt Guaranteed Secs 60-100%Money Market Investments 0-40%
Portfolio ComponentsPortfolio return 1.5% -2.4% 10.0% 8.3% 9.5% 8.0%Benchmark* 1.1% 0.8% 9.8% 9.9% 10.6% 8.9% Security Rating Net Assets
Note: Past returns are not indicative of future performance. TOP 10 GOVERNMENT SECURITIES8.13% GOI 2045 Sovereign 12.3%8.27% GOI 2020 Sovereign 9.5%
Asset Under Management (AUM) (Rs crores) 6.79% GOI 2029 Sovereign 8.3%8.4% GOI 2024 Sovereign 8.1%7.68% GOI 2023 Sovereign 7.9%7.73% GOI 2034 Sovereign 6.3%8.15% GOI 2026 Sovereign 5.7%7.88% GOI 2030 Sovereign 5.6%7.61% GOI 2030 Sovereign 5.5%8.38% SDL 2026 Sovereign 4.8%Others 10.3%TOTAL 84.2%
CASH AND MONEY MARKET 15.8%PORTFOLIO TOTAL 100.0%
Sector Allocation (As per NIC Classification*)
*NIC Classification – Industrial sectors as defined under National Industrial Classification 2008
Credit Rating Profile
Maturity by Profile NAV Movement
Fund Manager Funds managed by the Fund Manager
As on May 31, 2017
SFIN No: ULIF00815/12/09PRESERVER2117
Himanshu Shethia Equity - 0 | Debt - 7 | Balanced - 5
Rs. 66 crore
As on May 31, 2017
ReturnsAbsolute Return CAGR Return
84.2%15.8%
Last 1 Month
* Benchmark return has been computed by applying benchmark weightages on ISEC Mibex index for Government & Govt. Guaranteed Securities
Modified Duration(Debt and Money Market)
6.1
Date of Inception: January 11,2010
NA
V (
In R
s.)
Last 6 Months
Last 1Year
Last 2Years
Last 3Years
Since Inception
UNIT-LINKED Fund
Investment Objective: To generate income at a level consistent with preservation
of capital, through investments in securities issued or guaranteed by central and
state Governments.Investment Philosophy: The fund will target 100% investments in Government &
Govt. Guaranteed Securities to meet the stated objectives
Cash and Money Market
10(16%)
Debt56
(84%)
84%
16%
GOVERNMENT OF INDIA
Others
Government Securities
100%
< 1 Year14%
3 to 7 Years18%
> 7 Years68% 9
10
11
12
13
14
15
16
17
18
19
Jan-10 Apr-11 Jun-12 Sep-13 Dec-14 Feb-16 May-17
13 | Page

Liquid Fund (Open Fund)
Fund Details
AUM as on 31-05-2017 NAV as on 31-05-2017
Rs. 10.4096
Portfolio Return Asset Classes F&U Actual
Money Market Instruments 0-100%
Portfolio ComponentsPortfolio return 0.4% 2.3% - - - 4.1%Benchmark* 0.5% 2.9% - - - 5.2% Security Net Assets
Note: Past returns are not indicative of future performance. CASH AND MONEY MARKET 100.0%PORTFOLIO TOTAL 100.0%
Asset Under Management (AUM) (Rs crores)
Sector Allocation (As per NIC Classification*)
*NIC Classification – Industrial sectors as defined under National Industrial Classification 2008
Maturity by Profile NAV Movement
* Benchmark return has been computed by applying benchmark weightages on CRISIL CBLO index for CBLO
Modified Duration(Debt and Money Market)
-
Date of Inception: July 26,2016
NA
V (
In R
s.)
Last 6 Months
Last 1Year
Last 2Years
Last 3Years
Since Inception
Himanshu Shethia Equity - 0 | Debt - 7 | Balanced - 5
Rs. 0.39 crore
As on May 31, 2017
ReturnsAbsolute Return CAGR Return
100.0%
Last 1 Month
Fund Manager Funds managed by the Fund Manager
As on May 31, 2017
SFIN No: ULIF01909/10/15LIQUIDFUND117
UNIT-LINKED Fund
Investment Objective: To generate stable returns by investing in very short term
debt and money market instruments.
Investment Philosophy: The fund will target 100% investments in Government &
other debt securities to meet the stated objectives.
Cash and Money Market0.39
(100%)
100%
Others
< 1 Year100%
9.8
9.9
10
10.1
10.2
10.3
10.4
10.5
10.6
Jul-16 Sep-16 Nov-16 Dec-16 Feb-17 Apr-17 May-17
14 | Page

As on May 31, 2017
Fund BM Fund BM Fund BM Fund BM
High Risk
Accelerator 20% CCBFI80% Nifty 50 13.3 16.5 8.9 10.1 12.0 13.4 7.7 8.3
Multiplier Nifty 50 13.4 17.9 8.0 10.0 12.4 14.3 7.1 8.4
Virtue 18.0 NA 14.9 NA 16.2 NA NA NA
Medium Risk
Balancer 50% CCBFI50% Nifty 50 11.8 14.4 9.0 10.3 10.6 12.0 8.1 8.3
Moderator 80% CCBFI20% Nifty 50 9.8 12.3 8.9 10.5 8.9 10.5 8.0 8.2
Low Risk
Protector CCBFI 9.3 10.9 9.1 10.7 8.1 9.4 8.2 8.1
Preserver ISEC Mibex 9.5 9.8 9.1 10.6 7.5 9.7 7.1 8.7
CCBFI- CRISIL Composite Bond Fund Index
10 - Year (%)Benchmark (BM)
1 - Year (%) 3 - Year (%) 5 - Year (%)
Back
Glossary
15 | Page
Fund Performance (Closed Funds) - A Snapshot

Multiplier (Closed Fund)
Fund Details
AUM as on 31-05-2017
Portfolio Return Asset Classes F&U Actual
Listed Equities 80-100%Money Market Investments 0-40%
Portfolio ComponentsPortfolio return 2.5% 14.5% 13.4% 4.6% 8.0% 11.7%Benchmark* 3.4% 17.0% 17.9% 6.8% 10.0% 13.2% Security Net Assets
Note: Past returns are not indicative of future performance. TOP 10 EQUITY SECURITIESI T C LTD. 7.7%H D F C BANK LTD. 6.9%
Asset Under Management (AUM) (Rs crores) RELIANCE INDUSTRIES LTD. 6.6%INFOSYS LTD. 5.1%HOUSING DEVELOPMENT FINANCE CORPN. LTD. 4.2%KOTAK BANKING ETF 4.2%LARSEN & TOUBRO LTD. 4.2%I C I C I BANK LTD. 4.1%MARUTI SUZUKI INDIA LTD. 3.4%POWER GRID CORPN. OF INDIA LTD. 3.0%Others 48.3%TOTAL 97.7%
CASH AND MONEY MARKET 2.3%PORTFOLIO TOTAL 100.0%
Sector Allocation (As per NIC Classification*)
NAV Movement
*NIC Classification – Industrial sectors as defined under National Industrial Classification 2008
Fund Manager Funds managed by the Fund Manager
As on May 31, 2017
SFIN No: ULIF00625/01/05MULTIPLIER117
Deb Bhattacharya Equity - 2 | Debt - 0 | Balanced - 3
Rs. 2013 crore
As on May 31, 2017
ReturnsAbsolute Return CAGR Return
97.7%2.3%
Last 1 Month
* Benchmark return has been computed by applying benchmark weightages on Nifty 50 index for Equity
NAV as on 31-05-2017
Rs. 39.0361
Date of Inception: February 07,2005
NA
V (
In R
s.)
Last 6 Months
Last 1Year
Last 2Years
Last 3Years
Since Inception
UNIT-LINKED Fund
Investment Objective: To generate long term capital appreciation by investing in
diversified equities.
Investment Philosophy: The fund will target 100% investments in Equities to meet
the stated objectives.
Cash and Money Market
47(2%)
Equity1966(98%)
25%
10%
9%
9%8%
6%
6%
5%
4%
4%
14%
FINANCIAL AND INSURANCE ACTIVITIES
MANUFACTURE OF MOTOR VEHICLES, TRAILERSAND SEMI-TRAILERS
COMPUTER PROGRAMMING, CONSULTANCYAND RELATED ACTIVITIES
MANUFACTURE OF COKE AND REFINEDPETROLEUM PRODUCTS
MANUFACTURE OF TOBACCO PRODUCTS
MUTUAL FUND
INFRASTRUCTURE SECTOR
MANUFACTURE OF CHEMICALS AND CHEMICALPRODUCTS
CIVIL ENGINEERING
MANUFACTURE OF PHARMACEUTICALS,MEDICINAL CHEMICAL AND BOTANICALPRODUCTSOthers
8
13
18
23
28
33
38
43
Feb-05 Feb-07 Mar-09 Mar-11 Apr-13 May-15 May-17
16 | Page

Virtue (Closed Fund)
Fund Details
AUM as on 31-05-2017
Portfolio Return Asset Classes F&U Actual
Listed Equities 60-100%Money Market Instruments 0-40%
Portfolio ComponentsPortfolio return 0.0% 13.3% 18.0% 6.3% 14.9% 7.7%
Security Net AssetsNote: Past returns are not indicative of future performance. TOP 10 EQUITY SECURITIES
RELIANCE INDUSTRIES LTD. 5.3%INFOSYS LTD. 5.2%
Asset Under Management (AUM) (Rs crores) MARUTI SUZUKI INDIA LTD. 4.2%INDIAN OIL CORPN. LTD. 4.0%ULTRATECH CEMENT LTD. 3.6%H C L TECHNOLOGIES LTD. 3.1%G A I L (INDIA) LTD. 2.9%GRASIM INDUSTRIES LTD. 2.8%CROMPTON GREAVES CONSUMER ELECTRICAL 2.6%WABCO INDIA LTD. 2.4%Others 58.5%TOTAL 94.5%
CASH AND MONEY MARKET 5.5%PORTFOLIO TOTAL 100.0%
Sector Allocation (As per NIC Classification*)
NAV Movement
*NIC Classification – Industrial sectors as defined under National Industrial Classification 2008
Fund Manager Funds managed by the Fund Manager
As on May 31, 2017
SFIN No: ULIF00719/02/08VIRTUEFUND117
Deb Bhattacharya Equity - 2 | Debt - 0 | Balanced - 3
Rs. 100 crore
As on May 31, 2017
ReturnsAbsolute Return CAGR Return
94.5%5.5%
Last 1 Month
NAV as on 31-05-2017
Rs. 19.7971
Date of Inception: February 27,2008
NA
V (
In R
s.)
Last 6 Months
Last 1Year
Last 2Years
Last 3Years
Since Inception
UNIT-LINKED Fund
Investment Objective: To generate long term capital appreciation by investing in
diversified equities of companies promoting healthy life style and enhancing quality
of life.Investment Philosophy: The fund will target 100% investments in Equities to meet
the stated objectives.
Cash and Money Market
5(5%)
Equity95
(95%)
16%
12%
12%
9%7%
6%
6%
5%
4%
3%
20%
INFRASTRUCTURE SECTOR
MANUFACTURE OF COKE AND REFINEDPETROLEUM PRODUCTS
COMPUTER PROGRAMMING, CONSULTANCYAND RELATED ACTIVITIES
MANUFACTURE OF MOTOR VEHICLES, TRAILERSAND SEMI-TRAILERS
MANUFACTURE OF CHEMICALS AND CHEMICALPRODUCTS
MANUFACTURE OF OTHER NON-METALLICMINERAL PRODUCTS
MANUFACTURE OF ELECTRICAL EQUIPMENT
MANUFACTURE OF BASIC METALS
MANUFACTURE OF PHARMACEUTICALS,MEDICINAL CHEMICAL AND BOTANICALPRODUCTSCIVIL ENGINEERING
Others
5
7
9
11
13
15
17
19
21
Feb-08 Sep-09 Mar-11 Oct-12 Apr-14 Nov-15 May-17
17 | Page

Accelerator (Closed Fund)
Fund Details
AUM as on 31-05-2017 NAV as on 31-05-2017
Rs. 37.8943Portfolio Return
Asset Classes F&U Actual
Govt & Govt Guaranteed Secs 0-40%Infrastructure and Social Sector Secs 0-40%Listed Equities 60-95%
Portfolio return 2.3% 11.7% 13.3% 5.8% 8.9% 11.4% Long Term Bonds 0-60%Benchmark* 3.0% 13.8% 16.5% 7.4% 10.1% 12.3% Short Term Bonds 0-35%
Note: Past returns are not indicative of future performance. Money Market Investments 0-40%
Portfolio ComponentsAsset Under Management (AUM) (Rs crores)
Security Rating Net AssetsGOVERNMENT SECURITIES9.23% GOI 2043 Sovereign 2.2%7.61% GOI 2030 Sovereign 2.1%8.13% GOI 2045 Sovereign 0.9%TOTAL 5.2%
CORPORATE BONDSRELIANCE GAS TRANSPORTATION INFRASTRUCTURE AAA 6.3%L I C HOUSING FINANCE LTD. AAA 4.5%G A I L (INDIA) LTD. AAA 2.0%TOTAL 12.8%
Sector Allocation (As per NIC Classification*) TOP 10 EQUITY SECURITIESH D F C BANK LTD. 7.6%I T C LTD. 6.2%RELIANCE INDUSTRIES LTD. 5.5%HOUSING DEVELOPMENT FINANCE CORPN. LTD. 4.2%INFOSYS LTD. 4.1%LARSEN & TOUBRO LTD. 4.0%I C I C I BANK LTD. 3.6%MARUTI SUZUKI INDIA LTD. 2.9%MAHINDRA & MAHINDRA LTD. 2.3%POWER GRID CORPN. OF INDIA LTD. 2.3%Others 37.8%TOTAL 80.6%
CASH AND MONEY MARKET 1.4%PORTFOLIO TOTAL 100.0%
*NIC Classification – Industrial sectors as defined under National Industrial Classification 2008
Credit Rating Profile
Maturity by Profile NAV Movement
Last 1 Month
Fund Manager Funds managed by the Fund Manager
As on May 31, 2017
SFIN No: ULIF00525/01/05ACCELERATO117
As on May 31, 2017
Last 6 Months
Last 1Year
Last 2Years
Last 3Years
Since Inception
Returns
Date of Inception: February 07,2005
NA
V (
In R
s.)
* Benchmark return has been computed by applying benchmark weightages on CRISIL Composite Bond Fund Index index for Debt and Nifty 50 index for Equity
4.4%0.1%1.4%
Absolute Return CAGR Return5.2%
Deb Bhattacharya Equity - 2 | Debt - 0 | Balanced - 3
Modified Duration(Debt and Money Market)
4.7
80.6%
Himanshu Shethia Equity - 0 | Debt - 7 | Balanced - 5
Rs. 245 crore
8.3%
UNIT-LINKED Fund
Investment Objective: To achieve capital appreciation by investing predominantly
in equities, with limited investment in fixed income securities.
Investment Philosophy: The fund will target 80% investments in Equities and 20%
investments in Government & other debt securities to meet the stated objectives.
Cash and Money Market
3(1%)
Debt44
(18%)
Equity198
(81%)
24%
12%
8%
8%7%
6%
6%
5%
5%
4%
15%
FINANCIAL AND INSURANCE ACTIVITIES
INFRASTRUCTURE SECTOR
MANUFACTURE OF MOTOR VEHICLES,TRAILERS AND SEMI-TRAILERS
COMPUTER PROGRAMMING,CONSULTANCY AND RELATED ACTIVITIES
MANUFACTURE OF COKE AND REFINEDPETROLEUM PRODUCTS
MANUFACTURE OF TOBACCO PRODUCTS
MANUFACTURE OF CHEMICALS ANDCHEMICAL PRODUCTS
GOVERNMENT OF INDIA
HOUSING SECTOR
CIVIL ENGINEERING
Others
AAA71%
Government Securities
29%
< 1 Year4%
3 to 7 Years68%
> 7 Years28%
8
13
18
23
28
33
38
43
Feb-05 Feb-07 Mar-09 Mar-11 Apr-13 May-15 May-17
18 | Page
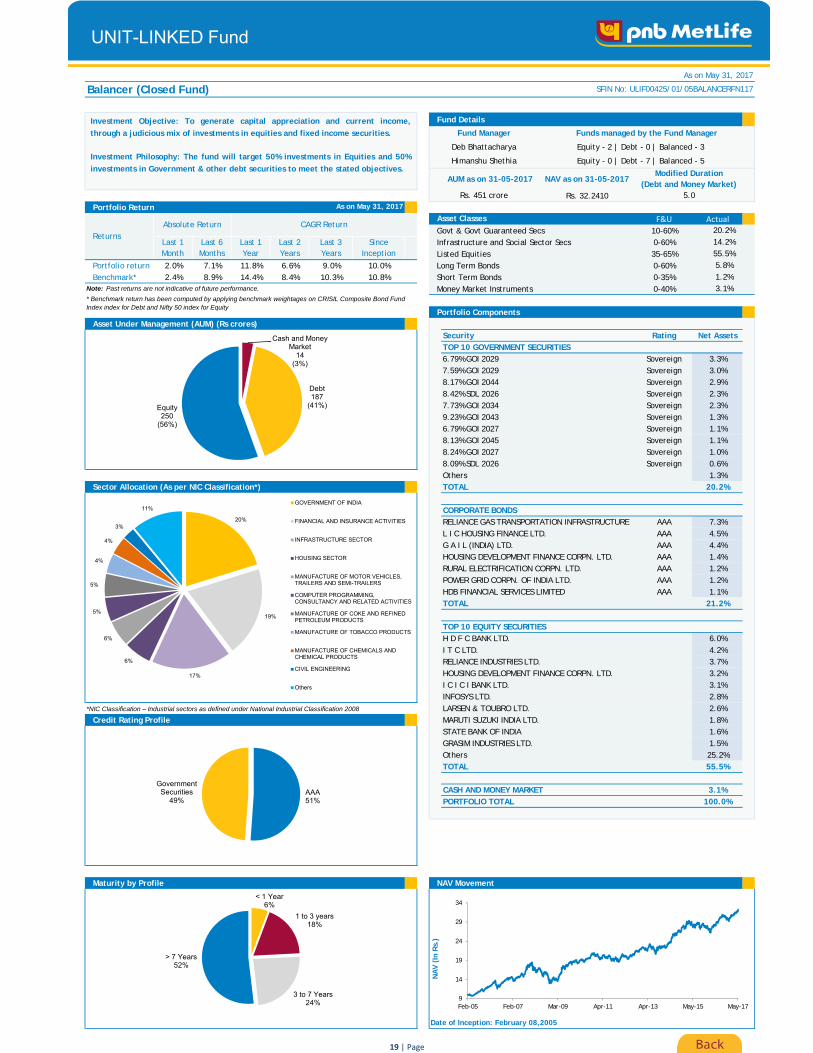
Balancer (Closed Fund)
Fund Details
AUM as on 31-05-2017 NAV as on 31-05-2017
Rs. 32.2410Portfolio Return
Asset Classes F&U Actual
Govt & Govt Guaranteed Secs 10-60%Infrastructure and Social Sector Secs 0-60%Listed Equities 35-65%
Portfolio return 2.0% 7.1% 11.8% 6.6% 9.0% 10.0% Long Term Bonds 0-60%Benchmark* 2.4% 8.9% 14.4% 8.4% 10.3% 10.8% Short Term Bonds 0-35%
Note: Past returns are not indicative of future performance. Money Market Instruments 0-40%
Portfolio ComponentsAsset Under Management (AUM) (Rs crores)
Security Rating Net AssetsTOP 10 GOVERNMENT SECURITIES6.79% GOI 2029 Sovereign 3.3%7.59% GOI 2029 Sovereign 3.0%8.17% GOI 2044 Sovereign 2.9%8.42% SDL 2026 Sovereign 2.3%7.73% GOI 2034 Sovereign 2.3%9.23% GOI 2043 Sovereign 1.3%6.79% GOI 2027 Sovereign 1.1%8.13% GOI 2045 Sovereign 1.1%8.24% GOI 2027 Sovereign 1.0%8.09% SDL 2026 Sovereign 0.6%Others 1.3%
Sector Allocation (As per NIC Classification*) TOTAL 20.2%
CORPORATE BONDSRELIANCE GAS TRANSPORTATION INFRASTRUCTURE AAA 7.3%L I C HOUSING FINANCE LTD. AAA 4.5%G A I L (INDIA) LTD. AAA 4.4%HOUSING DEVELOPMENT FINANCE CORPN. LTD. AAA 1.4%RURAL ELECTRIFICATION CORPN. LTD. AAA 1.2%POWER GRID CORPN. OF INDIA LTD. AAA 1.2%HDB FINANCIAL SERVICES LIMITED AAA 1.1%TOTAL 21.2%
TOP 10 EQUITY SECURITIESH D F C BANK LTD. 6.0%I T C LTD. 4.2%RELIANCE INDUSTRIES LTD. 3.7%HOUSING DEVELOPMENT FINANCE CORPN. LTD. 3.2%I C I C I BANK LTD. 3.1%INFOSYS LTD. 2.8%
*NIC Classification – Industrial sectors as defined under National Industrial Classification 2008 LARSEN & TOUBRO LTD. 2.6%Credit Rating Profile MARUTI SUZUKI INDIA LTD. 1.8%
STATE BANK OF INDIA 1.6%GRASIM INDUSTRIES LTD. 1.5%Others 25.2%TOTAL 55.5%
CASH AND MONEY MARKET 3.1%PORTFOLIO TOTAL 100.0%
Maturity by Profile NAV Movement
Last 1 Month
Fund Manager Funds managed by the Fund Manager
As on May 31, 2017
SFIN No: ULIF00425/01/05BALANCERFN117
As on May 31, 2017
Last 6 Months
Last 1Year
Last 2Years
Last 3Years
Since Inception
Returns
Date of Inception: February 08,2005
NA
V (
In R
s.)
* Benchmark return has been computed by applying benchmark weightages on CRISIL Composite Bond Fund Index index for Debt and Nifty 50 index for Equity
5.8%1.2%3.1%
Absolute Return CAGR Return20.2%
Deb Bhattacharya Equity - 2 | Debt - 0 | Balanced - 3
Modified Duration(Debt and Money Market)
5.0
55.5%
Himanshu Shethia Equity - 0 | Debt - 7 | Balanced - 5
Rs. 451 crore
14.2%
UNIT-LINKED Fund
Investment Objective: To generate capital appreciation and current income,
through a judicious mix of investments in equities and fixed income securities.
Investment Philosophy: The fund will target 50% investments in Equities and 50%
investments in Government & other debt securities to meet the stated objectives.
Cash and Money Market
14(3%)
Debt187
(41%)Equity250
(56%)
20%
19%
17%
6%
6%
5%
5%
4%
4%
3%
11%GOVERNMENT OF INDIA
FINANCIAL AND INSURANCE ACTIVITIES
INFRASTRUCTURE SECTOR
HOUSING SECTOR
MANUFACTURE OF MOTOR VEHICLES,TRAILERS AND SEMI-TRAILERS
COMPUTER PROGRAMMING,CONSULTANCY AND RELATED ACTIVITIES
MANUFACTURE OF COKE AND REFINEDPETROLEUM PRODUCTS
MANUFACTURE OF TOBACCO PRODUCTS
MANUFACTURE OF CHEMICALS ANDCHEMICAL PRODUCTS
CIVIL ENGINEERING
Others
AAA51%
Government Securities
49%
< 1 Year6%
1 to 3 years18%
3 to 7 Years24%
> 7 Years52%
9
14
19
24
29
34
Feb-05 Feb-07 Mar-09 Apr-11 Apr-13 May-15 May-17
19 | Page

Moderator (Closed Fund)
Fund Details
AUM as on 31-05-2017 NAV as on 31-05-2017
Rs. 26.5935Portfolio Return
Asset Classes F&U Actual
Govt & Govt Guaranteed Secs 10-60%Infrastructure and Social Sector Secs 0-60%Listed Equities 10-30%
Portfolio return 1.4% 2.1% 9.8% 7.1% 8.9% 8.3% Long Term Bonds 0-60%Benchmark* 1.8% 4.1% 12.3% 9.3% 10.5% 8.9% Short Term Bonds 0-35%
Note: Past returns are not indicative of future performance. Money Market Investments 0-40%
Portfolio ComponentsAsset Under Management (AUM) (Rs crores)
Security Rating Net AssetsGOVERNMENT SECURITIES9.2% GOI 2030 Sovereign 26.5%9.23% GOI 2043 Sovereign 11.1%8.13% GOI 2021 Sovereign 0.1%TOTAL 37.7%
CORPORATE BONDSG A I L (INDIA) LTD. AAA 9.2%HOUSING DEVELOPMENT FINANCE CORPN. LTD. AAA 5.3%HDB FINANCIAL SERVICES LIMITED AAA 4.7%TOTAL 19.3%
Sector Allocation (As per NIC Classification*) TOP 10 EQUITY SECURITIESH D F C BANK LTD. 2.6%I T C LTD. 1.7%RELIANCE INDUSTRIES LTD. 1.5%HOUSING DEVELOPMENT FINANCE CORPN. LTD. 1.4%INFOSYS LTD. 1.1%LARSEN & TOUBRO LTD. 1.1%I C I C I BANK LTD. 1.0%MARUTI SUZUKI INDIA LTD. 0.7%KOTAK MAHINDRA BANK LTD. 0.6%TATA MOTORS LTD. 0.6%Others 9.9%TOTAL 22.1%
CASH AND MONEY MARKET 21.0%PORTFOLIO TOTAL 100.0%
*NIC Classification – Industrial sectors as defined under National Industrial Classification 2008
Credit Rating Profile
Maturity by Profile NAV Movement
Last 1 Month
Fund Manager Funds managed by the Fund Manager
As on May 31, 2017
SFIN No: ULIF00325/01/05MODERATORF117
As on May 31, 2017
Last 6 Months
Last 1Year
Last 2Years
Last 3Years
Since Inception
Returns
Date of Inception: February 08,2005
NA
V (
In R
s.)
* Benchmark return has been computed by applying benchmark weightages on CRISIL Composite Bond Fund Index index for Debt and Nifty 50 index for Equity
10.0%0.0%21.0%
Absolute Return CAGR Return37.7%
Deb Bhattacharya Equity - 2 | Debt - 0 | Balanced - 3
Modified Duration(Debt and Money Market)
4.5
22.1%
Himanshu Shethia Equity - 0 | Debt - 7 | Balanced - 5
Rs. 22 crore
9.2%
UNIT-LINKED Fund
Investment Objective: To earn regular income by investing in high quality fixed
income securities and to generate capital appreciation by investing a limited
portion in equity.Investment Philosophy: The fund will target 20% investments in Equities and 80%
investments in Government & other debt securities to meet the stated objectives.
Cash and Money Market
5(21%)
Debt12
(57%)
Equity5
(22%)
38%
12%10%
5%
2%
2%
2%
2%
2%1%
24%
GOVERNMENT OF INDIA
FINANCIAL AND INSURANCE ACTIVITIES
INFRASTRUCTURE SECTOR
HOUSING SECTOR
MANUFACTURE OF MOTOR VEHICLES,TRAILERS AND SEMI-TRAILERS
COMPUTER PROGRAMMING, CONSULTANCYAND RELATED ACTIVITIES
MANUFACTURE OF COKE AND REFINEDPETROLEUM PRODUCTS
MANUFACTURE OF TOBACCO PRODUCTS
MANUFACTURE OF CHEMICALS ANDCHEMICAL PRODUCTS
CIVIL ENGINEERING
Others
Government Securities
66%
AAA34%
< 1 Year25%
1 to 3 years18%
3 to 7 Years7%
> 7 Years50%
9
13
17
21
25
29
Feb-05 Feb-07 Mar-09 Apr-11 Apr-13 May-15 May-17
20 | Page

Protector (Closed Fund)
Fund Details
AUM as on 31-05-2017 NAV as on 31-05-2017
Rs. 23.9376
Portfolio Return Asset Classes F&U Actual
Govt & Govt Guaranteed Secs 25-90%Infrastructure and Social Sector Secs 0-60%Long Term Bonds 10-60%Short Term Bonds 0-45%
Portfolio return 1.2% -0.6% 9.3% 8.4% 9.1% 7.3% Money Market Investments 0-40%Benchmark* 1.3% 0.9% 10.9% 9.9% 10.7% 7.3%
Note: Past returns are not indicative of future performance. Portfolio Components
Security Rating Net AssetsAsset Under Management (AUM) (Rs crores) TOP 10 GOVERNMENT SECURITIES
8.13% GOI 2045 Sovereign 6.4%6.79% GOI 2029 Sovereign 5.7%9.23% GOI 2043 Sovereign 4.8%8.83% GOI 2023 Sovereign 3.2%7.61% GOI 2030 Sovereign 3.0%8.22% SDL 2026 Sovereign 3.0%8.17% GOI 2044 Sovereign 2.5%8.38% SDL 2026 Sovereign 2.4%6.97% GOI 2026 Sovereign 1.7%8.33% GOI 2026 Sovereign 1.2%Others 2.3%TOTAL 36.4%
Sector Allocation (As per NIC Classification*) TOP 10 CORPORATE BONDSRELIANCE PORTS & TERMINALS LTD. AAA 9.5%LARSEN & TOUBRO LTD. AAA 9.5%TATA SONS LTD. AAA 9.3%HOUSING DEVELOPMENT FINANCE CORPN. LTD. AAA 4.4%RURAL ELECTRIFICATION CORPN. LTD. AAA 3.1%POWER FINANCE CORPN. LTD. AAA 3.0%AXIS BANK LTD. AAA 2.9%RELIANCE GAS TRANSPORTATION INFRASTRUCTURE AAA 2.9%L I C HOUSING FINANCE LTD. AAA 2.7%INFRASTRUCTURE LEASING & FINANCIAL SERVICES AAA 1.9%Others 4.1%TOTAL 53.3%
CASH AND MONEY MARKET 10.4%PORTFOLIO TOTAL 100.0%
*NIC Classification – Industrial sectors as defined under National Industrial Classification 2008
Credit Rating Profile
Maturity by Profile NAV Movement
Fund Manager Funds managed by the Fund Manager
As on May 31, 2017
SFIN No: ULIF00225/01/05PROTECTORF117
Himanshu Shethia Equity - 0 | Debt - 7 | Balanced - 5
Rs. 174 crore
As on May 31, 2017
ReturnsAbsolute Return CAGR Return
36.4%23.6%
Last 1 Month
Date of Inception: February 04,2005
NA
V (
In R
s.)
* Benchmark return has been computed by applying benchmark weightages on CRISIL Composite Bond Fund Index index for Debt
Modified Duration(Debt and Money Market)
4.5
23.1%6.5%10.4%
Last 6 Months
Last 1Year
Last 2Years
Last 3Years
Since Inception
UNIT-LINKED Fund
Investment Objective: To earn regular income by investing in high quality fixed
income securities
Investment Philosophy: The fund will target 100% investments in Government &
other debt securities to meet the stated objectives
Cash and Money Market
18(10%)
Debt156
(90%)
36%
24%
13%
10%
7%
10%
GOVERNMENT OF INDIA
INFRASTRUCTURE SECTOR
FINANCIAL AND INSURANCEACTIVITIES
CIVIL ENGINEERING
HOUSING SECTOR
Others
AAA59%
Government Securities
40%
AA+1%
< 1 Year14%
1 to 3 years12%
3 to 7 Years34%
> 7 Years40%
9
11
13
15
17
19
21
23
25
Feb-05 Feb-07 Mar-09 Apr-11 Apr-13 May-15 May-17
21 | Page
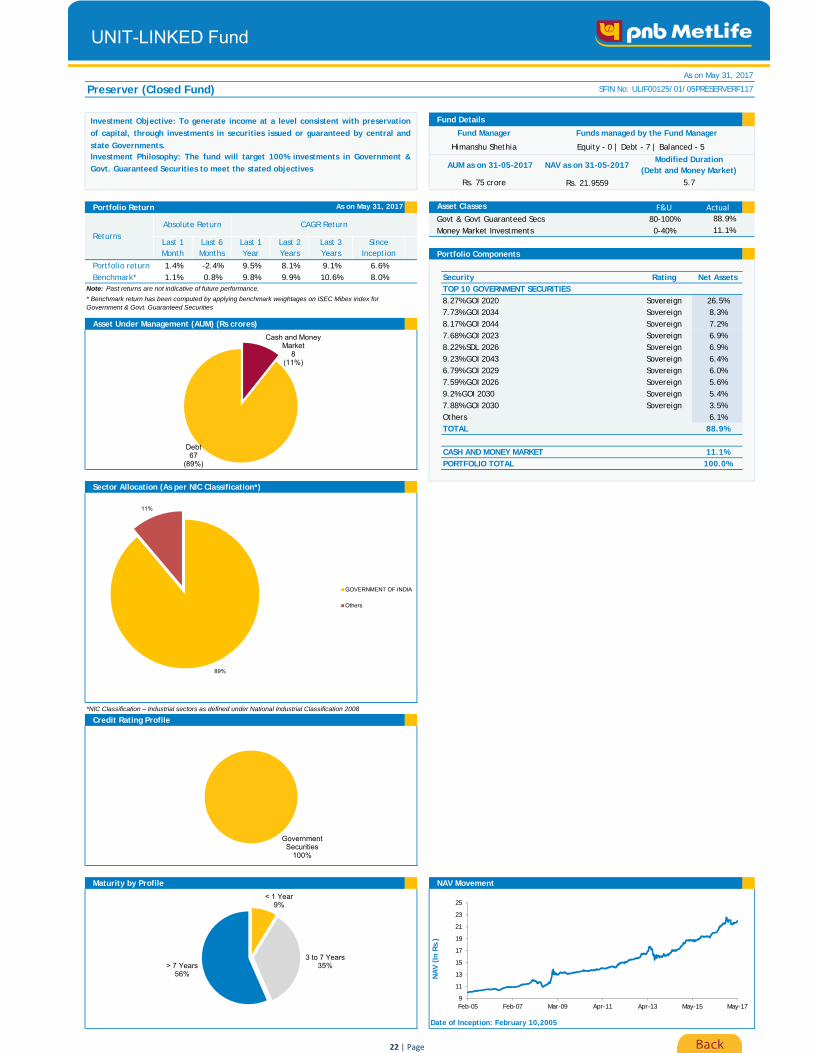
Preserver (Closed Fund)
Fund Details
AUM as on 31-05-2017 NAV as on 31-05-2017
Rs. 21.9559
Portfolio Return Asset Classes F&U Actual
Govt & Govt Guaranteed Secs 80-100%Money Market Investments 0-40%
Portfolio ComponentsPortfolio return 1.4% -2.4% 9.5% 8.1% 9.1% 6.6%Benchmark* 1.1% 0.8% 9.8% 9.9% 10.6% 8.0% Security Rating Net Assets
Note: Past returns are not indicative of future performance. TOP 10 GOVERNMENT SECURITIES8.27% GOI 2020 Sovereign 26.5%7.73% GOI 2034 Sovereign 8.3%
Asset Under Management (AUM) (Rs crores) 8.17% GOI 2044 Sovereign 7.2%7.68% GOI 2023 Sovereign 6.9%8.22% SDL 2026 Sovereign 6.9%9.23% GOI 2043 Sovereign 6.4%6.79% GOI 2029 Sovereign 6.0%7.59% GOI 2026 Sovereign 5.6%9.2% GOI 2030 Sovereign 5.4%7.88% GOI 2030 Sovereign 3.5%Others 6.1%TOTAL 88.9%
CASH AND MONEY MARKET 11.1%PORTFOLIO TOTAL 100.0%
Sector Allocation (As per NIC Classification*)
*NIC Classification – Industrial sectors as defined under National Industrial Classification 2008
Credit Rating Profile
Maturity by Profile NAV Movement
Fund Manager Funds managed by the Fund Manager
As on May 31, 2017
SFIN No: ULIF00125/01/05PRESERVERF117
Himanshu Shethia Equity - 0 | Debt - 7 | Balanced - 5
Rs. 75 crore
As on May 31, 2017
ReturnsAbsolute Return CAGR Return
88.9%11.1%
Last 1 Month
* Benchmark return has been computed by applying benchmark weightages on ISEC Mibex index for Government & Govt. Guaranteed Securities
Modified Duration(Debt and Money Market)
5.7
Date of Inception: February 10,2005
NA
V (
In R
s.)
Last 6 Months
Last 1Year
Last 2Years
Last 3Years
Since Inception
UNIT-LINKED Fund
Investment Objective: To generate income at a level consistent with preservation
of capital, through investments in securities issued or guaranteed by central and
state Governments.Investment Philosophy: The fund will target 100% investments in Government &
Govt. Guaranteed Securities to meet the stated objectives
Cash and Money Market
8(11%)
Debt67
(89%)
89%
11%
GOVERNMENT OF INDIA
Others
Government Securities
100%
< 1 Year9%
3 to 7 Years35%> 7 Years
56%
9
11
13
15
17
19
21
23
25
Feb-05 Feb-07 Mar-09 Apr-11 Apr-13 May-15 May-17
22 | Page

Discontinued Policy Fund
Fund Details
AUM as on 31-05-2017 NAV as on 31-05-2017
Rs. 15.8452
Portfolio Return Asset Classes F&U Actual
Government Securities 0-25%Money Market Instruments 0-100%
Portfolio ComponentsPortfolio return 0.5% 2.9% 6.2% 6.6% 7.1% 7.4%
Security Net AssetsNote: Past returns are not indicative of future performance. CASH AND MONEY MARKET 100.0%
PORTFOLIO TOTAL 100.0%
Asset Under Management (AUM) (Rs crores)
Sector Allocation (As per NIC Classification*)
*NIC Classification – Industrial sectors as defined under National Industrial Classification 2008
Credit Rating Profile
Maturity by Profile NAV Movement
Fund Manager Funds managed by the Fund Manager
As on May 31, 2017
SFIN No: ULIF01721/12/10DISCONTINU117
Himanshu Shethia Equity - 0 | Debt - 7 | Balanced - 5
Rs. 624 crore
As on May 31, 2017
ReturnsAbsolute Return CAGR Return
0.0%100.0%
Last 1 Month
Modified Duration(Debt and Money Market)
0.4
Date of Inception: December 21,2010
NA
V (
In R
s.)
Last 6 Months
Last 1Year
Last 2Years
Last 3Years
Since Inception
UNIT-LINKED Fund
Investment Objective: To generate income at a level consistent with the
preservation of capital, along with a minimum interest of 4% per annum.
Investment Philosophy: The fund will target 100% investments in Government &
other debt securities to meet the stated objectives.
Cash and Money Market
624(100%)
96%
4%
GOVERNMENT OF INDIA
Others
Government Securities
100%
< 1 Year100%
9
10
11
12
13
14
15
16
17
Dec-10 Jan-12 Feb-13 Mar-14 Apr-15 Apr-16 May-17
23 | Page
Quantitative Indicators
Macroeconomic Indicators
• Macroeconomics - Macroeconomics is the branch of economics that studies the behavior and performance of aneconomy as a whole. It focuses on the aggregate changes in the economy such as unemployment, growth rate,gross domestic product and inflation. Macroeconomics analyzes all aggregate indicators that influence theeconomy. Government and corporations use macroeconomic models to help in formulating of economic policiesand strategies.
• Gross Domestic Product (GDP) - GDP is one of the primary indicators used to gauge the health of a country'seconomy. It represents the total value of all goods and services produced over a specific time period. It can bestated in real terms or nominal terms (which includes inflation).
• Gross value added (GVA) - GVA is a productivity metric that measures the contribution to an economy, producer,sector or region. Gross value added provides a value for the amount of goods and services that have beenproduced, less the cost of all inputs and raw materials that are directly attributable to that production.
• Index of Industrial Production (IIP) – The index represents the production growth of various sectors in India. Theindex focuses on mining, electricity and manufacturing. The ongoing base year for calculation of index is 2004-2005.
• HSBC Purchasers Managers’ Index (PMI) - Three types of indices – Manufacturing, Services and Composite Indexare published on a monthly basis after surveys of private sector companies. An index reading above 50 indicates anoverall increase in that variable, while below 50 shows an overall decrease.
• Inflation – Inflation measures the change in the prices of a basket of goods and services in a year. From acalculation standpoint, it is the percentage change in the value of the Wholesale Price Index (WPI) / ConsumerPrice Index (CPI) on a year-on-year basis. It occurs due to an imbalance between demand and supply, changes inproduction and distribution cost or increase in taxes on products. When economy experiences inflation, i.e. whenthe price level of goods and services rises, the value of currency reduces.
• Standard Deviation (SD) - It shows how much the variation or dispersion of a fund’s daily returns has from itsaverage. Lesser SD indicates that the daily returns are moving closer to the average. A higher SD indicates thatdaily returns are widely spread over a large range of value.
• Beta – It indicates how the fund is performing relative to its benchmark. If beta of a fund is higher than itsbenchmark, which is considered 1, it indicates risk-return trade-off is better and vice-versa.
• Sharpe Ratio – It measures the risk-reward ratio as it indicates whether higher returns come with higher or lowerrisk. Greater the ratio, better is the risk-adjusted performance.
• Average Maturity – It is the weighted average period of all the maturities of debt securities in the portfolio.
• Modified Duration (MD) – It is the measurable change in the value of a security in response to a change in interestrates.
• Bond yield – Bond yield is the amount of return an investor realizes on a bond. Several types of bond yields exist,including nominal yield (interest paid divided by the face value of the bond) and current yield (annual earnings ofthe bond divided by its current market price). Yield to maturity (YTM), a popular measure where in addition tocoupon return it also additionally incorporates price decline/increase to face value of the bond over the maturityperiod.
Back24 | Page
Glossary

Back
Market Indices
Fixed Income Indicators
• Nifty 50 Index – It is a well diversified 50 stock index accounting for 22 sectors of the economy. It is used for avariety of purposes such as benchmarking fund portfolios, index based derivatives and index funds.
• CRISIL Composite Bond Fund Index - It seeks to track the performance of a debt portfolio that includesgovernment securities and AAA/AA rated corporate bonds.
• Repo Rate - The rate at which the RBI lends money to commercial banks is called repo rate. It is an instrument ofmonetary policy. Whenever shortage of funds banks has, they can borrow from the RBI.
• Cash Reserve Ratio (CRR) - CRR is the amount of funds which the banks need to keep with the RBI. If the RBIdecides to increase the CRR, the available amount with the banks comes down. The RBI uses the CRR to drain outexcessive money from the system.
25| Page
Macroeconomic Indicators
• Nominal interest rate - Nominal interest rate is the interest rate that does not take inflation impact into account.It is the interest rate that is quoted on bonds and loans.
• Real interest rate - Real interest rate adjusts for the inflation and gives the real rate of a bond or a loan.
• Monetary Policy – Monetary policy is the macroeconomic policy laid down by the Central bank. It involvesmanagement of money supply and interest rates to achieve macroeconomic objectives like inflation, consumption,growth and liquidity. Depending on growth-inflation dynamics, the central bank can either pursue an easy or atight monetary policy. An expansionary/easy/ accommodative monetary policy involves expansion of moneysupply, mainly by keeping interest rates low, to boost economic growth. A contractionary/tight monetary policyinvolves reduction in money supply to control inflation in the economy.
• Liquidity - The Central bank of a country has to maintain an appropriate level of liquidity to help meet the creditdemand of the country as well as maintain price stability. This is done by way of direct monetary policy tools suchas policy rates and cash reserves to be maintained with it by banks. It is also done by indirect means such as Openmarket Operations (OMO) which involve sale and purchase of Government securities.
• Fiscal Deficit – This takes place when India's expenditure rises than its revenue. To fill this gap, the Governmentraises debt by issuing Government/ sovereign bonds. Fiscal deficit is usually compared with GDP to understand thefinancial position of the country. Rising fiscal deficit to GDP ratio is not good for the country, which requiresimmediate attention to cut expenditure and/or increase the source of revenue.
• Current Account Deficit (CAD) - Current account deficit is a measurement of a country’s trade where the value ofimports of goods and services as well as net investment income or transfer from abroad is greater than the valueof exports of goods and services for a country. This indicates that the country is a net debtor of foreign currency,which increases the pressure on the country's existing foreign currency reserves. Current account surplus is theopposite of this.
• Investment - In private investment, the funds come from a private, for-profit business. A few examples of privateinvestment are a private company’s manufacturing plant, a commercial office building, or a shopping mall. Inpublic investment, the money exchanged comes from a governmental entity such as a city, state, country, etc. Itwould involve roads, airports, dams and other public infrastructure.
Glossary

Back26| Page
Others
• Goods and Services Tax (GST) – The GST is one of the biggest indirect tax reforms, with an aim to make India oneunified common market. It is a single tax on the supply of goods and services, right from the manufacturer to theconsumer. Credits of input taxes paid at each stage will be available in the subsequent stage of value addition,which makes GST essentially a tax only on value addition at each stage. The final consumer will thus bear only theGST charged by the last dealer in the supply chain, with set-off benefits at all the previous stages.
• Foreign institutional investors (FIIs) - FIIs are those institutional investors who invest in the assets belonging to adifferent country other than that where these organizations are based. These are the big companies such asinvestment banks, mutual funds etc, which invest considerable amount of money in Indian equity and fixedincome markets, and consequently have a strong bearing on the respective market movement and currency.
• Domestic institutional investors (DIIs)- DIIs are those institutional investors who undertake investment insecurities and other financial assets of the country they are based in. Institutional investment is defined to be theinvestment done by institutions or organizations such as banks, insurance companies, and mutual fund houses inthe financial or real assets of a country.
• Emerging market (EM) economy- An emerging market economy describes a nation's economy that is progressingtoward becoming more advanced, usually by means of rapid growth and industrialization. These countriesexperience an expanding role both in the world economy and on the political frontier.
• Organization of the Petroleum Exporting Countries (OPEC)- The OPEC was formed in 1960 to unify andcoordinate members’ petroleum policies. This was aimed at ensuring the stability of oil markets in order to securean efficient, economic, and regular supply of petroleum to customers as well as a steady income to producerswith a fair return. Members of OPEC include Iran, Iraq, Syria, Kuwait, Saudi Arabia, Bahrain, Qatar, the UnitedArab Emirates (or UAE), Oman, and Yemen. The OPEC countries produce 40% of the world’s crude oil.
• Federal Open Market Committee (FOMC)- The FOMC is the monetary policymaking body of the Federal ReserveSystem. The FOMC is composed of 12 members – seven members of the Board of Governors and five of the 12Reserve Bank presidents.
• International Monetary Fund (IMF)- The IMF, formed in 1945, is an international organization of 189 countries,headquartered in Washington, D.C. The key objectives include fostering global monetary cooperation, securingfinancial stability, facilitating international trade, promoting high employment and sustainable economic growth,and reducing poverty around the world.
Fixed Income Indicators
• Marginal Standing Facility (MSF) – It is a rate at which the RBI provides overnight lending to commercial banksover and above the repo window (repo rate). The interest rate charged is higher than the repo rate and hence it isused when there is considerable shortfall in liquidity.
• Statutory Liquidity ratio (SLR) – In India, commercial banks are required to maintain a certain percentage of theirtotal deposits (net demand and time liabilities) in notified Government securities to ensure safety and liquidity ofdeposits. This percentage is known as the SLR rate. If the RBI or Central Bank reduces the SLR rate, it means thathigher liquidity will be available to banks for their lending activity and vice-versa.
Glossary

Back27 | Page
ULIP
• MetLife Smart PlatinumUIN : 117L066V02
Traditional Products
• MetLife Guaranteed Income Plan UIN :117N097V01
• PNB MetLife Mera Heart and Cancer Care UIN: 117N100V01
• PNB MetLife Endowment Savings Plan PlusUIN : 117N099V01
An income benefit plan that provides you the customizability of choosingyour premium payment term and policy term, while providing guaranteedregular income to cherish little joys in life along with lump sum benefit atmaturity to help you turn your big dreams into reality.
A tailor-made health insurance plan that provides you withcomprehensive cover against different stages of cancer and heartdiseases, without a survival period. It also provides an inbuilt life coverand an option to get your premiums back (net of claims paid) at maturity.
A Unit Linked Whole life plan for your changing life stage needs. Alongwith 6 Unit Linked Funds & investment strategies like auto rebalancingand Systematic Transfer Option, this plan has free unlimited switchesonline, which allows you to manage your investments with changingmarket conditions.
A plan that helps you accumulate your savings for your financial needs atevery stage of life. Additionally, it provides life cover to protect yourfamily along with an option to protect your goals against critical illnesses.
• MetLife Guaranteed Savings Plan UIN :117N096V01
A plan with guaranteed benefits that helps you fulfil your big dreams byoffering lump sum benefit on maturity along with guaranteed additions oncumulative premiums.
• MetLife Mera Term Plan UIN: 117N092V01
A customizable protection plan which gives the flexibility to choose fromfour pay out options and also offers coverage for spouse in the same policy.Choose full lump sum pay out or choose amongst regular or increasingmonthly income along with lump sum pay out. Regular monthly income tillchild turns 21 years old can also be chosen along with lump sum pay out.Additional protection is also available through riders.
• MetLife Mera Wealth Plan UIN: 117L098V01
MetLife Mera Wealth Plan is a unit linked plan that provides a financialblueprint for goals related to every stage in life. With investment optionslike self-managed and systematic transfer, this product caters to everyrisk appetite. Loyalty additions which are added to the fund valueenhance fund growth and provide a superior offering for both our onlineas well as offline customers.
Our Popular Products

About Us
PNB MetLife India Insurance Company Limited (PNB MetLife) is one of the fastest growing lifeinsurance companies in the country, having as its shareholders, MetLife International Holdings LLC.(MIHL), Punjab National Bank Limited (PNB), Jammu & Kashmir Bank Limited (JKB), M. Pallonji andCompany Private Limited and other private investors, with MIHL and PNB being the majorityshareholders. PNB MetLife has been present in India since 2001.
PNB MetLife brings together the financial strength of a leading global life insurance provider, MetLife,Inc., and the credibility and reliability of PNB, one of India's oldest and leading nationalised banks.The vast distribution reach of PNB together with the global insurance expertise and product range ofMetLife makes PNB MetLife a strong and trusted insurance provider.
PNB MetLife is present in over 111 locations across the country and serves customers in more than8,000 locations through its bank partnerships with PNB, JKB and Karnataka Bank Limited.
PNB MetLife provides a wide range of protection and retirement products through its Agency sales ofover 6,000 financial advisors and multiple bank partners, and provides access to Employee Benefitplans for over 1,200 corporate clients in India. The company continues to be consistently profitableand has declared profits for last five Financial Years.
For more information, visit www.pnbmetlife.com
Customer Helpline No.
SMS HELP to 5607071(Special SMS Charges Apply)
1800-425-6969 (Toll Free) (Within India only)
IVR available 24*7 with your policy details
Contact Us
Back

PNB MetLife India Insurance Co. Ltd.(Insurance Regulatory and Development Authority of India
(IRDAI of India), Life Insurance Registration No.117)Registered Office: Unit No. 701, 702 & 703,
7th Floor, West Wing, Raheja Towers, 26/27 M G Road, Bangalore-560001.
Toll Free: 1-800-425-6969www.pnbmetlife.com
PNB MetLife India Insurance Company Limited, Registered office address: Unit No. 701, 702 & 703, 7th Floor, West Wing, RahejaTowers, 26/27 M G Road, Bangalore-560001, Karnataka. IRDAI Registration number 117. CI No: U66010KA2001PLC028883, Call us Toll-free at 1-800-425-6969, Website: www.pnbmetlife.com, Email: [email protected]. or write to us 1st Floor, Techniplex -1,Techniplex Complex, Off Veer Savarkar Flyover, Goregaon (West), Mumbai – 400062. Phone: +91-22-41790000, Fax: +91-22-41790203.LD/2017-18/045 EC045.
• For more details on risk factors, terms and conditions, please read product sales brochure carefully before concluding a sale• Unit-Linked Life Insurance products are different from the traditional insurance products and are subject to the risk factors• The premium paid in Unit-Linked Life Insurance Policies are subject to investment risks associated with capital markets and the NAVsof the Units may go up or down based on the performance of Fund and factors influencing the capital market and the insured isresponsible for his/her decisions • The name of the Insurance Company and the name of the Unit-Linked Life Insurance contract doesnot in any way indicate the quality of the contract, its future prospects or returns. Please know the associated risks and the applicablecharges, from your Insurance agent or the Intermediary or the Policy Document • The various Funds offered are the names of theFunds and do not in any way indicate the quality of these plans, their future prospects and returns. The Unit-Linked Funds don't offera guaranteed or assured return • The premium shall be adjusted on the due date even if it has been received in advance.
The fund update provided by PNB MetLife India Insurance Company Limited (“PNB MetLife”) is for general informational purposes only.This information is not intended as investment advice, or as an endorsement, recommendation or sponsorship of any company,security, or fund. The opinions and analyses included in the information are based from sources believed to be reliable and written ingood faith, but no representation or warranty, expressed or implied is made as to their accuracy, completeness or correctness. PNBMetLife cannot and do not assess or guarantee the suitability or profitability of any particular investment, or the potential value ofany investment or informational source. You should seek the advice of a qualified securities professional before making anyinvestment. The information contained herein does not suggest or imply and should not be construed, in any manner, a guarantee offuture performance. Past performance does not guarantee future results.
"The products on Nifty 50 Index is not sponsored, endorsed, sold or promoted by India Index Services & Products Limited (IISL). IISLdoes not make and expressly disclaims any representation or warranty, express or implied (including warranties of merchantability orfitness for particular purpose or use) regarding the advisability of investing in the products linked to Nifty 50 Index or particularly inthe ability of the Nifty 50 Index to track general stock market performance in India. Please read the full Disclaimers in relation to theNifty 50 Index in the Offer Document / Prospectus / Information Statement".
Indices provided by CRISIL
CRISIL Indices are the sole property of CRISIL Limited (CRISIL). CRISIL Indices shall not be copied, retransmitted or redistributed in anymanner for any commercial use. CRISIL has taken due care and caution in computation of the Indices, based on the data obtained fromsources, which it considers reliable. However, CRISIL does not guarantee the accuracy, adequacy or completeness of the Indices and isnot responsible for any errors or for the results obtained from the use of the Indices. CRISIL especially states that it has no financialliability whatsoever to the users of CRISIL Indices.
Compound annual growth rate (CAGR) is rounded to nearest 0.1%
Back
“The marks “PNB” and “MetLife” are the registered trademarks of Punjab National Bank and Metropolitan Life Insurance Company, respectively. PNB MetLife India Insurance CompanyLimited is a licensed user of these marks”
“BEWARE OF SPURIOUS CALLS AND FICTITIOUS/FRADULENT OFFERS”IRDAI clarifies to the public that
IRDAI or its officials do not involve in activities like sale of any kind of insurance or financial products nor invest premiums
IRDAI does not announce any bonus. Public receiving such phone calls are requested to lodge a police complaint along with details of phone call number


![PNB MetLife Guaranteed Income Plan MetLife Guaranteed Income...PNB MetLife India Insurance Co. Ltd. [Signature] [Name of signing authority] [Designation of signing authority] Stamp](https://img.pdfslide.us/doc/110x75/5aa476357f8b9ac8748bf686/pnb-metlife-guaranteed-income-plan-metlife-guaranteed-incomepnb-metlife-india.jpg)