Embed Size (px)
Citation preview

The BSE Limited, Listing Department, Phiroze Jeejeebhoy Towers, Dalal Street, Mumbai - 400 001
Scrip Code: 540173
Dear Sirs,
Sub: Investor Presentation
@ pnb Housing 1 1 ) • I r , 1 r o
E?httr Ki Bttttt
October 28, 2020
National Stock Exchange of India Limited, Listing Department "Exchange Plaza" Sandra Kurla Complex, Sandra (E), Mumbai- 400 051
Symbol: PNBHOUSING
Pursuant to Regulation 30 of the SEBI (Listing Obligations and Disclosure Requirements) Regulations, 2015, Please find attached herewith the Investor Presentation of the Company for the quarter and six months ended September 30, 2020.
A copy of the same is placed on the website of the Company www.pnbhousing.com
You are requested to take note of the above and arrange to bring this to the notice of all concerned.
Thanking You.
For PNB Hous· g Finance Limited
0 ~a in
Company Secretary & Head Compliance Membership No.: F2642
~ ~: gcff ~. ~al ~. 22, ~ TJ'Ml" l'flTf. ~ ~- 110001
Regd. Office: 9th Floor, Antriksh Bhawan, 22 Kasturba Gandhi Marg, New Delhi - 110 001 Toll Free: 1800 120 8800, Email: [email protected], Website: www.pnbhousing.com
CIN: L65922DL 1988PLC033856

PNB Housing Finance LimitedInvestor Presentation
October 2020

Performance Highlights
Data as on 30th September 2020
Write-offs since
Inception**
Book Value Per
Share
Capital to
Risk Asset Ratio
Retail Loans
Disbursement*
Asset Under
Management
Deposits
Average Cost
of Borrowing*
INR 3,138 Crore
INR 81,221 Crore
82% of the AUM
INR 16,600 Crore
8.09%
GNPA2.59% on Loan Assets
2.20% on AUM
11 bps
INR 506
18.66%
Total Provision/
Total Assets2.99%
**On cumulative disbursements
1
*For H1 FY21
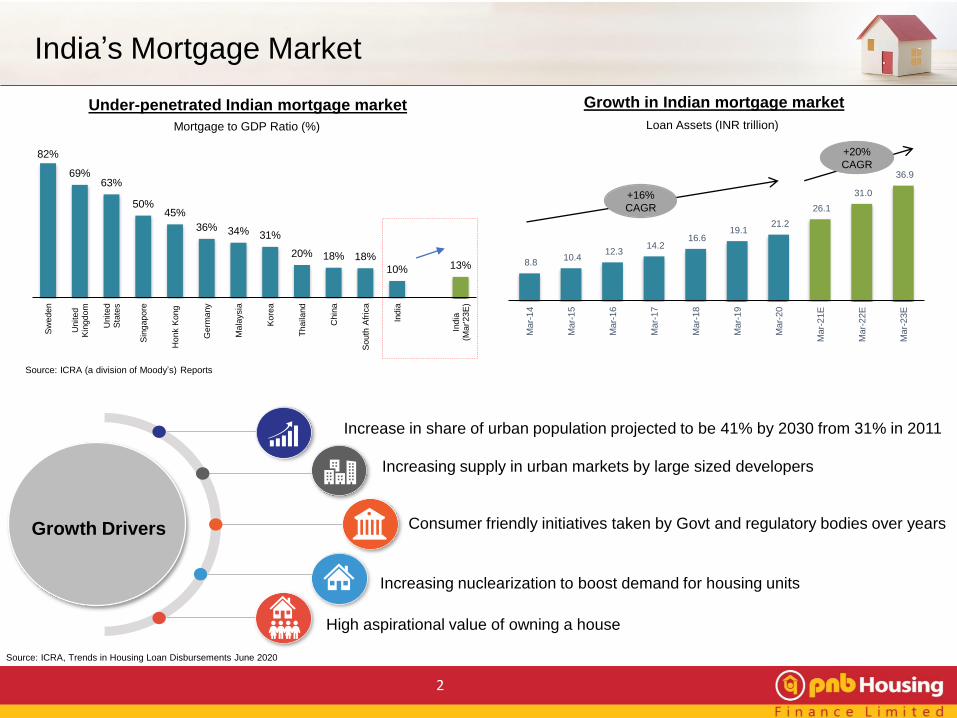
India’s Mortgage Market
Growth in Indian mortgage market
82%
69%63%
50%45%
36% 34% 31%
20% 18% 18%
10% 13%
Sw
eden
United
Kin
gdom
United
Sta
tes
Sin
gapore
Ho
nk K
ong
Germ
any
Mala
ysia
Kore
a
Thailand
Chin
a
South
Afr
ica
India
India
(M
ar'23E
)
Loan Assets (INR trillion)
Source: ICRA (a division of Moody’s) Reports
8.8 10.4
12.3 14.2
16.6 19.1
21.2
26.1
31.0
36.9
Mar-
14
Mar-
15
Mar-
16
Mar-
17
Mar-
18
Mar-
19
Mar-
20
Mar-
21E
Mar-
22E
Mar-
23E
+16%
CAGR
+20%
CAGR
Source: ICRA, Trends in Housing Loan Disbursements June 2020
Growth Drivers
Increase in share of urban population projected to be 41% by 2030 from 31% in 2011
Increasing supply in urban markets by large sized developers
Consumer friendly initiatives taken by Govt and regulatory bodies over years
Increasing nuclearization to boost demand for housing units
High aspirational value of owning a house
Under-penetrated Indian mortgage market
Mortgage to GDP Ratio (%)
2

Growth of Housing Finance Sector
Portfolio Composition of HFCs*
Source: ICRA Indian Mortgage Finance Market Update for August 2020
% Change is YoY
Total Loan of HFCs: INR 11.0 trillion*
65%
16%
19%
Home Loan LAP Construction Finance
Portfolio Growth of HFCs
21%
26% 25%
31% 32%
15%
3%
20%
22% 21% 20%25%
12%
3%
19% 21% 20%15%
22%
11%
3%
Mar-14 Mar-15 Mar-16 Mar-17 Mar-18 Mar-19 Mar-20
Other Loans Overall Portfolio Home Loans
41.0%
19.1%
6.3%
6.1%
1.9%
25.5%
HDFC LICHF IBHFL PNBHFL CanFin Others
Top 5 HFCs: 74%
5.0%
Mar-14
6.1%
Mar-17 Mar-20
2.5%
Loan Assets CAGR
+36%
PNBHFL Market Share (%)
7.7 11.0Total Loan of all
HFCs (INR trillion) 4.3
3
*As on 31st March 2020
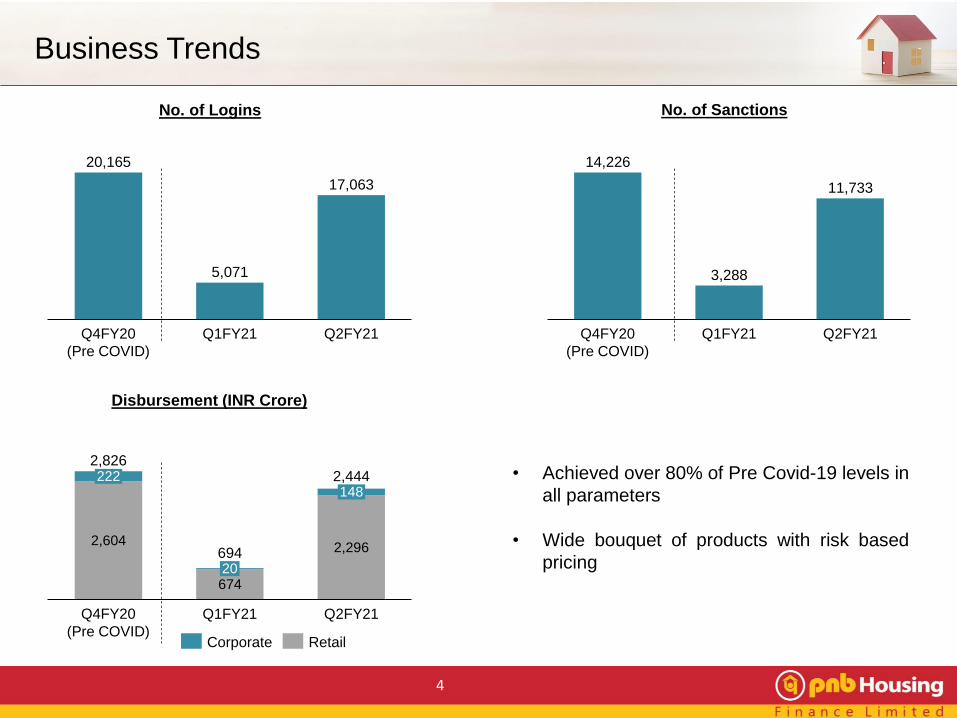
Business Trends
2,604
674
2,296
Q4FY20
(Pre COVID)
2,444222
Q1FY21
20
148
Q2FY21
2,826
694
20,165
5,071
17,063
Q4FY20
(Pre COVID)
Q1FY21 Q2FY21
No. of Logins No. of Sanctions
Disbursement (INR Crore)
4
Corporate Retail
14,226
3,288
11,733
Q1FY21Q4FY20
(Pre COVID)
Q2FY21
• Achieved over 80% of Pre Covid-19 levels in
all parameters
• Wide bouquet of products with risk based
pricing
5
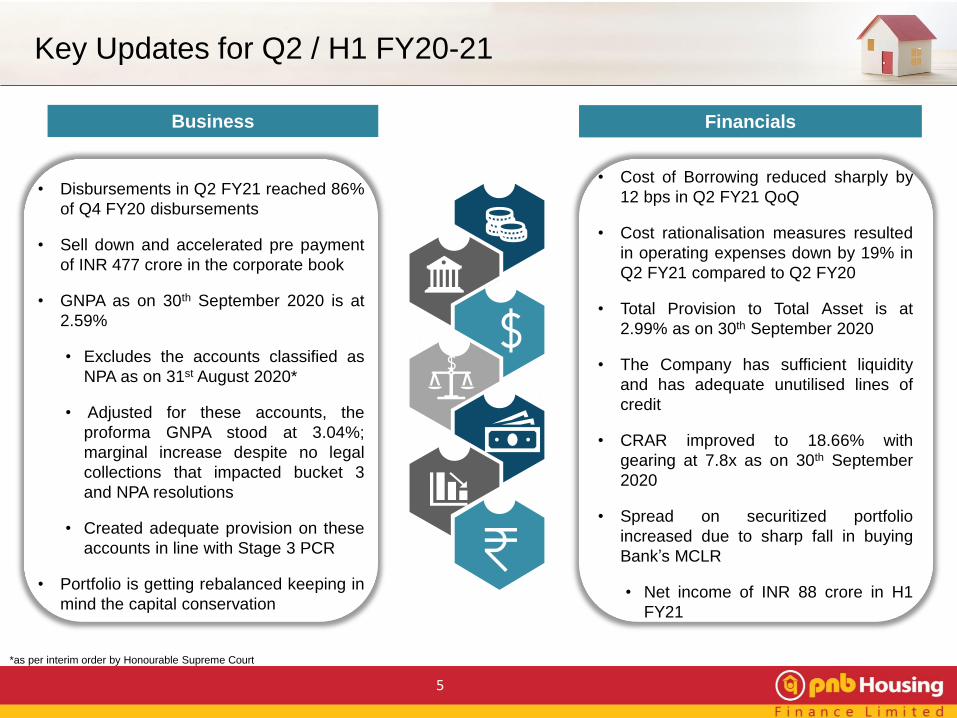
Key Updates for Q2 / H1 FY20-21
Business Financials
• Disbursements in Q2 FY21 reached 86%
of Q4 FY20 disbursements
• Sell down and accelerated pre payment
of INR 477 crore in the corporate book
• GNPA as on 30th September 2020 is at
2.59%
• Excludes the accounts classified as
NPA as on 31st August 2020*
• Adjusted for these accounts, the
proforma GNPA stood at 3.04%;
marginal increase despite no legal
collections that impacted bucket 3
and NPA resolutions
• Created adequate provision on these
accounts in line with Stage 3 PCR
• Portfolio is getting rebalanced keeping in
mind the capital conservation
• Cost of Borrowing reduced sharply by
12 bps in Q2 FY21 QoQ
• Cost rationalisation measures resulted
in operating expenses down by 19% in
Q2 FY21 compared to Q2 FY20
• Total Provision to Total Asset is at
2.99% as on 30th September 2020
• The Company has sufficient liquidity
and has adequate unutilised lines of
credit
• CRAR improved to 18.66% with
gearing at 7.8x as on 30th September
2020
• Spread on securitized portfolio
increased due to sharp fall in buying
Bank’s MCLR
• Net income of INR 88 crore in H1
FY21
*as per interim order by Honourable Supreme Court

6
Financial Highlights – Q2 FY21
Q2FY21
11.30%
Q2FY20
10.95%
Q2FY21Q2FY20
8.34% 8.01%
Q2FY20 Q2FY21
3.19%3.52%3.29%
Q2FY20 Q2FY21
2.61%
Average Cost of BorrowingAverage Yield NIMSpread
Pre-provision Operating Profit
578 575
Q2FY20 Q2FY21
PAT
367
313
Q2FY20 Q2FY21
Revenue
2,2302,022
Q2FY20 Q2FY21
1,5211,340
131
Q2FY21Q2FY20
107
1,6521,447
Finance Cost
Operating Expense
Ratios are calculated on Monthly Average
For the calculation of ratios P&L numbers are considered as per Ind AS
Expense
(INR Crore)

Robust Risk Buying Processes
Specialization
• Well qualified team with
vast mortgage
experience
• Stable and vintage
cadre of personnel
• Predictable service
standards
• Multiple checks and
balances with maker-
checker approach
Customer profiling
• Robust income
assessment and
established banking
relationship
• Wide bouquet of
products
• Risk based pricing
• Well diversified customer
base
Other mitigating
measures
• Workflow based
assessment on single
IT platform
• Use of technology in
verification of customer
data points and geo
tagging of properties
• Inhouse technical team
for verification
• Underwriting policies
tightened
3C Approach
• 3C approach: Counsel,
Collect and Cure
• Periodical portfolio scrub
for early warning signals
• In house contact center
with multilingual expertise
• Special cadre for
resolution through legal
tools
• Collections on-the-go
through mobility for
effective supervision
An independent internal audit function for all departments and processes, directly reporting to Audit Committee of Board
Multi pronged control mechanism coupled with regular portfolio review
Enterprise Risk Management framework
7

Particulars (INR Crore) 30-Sep-20 30-Jun-20 30-Sep-19
Gross Stage 1 & 2 65,214 66,130 73,729
% portfolio in stage 1 & 2 97.4% 97.2% 99.2%
ECL Provision Stage 1 & 2 1,241 1,092 586
Net Stage 1 & 2 63,972 65,038 73,143
ECL Provision % Stage 1 & 2 1.9% 1.7% 0.8%
Gross Stage 3 (GNPA) 1,737 1,879 624
% portfolio in Stage 3 (GNPA%) 2.6% 2.8% 0.8%
ECL Provision Stage 3 763 746 139
Net Stage 3 974 1,133 485
Coverage Ratio % Stage 3 43.9% 39.7% 22.3%
Total Assets 66,951 68,009 74,353
% portfolio 100% 100% 100%
ECL Provision 2,004 1,837 725
Net Stage 64,947 66,171 73,628
Total ECL Provision % 3.0% 2.7% 1.0%
Steady State Provision - - 169
Total Provision (including Steady state Provision) 2,004 1,837 894
Total Provision (including Steady state) / Total Assets (%) 3.0% 2.7% 1.2%
Provision Coverage Ratio (%) 115% 98% 143%
Expected Credit Loss (ECL) Provisions
Classification of the Assets based on the ECL computation under Ind AS:
ECL provision of INR 2,004 crore; higher by INR 1,332 crore as compared to regulatory provision
8

Gross Non-Performing Assets
Non-Performing Assets
1 Crore = 10 mn
0.84%
1.75%
2.75% 2.76%2.59%
0.65%
1.25%
1.75% 1.67%1.46%
30-Sep-19 31-Dec-19 31-Mar-20 30-Jun-20 30-Sep-20
GNPA NNPA
As on 30-Sep-2020 INR Crore
Gross NPA 1,737
ECL Provision 2,004
Regulatory provision 672
9
% of Loan Asset
• Gross NPA on AUM is at 2.2%
• Stage 3 provision ratio increased to 43.9% compared to 22.3% as on 30th September 2019
• Total Asset to Total Provision at 2.99% and overall provision coverage ratio at 115%
Figures as on 30th September 2020 unless mentioned

Business Operations
Central Support Office
Map not to scale. All data, information and maps are provided “as is” without warranty or any representation of accuracy, timeliness or completeness.
AUM – derisked Geographical
concentration
Disbursement Origination
(H1 FY21)
60%
40%
In-House DSA
Geography Hub Branches
North 8 31
South 7 31
West 7 34
Branches – Point of Sales & Services
Hubs – Fountain head for Decision Making
• 96 branches with pan-India
presence in 64 unique cities
29%
29%
42%
North South West
10

Business Update
57,01474,023 67,571 66,951
31-Mar-18 31-Mar-19 31-Mar-20 30-Sep-20
84,722
62,252
83,346 81,221
AUM CAGR
+16%
Loan AssetsAUM
Asset
(INR Crore) Disbursement
11
24,083 26,449
17,111
2,970
9,1129,630
FY20FY18 FY19
3,138
1,515
36,079
168
33,195
H1FY21
18,626
Corporate Retail

Asset Under Management
Corporate Retail
31-Mar-19
20%
80%
31-Mar-18
18%
82%
21% 18%
30-Sep-20
79%
31-Mar-20
82%
AUM Mix
Segment-wise Breakup
Product-wise Break-up As % to AUM
Retail 82%
Data as on 30th September 2020
Salaried 44%
Self Employed
38%
Corporate 18%
12
57%
21%
4%
18%Individual Housing Loan
Retail Loan Against Property
Retail Non- residental Premises Loan
Corporate Loan

Retail Focused Lending Operations
14
Retail segment contribute 95% of
the H1FY21 disbursement
Loans given as Individual Housing
Loans, Loan Against Property and
Non Residential Premises Loans
Focus on mass housing and
capital efficient product
segment
Focus on completed properties
Mandatory interaction with Self employed
customers, evidence based income
assessment and banking relations
Robust and scalable Hub and
Spoke model resulting in
efficient underwriting process
Digitisation of processes
from sourcing to closure
of loans resulting into
increased efficiencies
Quality of Loan Portfolio tested
against three major systemic events
i.e. Demonetisation, GST and tight
Liquidity
Retail Focused
Lending
13

Retail Loan Book – Average Ticket Size Range
Individual Housing Loan Retail Loan Against Property
14
36.3% 38.2%44.8% 46.1%
37.8%37.7%
35.6% 35.1%
16.6% 15.8%12.9% 12.5%
6.7% 6.2% 5.0% 4.7%
0.1% 0.1%
31-Mar-19
1.3%
0.1%
31-Mar-18
0.6%1.9% 0.4%1.6% 0.3%1.4%
31-Mar-20
0.1%0.2%
30-Sep-20
22.6% 21.0% 23.8% 24.5%
17.4%16.8%
18.2% 18.7%
20.0%19.6%
20.4% 20.4%
19.4%20.4%
18.6% 18.1%
13.5% 15.1%13.9% 13.3%
4.2% 4.5% 3.3% 3.2%1.9% 1.8%
30-Sep-2031-Mar-18 31-Mar-19 31-Mar-20
2.5%3.0%
75 Lakh -2 Crore 30-75 Lakh
2-5 Crore5-10 Crore10-15 Crore>15 Crore
Upto 30 Lakh
Data on Outstanding Loan Asset

15
Retail Loan Book – Key Attributes
31 31 29 28
52 5147 46
31-Mar-18 31-Mar-19 30-Sep-2031-Mar-20
IHL LAP
Average Ticket Size Weighted Average Loan to Value
71%69%
30-Sep-2031-Mar-18 31-Mar-19 31-Mar-20
47% 49%
71%
49%
71%
49%
IHL LAP
32% 30% 28% 29%
68% 70% 72% 71%
31-Mar-2031-Mar-18 30-Sep-2031-Mar-19
Salaried Self Employed
83% 82% 81% 81%
17% 18% 19% 19%
31-Mar-18 30-Sep-2031-Mar-19 31-Mar-20
Salaried vs Self-Employed
Individual Housing Loan Loan Against Property
Under construction vs Completed
74% 76% 81% 81%
26% 24% 19% 19%
31-Mar-18 30-Sep-2031-Mar-19 31-Mar-20
CompletedUnder Construction
Individual Housing Loan
Salaried Self Employed
ATS and LTV at Origination

Corporate Book Summary
Product SegmentAUM
(INR Crore)% of AUM
Unique Corporate
houses ATS
INR Crore
No. of Unique
Corporate houses
Construction Finance 10,352 12.7% 158
130Corporate Term Loan 2,955 3.6% 103
Lease Rental Discounting 1,024 1.3% 88
Total Corporate Book 14,331 18%
24%
25%
51%
North
South
West
Geographical Distribution City Concentration
89%
11%Top 7 markets
Others
16

✓ Pate Developers - INR 20 crore; an MOU has
been executed with leading developer of Pune
who has paid 10% payment earnest money.
✓ IREO Pvt Ltd. – Account resolved with
outstanding of INR 23 crore as on 30th Sept 2020
vs INR 101 crore as on 30th June 2020; moved
out of NPA as on 30th September 2020
✓ Other NPA account - 3 accounts with
outstanding balance of INR 4 Cr closed with NIL
credit loss
Corporate Book Remedial Actions on Key NPA accounts
Accounts Resolved Resolution Underway
✓ Vipul Ltd. - IINR 356 Cr; got symbolic
possession of the project; JDA with a large
international developer in advanced stages
✓ Radius - INR 259 Cr; initiated legal proceedings
under SARFAESI, working with the co-lender for
auction
✓ Supertech Ltd. - INR 244 Cr; bulk sale of
inventory in progress to restart the project
✓ Ornate Pvt. Ltd. - INR 181 Cr; initiated legal
proceeding, case is now gone to NCLT;
received EoI from various developers
17

Well Diversified Resource Profile
Credit Rating
• Fixed Deposit: “FAA+” by CRISIL and “AA” by CARE.
• Commercial Paper: “A1(+)” by CARE & CRISIL
• Non-Convertible Debentures: “AA” by CARE, India
Ratings, CRISIL and ICRA
• Bank Loans (Long Term): “AA” by CARE and CRISIL
1 Crore = 10 million
8.8% 12.9% 18.8% 17.7%
37.5% 28.0%22.5%
17.2%
17.5%
9.6%
19.5%
17.2%
19.6%20.6%
5.7%6.7%
7.1%
7.7%18.2% 24.4%
24.0%
6.5% 8.5% 7.4% 10.9%
30-Sep-2031-Mar-2031-Mar-19
2.5%
31-Mar-18
0.5%2.6%
As on
(INR Crore)Borrowings Assignment Total Resource
31-Mar-18 54,268 5,238 59,506
31-Mar-19 72,362 10,699 83,061
31-Mar-20 68,216 15,775 83,991
30-Sep-20 66,237 14,270 80,507
(INR Crore)
NHB Refinance Loan from Banks ECBs Deposits
CP NCDs Direct Assignment
18

Margin Analysis
Average Cost of BorrowingsAverage Yield Spread
Gross Margin
3.5%
H1FY21FY19FY18 FY20
3.3% 3.2% 3.1%
FY20FY18 FY19
10.4% 10.8%
H1FY21
10.2% 10.7% 8.1%
FY18
8.0%
FY19 FY20 H1FY21
7.7%8.2%
FY19 H1FY21FY18 FY20
2.7%2.5% 2.5%2.4%
FY18
3.1%3.2%
FY20FY19 H1FY21
3.0%2.9%
Net Interest Margin
Ratios are calculated on Monthly Average
Gross Margin is net of acquisition cost
19

Operating Leverage and Returns
Return on Asset Return on Equity
FY18 FY19 H1FY21FY20
8.1%
14.2%
17.4%
13.8%
FY18
0.6%
FY19
0.7%
FY20 H1FY21
0.6%
0.5%
FY18
17.2%16.0%
H1FY21FY19 FY20
19.6%
16.9%
1.6%
FY20FY18 FY19 H1FY21
1.5%1.6%
0.8%
Cost to Income RatioOpex to ATA Ratio
Ratios are calculated on Monthly Average
Opex to ATA is calculated as Operating Expenditure(Employee Cost + Other Expenses + Depreciation - Acquisition Cost – ESOP cost - CSR cost)/Average Total Assets as per Balance sheet
20

Average Gearing (x)
Ratio is calculated on Monthly Average
*Based on IGAAP numbers
7.6
9.38.8
8.1
31-Mar-2031-Mar-18 31-Mar-19 30-Sep-20 31-Mar-18
2.8%
3.0%
3.9%
15.2%12.8%
31-Mar-19
11.0%
31-Mar-20
2.6%
16.1%
30-Sep-20
16.7%
14.0%
18.0% 18.7%
Tier 2
Tier 1
Capital to Risk Asset Ratio*
Provisions
Stage 3
Coverage ratio
(%)28.4% 20.9% 36.2% 43.9%
Conservative Provisioning and Healthy Capital Position
Strong Balance Sheet
21
432594
1,7662,004
-1
0
1
2
3
0
500
1,000
1,500
2,000
2,500
0.8%
31-Mar-18
3.0%
31-Mar-19
0.8%
2.6%
31-Mar-20 30-Sep-20
Total Provision (as a % of assets) Total Provision

Consolidated Profit & Loss Statement
22
Particulars (INR Crore) Q2 FY21 Q2 FY20 YoY Q1 FY21 QoQ H1 FY21 H1 FY20 YoY FY20
Interest Income 1,960 2,016 1,802 3,762 3,995 7,688
Add: Net gain on fair value changes 31 23 50 80 64 159
Add: Income on derecognized (assigned) loans 0 110 0 0 229 336
Less: Finance Cost 1,340 1,521 1,364 2,703 3,034 5,875
Net Interest Income 651 628 3.6% 488 33.5% 1,139 1,254 -9.2% 2,308
Net Fees and other Income 30 78 20 50 169 298
Gross Income 681 706 -3.6% 508 34.0% 1,189 1,423 -16.5% 2,606
Operating Expenses
Less: Employee Benefit Expenses 55 71 61 116 139 233
Less: Other Expenses 36 41 26 62 95 245
Less: Depreciation and Amortisation 15 16 16 31 33 66
Operating Profit 575 578 -0.4% 405 42.1% 980 1,156 -15.2% 2,062
Less: Impairment on financial instruments & Write-offs
(Expected Credit Loss)179 152 76 255 316 1,251
Profit Before Tax 396 426 -7.1% 329 20.1% 725 840 -13.7% 811
Less: Tax Expense 83 59 72 155 189 165
Net Profit after Tax 313 367 -14.6% 257 21.8% 570 651 -12.4% 646
Add: Other Comprehensive Income 20 -44 -86 -67 -16 -55
Total Comprehensive Income 333 323 171 504 635 591
EPS (Basic) 18.6 21.8 15.3 33.9 38.8 38.5

Consolidated Balance Sheet
23
Particulars (INR Crore) 30-Sep-20 31-Mar-20
LIABILITIES
1 Financial Liabilities
(a) Debt Securities 14,339 17,837
(b) Borrowings (Other than Debt Securities) 33,647 32,328
(c) Deposits 15,979 16,132
(d) Subordinated Liabilities 1,439 1,439
(e) Other financial liabilities 2,418 1,776
Sub Total - Financial Liabilities 67,822 69,512
2 Non-Financial Liabilities
(a) Provisions 28 19
(b) Other non-financial liabilities 725 1,401
Sub Total - Non-Financial Liabilities 753 1,420
3 EQUITY
(a) Equity Share capital 168 168
(b) Other Equity 8,341 7,830
Sub Total - Equity 8,509 7,998
TOTAL – EQUITY & LIABILITIES 77,085 78,930
Particulars (INR Crore) 30-Sep-20 31-Mar-20
ASSETS
1 Financial Assets
(a) Cash and cash equivalents 7,472 8,514
(b) Loans 65,869 66,628
(c) Investments 2,080 2,076
(d) Other Financial Assets 841 872
Sub Total - Financial Assets 76,262 78,090
2 Non - Financial Assets
(a) Tax Assets (Net) 368 347
(b) Property, Plant and Equipment 95 105
(c) Right of use assets 98 120
(d) Other Intangible assets 22 25
(e) Other non-financial assets 64 35
(f) Assets held for sale 176 207
Sub Total - Non - Financial Assets 823 839
TOTAL - ASSETS 77,085 78,930

Shareholding
Outstanding Shares – 16,81,86,908 shares
32.7%
32.2%
24.0%
2.3%
6.5%1.6% 0.8%
Shareholding as on 30-Sep-20
Promoters Quality Investment Holdings
Foreign Inst. Investors Mutual Funds
Public & Others Bodies Corporates
Financial Institutions / Banks
Top Shareholders
General Atlantic Singapore Fund, SSG
Capital, Franklin Templeton MF, Malabar
Investments, Southeastern Asset
Management, Vanguard, Reliance Capital
MF, United India Insurance, Edelweiss
Trusteeship MF, Blackrock (ETFs)
Included in
“MSCI Global Small Cap Index” in November 2018
24

25
ESG Snapshot
Environment
Human Capital Governance
CSR: “Saksham”
• COVID-19:
• Supported scientific R&D of efficient and reusable PPE material in
partnership with IIT Delhi to create masks and surgical gowns
• Contributed to equip Maharashtra Govt.’s 1,000 bed Covid hospital
• Supported a mobile health unit for providing essential healthcare
services to construction worker families
• Strong Team of 1,425 employees as on 30th
September 2020
• Young organization with average age of 34 years
• 18% women employees
• Learning & development (H1 FY21):
• 1,393 unique employees trained
• 1,233 number of training programme conducted
• Diversified & highly experienced Board of
12 members with 7 independent directors
• Systems in place to address stakeholder’s
grievances viz customers, shareholders’,
vendors etc.
• Strong and well experienced senior
management team with extensive industry
experience
• Over 90% of customer requests resolved within TAT
• Partnered with CREDAI and NAREDCO to conduct
skill enhancement training
• Collaborated with NGOs & developers to provide
nutritional inputs, regular health check-ups and
education support for children of construction
workers
• Health insurance policy enhanced to cover COVID-19
• Over 95% reduction in usage of paper for customer
communication
• 99% EMI collections through digital mode
• Encouraging adoption of cloud computing technology,
virtualisation, data centre energy optimisation among others
• Launched ACE - a digital customer onboarding
platform to minimize physical interface
• Over 50% customers on mobile app

Key Takeaways
Wide Spread Retail
Distribution Network
and Unique
Operating Model
Wide spread retail
distribution network with
pan India presence and
over 22,000 channel
partners across India
Strong
Balance Sheet
Conservative
provisioning with
healthy capital position
Focus on Retail
Focus on Retail
business with 82% of
the AUM as retail as
on 30th September
2020
Diversified
Borrowing Mix with
balanced ALM
Diverse funding mix
with average cost of
borrowing at 8.1%(1)
Improving Cost to
Income Ratio
Operating leverage
playing out, thereby
improving C/I Ratio
1. For H1FY21
26

Glossary
ATA Average Total Assets
ATS Average Ticket Size
AUM Asset Under Management
BVPS Book Value per Share
C/I Cost to Income
CRAR Capital to Risk Asset Ratio
CP Commercial Paper
CTL Corporate Term Loan
DPS Dividend per Share
DSA Direct Selling Agents
ECB External Commercial Borrowing
ECL Expected Credit Loss
EPS Earning Per Share
GNPA Gross Non-Performing Asset
HFCs Housing Finance Companies
LAP Loan against Property
LRD Lease Rental Discounting
NCDs Non-Convertible Debentures
NII Net Interest Income
NIM Net Interest Margin
NNPA Net Non-Performing Asset
NRPL Non-Residential Premises Loans
PAT Profit After Tax
PCR Provision Coverage Ratio
ROA Return on Asset
ROE Return on Equity
27
Ratios Formulas Used
Average Yield (%) (Interest Income + Assignment Income) on Loans / Average Loan Assets
Cost to Income (%)Operating Expenditure(Employee Cost + Other Expenses + Depreciation - Acquisition Cost – ESOP cost - CSR
cost) / (Net Revenue-Acquisition Cost)
NIM (%) Net Interest Income including assignment income / Average Earning Assets
Opex to ATA (%)Operating Expenditure(Employee Cost + Other Expenses + Depreciation - Acquisition Cost – ESOP cost - CSR
cost) / Average Total Assets as per Balance sheet
PCR (%) (ECL Provision + Steady state Provision) as a % of GNPA

Disclaimer
This presentation and the accompanying slides (the “Presentation”), which have been prepared by PNB Housing Finance
Limited (the “Company”), have been prepared solely for information purposes and do not constitute any offer,
recommendation or invitation to purchase or subscribe for any securities, and shall not form the basis or be relied on in
connection with any contract or binding commitment what so ever. No offering of securities of the Company will be made
except by means of a statutory offering document containing detailed information about the Company.
This Presentation has been prepared by the Company based on information and data which the Company considers reliable,
but the Company makes no representation or warranty, express or implied, whatsoever, and no reliance shall be placed on,
the truth, accuracy, completeness, fairness and reasonableness of the contents of this Presentation. This Presentation may
not be all inclusive and may not contain all of the information that you may consider material. Any liability in respect of the
contents of, or any omission from, this Presentation is expressly excluded.
Certain matters discussed in this Presentation may contain statements regarding the Company’s market opportunity and
business prospects that are individually and collectively forward-looking statements. Such forward-looking statements are not
guarantees of future performance and are subject to known and unknown risks, uncertainties and assumptions that are
difficult to predict. These risks and uncertainties include, but are not limited to, the performance of the Indian economy and of
the economies of various international markets, the performance of the industry in India and world-wide, competition, natural
calamities, inflation, deflation, the performance of the financial markets in India and globally, changes in Indian laws and
regulations, including tax, accounting and housing finance companies regulations, changes in competition and the pricing
environment in India, and regional or general changes in asset valuations, the Company’s ability to successfully implement its
strategy, the Company’s future levels of growth and expansion, technological implementation, changes and advancements,
changes in revenue, income or cash flows, the Company’s market preferences and its exposure to market risks, as well as
other risks. The Company’s actual results, levels of activity, performance or achievements could differ materially from results
expressed in or implied by this Presentation. The Company assumes no obligation to update any forward-looking information
contained in this Presentation. Any forward-looking statements and projections made by third parties included in this
Presentation are not adopted by the Company and the Company is not responsible for such third party statements and
projections.
28
Thank You
Company:
PNB Housing Finance Limited
CIN: L65922DL1988PLC033856
Ms. Deepika Gupta Padhi (Head-Investor Relations)
Phone: +91 11 23445214
www.pnbhousing.com