Embed Size (px)
Citation preview
Content:1. Tables S1‐S62. Figures S1‐S103. Supplemental methods
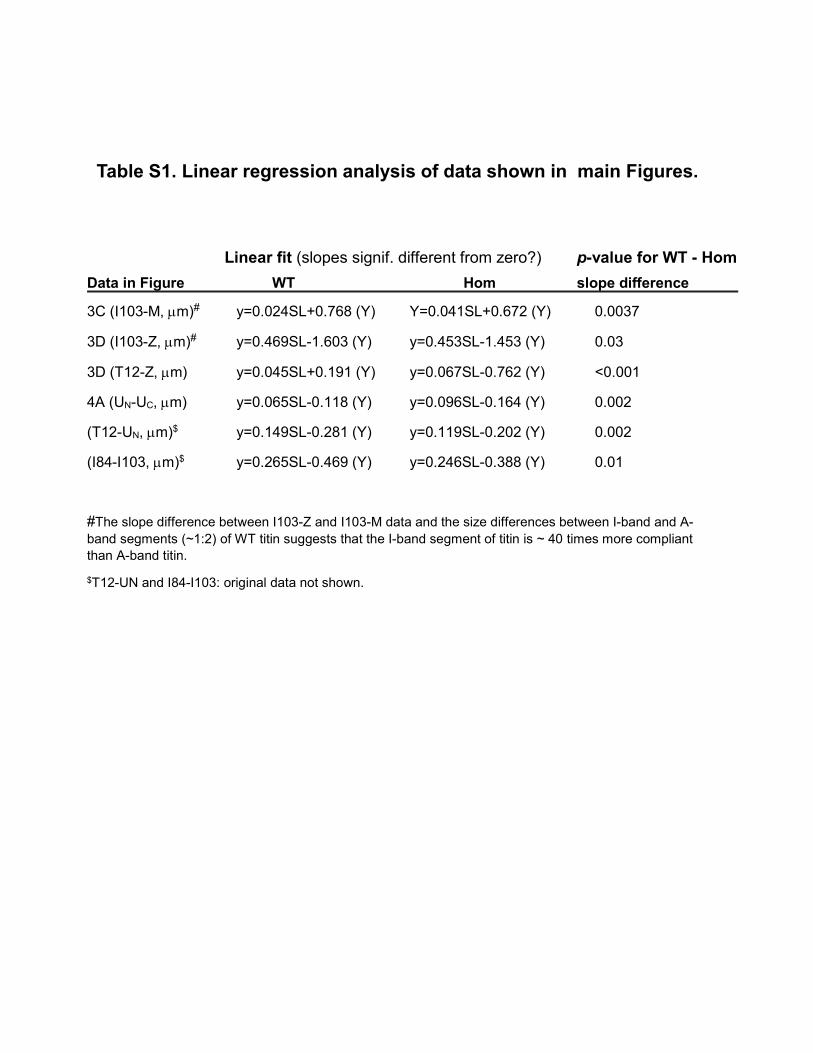
Table S1. Linear regression analysis of data shown in main Figures.
Linear fit (slopes signif. different from zero?) p-value for WT - Hom
Data in Figure WT Hom slope difference
3C (I103-M, m)# y=0.024SL+0.768 (Y) Y=0.041SL+0.672 (Y) 0.0037
3D (I103-Z, m)# y=0.469SL-1.603 (Y) y=0.453SL-1.453 (Y) 0.03
3D (T12-Z, m) y=0.045SL+0.191 (Y) y=0.067SL-0.762 (Y) <0.001
4A (UN-UC, m) y=0.065SL-0.118 (Y) y=0.096SL-0.164 (Y) 0.002
(T12-UN, m)$ y=0.149SL-0.281 (Y) y=0.119SL-0.202 (Y) 0.002
(I84-I103, m)$ y=0.265SL-0.469 (Y) y=0.246SL-0.388 (Y) 0.01
#The slope difference between I103-Z and I103-M data and the size differences between I-band and A-band segments (~1:2) of WT titin suggests that the I-band segment of titin is ~ 40 times more compliant than A-band titin.
$T12-UN and I84-I103: original data not shown.
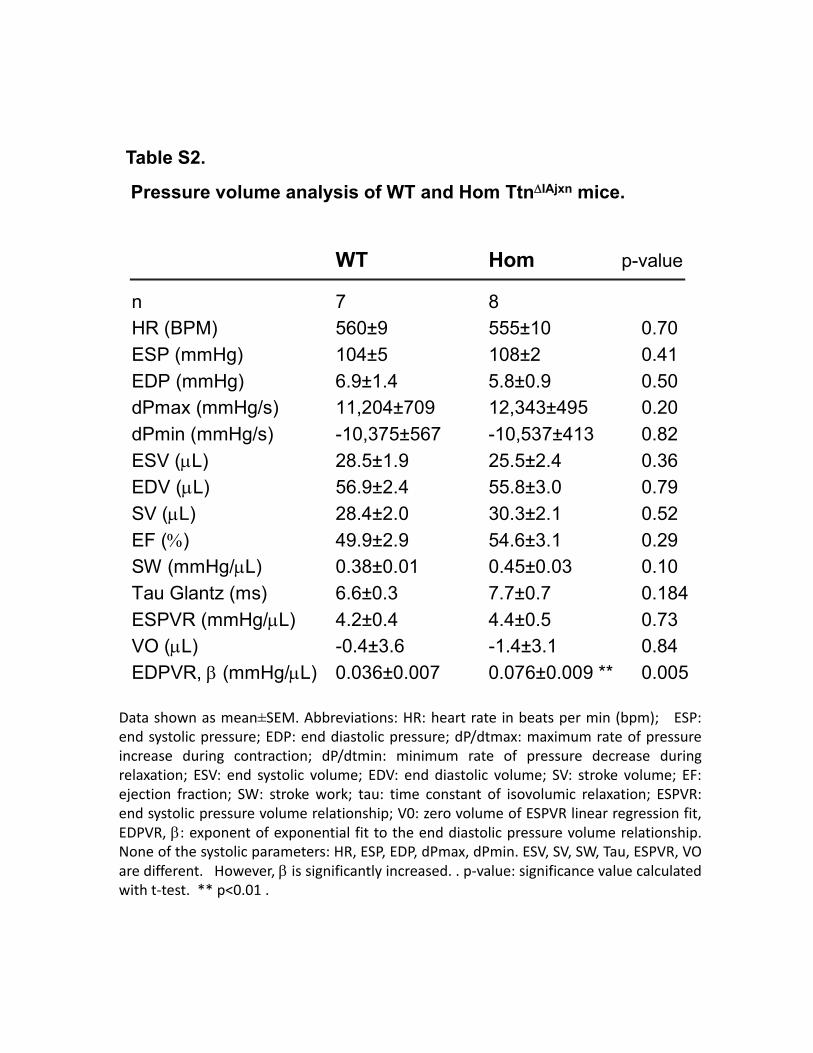
Table S2.
Pressure volume analysis of WT and Hom TtnIAjxn mice.
Data shown as mean±SEM. Abbreviations: HR: heart rate in beats per min (bpm); ESP:end systolic pressure; EDP: end diastolic pressure; dP/dtmax: maximum rate of pressureincrease during contraction; dP/dtmin: minimum rate of pressure decrease duringrelaxation; ESV: end systolic volume; EDV: end diastolic volume; SV: stroke volume; EF:ejection fraction; SW: stroke work; tau: time constant of isovolumic relaxation; ESPVR:end systolic pressure volume relationship; V0: zero volume of ESPVR linear regression fit,EDPVR, : exponent of exponential fit to the end diastolic pressure volume relationship.None of the systolic parameters: HR, ESP, EDP, dPmax, dPmin. ESV, SV, SW, Tau, ESPVR, VOare different. However, is significantly increased. . p‐value: significance value calculatedwith t‐test. ** p<0.01 .
WT Hom p-value
n 7 8
HR (BPM) 560±9 555±10 0.70
ESP (mmHg) 104±5 108±2 0.41
EDP (mmHg) 6.9±1.4 5.8±0.9 0.50
dPmax (mmHg/s) 11,204±709 12,343±495 0.20
dPmin (mmHg/s) -10,375±567 -10,537±413 0.82
ESV (L) 28.5±1.9 25.5±2.4 0.36
EDV (L) 56.9±2.4 55.8±3.0 0.79
SV (L) 28.4±2.0 30.3±2.1 0.52
EF () 49.9±2.9 54.6±3.1 0.29
SW (mmHg/L) 0.38±0.01 0.45±0.03 0.10
Tau Glantz (ms) 6.6±0.3 7.7±0.7 0.184
ESPVR (mmHg/L) 4.2±0.4 4.4±0.5 0.73
VO (L) -0.4±3.6 -1.4±3.1 0.84
EDPVR, (mmHg/L) 0.036±0.007 0.076±0.009 ** 0.005
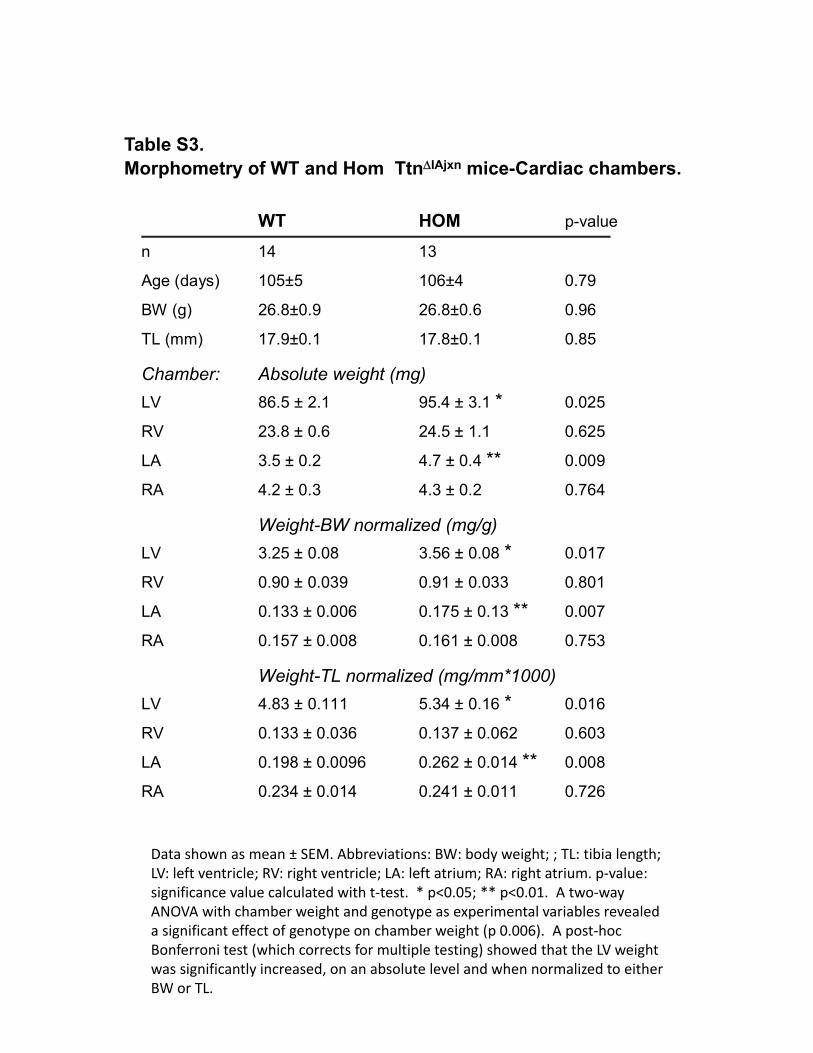
Table S3. Morphometry of WT and Hom TtnIAjxn mice-Cardiac chambers.
Data shown as mean ± SEM. Abbreviations: BW: body weight; ; TL: tibia length; LV: left ventricle; RV: right ventricle; LA: left atrium; RA: right atrium. p‐value: significance value calculated with t‐test. * p<0.05; ** p<0.01. A two‐way ANOVA with chamber weight and genotype as experimental variables revealed a significant effect of genotype on chamber weight (p 0.006). A post‐hoc Bonferroni test (which corrects for multiple testing) showed that the LV weight was significantly increased, on an absolute level and when normalized to either BW or TL.
WT HOM p-value
n 14 13
Age (days) 105±5 106±4 0.79
BW (g) 26.8±0.9 26.8±0.6 0.96
TL (mm) 17.9±0.1 17.8±0.1 0.85
Chamber: Absolute weight (mg)
LV 86.5 ± 2.1 95.4 ± 3.1 * 0.025
RV 23.8 ± 0.6 24.5 ± 1.1 0.625
LA 3.5 ± 0.2 4.7 ± 0.4 ** 0.009
RA 4.2 ± 0.3 4.3 ± 0.2 0.764
Weight-BW normalized (mg/g)
LV 3.25 ± 0.08 3.56 ± 0.08 * 0.017
RV 0.90 ± 0.039 0.91 ± 0.033 0.801
LA 0.133 ± 0.006 0.175 ± 0.13 ** 0.007
RA 0.157 ± 0.008 0.161 ± 0.008 0.753
Weight-TL normalized (mg/mm*1000)
LV 4.83 ± 0.111 5.34 ± 0.16 * 0.016
RV 0.133 ± 0.036 0.137 ± 0.062 0.603
LA 0.198 ± 0.0096 0.262 ± 0.014 ** 0.008
RA 0.234 ± 0.014 0.241 ± 0.011 0.726
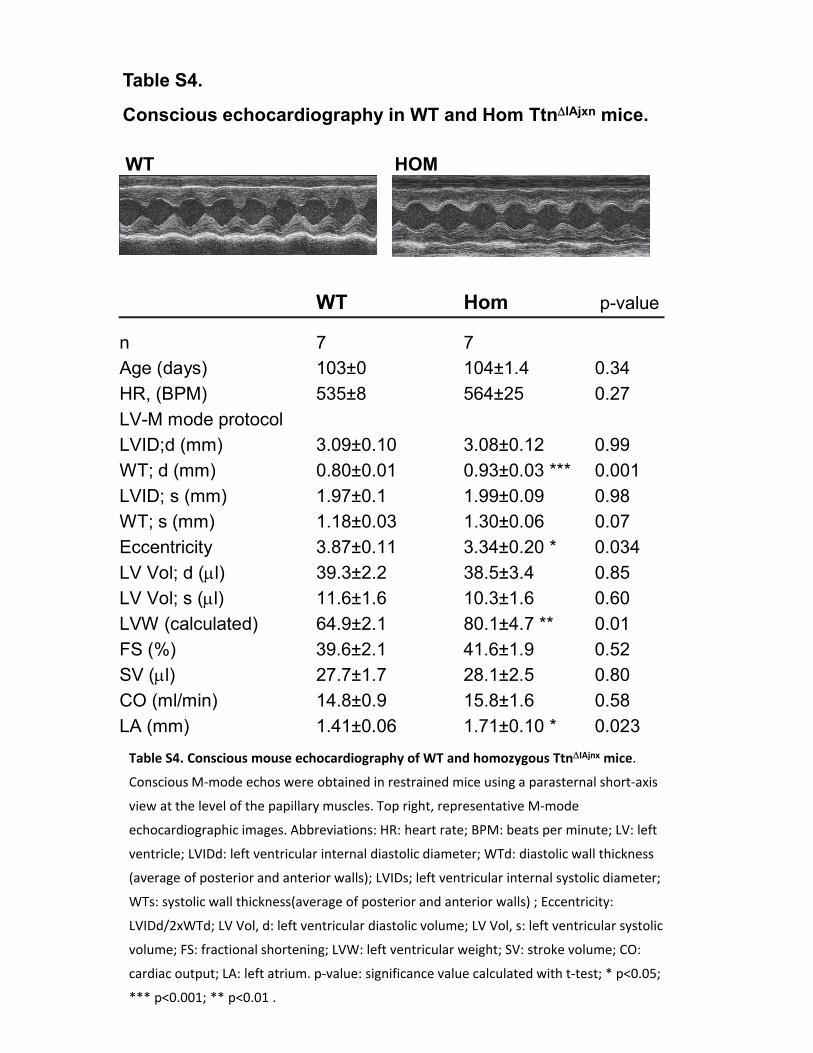
Table S4.
Conscious echocardiography in WT and Hom TtnIAjxn mice.
Table S4. Conscious mouse echocardiography of WT and homozygous TtnIAjnx mice.
Conscious M‐mode echos were obtained in restrained mice using a parasternal short‐axis
view at the level of the papillary muscles. Top right, representative M‐mode
echocardiographic images. Abbreviations: HR: heart rate; BPM: beats per minute; LV: left
ventricle; LVIDd: left ventricular internal diastolic diameter; WTd: diastolic wall thickness
(average of posterior and anterior walls); LVIDs; left ventricular internal systolic diameter;
WTs: systolic wall thickness(average of posterior and anterior walls) ; Eccentricity:
LVIDd/2xWTd; LV Vol, d: left ventricular diastolic volume; LV Vol, s: left ventricular systolic
volume; FS: fractional shortening; LVW: left ventricular weight; SV: stroke volume; CO:
cardiac output; LA: left atrium. p‐value: significance value calculated with t‐test; * p<0.05;
*** p<0.001; ** p<0.01 .
WT Hom p-value
n 7 7
Age (days) 103±0 104±1.4 0.34
HR, (BPM) 535±8 564±25 0.27
LV-M mode protocol
LVID;d (mm) 3.09±0.10 3.08±0.12 0.99
WT; d (mm) 0.80±0.01 0.93±0.03 *** 0.001
LVID; s (mm) 1.97±0.1 1.99±0.09 0.98
WT; s (mm) 1.18±0.03 1.30±0.06 0.07
Eccentricity 3.87±0.11 3.34±0.20 * 0.034
LV Vol; d (l) 39.3±2.2 38.5±3.4 0.85
LV Vol; s (l) 11.6±1.6 10.3±1.6 0.60
LVW (calculated) 64.9±2.1 80.1±4.7 ** 0.01
FS (%) 39.6±2.1 41.6±1.9 0.52
SV (l) 27.7±1.7 28.1±2.5 0.80
CO (ml/min) 14.8±0.9 15.8±1.6 0.58
LA (mm) 1.41±0.06 1.71±0.10 * 0.023
WT HOM
WT HOM p-value
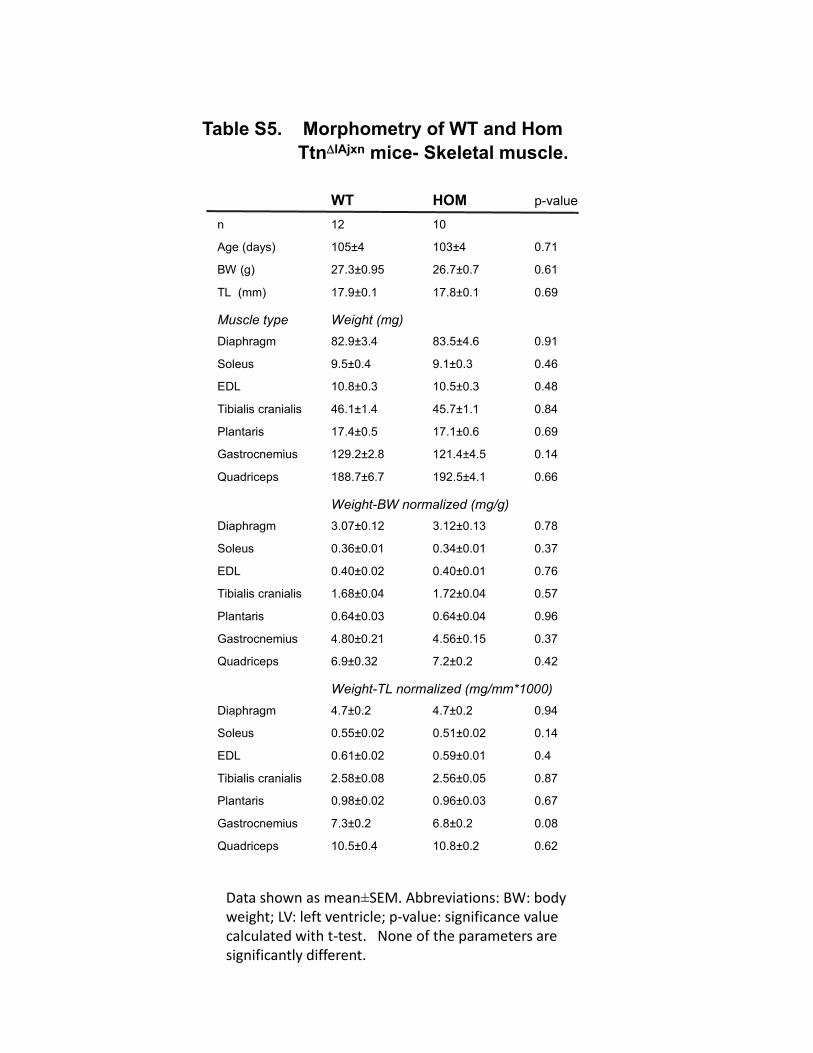
n 12 10
Age (days) 105±4 103±4 0.71
BW (g) 27.3±0.95 26.7±0.7 0.61
TL (mm) 17.9±0.1 17.8±0.1 0.69
Muscle type Weight (mg)
Diaphragm 82.9±3.4 83.5±4.6 0.91
Soleus 9.5±0.4 9.1±0.3 0.46
EDL 10.8±0.3 10.5±0.3 0.48
Tibialis cranialis 46.1±1.4 45.7±1.1 0.84
Plantaris 17.4±0.5 17.1±0.6 0.69
Gastrocnemius 129.2±2.8 121.4±4.5 0.14
Quadriceps 188.7±6.7 192.5±4.1 0.66
Weight-BW normalized (mg/g)
Diaphragm 3.07±0.12 3.12±0.13 0.78
Soleus 0.36±0.01 0.34±0.01 0.37
EDL 0.40±0.02 0.40±0.01 0.76
Tibialis cranialis 1.68±0.04 1.72±0.04 0.57
Plantaris 0.64±0.03 0.64±0.04 0.96
Gastrocnemius 4.80±0.21 4.56±0.15 0.37
Quadriceps 6.9±0.32 7.2±0.2 0.42
Weight-TL normalized (mg/mm*1000)
Diaphragm 4.7±0.2 4.7±0.2 0.94
Soleus 0.55±0.02 0.51±0.02 0.14
EDL 0.61±0.02 0.59±0.01 0.4
Tibialis cranialis 2.58±0.08 2.56±0.05 0.87
Plantaris 0.98±0.02 0.96±0.03 0.67
Gastrocnemius 7.3±0.2 6.8±0.2 0.08
Quadriceps 10.5±0.4 10.8±0.2 0.62
Data shown as mean±SEM. Abbreviations: BW: body weight; LV: left ventricle; p‐value: significance value calculated with t‐test. None of the parameters are significantly different.
Table S5. Morphometry of WT and HomTtnIAjxn mice- Skeletal muscle.
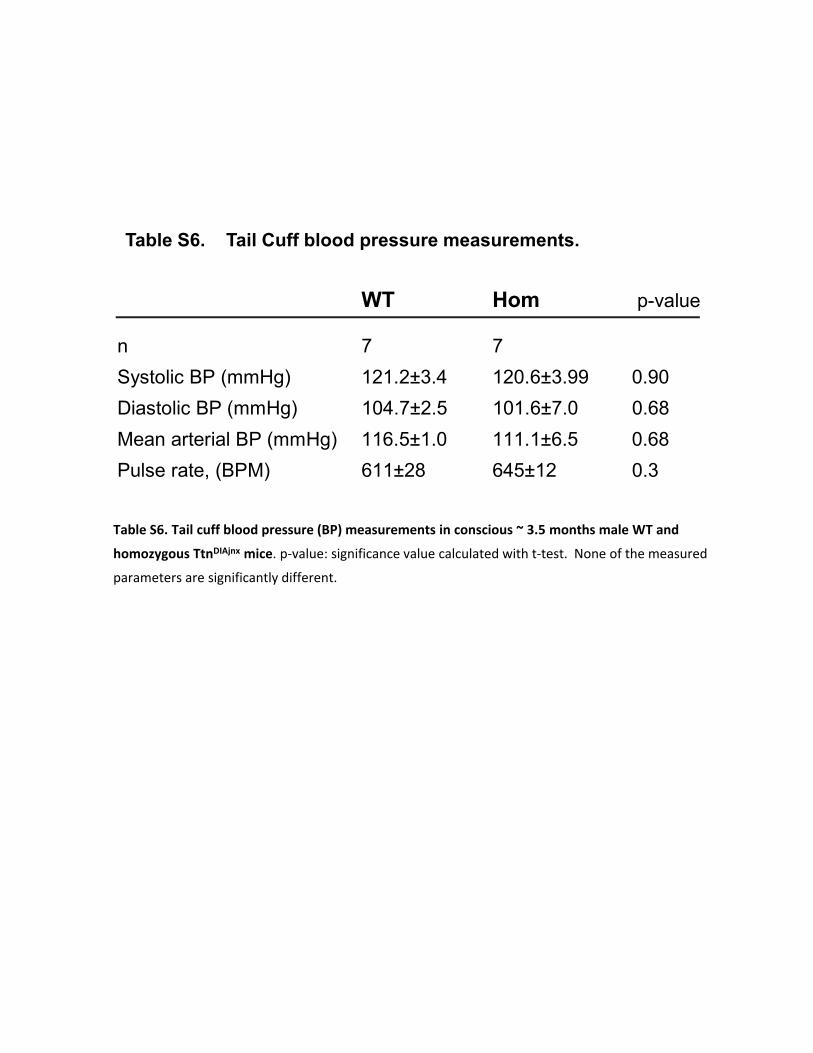
Table S6. Tail cuff blood pressure (BP) measurements in conscious ~ 3.5 months male WT and
homozygous TtnDIAjnx mice. p‐value: significance value calculated with t‐test. None of the measured
parameters are significantly different.
Table S6. Tail Cuff blood pressure measurements.
WT Hom p-value
n 7 7
Systolic BP (mmHg) 121.2±3.4 120.6±3.99 0.90
Diastolic BP (mmHg) 104.7±2.5 101.6±7.0 0.68
Mean arterial BP (mmHg) 116.5±1.0 111.1±6.5 0.68
Pulse rate, (BPM) 611±28 645±12 0.3
251 269
Fold difference (Hom/W
T)
Exon number in mouse TTN
WT Hom p-value
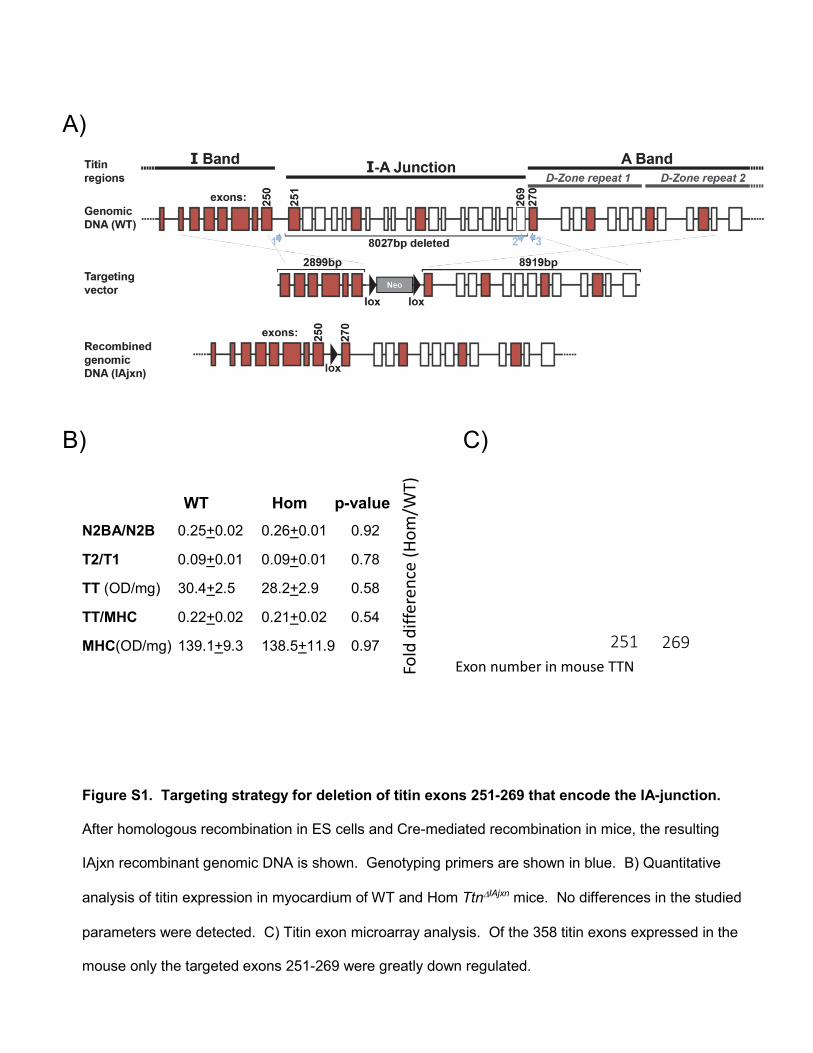
N2BA/N2B 0.25+0.02 0.26+0.01 0.92
T2/T1 0.09+0.01 0.09+0.01 0.78
TT (OD/mg) 30.4+2.5 28.2+2.9 0.58
TT/MHC 0.22+0.02 0.21+0.02 0.54
MHC(OD/mg) 139.1+9.3 138.5+11.9 0.97
B)
A)
C)
Figure S1. Targeting strategy for deletion of titin exons 251-269 that encode the IA-junction.
After homologous recombination in ES cells and Cre-mediated recombination in mice, the resulting
IAjxn recombinant genomic DNA is shown. Genotyping primers are shown in blue. B) Quantitative
analysis of titin expression in myocardium of WT and Hom TtnIAjxn mice. No differences in the studied
parameters were detected. C) Titin exon microarray analysis. Of the 358 titin exons expressed in the
mouse only the targeted exons 251-269 were greatly down regulated.
WT
Hom
WT
Hom
Distance (m)
WT
Hom
B)
Intensity (A.U.)
Intensity (A.U.)
0
2 104
4 104
6 104
0.0 1.0 2.0 3.0
0
2 104
4 104
6 104
0
2 104
4 104
6 104
0
2 104
4 104
6 104
0.0 1.0 2.0 3.0
SIM
I103 I103
T12 T12
A)
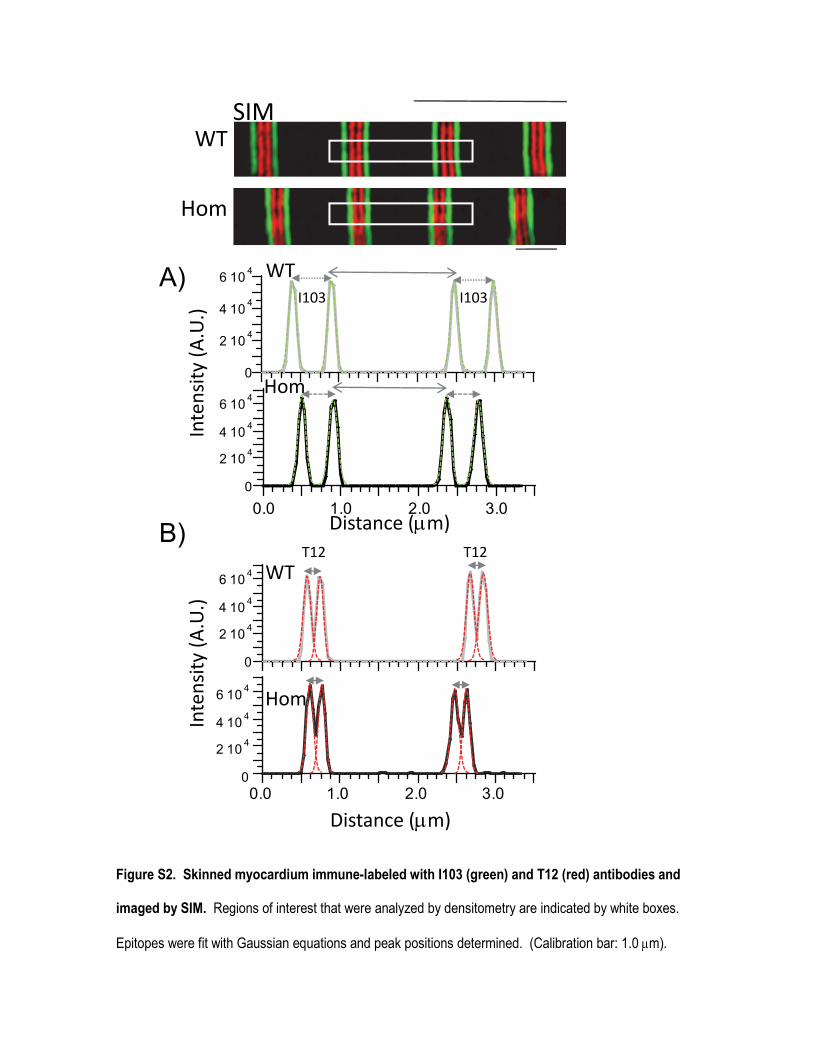
Figure S2. Skinned myocardium immune-labeled with I103 (green) and T12 (red) antibodies and
imaged by SIM. Regions of interest that were analyzed by densitometry are indicated by white boxes.
Epitopes were fit with Gaussian equations and peak positions determined. (Calibration bar: 1.0 m).
Distance (m)
sinVM
cosE M
****
**
EM W
T
EM H
om
VM W
T
VM H
om
Mo
du
lus
(pN
/mo
lecu
le)
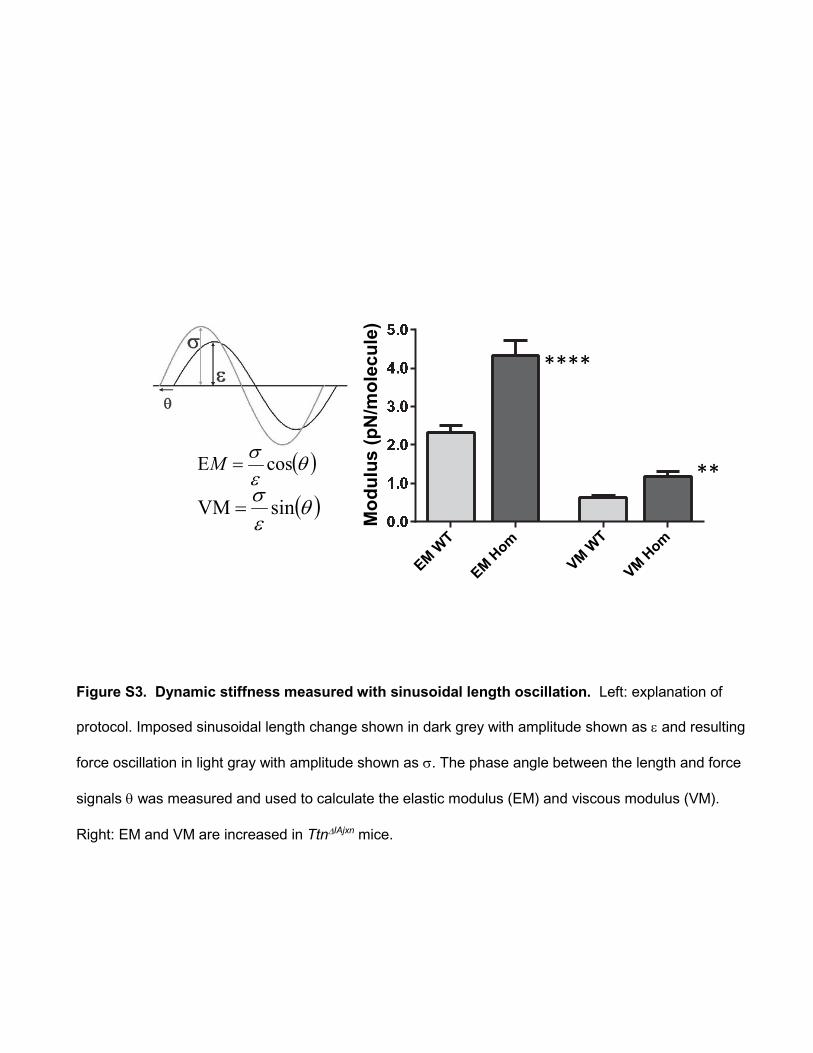
Figure S3. Dynamic stiffness measured with sinusoidal length oscillation. Left: explanation of
protocol. Imposed sinusoidal length change shown in dark grey with amplitude shown as and resulting
force oscillation in light gray with amplitude shown as . The phase angle between the length and force
signals was measured and used to calculate the elastic modulus (EM) and viscous modulus (VM).
Right: EM and VM are increased in TtnIAjxn mice.
**A) B) C)
BN
P/C
ypA
*
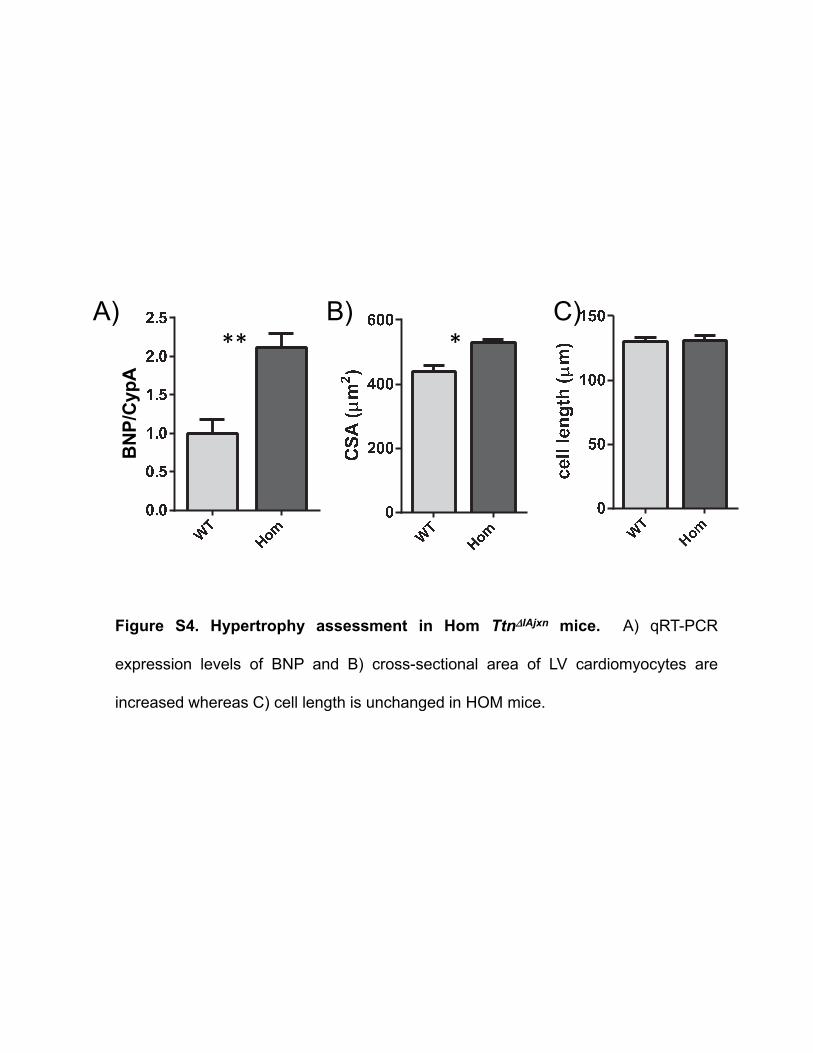
Figure S4. Hypertrophy assessment in Hom TtnIAjxn mice. A) qRT-PCR
expression levels of BNP and B) cross-sectional area of LV cardiomyocytes are
increased whereas C) cell length is unchanged in HOM mice.
WT
Hom
skm
Act
in/C
ypA
WT
Hom
0.0
0.5
1.0
1.5
2.0
WT
Hom
0.0
0.5
1.0
1.5
2.0
A) B)
C) D)
Neonate
αβ
WT Hom WT Hom
E)
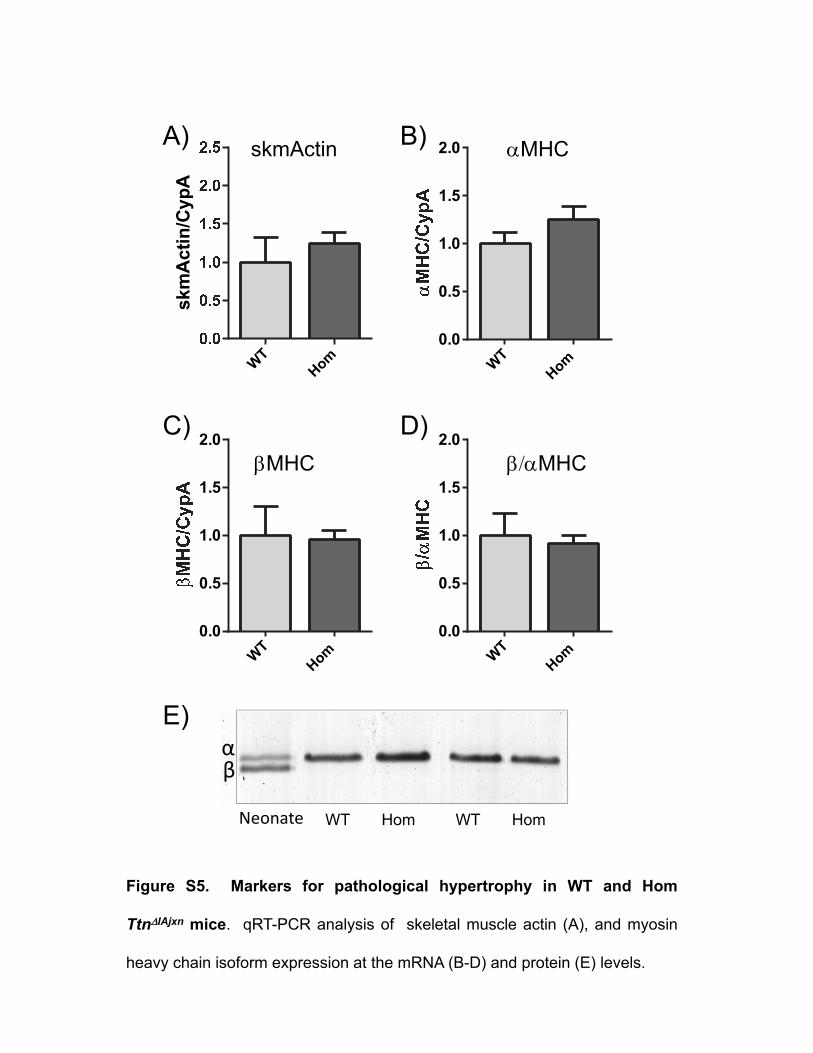
Figure S5. Markers for pathological hypertrophy in WT and Hom
TtnIAjxn mice. qRT-PCR analysis of skeletal muscle actin (A), and myosin
heavy chain isoform expression at the mRNA (B-D) and protein (E) levels.
WT
Hom
0.0
0.5
1.0
1.5
2.0
MHC
MHC MHC
skmActin
N.S.
B)
N.S.N.S.
N.S.
A)
N.S.
N.S.N.S.
C) D)
5 10 20 400
25
50
75
100
125
Stretch ampl. (% of slack length)
Pas
sive
Ten
sio
n (
mN
/mm
2)
HomWT
1 5 10 20 40 60 8010015
020
025
0
Act
ive
Ten
sio
n (
mN
/mm
2)
Maximal tetanic tension Time to Max tension
N.S.
Active tension-frequency relationPassive tension - length relation
1
050
100150200250300350
WT HOM
1
0.00
0.05
0.10
0.15
0.20
se
c
WT HOM
N.S.
E) Half-relaxation time F)
N.S.
Fatigue (force of 75th tetanus)
1
0.00
0.01
0.02
0.03
0.04
WT HOM1
0.00
0.05
0.10
0.15
WT HOM
1
1.1
1.2
1.3
1.4
1.5
1.6
A-b
and
wid
th (
m)
WT HOM
A-band width
30
90
150
0.0 0.50 1.0 1.5 2.0 2.5 3.0
HOM
WT
1.52 m 1.52 m
G)
H)
30
90
150
0.0 0.50 1.0 1.5 2.0 2.5 3.0
Figure S6‐caption is on next page
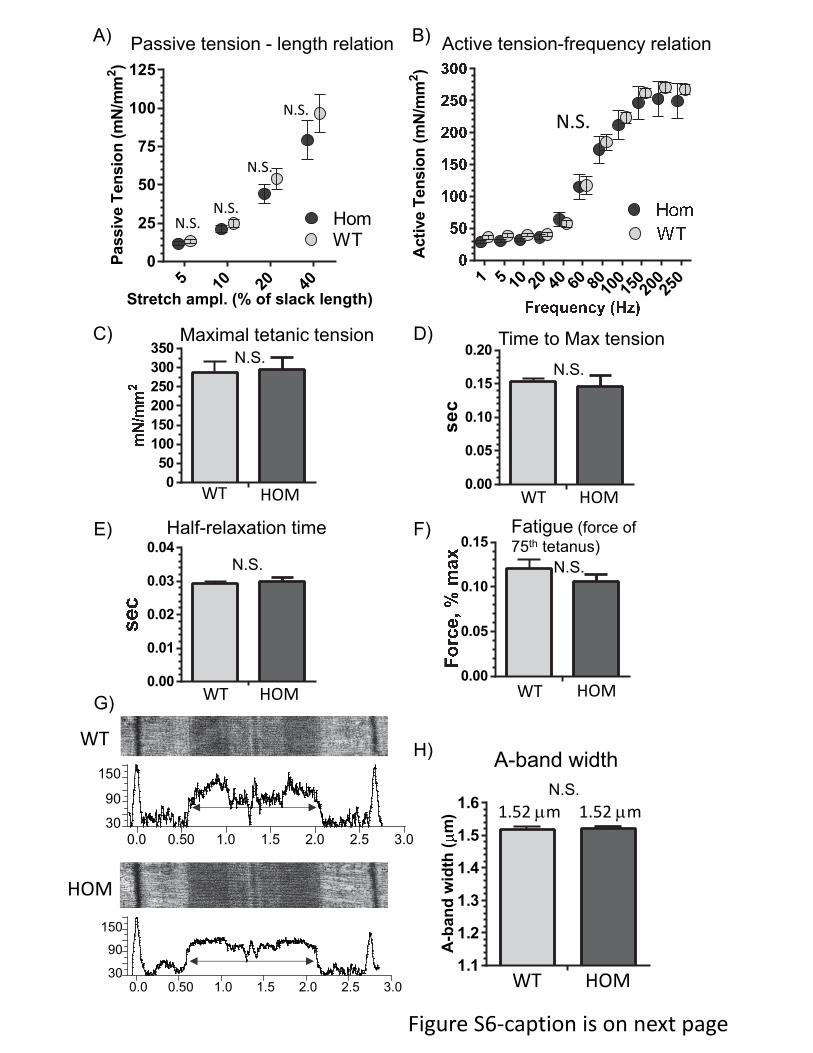
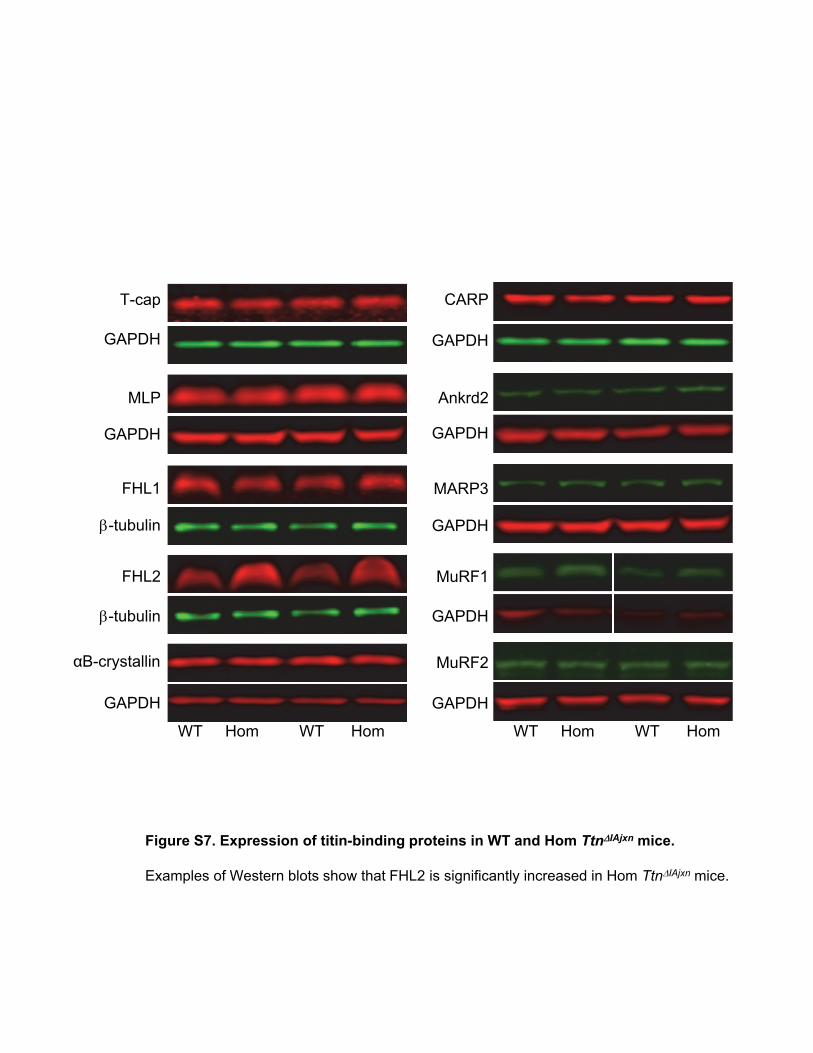
From previous page. Figure S6. Characterizing extensor digitorum longus (EDL)
muscle in WT and Hom TtnIAjxn mice. A) Passive tension - muscle length relation. B)
Active tension – stimulation frequency relation. C) Maximal tetanic tension. D) Time to
maximal tetanic tension. E) Half relaxation time when maximal tetanic contraction is
terminated) A-band width measurement in intact and skinned muscle measured by
electron microscopy. F) Fatigue (force at the end of a train of 75 tetani, see Methods).
No differences were found in any of the parameters between WT and Hom TtnIAjxn mice.
G) Representative transmission electronmicrographs of WT (top) and Hom TtnIAjxn
sarcomere (intact EDL muscle) with densitometry profiles shown at bottom. H) A-band
width measurements from electron micrographs of intact muscle. There are no
difference between WT and Hom mice.
CARP
GAPDH
Ankrd2
GAPDH
MARP3
GAPDH
MuRF2
GAPDH
MuRF1
GAPDH
T-cap
GAPDH
MLP
GAPDH
FHL2
-tubulin
FHL1
-tubulin
αB-crystallin
GAPDH
WT Hom WT Hom WT Hom WT Hom
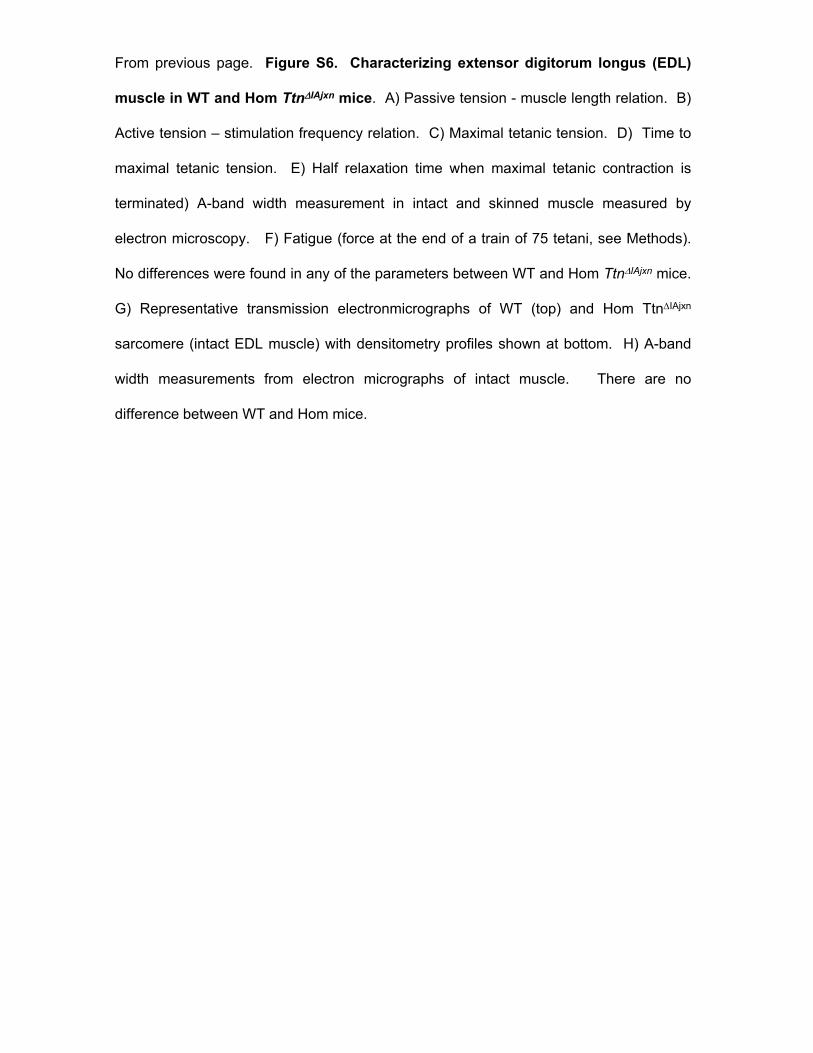
Figure S7. Expression of titin-binding proteins in WT and Hom TtnIAjxn mice.
Examples of Western blots show that FHL2 is significantly increased in Hom TtnIAjxn mice.
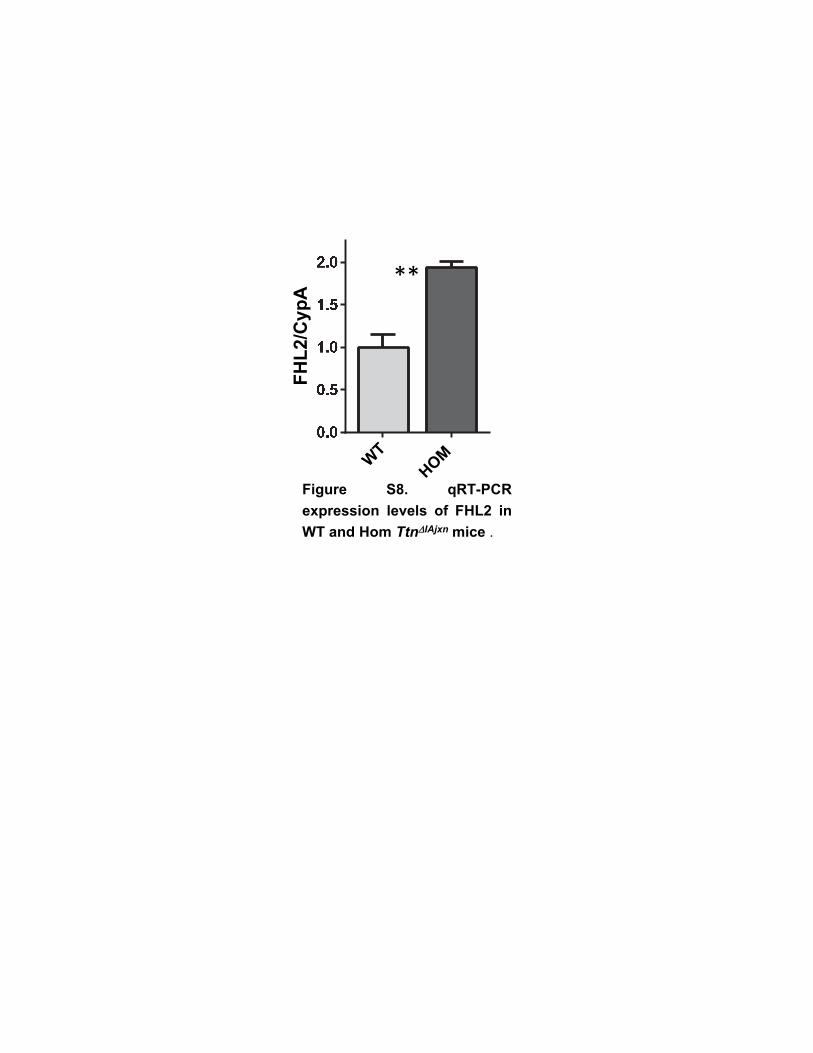
**
Figure S8. qRT-PCR
expression levels of FHL2 in
WT and Hom TtnIAjxn mice .
WT
HOM
FH
L2/
Cyp
A
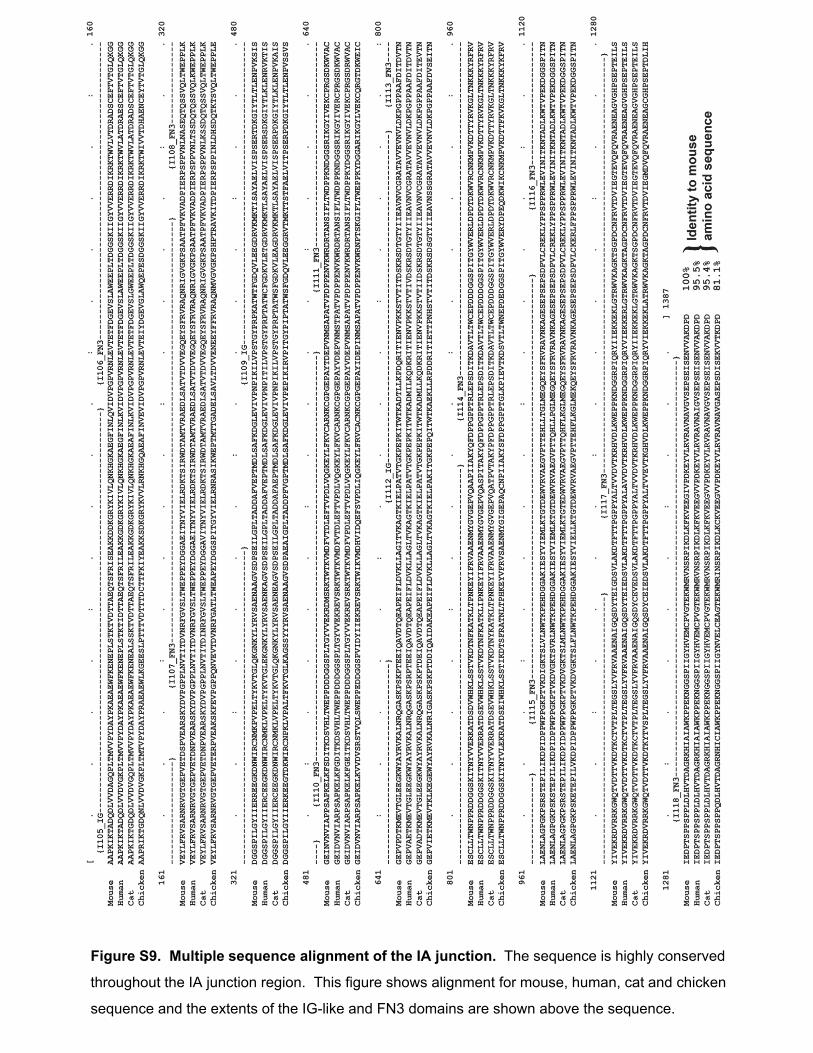
Figure S9. Multiple sequence alignment of the IA junction. The sequence is highly conserved
throughout the IA junction region. This figure shows alignment for mouse, human, cat and chicken
sequence and the extents of the IG-like and FN3 domains are shown above the sequence.
**
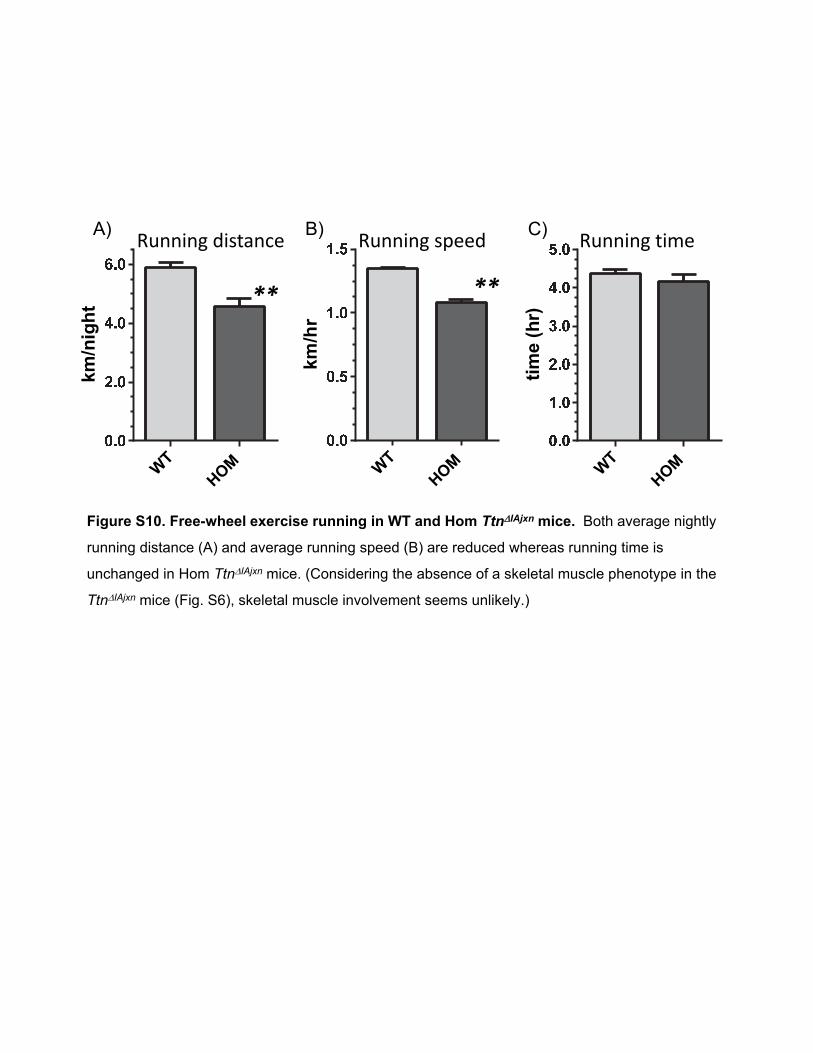
Figure S10. Free-wheel exercise running in WT and Hom TtnIAjxn mice. Both average nightly
running distance (A) and average running speed (B) are reduced whereas running time is
unchanged in Hom TtnIAjxn mice. (Considering the absence of a skeletal muscle phenotype in the
TtnIAjxn mice (Fig. S6), skeletal muscle involvement seems unlikely.)
WT
HOM
km/n
igh
t
WT
HOM
km/h
r**
Running distance Running speed
WT
HOM
tim
e (h
r)
Running timeB) A) C)
1
Supplemental Methods
GENERATION OF MICE DEFICIENT IN THE IA-JUNCTION. Targeting vector construction. The
knockout targeting vector was constructed using the recombineering technique described by Liu et al
(1). A 19,825 bp genomic DNA fragment (position chr2:76,779,615 – 76,799,439; GRCm38/mm10
Assembly) containing exon 245-282 of the gene was cloned. A fragment of 8026 bps containing exons
251-269 was replaced by a floxed PGK-neo (PL452) cassette. The 5’ homologous arm was 2899 bp
and the 3’ homologous arm was 8919 bp long. ES cell targeting and screening. The targeting vector
was linearized with Not1 and electroporated into D1 ES cells which were derived from F1 hybrid
blastocyst of 129S6 x C57BL/6J by the Gene Targeting & Transgenic Facility at University of
Connecticut Health Center. G418-resistant ES colonies were isolated and screened for homologous
recombination by nested PCR using primers outside the construct paired with primers inside the neo
cassette. Primer sequences were as follows: 5’ arm forward primers: GTGAATGTGAAGGCTTTCTTT
and CTTCCAACTTTTTCTTTCCAG, 3’ arm reverse primers: CTGATGGAGCCTAACAATGAATG and
GGAACAAATAGCAAGCATCAC. Clones PCR-positive for both arms were expanded for generation of
chimeric mice. Chimera generation and mice genotype. Confirmed targeted ES cells were
aggregated with 8-cell embryos of CD-1 strain. The aggregated embryos were transferred to
pseudopregnant recipients and allowed to develop to term. Chimeric mice were identified by coat color
and offspring from two chimeras from each line were tested for germline transmission of the targeted
allele. The neo cassette was removed by mating the chimeras with a Cre deleter strain (129S1-
Hprttm1(cre)Mnn Stock Number 004302, Jackson Laboratory, Bar Harbor, ME). The F1 pups with the neo
cassette removed were genotyped by PCR using primers:
WTfor, GTGTCAGTGAGCCATCTGAA; IAjxnfor, GATGGTATGCCATCTTCACC, and Rev,
GCCATCTTTATGCCAGCTCA (products: 267bp WT and 417bp IAjxn).
Mice were subsequently bred onto a C57BL/6J background (Stock Number 000664, Jackson
Laboratory) for 8 generations. Template DNA for genotyping was digested from tail tips using Tail Lysis
2
Buffer (0.1mM Tris pH 8.8, 5mM EDTA, 0.2M NaCl, 0.2% SDS) and 0.4 mg/mL proteinase K
(Worthington Biochemical Corporation) at 55oC overnight. The reaction was carried out for 32 cycles
(94oC 20s, 55oC 30s and 72oC 30s) followed by one cycle of 72oC for 5 min. 1 µL of the template was
amplified using GoTaq Green Master Mix (Promega) in a 20 µL PCR reaction. The heterozygous mice
produce litters at Mendelian ratios and breeding was performed with both heterozygous and
homozygous breeding schemes. Periodic backcrossing of homozygous breeders to C57BL/6J line
was performed to eliminate genetic drift. In our studies we used mice ~ 4 months old and male, unless
indicated otherwise.
TRANSMISSION ELECTRON MICROSCOPY (TEM). Electron microscopy and IEM was performed in
WT and Hom TtnIAjxn mice. Intact Muscle. Intact muscle (in situ fixation) was performed in anesthetized
and ventilated mice using isoflurane delivered in 100% oxygen. A midline sternotomy was performed and
a 27G needle was placed into the apex of the left ventricle to prevent pressure accumulation prior to
slowly infusing 3 mL of an arresting solution containing 30mM KCl and 30mM BDM in HEPES ([in mmol/L]
133.5 NaCl, 5 KCl, 1.2 NaH2PO4, 1.2 MgSO4, 30 BDM, 10 HEPES, pH 7.4) into the left atrium. Following
the flow of arresting solution, a cold solution of 3% glutaraldehyde and 3% paraformaldehyde containing
0.03% tannic acid in PBS pH 7.2 was perfused for 5 minutes. Following fixation, muscles were then gently
removed with microscissors under microscope visualization (3X). The dissected muscles were then
placed in 3% paraformaldehyde in PBS for 30 minutes at 4 ºC. The muscles were rinsed for 15 minutes
in PBS containing protease inhibitors. A secondary fixation was performed in 3% glutaraldehyde
containing 0.03% tannic acid in PBS for 1 hour. After PBS rinses the muscles were post-fixed in 1%OsO4
in PBS for 30 minutes, and were then dehydrated in an ethanol graded series of increasing
concentrations. Following dehydration the muscles were first infiltrated with 100% propylene oxide then
a mix of 1:1 propylene oxide:Araldite, Embed 812 (Epon-812, EMS), and finally embedded in a pure
Araldite, Embed 812 resin. Ultrathin sections (~70 nm) were obtained with a Reichert-Jung
ultramicrotome and contrasted with 1% potassium permanganate and lead citrate. Longitudinal fiber
3
direction was aligned with the edge of the diamond knife during ultramicrotomy procedure. Samples were
observed in a TECNAI Spirit G2 electron microscope operated at 100 kV. SKINNED MUSCLE. Cervical
dislocation was performed and the heart was removed and placed into a petri dish containing relaxing
solution ([in mmol/L]: 10 BES, 10 EGTA, 6.56 MgCl2, 5.88 Na-ATP, 1 DTT, 46.35 potassium-propionate,
15 creatine phosphate) with 1% Triton X-100 and protease inhibitors ([in mmol/L] 0.1 E64, 0.4 leupeptin
and 0.5 PMSF). The muscles were removed and placed in a 5mL tube with skinning solution and placed
on a rotator at 4C overnight. The following day the muscles were washed with relaxing solution and were
stretched and fixed with 3% paraformaldehyde in PBS for 30 minutes at 4 ºC. The remaining methods
were identical to the preparation detailed for intact muscle electron microscopy. In a separate set of
experiments TEM studies were performed on intact extensor digitorum longus (EDL) muscle. Briefly, the
tendons of the EDL muscle were attached to silk suture while in a bath containing calcium-free Ringer
solution (145mM NaCl, 2.5mM KCL, 1.0mM MgSO4, 1.0mM HEPES, 10mM glucose, pH 7.4, 30°C). The
muscle was stretched ~15% and was then fixed in 2% paraformaldehyde and 2% glutaraldehyde
containing 0.03% tannic acid in PBS for 45 min and processed for EM as explained above.
IMMUNOELECTRON MICROSCOPY (IEM). Ultrastructural immunolocalization of the I103 epitope on
cardiac LV wall muscles from WT and Hom TtnIAjxn mice was performed on skinned stretched muscles
(detailed in previous section) by the pre-embedding technique with modifications as previously described
(2). Skinned muscle fixation was performed with 4% paraformaldehyde (PF; Sigma P-6148) in PBS at 4ºC
for 30 minutes, and washed first with PBS then with PBS containing protease inhibitors. Blocking was
performed with 1% BSA in PBS containing protease inhibitors for 1 hour at 4°C followed by overnight
incubation at 4°C with rabbit polyclonal anti-I103 antibody (2mg/ml) diluted 1:25 in the same buffer
containing 1% BSA and protease inhibitors. After rinsing in PBS with protease inhibitors, muscle tissues
were incubated overnight at 4°C with secondary Fab goat anti-rabbit antibody IgG (AP 132, Millipore) at
1:25 dilution in 1% BSA PBS containing protease inhibitors. For negative control the primary antibody
was omitted and replaced with 1% BSA in PBS containing protease inhibitors. Samples were washed in
4
PBS and a secondary fixation was performed with 3% glutaraldehyde in the same buffer for 30 minutes at
4 ºC. After rinsing with PBS, postfixation was performed with 1% OsO4 in PBS for 30 minutes at 4 ºC.
Subsequently, muscle tissues were washed with PBS and distilled water, dehydrated in a graded series
of ethanol (70%, 95%, 100%) and infiltrated with propylene oxide for 15 minutes, then in a mixture of 1:1
propylene oxide:Araldite/Embed 812 resin for 1hour at RT in a rotator followed by Araldite/Embed 812
alone, 3 changes for 30 minutes. After the infiltration, muscle tissues fragments were longitudinally
oriented in a plastic surface and prepared for embedding and polymerization for 48 hours at 60 ºC.
Ultrathin sections were contrasted in 1% potassium permanganate and lead citrate, and observed in a
Tecnai Spirit G2 electron microscope operated at 100 kV. Digital images were stored for further quantitative
analysis using ImageJ and results analyzed with Fityk.
STRUCTURED ILLUMINATION MICROSCOPY (SIM). Mice, dissection, and fixation was identical to that
performed for skinned muscle electron microscopy (see above). Muscles were embedded in Tissue-Tek
O.C.T. compound (Sakura Finetek) and immediately frozen in 2-methylbutane precooled in liquid N2. 5 m
cryosections were then cut and mounted onto number 1.5 coverslips. Tissue sections were permeablized
in 0.2% Triton X-100/PBS for 20 minutes at room temperature, blocked with 2% BSA and 1% normal
donkey serum in PBS for 1 hour at room temp, and incubated overnight at 4C with primary antibodies
diluted in PBS. The primary antibodies included: a chicken polyclonal anti-Titin UN (10 g/ml), a rabbit
polyclonal anti-Titin UC (2 g/ml), a rabbit polyclonal anti-Titin I84 (2 g/ml), a rabbit polyclonal anti-Titin
I103 (1 g/ml), a monoclonal anti-Titin T12 (2.5 g/ml) and a monoclonal anti--actinin (1:200) (EA-53,
Sigma) antibody. (See below for an antibody list.) Sections were then washed with PBS for 20 minutes,
and incubated with secondary antibodies/PBS for 1.5 hours. The secondary antibodies, obtained from
Invitrogen and Jackson Immunoresearch Laboratories, included: Alexa Fluor 594 conjugated goat anti-
rabbit IgG (1:600), Texas Red conjugated goat anti-chicken IgG (1:600), Alexa Fluor 488 conjugated goat
anti-rabbit IgG (1:1000), and Cascade Blue conjugated goat anti-mouse IgG (1:200). The sections were
5
then washed with PBS for 20 minutes and mounted onto slides with Aqua Poly/Mount (Polysciences Inc.).
Super resolution microscopy was performed using a Zeiss ELYRA S1 (SR-SIM) microscope equipped with
an AXIO Observer Z1 inverted microscope stand with transmitted (HAL), UV (HBO) and solid-state
(405/488/561 nm) laser illumination sources, a 60× objective (NA 1.45), and EM-CCD camera (Andor
iXon). Images were acquired with ZEN 2011 software, densitometry was performed in ImageJ and results
analyzed with Fityk. Densitometry profiles were background subtracted and epitope profiles were fit with
Gaussian curves to determine their peak location. Epitope distances were determined across the A-band
(Fig. 3A-C) or Z-disk (Fig. 3D; Fig. 4) and then divided by 2, to obtain epitope to M-band distance or epitope
to Z-disk distance, respectively.
Passive and active tension characteristics of skeletal muscle. Intact muscle mechanics was
performed using the Aurora 1200A in vitro test system that has been described previously (3, 4). Briefly,
EDL muscle was attached between a combination servomotor-force transducer and fixed hook via silk
suture in a bath containing oxygenated Ringer solution (145mM NaCl, 2.5mM KCL, 1.0mM MgSO4,
1.0mM CaCl2x2H2O, 1.0mM HEPES, 10mM glucose, pH 7.4, 30°C). For passive force the muscle was
stretched from slack length to 10%, 20% and 30% of the muscle length at 10% per sec. The muscle was
held for 60 seconds and then returned to slack length waiting seven minutes between each stretch.
Measured force in mN was normalized to cross-sectional area (muscle mass (mg)/ (L0 (mm)*1.056) to
obtain stress (mN/mm2). The optimal length (L0) was determined by adjusting muscle length until optimal
fiber length for maximal twitch force was achieved (pulse duration of 200 μs with biphasic polarity). Active
stress was determined from a force-frequency protocol. The muscle was stimulated at incremental
stimulation frequencies 1, 5, 10, 20, 40, 60, 80, 100, 150, 200, 250 Hz waiting 30, 30, 60, 90, 120, 120,
120, 120, 120, 120, 120 seconds, respectively, in between each activation. From these data, maximal
tetanic tension, time to maximal tetanic tension, and half-relaxation time of tetanic tension were
calculated. The muscle was then fatigued by stimulation for 1 sec at 60 Hz followed by three seconds of
6
rest for a total of 75 tetani. The data from each experiment were analyzed with Aurora's DMA software,
Microsoft Excel, and Kaleidagraph 3.6. When the experiment was completed muscles were dried with
blotting paper and were then weighed. The average cross-sectional area was obtained by dividing the
weight by the specific gravity of muscle (1.065) and by the muscle length.
SINGLE MOLECULE MODELING. Single molecule forces were calculated using the wormlike chain
(WLC) equation(5) using the measured extension of the N2B element (Fig. 4C). The contour length
(CL) was assumed to be 200 nm and the persistence lengths (PL) 0.5 nm, respectively. To avoid
volume-exclusion and self-interaction effects (6, 7) force was calculated at sarcomere lengths where
the fractional extension of the N2B element was >0.1 and we selected for this the 2.1-2.2 m SL range
and the 2.25-2.35 m SL range. (For additional details, see (8-11).) We then calculated the force of a
single titin molecule and compared results for WT with TtnIAjxn mice (Fig. 4D).
CARDIOMYOCYTE STUDIES. Cell isolation. Mice were heparinized (1,000 U/kg, i.p.) and
euthanized by cervical dislocation under isoflurane. The heart was removed and cannulated via the
aorta with a blunted 21-gauge needle for retrograde coronary perfusion. The heart was perfused for 4
min with perfusion buffer ([in mmol/L] 113 NaCl, 4.7 KCl, 0.6 KH2PO4, 0.6 Na2HPO4, 1.2 MgSO4, 12
NaHCO3, 10 KHCO3, 10 HEPES, 10 taurine, 5.5 glucose, 5 BDM, 20 Creatine, 5 Adenosine and 5
Inosin, pH 7.4), followed by digestion buffer (perfusion buffer plus 0.05 mg/ml Liberase TM research
grade; Roche Applied Science, and 13 µM CaCl2) for 20 min. When the heart was flaccid, digestion
was halted and the heart was placed in myocyte stopping buffer (perfusion buffer plus bovine calf
serum 0.08 [BCS]/ml and 8 µM CaCl2) with protease inhibitors ([in mmol/L] 0.4 Leupeptin, 0.1 E64, and
0.5 PMSF (Peptides International,Sigma-Aldrich)). The left ventricle was cut into small pieces, and the
rest of the heart was discarded. The small pieces of left ventricle were triturated several times with a
transfer pipette and then filtered through a 300µm nylon mesh filter. Skinned cells. Cells were
7
skinned for 7 min in relaxing solution ([in mmol/L] 40 BES, 10 EGTA, 6.56 MgCl2, 5.88 Na-ATP, 1.0
DTT, 46.35 K-propionate, 15 creatine phosphate, pH 7.0) with protease inhibitors ([in mmol/L] 0.4
leupeptin, 0.1 E64 , and 0.5 PMSF) and 0.3% Triton X-100 (Ultrapure; Thermo Fisher Scientific). Cells
were washed extensively with relaxing solution pCa 9 and stored on ice. Skinned myocytes were used
for mechanic studies within 48 h after time of cell isolation. Myocyte suspension was added to a room
temperature flow-through chamber mounted on the stage of an inverted microscope (Diaphot 200;
Nikon). Skinned myocyte was glued at one end to a force transducer (Model 406A or 403A, Aurora
Scientific). The other end was bent with a pulled glass pipette attached to micromanipulator so that the
myocyte axis aligned with the microscope optical axis and cross sectional area (CSA) was measured
directly. The cross sectional images of skinned cells were analyzed by ImageJ 1.41 software (National
Institutes of Health) and were used to convert measured force to stress and for cell dimension study
(Fig S4d). Then, the free end of the cell was glued to a servomotor (Model 308B, Aurora Scientific) that
imposes controlled stretches. Sarcomere length (SL) was measured with a MyocamS and SarcLen
acquisition module (IonWizard 6.2, IonOptix Co, MA) attached to a computer. Passive stress in
skinned myocytes. Passive stress was measured in relaxing solution pCa 9 with protease inhibitors at
room temperature. Cells were stretched from slack length at a speed of 1 base length/sec, followed by
a 20 sec hold and then a sinusoidal length oscillation (frequency 0.1-100 Hz, amplitude 5% base length
of the cell) and then a release back to the original length. Recovery time of at least 15 min in between
stretches was utilized to prevent memory-effects in subsequent measurements. Data were collected
using a custom LabVIEW VI (National Instruments, Austin TX) at a sample rate of 1 kHz. Obtained
passive forces were converted to force per titin molecule (assuming 3240 titin molecules per m2 of
myofibril and 50% of the cell’s cross-sectional area taken up by myofibrils(12)).
IN VIVO PRESSURE-VOLUME RELATIONSHIPS. In vivo pressure volume analysis was performed in
mice using a SciSense Advantage Admittance Derived Volume Measurement System and 1.2F
catheters with 4.5 mm electrode spacing (SciSense, London, Ontario, Canada). Mice were
8
anesthetized and ventilated with 1% isoflurane using a ventilator and body temperature maintained at
37oC. Four month old anesthetized mice were secured and a midline incision was made down the
neck. The muscles in the neck were separated and the right carotid artery was isolated from the vagus
nerve. The right carotid artery was cannulated and the catheter guided past the aortic valve. The
abdomen was opened below the sternum; the IVC was located and occluded during a sigh (pause) in
ventilation to acquire load-independent indices. Data acquisition and analysis was performed in
LabScribe2 (iWorx, Dover NH). Diastolic PV data was analyzed using a monoexponential fit (𝑃 =
𝐴𝑒𝛽𝑉)(13) with the exponent (β) reported as the stiffness.
ECHOCARDIOGRAPHY. Echocardiography was used to study LV wall thickness and chamber
dimensions in diastole and systole. We studied mice that were conscious to avoid the well-known
effects of anesthesia on wall thickness and chamber dimensions (14). A Vevo 2100 High Resolution
Imaging System (Visual-Sonics, Toronto, Canada) was used with the model MS550D scan head
designed for murine cardiac imaging. Care was taken to avoid animal contact and excessive pressure
which could induce bradycardia. Imaging was performed at a depth setting of 11 mm. Images were
collected and stored as a digital cine loop for off-line calculations. Mice were consciously echoed while
scruffing the skin at the nape of the neck and a standard short axis (M-mode) cine loop was recorded at
the level of the papillary muscles to asses chamber dimensions (LV systolic and diastolic dimensions
(LVDs, LVDd)) posterior and anterior wall thickness (WT), and cardiac function via Fractional
Shortening (%FS). Functional calculations were obtained according to American Society of
Echocardiography guidelines. In addition, the left atrial dimension was measured in the long-axis view
directly below the aortic valve leaflets. To investigate diastolic function we performed a Doppler echo
on anesthetized mice. (These studies are not possible on conscious mice). Anesthesia was induced
by intraperitoneal (i.p.) injection of ketamine hydrochloride (K2753, Sigma-Aldrich) 100 mg/kg plus
atropine sulfate (A0257, Sigma-Aldrich) 1.2 mg/kg. Following anesthetic induction, the mouse was
placed in dorsal recumbence on a heated platform for echocardiography. Body temperature was
9
maintained at 37°C and anesthesia was maintained with 0.5-1.0% isoflurane (USP, Phoenix) in 100%
oxygen. Transthoracic echo images was obtained with a Vevo 700 High Resolution Imaging System
(Visual-Sonics, Toronto, Canada) using the model 707B scan head designed for murine cardiac
imaging. Care was taken to avoid animal contact and excessive pressure which could induce
bradycardia. Imaging was performed at a depth setting of 1 cm. Images were collected and stored as a
digital cine loop for off-line calculations. Passive LV filling peak velocity, E (cm/sec), and atrial
contraction flow peak velocity, A (cm/sec), were acquired from the images of mitral valve Doppler flow
from tilted parasternal long axis views, according to American Society of Echocardiography guidelines.
A sweep speed of 100 mm/sec was used. The heart rate of animals was maintained in the range of 350
to 450 bpm for Doppler studies.
TISSUES COLLECTION. Mice were weighed, anesthetized with isoflurane and sacrificed by cervical
dislocation. The hearts were rapidly excised and placed into a dish containing HEPES buffer ([in
mmol/L] 133.5 NaCl, 5 KCl, 1.2 NaH2PO4, 1.2 MgSO4, 30 BDM, 10 HEPES). All four chambers were
removed, blotted and weighed separately. The left ventricle (LV) was further separated into 2 sections,
one of which was snap frozen in liquid nitrogen and the other placed into RNALater for subsequent
analysis. Additionally we determined weights of skeletal muscle. Tibias were removed and tibia length
was measured using a caliper.
TAIL CUFF BLOOD PRESSURE MEASUREMENT. Mice underwent blood pressure analysis utilizing
the Hatteras Instruments Blood Pressure Analysis System (Model MC4000) placing individual tails in
small cuffs, gently taping the tail and placing a magnetic cover over each mouse allowing for proper
measurements to be taken. Selected mice were conditioned two consecutive days prior to final analysis
by taking the measurements at the same time of the day in order to allow for mice to become
accustomed to the test. Analysis included five preliminary and ten measurement cycles holding a
constant temperature of 90°F with a maximum cuff pressure of 200 mmHg. Conditioning the mice
10
allowed for stable blood pressure measurements to be taken with low errors (at least 7/10
measurement cycles completed successfully).
EXERCISE TESTING. We used ~3.5 month old mice for voluntary exercise studies. Individual mice
were housed in a large cage that contained a free-running wheel. The exercise wheels have been
previously described(15). Briefly, an 11.5cm diameter wheel with a 5.0 cm wide running surface (6208;
PetSmart; Phoenix, AZ) was equipped with a digital magnetic counter (BC600, Sigma Sport, Olney Il)
that is activated by wheel rotation. Mice were given water and standard rodent feed ad libitum. Nightly
distance run, speed and run time were recorded. After an initial ~10 day ramp-up during which running
distance increased mice reached an approximate steady-state and the average distance, speed and
running time were measures during days 17-21 after starting the running protocol.
QUANTIFICATION OF PROTEIN EXPRESSION. Flash-frozen LV tissues were prepared as
previously described (16-18). Briefly, the LV tissues were flash frozen in liquid nitrogen and solubilized
between glass pestles cooled in liquid nitrogen. Tissues were primed at -20oC for a minimum of 20 min,
then suspended in 50% urea buffer ([in mol/L] 8 Urea, 2 Thiourea, 0.05 Tris-HCl, 0.075 Dithiothreitol
with 3% SDS and 0.03% Bromophenol blue pH 6.8) and 50% glycerol with protease inhibitors ([in
mmol/L ] 0.04 E64, 0.16 Leupeptin and 0.2 PMSF) at 60oC for 10 min. Then the samples were
centrifuged at 13000 rpm for 5 min, aliquoted and flash frozen in liquid nitrogen and stored at -80oC.
Titin isoform analysis was performed as previously described (18). Briefly, the solubilized samples
from each genotype (LV of TtnΔAIjnx +/+ (WT), +/- (Het), and -/- (Hom)) were electrophoresed on 1%
agarose gels using a vertical SDS-agarose gel system (Hoefer). Gels were run at 15 mA per gel for 3 h
and 20 min, then stained using Coomassie brilliant blue (Acros organics), scanned using a commercial
scanner (Epson 800, Epson Corporation, Long Beach CA) and analyzed using One-D scan
(Scanalytics Inc, Rockville MD). Each sample was loaded in a range of five volumes and the integrated
optical density (IOD) of titin and MHC were determined as a function of loading volume. The slope of
11
the linear relationship between IOD and loading was obtained for each protein to quantify expression
ratios. Expression levels were also quantified from LV with western blotting as previously described
(19). Solubilized samples were run on a 0.8% agarose gel in a vertical gel electrophoresis chamber.
Gels run at 15 mA per gel for 3 h and 20 min were then transferred onto PVDF membranes (Immobilon-
FL, Millipore) using a semi-dry transfer unit (Trans-Blot Cell, Bio-Rad, Hercules CA). Blots were stained
with Ponceau S (Sigma) to visualize the total protein transferred. Blots were then probed with primary
antibodies (see Table 1) followed with secondary antibodies conjugated with fluorescent dyes with
infrared excitation spectra (Biotium Company, Hayward CA). Blots were scanned using an Odyssey
Infrared Imaging System (Li-COR Biosciences, Lincoln NE) and the images were analyzed using Li-
COR software. Ponceau S scans were analyzed in One-D scan to normalize WB signal to protein
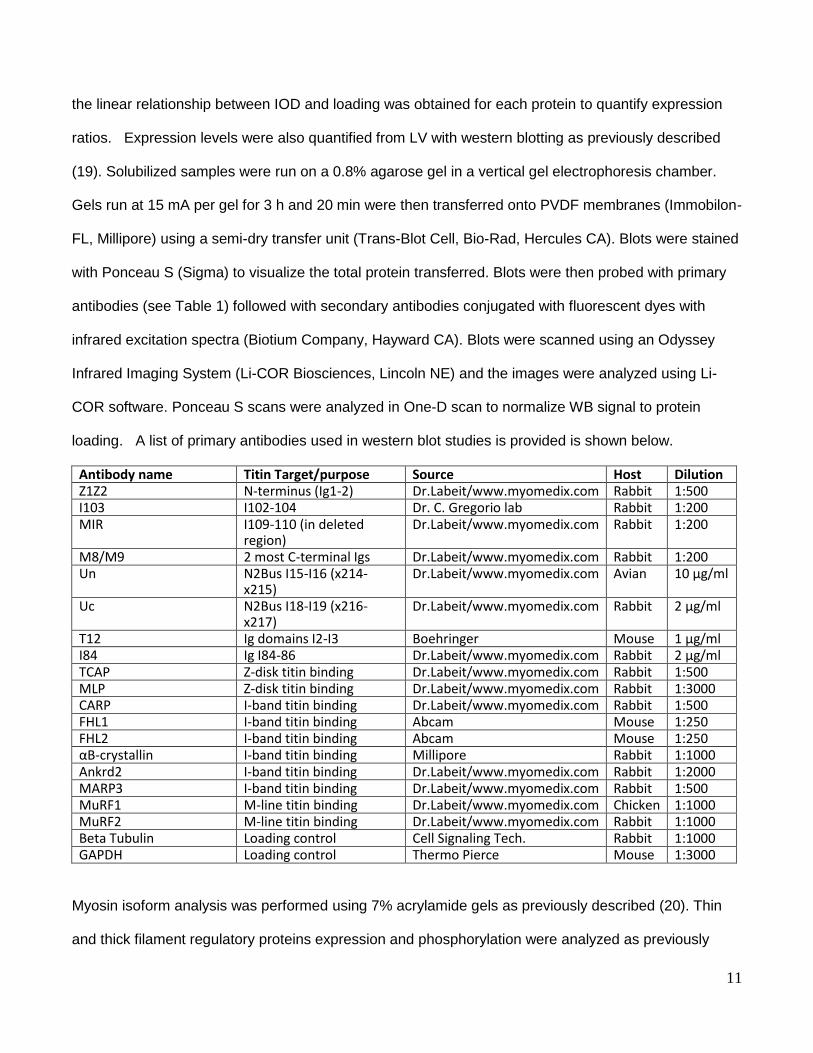
loading. A list of primary antibodies used in western blot studies is provided is shown below.
Antibody name Titin Target/purpose Source Host Dilution Z1Z2 N-terminus (Ig1-2) Dr.Labeit/www.myomedix.com Rabbit 1:500 I103 I102-104 Dr. C. Gregorio lab Rabbit 1:200 MIR I109-110 (in deleted
region) Dr.Labeit/www.myomedix.com Rabbit 1:200
M8/M9 2 most C-terminal Igs Dr.Labeit/www.myomedix.com Rabbit 1:200 Un N2Bus I15-I16 (x214-
x215) Dr.Labeit/www.myomedix.com Avian 10 µg/ml
Uc N2Bus I18-I19 (x216-x217)
Dr.Labeit/www.myomedix.com Rabbit 2 µg/ml
T12 Ig domains I2-I3 Boehringer Mouse 1 µg/ml I84 Ig I84-86 Dr.Labeit/www.myomedix.com Rabbit 2 µg/ml TCAP Z-disk titin binding Dr.Labeit/www.myomedix.com Rabbit 1:500 MLP Z-disk titin binding Dr.Labeit/www.myomedix.com Rabbit 1:3000 CARP I-band titin binding Dr.Labeit/www.myomedix.com Rabbit 1:500 FHL1 I-band titin binding Abcam Mouse 1:250 FHL2 I-band titin binding Abcam Mouse 1:250 αB-crystallin I-band titin binding Millipore Rabbit 1:1000 Ankrd2 I-band titin binding Dr.Labeit/www.myomedix.com Rabbit 1:2000 MARP3 I-band titin binding Dr.Labeit/www.myomedix.com Rabbit 1:500 MuRF1 M-line titin binding Dr.Labeit/www.myomedix.com Chicken 1:1000 MuRF2 M-line titin binding Dr.Labeit/www.myomedix.com Rabbit 1:1000 Beta Tubulin Loading control Cell Signaling Tech. Rabbit 1:1000 GAPDH Loading control Thermo Pierce Mouse 1:3000
Myosin isoform analysis was performed using 7% acrylamide gels as previously described (20). Thin
and thick filament regulatory proteins expression and phosphorylation were analyzed as previously
12
described (8, 17, 21, 22). Briefly, LV samples from all three genotypes were loaded onto a 12% SDS-
PAGE gel and run for 2 h at 100 V. Gels were fixed in 50% methanol, 10% acetic acid overnight then
stained with Pro-Q Diamond Phosphoprotein Gel stain (Invitrogen), destained with 20% acetonitrile, 50
mM sodium acetate pH 4, and scanned with a 302 nm UV transilluminator (G: BOX Syngene, USA).
Gels were then stained with Coomassie brilliant blue, scanned, and analyzed using One-D scan for
protein content. Each sample was loaded one time in sets of three in a row.
RNA ANALYSIS. Custom Titin Exon Microarray. Ttn mRNA expression was analyzed using our
custom exon microarray as previously described (8, 16, 20, 23, 24). Left ventricular tissues were
dissected from male mice (10 month-old) and stored in Ambion RNAlater (Invitrogen). Total RNA was
isolated using the Qiagen RNeasy Fibrous Tissue Mini Kit (Qiagen). The SenseAmp Kit (Genisphere)
and Superscript III reverse transcriptase enzyme (Invitrogen) were used for sense amplification of each
sample. Samples of the same genotype were pooled for reverse transcription and dye-coupled with
Alexa Fluor 555 and Alexa Fluor 647 using the SuperScript Plus Indirect cDNA Labeling System
(Invitrogen). A 3-point hybridization loop design with technical replicate dye-flip was used; 750 ng of
labeled cDNA with each fluorophore were co-hybridized on individual slides (platform: 50-mer
oligonucleotides specific for each Ttn exon robotically spotted in triplicate on Corning Ultra GAPS
slides) using SlideHyb Buffer #1 (Ambion) in a GeneTAC Hybridization Station (Genomic Solutions) for
16 h at 42oC. Slides were scanned at 595 nm and 685 nm with an ArrayWoRx scanner (Applied
Precision). Spot-finding was performed with SoftWoRx Tracker (Applied Precision) and analyzed with
the CARMA package(25).
qRT-PCR. Total RNA was extracted using the RNeasy Fibrous Tissue Mini Kit with DNase treatment
(Qiagen) from left ventricle tissue which upon dissection had been immediately immersed into RNAlater
(Ambion) and stored at -20oC. Samples were from 6 12-week-old male mice for each group.
SuperScript III (Invitrogen) was used to reverse transcribe total RNA; cDNA equivalent to 25ng total
13
RNA were used for each reaction. Quantitative RT-PCR used Maxima SYBR Green qPCR Master Mix
(Fermentas) in a Rotor-gene 6000 (Corbett Life Science). Primer sequences used: Skeletal actin
(for:5'-GCCGTTGTCACACACAAGAG-3', rev:5'-CTCACTTCCTACCCTCGGC-3', product 102bp),
αMHC (for: 5'-CCGGGTGATCTTCCAGCTAA-3', rev:5'-GCTCAGCACATCAAAGGCACT-3', product
208bp), βMHC (for:5'-TCCCAAGGAGAGACGACTGTG-3', rev:5'-CCTTAAGCAGGTCGGCTGAGT-3',
product: 253bp), Fhl2 (for: 5'-CCTGTGAGGAGTGTGGAACA-3', rev: 5'-GAGCAATGGAAGCAGCCTT-
3', product:91bp), BNP (for: 5'-ACAAGATAGACCGGATCGGA-3', rev: 5'-
ACCCAGGCAGAGTCAGAAAC-3', product: 110bp), and CypA (for: 5'-CAGACGCCACTGTCGCTTT-
3', rev: 5'-TGTCTTTGGAACTTTGTCTGCAA-3', product: 133bp). Analysis used Standard Curves,
averages of three technical replicates for each data point, and expression was normalized to CypA.
MULTIPLE SEQUENCE ALIGNMENTS. Amino acid sequences for the IA-junction region from
multiple mammalian species and chicken were obtained by using BLAST search at http://ensembl.org.
Once retrieved, alignments of the IA-junction sequences were assembled using Clustal Omega and T-
coffee at http://www.ebi.ac.uk/Tools/msa/.
STATISTICS. Statistical analysis was performed in Graphpad Prism (GraphPad Software, Inc). A
one-way ANOVA with a Bonferroni post-hoc analysis that calculates p-values (when needed corrected
for multiple comparisons) was performed to assess differences between multiple groups. A t-test was
used when comparing two groups only. A two-way ANOVA was used in Table S3 (chamber weights
(LV, LA, RV, RA) and genotype (WT and HomTtnIAjxn) with a Bonferroni posthoc test. Results are
shown as mean ± SEM. p<0.05 was defined as significant with * p<0.05; ** p<0.01 and *** p<0.001.
References.
14
1. Liu P, Jenkins NA, & Copeland NG (2003) A highly efficient recombineering-based method for
generating conditional knockout mutations. Genome Res 13(3):476-484.
2. Trombitas K & Granzier H (1997) Actin removal from cardiac myocytes shows that near Z line
titin attaches to actin while under tension. Am J Physiol 273(2 Pt 1):C662-670.
3. Labeit S, et al. (2010) Modulation of muscle atrophy, fatigue and MLC phosphorylation by
MuRF1 as indicated by hindlimb suspension studies on MuRF1-KO mice. J Biomed Biotechnol
2010:693741.
4. Ottenheijm CA, Hidalgo C, Rost K, Gotthardt M, & Granzier H (2009) Altered contractility of
skeletal muscle in mice deficient in titin's M-band region. J Mol Biol 393(1):10-26.
5. Kellermayer MS, Smith SB, Bustamante C, & Granzier HL (1998) Complete unfolding of the
titin molecule under external force. J Struct Biol 122(1-2):197-205.
6. Bustamante C, Marko JF, Siggia ED, & Smith S (1994) Entropic elasticity of lambda-phage
DNA. Science 265(5178):1599-1600.
7. Marko JF & Siggia ED (1995) Statistical mechanics of supercoiled DNA. Phys Rev E Stat Phys
Plasmas Fluids Relat Interdiscip Topics 52(3):2912-2938.
8. Granzier HL, et al. (2009) Truncation of titin's elastic PEVK region leads to cardiomyopathy
with diastolic dysfunction. Circ Res 105(6):557-564.
9. Trombitas K, Freiburg A, Centner T, Labeit S, & Granzier H (1999) Molecular dissection of
N2B cardiac titin's extensibility. Biophys J 77(6):3189-3196.
10. Trombitas K, et al. (2000) Extensibility of isoforms of cardiac titin: variation in contour length
of molecular subsegments provides a basis for cellular passive stiffness diversity. Biophys J
79(6):3226-3234.
11. Watanabe K, Muhle-Goll C, Kellermayer MS, Labeit S, & Granzier H (2002) Different
molecular mechanics displayed by titin's constitutively and differentially expressed tandem Ig
segments. J Struct Biol 137(1-2):248-258.
12. Granzier HL & Irving TC (1995) Passive tension in cardiac muscle: contribution of collagen,
titin, microtubules, and intermediate filaments. Biophys J 68(3):1027-1044.
13. Burkhoff D, Mirsky I, & Suga H (2005) Assessment of systolic and diastolic ventricular
properties via pressure-volume analysis: a guide for clinical, translational, and basic researchers.
Am J Physiol Heart Circ Physiol 289(2):H501-512.
14. Yang XP, et al. (1999) Echocardiographic assessment of cardiac function in conscious and
anesthetized mice. The American journal of physiology 277(5 Pt 2):H1967-1974.
15. Konhilas JP, et al. (2004) Sex modifies exercise and cardiac adaptation in mice. Am J Physiol
Heart Circ Physiol 287(6):H2768-2776.
16. Lahmers S, Wu Y, Call DR, Labeit S, & Granzier H (2004) Developmental control of titin
isoform expression and passive stiffness in fetal and neonatal myocardium. Circ Res 94(4):505-
513.
17. Hidalgo C, et al. (2009) PKC phosphorylation of titin's PEVK element: a novel and conserved
pathway for modulating myocardial stiffness. Circ Res 105(7):631-638, 617 p following 638.
18. Warren CM, Jordan MC, Roos KP, Krzesinski PR, & Greaser ML (2003) Titin isoform
expression in normal and hypertensive myocardium. Cardiovasc Res 59(1):86-94.
19. Hudson BD, Hidalgo CG, Gotthardt M, & Granzier HL (2010) Excision of titin's cardiac PEVK
spring element abolishes PKCalpha-induced increases in myocardial stiffness. J Mol Cell
Cardiol 48(5):972-978.
20. Chung CS, et al. (2013) Shortening of the elastic tandem immunoglobulin segment of titin leads
to diastolic dysfunction. Circulation 128(1):19-28.
15
21. Chung CS & Granzier HL (2011) Contribution of titin and extracellular matrix to passive
pressure and measurement of sarcomere length in the mouse left ventricle. J Mol Cell Cardiol
50(4):731-739.
22. Radke MH, et al. (2007) Targeted deletion of titin N2B region leads to diastolic dysfunction and
cardiac atrophy. Proc Natl Acad Sci U S A 104(9):3444-3449.
23. Granzier H & Labeit S (2007) Structure-function relations of the giant elastic protein titin in
striated and smooth muscle cells. Muscle Nerve 36(6):740-755.
24. Labeit S, et al. (2006) Expression of distinct classes of titin isoforms in striated and smooth
muscles by alternative splicing, and their conserved interaction with filamins. J Mol Biol
362(4):664-681.
25. Greer KA, McReynolds MR, Brooks HL, & Hoying JB (2006) CARMA: A platform for
analyzing microarray datasets that incorporate replicate measures. BMC Bioinformatics 7:149.