Embed Size (px)
Citation preview
Rapid deposition of oxidized biogenic compounds toa temperate forestTran B. Nguyena,1,2, John D. Crounsea,1, Alex P. Tenga, Jason M. St. Claira, Fabien Paulotb,c, Glenn M. Wolfed,e,and Paul O. Wennberga,f,2
Divisions of aGeological and Planetary Sciences and fEngineering and Applied Science, California Institute of Technology, Pasadena, CA 91125; bGeophysicalFluid Dynamics Laboratory, National Oceanic and Atmospheric Administration, Princeton, NJ 08540; cAtmospheric and Oceanic Sciences, Princeton University,Princeton, NJ 08544; dAtmospheric Chemistry and Dynamics Lab, NASA Goddard Space Flight Center, Greenbelt, MD 20771; and eJoint Center for EarthSystems Technology, University of Maryland Baltimore County, Baltimore, MD 21250
Edited by Mark H. Thiemens, University of California, San Diego, La Jolla, CA, and approved December 22, 2014 (received for review September 28, 2014)
We report fluxes and dry deposition velocities for 16 atmosphericcompounds above a southeastern United States forest, including:hydrogen peroxide (H2O2), nitric acid (HNO3), hydrogen cyanide(HCN), hydroxymethyl hydroperoxide, peroxyacetic acid, organichydroxy nitrates, and other multifunctional species derived fromthe oxidation of isoprene and monoterpenes. The data suggestthat dry deposition is the dominant daytime sink for small, satu-rated oxygenates. Greater than 6 wt %C emitted as isoprene bythe forest was returned by dry deposition of its oxidized products.Peroxides account for a large fraction of the oxidant flux, possiblyeclipsing ozone in more pristine regions. The measured organicnitrates comprise a sizable portion (15%) of the oxidized nitrogeninput into the canopy, with HNO3 making up the balance. We ob-serve that water-soluble compounds (e.g., strong acids and hydro-peroxides) deposit with low surface resistance whereas compoundswith moderate solubility (e.g., organic nitrates and hydroxycarbon-yls) or poor solubility (e.g., HCN) exhibited reduced uptake at thesurface of plants. To first order, the relative deposition velocities ofwater-soluble compounds are constrained by their molecular diffu-sivity. From resistance modeling, we infer a substantial emission fluxof formic acid at the canopy level (∼1 nmol m−2·s−1). GEOS−Chem,awidely used atmospheric chemical transport model, currently under-estimates dry deposition for most molecules studied in this work.Reconciling GEOS−Chem deposition velocities with observationsresulted in up to a 45% decrease in the simulated surface con-centration of trace gases.
biosphere−atmosphere exchange | isoprene | dry deposition | OVOCs |fluxes
Forests are major sources of volatile organic compounds (VOCs),contributing approximately half of the reactive carbon emissions
worldwide (1). Emissions of a single compound, isoprene (C5H8),contribute approximately a third of the global VOC flux (2). Theemitted carbon is transformed in the atmosphere by photolysisand oxidation reactions with the hydroxyl radical (OH), ozone(O3), or the nitrate radical (NO3), generating highly oxidized andoften multifunctional compounds that are termed oxidized volatileorganic compounds (OVOCs). Atmospheric OVOCs can be lostthrough further photooxidation (ultimately leading to CO2 orsmall organic acids), condensation onto aerosol particles (formingsecondary organic aerosols), or deposition to surfaces.Due to its high emission and fast reactivity, the atmospheric
oxidation of isoprene significantly impacts air quality and climateby altering the regional and global budgets of organic aerosols (2)and oxidants [e.g., ozone (3) and HOx = OH + HO2 (4)]. Fig. 1illustrates the typical atmospheric reaction pathways for isopreneand the related monoterpenes, occurring both in the day and night.Representations of VOC oxidation and organic aerosol productionin air quality and climate models have significantly improved in thelast decade (3, 5) as a result of renewed focus on the isoprenechemical mechanism. This has followed from improved analyticalmethods that have enabled ambient and laboratory studies of the
chemistry and oxidative fate of OVOCs such as isoprene hydroxynitrates (ISOPN) and isoprene epoxydiols (IEPOX). However,little progress on understanding the dry deposition of OVOCshas been made, despite the suggested importance of this losspathway (6, 7).Direct and speciated measurements of trace gas exchange have
been performed for inorganic compounds (e.g., O3, SO2, NOx,N2O, NH3, HNO3, H2O2), biogenic VOCs, and simple oxygenates[e.g., peroxyacetylnitrate (PAN), methanol, formic acid, acetone](8, 9). Recent flux observations above a California orange groveprovide evidence for large depositional fluxes of OVOCs (10),although the speciated fluxes were not measured. Indeed, thesurface exchange behavior for the multifunctional OVOCs thatcomprise the majority of isoprene and monoterpene oxidationproducts remains poorly constrained because few ambient mea-surements have been performed with sufficient temporal resolu-tion or chemical specificity. It has been postulated that drydeposition may be a significant sink for many key OVOCs withinthe boundary layer and thus may be a controlling factor for theiratmospheric lifetimes and mixing ratios at Earth’s surface. Fur-thermore, atmospheric model evaluations suggest that disregard-ing dry deposition of OVOCs may lead to a large overestimate inthe formation rate of secondary organic aerosol (up to 50%) (11,12), a larger error than that due to ignoring wet deposition (13).Due to the scarcity of ambient chemically specific dry de-
position data, model representation of atmosphere−biosphere
Significance
Dry deposition is an important removal mechanism for oxidizedatmospheric compounds. This process remains, however, poorlyunderstood due to the scarcity of direct flux observations for allbut small, inorganic molecules in the atmosphere. The chemicallyspeciated fluxes presented here comprise a unique and noveldataset that quantifies the dry deposition velocities for a varietyof trace gases in a typical forested ecosystem. The data illustratethe key role of molecular diffusion in the atmosphere−biosphereexchange of water-soluble species. Furthermore, this work en-abled evaluation of the dry deposition parameterization in aglobal chemical transport model. The results aid in resolving keydiscrepancies within the global model, resulting in more-accuratepredictions of trace gas lifetimes and surface concentrations.
Author contributions: P.O.W. designed research; T.B.N., J.D.C., A.P.T., J.M.S.C., F.P., andG.M.W. performed research; J.D.C. contributed new reagents/analytic tools; T.B.N. ana-lyzed data; and T.B.N. and P.O.W. wrote the paper.
The authors declare no conflict of interest.
This article is a PNAS Direct Submission.
Freely available online through the PNAS open access option.1T.B.N. and J.D.C. contributed equally to this work.2To whom correspondence may be addressed. Email: [email protected] or [email protected].
This article contains supporting information online at www.pnas.org/lookup/suppl/doi:10.1073/pnas.1418702112/-/DCSupplemental.
www.pnas.org/cgi/doi/10.1073/pnas.1418702112 PNAS Early Edition | 1 of 10
EART
H,A
TMOSP
HER
IC,
ANDPL
ANET
ARY
SCIENCE
SPN
ASPL
US
https://ntrs.nasa.gov/search.jsp?R=20150022425 2018-05-27T03:42:57+00:00Z
exchange behavior of OVOCs rely on parameterizations thathave been optimized for O3 and SO2 (14). The higher water sol-ubility of oxygenates compared with hydrocarbons increases theirpropensity to deposit to the surface by interacting with surfacewater layers; thus, it is unclear if the parameterization developedfor less soluble species is sufficient to describe the flux behavior ofwater-soluble compounds. Direct measurements of dry depositionfor key VOC oxidation products are clearly needed to completethe understanding of their atmospheric fates.As the biosphere exchange of chemical species within the
boundary layer is driven by turbulence, surface fluxes can be es-timated with micrometeorological methods such as eddy co-variance (EC). Calculations using the EC method require mixingratio measurements performed fast enough to capture the high-frequency timescale of turbulent eddies; e.g., measurements shouldexceed 1 Hz sampling frequency at this site (SI Appendix, Fig. S7).
The recent development of fast mass spectrometry-based detectorsfacilitates EC flux measurements for a wide variety of species, in-cluding complex OVOCs (15). The EC flux of the desired species x(Fx) above a surface, such as a forest canopy, can be expressed asthe correlation of the mixing ratio of x with the vertical windcomponent (w),
Fx =w′x′ [1]
where primes denote deviation from the mean value, and overbarsdenote an average over a typical flux period (∼30 min). Importantunderlying assumptions in Eq. 1 are that (i) the measurement isstationary (i.e., no significant variations in the turbulent statisticsin time or in the point of measurement relative to meteorologicalevents), (ii) the surface is homogeneous so that the horizontalwind components are unimportant, and (iii) the scale of chemicalchange is slow in relation to flux variation (16). In this work, wefocus on the downward exchange of trace gases, where the de-position velocity (Vd, cm·s−1) is defined in relation to the flux andthe mean mixing ratio of x,
Vd =−Fx
x: [2]
This velocity determines the deposition lifetime of compoundx in the tropospheric boundary layer (τdep ≈ h/Vd, where h is theboundary layer height in centimeters). We report EC flux obser-vations for 16 biogenic trace gases and energy balance closureabove a southeast US temperate mixed forest in the summer. Theorganic and inorganic species studied here were chemically re-solved with time-of-flight chemical ionization mass spectrometryusing CF3O
− reagent anions (CIMS), a soft-ionization methodspecific for the detection of hydroperoxides, acids, multifunc-tional nitrates, and multifunctional oxygenated compounds(17). The mixing ratios of compounds, meteorology, and three-dimensional wind (u, v, and w) were measured atop a 20-m walk-up tower in the Talladega National Forest in June 2013 as part ofthe Southern Oxidant and Aerosol Study (SOAS) campaign(SI Appendix, section 1).
Results and DiscussionFluxes are calculated from the fast measurements of chemicalmixing ratios (10 Hz), virtual temperature (8 Hz), and verticalwinds (8 Hz). Details of the site, measurement methods, cali-bration (SI Appendix, Table S1), and quality assessment/qualitycontrol of flux data can be found inMaterials and Methods and SIAppendix. The site location and tower sampling platform pre-sented challenges to the flux measurements due to inconsistenciesin fetch to the south and perturbations of wind trajectory in thisdirection due to shadowing by the instrument. Accurate fluxmeasurements were possible on several days, however, when thewind direction was ideal to sample air from the forest to thenorth. The measurement of solar radiation, externally calibratedand converted to net radiation (18), was used as one verificationof flux quality (16). The closure condition requires that the ob-served net radiation downward (Rn), less the storage heat flux (S)(19), is equivalent to the observed sensible heat flux upward (SH,heat that can be measured) plus latent heat flux upward (LE,heat that is used to evaporate water). The quality constraints (SIAppendix, section 4) were met for only a subset of measurements(∼16%). We restrict our analysis to these periods.Our observations demonstrate that dry deposition is a signifi-
cant atmospheric sink for many OVOCs formed in the darkchemical and photochemical reactions of isoprene and mono-terpenes. Gas-phase inorganic compounds are also observed todeposit, often quite rapidly. Fig. 2 and SI Appendix, Fig. S17,show downward exchanges of relevant OVOCs and inorganicspecies and upward exchanges of heat and water for the days in
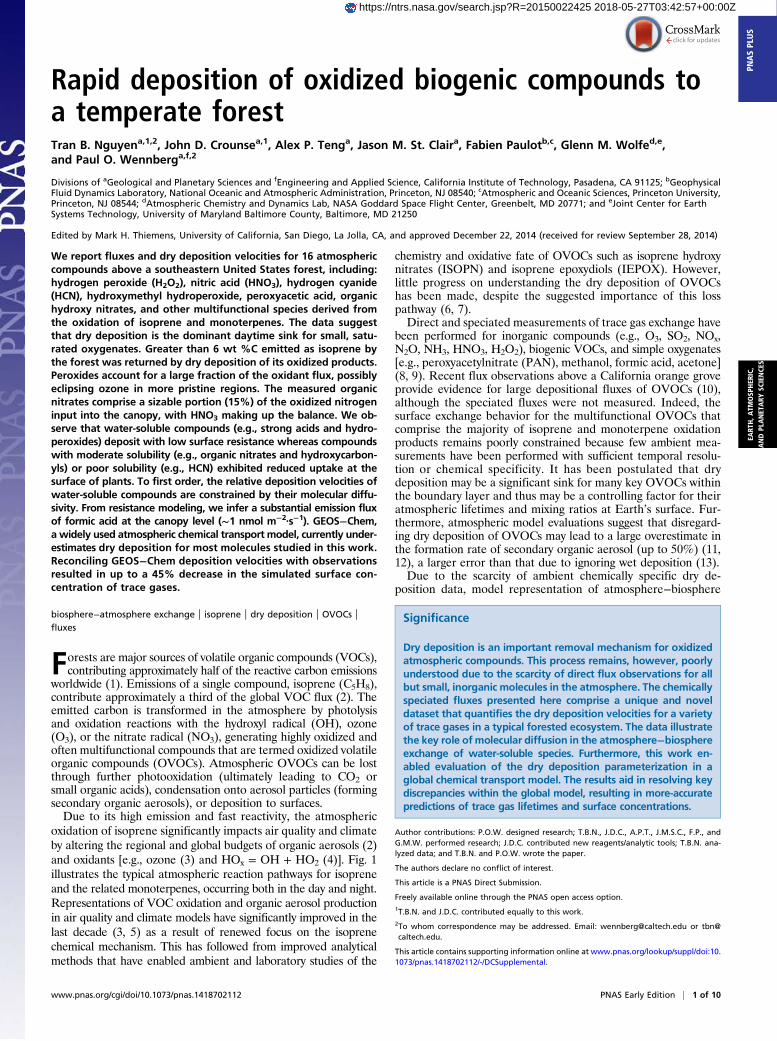
Fig. 1. Formation pathways for the oxidation products of isoprene andmonoterpenes included in this study. Thick arrows indicate primary emission.Representative isomers and reaction pathways are shown. Flux data arereported for compounds shown in solid boxes. In HO2-rich environments, theOH-initiated reaction of isoprene generates ISOPOOH, which are sub-sequently oxidized to epoxydiols (IEPOX) in an OH-conserving mechanismwith almost quantitative yields (88). The photooxidation of IEPOX producesC4 dihydroxy carbonyls (DHC4), C4 hydroxy dicarbonyls (HDC4), HAC, formicacid, and other products (42, 89). In NO-rich environments, the minor routeof the OH-initiated reaction of isoprene produces ISOPN, which are sub-sequently oxidized to HAC, hydroxy nitrates with backbones of MACNand MVKN, and other products (54, 90, 91). The major route of the NO-dominated OH-initiated reaction (not shown) produces carbonyls suchas methacrolein, methyl vinyl ketone, and HAC, among other products.PROPNN is formed primarily from the oxidation-induced fragmentation oflarger nitrates. A temperature-dependent isomerization of the isoprene RO2
generates the HPALD (56, 92). The O3-initated oxidation of isoprene or otherexocyclic compounds forms the C1 stabilized Criegee intermediate (SCI),among other products, which reacts with water to produce HMHP and for-mic acid (43). NO3-initated oxidation of isoprene and monoterpenes, fol-lowed by the HO2 reaction, produces INP and MTNP, respectively (93). PAA isthought to predominantly form through the HO2 reaction with acetylperoxyradical [CH3C(O)OO], which has several anthropogenic and biogenic sources(94). The main source of HCN is biomass burning (52). Formic acid has manysources, including direct emission from canopies, photooxidation at surfacesand in the gas phase, ozonolysis, and secondary chemistry (6).
2 of 10 | www.pnas.org/cgi/doi/10.1073/pnas.1418702112 Nguyen et al.

this study. LE comprised the majority of the total upward energyflux at this site, which is typical for forested environments. Fluxesof hydrogen peroxide (H2O2) are among the largest observedduring the campaign, reaching 2 nmol·m−2·s−1, in good agreementwith other accounts in forested settings (20). Observed fluxes hada daytime diurnal pattern, driven by the combined effect of lightand temperature on turbulence, stomatal conductance, and gas-phase photochemical production.The biosphere−atmosphere exchange behaviors for several
species studied here are currently unknown or have only beenspeculated in the past. These chemical compounds include hy-drogen cyanide (HCN), hydroxymethyl hydroperoxide (HMHP),peroxyacetic acid (PAA), the sum of isoprene hydroxy hydro-peroxides and epoxydiols (ISOPOOH + IEPOX), isoprenehydroperoxy aldehydes (HPALD), ISOPN, the sum of hydroxynitrates with carbon backbones of methacrolein and methyl-vinylketone (MACN + MVKN), propanone nitrate or propanalnitrate (PROPNN), hydroxyacetone (HAC), the C4 hydroxydicarbonyl from IEPOX oxidation (HDC4), the C4 dihydroxycarbonyl from IEPOX oxidation (DHC4), isoprene nitrooxyhydroperoxide (INP), and monoterpene nitrooxy hydroperoxide(MTNP). The structures of the compounds measured in this workare shown in Fig. 1.Fig. 3 shows the observed mean deposition velocities (Vd) for
each compound binned into hourly periods. Daytime Vd values(Fig. 3 legend) were averaged for local hours 1000–1500 acrossall measurement days. In most cases, the deposition velocities aremore rapid than that of O3 (21). Diurnal patterns of depositionvelocities largely mirrored those for flux. However, the diurnalpatterns for some compounds are asymmetric (peaking beforenoon), which may indicate that their biosphere exchange is con-trolled in part by stomatal conductance and/or surface wateravailability. Although daytime Vd may depend to some extenton environmental conditions and canopy characteristics at eachsite, it is instructive to compare the values measured here withavailable data on dry deposition over forests. For example, in thiswork, the observed Vd for H2O2 (5.2 ± 1.1 cm·s−1) is in excellentagreement with other direct measurement accounts (Vd;H2O2 =5 ± 2 cm·s−1 (22–24). Measured fluxes of formic acid have beenreported to be bidirectional, with an effective range of Vd;Formic =0.17–1.0 cm·s−1 (25, 26) that is in reasonable agreement with our
determination (1.0 ± 0.4 cm·s−1). Measurements of nitric acid(HNO3) dry deposition encompass the largest range in theliterature [Vd;HNO3 = −1–8 cm·s−1 (27–30)]. HNO3 is a chal-lenging compound to measure because of its interactions withinstrument surfaces. The CIMS measurement of HNO3 wasaffected by an instrumental delay and was corrected witha time response perturbation function (SI Appendix, section5). Our determination for nitric acid deposition velocity(Vd;HNO3 = 3.8 ± 1.3 cm·s−1) is within range of other reportsand is consistent with results from resistance modeling per-formed in this work. Other speciated Vd we observe comparewell, although indirectly, to previously reported data availableas averaged measurements within the class of organic hydro-peroxides [Vd;ROOH = 1.1–2.5 cm·s−1 (22, 23)] or organic nitrates[Vd;RONO2 (gas + particles) ≈ 2.0 cm·s−1 (29, 30)].
Resistance Model of Deposition. Here we seek to evaluate thephysical factors that control dry deposition within the frameworkof resistance modeling. Deposition velocity is usually parame-terized as a series of resistances in the transport from the at-mosphere to a surface—in this case, a canopy that is representedas a theoretical large leaf (31). The downward trajectory of achemical species can be hindered by the step-wise resistances toaerodynamic transfer (Ra), molecular diffusion through the quasi-laminar boundary layer of the leaf (Rb), and uptake at the surfaceof the leaf (Rc),
Vd =1
Ra +Rb +Rc[3]
SI Appendix, section 6, describes the resistance model in detail.We used Ra and Rb parameterization as suggested (32–34). Ra isdependent only on the atmospheric stability (i.e., turbulence). Rbis inversely dependent on the turbulence, the molecular diffusiv-ity of compound x in air [Dx (m2·s−1)], and canopy characteristicssuch as the observed leaf area index (LAI) of the canopy at themeasurement site (LAI = 4.7; see SI Appendix). Rc is parameter-ized according to a revised Weseley scheme (35), which, to firstorder, considers the combined resistances from stomata (rs),mesophyll (rm), and cuticles (rcut) of plants. The surface uptake of
Fig. 2. The balance of latent heat (LE) and sensible heat (SH) fluxes com-pared with net radiation (Rn) minus heat storage (S), virtual temperature andabsolute water vapor, and fluxes and mean mixing ratios for select chemicalspecies. SI Appendix, Fig. S17, shows the remaining fluxes and mean mixingratios measured in this work.
Fig. 3. Measured deposition velocities (centimeters per second) for speciesincluded in this work. The daytime (h = 1000–1500) mean (centimetersper second) and SD (1σ) are (A) formic acid [1.0 ± 0.4], (B) nitric acid [3.8 ±1.3], (C ) HCN [0.3 ± 0.1], (D) H2O2 [5.2 ± 1.1], (E ) HMHP [4.1 ± 1.1], (F ) PAA[2.7 ± 0.7], (G) ISOPOOH + IEPOX (IP + IE, isomeric) [2.5 ± 0.6], (H) HPALD[2.4 ± 0.6], (I) ISOPN [1.5 ± 0.6], (J) MACN + MVKN [1.5 ± 0.5], (K),PROPNN [1.7 ± 0.6], (L) HAC [1.4 ± 0.5], (M) HDC4 [1.1 ± 0.5], (N) DHC4 [1.0 ±0.4], (O) INP [1.3 ± 0.6], and (P) MTNP [0.8 ± 0.4]. Solid curve is datasmoothed by a moving average algorithm.
Nguyen et al. PNAS Early Edition | 3 of 10
EART
H,A
TMOSP
HER
IC,
ANDPL
ANET
ARY
SCIENCE
SPN
ASPL
US

a particular compound is represented as functions of Dx, watersolubility (H, Henry’s Law coefficient), and a reactivity coeffi-cient (f0, range 0–1 where 1 is as reactive as ozone),
Rc ∼�
1ðrsðDxÞ+ rmðH; f0ÞÞ+
1rcutðH; f0Þ
�−1
: [4]
The original Weseley parameterization overestimates Rc forcompounds like H2O2 (20), which should be close to zero (22),despite the fact that water solubility of H2O2 is not significantlyvariable below pH = 8 and f0 is set to maximum. With empiricalresults at hand, we optimized the parameters in the Weseley Rcscheme to minimize discrepancies between calculated and ob-served Vd. We adjusted coefficients only in the rm and rcut terms(SI Appendix, Eqs. 14–16) to be more sensitive to water solubil-ity. Furthermore, we use the simple Henry’s Law coefficients (H)that describe physical solvation in pure water, instead of effectiveHenry’s Law coefficients (H*). We find that H satisfactorily repro-duces empirical Rc. Furthermore, H is a more practical parameteras the knowledge of ionic activity (36, 37) and pH at surfaceaqueous layers is not readily available to estimate H* for thespecies where solubility enhancements are important (e.g., alde-hydes, acids, and bases). We neglect pH dependence for solubilitybecause pH inside plant mesophyll (38) and leaf surface (39) tendto be buffered near neutral. H was estimated based on chemicalproxies for the larger multifunctional compounds (SI Appendix,Table S2) where measured values were unavailable (40).Fig. 4 shows that results from the revised resistance model are
in excellent agreement with ambient observations for the ma-jority of the compounds studied in this work. The poorer modelagreement for the mean of ISOPOOH + IEPOX is likely due toerror in flux measurement and not modeling. Deposition velocityfor IEPOX may be slightly underrepresented in our work be-cause the expected time response delay in sampling IEPOX wasuncorrected (SI Appendix, section 5). Surface resistances are smallfor the water-soluble and more reactive species (e.g., strong acids,hydroperoxides, and peroxyacids) but become important for othercompounds. The parameterization captures observed Vd success-fully on both ends of the water-solubility spectrum, e.g., for poorlywater-soluble compounds like HCN [H ≈ 10 M·atm−1 (40)] and forhighly water-soluble compounds like HMHP (H ∼106 M·atm−1).
The exception is formic acid, where Vd predicted by the re-sistance model is approximately twice the observed value.The behavior of formic acid cannot be explained by the physical
characteristics of this molecule. With the assumption that the re-sistance model results are robust, poor model agreement impliesthat error may exist in the formic acid measurement, solubilityestimations, or the assumption that formic acid has no emissionsource. A time response test suggests that >98% of the formic acidflux was captured by the measurement (SI Appendix, Fig. S11) andH is not expected to be overestimated for formic acid. More likely,we believe that a significant portion of the observed formic acid ina forested setting is produced by secondary, possibly heteroge-neous, reactions (6, 41). These secondary emission pathways areadditional to the proposed primary emission of formic acid frombiogenic, anthropogenic, and pyrogenic sources. The discrepancybetween modeled and observed Vd of formic acid requires a largeemission flux—on the order of 1 nmol·m−2·s−1 in the daytime.One possible route to secondary formic acid formation may
include water-mediated degradation of larger OVOCs that aredeposited on canopy surfaces or on aerosol surfaces, e.g., the oxi-dation of IEPOX (42) and decomposition of HMHP (43). Thedeposition of HMHP and IEPOX is likely independent of surfacechemistry at this site because surface uptake is not a limiting processfor these compounds (Fig. 4, Lower). Thus, their in-canopy chem-istry is not expected to lead to model/measurement disagreement,within the error of the measurement, by significantly enhancingdeposition. HMHP decomposition (downward flux of ∼0.2nmol·m−2·s−1) may produce formic acid via thermal, photochem-ical, or dark decomposition pathways. The lifetime of HMHP withrespect to hydrolysis at neutral pH has been measured to beroughly 17 min (44), on the timescale of mixing within the can-opy. The formation yield of formic acid from IEPOX oxidation issignificant in the gas phase (10–30%) (42), although the lifetimeof IEPOX in the gas phase is long (>10 h). We speculate theyields are higher in the aqueous phase; however, more work isneeded before the contribution of IEPOX to the formic acid fluxcan be estimated.Another possible formic acid source is the rapid in-canopy
ozonolysis of monoterpenes and other biogenic VOCs (45, 46),which may occur primarily within stomata (47) and is enhancedunder humid conditions (43). For example, the in-canopy ozo-nolysis of sesquiterpenes (τ ≈ 1–2 min) has been estimated to con-sume 0.6–1.5 nmol·m−2·s−1 (7–28%) of the downward ozone fluxand 46–61% of the sesquiterpenes mass in Amazonia (48). Ap-proximately 6% of the ozone flux at this site is required to ac-count for the entire formic acid flux. Although the kinetics andyields of the myriad formic acid formation routes are not wellunderstood, a 1 nmol·m−2·s−1 secondary source of formic acidfrom these combined pathways appears plausible.The calculated resistances shed light on a remarkable empirical
relationship of highly depositing compounds—their observed day-time deposition scale with inverse molecular mass ð ffiffiffiffi
mp Þ−1 (Fig. 5).
These trends suggest that molecular diffusivity through the leafboundary layer and, for larger molecules, from the leaf surface itselfact as a constraint on dry deposition at a specific turbulent condi-tion. According to the resistance model, diffusivity restrictions arisefrom the terms describing transport to the quasi-laminar layer of theleaf surface (Rb) or through stomata (rs component of Rc). We findtwo “diffusion-limited” upper bounds: when there is no resistance atthe surface of the leaf (Rtotal = Ra + Rb, Fig. 5, dashed line) andwhen there is a stomata-controlled resistance at the surface of theleaf [Rtotal = Ra + Rb + Rc (rs), Fig. 5, solid line]. The two limitsconverge for smaller compounds (<80 Da) with high diffusivitysuch that rs is minimal. As expected, the observed daytime Vd forHNO3 (the prototypical molecule for rapid deposition) is atmaximum for its size. It appears that bulkier compounds such asMTNP cannot achieve surface resistance-free deposition becausethey are hindered by subsequent transport through the stomata.
Fig. 4. (Upper) Daytime mean deposition velocities (centimeters per sec-ond) that were measured vs. calculated by a tuned resistance model. (Lower)Modeled contributions to the total deposition resistance from aerodynamictransfer (Ra), molecular diffusion (Rb), and canopy uptake (Rc). Model inputsand results are shown in SI Appendix, Table S2.
4 of 10 | www.pnas.org/cgi/doi/10.1073/pnas.1418702112 Nguyen et al.

Efficiently-depositing compounds approaching the stomata-controlled diffusion limit generally belong to the chemical classesof simple or multifunctional hydroperoxides and strong acidswith high water solubility (threshold H in this model ≈ 3 × 10⁴
M·atm−1). The model sensitivity to various parameters is dis-cussed in SI Appendix, section 6, and shown in SI Appendix, Fig.S16, for H. Organic nitrates and peroxyacids are close to theupper bound. Most of the major outliers in Fig. 5, e.g., HCN andketones, have poor solubility in water or low reactivity at the leafsurface, which produces a substantial nonstomatal Rc term. Inparticular, uptake of HCN from the surface comprise >90% ofits total resistance. Formic acid is also an outlier on this plot,likely due to the aforementioned emission. In addition to diffu-sion restrictions, the absolute deposition velocities for a specificcompound remain highly dependent on atmospheric stability.The aerodynamic resistance (Ra) can be significant when theatmospheric stability is high; however, this term is identical forall compounds, so it will materialize as a vertical offset in Fig. 5.Under exceptionally high turbulent mixing conditions (Ra → 0),we estimate that Vd for HNO3 and H2O2 can reach ∼6 cm·s−1
and 8 cm·s−1, respectively, in this forest setting.The empirical relationship between mass and deposition velocity
for soluble species serves as a useful paradigm for understandingprevious and future measurements performed under differingconditions. That a single physical characteristic of atmospherictrace gases constrains their deposition velocities in relation toeach other has not yet been fully realized. Current sensitivitysimulations of atmospheric loss often exceed these “diffusion-limited maxima” when modeling dry deposition of OVOCs. Forexample, HNO3 is typically modeled to have the highest relativedeposition velocity, and sensitivity studies tend to equate Vd ofother compounds that may also deposit quickly (e.g., ISOPN)to Vd of HNO3 (7, 49). These data suggest that it may be moreappropriate to scale Vd of highly depositing species in sensitivitysimulations with respect to H2O2 or HNO3 based on molecularmass. Furthermore, it appears that H2O2 will always depositfaster than HNO3 at any given turbulent condition.
Impact on Regional and Global Budgets of Trace Gases. Global at-mospheric transport models used to assess chemistry and climatefeedbacks often overpredict surface volume mixing ratios for tracegases such as H2O2 (50, 51), HCN (52), and ISOPN (5). Dependingon the molecule, such model discrepancies can affect the entiretroposphere or only the boundary layer. These overestimations havemotivated hypotheses about unknown atmospheric sinks for these
compounds or their precursors, e.g., enhanced aerosol uptake ofHO2 due to Fenton chemistry that does not produce H2O2 in thegas phase (51) or an ocean sink for HCN (52).We performed regional and global simulations using GEOS−
Chem v9.2 (53), a global 3D chemical transport model, to as-sess the importance of dry deposition in model simulations ofsurface mixing ratios. GEOS−Chem simulations were driven byGEOS-FP (forward processing) meteorology with hourly reso-lution (SI Appendix, section 7). Compound-specific surfacemixing ratio and vertical profile impacts in response to modeledchanges in dry deposition are a nonlinear result of chemistry,land use, and meteorology; thus, they are not possible to predicta priori. In one case study, we performed a 1-mo simulation ata fine-grid horizontal resolution of 0.25° × 0.33° to facilitatecomparisons with hourly observations of deposition velocitiesand meteorology at the measurement site. Two year-long globalsimulations at a coarser resolution (2° × 2.5°) were also per-formed for a “base” case and “sensitivity” case. In the basesimulation, we use the default GEOS−Chem dry deposition ve-locities, while in the sensitivity simulation, we adjust the averagedaytime Vd of several compounds to match measurements. Weuse the most recent version of GEOS−Chem chemical mech-anism with a few updates (SI Appendix, Table S3) to reflectrevised knowledge of OVOC reactions published very recently,such as updated ISOPN + OH and ISOPN + O3 rate coefficients(54). Model results for HCN and several other species of interestare not available because these compounds are either not includedin GEOS−Chem (HMHP, HCN, HPALDs, HDC4, DHC4, INP,and MTNP) or because their dry deposition was neglected in themodel (PAA). Among the compounds not included in the sim-ulations, HMHP (55) and HPALDs (56) may have the moresignificant impact on model predictions because of their highdeposition velocities and large abundance in forested settingsand in biomass burning plumes.Fig. 6 shows the meteorological conditions and energy fluxes
generated by GEOS-FP and deposition velocities calculated bythe fine-grid GEOS−Chem simulation for June 2013 at the coor-dinates of measurement site (CTR). Excellent agreement in boththe mean magnitudes and diurnal pattern was obtained for thecomparison of friction velocity (turbulence, Fig. 6A), sensibleheat flux (Fig. 6B), and latent heat flux (Fig. 6C) between themodel (averaged for 30 d) and measurements (averaged for 5 d).This suggests that the meteorological and surface exchangeconditions during the select days used in this work are repre-sentative of the site during June. Furthermore, these simulationssuggest that flux observations during the SOAS campaign are notatypical for the eastern US region or for the year 2013 (SI Ap-pendix, Figs. S18 and S19, respectively).The deposition velocities for compounds of interest showed
poorer agreement in the fine-grid simulations (Fig. 6 D–F, blacklines). As meteorology and land surface processes are reasonablywell represented in the atmospheric model, the discrepancy likelyresides in the parameterization of surface uptake resistance (Rc)by the canopy. The GEOS−Chemmodel uses theWeseley scheme(Eq. 4) to calculate surface resistance for chemical species. Asnoted earlier (20), Rc for H2O2 and certain OVOCs are over-estimated compared with observations, leading to low values ofVd simulated by the model. For the sensitivity study, we arbi-trarily increased the effective solubility inputs for compounds ofinterest (SI Appendix, Table S4) until the calculated Vd matchedobserved values (Fig. 6 D–F, blue lines, when an applicablechange is made). In some cases, the required solubility adjust-ments are clearly too large compared with uncertainties andsuggest that a change to the parameterization, such as was done inResistance Model of Deposition, should be implemented to improvethe model description of dry deposition in future work. Thismethod, however, is a reasonable temporary solution that can be
Fig. 5. The dependence of deposition velocities on inverse molecular massð ffiffiffiffiffi
mp Þ−1, a representation of molecular diffusivity, for various chemical clas-ses. The dashed line is the upper limit for deposition without surface re-sistance (Vd = 1/[Ra + Rb]). The solid line is the upper limit for deposition thatexperiences only stomatal resistance at the surface (Vd = 1/[Ra + Rb + Rc (rs)]).
Nguyen et al. PNAS Early Edition | 5 of 10
EART
H,A
TMOSP
HER
IC,
ANDPL
ANET
ARY
SCIENCE
SPN
ASPL
US

immediately implemented in atmospheric models while an upda-ted parameterization is under development.Table 1 shows simulation results extracted for June 2013 from
the base and sensitivity studies in the grid box that encompassesthe coordinates of the measurement site. Changes in Vd signifi-cantly impact predictions of surface concentration for the depositingspecies, but secondary chemistry, e.g., ozone production or SO2oxidation, are not considerably affected. The surface mixing ratios
for compounds with adjusted Vd decreased ∼10–50%. Although theobserved changes in modeled mixing ratios were not found to affectO3 and HOx (OH +HO2) at this site, season, and altitude (<1 km),effects on O3 and HOx due to the photochemistry of isoprenenitrates and H2O2, respectively, may be more significant for otherregions of the globe and times of the year (51, 57). The adjustmentin Vd for H2O2 was the largest (a factor of 7 increase), and itssurface mixing ratio was correspondingly reduced by the greatestamount (45%). Higher H2O2 dry deposition significantly affectedsimulation results of its surface concentration for much of theforested areas of the globe (Fig. 7), e.g., Canadian and Europeanboreal forests, the Amazon basin, and the Congo basin. Mea-surements at these sites are not available for model comparison;however, the results suggest that underrepresentation of dry de-position for H2O2 is likely responsible for much of past over-estimations of its mixing ratios in GEOS−Chem simulations (51).The sensitivity of H2O2 boundary layer mixing ratio to dry
deposition may be expected because this compound has a longlifetime with respect to oxidation and photolysis in the loweratmosphere. To estimate dry, midday sinks, we use measureddaytime deposition velocities (Fig. 3), simulated [OH] ≈ 2.6 ×10⁶·cm−3 (twice the 24-h value in Table 1), simulated photolysisunder tropical noon with 300 Dobson units ozone (58), anda boundary layer height of 1.5 km. The deposition lifetime ofH2O2 (τdep ≈ 8 h) accounts for >70% of its total atmosphericloss under dry conditions [τhv ≈ 1.4 d; τOH ≈ 2.6 d (59)]. Re-action with ozone, usually several orders of magnitude slowerfor unsaturated compounds and unimportant for saturatedcompounds, was neglected as a loss process. Dry deposition ofother saturated compounds can be expected to dominate theiratmospheric removal in a manner similar to H2O2 because theirreactive lifetimes in the atmosphere are long and their watersolubilities are high. For example, HMHP (∼4 cm·s−1) has a de-position lifetime of 10 h, accounting for ∼55% of its atmosphericremoval [τ hv≈ 4 d, τOH ≈ 14 h (estimated based on methylhy-droperoxide+OH rate coefficient) (60)]. Similarly, dry depositionmay comprise ∼60% of the atmospheric loss for PAA (59, 61) and∼45% of the atmospheric loss for IEPOX (42). IEPOX is alsoremoved by reactive uptake to aerosols. Using data from a recent
Fig. 6. Base GEOS−Chem (run at 0.25° lat × 0.33° lon) simulations (blacklines) and observations (colored points) for June 2013 at the Brent, AL CTRsite. The modeled (A) friction velocity, (B) sensible heat flux, and (C) latentheat flux data are derived from GEOS-FP hourly-resolved meteorology. De-position velocities (D–F) were calculated from GEOS−Chem without mod-ifications (black lines) or with adjustments to the Henry’s coefficient of thesecompounds (blue lines, if applicable) for a sensitivity study (see text). Simu-lations were performed for all 30 d in June 2013, and observed data weremeasured for the 5 d included in this study. Error bars represent 1 SD frommean values.
Table 1. GEOS−Chem base and sensitivity (sens.) simulation for the grid box representing theBrent, AL, field site, 2° × 2.5° resolution
Tracer name Base Vd,* cm·s−1 Sens. Vd,* cm·s−1 Base conc. (70 m) Sens. conc. (70 m) Δ %
OH – – 1.32 × 10⁶ 1.30 × 10⁶ −2HO2 – – 3.84 × 10⁸ 3.77 × 10⁸ −2NO – – 0.12 0.12 0NO2 – – 0.98 0.98 0O3 – – 50.97 50.63 −1PAN – – 0.38 0.37 −2HNO3 3.02 3.02 0.46 0.45 −1H2O2 0.37 2.66 2.83 1.55 −45PPN – – 0.019 0.018 −2HCHO – – 3.64 3.60 −1MHP – – 1.18 1.15 −2SO2 – – 1.20 1.21 1SO4 – – 0.53 0.52 −2ISOPN 0.30 0.82 0.081 0.073 −10MACN+MVKN 0.30 0.81 0.075 0.069 −9PROPNN 0.30 0.48 0.055 0.047 −14HAC 0.30 0.71 1.48 1.25 −15ISOPOOH 0.76 0.76 0.38 0.38 0IEPOX 2.86 2.73 0.58 0.59 1
Concentrations (conc.) are reported in parts per billion by volume, except OH and HO2, where units are inmolecules per cubic centimeter. Percent change is defined with respect to the base simulation.*The 24-h average (approximately half of daytime value).
6 of 10 | www.pnas.org/cgi/doi/10.1073/pnas.1418702112 Nguyen et al.

laboratory study of IEPOX particle uptake probabilities (62), weestimate that the dry deposition fate of IEPOX is significantlyaffected only in the presence of very acidic inorganic sulfate par-ticles at pH < 1 (reduced to ∼20%) and is relatively unaffected ifthe particles have more moderate acidities (pH > 3).For unsaturated compounds like ISOPN, deposition may
comprise a smaller fraction (<10%) of the daytime sink becauseits reaction with OH is fast (54). Thus, errors in representation ofISOPN dry deposition will have a much smaller effect on simu-lated ISOPN surface concentrations. In general, while dry de-position is less important for organic nitrates than peroxides,changes in their mixing ratios obtained from the sensitivity studywere significant for both classes of compounds. Mixing ratios fororganic nitrates from isoprene were reduced by 9–14% in thesensitivity study. The carbonyl nitrates (in particular MACN)may be reasonably photolabile (63), further diminishing theimportance of dry deposition. Smaller multifunctional carbonylslike HAC are longer-lived in the atmosphere. Correspondingly,their surface concentration reductions (15%) in the sensitivitystudy are larger than for ISOPN.The differences in H2O2 and other trace gas mixing ratios in
the troposphere between the base and sensitivity studies weremost significant within the boundary layer (<3 km). Importantly,the concentration gradient is larger near the surface when Vd ishigher (SI Appendix, Fig. S20), leading to more pronounceddifferences between the base and sensitivity studies at the mea-surement height of ∼20 m. As the lowest vertical layer in GEOS−Chem corresponds to an average height of 70 m, we linearlyextrapolated the surface gradient to the tower height for com-pounds of interest to compare with measurements. Comparedwith mixing ratios measured at SOAS [24-h mean ≈ 0.5 (±30%)parts per billion by volume (ppbv) on campaign days withoutsignificant precipitation], H2O2 mixing ratios are overpredictedby more than 300% in the base simulation and are much closerin the sensitivity simulations, but still overpredicted by ∼85%.Daytime values for other trace gases are still overestimated by30–300% in the model for the CTR measurement site; however,all mixing ratios in the sensitivity study are substantially closer tomeasured values at SOAS when extrapolated to the measure-ment height. The errors in overestimations are reduced by fac-tors of 1.5–4.The most dramatic overestimation occurred with IEPOX,
where 24-h mean values at SOAS are measured to be ∼0.09 ppbwith tandem mass spectrometry and simulated to be ∼0.35 ppb
(extrapolated to 20 m). Unlike H2O2, this result is not attributedto underestimation of dry deposition. In fact, the simulated Vd inGEOS−Chem for IEPOX is ∼70% higher than results from theadjusted resistance model we used in this work. Interestingly, Vdsimulated in GEOS−Chem for ISOPOOH is ∼50% lower thanour estimates. IEPOX deposition velocity should be limited bymolecular diffusion due to its high water solubility (Fig. 5), whichsuggests a lower daytime Vd than that simulated by GEOS−Chem (∼5.5 cm·s−1). The average Vd for these isobaric specieswas not adjusted in our sensitivity simulations because theirmean simulated Vd is similar to the observed value due to thenegating errors. More likely, the low observed mixing ratios ofIEPOX at SOAS may be due to error in its production rate orbecause heterogeneous loss reactions, such as conversion to or-ganic aerosols in anthropogenically impacted particle liquidwater (64), were not accounted for in the model. IEPOX uptakeclearly involves hydronium-catalyzed ring opening in aerosolliquid water (62, 65, 66). However, field results suggest that morefactors than acid catalysis govern the chemistry (67). Laboratoryresults indicate that hydrated ammonium sulfate particles (butnot sodium or magnesium sulfate) produce a similar magnitudeof organic aerosol mass due to IEPOX uptake regardless ofwhether acid was added (68, 69). More work is needed toelucidate field observations and update atmospheric modelmechanisms.Results from this sensitivity simulation suggest that improved
representations of dry deposition in GEOS−Chem, and likelyother models, would partially resolve model overestimations forcertain species within the boundary layer. Additionally, an ex-perimentally constrained OVOC dry deposition scheme is likelyto have a substantial effect on the organic aerosol budget, assuggested previously (11). The impact on aerosols, however, wasnot determined in this work. Enhanced accuracy of model sim-ulations of biogenic trace gas surface concentrations and life-times may be gained by updating the model to include OVOCsthat are not yet in the mechanism and by improving verticalmixing schemes for volatile compounds (70), especially near thecanopy (71).
Impact on Ecosystems. The field observations suggest that a sig-nificant portion of VOC emitted by the biosphere is returned tothe ecosystem via dry deposition of OVOCs. Fig. 8, Left, showsthe net mean deposition of C, N, and O atomic mass, obtainedfrom the speciated contributions of 16 molecular formulas ob-served, averaged across multiple days. As our measurementsencompass only a subset of organic species present in the tro-posphere, all estimations of combined fluxes are lower limits. Weobserved that at least 6% of the reactive carbon mass that wasemitted as isoprene in an AL forest [∼4 mgC·m−2·h−1 daytime(72), integrated over 24 h] were removed by the canopy via drydeposition of isoprene’s oxidation products. Our analysis does
Fig. 7. GEOS−Chem sensitivity study (2° lat × 2.5° lon) for H2O2 during June2013: 24-h mean deposition velocities in the (A) base and (B) sensitivitysimulations and surface mixing ratios in the (C) base and (D) sensitivitysimulations.
Fig. 8. (Left) Net carbon, oxygen, and nitrogen downward flux by mass, cal-culated from molecular formulas for compounds shown in SI Appendix, TableS1, and averaged over the dates in the study. (Right) Percent contribution oforganic nitrates and nitric acid to the measured oxidized nitrogen flux.
Nguyen et al. PNAS Early Edition | 7 of 10
EART
H,A
TMOSP
HER
IC,
ANDPL
ANET
ARY
SCIENCE
SPN
ASPL
US
not include HCN and MTNP. This estimate of the contributionof dry deposition removal of isoprene carbon may be larger if themany isoprene-derived OVOCs that are expected to deposit areincluded in the analysis, e.g., ethanal nitrate, various acylperox-ynitrates (APNs), acetic acid, glycolaldehyde, formaldehyde,glyoxal, methylglyoxal, acetaldehyde, and other OVOCs.Oxygenated compounds contribute most of the mass flux due
to the combined effect of their larger molecular weight from theincorporation of oxygen during oxidation (73), and the pro-pensity for less-volatile and more-water-soluble compounds todeposit. The oxidant deposition observed by our instrument isattributed to hydroperoxides (−OOH), although we are missingthe likely minor contribution of methyl hydroperoxide (MHP).Organic hydroperoxides can be formed primarily from the RO2reaction with HO2, more prevalent in pristine environments, orfrom humid ozonolysis, more prevalent in urban-influencedenvironments (Fig. 1). Thus, oxidant deposition is highly de-pendent on geographical location and time of day. However,ozone has been considered as the predominant oxidant inmodeling dry deposition or in estimating oxidant-induced plantdamage. The apparent effects of ozone on forest ecosystems arewell documented, but they may not be directly attributable toozone. Ozone concentration rapidly declines after stomatal up-take, and damaging effects in plants are often linked to theproduction of secondary stressors that are dependent on ozonedose (74). These secondary stressors were suggested to be, inpart, H2O2, HMHP, and other hydroperoxides that are producedas part of alkene ozonolysis (46). It should be noted that bothH2O2 and O3 may elicit beneficial defense reactions in plantsbelow their relative phytotoxic limits (75, 76), and the physio-logical effects are tightly coupled. Thus, it may be useful toconsider the total activated oxygen flux as the sum of ozoneand peroxides.We estimate that the daytime molar peroxide flux at this
southeast US site (2.4 nmol OOH·m−2·s−1) is 15% of the ozoneflux on average [∼16 nmol·m−2·s−1 using [O3] = 50 ppbv andVd;O3 = 0.8 cm·s−1 (77)]. However, in more pristine areas like theAmazon rainforest, the concentration of total peroxides is higherand ozone is lower than the southeast United States. The esti-mated daytime peroxide flux of 5.7 nmol·m−2·s−1 in Amazonia[using [H2O2] and [ROOH] observed by Lelieveld et al. (4) andVd;H2O2 = 5 cm·s−1 and Vd;ROOH = 2 cm·s−1] can be 50–120% ofobserved daytime O3 fluxes during the dry season (78). Theseresults suggest that, across varying degrees of urban influence,peroxides can comprise a significant to dominant fraction of thedaytime oxidant flux in forest ecosystems.Exogenous H2O2 (millimolar equivalent) has been shown to
inhibit stomatal opening by signaling the production of NO inguard cells (79, 80). Furthermore, as peroxides are potent oxi-dizers and generators of reactive oxygen species (ROS) like thehydroxyl radical (OH) and the superoxide (O2
.−) in water, theirlarge deposition flux motivates inquiries into their fates at thesurface of plants. Deposited peroxides likely participate inaqueous or heterogeneous chemistry, e.g., the oxidation of de-posited SO2 to sulfuric acid (81) or the production of ROS likeOH, HO2, and O2
.− through direct photochemistry and catalyticreaction with trace metals (Fe) (82). During the SOAS cam-paign, we measured plumes of SO2 in the range of 1–9 ppb (SIAppendix, Fig. S21). The peroxide-mediated production of strongacids and oxidants may play a role in plant damage during theseepisodes. Additionally, this chemistry may contribute to theaforementioned inferred emission flux of formic acid throughheterogeneous oxidation of OVOCs. Whether the observed de-position flux of peroxides can impact atmospheric chemistry viaheterogeneous pathways or affect plant function under typicalatmospheric conditions remains to be further explored.The mean daytime dry deposition flux from HNO3, HCN,
and speciated organic nitrates was measured to be 27 (±15)
μgN·m−2·h−1. To estimate the ecosystem input of nitrogen, thedry flux of N-containing species that were not measured in thiswork (NH3, NH4
+, etc.) were simulated with GEOS−Chem.The wet-deposited N data for 2013 (measured as NH4
+ andNO3
−) was provided by the National Atmospheric DepositionProgram at the AL03 site corresponding to CTR (nadp.sws.uiuc.edu/). We estimate that dry deposition supplied ∼52% of thetotal wet and dry input of nitrogen to the canopy by mass. Thisresult is consistent with average estimates (∼46%) at 10 NorthAmerican forests (83).HNO3 is commonly assumed to dominate the oxidized nitro-
gen dry deposition flux; however, our data indicate that organicnitrates (RONO2) measured by our instrument can constitutea sizable portion (15%) of the dry flux of oxidized nitrogen ob-served at this site (Fig. 8, Right), with nitric acid making up thebalance. This is a lower limit of the organic nitrogen input intothe canopy. Zhang et al. (49) assumed a deposition velocity ofisoprene nitrates to be ∼5.5 cm·s−1 in the daytime (greater thana factor of 3 larger than our observations) and arrived at a similarconclusion. If we include an estimation for acylperoxy nitratesfrom data obtained in Northern California (84), the resultingorganic nitrogen contribution would be a bit higher (∼25%).HCN was, at most, 3% of the N flux observed in this work.However, the main source of HCN is biomass burning and, thus,its flux will vary significantly depending on location and time ofyear. The minor impact from NO2 deposition (21) was neglected.The data demonstrate that organic nitrogen is an importantfraction of the oxidized nitrogen dry deposition flux, similar towet deposition (85). The organic nitrogen may be taken up byfoliage (86, 87) and incorporated into the synthesis of leafnutrients. As the effects of organic nitrogen on carbon seques-tration are inadequately represented in most ecological models,these data motivate further inquiry into the ecosystem ram-ifications of OVOC deposition.
Materials and MethodsSite and Sampling. This work was performed as part of the SOAS Campaign(soas2013.rutgers.edu/) at the CTR Southeastern Aerosol Research andCharacterization Study (SEARCH) site operated by the Electric Power Re-search Institute (Brent, AL, Lat 32.90289 Lon −87.24968) for the US Envi-ronmental Protection Agency. The metal walk-up sampling tower was ∼20 min height (measurement height ∼22 m) and the mean canopy height was∼10 m. The CIMS was situated on the topmost platform, facing north towardthe forest. The temperatures inside the instrument enclosure and CIMS flowregion were controlled, and the instrument was shielded from the elementsby an insulated enclosure. An ultrasonic anemometer extending off thetower on the north side, longitudinally separated from the inlet ∼0.8 m,measured the 3D wind components and the converted virtual temperature.A weather station comprised of several sensors monitored the relative hu-midity (RH, percent), air temperature (T, degrees Centigrade), barometricpressure (P, millibars), solar radiation (watts per square meter), wind speed(meters per second), and wind direction (0–360°).
CIMS Mixing Ratios. The ionization mechanism and details about calibrationfor each species are presented in SI Appendix. Briefly, compounds were mea-sured through a high-flow fluoropolymer-coated glass inlet (∼40 cm long,3.1 cm ID, ∼2,000 L·min−1). The analytical method, using reagent ion CF3O
−,is specific toward the detection of acids, hydroperoxides, multifunctionalnitrates, and other multifunctional species. The ionization mechanism isfluoride transfer for acidic analytes and cluster formation for other analytes.The absolute sensitivity and water vapor dependence of the ionization werecalibrated for each species in the laboratory by quantitative techniques(spectroscopy, gravimetry, liquid chromatography, etc.), when calibrationstandards are available commercially or can be synthesized and purified (11out of 16 compounds). The sensitivities were calculated by ab initio methodsotherwise. High-frequency CIMS measurement of water vapor was cali-brated by 1-Hz weather station measurements of RH, T, and P after ap-plication of a temperature correction to the ion signal. In-field calibrationswere performed every 2 h with commercially available standards, and in-field zero backgrounds were measured every half hour, under dry andambient RH conditions.
8 of 10 | www.pnas.org/cgi/doi/10.1073/pnas.1418702112 Nguyen et al.
Flux Calculations. Data processing protocols, flux quality assessment andcriteria, standard corrections, and CIMS-specific corrections are documentedin detail in SI Appendix. We limit the fluxes presented here to a few idealdays from the campaign period, characterized by the following conditions:The turbulence (measured by the momentum flux) is well established, thedata reproducibility is high, the spectral analysis shows expected behaviorfor sampling in the inertial subrange, and the energy balance closure at thesurface (Fig. 2) is adequately met. Acceptable data generally correspond tomeasurement periods for which winds were northerly, with exclusively forestfetch. Mixing ratios and the vertical wind were measured at 8 Hz or faster. Atime response correction was applied for HNO3 (factor of 1.62) as described inSI Appendix, section 5, due the measured flux dampening caused by the timedelay of this compound from interactions with instrument surfaces. Mea-surement uncertainties (±1σ) are largest for species with lower mean con-centrations during the daytime, such as MTNP, which has a dominantnighttime source. A short period of atypical nighttime convection was re-moved from the data for Julian day 165 due to the flux criteria discussed inSI Appendix, section 4. EC fluxes of other species commonly detected by CIMS
(notably, SO2, glycolaldehyde, and methyl hydroperoxide) were not calculatedin this work because mixing ratios at this site were either too rapidly changing(SO2 plumes) or contain interfering species when measured with the time-of-flight mass detector.
ACKNOWLEDGMENTS. We thank the organizers and committee members ofthe SOAS campaign: A. G. Carlton, A. H. Goldstein, J. L. Jimenez, R. W. Pinder,J. de Gouw, B. J. Turpin, and A. B. Guenther. We acknowledge C. J. Groff atPurdue University for his help with leaf area index measurements and treesurveys. We thank D. J. Jacob and the Atmospheric Chemistry Modeling Groupat Harvard University for making GEOS−Chem available for this work. Mete-orological data used in the GEOS−Chem simulations were provided by theGlobal Modeling and Assimilation Office at NASA Goddard Space Flight Cen-ter. We acknowledge funding from the National Science Foundation (NSF)under Grant AGS-1240604 and NSF Postdoctoral Research Fellowship programAward AGS-1331360. Financial and logistical support for SOAS was providedby the NSF, the Earth Observing Laboratory at the National Center for Atmo-spheric Research (operated by NSF), the personnel at Atmospheric Researchand Analysis, and the Electric Power Research Institute.
1. Guenther A (2002) The contribution of reactive carbon emissions from vegetation tothe carbon balance of terrestrial ecosystems. Chemosphere 49(8):837–844.
2. Carlton AG, Wiedinmyer C, Kroll JH (2009) A review of secondary organic aerosolformation from isoprene. Atmos Chem Phys 9(14):4987–5005.
3. Mao J, et al. (2013) Ozone and organic nitrates over the eastern United States: Sen-sitivity to isoprene chemistry. J Geophys Res 118(19):11,256–11,268.
4. Lelieveld J, et al. (2008) Atmospheric oxidation capacity sustained by a tropical forest.Nature 452(7188):737–740.
5. Xie Y, et al. (2013) Understanding the impact of recent advances in isoprene photo-oxidation on simulations of regional air quality. Atmos Chem Phys 13(16):8439–8455.
6. Paulot F, et al. (2011) Importance of secondary sources in the atmospheric budgets offormic and acetic acids. Atmos Chem Phys 11(5):1989–2013.
7. Horowitz LW, et al. (2007) Observational constraints on the chemistry of isoprenenitrates over the eastern United States. J Geophys Res 112(D12):D12S08.
8. Fowler D, Duyzer J, Andreae M, Schimel D (1989)Micrometeorological Techniques forthe Measurement of Trace Gas Exchange (Wiley, New York).
9. Karl T, et al. (2004) Exchange processes of volatile organic compounds above a trop-ical rain forest: Implications for modeling tropospheric chemistry above dense vege-tation. J Geophys Res 109(D18):D18306.
10. Park J-H, et al. (2013) Active atmosphere-ecosystem exchange of the vast majority ofdetected volatile organic compounds. Science 341(6146):643–647.
11. Bessagnet B, Seigneur C, Menut L (2010) Impact of dry deposition of semi-volatileorganic compounds on secondary organic aerosols. Atmos Environ 44(14):1781–1787.
12. Ahmadov R, et al. (2012) A volatility basis set model for summertime secondary or-ganic aerosols over the eastern United States in 2006. J Geophys Res 117(D6):D06301.
13. Knote C, Hodzic A, Jimenez JL (2014) The effect of dry and wet deposition of con-densable vapors on secondary organic aerosols concentrations over the continentalUS. Atmos Chem Phys Discuss 14(9):13731–13767.
14. Zhang L, Brook J, Vet R (2003) A revised parameterization for gaseous dry depositionin air-quality models. Atmos Chem Phys 3(6):2067–2082.
15. Müller M, et al. (2010) First eddy covariance flux measurements by PTR-TOF. AtmosMeas Tech 3(2):387–395.
16. Baldocchi DD, Hincks BB, Meyers TP (1988) Measuring biosphere-atmosphere ex-changes of biologically related gases with micrometeorological methods. Ecology 69(5):1331–1340.
17. Crounse JD, McKinney KA, Kwan AJ, Wennberg PO (2006) Measurement of gas-phasehydroperoxides by chemical ionization mass spectrometry. Anal Chem 78(19):6726–6732.
18. Kaminsky KZ, Dubayah R (1997) Estimation of surface net radiation in the borealforest and northern prairie from shortwave flux measurements. J Geophys Res 102(D24):29707–29716.
19. Oliphant A, et al. (2004) Heat storage and energy balance fluxes for a temperatedeciduous forest. Agric For Meteorol 126(3):185–201.
20. Ganzeveld L, Valverde-Canossa J, Moortgat GK, Steinbrecher R (2006) Evaluation ofperoxide exchanges over a coniferous forest in a single-column chemistry-climatemodel. Atmos Environ 40(0):68–80.
21. Munger JW, et al. (1996) Atmospheric deposition of reactive nitrogen oxides andozone in a temperate deciduous forest and a subarctic woodland: 1. Measurementsand mechanisms. J Geophys Res 101(D7):12639–12657.
22. Hall B, Claiborn C, Baldocchi D (1999) Measurement and modeling of the dry de-position of peroxides. Atmos Environ 33(4):577–589.
23. Hall BD, Claiborn CS (1997) Measurements of the dry deposition of peroxides toa Canadian boreal forest. J Geophys Res 102(D24):29343–29353.
24. Valverde-Canossa J, et al. (2006) First measurements of H2O2 and organic peroxidessurface fluxes by the relaxed eddy-accumulation technique. Atmos Environ 40(Suppl1):55–67.
25. Hartmann WR, Santana M, Hermoso M, Andreae MO, Sanhueza E (1991) Diurnalcycles of formic and acetic acids in the northern part of the Guayana shield, Ven-ezuela. J Atmos Chem 13(1):63–72.
26. Kuhn U, et al. (2002) Exchange of short-chain monocarboxylic acids by vegetation ata remote tropical forest site in Amazonia. J Geophys Res 107(D20):8069.
27. Meyers T, Huebert B, Hicks B (1989) HNO3 deposition to a deciduous forest. BoundaryLayer Metorol 49(4):395–410.
28. Horii CV, et al. (2005) Atmospheric reactive nitrogen concentration and flux budgetsat a Northeastern US forest site. Agric For Meteorol 133(1):210–225.
29. Farmer D, Wooldridge P, Cohen R (2006) Application of thermal-dissociation laserinduced fluorescence (TD-LIF) to measurement of HNO3, Σalkyl nitrates, Σperoxy ni-trates, and NO2 fluxes using eddy covariance. Atmos Chem Phys 6(11):3471–3486.
30. Farmer D, Cohen R (2008) Observations of HNO3, ΣAN, ΣPN and NO2 fluxes: Evidencefor rapid HOx chemistry within a pine forest canopy. Atmos Chem Phys 8(14):3899–3917.
31. Lee X, Massman W, Law BE (2006) Handbook of Micrometeorology: A Guide forSurface Flux Measurement and Analysis (Springer, New York).
32. Jensen NO, Hummelshøj P (1995) Derivation of canopy resistance for water vapourfluxes over a spruce forest, using a new technique for the viscous sublayer resistance.Agric For Meteorol 73(3-4):339–352.
33. Jensen NO, Hummelshøj P (1997) Erratum to Derivation of canopy resistance forwater vapour fluxes over a spruce forest, using a new technique for the viscoussublayer resistance. Agric For Meteorol 85(3):289.
34. Wesely M, Hicks B (2000) A review of the current status of knowledge on dry de-position. Atmos Environ 34(12):2261–2282.
35. Wesely ML (1989) Parameterization of surface resistances to gaseous dry deposition inregional-scale numerical models. Atmos Environ 23(6):1293–1304.
36. Kampf CJ, et al. (2013) Effective Henry’s law partitioning and the salting constant ofglyoxal in aerosols containing sulfate. Environ Sci Technol 47(9):4236–4244.
37. Ip HSS, Huang XHH, Yu JZ (2009) Effective Henry’s law constants of glyoxal, glyoxylicacid, and glycolic acid. Geophys Res Lett 36(1):L01802.
38. Snedden WA, Chung I, Pauls RH, Bown AW (1992) Proton/l-glutamate symport andthe regulation of intracellular pH in isolated mesophyll cells. Plant Physiol 99(2):665–671.
39. Van Hove LWA, Adema EH, Vredenberg WJ, Pieters GA (1989) A study of the ad-sorption of NH3 and SO2 on leaf surfaces. Atmos Environ 23(7):1479–1486.
40. Sander R (1999) Compilation of Henry’s Law Constants for Inorganic and OrganicSpecies of Potential Importance in Environmental Chemistry (Max Planck Inst Chem,Mainz, Germany).
41. Stavrakou T, et al. (2012) Satellite evidence for a large source of formic acid fromboreal and tropical forests. Nat Geosci 5(1):26–30.
42. Bates KH, et al. (2014) Gas phase production and loss of isoprene epoxydiols. J PhysChem A 118(7):1237–1246.
43. Neeb P, Sauer F, Horie O, Moortgat GK (1997) Formation of hydroxymethyl hydro-peroxide and formic acid in alkene ozonolysis in the presence of water vapor. AtmosEnviron 31(15):1417–1423.
44. Marklund S (1971) The simultaneous determination of bis(hydroxymethyl)peroxide(BHMP), hydroxymethylhydroperoxide (HMP), and H2O2 with Titanium (IV). Equilibriabetween peroxides and stabilities of HMP and BHMP at physiological conditions. ActaChem Scand 25(9):3517–3531.
45. Goldstein AH, et al. (2004) Forest thinning experiment confirms ozone deposition toforest canopy is dominated by reaction with biogenic VOCs. Geophys Res Lett 31(22):L22106.
46. Hewitt CN, Kok GL, Fall R (1990) Hydroperoxides in plants exposed to ozone mediateair pollution damage to alkene emitters. Nature 344(6261):56–58.
47. Fares S, Loreto F, Kleist E, Wildt J (2008) Stomatal uptake and stomatal deposition ofozone in isoprene and monoterpene emitting plants. Plant Biol (Stuttg) 10(1):44–54.
48. Jardine K, et al. (2011) Within-canopy sesquiterpene ozonolysis in Amazonia.J Geophys Res 116(D19):D19301.
49. Zhang L, et al. (2012) Nitrogen deposition to the United States: Distribution, sources,and processes. Atmos Chem Phys 12(10):4539–4554.
50. Allen NDC, González Abad G, Bernath PF, Boone CD (2013) Satellite observations ofthe global distribution of hydrogen peroxide (H2O2) from ACE. J. Quant. SpectroscRadiat Transfer 115:66–77.
51. Mao J, et al. (2010) Chemistry of hydrogen oxide radicals (HOx) in the Arctic tropo-sphere in spring. Atmos Chem Phys 10(13):5823–5838.
52. Li Q, et al. (2000) Atmospheric hydrogen cyanide (HCN): Biomass burning source,ocean sink? Geophys Res Lett 27(3):357–360.
Nguyen et al. PNAS Early Edition | 9 of 10
EART
H,A
TMOSP
HER
IC,
ANDPL
ANET
ARY
SCIENCE
SPN
ASPL
US

53. Bey I, et al. (2001) Global modeling of tropospheric chemistry with assimilated me-teorology: Model description and evaluation. J Geophys Res 106(D19):23073–23095.
54. Lee L, Teng AP, Wennberg PO, Crounse JD, Cohen RC (2014) On rates and mechanismsof OH and O3 reactions with isoprene-derived hydroxy nitrates. J Phys Chem A 118(9):1622–1637.
55. Lee M, Heikes BG, O’Sullivan DW (2000) Hydrogen peroxide and organic hydroper-oxide in the troposphere: A review. Atmos Environ 34(21):3475–3494.
56. Crounse JD, Paulot F, Kjaergaard HG, Wennberg PO (2011) Peroxy radical isomeri-zation in the oxidation of isoprene. Phys Chem Chem Phys 13(30):13607–13613.
57. Paulot F, Henze DK, Wennberg PO (2012) Impact of the isoprene photochemicalcascade on tropical ozone. Atmos Chem Phys 12(3):1307–1325.
58. Tie X, et al. (2003) Effect of clouds on photolysis and oxidants in the troposphere.J Geophys Res 108(D20):4642.
59. Sander SP, et al. (2006) Chemical Kinetics and Photochemical Data for Use inStratospheric Modeling: Evaluation Number 15 (Jet Propulsion Lab, Pasadena, CA) JPLPubl 06-2.
60. Bauerle S, Moortgat GK (1999) Absorption cross-sections of HOCH2OOH vapor be-tween 205 and 360 nm at 298 K. Chem Phys Lett 309(1-2):43–48.
61. Orlando JJ, Tyndall GS (2003) Gas phase UV absorption spectra for peracetic acid, andfor acetic acid monomers and dimers. J Photochem Photobiol Chem 157(2-3):161–166.
62. Gaston CJ, et al. (2014) Reactive uptake of an isoprene-derived epoxydiol to sub-micron aerosol particles. Environ Sci Technol 48(19):11178–11186.
63. Müller J-F, Peeters J, Stavrakou T (2014) Fast photolysis of carbonyl nitrates fromisoprene. Atmos Chem Phys 14(5):2497–2508.
64. Carlton AG, Turpin BJ (2013) Particle partitioning potential of organic compounds ishighest in the Eastern US and driven by anthropogenic water. Atmos Chem Phys13(20):10203–10214.
65. Lin Y-H, et al. (2012) Isoprene epoxydiols as precursors to secondary organic aerosolformation: Acid-catalyzed reactive uptake studies with authentic compounds. EnvironSci Technol 46(1):250–258.
66. Eddingsaas NC, VanderVelde DG, Wennberg PO (2010) Kinetics and products of theacid-catalyzed ring-opening of atmospherically relevant butyl epoxy alcohols. J PhysChem A 114(31):8106–8113.
67. Lin YH, Knipping EM, Edgerton ES, Shaw SL, Surratt JD (2013) Investigating the in-fluences of SO2 and NH3 levels on isoprene-derived secondary organic aerosol for-mation using conditional sampling approaches. Atmos Chem Phys 13(16):8457–8470.
68. Lin Y-H, et al. (2014) Light-absorbing oligomer formation in secondary organicaerosol from reactive uptake of isoprene epoxydiols. Environ Sci Technol 48(20):12012–12021.
69. Nguyen TB, et al. (2014) Organic aerosol formation from the reactive uptake of iso-prene epoxydiols (IEPOX) onto non-acidified inorganic seeds. Atmos Chem Phys 14(7):3497–3510.
70. Bryan A, et al. (2012) In-canopy gas-phase chemistry during CABINEX 2009: Sensitivityof a 1-D canopy model to vertical mixing and isoprene chemistry. Atmos Chem Phys12(18):8829–8849.
71. Steiner A, et al. (2011) Analysis of coherent structures and atmosphere-canopy cou-pling strength during the CABINEX field campaign. Atmos Chem Phys 11(23):11921–11936.
72. Guenther A, et al. (1996) Estimates of regional natural volatile organic compoundfluxes from enclosure and ambient measurements. J Geophys Res 101(D1):1345–1359.
73. Crounse JD, Nielsen LB, Jørgensen S, Kjaergaard HG, Wennberg PO (2013) Autoxi-
dation of organic compounds in the atmosphere. J Phys Chem Lett 4(20):3513–3520.74. Sandermann H, Jr (1996) Ozone and plant health. Annu Rev Phytopathol 34(1):
347–366.75. Sandermann H, Jr, Ernst D, Heller W, Langebartels C (1998) Ozone: An abiotic elicitor
of plant defence reactions. Trends Plant Sci 3(2):47–50.76. Mehlhorn H (1990) Ethylene-promoted ascorbate peroxidase activity protects plants
against hydrogen peroxide, ozone and paraquat. Plant Cell Environ 13(9):971–976.77. Finkelstein PL, et al. (2000) Ozone and sulfur dioxide dry deposition to forests: Ob-
servations and model evaluation. J Geophys Res 105(D12):15365–15377.78. Rummel U, et al. (2007) Seasonal variation of ozone deposition to a tropical rain
forest in southwest Amazonia. Atmos Chem Phys 7(20):5415–5435.79. Yan J, Tsuichihara N, Etoh T, Iwai S (2007) Reactive oxygen species and nitric oxide are
involved in ABA inhibition of stomatal opening. Plant Cell Environ 30(10):1320–1325.80. Lum HK, Butt YK, Lo SC (2002) Hydrogen peroxide induces a rapid production of nitric
oxide in mung bean (Phaseolus aureus). Nitric Oxide 6(2):205–213.81. Lind JA, Lazrus AL, Kok GL (1987) Aqueous phase oxidation of sulfur (IV) by hydrogen
peroxide, methylhydroperoxide, and peroxyacetic acid. J Geophys Res 92(D4):
4171–4177.82. Fenton H (1894) Oxidation of tartaric acid in presence of iron. J Chem Soc Trans 65:
899–910.83. Lovett GM, Lindberg SE (1993) Atmospheric deposition and canopy interactions of
nitrogen in forests. Can J For Res 23(8):1603–1616.84. Wolfe GM, et al. (2009) Eddy covariance fluxes of acyl peroxy nitrates (PAN, PPN and
MPAN) above a Ponderosa pine forest. Atmos Chem Phys 9(2):615–634.85. Neff J, Holland E, Dentener F, McDowell W, Russell K (2002) The origin, composition
and rates of organic nitrogen deposition: A missing piece of the nitrogen cycle?
Biogeochemistry 57-58(1):99–136.86. Lockwood AL, Filley TR, Rhodes D, Shepson PB (2008) Foliar uptake of atmospheric
organic nitrates. Geophys Res Lett 35(15):L15809.87. Sparks JP, Roberts JM, Monson RK (2003) The uptake of gaseous organic nitrogen by
leaves: A significant global nitrogen transfer process. Geophys Res Lett 30(23):2189.88. Paulot F, et al. (2009) Unexpected epoxide formation in the gas-phase photooxida-
tion of isoprene. Science 325(5941):730–733.89. Jacobs MI, Darer AI, Elrod MJ (2013) Rate constants and products of the OH reaction
with isoprene-derived epoxides. Environ Sci Technol 47(22):12868–12876.90. Paulot F, et al. (2009) Isoprene photooxidation: New insights into the production of
acids and organic nitrates. Atmos Chem Phys 9(4):1479–1501.91. Jacobs MI, Burke WJ, Elrod MJ (2014) Kinetics of the reactions of isoprene-derived
hydroxynitrates: Gas phase epoxide formation and solution phase hydrolysis. Atmos
Chem Phys Discuss 14(8):12121–12165.92. Peeters J, Nguyen TL, Vereecken L (2009) HOx radical regeneration in the oxidation of
isoprene. Phys Chem Chem Phys 11(28):5935–5939.93. Beaver MR, et al. (2012) Importance of biogenic precursors to the budget of organic
nitrates: Observations of multifunctional organic nitrates by CIMS and TD-LIF during
BEARPEX 2009. Atmos Chem Phys 12(13):5773–5785.94. Tyndall GS, et al. (2001) Atmospheric chemistry of small organic peroxy radicals.
J Geophys Res 106(D11):12157–12182.
10 of 10 | www.pnas.org/cgi/doi/10.1073/pnas.1418702112 Nguyen et al.