Embed Size (px)
Citation preview
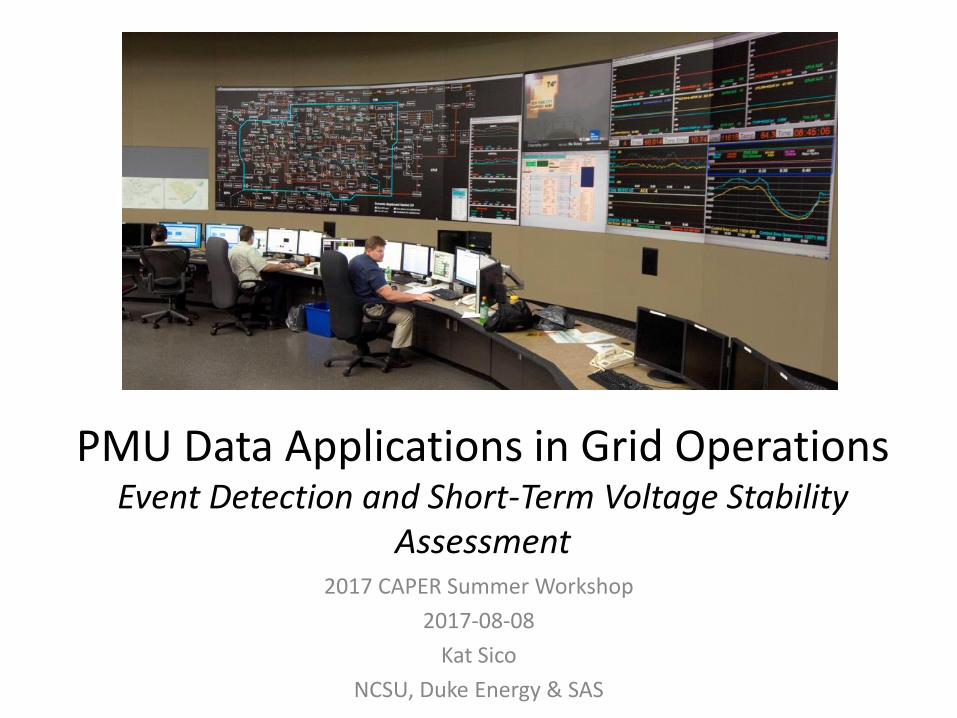
PMU Data Applications in Grid Operations Event Detection and Short-Term Voltage Stability
Assessment 2017 CAPER Summer Workshop
2017-08-08
Kat Sico
NCSU, Duke Energy & SAS

What is a PMU ? • Phasor Measurement Unit, aka Synchrophasor • Measures A, B and C phase currents and voltages and uses a
recursive algorithm to calculate the symmetrical components via the Discrete Fourier Transform
• Records 30-120 samples per second (SCADA typically samples once every 2-4 seconds)
• Provides local phase angle and frequency measurement (SCADA measures magnitude and estimates phase angle)
• Time synchronization of PMUs via GPS aligns phase angles to a common time reference allowing for observability across a wide area

PMUs at Duke Energy
• Locations – Duke Carolinas West
• 141 PMUs installed at 62 substations – Duke Carolinas East
• 18 PMUs installed at 9 substations – Indiana/Ohio
• 34 PMUs installed at 16 substations – Florida
• Pilot Projects in progress
• Data – Phasors (Magnitude and Angle)
• A,B,C Phase and Positive Sequence Voltages • A,B,C Phase and Positive Sequence Currents
– Frequency • Frequency and Rate of Change of Frequency
– Sample Rate • 30 samples per second
Duke Energy U.S. Service Territories

So what do we do with all this data?
• Research Effort – North Carolina Stat University
– Duke Energy
– SAS Institute
• Goal: develop tools that provide useful information for real-time operations.
• SAS Event Detection and Classification
• NCSU Short-Term Voltage Stability Assessment – Decision Tree
– Lyapunov Exponent (LE)
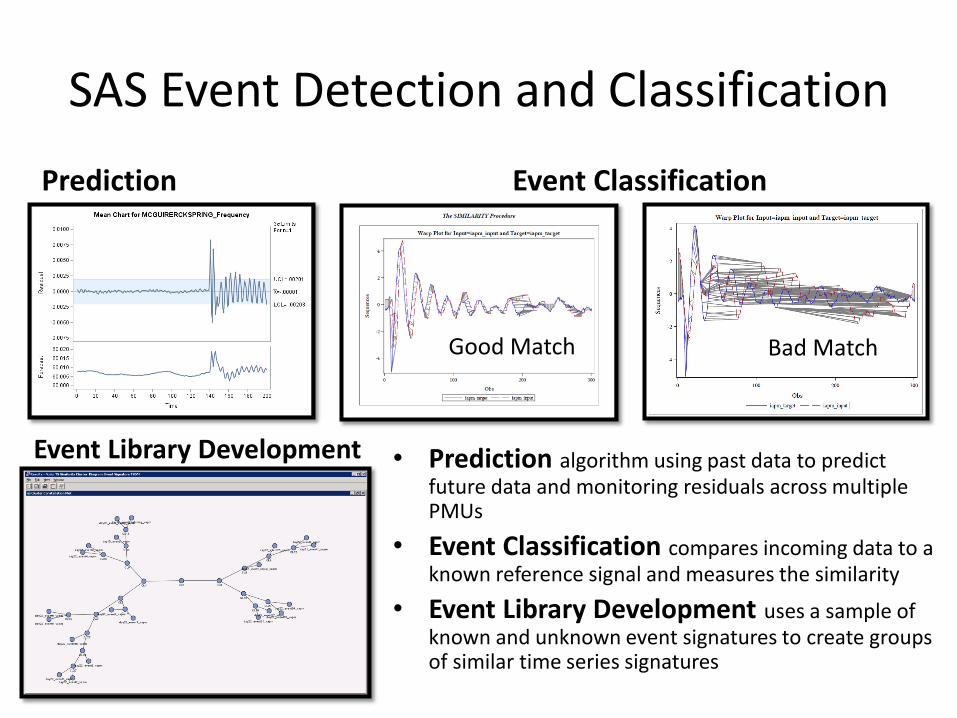
SAS Event Detection and Classification
Prediction Event Classification
Event Library Development
Good Match Bad Match
• Prediction algorithm using past data to predict future data and monitoring residuals across multiple PMUs
• Event Classification compares incoming data to a known reference signal and measures the similarity
• Event Library Development uses a sample of known and unknown event signatures to create groups of similar time series signatures
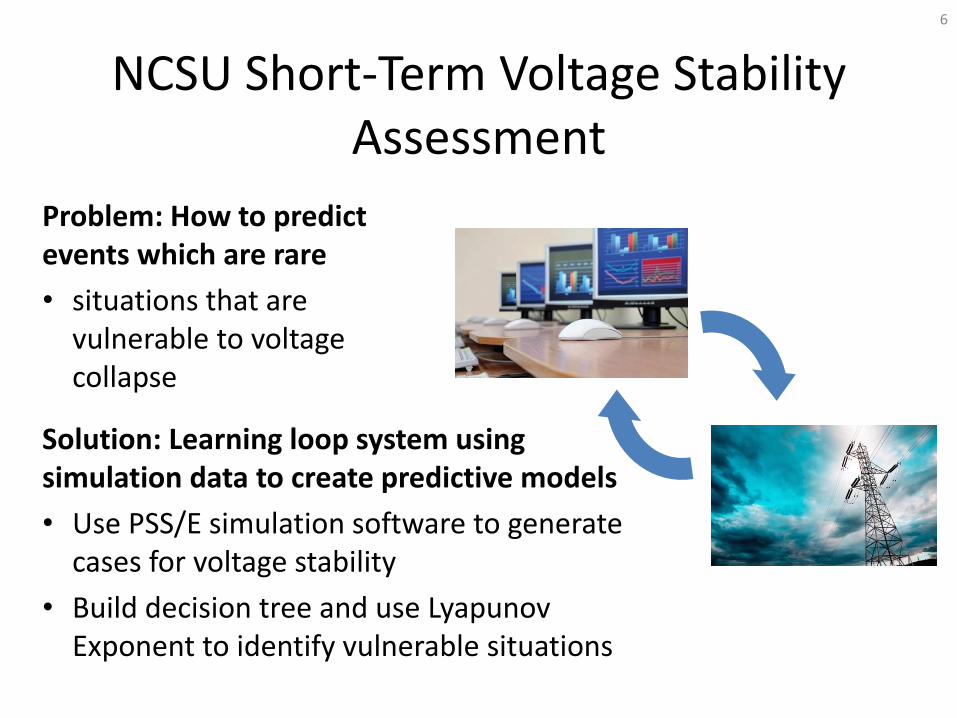
NCSU Short-Term Voltage Stability Assessment
6
Problem: How to predict events which are rare
• situations that are vulnerable to voltage collapse
Solution: Learning loop system using simulation data to create predictive models
• Use PSS/E simulation software to generate cases for voltage stability
• Build decision tree and use Lyapunov Exponent to identify vulnerable situations
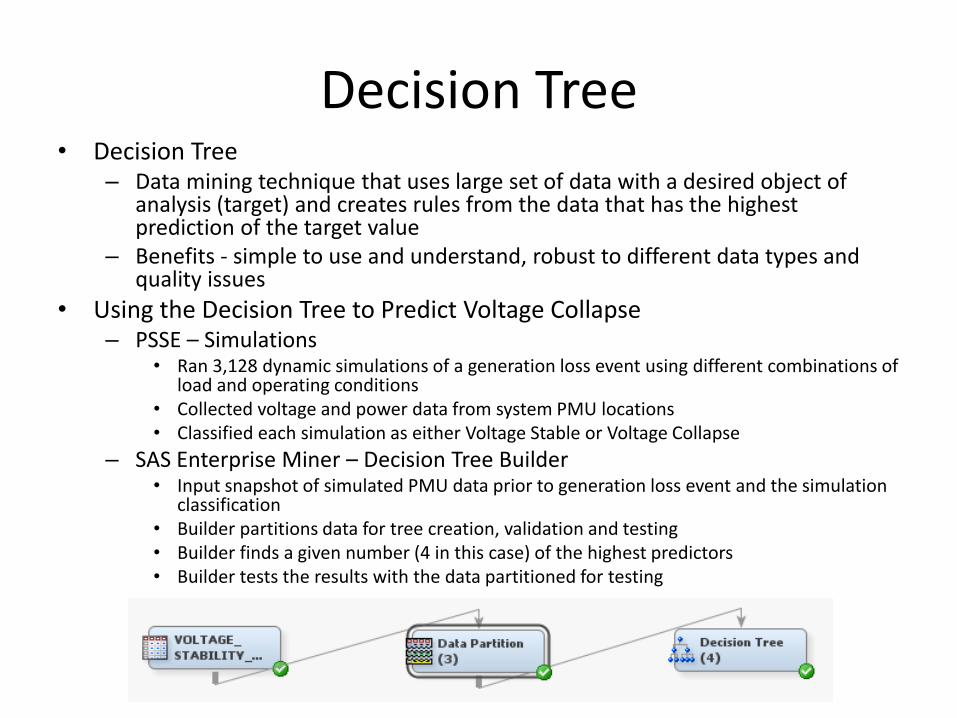
Decision Tree • Decision Tree
– Data mining technique that uses large set of data with a desired object of analysis (target) and creates rules from the data that has the highest prediction of the target value
– Benefits - simple to use and understand, robust to different data types and quality issues
• Using the Decision Tree to Predict Voltage Collapse – PSSE – Simulations
• Ran 3,128 dynamic simulations of a generation loss event using different combinations of load and operating conditions
• Collected voltage and power data from system PMU locations • Classified each simulation as either Voltage Stable or Voltage Collapse
– SAS Enterprise Miner – Decision Tree Builder • Input snapshot of simulated PMU data prior to generation loss event and the simulation
classification • Builder partitions data for tree creation, validation and testing • Builder finds a given number (4 in this case) of the highest predictors • Builder tests the results with the data partitioned for testing
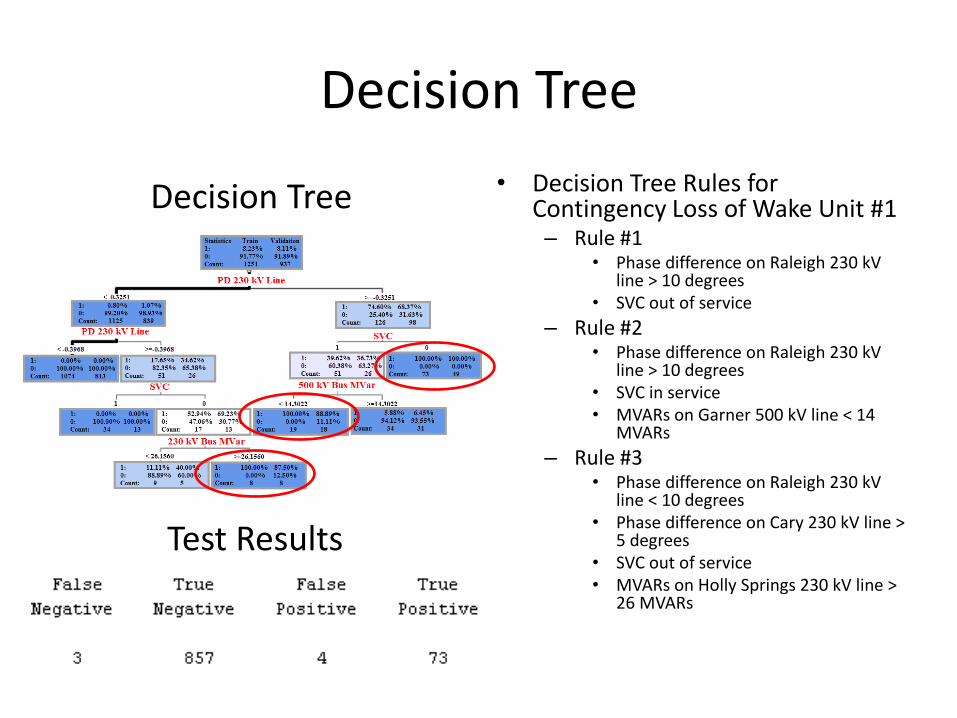
Decision Tree
• Decision Tree Rules for Contingency Loss of Wake Unit #1 – Rule #1
• Phase difference on Raleigh 230 kV line > 10 degrees
• SVC out of service
– Rule #2 • Phase difference on Raleigh 230 kV
line > 10 degrees • SVC in service • MVARs on Garner 500 kV line < 14
MVARs
– Rule #3 • Phase difference on Raleigh 230 kV
line < 10 degrees • Phase difference on Cary 230 kV line >
5 degrees • SVC out of service • MVARs on Holly Springs 230 kV line >
26 MVARs
Decision Tree
Test Results
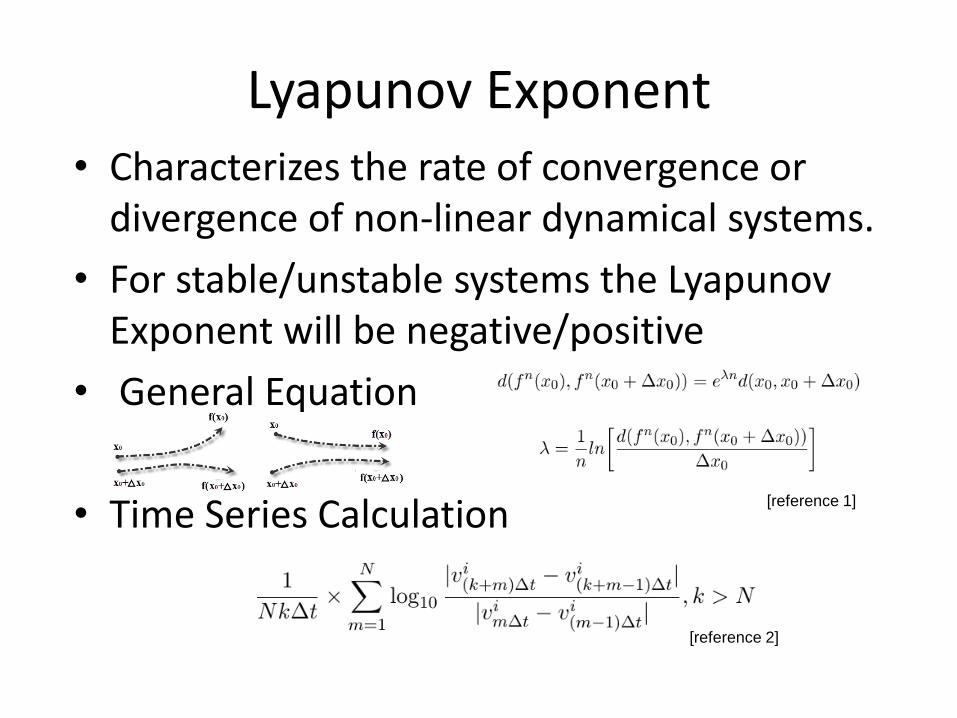
Lyapunov Exponent • Characterizes the rate of convergence or
divergence of non-linear dynamical systems.
• For stable/unstable systems the Lyapunov Exponent will be negative/positive
• General Equation
• Time Series Calculation
[reference 2]
[reference 1]
200
205
210
215
220
225
230
235
240
245
250
0 1 2 3 4 5 6 7 8 9 10 11 12 13 14 15 16 17 18 19 20 21 22 23 24 25 26 27 28 29 30 31 32 33
Vo
ltag
e (
kV)
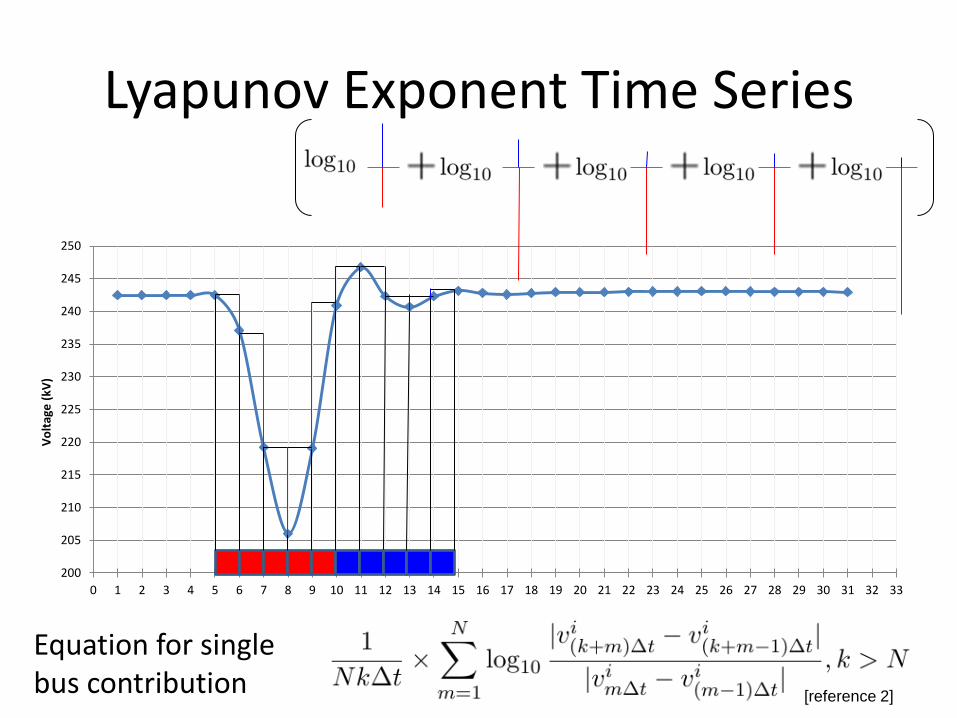
Lyapunov Exponent Time Series
Equation for single bus contribution
[reference 2]
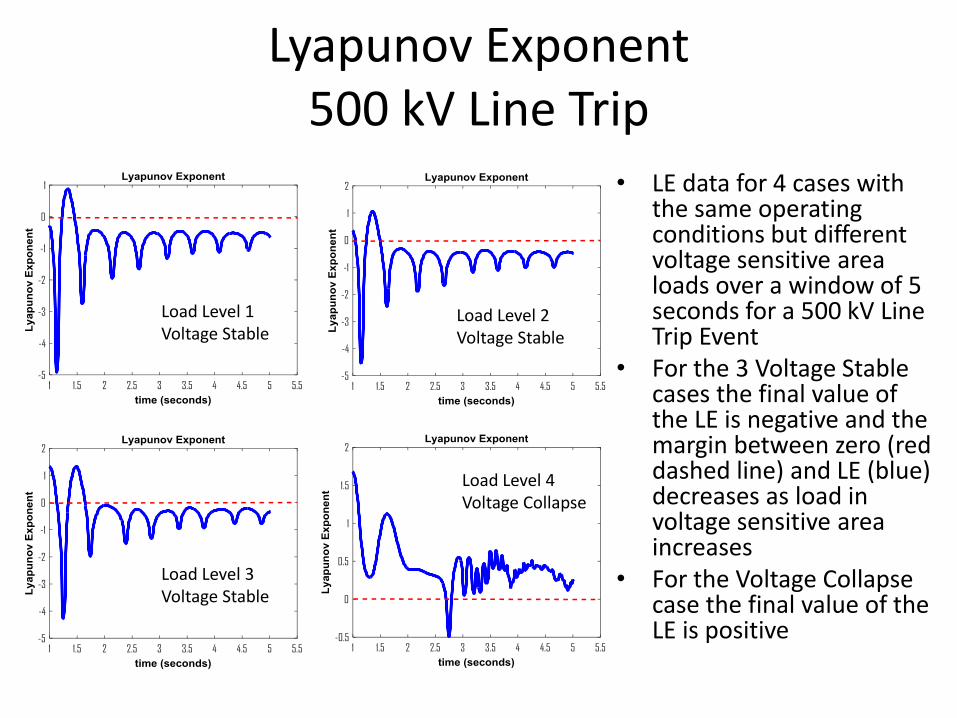
Lyapunov Exponent 500 kV Line Trip
Load Level 1 Voltage Stable
Load Level 3 Voltage Stable
Load Level 2 Voltage Stable
Load Level 4 Voltage Collapse
• LE data for 4 cases with the same operating conditions but different voltage sensitive area loads over a window of 5 seconds for a 500 kV Line Trip Event
• For the 3 Voltage Stable cases the final value of the LE is negative and the margin between zero (red dashed line) and LE (blue) decreases as load in voltage sensitive area increases
• For the Voltage Collapse case the final value of the LE is positive
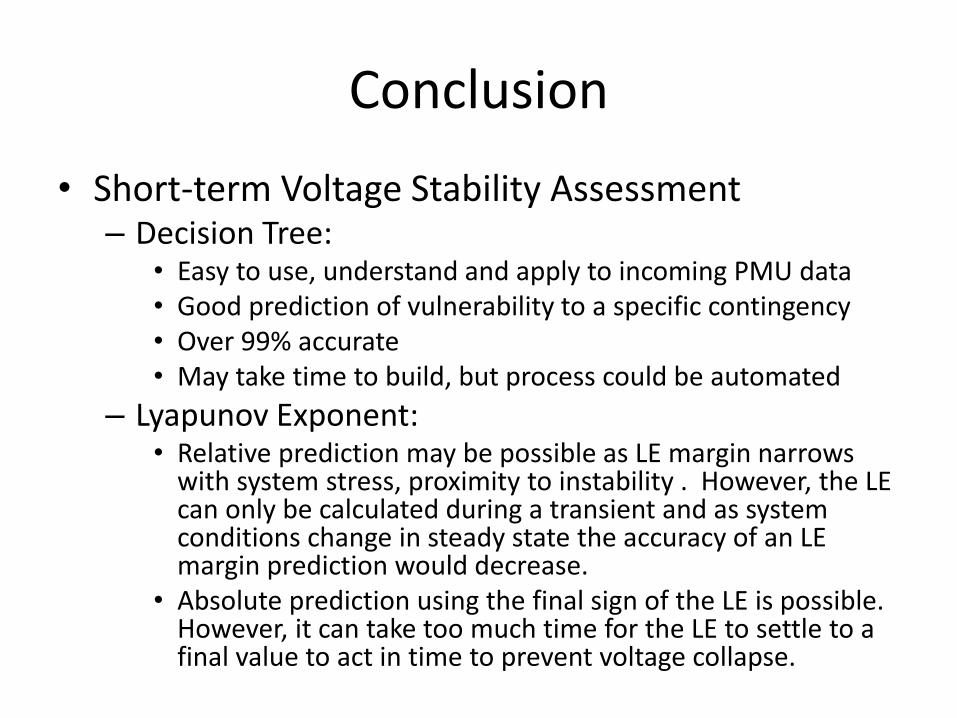
Conclusion
• Short-term Voltage Stability Assessment – Decision Tree:
• Easy to use, understand and apply to incoming PMU data • Good prediction of vulnerability to a specific contingency • Over 99% accurate • May take time to build, but process could be automated
– Lyapunov Exponent: • Relative prediction may be possible as LE margin narrows
with system stress, proximity to instability . However, the LE can only be calculated during a transient and as system conditions change in steady state the accuracy of an LE margin prediction would decrease.
• Absolute prediction using the final sign of the LE is possible. However, it can take too much time for the LE to settle to a final value to act in time to prevent voltage collapse.
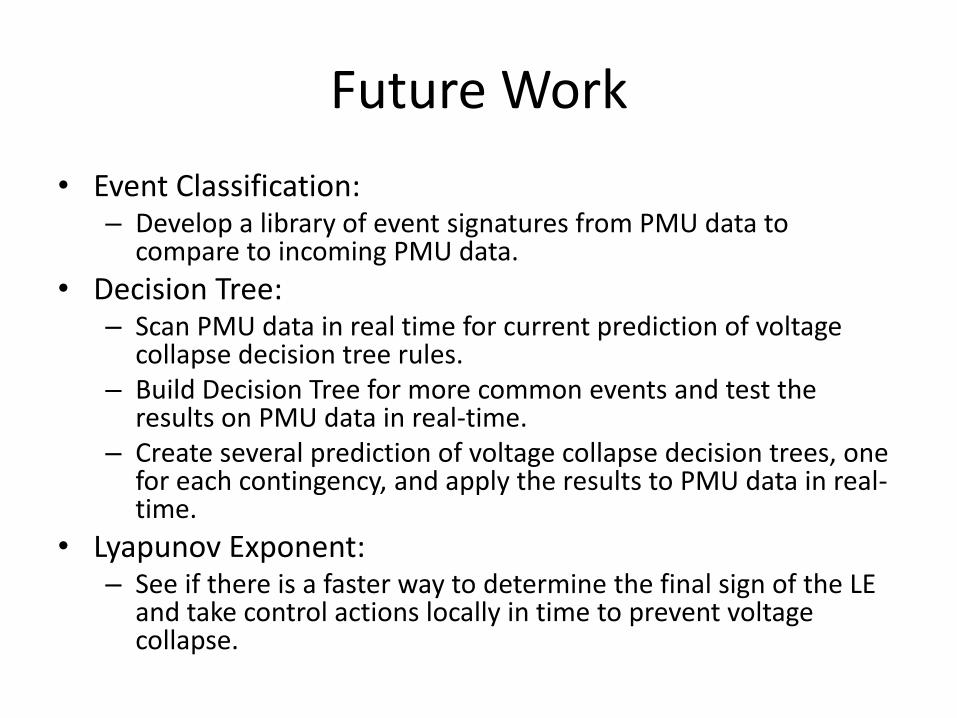
Future Work
• Event Classification: – Develop a library of event signatures from PMU data to
compare to incoming PMU data.
• Decision Tree: – Scan PMU data in real time for current prediction of voltage
collapse decision tree rules. – Build Decision Tree for more common events and test the
results on PMU data in real-time. – Create several prediction of voltage collapse decision trees, one
for each contingency, and apply the results to PMU data in real-time.
• Lyapunov Exponent: – See if there is a faster way to determine the final sign of the LE
and take control actions locally in time to prevent voltage collapse.

Questions
References
[1] Lyapunov exponent: Lecture 24 Indian Institute of Technology Kharagpur. YouTube video https://www.youtube.com/watch?v=-xSNqJQRoo4. Accessed: 2014-10-10.
[2] S. Dasgupta, M. Paramasivam, U. Vaidya, and V. Ajjarapu, “Real-Time Monitoring of Short-Term Voltage Stability using PMU Data," 2013.