Embed Size (px)
Citation preview
Page 2
Q1.An investigation was carried out to show how thinking distance, braking distance and stopping distance are affected by the speed of a car.
The results are shown in the table.
Speed
in metres per second
Thinking distance in metres
Braking distance in
metres
Stopping distance in metres
10 6 6 12
15 9 14 43
20 12 24 36
25 15 38 53
30 18 55 73
(a) Draw a ring around the correct answer to complete each sentence.
As speed increases, thinking distance
decreases.
increases.
stays the same.
As speed increases, braking distance
decreases.
increases.
stays the same.
(2)
(b) One of the values of stopping distance is incorrect.
Draw a ring around the incorrect value in the table.
Calculate the correct value of this stopping distance.
.........................................................................................................................
PhysicsAndMathsTutor.com
Page 3
Stopping distance = ................................ m (2)
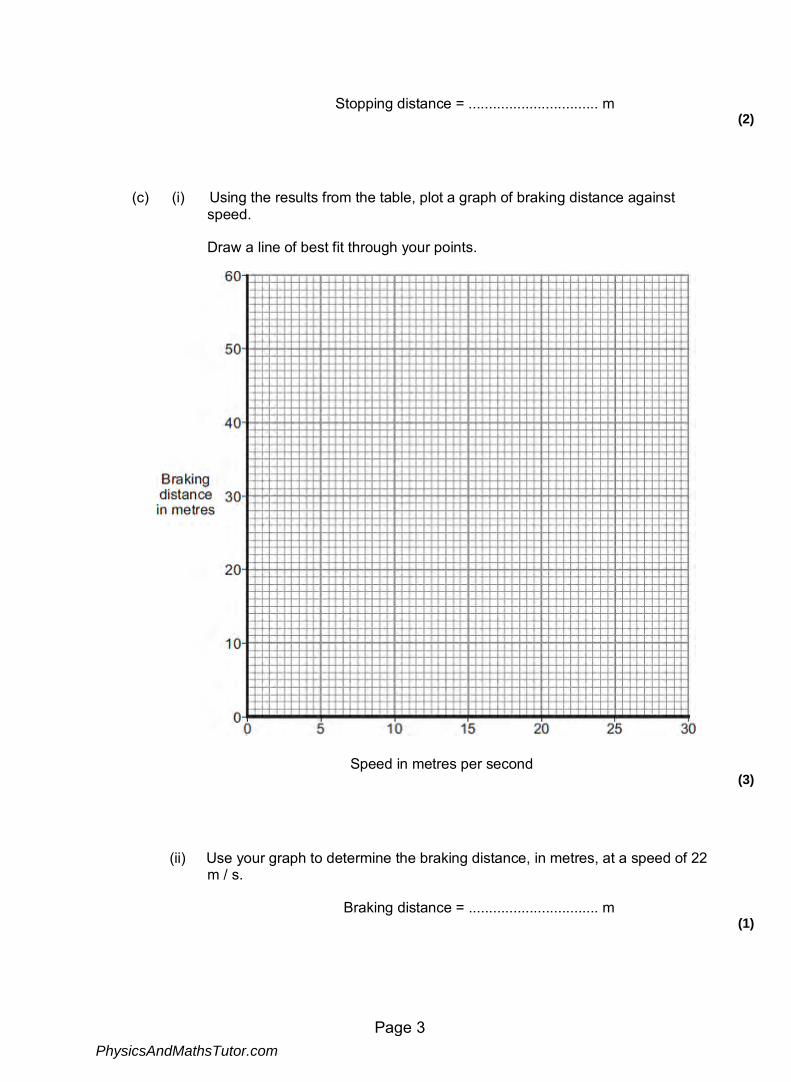
(c) (i) Using the results from the table, plot a graph of braking distance against speed.
Draw a line of best fit through your points.
Speed in metres per second (3)
(ii) Use your graph to determine the braking distance, in metres, at a speed of 22 m / s.
Braking distance = ................................ m (1)
PhysicsAndMathsTutor.com
Page 4
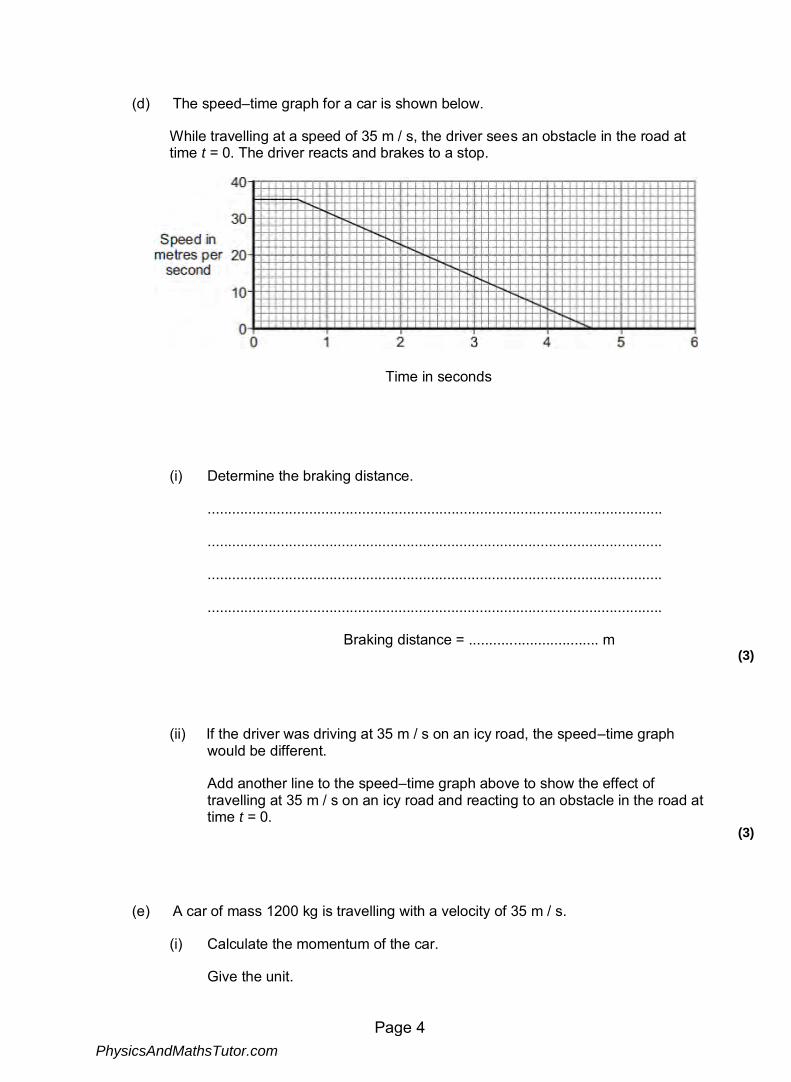
(d) The speed–time graph for a car is shown below.
While travelling at a speed of 35 m / s, the driver sees an obstacle in the road at time t = 0. The driver reacts and brakes to a stop.
Time in seconds
(i) Determine the braking distance.
................................................................................................................
................................................................................................................
................................................................................................................
................................................................................................................
Braking distance = ................................ m (3)
(ii) If the driver was driving at 35 m / s on an icy road, the speed–time graph would be different.
Add another line to the speed–time graph above to show the effect of travelling at 35 m / s on an icy road and reacting to an obstacle in the road at time t = 0.
(3)
(e) A car of mass 1200 kg is travelling with a velocity of 35 m / s.
(i) Calculate the momentum of the car.
Give the unit.
PhysicsAndMathsTutor.com
Page 5
................................................................................................................
................................................................................................................
................................................................................................................
Momentum = .......................................... (3)
(ii) The car stops in 4 seconds.
Calculate the average braking force acting on the car during the 4 seconds.
................................................................................................................
................................................................................................................
Force = ................................ N (2)
(Total 19 marks)
PhysicsAndMathsTutor.com
Page 6
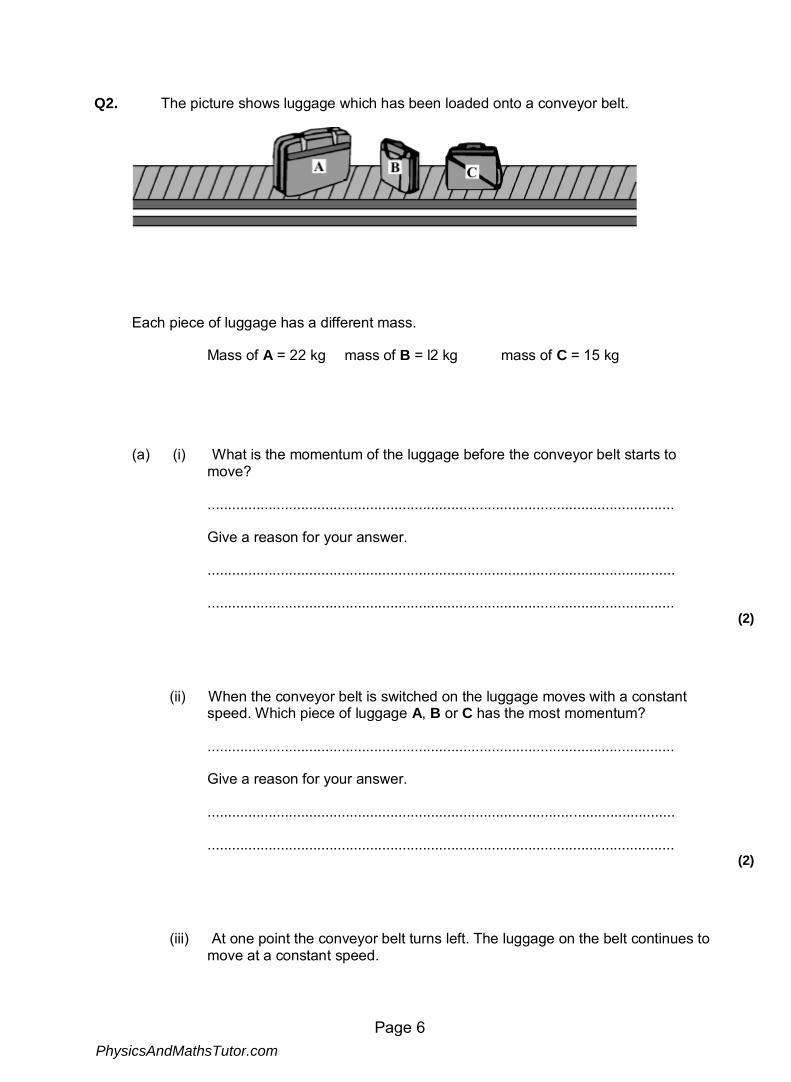
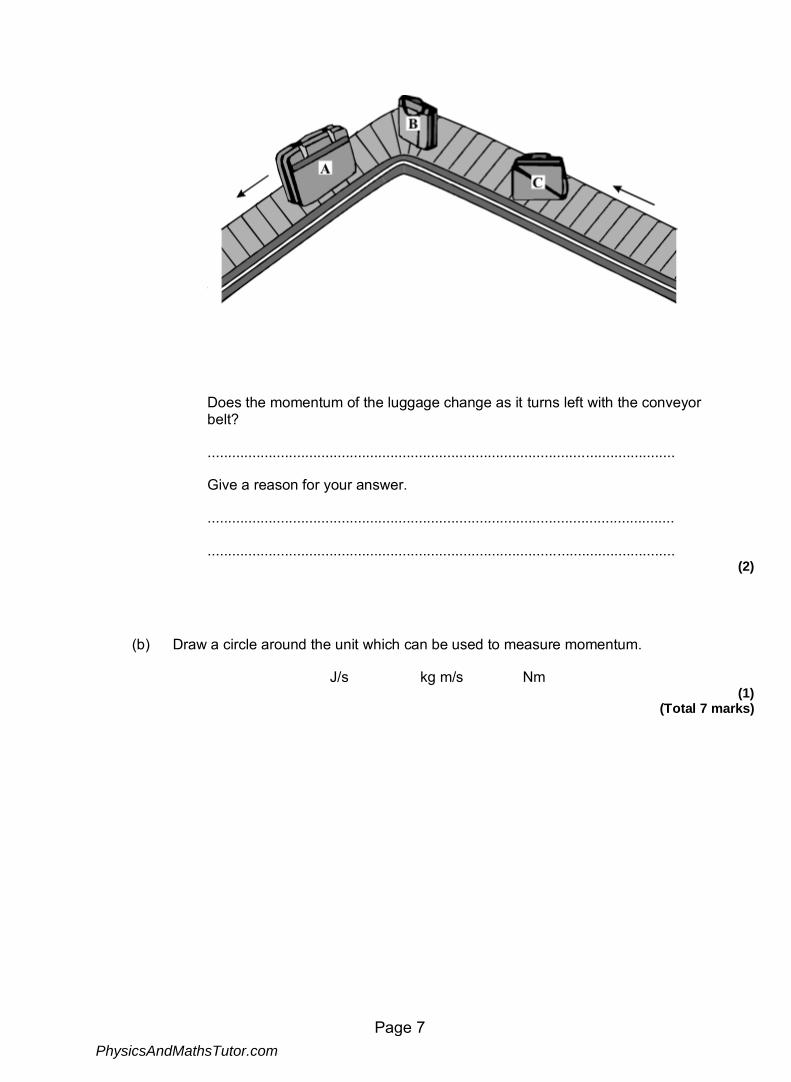
Q2. The picture shows luggage which has been loaded onto a conveyor belt.
Each piece of luggage has a different mass.
Mass of A = 22 kg mass of B = l2 kg mass of C = 15 kg
(a) (i) What is the momentum of the luggage before the conveyor belt starts to move?
...................................................................................................................
Give a reason for your answer.
...................................................................................................................
................................................................................................................... (2)
(ii) When the conveyor belt is switched on the luggage moves with a constant speed. Which piece of luggage A, B or C has the most momentum?
...................................................................................................................
Give a reason for your answer.
...................................................................................................................
................................................................................................................... (2)
(iii) At one point the conveyor belt turns left. The luggage on the belt continues to move at a constant speed.
PhysicsAndMathsTutor.com
Page 7
Does the momentum of the luggage change as it turns left with the conveyor belt?
...................................................................................................................
Give a reason for your answer.
...................................................................................................................
................................................................................................................... (2)
(b) Draw a circle around the unit which can be used to measure momentum.
J/s kg m/s Nm (1)
(Total 7 marks)
PhysicsAndMathsTutor.com
Page 8
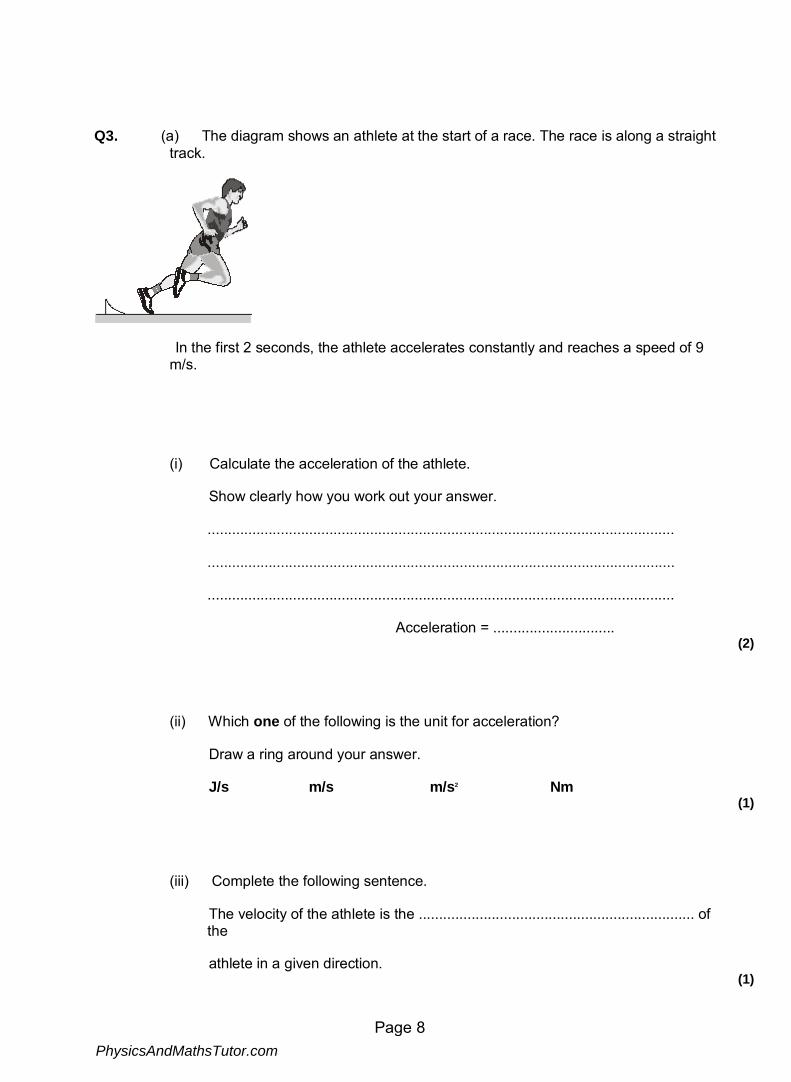
Q3. (a) The diagram shows an athlete at the start of a race. The race is along a straight track.
In the first 2 seconds, the athlete accelerates constantly and reaches a speed of 9 m/s.
(i) Calculate the acceleration of the athlete.
Show clearly how you work out your answer.
...................................................................................................................
...................................................................................................................
...................................................................................................................
Acceleration = .............................. (2)
(ii) Which one of the following is the unit for acceleration?
Draw a ring around your answer.
J/s m/s m/s2 Nm (1)
(iii) Complete the following sentence.
The velocity of the athlete is the .................................................................... of the
athlete in a given direction. (1)
PhysicsAndMathsTutor.com
Page 9
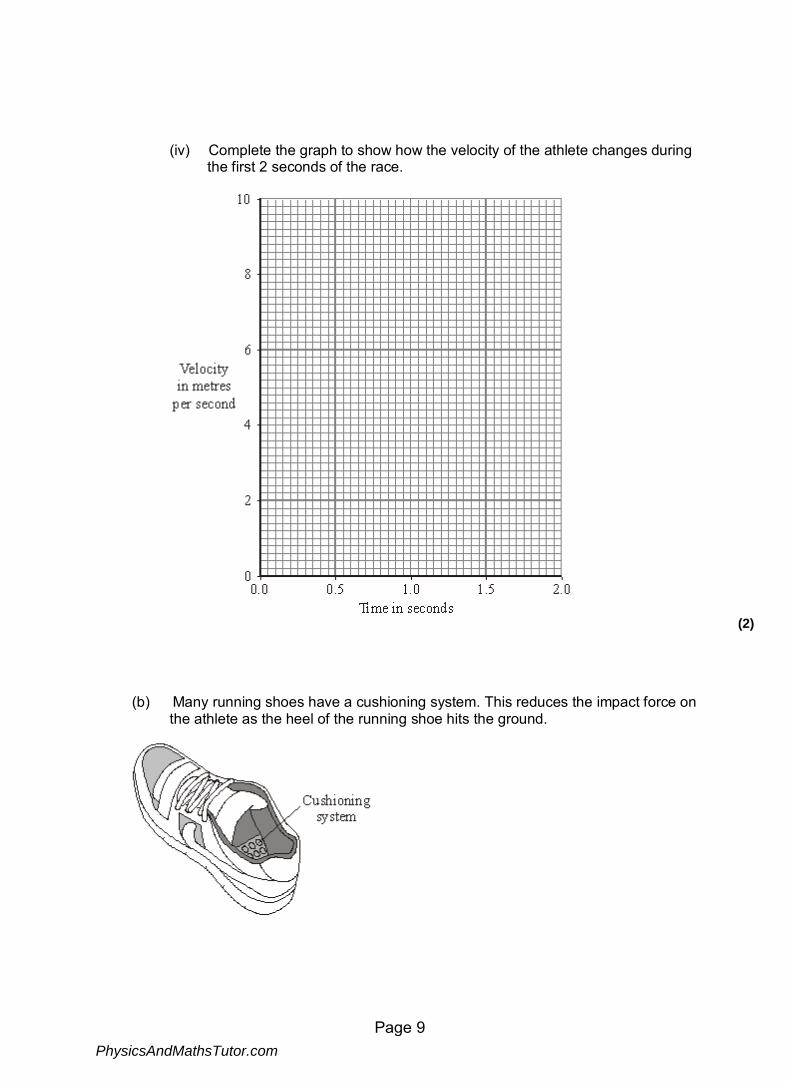
(iv) Complete the graph to show how the velocity of the athlete changes during the first 2 seconds of the race.
(2)
(b) Many running shoes have a cushioning system. This reduces the impact force on the athlete as the heel of the running shoe hits the ground.
PhysicsAndMathsTutor.com
Page 10
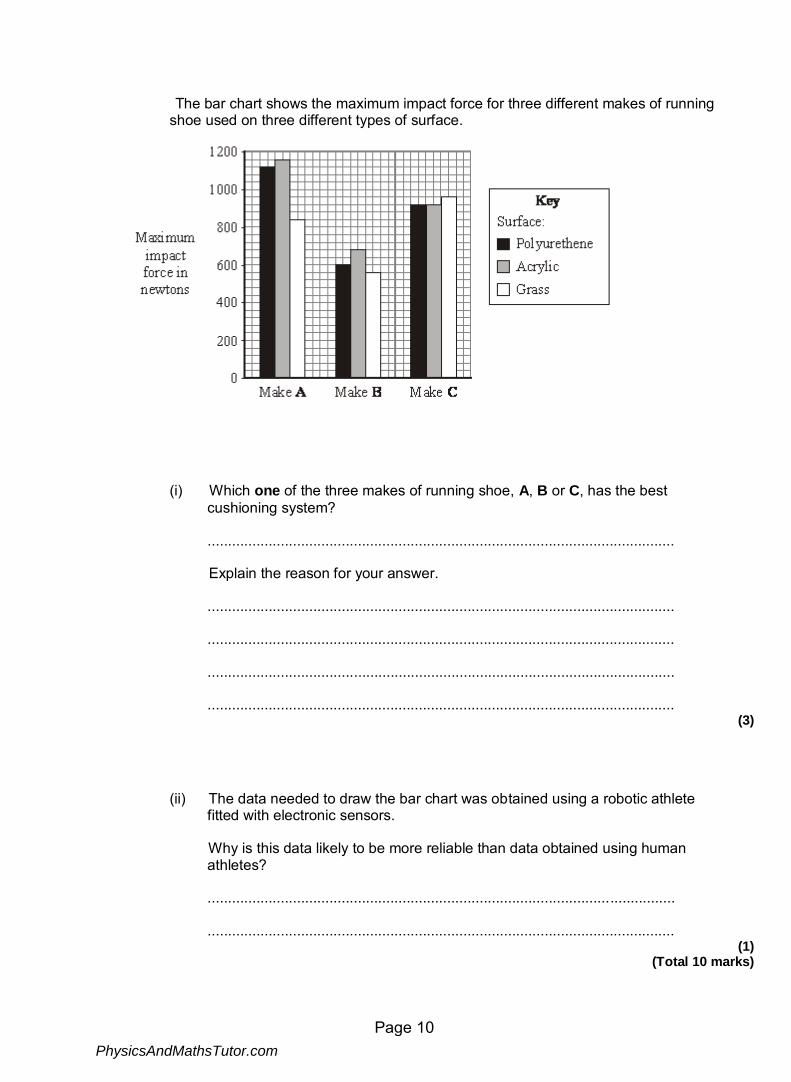
The bar chart shows the maximum impact force for three different makes of running shoe used on three different types of surface.
(i) Which one of the three makes of running shoe, A, B or C, has the best cushioning system?
...................................................................................................................
Explain the reason for your answer.
...................................................................................................................
...................................................................................................................
...................................................................................................................
................................................................................................................... (3)
(ii) The data needed to draw the bar chart was obtained using a robotic athlete fitted with electronic sensors.
Why is this data likely to be more reliable than data obtained using human athletes?
...................................................................................................................
................................................................................................................... (1)
(Total 10 marks)
PhysicsAndMathsTutor.com
Page 11
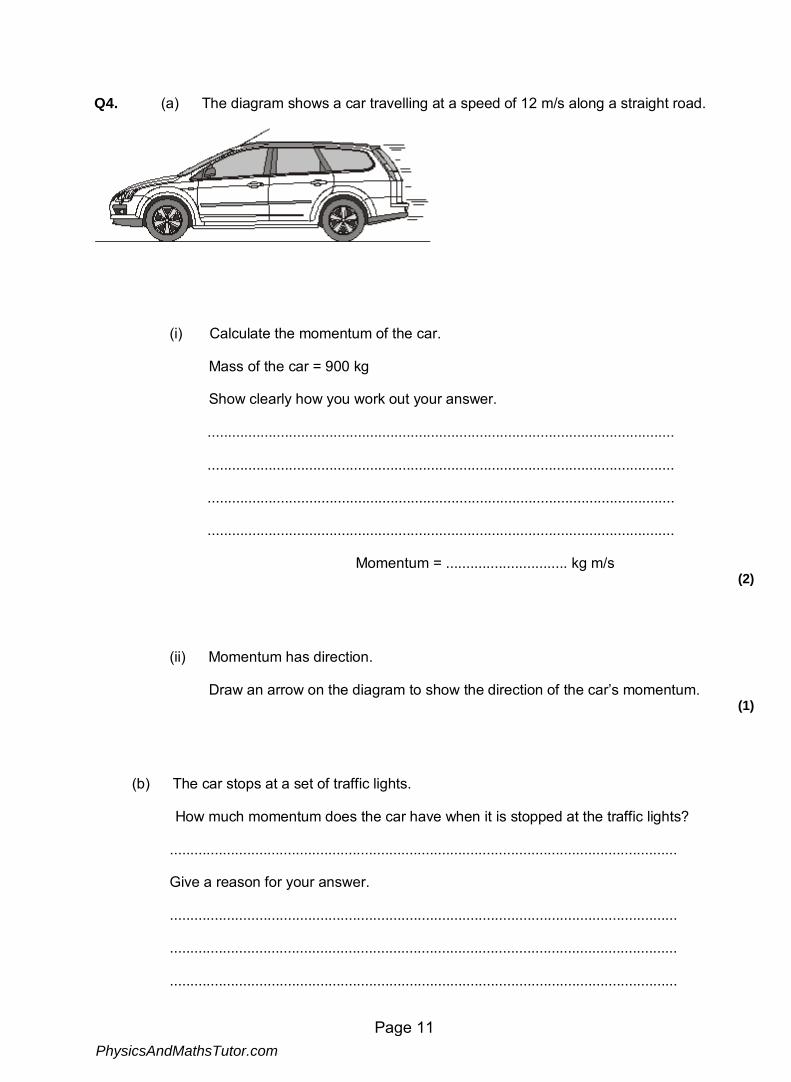
Q4. (a) The diagram shows a car travelling at a speed of 12 m/s along a straight road.
(i) Calculate the momentum of the car.
Mass of the car = 900 kg
Show clearly how you work out your answer.
...................................................................................................................
...................................................................................................................
...................................................................................................................
...................................................................................................................
Momentum = .............................. kg m/s (2)
(ii) Momentum has direction.
Draw an arrow on the diagram to show the direction of the car’s momentum. (1)
(b) The car stops at a set of traffic lights.
How much momentum does the car have when it is stopped at the traffic lights?
.............................................................................................................................
Give a reason for your answer.
.............................................................................................................................
.............................................................................................................................
.............................................................................................................................
PhysicsAndMathsTutor.com
Page 12
............................................................................................................................. (2)
(Total 5 marks)
PhysicsAndMathsTutor.com
Page 13
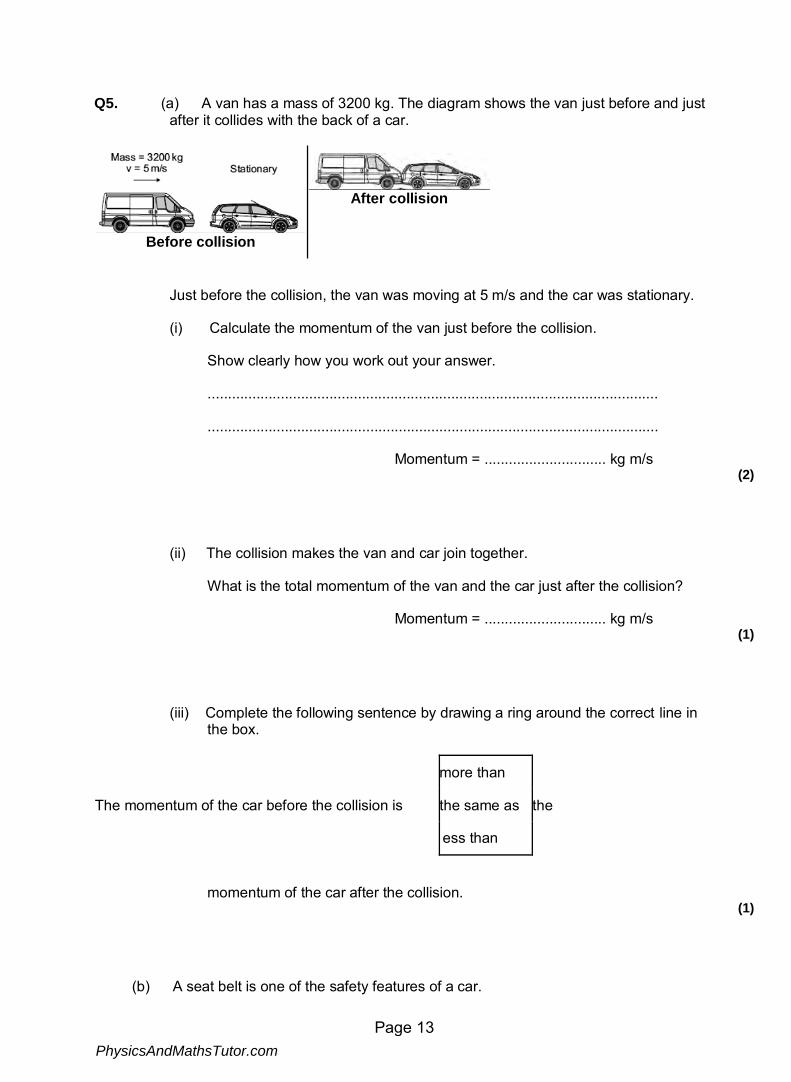
Q5. (a) A van has a mass of 3200 kg. The diagram shows the van just before and just after it collides with the back of a car.
Before collision
After collision
Just before the collision, the van was moving at 5 m/s and the car was stationary.
(i) Calculate the momentum of the van just before the collision.
Show clearly how you work out your answer.
...............................................................................................................
...............................................................................................................
Momentum = .............................. kg m/s (2)
(ii) The collision makes the van and car join together.
What is the total momentum of the van and the car just after the collision?
Momentum = .............................. kg m/s (1)
(iii) Complete the following sentence by drawing a ring around the correct line in the box.
more than
The momentum of the car before the collision is the same as the
ess than
momentum of the car after the collision. (1)
(b) A seat belt is one of the safety features of a car.
PhysicsAndMathsTutor.com
Page 14
In a collision, wearing a seat belt reduces the risk of injury.
Use words or phrases from the box to complete the following sentences.
decreases stays the same increases
In a collision, the seat belt stretches. The time it takes for the person held by the seat belt to lose momentum compared to a person not wearing a seat belt,
.................................................................................................... .
The force on the person’s body ............................................................................. and so reduces the risk of injury.
(2) (Total 6 marks)
PhysicsAndMathsTutor.com
Page 15
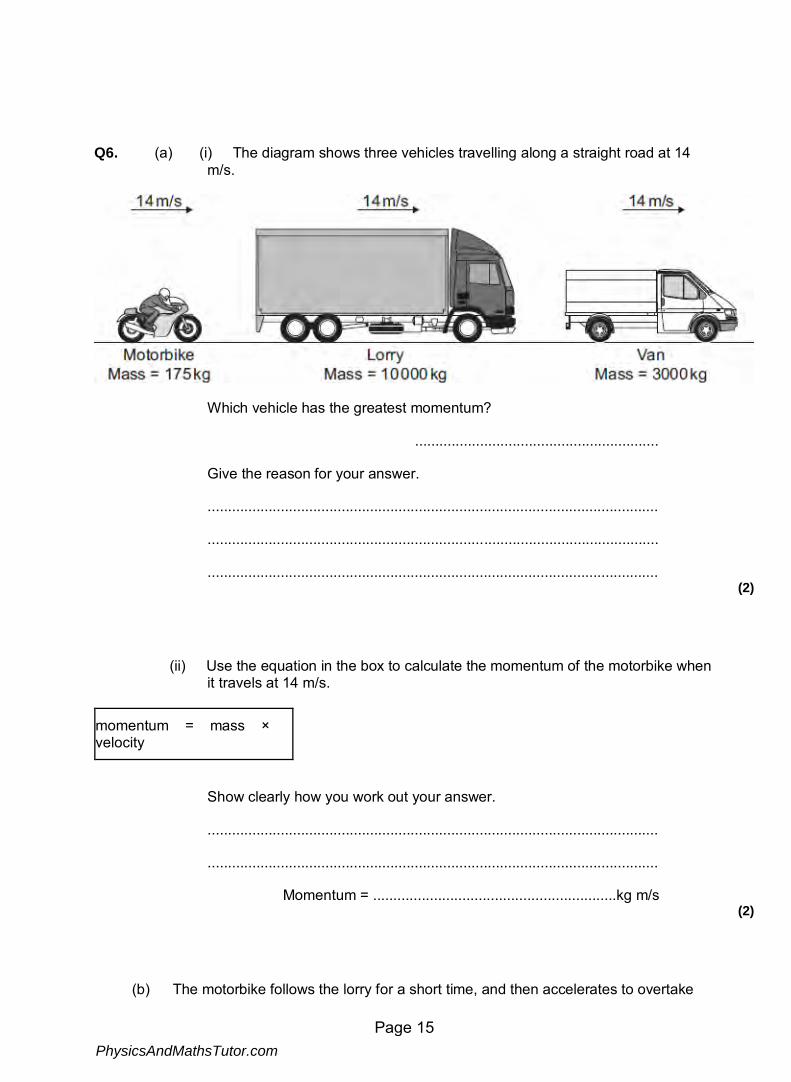
Q6. (a) (i) The diagram shows three vehicles travelling along a straight road at 14 m/s.
Which vehicle has the greatest momentum?
............................................................
Give the reason for your answer.
...............................................................................................................
...............................................................................................................
............................................................................................................... (2)
(ii) Use the equation in the box to calculate the momentum of the motorbike when it travels at 14 m/s.
momentum = mass × velocity
Show clearly how you work out your answer.
...............................................................................................................
...............................................................................................................
Momentum = ............................................................kg m/s (2)
(b) The motorbike follows the lorry for a short time, and then accelerates to overtake
PhysicsAndMathsTutor.com
Page 16
both the lorry and van.
(i) Complete the following sentence by drawing a ring around the correct line in the box.
When the motorbike starts to overtake, the kinetic energy
decreases.
of the motorbike stays the same.
ncreases.
(1)
(ii) Give a reason for your answer to part (b)(i).
...............................................................................................................
............................................................................................................... (1)
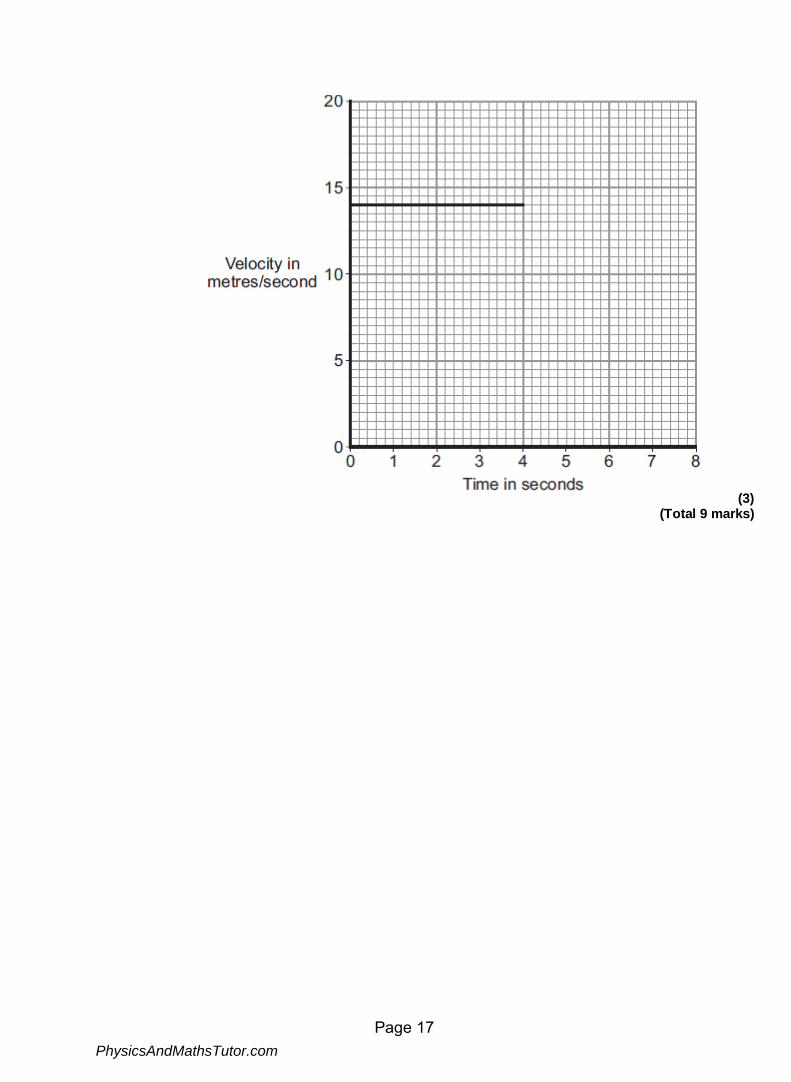
(iii) The graph shows the velocity of the motorbike up to the time when it starts to accelerate. The motorbike accelerates constantly, going from a speed of 14 m/s to a speed of 20 m/s in a time of 2 seconds. The motorbike then stays at 20 m/s.
Complete the graph to show the motion of the motorbike over the next 4 seconds.
PhysicsAndMathsTutor.com
Page 17
(3)
(Total 9 marks)
PhysicsAndMathsTutor.com

![REGENERATIVE BRAKING SYSTEM IN ELECTRIC VEHICLES · REGENERATIVE BRAKING SYSTEM IN ELECTRIC VEHICLES ... REGENERATIVE BRAKING SYSTEM ... Regenerative action during braking[9]](https://img.pdfslide.us/doc/110x75/5adccef67f8b9a1a088c7cf0/regenerative-braking-system-in-electric-vehicles-braking-system-in-electric-vehicles.jpg)