Embed Size (px)
Citation preview
University Performance Management Process
2006-07 Final Year-End Report
Office of Institutional Research and Assessment August 14, 2007
i
University Performance Management Process 2006-07 Year-End Report
Table of Contents
A. Raise Academic Quality 1. Strengthen CUNY flagship and college priority programs, and continuously update curricula and program mix
1.1 Resources will be shifted to University flagship/college priority programs, to graduate programs and to support the University’s commitment to become a research-intensive institution.
1.2 The University and its colleges will draw greater recognition for academic quality. 1.3 Program reviews and analyses of enrollment and financial data will demonstrably shape academic decisions and allocations by colleges. 1.4 Colleges will expand online course and program offerings and use technology to enrich teaching among CUNY
Percentage of instructional (student) FTEs offered partially or totally online............................................................................................ 1 Context: Percentage of instructional (student) FTEs offered totally online ............................................................................................... 2 Context: Percentage of instructional (student) FTEs offered partially online ............................................................................................ 3 2. Attract and nurture a strong faculty that is recognized for excellent teaching, scholarship and creative activity
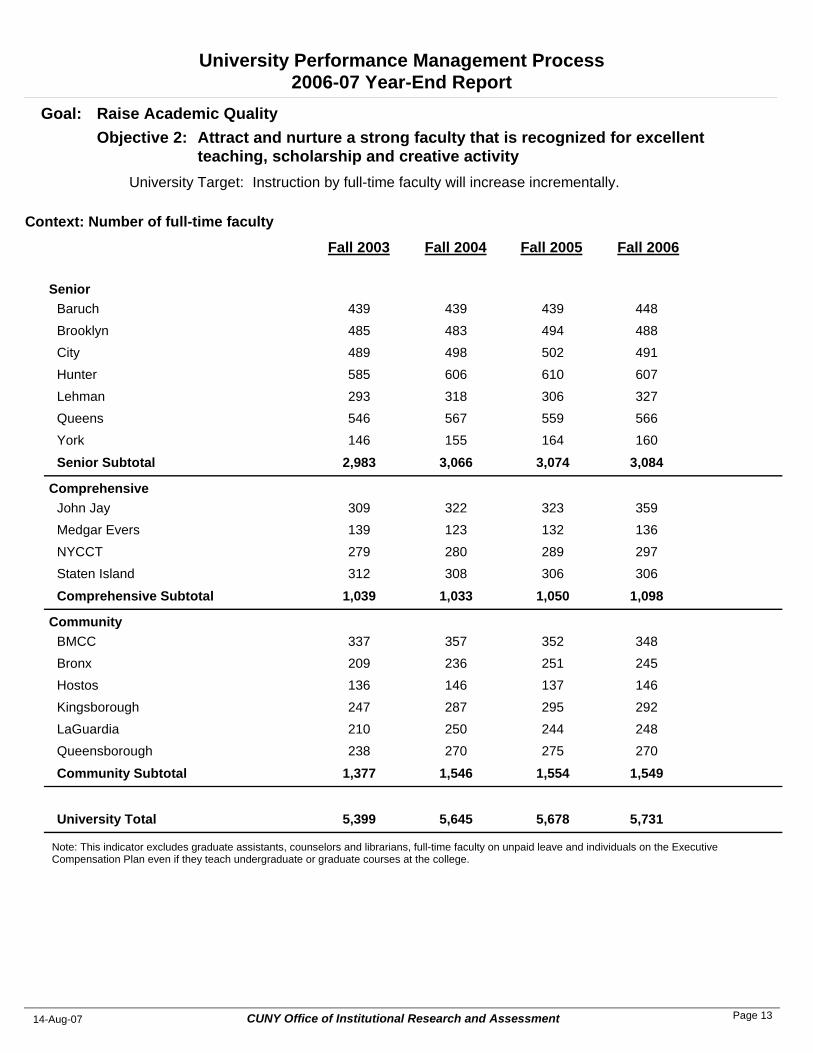
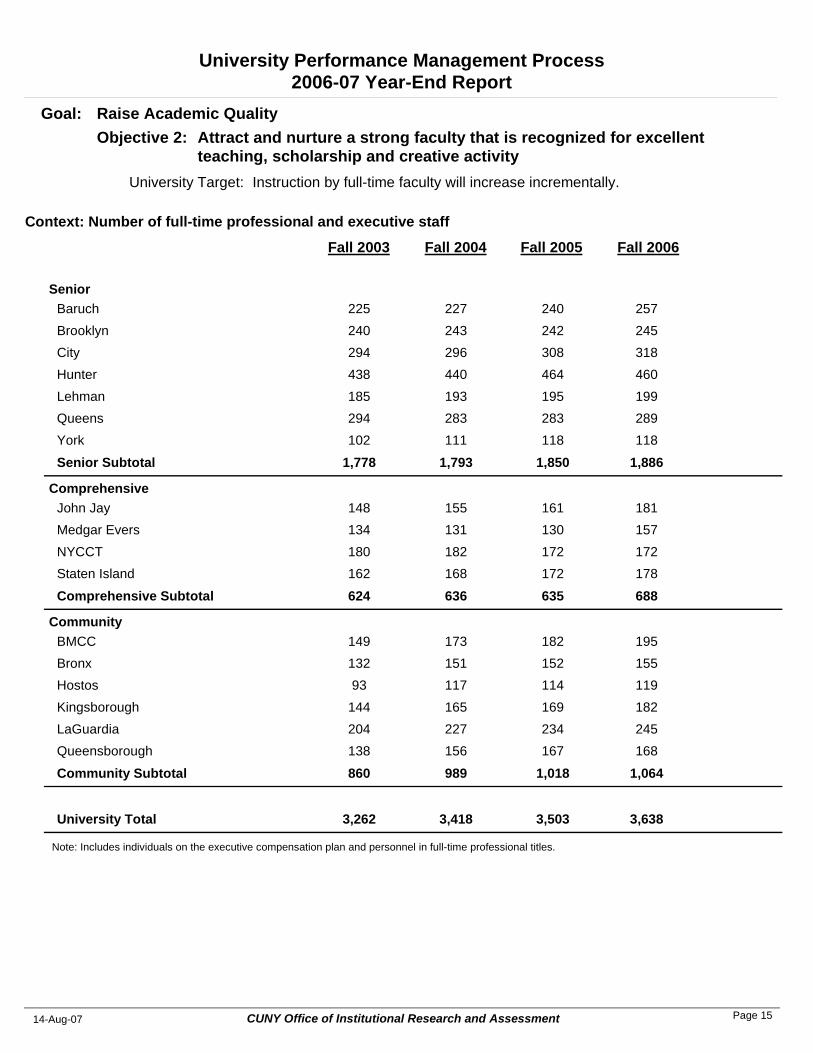
2.1 Colleges will continuously upgrade the quality of their faculty, as scholars and as teachers. 2.2 Faculty research/scholarship will increase from 2005-06 levels. 2.3 Instruction by full-time faculty will increase incrementally.
Percentage of instruction taught by full-time faculty (with adjustments) ................................................................................................... 4 Percentage of instruction in undergraduate courses delivered by full-time faculty ................................................................................... 5 Percentage of instruction in graduate courses delivered by full-time faculty ............................................................................................ 6 Mean teaching hours of veteran full-time faculty ...................................................................................................................................... 7 Mean teaching hours of new full-time faculty (eligible for contractual release time)................................................................................. 8 Context: Number of veteran full-time faculty............................................................................................................................................. 9 Context: Number of new full-time faculty (eligible for contractual release time) ..................................................................................... 10 Context: Undergraduate student-faculty ratio ......................................................................................................................................... 11 Context: Number of full-time faculty who taught at least one course in the fall ...................................................................................... 12 Context: Number of full-time faculty........................................................................................................................................................ 13 Context: Number of FTE part-time faculty .............................................................................................................................................. 14 Context: Number of full-time professional and executive staff ................................................................................................................ 15 2.4 Efforts will be made to recruit more under-represented faculty and staff. B. Improve Student Success 3. Ensure that all students receive a solid general education and effective support, particularly in the first 60 credits of study
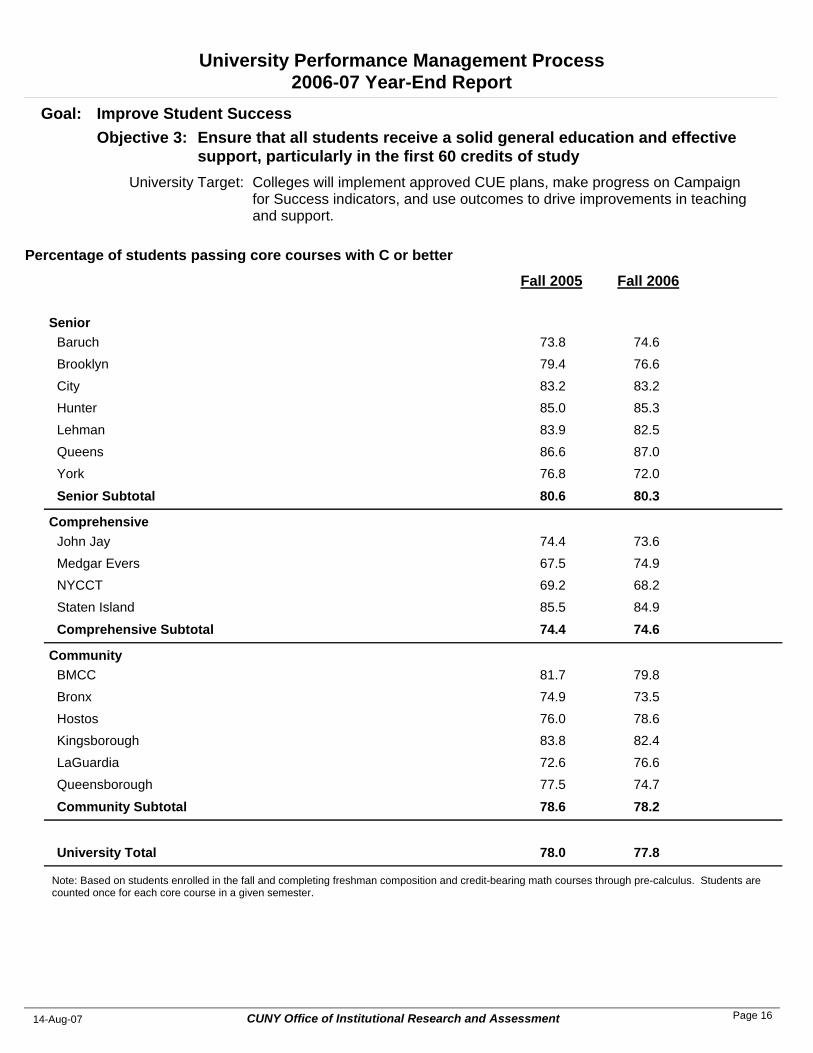
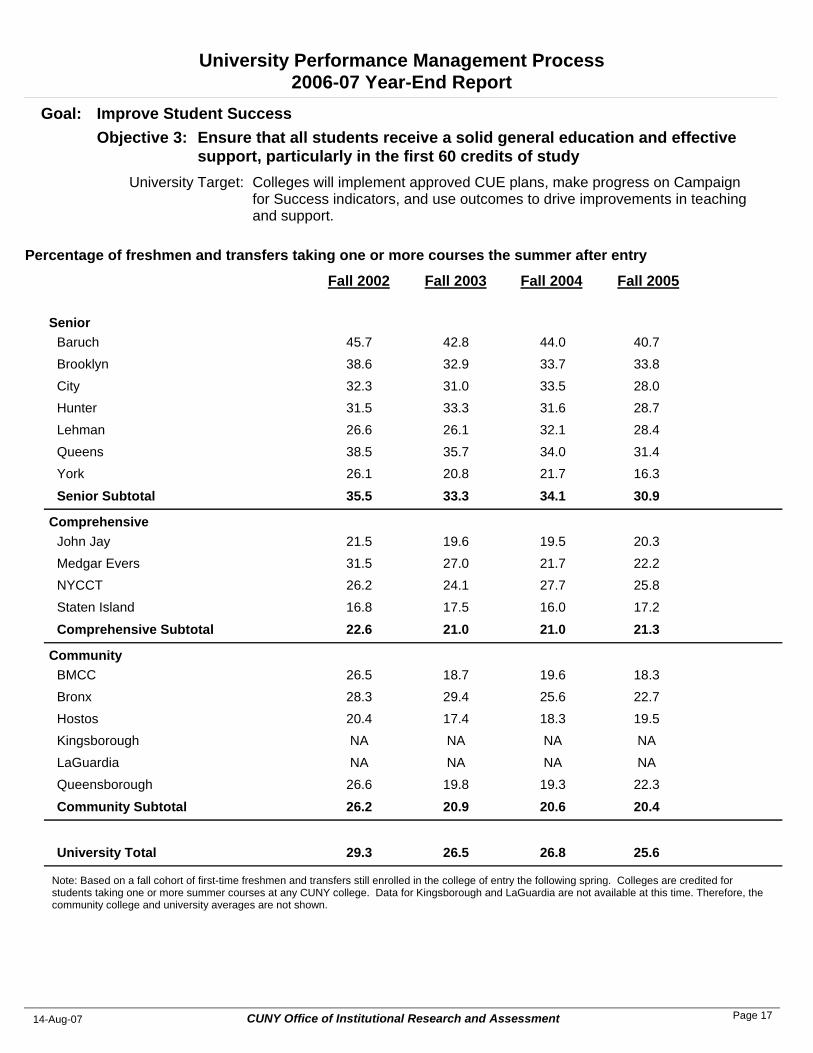
3.1 Colleges will implement approved CUE plans, make progress on Campaign for Success indicators, and use outcomes to drive improvements in teaching and support.
Percentage of students passing core courses with C or better............................................................................................................... 16 Percentage of freshmen and transfers taking one or more courses the summer after entry.................................................................. 17 Baccalaureate Programs Percentage of baccalaureate students who have declared a major by the 70th credit........................................................................... 18 Percentage of lower division FTEs taught by full-time faculty................................................................................................................. 19 Average number of credits earned by full-time first-time freshmen in baccalaureate programs in the first 12 months (fall, spring and summer terms) ...................................................................................................................................................... 20
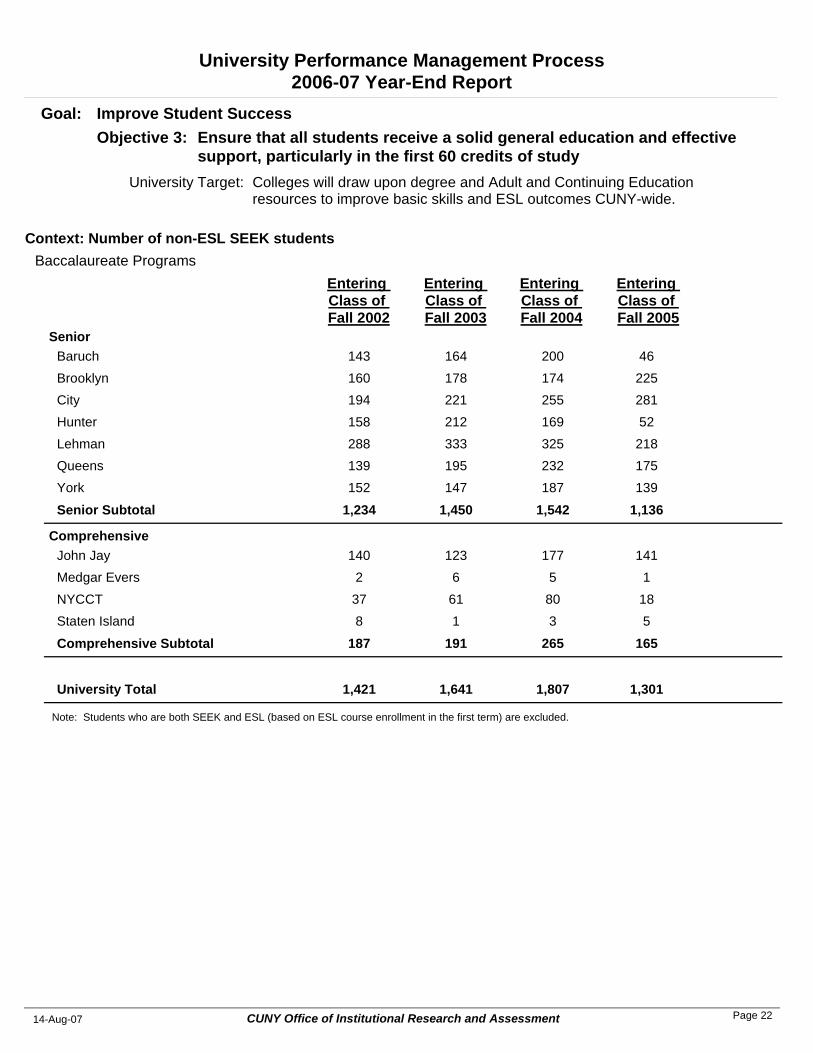
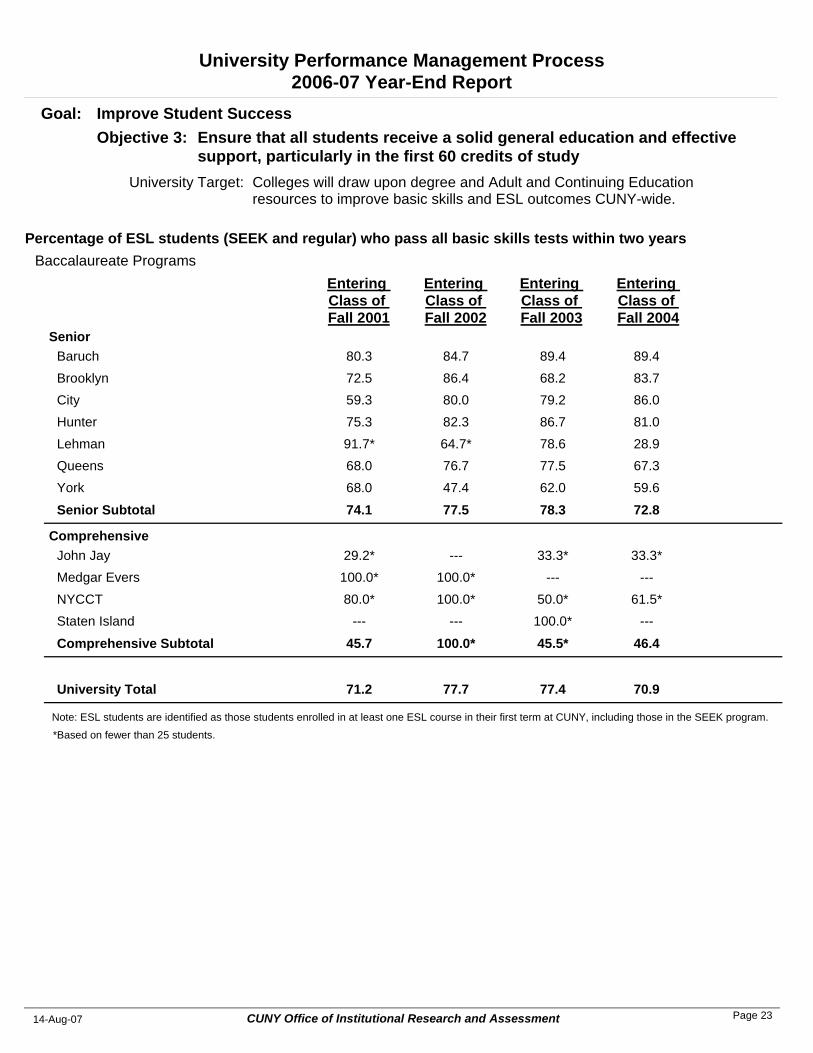
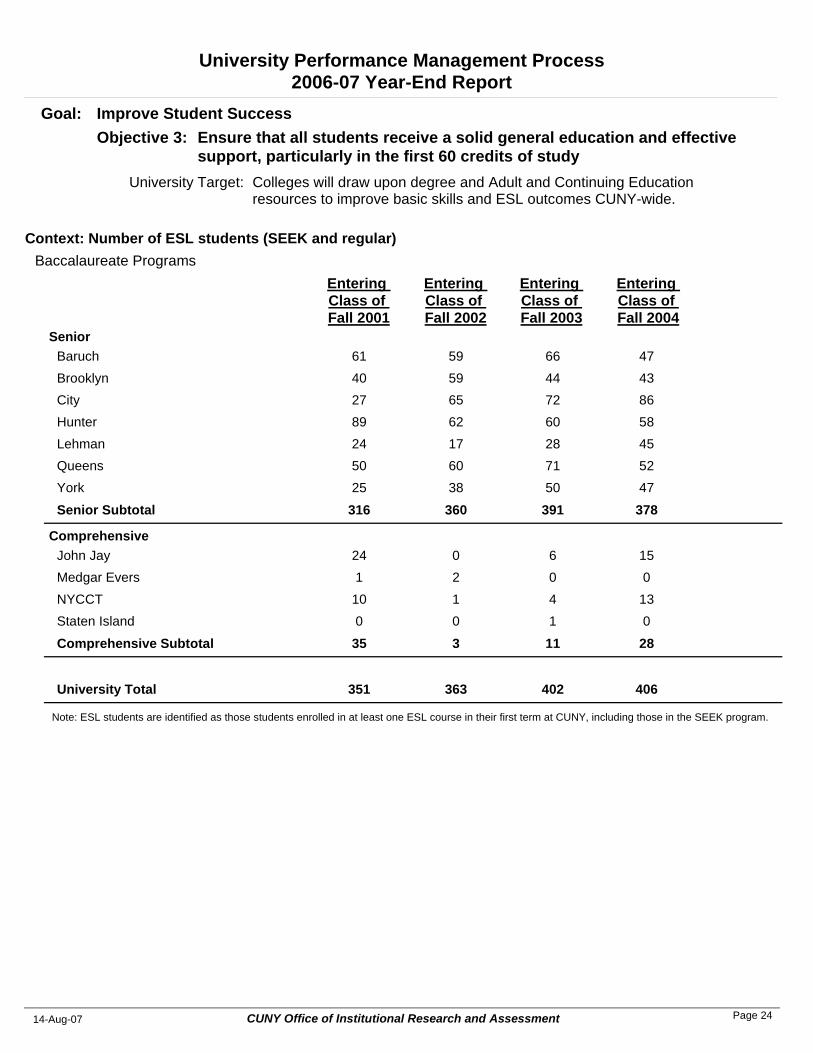
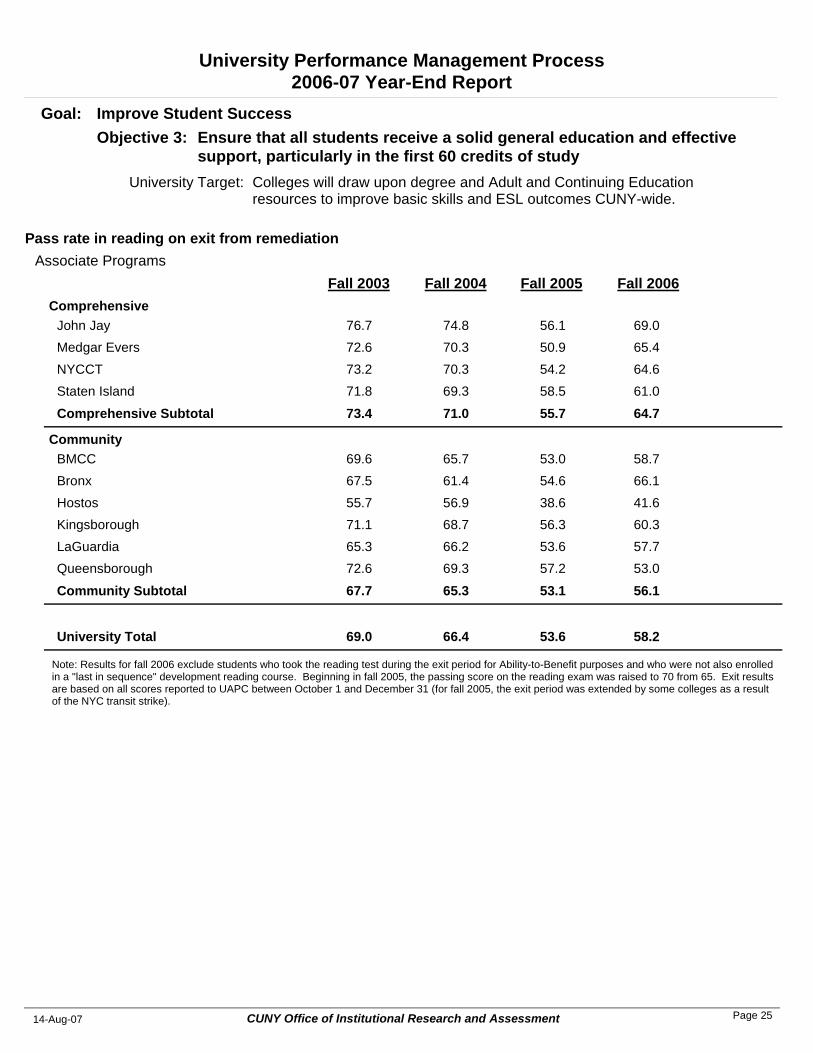
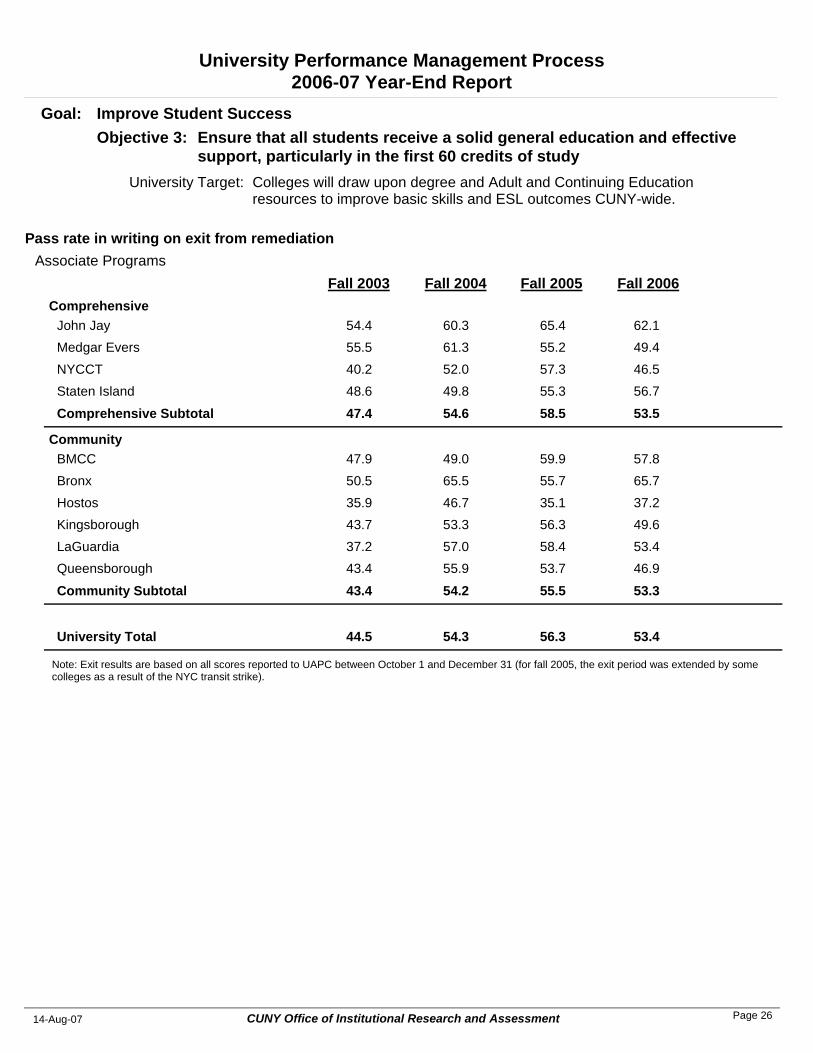
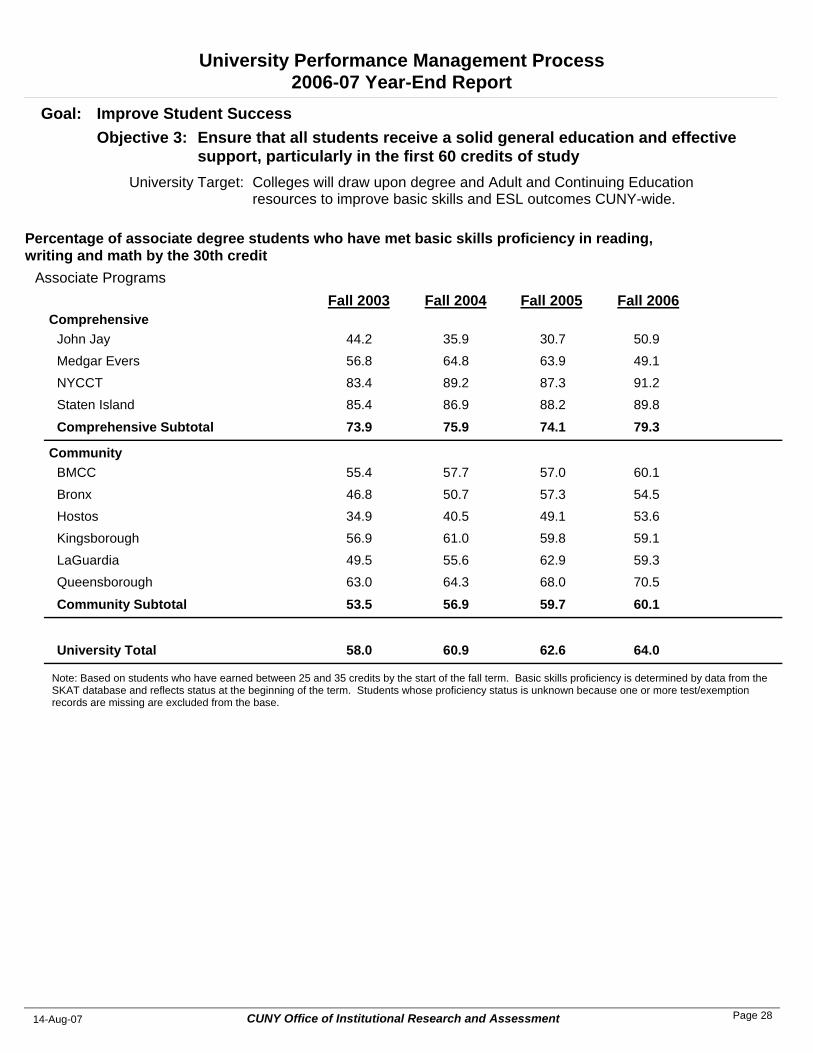
3.2 Colleges will draw upon degree and Adult and Continuing Education resources to improve basic skills and ESL outcomes CUNY-wide.
Baccalaureate Programs Percentage of non-ESL SEEK students who pass all basic skills tests within one year......................................................................... 21 Context: Number of non-ESL SEEK students......................................................................................................................................... 22 Percentage of ESL students (SEEK and regular) who pass all basic skills tests within two years......................................................... 23 Context: Number of ESL students (SEEK and regular) .......................................................................................................................... 24 Associate Programs Pass rate in reading on exit from remediation ........................................................................................................................................ 25 Pass rate in writing on exit from remediation .......................................................................................................................................... 26 Pass rate in math on exit from remediation ............................................................................................................................................ 27 Percentage of associate degree students who have met basic skills proficiency in reading, writing and math by the 30th credit ......... 28
ii
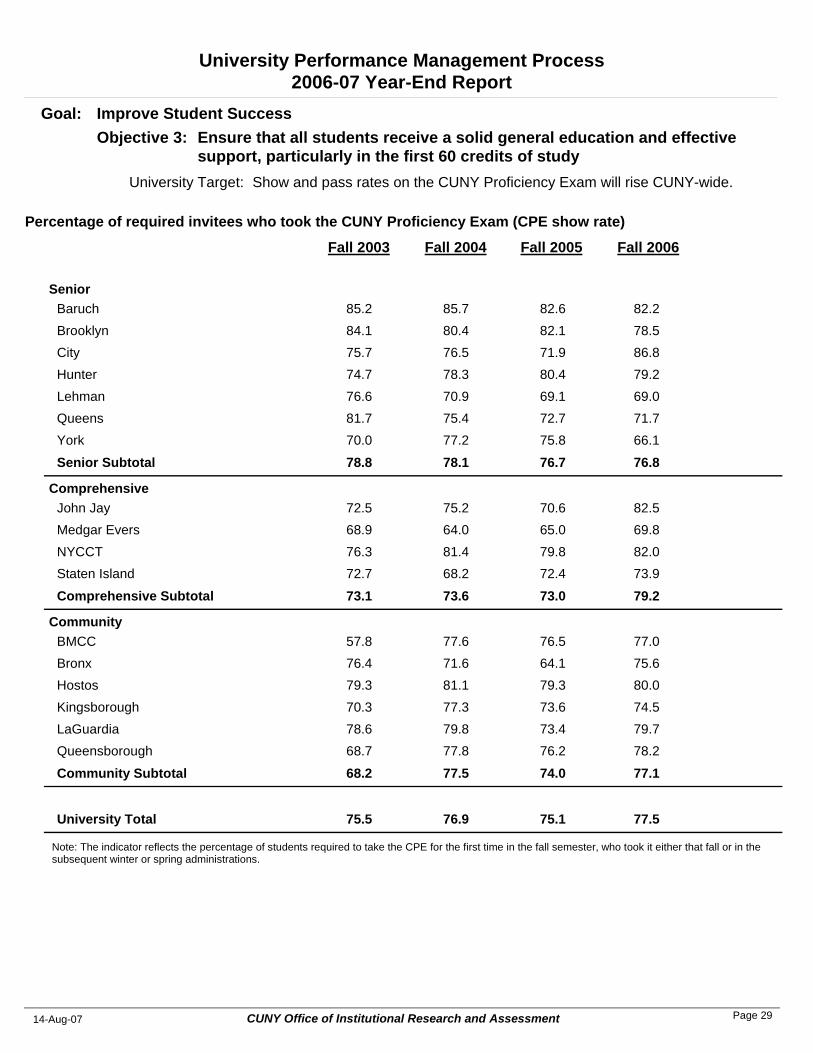
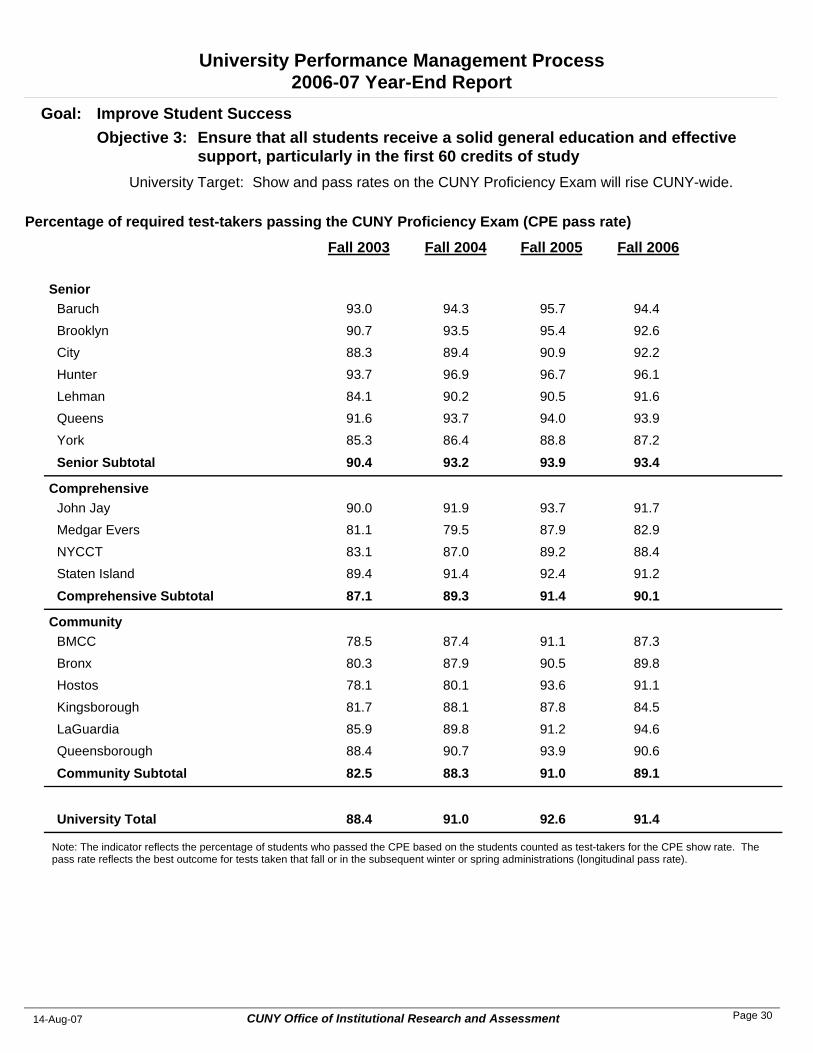
3.3 Show and pass rates on the CUNY Proficiency Exam will rise CUNY-wide. Percentage of required invitees who took the CUNY Proficiency Exam (CPE show rate) ..................................................................... 29 Percentage of required test-takers passing the CUNY Proficiency Exam (CPE pass rate).................................................................... 30
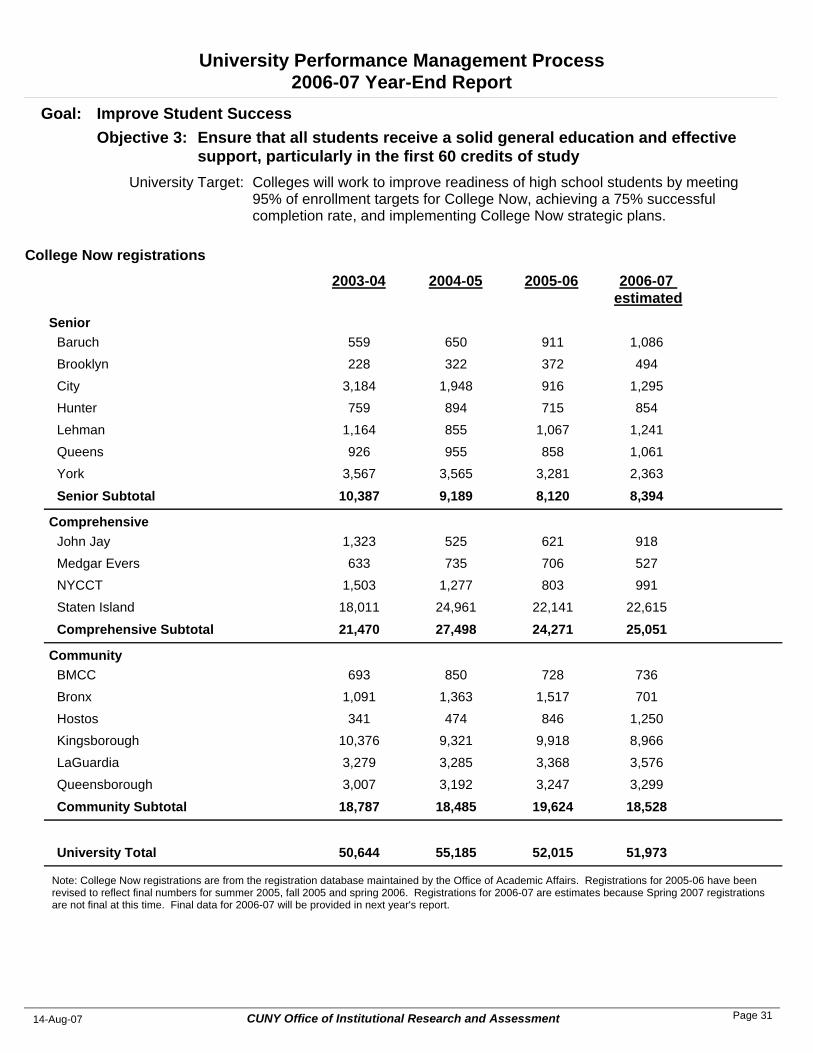
3.4 Colleges will work to improve readiness of high school students by meeting 95% of enrollment targets for College Now, achieving a 75% successful completion rate, and implementing College Now strategic plans.
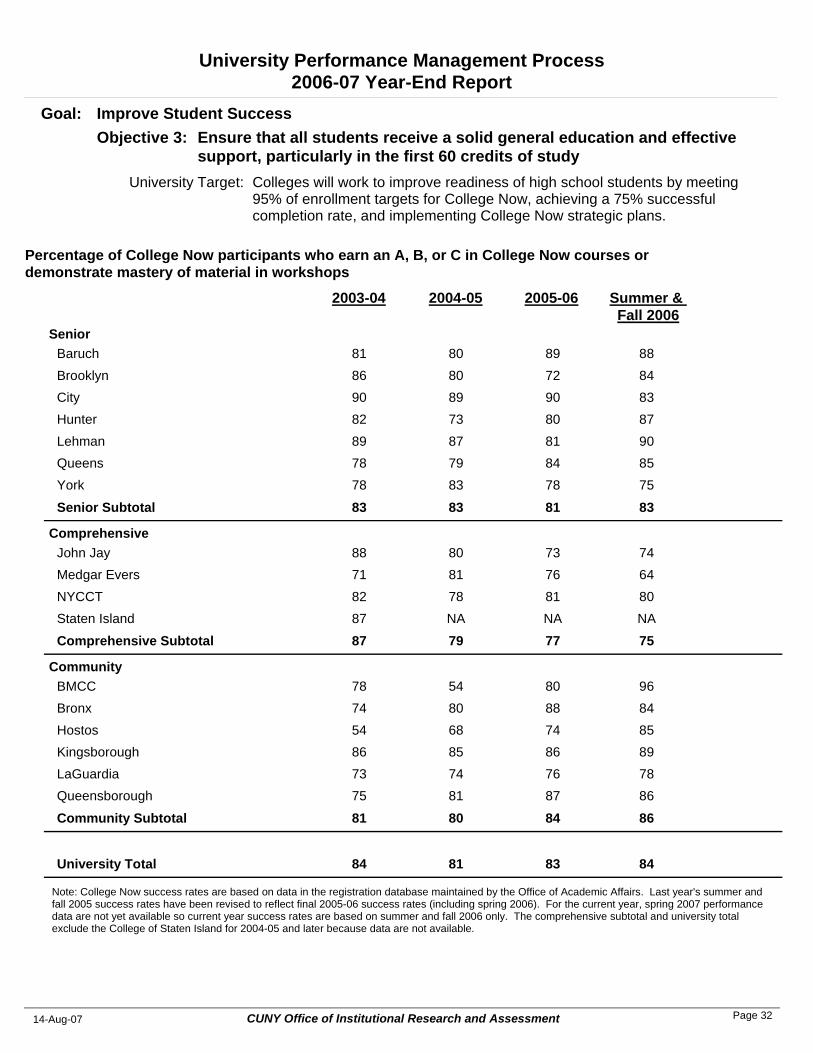
College Now registrations ....................................................................................................................................................................... 31 Percentage of College Now participants who earn an A, B, or C in College Now courses or demonstrate mastery of material in workshops ..................................................................................................................................................................... 32 4. Increase retention and graduation rates
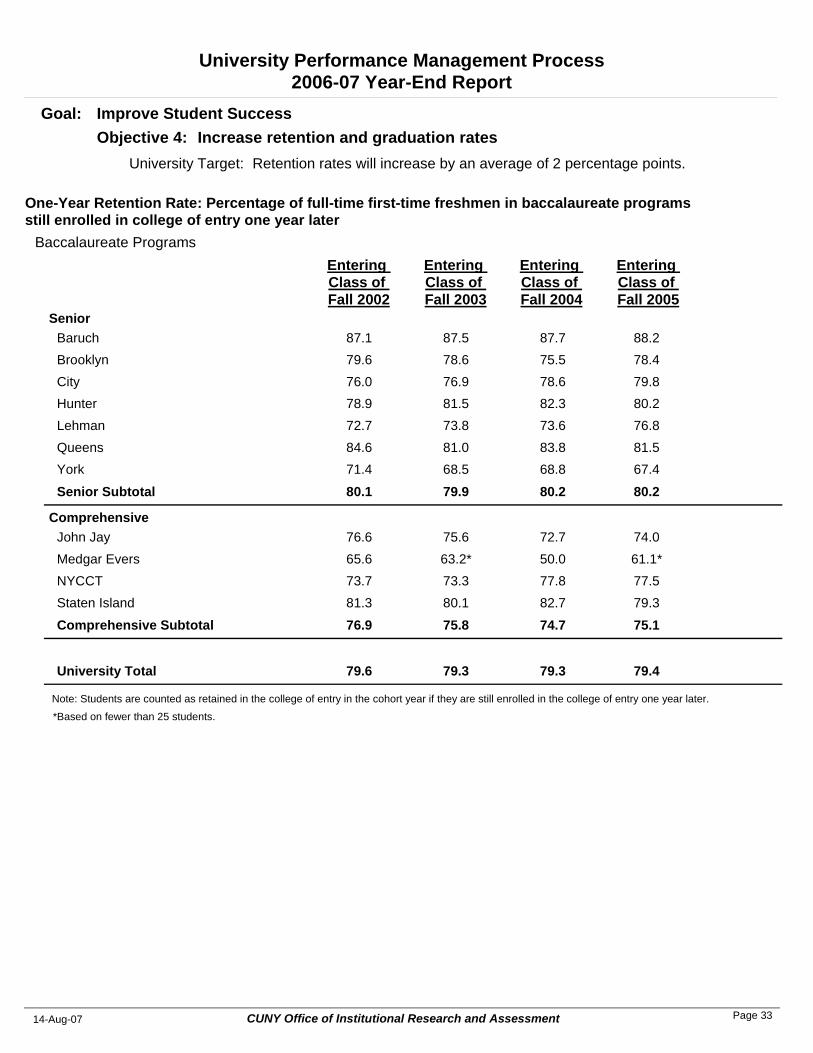
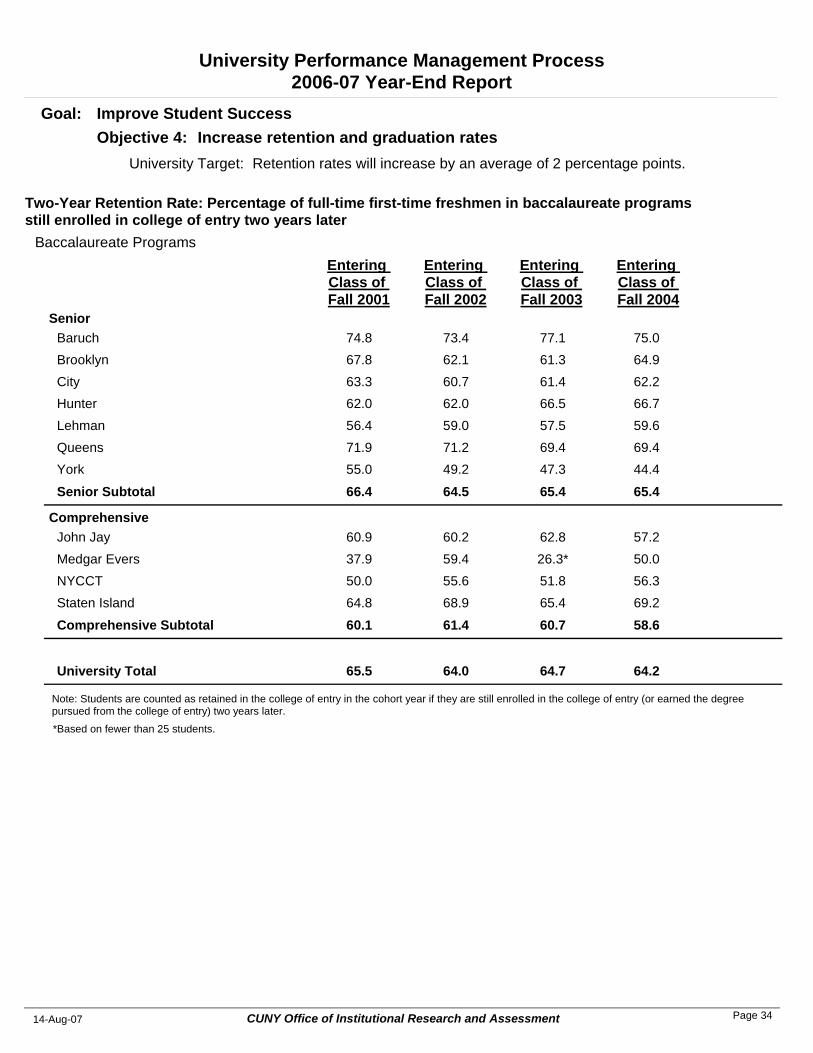
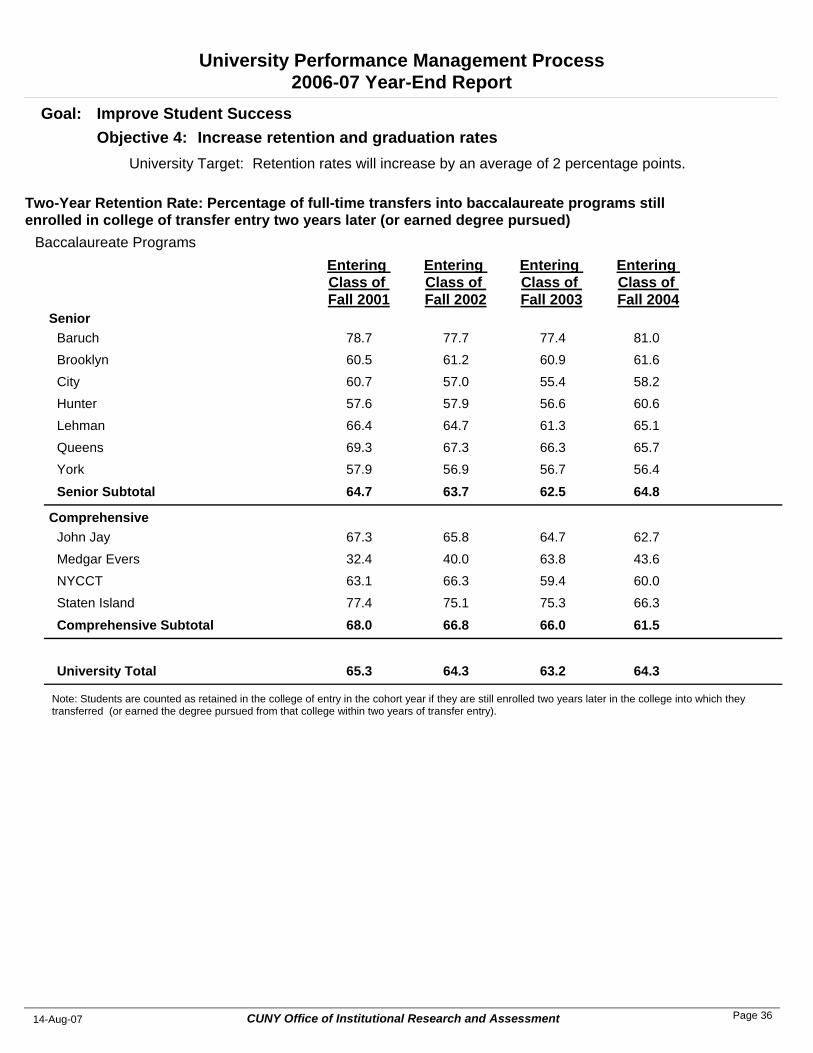
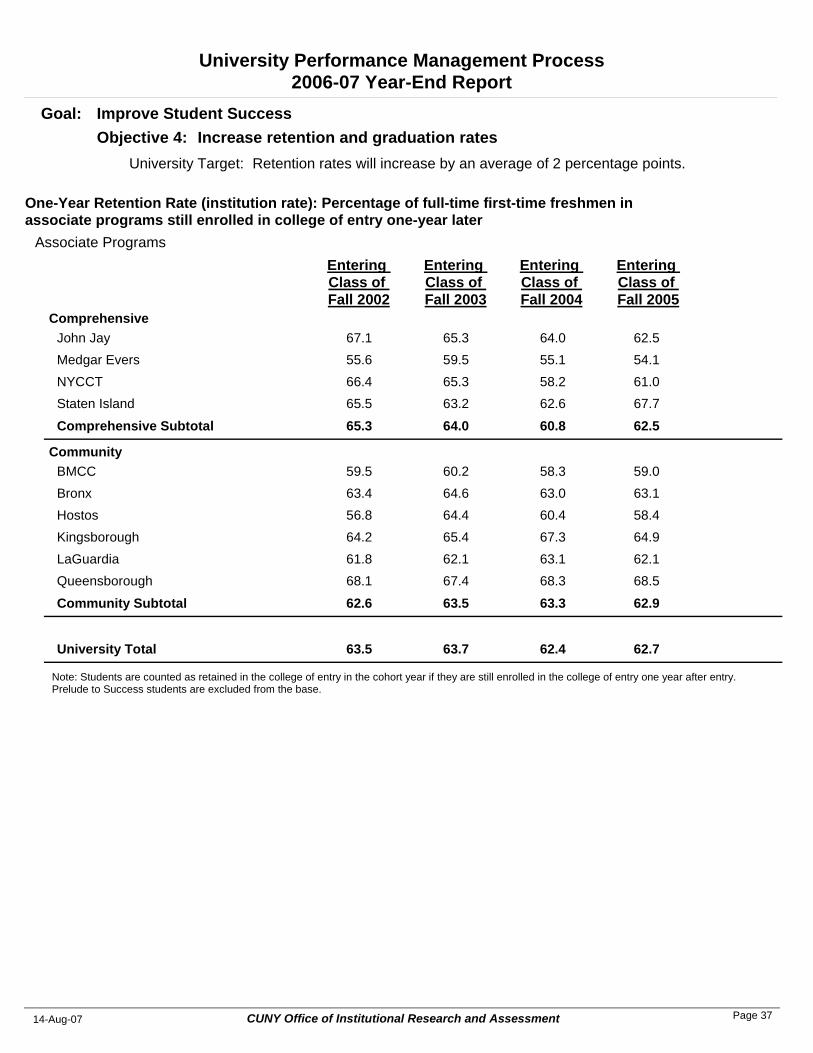
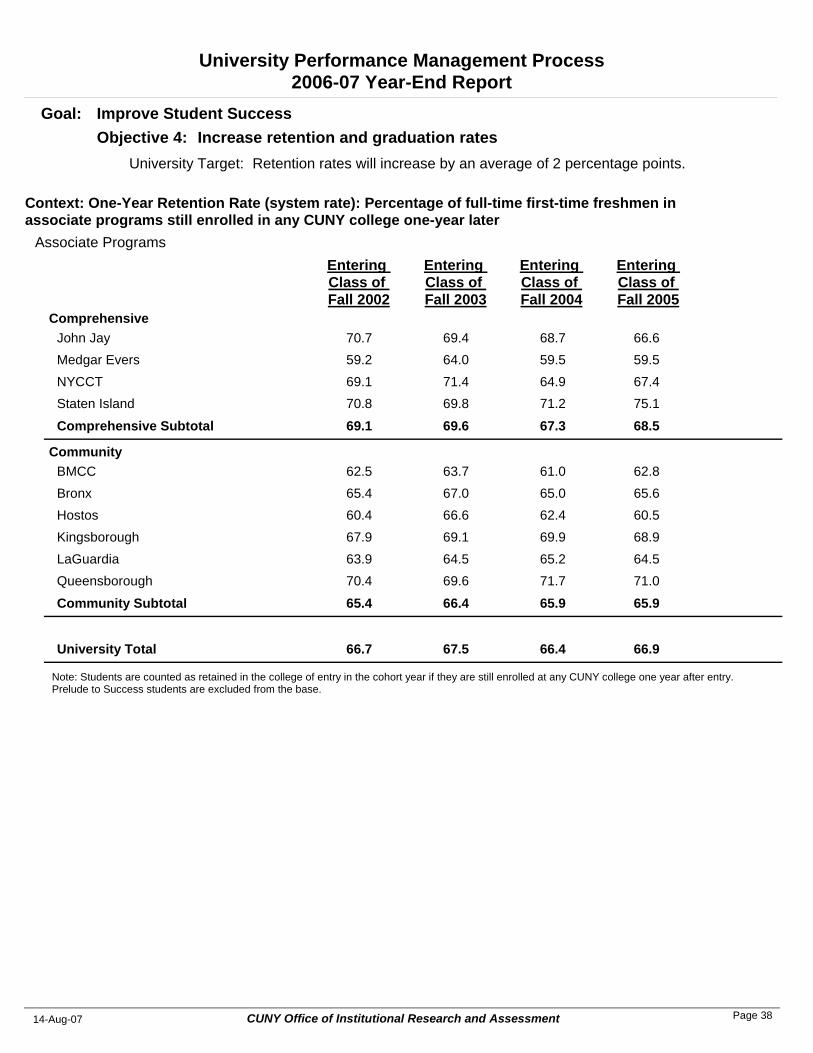
4.1 Retention rates will increase by an average of 2 percentage points. Baccalaureate Programs One-Year Retention Rate: Percentage of full-time first-time freshmen in baccalaureate programs still enrolled in college of entry one year later ......................................................................................................................................................................... 33 Two-Year Retention Rate: Percentage of full-time first-time freshmen in baccalaureate programs still enrolled in college of entry two years later........................................................................................................................................................................ 34 One-Year Retention Rate: Percentage of full-time transfers into baccalaureate programs still enrolled in college of transfer entry one year later (or earned degree pursued) ............................................................................................................................ 35 Two-Year Retention Rate: Percentage of full-time transfers into baccalaureate programs still enrolled in college of transfer entry two years later (or earned degree pursued)........................................................................................................................... 36 Associate Programs One-Year Retention Rate (institution rate): Percentage of full-time first-time freshmen in associate programs still enrolled in college of entry one-year later......................................................................................................................................................... 37 Context: One-Year Retention Rate (system rate): Percentage of full-time first-time freshmen in associate programs still enrolled in any CUNY college one-year later................................................................................................................................................ 38
4.2 Graduation rates will rise by an average of 2 percentage points in baccalaureate/master's programs and 1 point in associate programs.
Baccalaureate Programs Four-Year Graduation Rate: Percentage of full-time first-time freshmen in baccalaureate programs who graduated from college of entry within four years..................................................................................................................................................... 39 Six-year Graduation Rate: Percentage of full-time first-time freshmen in baccalaureate programs who graduated from college of entry within six years.................................................................................................................................................................. 40 Four-year Graduation Rate: Percentage of full-time transfers into baccalaureate programs who graduated from college of transfer entry within four years........................................................................................................................................................ 41 Six-year Graduation Rate: Percentage of full-time transfers into baccalaureate programs who graduated from college of transfer entry within six years.......................................................................................................................................................... 42 Master’s Programs Four-year Graduation Rate: Percentage of master's students who graduated within four years of entry into master's program........... 43 Associate Programs Six-year Graduation Rate (institution rate): Percentage of full-time first-time freshmen in associate programs who graduated from the college of entry within six years ........................................................................................................................................ 44 Context: Six-year Graduation Rate (system rate): Percentage of full-time first-time freshmen in associate programs who graduated from any CUNY college within six years of entry ............................................................................................................................ 45 Context: Percentage of full-time first-time freshmen in associate programs who transferred outside of CUNY within six years of entry................................................................................................................................................................................................. 46 5. Improve post-graduate outcomes
5.1 Professional preparation programs will improve performance of their students on certification/licensing exams or maintain high performance.
Percentage passing the Liberal Arts and Sciences Test (LAST) for teacher certification....................................................................... 47 Context: Number taking the LAST teacher certification exam ................................................................................................................ 48 Percentage passing the Assessment of Teaching Skills-Written (ATS-W) for teacher certification........................................................ 49 Context: Number taking the ATS-W teacher certification exam.............................................................................................................. 50 Percentage passing a Content Specialty Test (CST) ............................................................................................................................. 51 Context: Number taking a Content Specialty Test (CST) ....................................................................................................................... 52 Percentage passing NCLEX exam ......................................................................................................................................................... 53 Context: Number taking NCLEX exam ................................................................................................................................................... 54 Percentage of first-time test-takers without an advanced degree passing at least one segment of the Uniform CPA exam ................. 55 Percentage of first-time test-takers with an advanced degree passing at least one segment of the Uniform CPA exam ...................... 56
iii
5.2 All colleges will establish performance baselines on graduate exams. 5.3 Job and education placement rates for associate graduates will rise; job/education and satisfaction rate baselines will
be established for baccalaureate graduates. Six-month job placement rate in vocational programs ............................................................................................................................ 57 Context: Six-month education placement rate in vocational programs................................................................................................... 58 Context: Six-month job and education placement rate in vocational programs ...................................................................................... 59 6. Improve quality of student support services
6.1 Student satisfaction with academic support services, student services and use of technology to strengthen instruction will rise CUNY-wide.
Student satisfaction with academic support services.............................................................................................................................. 60 Student satisfaction with student services .............................................................................................................................................. 61 Student satisfaction with access to computer technology....................................................................................................................... 62 C. Enhance Financial and Management Effectiveness 7. Meet enrollment goals and facilitate movement of eligible students from associate to baccalaureate programs
7.1 Colleges will meet targets for degree credit and adult and continuing education enrollment; colleges will heighten recruitment efforts for underserved males; mean SATs/CAAs of baccalaureate entrants will rise.
Total Enrollment...................................................................................................................................................................................... 63 Total FTEs .............................................................................................................................................................................................. 64 First-time Freshmen................................................................................................................................................................................ 65 Transfers ................................................................................................................................................................................................ 66 Total Undergraduates ............................................................................................................................................................................. 67 New Graduates ....................................................................................................................................................................................... 68 Total Graduates ...................................................................................................................................................................................... 69 Number of seats filled in Adult and Continuing Education courses ........................................................................................................ 70 Mean SAT Score of regularly-admitted first-time freshmen enrolled in baccalaureate programs........................................................... 71 Context: Mean SAT Score of regularly-admitted first-time freshmen enrolled in baccalaureate programs, excluding ESL students..... 72 Mean College Admissions Average (CAA) of regularly-admitted first-time freshmen enrolled in baccalaureate programs ................... 73
7.2 All colleges will have completed TIPPS equivalency evaluations for 90% of courses by June 30, 2007; all colleges will install Degree Works by June 30, 2007; for each month that Degree Works is installed, an additional 1% of students will access this planning and advisement tool.
Percentage of course evaluations completed in TIPPS (based on all courses) ..................................................................................... 74 Context: Number of course evaluations completed in TIPPS (based on all courses)............................................................................. 75 Context: Percentage of course evaluations completed in TIPPS (excluding special courses, electives and non-credit courses) ......... 76 Context: Percentage of evaluated courses designated as non-transferable .......................................................................................... 77 Baccalaureate Programs Context: Number of transfers from CUNY AA/AS programs................................................................................................................... 78 Context: Number of transfers from CUNY AAS programs ...................................................................................................................... 79 Associate Programs Context: Percentage of AA/AS recipients who transferred to a CUNY baccalaureate program ............................................................. 80 Context: Percentage of AAS recipients who transferred to a CUNY baccalaureate program ................................................................ 81 Context: Average first term GPA of transfers from AA/AS programs...................................................................................................... 82 Context: Average first term GPA of transfers from AAS programs ......................................................................................................... 83 Context: One-year (Fall-to-Fall) retention rate of AA/AS transfers to baccalaureate programs.............................................................. 84 Context: One-year (Fall-to-Fall) retention rate of AAS transfers to baccalaureate programs ................................................................. 85 8. Increase revenues from external sources
8.1 Alumni-corporate fundraising will increase 10% CUNY-wide. Total Voluntary Support (Cash In and Testamentary Gifts) .................................................................................................................... 86
8.2 Colleges will complete agreed-upon restructuring of their philanthropic foundations to comply with CUNY guidelines and document participation in the CUNY Compact.
8.3 Contract/grant awards will rise 5% CUNY-wide. Grants and contracts awarded (administered by the Research Foundation).......................................................................................... 87
8.4 Indirect cost recovery ratios will improve CUNY-wide. Indirect cost recovery as a percentage of overall activity ....................................................................................................................... 88
iv
8.5 Each college will meet agreed upon revenue targets for adult and continuing education. 9. Improve productivity, service to students, and environmental health and safety
9.1 Each college will achieve its productivity savings target and apply those funds to student instruction-related activities. Productivity savings as a percentage of targeted amount ...................................................................................................................... 89 9.2 Student satisfaction with administrative services will rise or remain high at all CUNY colleges. Student satisfaction with administrative services.................................................................................................................................... 90
9.3 Every college will lower or hold constant the percentage of its tax levy budget spent on administrative services. Institutional Support Services (administrative services) as a percentage of total tax levy budget .......................................................... 91 Context: Institutional Support Services (administrative services) ........................................................................................................... 91 Context: General Administration as a percentage of total tax levy budget ............................................................................................. 92 Context: General Administration ............................................................................................................................................................. 92 Context: General Institutional Services as a percentage of total tax levy budget ................................................................................... 93 Context: General Institutional Services................................................................................................................................................... 93 Context: Maintenance and Operations as a percentage of total tax levy budget.................................................................................... 94 Context: Maintenance and Operations ................................................................................................................................................... 94
9.4 All colleges will have and implement financial plans with balanced budgets. 9.5 The percentage of instruction delivered on Fridays, nights, or weekends will rise CUNY-wide, to better serve students
and use facilities fully. Percentage of FTEs offered on Fridays, evenings or weekends ............................................................................................................ 95
9.6 All colleges will develop a chemical inventory and hazardous waste management system. All faculty/staff working with chemicals or other hazardous substances will participate in hazardous waste training sessions.
University Performance Management Process2006-07 Year-End Report
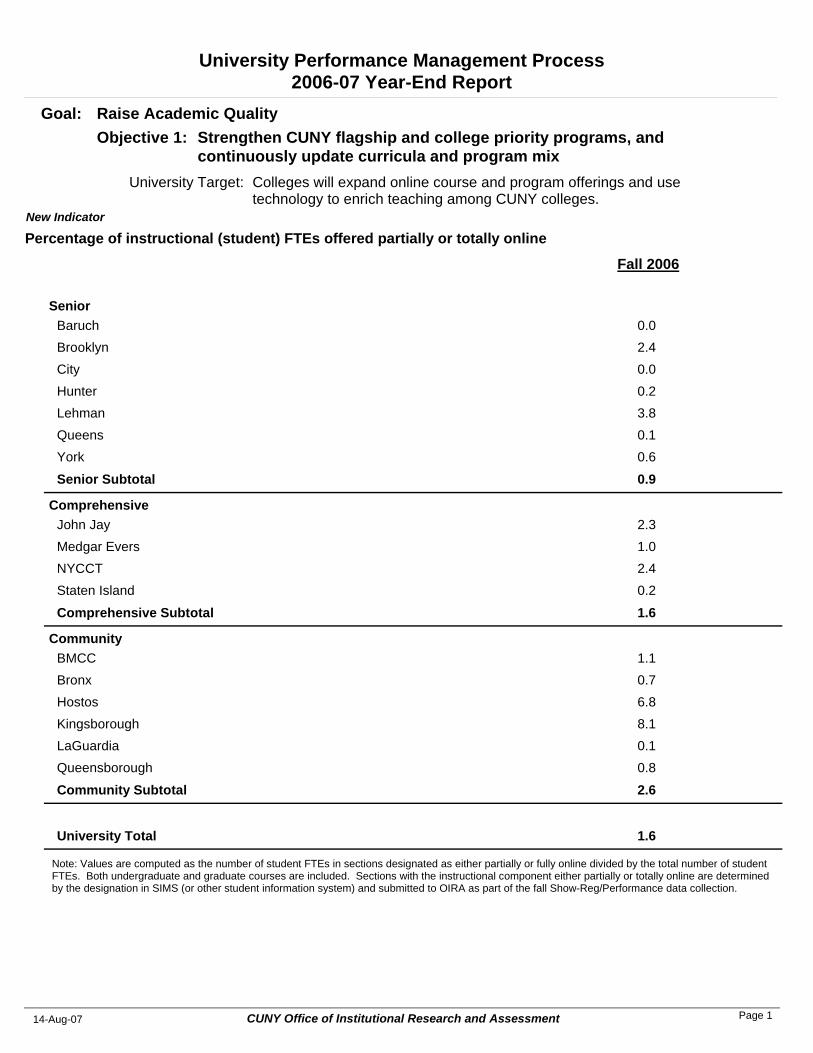
Colleges will expand online course and program offerings and use technology to enrich teaching among CUNY colleges.
University Target:
Strengthen CUNY flagship and college priority programs, and continuously update curricula and program mix
Objective 1: Goal: Raise Academic Quality
Fall 2006
Percentage of instructional (student) FTEs offered partially or totally onlineNew Indicator
SeniorBaruch 0.0Brooklyn 2.4City 0.0Hunter 0.2Lehman 3.8Queens 0.1York 0.6
Senior Subtotal 0.9
ComprehensiveJohn Jay 2.3Medgar Evers 1.0NYCCT 2.4Staten Island 0.2
Comprehensive Subtotal 1.6
CommunityBMCC 1.1Bronx 0.7Hostos 6.8Kingsborough 8.1LaGuardia 0.1Queensborough 0.8
Community Subtotal 2.6
University Total 1.6
Note: Values are computed as the number of student FTEs in sections designated as either partially or fully online divided by the total number of student FTEs. Both undergraduate and graduate courses are included. Sections with the instructional component either partially or totally online are determined by the designation in SIMS (or other student information system) and submitted to OIRA as part of the fall Show-Reg/Performance data collection.
CUNY Office of Institutional Research and Assessment14-Aug-07 Page 1
University Performance Management Process2006-07 Year-End Report
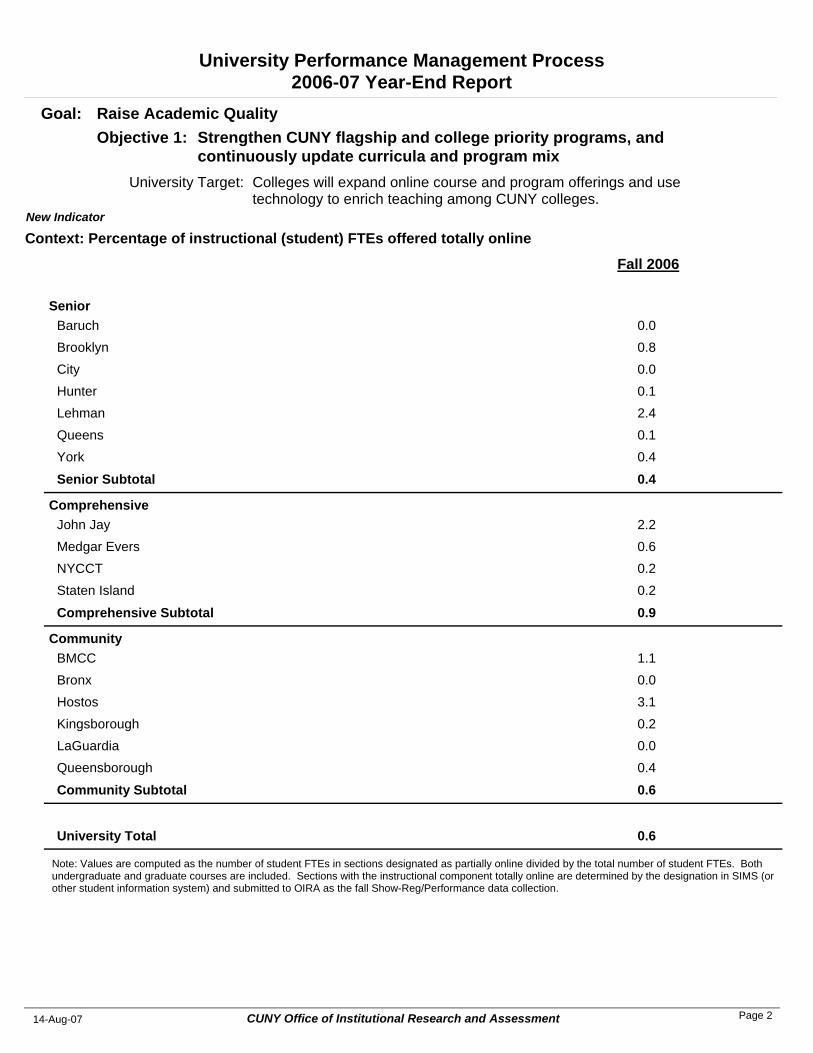
Colleges will expand online course and program offerings and use technology to enrich teaching among CUNY colleges.
University Target:
Strengthen CUNY flagship and college priority programs, and continuously update curricula and program mix
Objective 1: Goal: Raise Academic Quality
Fall 2006
Context: Percentage of instructional (student) FTEs offered totally onlineNew Indicator
SeniorBaruch 0.0Brooklyn 0.8City 0.0Hunter 0.1Lehman 2.4Queens 0.1York 0.4
Senior Subtotal 0.4
ComprehensiveJohn Jay 2.2Medgar Evers 0.6NYCCT 0.2Staten Island 0.2
Comprehensive Subtotal 0.9
CommunityBMCC 1.1Bronx 0.0Hostos 3.1Kingsborough 0.2LaGuardia 0.0Queensborough 0.4
Community Subtotal 0.6
University Total 0.6
Note: Values are computed as the number of student FTEs in sections designated as partially online divided by the total number of student FTEs. Both undergraduate and graduate courses are included. Sections with the instructional component totally online are determined by the designation in SIMS (or other student information system) and submitted to OIRA as the fall Show-Reg/Performance data collection.
CUNY Office of Institutional Research and Assessment14-Aug-07 Page 2
University Performance Management Process2006-07 Year-End Report
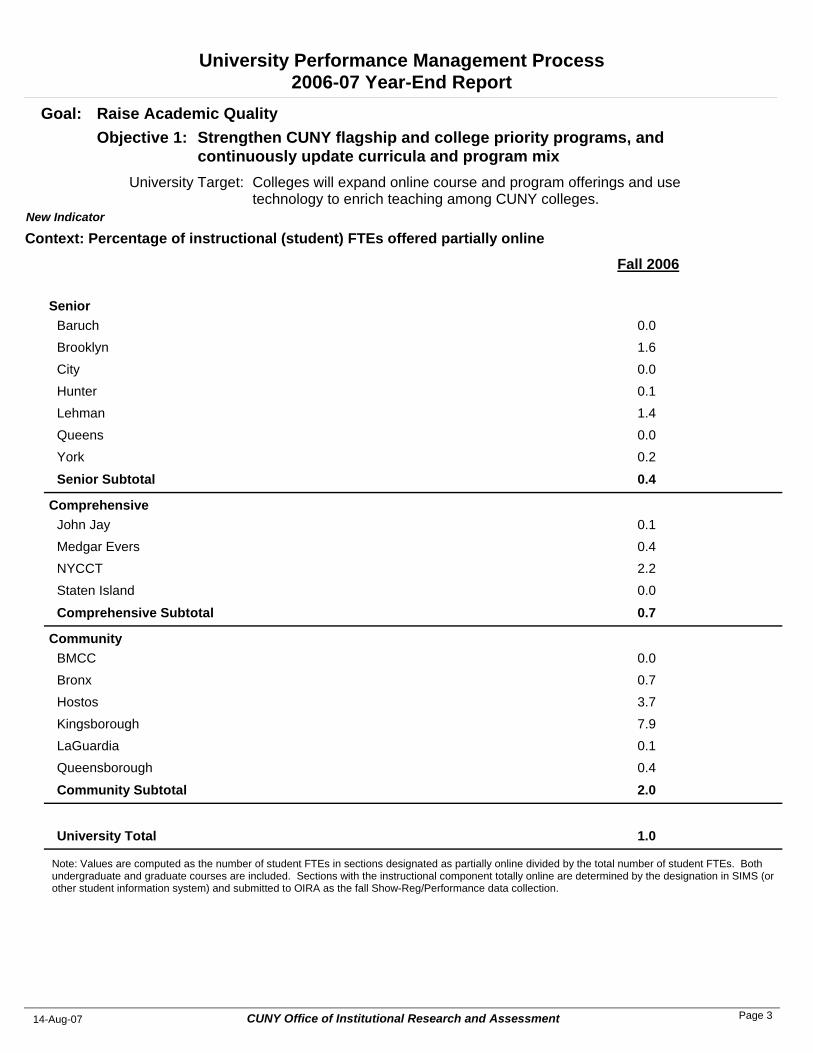
Colleges will expand online course and program offerings and use technology to enrich teaching among CUNY colleges.
University Target:
Strengthen CUNY flagship and college priority programs, and continuously update curricula and program mix
Objective 1: Goal: Raise Academic Quality
Fall 2006
Context: Percentage of instructional (student) FTEs offered partially onlineNew Indicator
SeniorBaruch 0.0Brooklyn 1.6City 0.0Hunter 0.1Lehman 1.4Queens 0.0York 0.2
Senior Subtotal 0.4
ComprehensiveJohn Jay 0.1Medgar Evers 0.4NYCCT 2.2Staten Island 0.0
Comprehensive Subtotal 0.7
CommunityBMCC 0.0Bronx 0.7Hostos 3.7Kingsborough 7.9LaGuardia 0.1Queensborough 0.4
Community Subtotal 2.0
University Total 1.0
Note: Values are computed as the number of student FTEs in sections designated as partially online divided by the total number of student FTEs. Both undergraduate and graduate courses are included. Sections with the instructional component totally online are determined by the designation in SIMS (or other student information system) and submitted to OIRA as the fall Show-Reg/Performance data collection.
CUNY Office of Institutional Research and Assessment14-Aug-07 Page 3
University Performance Management Process2006-07 Year-End Report
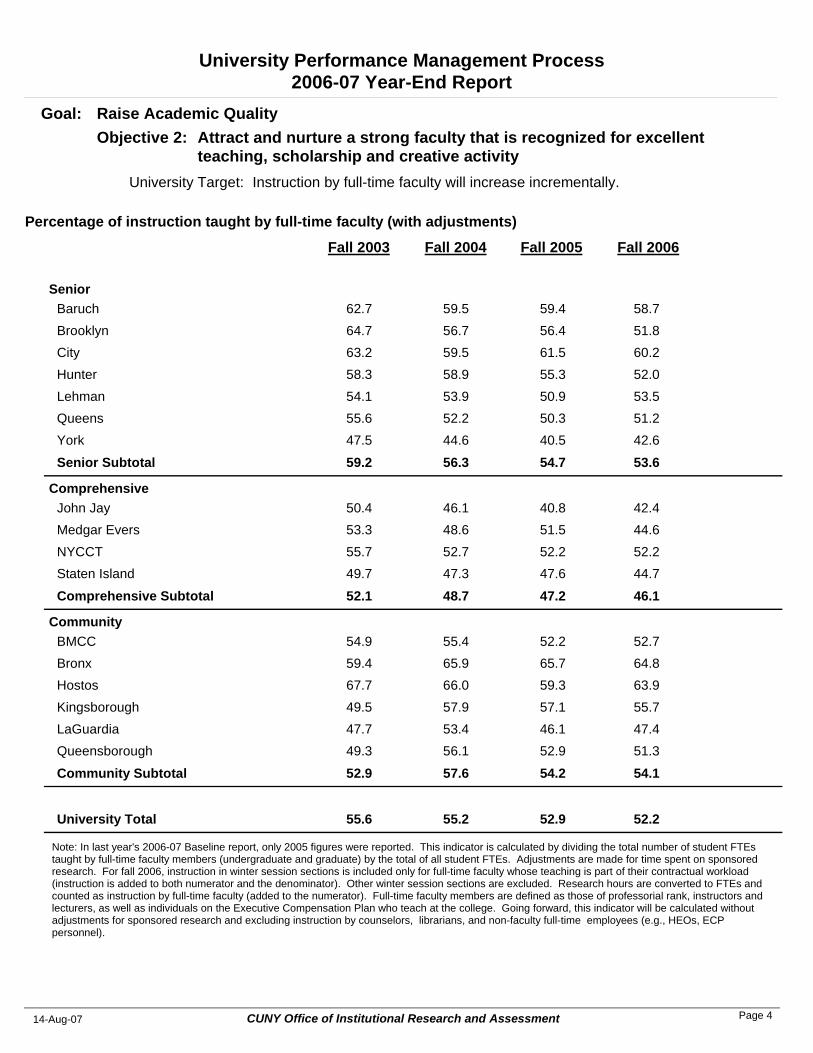
Instruction by full-time faculty will increase incrementally.University Target:
Attract and nurture a strong faculty that is recognized for excellent teaching, scholarship and creative activity
Objective 2: Goal: Raise Academic Quality
Fall 2004 Fall 2005 Fall 2006
Percentage of instruction taught by full-time faculty (with adjustments)
Fall 2003
SeniorBaruch 59.5 59.4 58.762.7Brooklyn 56.7 56.4 51.864.7City 59.5 61.5 60.263.2Hunter 58.9 55.3 52.058.3Lehman 53.9 50.9 53.554.1Queens 52.2 50.3 51.255.6York 44.6 40.5 42.647.5
Senior Subtotal 56.3 54.7 53.659.2
ComprehensiveJohn Jay 46.1 40.8 42.450.4Medgar Evers 48.6 51.5 44.653.3NYCCT 52.7 52.2 52.255.7Staten Island 47.3 47.6 44.749.7
Comprehensive Subtotal 48.7 47.2 46.152.1
CommunityBMCC 55.4 52.2 52.754.9Bronx 65.9 65.7 64.859.4Hostos 66.0 59.3 63.967.7Kingsborough 57.9 57.1 55.749.5LaGuardia 53.4 46.1 47.447.7Queensborough 56.1 52.9 51.349.3
Community Subtotal 57.6 54.2 54.152.9
University Total 55.2 52.9 52.255.6
Note: In last year's 2006-07 Baseline report, only 2005 figures were reported. This indicator is calculated by dividing the total number of student FTEs taught by full-time faculty members (undergraduate and graduate) by the total of all student FTEs. Adjustments are made for time spent on sponsored research. For fall 2006, instruction in winter session sections is included only for full-time faculty whose teaching is part of their contractual workload (instruction is added to both numerator and the denominator). Other winter session sections are excluded. Research hours are converted to FTEs and counted as instruction by full-time faculty (added to the numerator). Full-time faculty members are defined as those of professorial rank, instructors and lecturers, as well as individuals on the Executive Compensation Plan who teach at the college. Going forward, this indicator will be calculated without adjustments for sponsored research and excluding instruction by counselors, librarians, and non-faculty full-time employees (e.g., HEOs, ECP personnel).
CUNY Office of Institutional Research and Assessment14-Aug-07 Page 4
University Performance Management Process2006-07 Year-End Report
Instruction by full-time faculty will increase incrementally.University Target:
Attract and nurture a strong faculty that is recognized for excellent teaching, scholarship and creative activity
Objective 2: Goal: Raise Academic Quality
Fall 2004 Fall 2005 Fall 2006
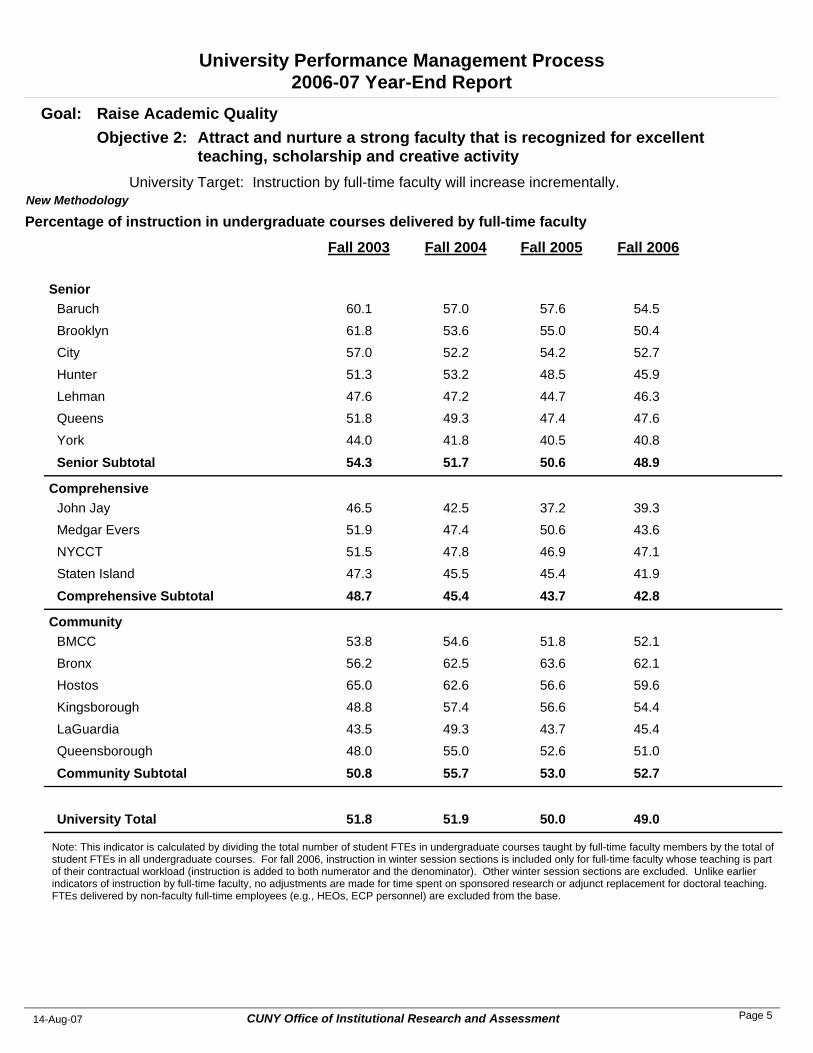
Percentage of instruction in undergraduate courses delivered by full-time facultyNew Methodology
Fall 2003
SeniorBaruch 57.0 57.6 54.560.1Brooklyn 53.6 55.0 50.461.8City 52.2 54.2 52.757.0Hunter 53.2 48.5 45.951.3Lehman 47.2 44.7 46.347.6Queens 49.3 47.4 47.651.8York 41.8 40.5 40.844.0
Senior Subtotal 51.7 50.6 48.954.3
ComprehensiveJohn Jay 42.5 37.2 39.346.5Medgar Evers 47.4 50.6 43.651.9NYCCT 47.8 46.9 47.151.5Staten Island 45.5 45.4 41.947.3
Comprehensive Subtotal 45.4 43.7 42.848.7
CommunityBMCC 54.6 51.8 52.153.8Bronx 62.5 63.6 62.156.2Hostos 62.6 56.6 59.665.0Kingsborough 57.4 56.6 54.448.8LaGuardia 49.3 43.7 45.443.5Queensborough 55.0 52.6 51.048.0
Community Subtotal 55.7 53.0 52.750.8
University Total 51.9 50.0 49.051.8
Note: This indicator is calculated by dividing the total number of student FTEs in undergraduate courses taught by full-time faculty members by the total of student FTEs in all undergraduate courses. For fall 2006, instruction in winter session sections is included only for full-time faculty whose teaching is part of their contractual workload (instruction is added to both numerator and the denominator). Other winter session sections are excluded. Unlike earlier indicators of instruction by full-time faculty, no adjustments are made for time spent on sponsored research or adjunct replacement for doctoral teaching. FTEs delivered by non-faculty full-time employees (e.g., HEOs, ECP personnel) are excluded from the base.
CUNY Office of Institutional Research and Assessment14-Aug-07 Page 5
University Performance Management Process2006-07 Year-End Report
Instruction by full-time faculty will increase incrementally.University Target:
Attract and nurture a strong faculty that is recognized for excellent teaching, scholarship and creative activity
Objective 2: Goal: Raise Academic Quality
Fall 2004 Fall 2005 Fall 2006
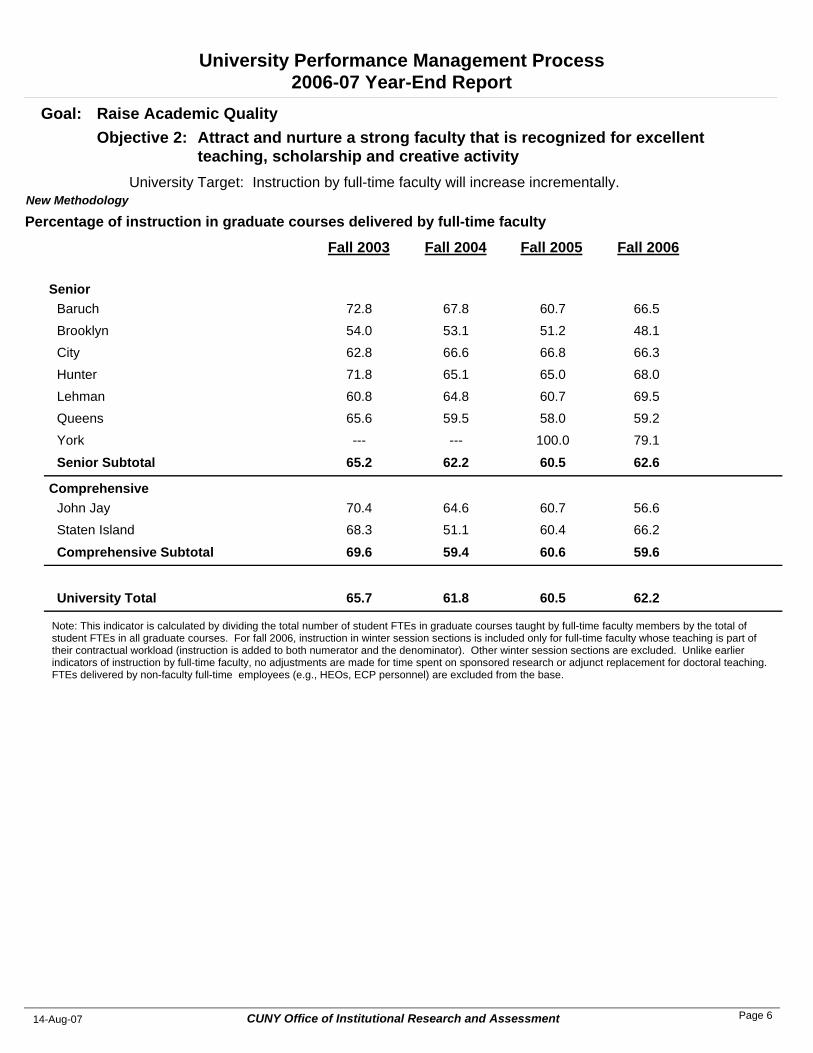
Percentage of instruction in graduate courses delivered by full-time facultyNew Methodology
Fall 2003
SeniorBaruch 67.8 60.7 66.572.8Brooklyn 53.1 51.2 48.154.0City 66.6 66.8 66.362.8Hunter 65.1 65.0 68.071.8Lehman 64.8 60.7 69.560.8Queens 59.5 58.0 59.265.6York --- 100.0 79.1---
Senior Subtotal 62.2 60.5 62.665.2
ComprehensiveJohn Jay 64.6 60.7 56.670.4Staten Island 51.1 60.4 66.268.3
Comprehensive Subtotal 59.4 60.6 59.669.6
University Total 61.8 60.5 62.265.7
Note: This indicator is calculated by dividing the total number of student FTEs in graduate courses taught by full-time faculty members by the total of student FTEs in all graduate courses. For fall 2006, instruction in winter session sections is included only for full-time faculty whose teaching is part of their contractual workload (instruction is added to both numerator and the denominator). Other winter session sections are excluded. Unlike earlier indicators of instruction by full-time faculty, no adjustments are made for time spent on sponsored research or adjunct replacement for doctoral teaching. FTEs delivered by non-faculty full-time employees (e.g., HEOs, ECP personnel) are excluded from the base.
CUNY Office of Institutional Research and Assessment14-Aug-07 Page 6
University Performance Management Process2006-07 Year-End Report
Instruction by full-time faculty will increase incrementally.University Target:
Attract and nurture a strong faculty that is recognized for excellent teaching, scholarship and creative activity
Objective 2: Goal: Raise Academic Quality
Fall 2004 Fall 2005 Fall 2006
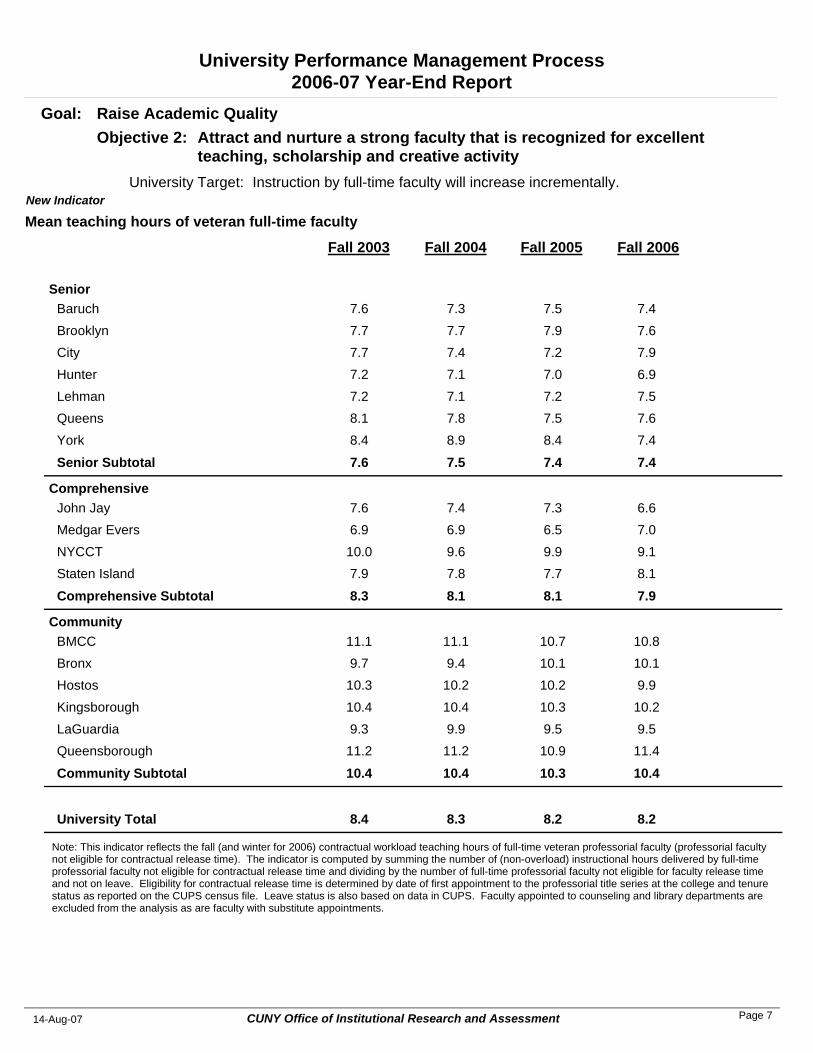
Mean teaching hours of veteran full-time facultyNew Indicator
Fall 2003
SeniorBaruch 7.3 7.5 7.47.6Brooklyn 7.7 7.9 7.67.7City 7.4 7.2 7.97.7Hunter 7.1 7.0 6.97.2Lehman 7.1 7.2 7.57.2Queens 7.8 7.5 7.68.1York 8.9 8.4 7.48.4
Senior Subtotal 7.5 7.4 7.47.6
ComprehensiveJohn Jay 7.4 7.3 6.67.6Medgar Evers 6.9 6.5 7.06.9NYCCT 9.6 9.9 9.110.0Staten Island 7.8 7.7 8.17.9
Comprehensive Subtotal 8.1 8.1 7.98.3
CommunityBMCC 11.1 10.7 10.811.1Bronx 9.4 10.1 10.19.7Hostos 10.2 10.2 9.910.3Kingsborough 10.4 10.3 10.210.4LaGuardia 9.9 9.5 9.59.3Queensborough 11.2 10.9 11.411.2
Community Subtotal 10.4 10.3 10.410.4
University Total 8.3 8.2 8.28.4
Note: This indicator reflects the fall (and winter for 2006) contractual workload teaching hours of full-time veteran professorial faculty (professorial faculty not eligible for contractual release time). The indicator is computed by summing the number of (non-overload) instructional hours delivered by full-time professorial faculty not eligible for contractual release time and dividing by the number of full-time professorial faculty not eligible for faculty release time and not on leave. Eligibility for contractual release time is determined by date of first appointment to the professorial title series at the college and tenure status as reported on the CUPS census file. Leave status is also based on data in CUPS. Faculty appointed to counseling and library departments are excluded from the analysis as are faculty with substitute appointments.
CUNY Office of Institutional Research and Assessment14-Aug-07 Page 7
University Performance Management Process2006-07 Year-End Report
Instruction by full-time faculty will increase incrementally.University Target:
Attract and nurture a strong faculty that is recognized for excellent teaching, scholarship and creative activity
Objective 2: Goal: Raise Academic Quality
Fall 2004 Fall 2005 Fall 2006
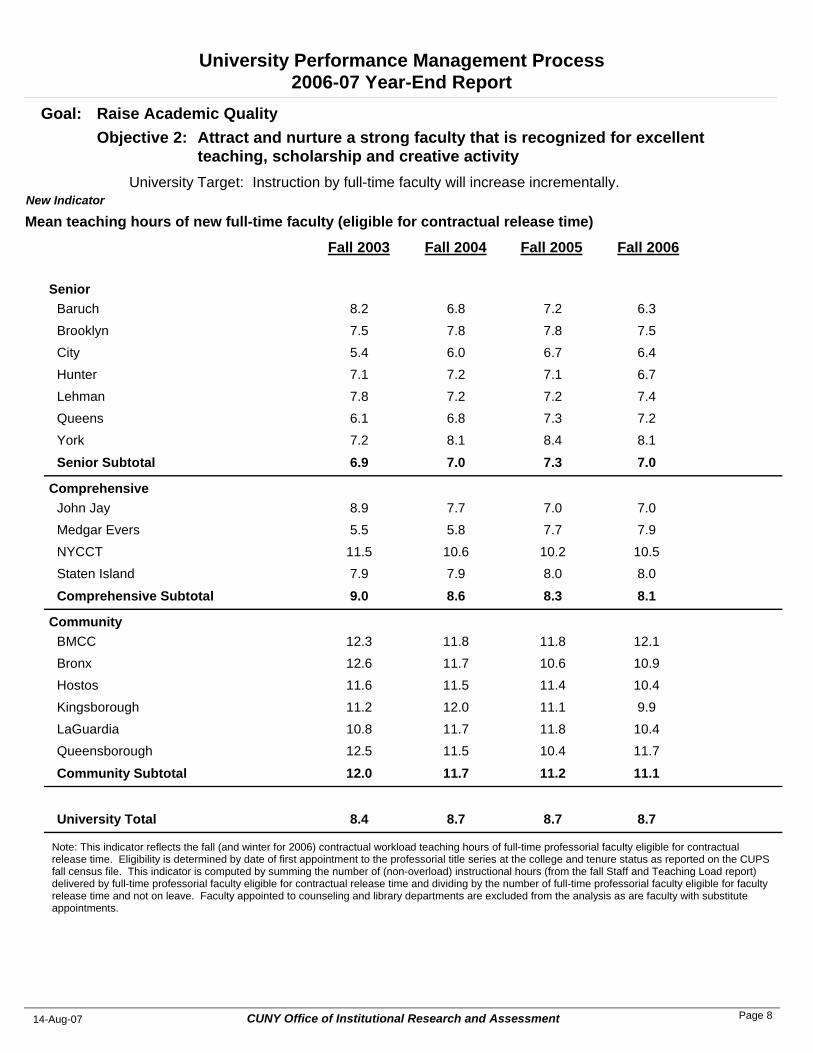
Mean teaching hours of new full-time faculty (eligible for contractual release time)New Indicator
Fall 2003
SeniorBaruch 6.8 7.2 6.38.2Brooklyn 7.8 7.8 7.57.5City 6.0 6.7 6.45.4Hunter 7.2 7.1 6.77.1Lehman 7.2 7.2 7.47.8Queens 6.8 7.3 7.26.1York 8.1 8.4 8.17.2
Senior Subtotal 7.0 7.3 7.06.9
ComprehensiveJohn Jay 7.7 7.0 7.08.9Medgar Evers 5.8 7.7 7.95.5NYCCT 10.6 10.2 10.511.5Staten Island 7.9 8.0 8.07.9
Comprehensive Subtotal 8.6 8.3 8.19.0
CommunityBMCC 11.8 11.8 12.112.3Bronx 11.7 10.6 10.912.6Hostos 11.5 11.4 10.411.6Kingsborough 12.0 11.1 9.911.2LaGuardia 11.7 11.8 10.410.8Queensborough 11.5 10.4 11.712.5
Community Subtotal 11.7 11.2 11.112.0
University Total 8.7 8.7 8.78.4
Note: This indicator reflects the fall (and winter for 2006) contractual workload teaching hours of full-time professorial faculty eligible for contractual release time. Eligibility is determined by date of first appointment to the professorial title series at the college and tenure status as reported on the CUPS fall census file. This indicator is computed by summing the number of (non-overload) instructional hours (from the fall Staff and Teaching Load report) delivered by full-time professorial faculty eligible for contractual release time and dividing by the number of full-time professorial faculty eligible for faculty release time and not on leave. Faculty appointed to counseling and library departments are excluded from the analysis as are faculty with substitute appointments.
CUNY Office of Institutional Research and Assessment14-Aug-07 Page 8
University Performance Management Process2006-07 Year-End Report
Instruction by full-time faculty will increase incrementally.University Target:
Attract and nurture a strong faculty that is recognized for excellent teaching, scholarship and creative activity
Objective 2: Goal: Raise Academic Quality
Fall 2004 Fall 2005 Fall 2006
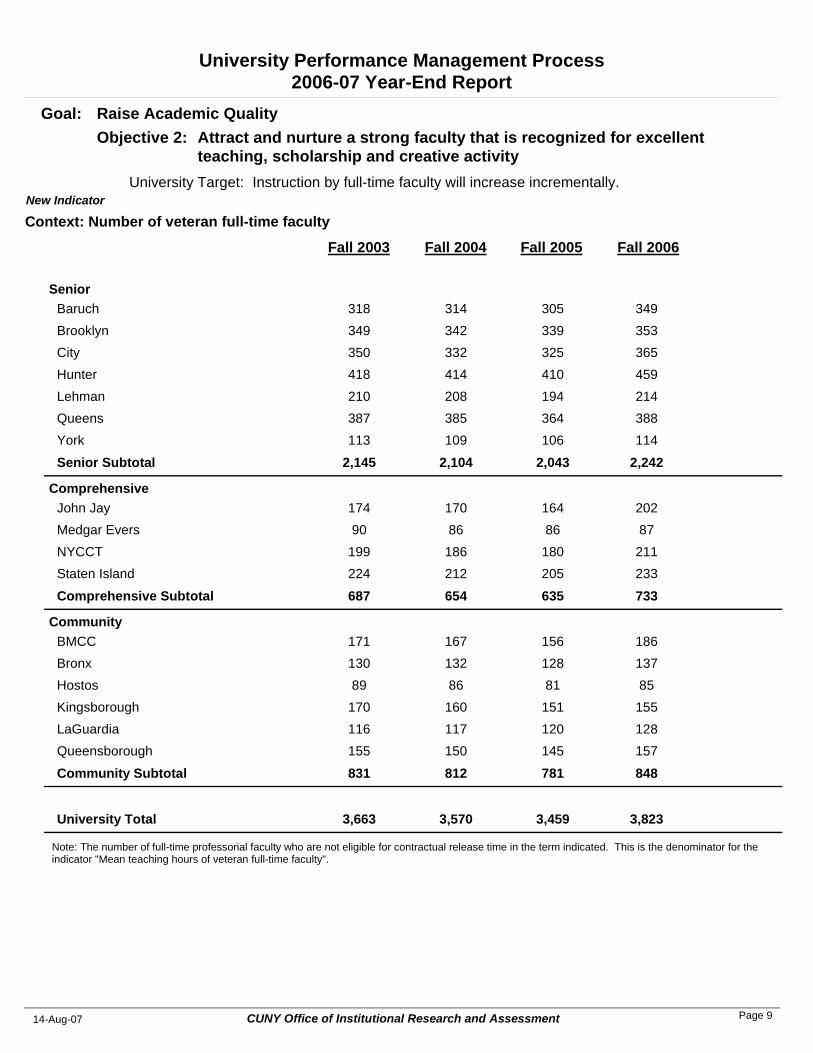
Context: Number of veteran full-time facultyNew Indicator
Fall 2003
SeniorBaruch 314 305 349318Brooklyn 342 339 353349City 332 325 365350Hunter 414 410 459418Lehman 208 194 214210Queens 385 364 388387York 109 106 114113
Senior Subtotal 2,104 2,043 2,2422,145
ComprehensiveJohn Jay 170 164 202174Medgar Evers 86 86 8790NYCCT 186 180 211199Staten Island 212 205 233224
Comprehensive Subtotal 654 635 733687
CommunityBMCC 167 156 186171Bronx 132 128 137130Hostos 86 81 8589Kingsborough 160 151 155170LaGuardia 117 120 128116Queensborough 150 145 157155
Community Subtotal 812 781 848831
University Total 3,570 3,459 3,8233,663
Note: The number of full-time professorial faculty who are not eligible for contractual release time in the term indicated. This is the denominator for the indicator "Mean teaching hours of veteran full-time faculty".
CUNY Office of Institutional Research and Assessment14-Aug-07 Page 9
University Performance Management Process2006-07 Year-End Report
Instruction by full-time faculty will increase incrementally.University Target:
Attract and nurture a strong faculty that is recognized for excellent teaching, scholarship and creative activity
Objective 2: Goal: Raise Academic Quality
Fall 2004 Fall 2005 Fall 2006
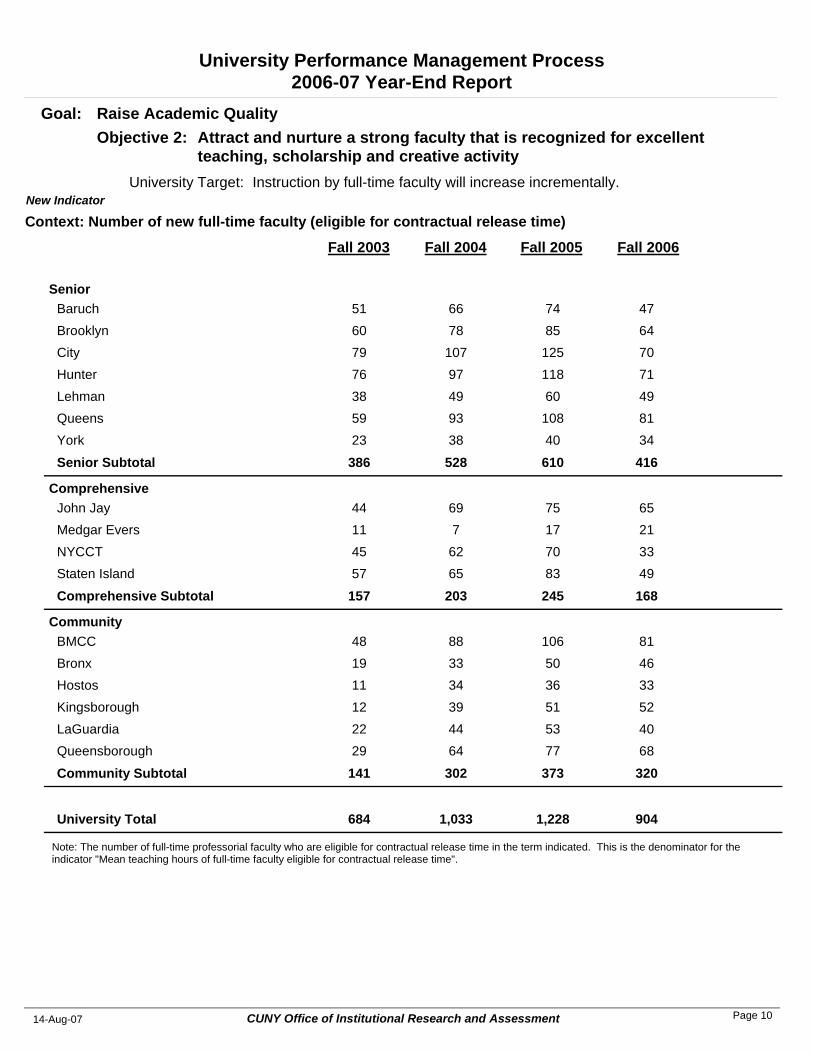
Context: Number of new full-time faculty (eligible for contractual release time)New Indicator
Fall 2003
SeniorBaruch 66 74 4751Brooklyn 78 85 6460City 107 125 7079Hunter 97 118 7176Lehman 49 60 4938Queens 93 108 8159York 38 40 3423
Senior Subtotal 528 610 416386
ComprehensiveJohn Jay 69 75 6544Medgar Evers 7 17 2111NYCCT 62 70 3345Staten Island 65 83 4957
Comprehensive Subtotal 203 245 168157
CommunityBMCC 88 106 8148Bronx 33 50 4619Hostos 34 36 3311Kingsborough 39 51 5212LaGuardia 44 53 4022Queensborough 64 77 6829
Community Subtotal 302 373 320141
University Total 1,033 1,228 904684
Note: The number of full-time professorial faculty who are eligible for contractual release time in the term indicated. This is the denominator for the indicator "Mean teaching hours of full-time faculty eligible for contractual release time".
CUNY Office of Institutional Research and Assessment14-Aug-07 Page 10
University Performance Management Process2006-07 Year-End Report
Instruction by full-time faculty will increase incrementally.University Target:
Attract and nurture a strong faculty that is recognized for excellent teaching, scholarship and creative activity
Objective 2: Goal: Raise Academic Quality
Fall 2004 Fall 2005 Fall 2006
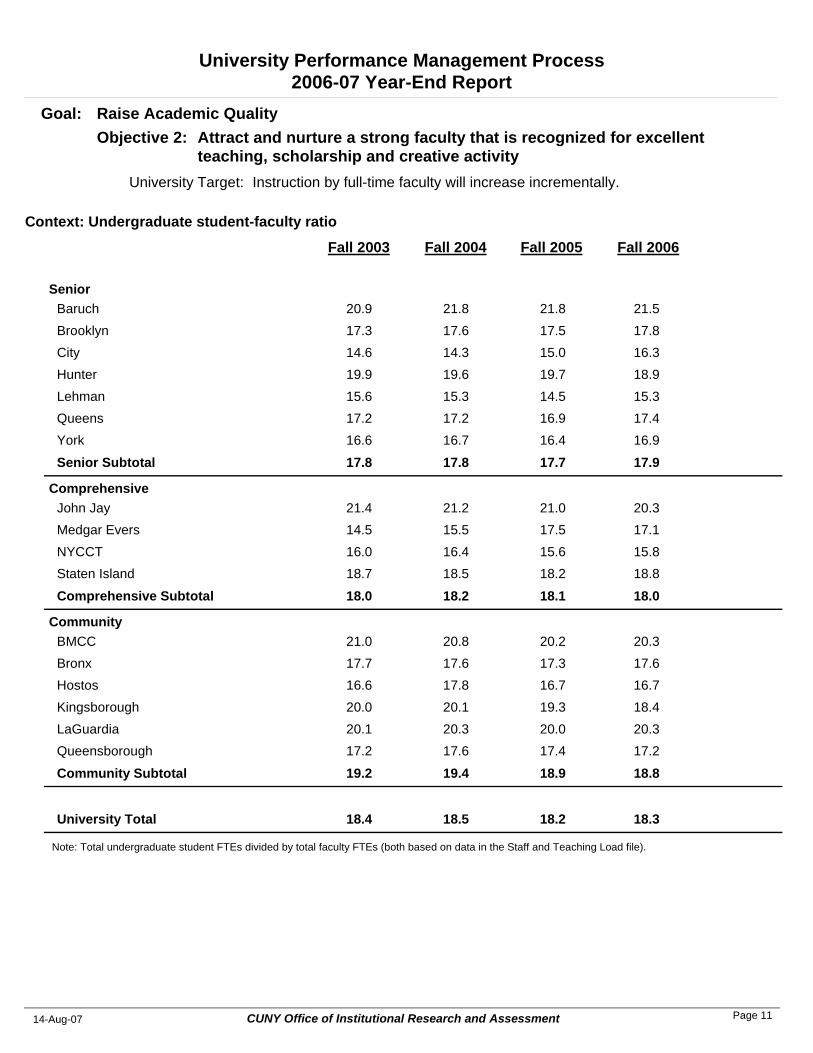
Context: Undergraduate student-faculty ratio
Fall 2003
SeniorBaruch 21.8 21.8 21.520.9Brooklyn 17.6 17.5 17.817.3City 14.3 15.0 16.314.6Hunter 19.6 19.7 18.919.9Lehman 15.3 14.5 15.315.6Queens 17.2 16.9 17.417.2York 16.7 16.4 16.916.6
Senior Subtotal 17.8 17.7 17.917.8
ComprehensiveJohn Jay 21.2 21.0 20.321.4Medgar Evers 15.5 17.5 17.114.5NYCCT 16.4 15.6 15.816.0Staten Island 18.5 18.2 18.818.7
Comprehensive Subtotal 18.2 18.1 18.018.0
CommunityBMCC 20.8 20.2 20.321.0Bronx 17.6 17.3 17.617.7Hostos 17.8 16.7 16.716.6Kingsborough 20.1 19.3 18.420.0LaGuardia 20.3 20.0 20.320.1Queensborough 17.6 17.4 17.217.2
Community Subtotal 19.4 18.9 18.819.2
University Total 18.5 18.2 18.318.4
Note: Total undergraduate student FTEs divided by total faculty FTEs (both based on data in the Staff and Teaching Load file).
CUNY Office of Institutional Research and Assessment14-Aug-07 Page 11
University Performance Management Process2006-07 Year-End Report
Instruction by full-time faculty will increase incrementally.University Target:
Attract and nurture a strong faculty that is recognized for excellent teaching, scholarship and creative activity
Objective 2: Goal: Raise Academic Quality
Fall 2004 Fall 2005 Fall 2006
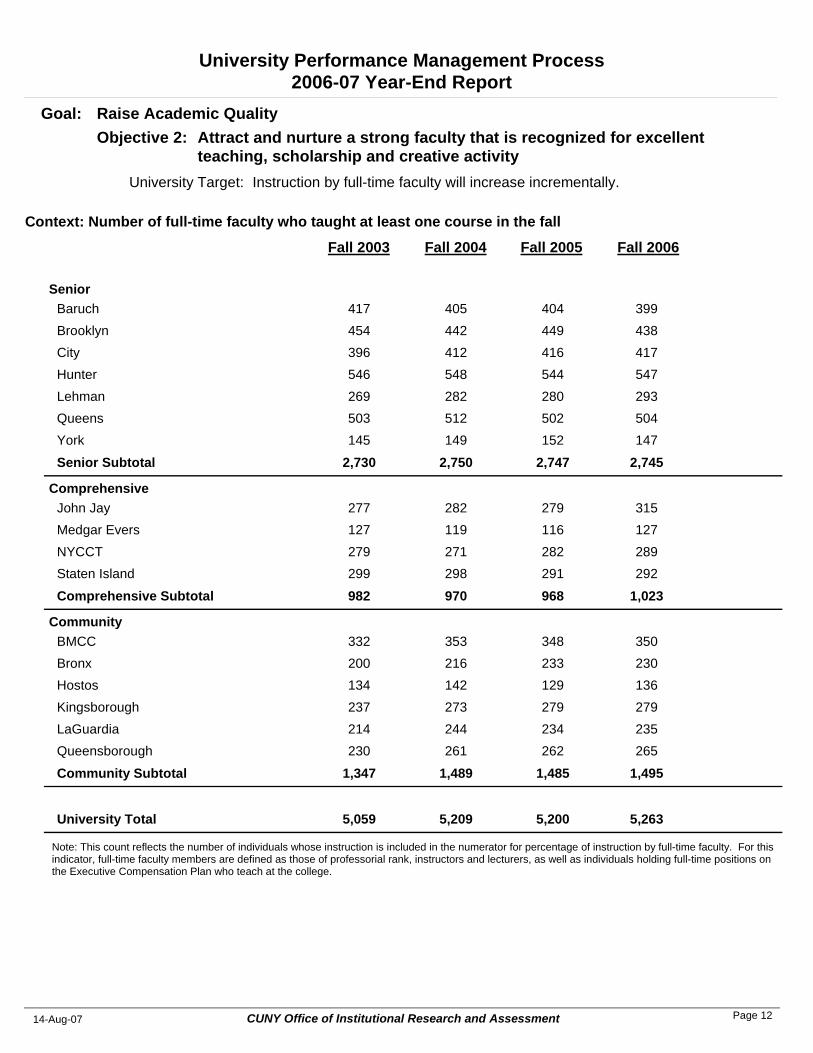
Context: Number of full-time faculty who taught at least one course in the fall
Fall 2003
SeniorBaruch 405 404 399417Brooklyn 442 449 438454City 412 416 417396Hunter 548 544 547546Lehman 282 280 293269Queens 512 502 504503York 149 152 147145
Senior Subtotal 2,750 2,747 2,7452,730
ComprehensiveJohn Jay 282 279 315277Medgar Evers 119 116 127127NYCCT 271 282 289279Staten Island 298 291 292299
Comprehensive Subtotal 970 968 1,023982
CommunityBMCC 353 348 350332Bronx 216 233 230200Hostos 142 129 136134Kingsborough 273 279 279237LaGuardia 244 234 235214Queensborough 261 262 265230
Community Subtotal 1,489 1,485 1,4951,347
University Total 5,209 5,200 5,2635,059
Note: This count reflects the number of individuals whose instruction is included in the numerator for percentage of instruction by full-time faculty. For this indicator, full-time faculty members are defined as those of professorial rank, instructors and lecturers, as well as individuals holding full-time positions on the Executive Compensation Plan who teach at the college.
CUNY Office of Institutional Research and Assessment14-Aug-07 Page 12
University Performance Management Process2006-07 Year-End Report
Instruction by full-time faculty will increase incrementally.University Target:
Attract and nurture a strong faculty that is recognized for excellent teaching, scholarship and creative activity
Objective 2: Goal: Raise Academic Quality
Fall 2004 Fall 2005 Fall 2006
Context: Number of full-time faculty
Fall 2003
SeniorBaruch 439 439 448439Brooklyn 483 494 488485City 498 502 491489Hunter 606 610 607585Lehman 318 306 327293Queens 567 559 566546York 155 164 160146
Senior Subtotal 3,066 3,074 3,0842,983
ComprehensiveJohn Jay 322 323 359309Medgar Evers 123 132 136139NYCCT 280 289 297279Staten Island 308 306 306312
Comprehensive Subtotal 1,033 1,050 1,0981,039
CommunityBMCC 357 352 348337Bronx 236 251 245209Hostos 146 137 146136Kingsborough 287 295 292247LaGuardia 250 244 248210Queensborough 270 275 270238
Community Subtotal 1,546 1,554 1,5491,377
University Total 5,645 5,678 5,7315,399
Note: This indicator excludes graduate assistants, counselors and librarians, full-time faculty on unpaid leave and individuals on the Executive Compensation Plan even if they teach undergraduate or graduate courses at the college.
CUNY Office of Institutional Research and Assessment14-Aug-07 Page 13

University Performance Management Process2006-07 Year-End Report
Instruction by full-time faculty will increase incrementally.University Target:
Attract and nurture a strong faculty that is recognized for excellent teaching, scholarship and creative activity
Objective 2: Goal: Raise Academic Quality
Fall 2004 Fall 2005 Fall 2006
Context: Number of FTE part-time faculty
Fall 2003
SeniorBaruch 183 183 193182Brooklyn 185 205 231155City 188 202 212174Hunter 260 286 313262Lehman 183 209 196160Queens 252 275 285219York 109 115 10996
Senior Subtotal 1,360 1,475 1,5391,248
ComprehensiveJohn Jay 250 274 289220Medgar Evers 76 84 9881NYCCT 264 284 298251Staten Island 200 206 215188
Comprehensive Subtotal 790 848 900740
CommunityBMCC 289 311 304301Bronx 116 121 121126Hostos 62 72 7261Kingsborough 180 187 192203LaGuardia 236 220 227239Queensborough 186 198 208224
Community Subtotal 1,069 1,109 1,1241,154
University Total 3,219 3,432 3,5633,142
Note: Number of teaching hours of adjuncts divided by 13.5.
CUNY Office of Institutional Research and Assessment14-Aug-07 Page 14
University Performance Management Process2006-07 Year-End Report
Instruction by full-time faculty will increase incrementally.University Target:
Attract and nurture a strong faculty that is recognized for excellent teaching, scholarship and creative activity
Objective 2: Goal: Raise Academic Quality
Fall 2004 Fall 2005 Fall 2006
Context: Number of full-time professional and executive staff
Fall 2003
SeniorBaruch 227 240 257225Brooklyn 243 242 245240City 296 308 318294Hunter 440 464 460438Lehman 193 195 199185Queens 283 283 289294York 111 118 118102
Senior Subtotal 1,793 1,850 1,8861,778
ComprehensiveJohn Jay 155 161 181148Medgar Evers 131 130 157134NYCCT 182 172 172180Staten Island 168 172 178162
Comprehensive Subtotal 636 635 688624
CommunityBMCC 173 182 195149Bronx 151 152 155132Hostos 117 114 11993Kingsborough 165 169 182144LaGuardia 227 234 245204Queensborough 156 167 168138
Community Subtotal 989 1,018 1,064860
University Total 3,418 3,503 3,6383,262
Note: Includes individuals on the executive compensation plan and personnel in full-time professional titles.
CUNY Office of Institutional Research and Assessment14-Aug-07 Page 15
University Performance Management Process2006-07 Year-End Report
Colleges will implement approved CUE plans, make progress on Campaign for Success indicators, and use outcomes to drive improvements in teaching and support.
University Target:
Ensure that all students receive a solid general education and effective support, particularly in the first 60 credits of study
Objective 3: Goal: Improve Student Success
Fall 2005 Fall 2006
Percentage of students passing core courses with C or better
SeniorBaruch 73.8 74.6Brooklyn 79.4 76.6City 83.2 83.2Hunter 85.0 85.3Lehman 83.9 82.5Queens 86.6 87.0York 76.8 72.0
Senior Subtotal 80.6 80.3
ComprehensiveJohn Jay 74.4 73.6Medgar Evers 67.5 74.9NYCCT 69.2 68.2Staten Island 85.5 84.9
Comprehensive Subtotal 74.4 74.6
CommunityBMCC 81.7 79.8Bronx 74.9 73.5Hostos 76.0 78.6Kingsborough 83.8 82.4LaGuardia 72.6 76.6Queensborough 77.5 74.7
Community Subtotal 78.6 78.2
University Total 78.0 77.8
Note: Based on students enrolled in the fall and completing freshman composition and credit-bearing math courses through pre-calculus. Students are counted once for each core course in a given semester.
CUNY Office of Institutional Research and Assessment14-Aug-07 Page 16
University Performance Management Process2006-07 Year-End Report
Colleges will implement approved CUE plans, make progress on Campaign for Success indicators, and use outcomes to drive improvements in teaching and support.
University Target:
Ensure that all students receive a solid general education and effective support, particularly in the first 60 credits of study
Objective 3: Goal: Improve Student Success
Fall 2003 Fall 2004 Fall 2005
Percentage of freshmen and transfers taking one or more courses the summer after entry
Fall 2002
SeniorBaruch 42.8 44.0 40.745.7Brooklyn 32.9 33.7 33.838.6City 31.0 33.5 28.032.3Hunter 33.3 31.6 28.731.5Lehman 26.1 32.1 28.426.6Queens 35.7 34.0 31.438.5York 20.8 21.7 16.326.1
Senior Subtotal 33.3 34.1 30.935.5
ComprehensiveJohn Jay 19.6 19.5 20.321.5Medgar Evers 27.0 21.7 22.231.5NYCCT 24.1 27.7 25.826.2Staten Island 17.5 16.0 17.216.8
Comprehensive Subtotal 21.0 21.0 21.322.6
CommunityBMCC 18.7 19.6 18.326.5Bronx 29.4 25.6 22.728.3Hostos 17.4 18.3 19.520.4Kingsborough NA NA NANALaGuardia NA NA NANAQueensborough 19.8 19.3 22.326.6
Community Subtotal 20.9 20.6 20.426.2
University Total 26.5 26.8 25.629.3
Note: Based on a fall cohort of first-time freshmen and transfers still enrolled in the college of entry the following spring. Colleges are credited for students taking one or more summer courses at any CUNY college. Data for Kingsborough and LaGuardia are not available at this time. Therefore, the community college and university averages are not shown.
CUNY Office of Institutional Research and Assessment14-Aug-07 Page 17
University Performance Management Process2006-07 Year-End Report
Colleges will implement approved CUE plans, make progress on Campaign for Success indicators, and use outcomes to drive improvements in teaching and support.
University Target:
Ensure that all students receive a solid general education and effective support, particularly in the first 60 credits of study
Objective 3: Goal: Improve Student Success
Fall 2004 Fall 2005 Fall 2006Baccalaureate Programs
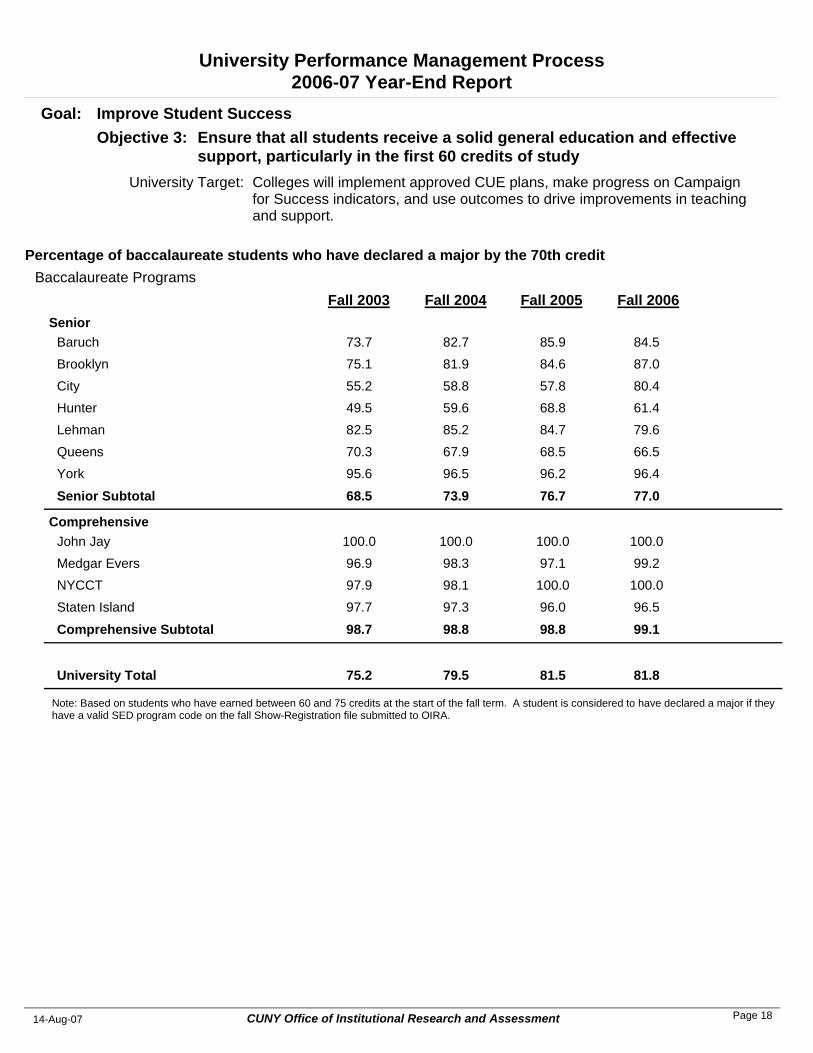
Percentage of baccalaureate students who have declared a major by the 70th credit
Fall 2003Senior
Baruch 82.7 85.9 84.573.7Brooklyn 81.9 84.6 87.075.1City 58.8 57.8 80.455.2Hunter 59.6 68.8 61.449.5Lehman 85.2 84.7 79.682.5Queens 67.9 68.5 66.570.3York 96.5 96.2 96.495.6
Senior Subtotal 73.9 76.7 77.068.5
ComprehensiveJohn Jay 100.0 100.0 100.0100.0Medgar Evers 98.3 97.1 99.296.9NYCCT 98.1 100.0 100.097.9Staten Island 97.3 96.0 96.597.7
Comprehensive Subtotal 98.8 98.8 99.198.7
University Total 79.5 81.5 81.875.2
Note: Based on students who have earned between 60 and 75 credits at the start of the fall term. A student is considered to have declared a major if they have a valid SED program code on the fall Show-Registration file submitted to OIRA.
CUNY Office of Institutional Research and Assessment14-Aug-07 Page 18
University Performance Management Process2006-07 Year-End Report
Colleges will implement approved CUE plans, make progress on Campaign for Success indicators, and use outcomes to drive improvements in teaching and support.
University Target:
Ensure that all students receive a solid general education and effective support, particularly in the first 60 credits of study
Objective 3: Goal: Improve Student Success
Fall 2004 Fall 2005 Fall 2006Baccalaureate Programs
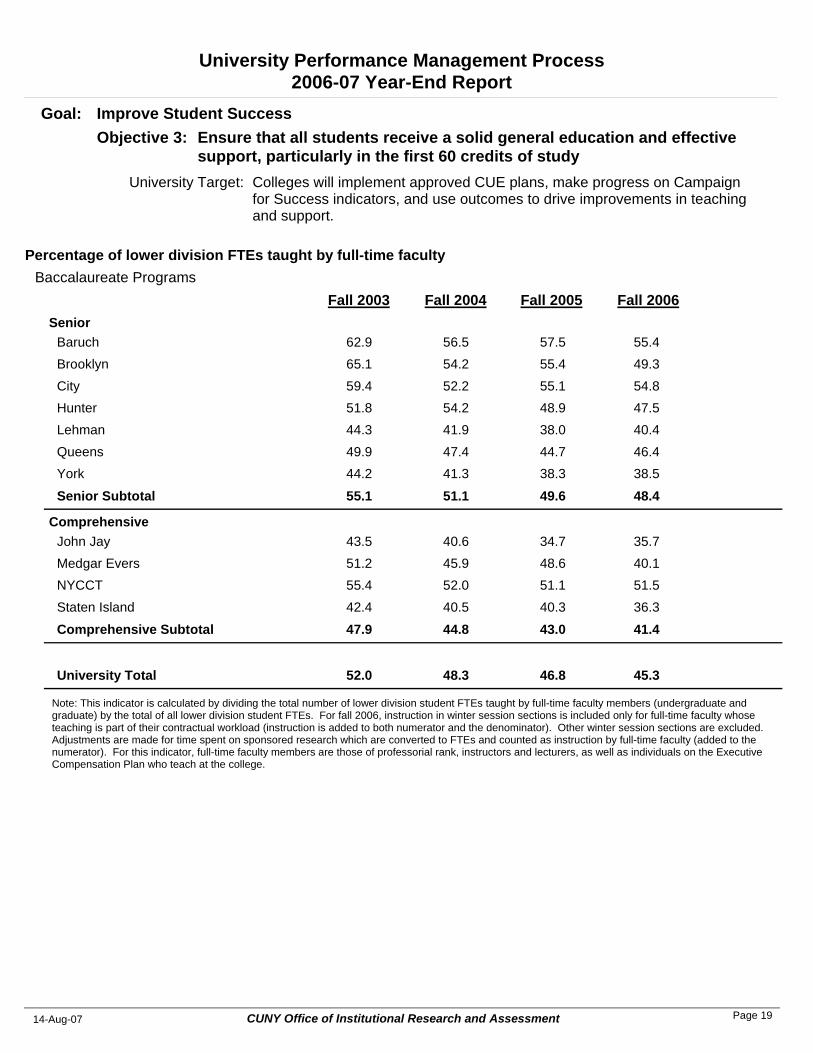
Percentage of lower division FTEs taught by full-time faculty
Fall 2003Senior
Baruch 56.5 57.5 55.462.9Brooklyn 54.2 55.4 49.365.1City 52.2 55.1 54.859.4Hunter 54.2 48.9 47.551.8Lehman 41.9 38.0 40.444.3Queens 47.4 44.7 46.449.9York 41.3 38.3 38.544.2
Senior Subtotal 51.1 49.6 48.455.1
ComprehensiveJohn Jay 40.6 34.7 35.743.5Medgar Evers 45.9 48.6 40.151.2NYCCT 52.0 51.1 51.555.4Staten Island 40.5 40.3 36.342.4
Comprehensive Subtotal 44.8 43.0 41.447.9
University Total 48.3 46.8 45.352.0
Note: This indicator is calculated by dividing the total number of lower division student FTEs taught by full-time faculty members (undergraduate and graduate) by the total of all lower division student FTEs. For fall 2006, instruction in winter session sections is included only for full-time faculty whose teaching is part of their contractual workload (instruction is added to both numerator and the denominator). Other winter session sections are excluded. Adjustments are made for time spent on sponsored research which are converted to FTEs and counted as instruction by full-time faculty (added to the numerator). For this indicator, full-time faculty members are those of professorial rank, instructors and lecturers, as well as individuals on the Executive Compensation Plan who teach at the college.
CUNY Office of Institutional Research and Assessment14-Aug-07 Page 19
University Performance Management Process2006-07 Year-End Report
Colleges will implement approved CUE plans, make progress on Campaign for Success indicators, and use outcomes to drive improvements in teaching and support.
University Target:
Ensure that all students receive a solid general education and effective support, particularly in the first 60 credits of study
Objective 3: Goal: Improve Student Success
Fall 2003 Fall 2004 Fall 2005Baccalaureate Programs
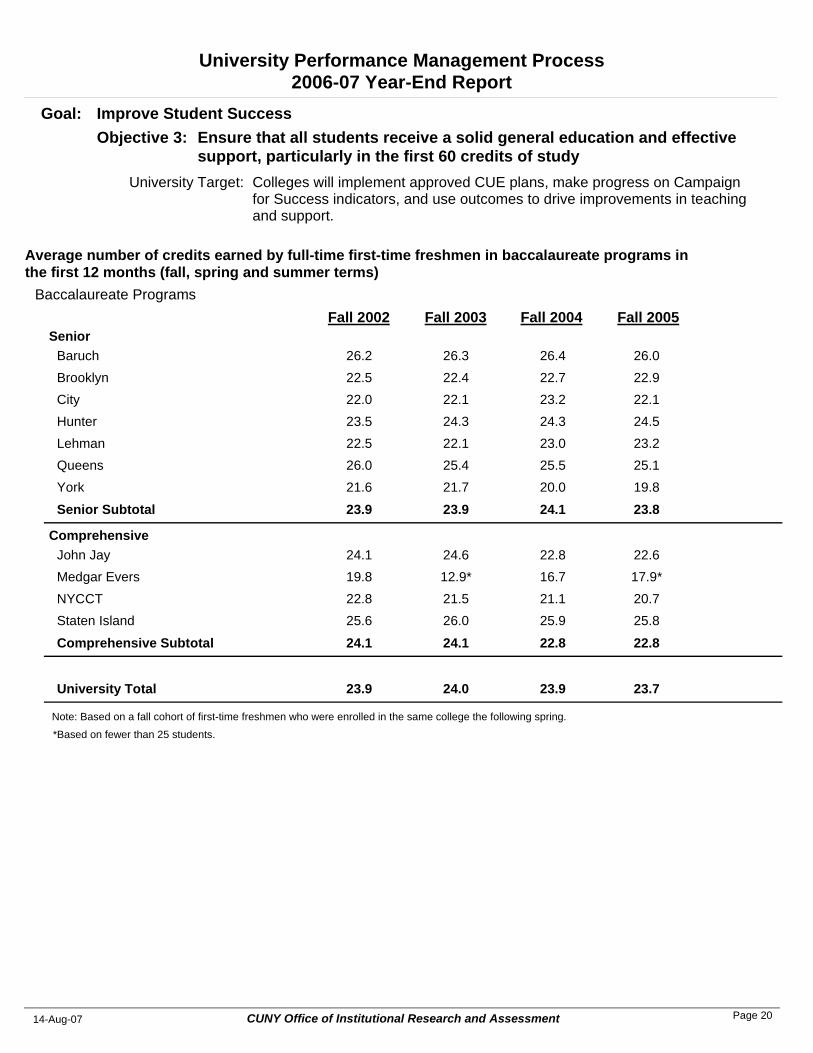
Average number of credits earned by full-time first-time freshmen in baccalaureate programs in the first 12 months (fall, spring and summer terms)
Fall 2002Senior
Baruch 26.3 26.4 26.026.2Brooklyn 22.4 22.7 22.922.5City 22.1 23.2 22.122.0Hunter 24.3 24.3 24.523.5Lehman 22.1 23.0 23.222.5Queens 25.4 25.5 25.126.0York 21.7 20.0 19.821.6
Senior Subtotal 23.9 24.1 23.823.9
ComprehensiveJohn Jay 24.6 22.8 22.624.1Medgar Evers 12.9* 16.7 17.9*19.8NYCCT 21.5 21.1 20.722.8Staten Island 26.0 25.9 25.825.6
Comprehensive Subtotal 24.1 22.8 22.824.1
University Total 24.0 23.9 23.723.9
Note: Based on a fall cohort of first-time freshmen who were enrolled in the same college the following spring.
*Based on fewer than 25 students.
CUNY Office of Institutional Research and Assessment14-Aug-07 Page 20
University Performance Management Process2006-07 Year-End Report
Colleges will draw upon degree and Adult and Continuing Education resources to improve basic skills and ESL outcomes CUNY-wide.
University Target:
Ensure that all students receive a solid general education and effective support, particularly in the first 60 credits of study
Objective 3: Goal: Improve Student Success
Entering Class of Fall 2003
Entering Class of Fall 2004
Entering Class of Fall 2005
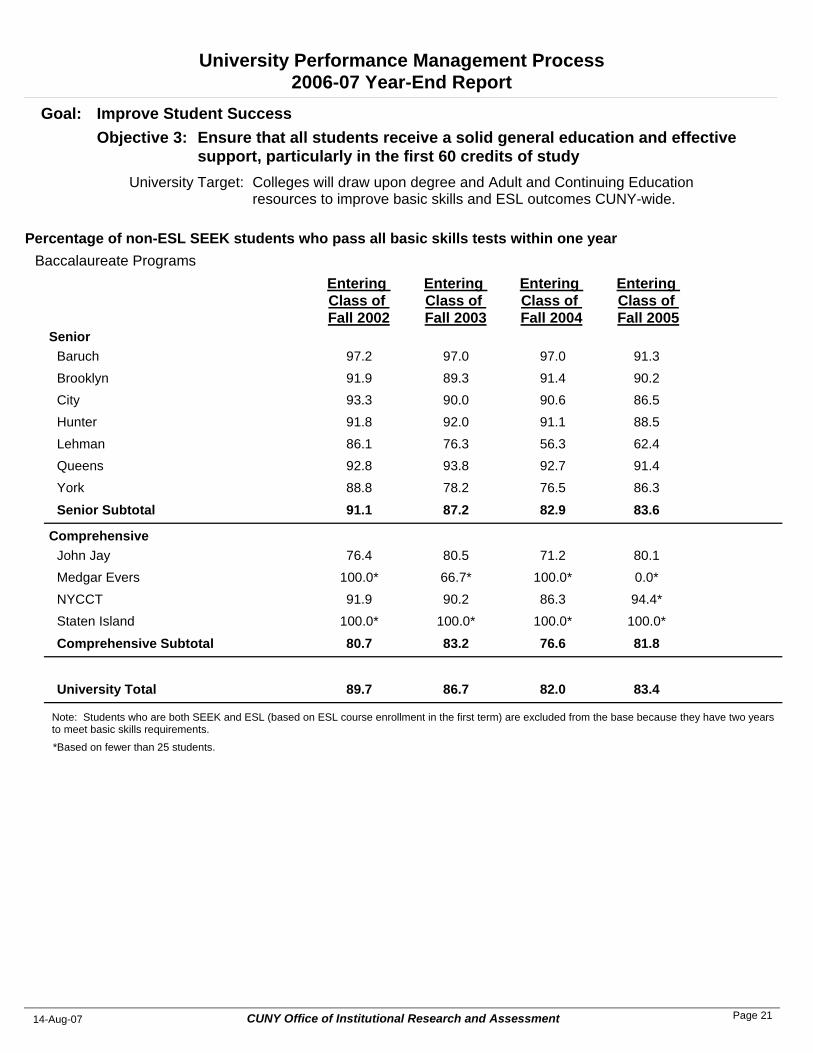
Baccalaureate ProgramsPercentage of non-ESL SEEK students who pass all basic skills tests within one year
Entering Class of Fall 2002
SeniorBaruch 97.0 97.0 91.397.2Brooklyn 89.3 91.4 90.291.9City 90.0 90.6 86.593.3Hunter 92.0 91.1 88.591.8Lehman 76.3 56.3 62.486.1Queens 93.8 92.7 91.492.8York 78.2 76.5 86.388.8
Senior Subtotal 87.2 82.9 83.691.1
ComprehensiveJohn Jay 80.5 71.2 80.176.4Medgar Evers 66.7* 100.0* 0.0*100.0*NYCCT 90.2 86.3 94.4*91.9Staten Island 100.0* 100.0* 100.0*100.0*
Comprehensive Subtotal 83.2 76.6 81.880.7
University Total 86.7 82.0 83.489.7
Note: Students who are both SEEK and ESL (based on ESL course enrollment in the first term) are excluded from the base because they have two years to meet basic skills requirements.
*Based on fewer than 25 students.
CUNY Office of Institutional Research and Assessment14-Aug-07 Page 21
University Performance Management Process2006-07 Year-End Report
Colleges will draw upon degree and Adult and Continuing Education resources to improve basic skills and ESL outcomes CUNY-wide.
University Target:
Ensure that all students receive a solid general education and effective support, particularly in the first 60 credits of study
Objective 3: Goal: Improve Student Success
Entering Class of Fall 2003
Entering Class of Fall 2004
Entering Class of Fall 2005
Baccalaureate ProgramsContext: Number of non-ESL SEEK students
Entering Class of Fall 2002
SeniorBaruch 164 200 46143Brooklyn 178 174 225160City 221 255 281194Hunter 212 169 52158Lehman 333 325 218288Queens 195 232 175139York 147 187 139152
Senior Subtotal 1,450 1,542 1,1361,234
ComprehensiveJohn Jay 123 177 141140Medgar Evers 6 5 12NYCCT 61 80 1837Staten Island 1 3 58
Comprehensive Subtotal 191 265 165187
University Total 1,641 1,807 1,3011,421
Note: Students who are both SEEK and ESL (based on ESL course enrollment in the first term) are excluded.
CUNY Office of Institutional Research and Assessment14-Aug-07 Page 22
University Performance Management Process2006-07 Year-End Report
Colleges will draw upon degree and Adult and Continuing Education resources to improve basic skills and ESL outcomes CUNY-wide.
University Target:
Ensure that all students receive a solid general education and effective support, particularly in the first 60 credits of study
Objective 3: Goal: Improve Student Success
Entering Class of Fall 2002
Entering Class of Fall 2003
Entering Class of Fall 2004
Baccalaureate ProgramsPercentage of ESL students (SEEK and regular) who pass all basic skills tests within two years
Entering Class of Fall 2001
SeniorBaruch 84.7 89.4 89.480.3Brooklyn 86.4 68.2 83.772.5City 80.0 79.2 86.059.3Hunter 82.3 86.7 81.075.3Lehman 64.7* 78.6 28.991.7*Queens 76.7 77.5 67.368.0York 47.4 62.0 59.668.0
Senior Subtotal 77.5 78.3 72.874.1
ComprehensiveJohn Jay --- 33.3* 33.3*29.2*Medgar Evers 100.0* --- ---100.0*NYCCT 100.0* 50.0* 61.5*80.0*Staten Island --- 100.0* ------
Comprehensive Subtotal 100.0* 45.5* 46.445.7
University Total 77.7 77.4 70.971.2
Note: ESL students are identified as those students enrolled in at least one ESL course in their first term at CUNY, including those in the SEEK program.
*Based on fewer than 25 students.
CUNY Office of Institutional Research and Assessment14-Aug-07 Page 23
University Performance Management Process2006-07 Year-End Report
Colleges will draw upon degree and Adult and Continuing Education resources to improve basic skills and ESL outcomes CUNY-wide.
University Target:
Ensure that all students receive a solid general education and effective support, particularly in the first 60 credits of study
Objective 3: Goal: Improve Student Success
Entering Class of Fall 2002
Entering Class of Fall 2003
Entering Class of Fall 2004
Baccalaureate ProgramsContext: Number of ESL students (SEEK and regular)
Entering Class of Fall 2001
SeniorBaruch 59 66 4761Brooklyn 59 44 4340City 65 72 8627Hunter 62 60 5889Lehman 17 28 4524Queens 60 71 5250York 38 50 4725
Senior Subtotal 360 391 378316
ComprehensiveJohn Jay 0 6 1524Medgar Evers 2 0 01NYCCT 1 4 1310Staten Island 0 1 00
Comprehensive Subtotal 3 11 2835
University Total 363 402 406351
Note: ESL students are identified as those students enrolled in at least one ESL course in their first term at CUNY, including those in the SEEK program.
CUNY Office of Institutional Research and Assessment14-Aug-07 Page 24
University Performance Management Process2006-07 Year-End Report
Colleges will draw upon degree and Adult and Continuing Education resources to improve basic skills and ESL outcomes CUNY-wide.
University Target:
Ensure that all students receive a solid general education and effective support, particularly in the first 60 credits of study
Objective 3: Goal: Improve Student Success
Fall 2004 Fall 2005 Fall 2006Associate Programs
Pass rate in reading on exit from remediation
Fall 2003Comprehensive
John Jay 74.8 56.1 69.076.7Medgar Evers 70.3 50.9 65.472.6NYCCT 70.3 54.2 64.673.2Staten Island 69.3 58.5 61.071.8
Comprehensive Subtotal 71.0 55.7 64.773.4
CommunityBMCC 65.7 53.0 58.769.6Bronx 61.4 54.6 66.167.5Hostos 56.9 38.6 41.655.7Kingsborough 68.7 56.3 60.371.1LaGuardia 66.2 53.6 57.765.3Queensborough 69.3 57.2 53.072.6
Community Subtotal 65.3 53.1 56.167.7
University Total 66.4 53.6 58.269.0
Note: Results for fall 2006 exclude students who took the reading test during the exit period for Ability-to-Benefit purposes and who were not also enrolled in a "last in sequence" development reading course. Beginning in fall 2005, the passing score on the reading exam was raised to 70 from 65. Exit results are based on all scores reported to UAPC between October 1 and December 31 (for fall 2005, the exit period was extended by some colleges as a result of the NYC transit strike).
CUNY Office of Institutional Research and Assessment14-Aug-07 Page 25
University Performance Management Process2006-07 Year-End Report
Colleges will draw upon degree and Adult and Continuing Education resources to improve basic skills and ESL outcomes CUNY-wide.
University Target:
Ensure that all students receive a solid general education and effective support, particularly in the first 60 credits of study
Objective 3: Goal: Improve Student Success
Fall 2004 Fall 2005 Fall 2006Associate Programs
Pass rate in writing on exit from remediation
Fall 2003Comprehensive
John Jay 60.3 65.4 62.154.4Medgar Evers 61.3 55.2 49.455.5NYCCT 52.0 57.3 46.540.2Staten Island 49.8 55.3 56.748.6
Comprehensive Subtotal 54.6 58.5 53.547.4
CommunityBMCC 49.0 59.9 57.847.9Bronx 65.5 55.7 65.750.5Hostos 46.7 35.1 37.235.9Kingsborough 53.3 56.3 49.643.7LaGuardia 57.0 58.4 53.437.2Queensborough 55.9 53.7 46.943.4
Community Subtotal 54.2 55.5 53.343.4
University Total 54.3 56.3 53.444.5
Note: Exit results are based on all scores reported to UAPC between October 1 and December 31 (for fall 2005, the exit period was extended by some colleges as a result of the NYC transit strike).
CUNY Office of Institutional Research and Assessment14-Aug-07 Page 26

University Performance Management Process2006-07 Year-End Report
Colleges will draw upon degree and Adult and Continuing Education resources to improve basic skills and ESL outcomes CUNY-wide.
University Target:
Ensure that all students receive a solid general education and effective support, particularly in the first 60 credits of study
Objective 3: Goal: Improve Student Success
Fall 2004 Fall 2005 Fall 2006Associate Programs
Pass rate in math on exit from remediation
Fall 2003Comprehensive
John Jay 43.0 68.4 51.675.0Medgar Evers 67.5 60.3 63.775.6NYCCT 91.3 90.5 88.088.6Staten Island 63.5 62.2 57.375.1
Comprehensive Subtotal 69.4 69.5 62.280.3
CommunityBMCC 74.3 57.8 60.883.8Bronx 48.0 64.3 55.256.7Hostos 55.9 48.8 51.661.8Kingsborough 49.5 55.9 57.369.7LaGuardia 72.4 76.2 77.966.3Queensborough 66.0 61.3 56.752.4
Community Subtotal 63.9 60.3 60.468.0
University Total 65.0 62.7 60.970.5
Note: Results for fall 2006 exclude students who took the COMPASS algebra test during the exit period for Ability-to-Benefit purposes and who were not also enrolled in a "last in sequence" development math course. Starting in fall 2004, when the COMPASS math assessment was introduced, exit results are based on students who took COMPASS Part 2 or CUNY Math tests during the exit period. Prior results are based on the CUNY math test only. Exit results are based on all scores reported to UAPC between October 1 and December 31 (for fall 2005, the exit period was extended by some colleges as a result of the NYC transit strike).
CUNY Office of Institutional Research and Assessment14-Aug-07 Page 27
University Performance Management Process2006-07 Year-End Report
Colleges will draw upon degree and Adult and Continuing Education resources to improve basic skills and ESL outcomes CUNY-wide.
University Target:
Ensure that all students receive a solid general education and effective support, particularly in the first 60 credits of study
Objective 3: Goal: Improve Student Success
Fall 2004 Fall 2005 Fall 2006Associate Programs
Percentage of associate degree students who have met basic skills proficiency in reading, writing and math by the 30th credit
Fall 2003Comprehensive
John Jay 35.9 30.7 50.944.2Medgar Evers 64.8 63.9 49.156.8NYCCT 89.2 87.3 91.283.4Staten Island 86.9 88.2 89.885.4
Comprehensive Subtotal 75.9 74.1 79.373.9
CommunityBMCC 57.7 57.0 60.155.4Bronx 50.7 57.3 54.546.8Hostos 40.5 49.1 53.634.9Kingsborough 61.0 59.8 59.156.9LaGuardia 55.6 62.9 59.349.5Queensborough 64.3 68.0 70.563.0
Community Subtotal 56.9 59.7 60.153.5
University Total 60.9 62.6 64.058.0
Note: Based on students who have earned between 25 and 35 credits by the start of the fall term. Basic skills proficiency is determined by data from the SKAT database and reflects status at the beginning of the term. Students whose proficiency status is unknown because one or more test/exemption records are missing are excluded from the base.
CUNY Office of Institutional Research and Assessment14-Aug-07 Page 28
University Performance Management Process2006-07 Year-End Report
Show and pass rates on the CUNY Proficiency Exam will rise CUNY-wide.University Target:
Ensure that all students receive a solid general education and effective support, particularly in the first 60 credits of study
Objective 3: Goal: Improve Student Success
Fall 2004 Fall 2005 Fall 2006
Percentage of required invitees who took the CUNY Proficiency Exam (CPE show rate)
Fall 2003
SeniorBaruch 85.7 82.6 82.285.2Brooklyn 80.4 82.1 78.584.1City 76.5 71.9 86.875.7Hunter 78.3 80.4 79.274.7Lehman 70.9 69.1 69.076.6Queens 75.4 72.7 71.781.7York 77.2 75.8 66.170.0
Senior Subtotal 78.1 76.7 76.878.8
ComprehensiveJohn Jay 75.2 70.6 82.572.5Medgar Evers 64.0 65.0 69.868.9NYCCT 81.4 79.8 82.076.3Staten Island 68.2 72.4 73.972.7
Comprehensive Subtotal 73.6 73.0 79.273.1
CommunityBMCC 77.6 76.5 77.057.8Bronx 71.6 64.1 75.676.4Hostos 81.1 79.3 80.079.3Kingsborough 77.3 73.6 74.570.3LaGuardia 79.8 73.4 79.778.6Queensborough 77.8 76.2 78.268.7
Community Subtotal 77.5 74.0 77.168.2
University Total 76.9 75.1 77.575.5
Note: The indicator reflects the percentage of students required to take the CPE for the first time in the fall semester, who took it either that fall or in the subsequent winter or spring administrations.
CUNY Office of Institutional Research and Assessment14-Aug-07 Page 29
University Performance Management Process2006-07 Year-End Report
Show and pass rates on the CUNY Proficiency Exam will rise CUNY-wide.University Target:
Ensure that all students receive a solid general education and effective support, particularly in the first 60 credits of study
Objective 3: Goal: Improve Student Success
Fall 2004 Fall 2005 Fall 2006
Percentage of required test-takers passing the CUNY Proficiency Exam (CPE pass rate)
Fall 2003
SeniorBaruch 94.3 95.7 94.493.0Brooklyn 93.5 95.4 92.690.7City 89.4 90.9 92.288.3Hunter 96.9 96.7 96.193.7Lehman 90.2 90.5 91.684.1Queens 93.7 94.0 93.991.6York 86.4 88.8 87.285.3
Senior Subtotal 93.2 93.9 93.490.4
ComprehensiveJohn Jay 91.9 93.7 91.790.0Medgar Evers 79.5 87.9 82.981.1NYCCT 87.0 89.2 88.483.1Staten Island 91.4 92.4 91.289.4
Comprehensive Subtotal 89.3 91.4 90.187.1
CommunityBMCC 87.4 91.1 87.378.5Bronx 87.9 90.5 89.880.3Hostos 80.1 93.6 91.178.1Kingsborough 88.1 87.8 84.581.7LaGuardia 89.8 91.2 94.685.9Queensborough 90.7 93.9 90.688.4
Community Subtotal 88.3 91.0 89.182.5
University Total 91.0 92.6 91.488.4
Note: The indicator reflects the percentage of students who passed the CPE based on the students counted as test-takers for the CPE show rate. The pass rate reflects the best outcome for tests taken that fall or in the subsequent winter or spring administrations (longitudinal pass rate).
CUNY Office of Institutional Research and Assessment14-Aug-07 Page 30
University Performance Management Process2006-07 Year-End Report
Colleges will work to improve readiness of high school students by meeting 95% of enrollment targets for College Now, achieving a 75% successful completion rate, and implementing College Now strategic plans.
University Target:
Ensure that all students receive a solid general education and effective support, particularly in the first 60 credits of study
Objective 3: Goal: Improve Student Success
2004-05 2005-06 2006-07 estimated
College Now registrations
2003-04
SeniorBaruch 650 911 1,086559Brooklyn 322 372 494228City 1,948 916 1,2953,184Hunter 894 715 854759Lehman 855 1,067 1,2411,164Queens 955 858 1,061926York 3,565 3,281 2,3633,567
Senior Subtotal 9,189 8,120 8,39410,387
ComprehensiveJohn Jay 525 621 9181,323Medgar Evers 735 706 527633NYCCT 1,277 803 9911,503Staten Island 24,961 22,141 22,61518,011
Comprehensive Subtotal 27,498 24,271 25,05121,470
CommunityBMCC 850 728 736693Bronx 1,363 1,517 7011,091Hostos 474 846 1,250341Kingsborough 9,321 9,918 8,96610,376LaGuardia 3,285 3,368 3,5763,279Queensborough 3,192 3,247 3,2993,007
Community Subtotal 18,485 19,624 18,52818,787
University Total 55,185 52,015 51,97350,644
Note: College Now registrations are from the registration database maintained by the Office of Academic Affairs. Registrations for 2005-06 have been revised to reflect final numbers for summer 2005, fall 2005 and spring 2006. Registrations for 2006-07 are estimates because Spring 2007 registrations are not final at this time. Final data for 2006-07 will be provided in next year's report.
CUNY Office of Institutional Research and Assessment14-Aug-07 Page 31
University Performance Management Process2006-07 Year-End Report
Colleges will work to improve readiness of high school students by meeting 95% of enrollment targets for College Now, achieving a 75% successful completion rate, and implementing College Now strategic plans.
University Target:
Ensure that all students receive a solid general education and effective support, particularly in the first 60 credits of study
Objective 3: Goal: Improve Student Success
2004-05 2005-06 Summer & Fall 2006
Percentage of College Now participants who earn an A, B, or C in College Now courses or demonstrate mastery of material in workshops
2003-04
SeniorBaruch 80 89 8881Brooklyn 80 72 8486City 89 90 8390Hunter 73 80 8782Lehman 87 81 9089Queens 79 84 8578York 83 78 7578
Senior Subtotal 83 81 8383
ComprehensiveJohn Jay 80 73 7488Medgar Evers 81 76 6471NYCCT 78 81 8082Staten Island NA NA NA87
Comprehensive Subtotal 79 77 7587
CommunityBMCC 54 80 9678Bronx 80 88 8474Hostos 68 74 8554Kingsborough 85 86 8986LaGuardia 74 76 7873Queensborough 81 87 8675
Community Subtotal 80 84 8681
University Total 81 83 8484
Note: College Now success rates are based on data in the registration database maintained by the Office of Academic Affairs. Last year's summer and fall 2005 success rates have been revised to reflect final 2005-06 success rates (including spring 2006). For the current year, spring 2007 performance data are not yet available so current year success rates are based on summer and fall 2006 only. The comprehensive subtotal and university total exclude the College of Staten Island for 2004-05 and later because data are not available.
CUNY Office of Institutional Research and Assessment14-Aug-07 Page 32
University Performance Management Process2006-07 Year-End Report
Retention rates will increase by an average of 2 percentage points. University Target:
Increase retention and graduation ratesObjective 4: Goal: Improve Student Success
Entering Class of Fall 2003
Entering Class of Fall 2004
Entering Class of Fall 2005
Baccalaureate Programs
One-Year Retention Rate: Percentage of full-time first-time freshmen in baccalaureate programs still enrolled in college of entry one year later
Entering Class of Fall 2002
SeniorBaruch 87.5 87.7 88.287.1Brooklyn 78.6 75.5 78.479.6City 76.9 78.6 79.876.0Hunter 81.5 82.3 80.278.9Lehman 73.8 73.6 76.872.7Queens 81.0 83.8 81.584.6York 68.5 68.8 67.471.4
Senior Subtotal 79.9 80.2 80.280.1
ComprehensiveJohn Jay 75.6 72.7 74.076.6Medgar Evers 63.2* 50.0 61.1*65.6NYCCT 73.3 77.8 77.573.7Staten Island 80.1 82.7 79.381.3
Comprehensive Subtotal 75.8 74.7 75.176.9
University Total 79.3 79.3 79.479.6
Note: Students are counted as retained in the college of entry in the cohort year if they are still enrolled in the college of entry one year later.
*Based on fewer than 25 students.
CUNY Office of Institutional Research and Assessment14-Aug-07 Page 33
University Performance Management Process2006-07 Year-End Report
Retention rates will increase by an average of 2 percentage points. University Target:
Increase retention and graduation ratesObjective 4: Goal: Improve Student Success
Entering Class of Fall 2002
Entering Class of Fall 2003
Entering Class of Fall 2004
Baccalaureate Programs
Two-Year Retention Rate: Percentage of full-time first-time freshmen in baccalaureate programs still enrolled in college of entry two years later
Entering Class of Fall 2001
SeniorBaruch 73.4 77.1 75.074.8Brooklyn 62.1 61.3 64.967.8City 60.7 61.4 62.263.3Hunter 62.0 66.5 66.762.0Lehman 59.0 57.5 59.656.4Queens 71.2 69.4 69.471.9York 49.2 47.3 44.455.0
Senior Subtotal 64.5 65.4 65.466.4
ComprehensiveJohn Jay 60.2 62.8 57.260.9Medgar Evers 59.4 26.3* 50.037.9NYCCT 55.6 51.8 56.350.0Staten Island 68.9 65.4 69.264.8
Comprehensive Subtotal 61.4 60.7 58.660.1
University Total 64.0 64.7 64.265.5
Note: Students are counted as retained in the college of entry in the cohort year if they are still enrolled in the college of entry (or earned the degree pursued from the college of entry) two years later.
*Based on fewer than 25 students.
CUNY Office of Institutional Research and Assessment14-Aug-07 Page 34

University Performance Management Process2006-07 Year-End Report
Retention rates will increase by an average of 2 percentage points. University Target:
Increase retention and graduation ratesObjective 4: Goal: Improve Student Success
Entering Class of Fall 2003
Entering Class of Fall 2004
Entering Class of Fall 2005
Baccalaureate Programs
One-Year Retention Rate: Percentage of full-time transfers into baccalaureate programs still enrolled in college of transfer entry one year later (or earned degree pursued)
Entering Class of Fall 2002
SeniorBaruch 85.2 87.5 85.687.3Brooklyn 73.6 69.6 70.371.9City 68.7 69.6 71.370.6Hunter 66.3 72.3 70.673.4Lehman 69.1 75.9 73.275.7Queens 75.4 73.8 76.276.0York 67.6 66.3 62.267.5
Senior Subtotal 72.7 74.1 73.674.9
ComprehensiveJohn Jay 73.9 74.4 77.973.6Medgar Evers 76.6 62.8 59.047.3NYCCT 72.1 74.7 75.382.9Staten Island 85.3 80.4 75.088.4
Comprehensive Subtotal 76.1 74.5 75.677.3
University Total 73.4 74.2 73.975.4
Note: Students are counted as retained in the college of entry in the cohort year if they are still enrolled one year later in the college into which they transferred (or earned the degree pursued from that college within one year of transfer entry).
CUNY Office of Institutional Research and Assessment14-Aug-07 Page 35
University Performance Management Process2006-07 Year-End Report
Retention rates will increase by an average of 2 percentage points. University Target:
Increase retention and graduation ratesObjective 4: Goal: Improve Student Success
Entering Class of Fall 2002
Entering Class of Fall 2003
Entering Class of Fall 2004
Baccalaureate Programs
Two-Year Retention Rate: Percentage of full-time transfers into baccalaureate programs still enrolled in college of transfer entry two years later (or earned degree pursued)
Entering Class of Fall 2001
SeniorBaruch 77.7 77.4 81.078.7Brooklyn 61.2 60.9 61.660.5City 57.0 55.4 58.260.7Hunter 57.9 56.6 60.657.6Lehman 64.7 61.3 65.166.4Queens 67.3 66.3 65.769.3York 56.9 56.7 56.457.9
Senior Subtotal 63.7 62.5 64.864.7
ComprehensiveJohn Jay 65.8 64.7 62.767.3Medgar Evers 40.0 63.8 43.632.4NYCCT 66.3 59.4 60.063.1Staten Island 75.1 75.3 66.377.4
Comprehensive Subtotal 66.8 66.0 61.568.0
University Total 64.3 63.2 64.365.3
Note: Students are counted as retained in the college of entry in the cohort year if they are still enrolled two years later in the college into which they transferred (or earned the degree pursued from that college within two years of transfer entry).
CUNY Office of Institutional Research and Assessment14-Aug-07 Page 36
University Performance Management Process2006-07 Year-End Report
Retention rates will increase by an average of 2 percentage points. University Target:
Increase retention and graduation ratesObjective 4: Goal: Improve Student Success
Entering Class of Fall 2003
Entering Class of Fall 2004
Entering Class of Fall 2005
Associate Programs
One-Year Retention Rate (institution rate): Percentage of full-time first-time freshmen in associate programs still enrolled in college of entry one-year later
Entering Class of Fall 2002
ComprehensiveJohn Jay 65.3 64.0 62.567.1Medgar Evers 59.5 55.1 54.155.6NYCCT 65.3 58.2 61.066.4Staten Island 63.2 62.6 67.765.5
Comprehensive Subtotal 64.0 60.8 62.565.3
CommunityBMCC 60.2 58.3 59.059.5Bronx 64.6 63.0 63.163.4Hostos 64.4 60.4 58.456.8Kingsborough 65.4 67.3 64.964.2LaGuardia 62.1 63.1 62.161.8Queensborough 67.4 68.3 68.568.1
Community Subtotal 63.5 63.3 62.962.6
University Total 63.7 62.4 62.763.5
Note: Students are counted as retained in the college of entry in the cohort year if they are still enrolled in the college of entry one year after entry. Prelude to Success students are excluded from the base.
CUNY Office of Institutional Research and Assessment14-Aug-07 Page 37
University Performance Management Process2006-07 Year-End Report
Retention rates will increase by an average of 2 percentage points. University Target:
Increase retention and graduation ratesObjective 4: Goal: Improve Student Success
Entering Class of Fall 2003
Entering Class of Fall 2004
Entering Class of Fall 2005
Associate Programs
Context: One-Year Retention Rate (system rate): Percentage of full-time first-time freshmen in associate programs still enrolled in any CUNY college one-year later
Entering Class of Fall 2002
ComprehensiveJohn Jay 69.4 68.7 66.670.7Medgar Evers 64.0 59.5 59.559.2NYCCT 71.4 64.9 67.469.1Staten Island 69.8 71.2 75.170.8
Comprehensive Subtotal 69.6 67.3 68.569.1
CommunityBMCC 63.7 61.0 62.862.5Bronx 67.0 65.0 65.665.4Hostos 66.6 62.4 60.560.4Kingsborough 69.1 69.9 68.967.9LaGuardia 64.5 65.2 64.563.9Queensborough 69.6 71.7 71.070.4
Community Subtotal 66.4 65.9 65.965.4
University Total 67.5 66.4 66.966.7
Note: Students are counted as retained in the college of entry in the cohort year if they are still enrolled at any CUNY college one year after entry. Prelude to Success students are excluded from the base.
CUNY Office of Institutional Research and Assessment14-Aug-07 Page 38
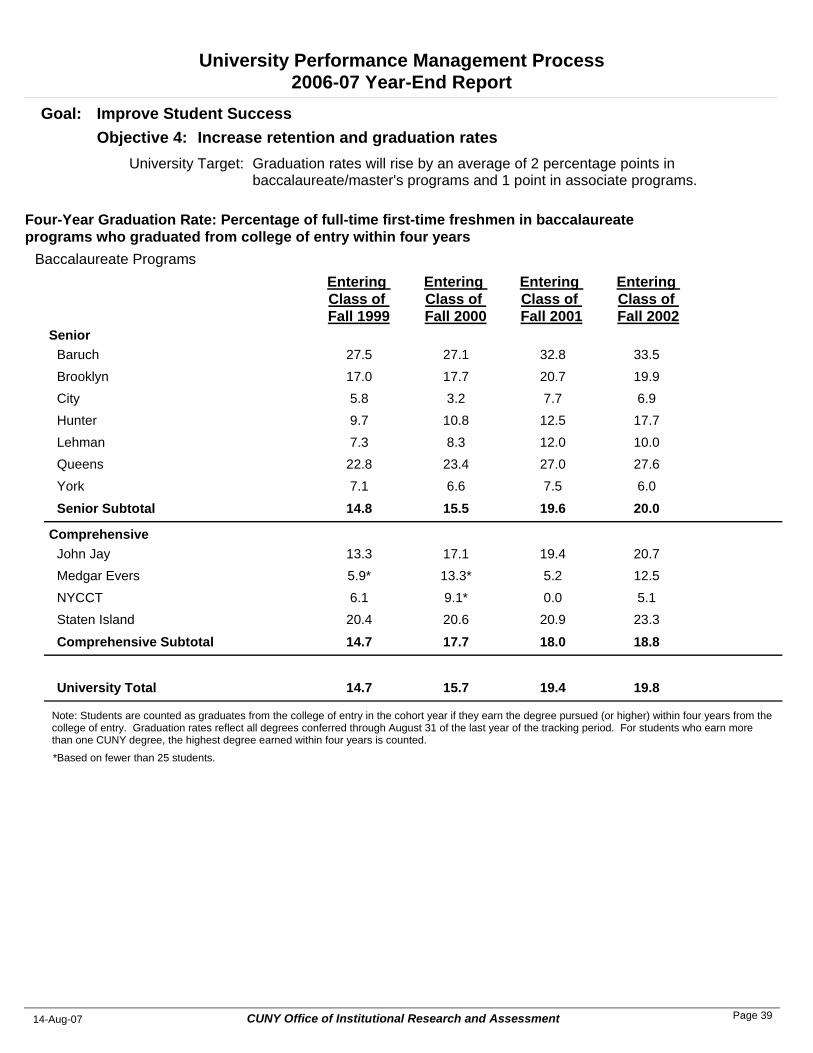
University Performance Management Process2006-07 Year-End Report
Graduation rates will rise by an average of 2 percentage points in baccalaureate/master's programs and 1 point in associate programs.
University Target:
Increase retention and graduation ratesObjective 4: Goal: Improve Student Success
Entering Class of Fall 2000
Entering Class of Fall 2001
Entering Class of Fall 2002
Baccalaureate Programs
Four-Year Graduation Rate: Percentage of full-time first-time freshmen in baccalaureate programs who graduated from college of entry within four years
Entering Class of Fall 1999
SeniorBaruch 27.1 32.8 33.527.5Brooklyn 17.7 20.7 19.917.0City 3.2 7.7 6.95.8Hunter 10.8 12.5 17.79.7Lehman 8.3 12.0 10.07.3Queens 23.4 27.0 27.622.8York 6.6 7.5 6.07.1
Senior Subtotal 15.5 19.6 20.014.8
ComprehensiveJohn Jay 17.1 19.4 20.713.3Medgar Evers 13.3* 5.2 12.55.9*NYCCT 9.1* 0.0 5.16.1Staten Island 20.6 20.9 23.320.4
Comprehensive Subtotal 17.7 18.0 18.814.7
University Total 15.7 19.4 19.814.7
Note: Students are counted as graduates from the college of entry in the cohort year if they earn the degree pursued (or higher) within four years from the college of entry. Graduation rates reflect all degrees conferred through August 31 of the last year of the tracking period. For students who earn more than one CUNY degree, the highest degree earned within four years is counted.
*Based on fewer than 25 students.
CUNY Office of Institutional Research and Assessment14-Aug-07 Page 39
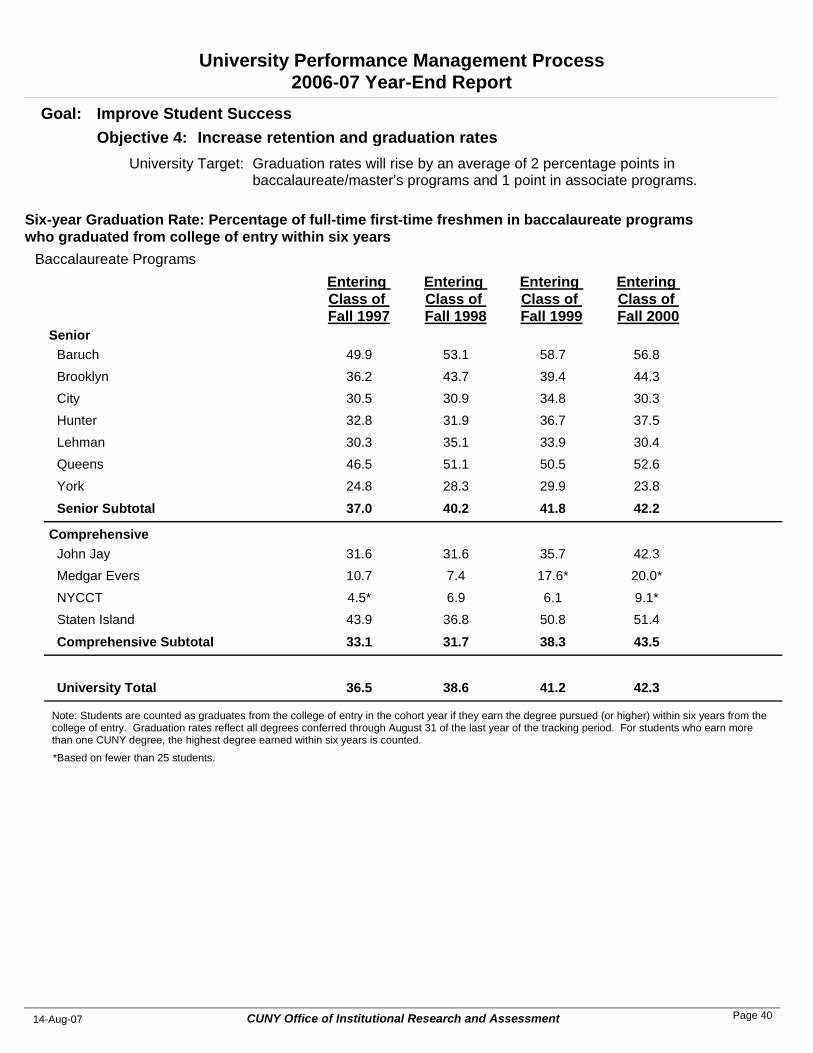
University Performance Management Process2006-07 Year-End Report
Graduation rates will rise by an average of 2 percentage points in baccalaureate/master's programs and 1 point in associate programs.
University Target:
Increase retention and graduation ratesObjective 4: Goal: Improve Student Success
Entering Class of Fall 1998
Entering Class of Fall 1999
Entering Class of Fall 2000
Baccalaureate Programs
Six-year Graduation Rate: Percentage of full-time first-time freshmen in baccalaureate programs who graduated from college of entry within six years
Entering Class of Fall 1997
SeniorBaruch 53.1 58.7 56.849.9Brooklyn 43.7 39.4 44.336.2City 30.9 34.8 30.330.5Hunter 31.9 36.7 37.532.8Lehman 35.1 33.9 30.430.3Queens 51.1 50.5 52.646.5York 28.3 29.9 23.824.8
Senior Subtotal 40.2 41.8 42.237.0
ComprehensiveJohn Jay 31.6 35.7 42.331.6Medgar Evers 7.4 17.6* 20.0*10.7NYCCT 6.9 6.1 9.1*4.5*Staten Island 36.8 50.8 51.443.9
Comprehensive Subtotal 31.7 38.3 43.533.1
University Total 38.6 41.2 42.336.5
Note: Students are counted as graduates from the college of entry in the cohort year if they earn the degree pursued (or higher) within six years from the college of entry. Graduation rates reflect all degrees conferred through August 31 of the last year of the tracking period. For students who earn more than one CUNY degree, the highest degree earned within six years is counted.
*Based on fewer than 25 students.
CUNY Office of Institutional Research and Assessment14-Aug-07 Page 40
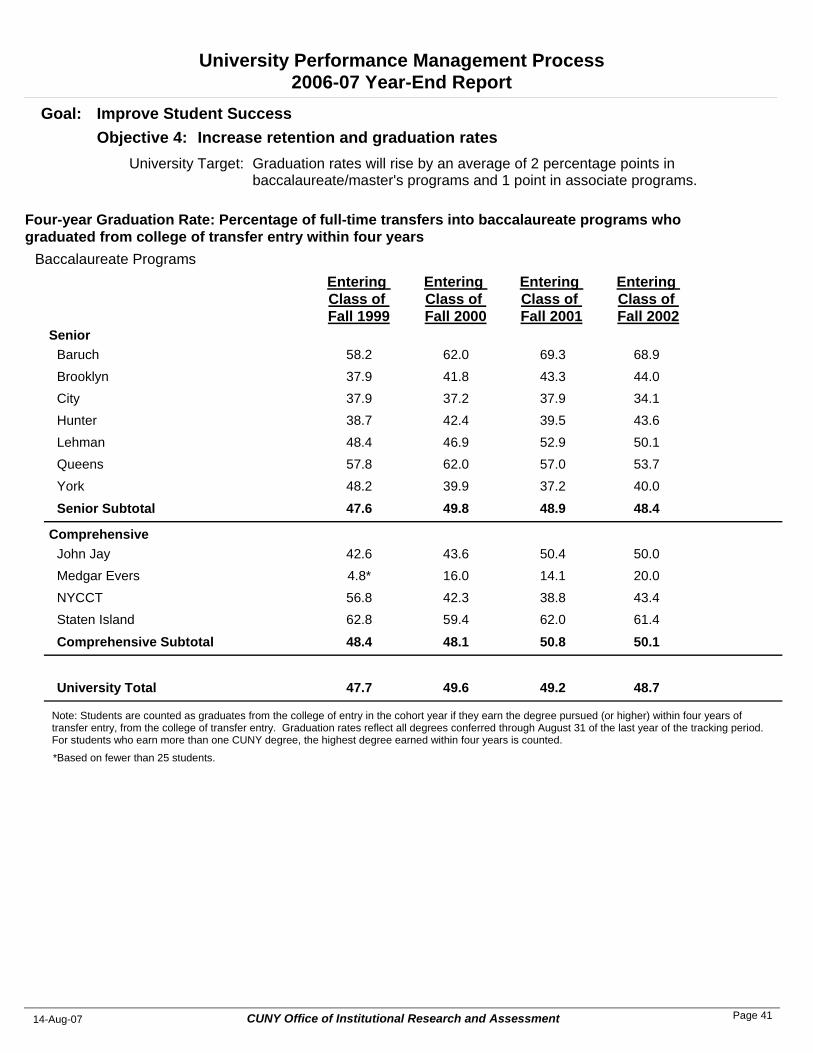
University Performance Management Process2006-07 Year-End Report
Graduation rates will rise by an average of 2 percentage points in baccalaureate/master's programs and 1 point in associate programs.
University Target:
Increase retention and graduation ratesObjective 4: Goal: Improve Student Success
Entering Class of Fall 2000
Entering Class of Fall 2001
Entering Class of Fall 2002
Baccalaureate Programs
Four-year Graduation Rate: Percentage of full-time transfers into baccalaureate programs who graduated from college of transfer entry within four years
Entering Class of Fall 1999
SeniorBaruch 62.0 69.3 68.958.2Brooklyn 41.8 43.3 44.037.9City 37.2 37.9 34.137.9Hunter 42.4 39.5 43.638.7Lehman 46.9 52.9 50.148.4Queens 62.0 57.0 53.757.8York 39.9 37.2 40.048.2
Senior Subtotal 49.8 48.9 48.447.6
ComprehensiveJohn Jay 43.6 50.4 50.042.6Medgar Evers 16.0 14.1 20.04.8*NYCCT 42.3 38.8 43.456.8Staten Island 59.4 62.0 61.462.8
Comprehensive Subtotal 48.1 50.8 50.148.4
University Total 49.6 49.2 48.747.7
Note: Students are counted as graduates from the college of entry in the cohort year if they earn the degree pursued (or higher) within four years of transfer entry, from the college of transfer entry. Graduation rates reflect all degrees conferred through August 31 of the last year of the tracking period. For students who earn more than one CUNY degree, the highest degree earned within four years is counted.
*Based on fewer than 25 students.
CUNY Office of Institutional Research and Assessment14-Aug-07 Page 41
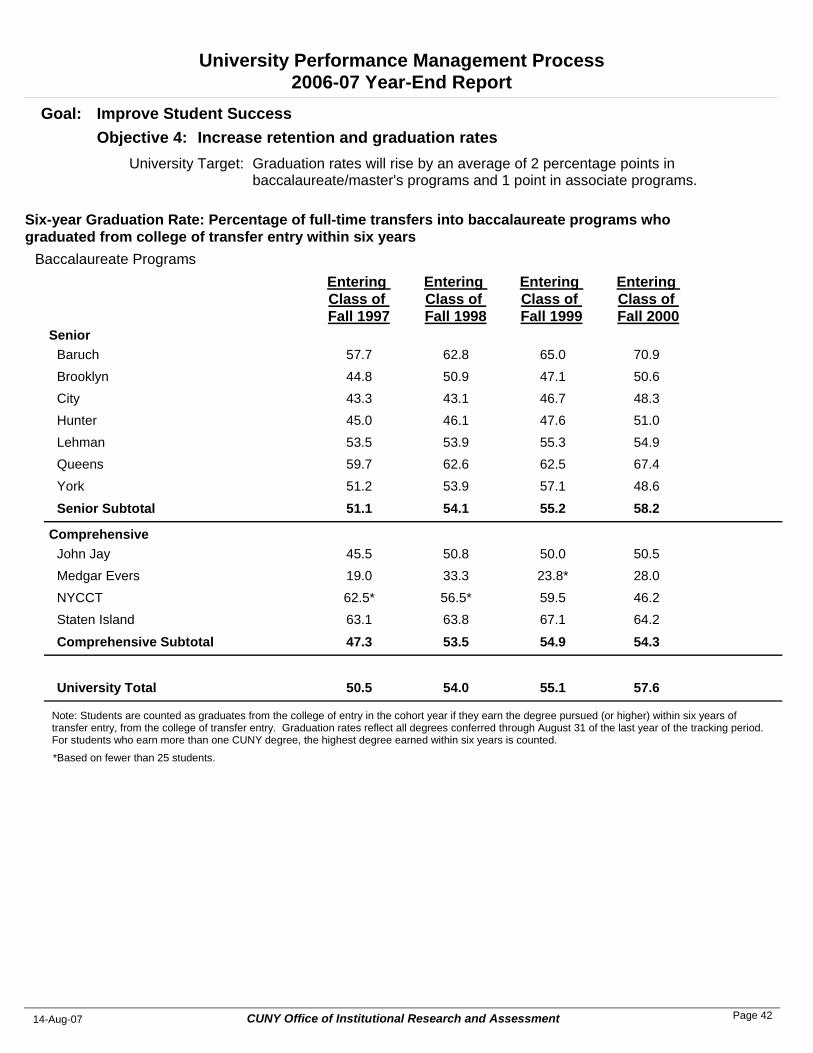
University Performance Management Process2006-07 Year-End Report
Graduation rates will rise by an average of 2 percentage points in baccalaureate/master's programs and 1 point in associate programs.
University Target:
Increase retention and graduation ratesObjective 4: Goal: Improve Student Success
Entering Class of Fall 1998
Entering Class of Fall 1999
Entering Class of Fall 2000
Baccalaureate Programs
Six-year Graduation Rate: Percentage of full-time transfers into baccalaureate programs who graduated from college of transfer entry within six years
Entering Class of Fall 1997
SeniorBaruch 62.8 65.0 70.957.7Brooklyn 50.9 47.1 50.644.8City 43.1 46.7 48.343.3Hunter 46.1 47.6 51.045.0Lehman 53.9 55.3 54.953.5Queens 62.6 62.5 67.459.7York 53.9 57.1 48.651.2
Senior Subtotal 54.1 55.2 58.251.1
ComprehensiveJohn Jay 50.8 50.0 50.545.5Medgar Evers 33.3 23.8* 28.019.0NYCCT 56.5* 59.5 46.262.5*Staten Island 63.8 67.1 64.263.1
Comprehensive Subtotal 53.5 54.9 54.347.3
University Total 54.0 55.1 57.650.5
Note: Students are counted as graduates from the college of entry in the cohort year if they earn the degree pursued (or higher) within six years of transfer entry, from the college of transfer entry. Graduation rates reflect all degrees conferred through August 31 of the last year of the tracking period. For students who earn more than one CUNY degree, the highest degree earned within six years is counted.
*Based on fewer than 25 students.
CUNY Office of Institutional Research and Assessment14-Aug-07 Page 42
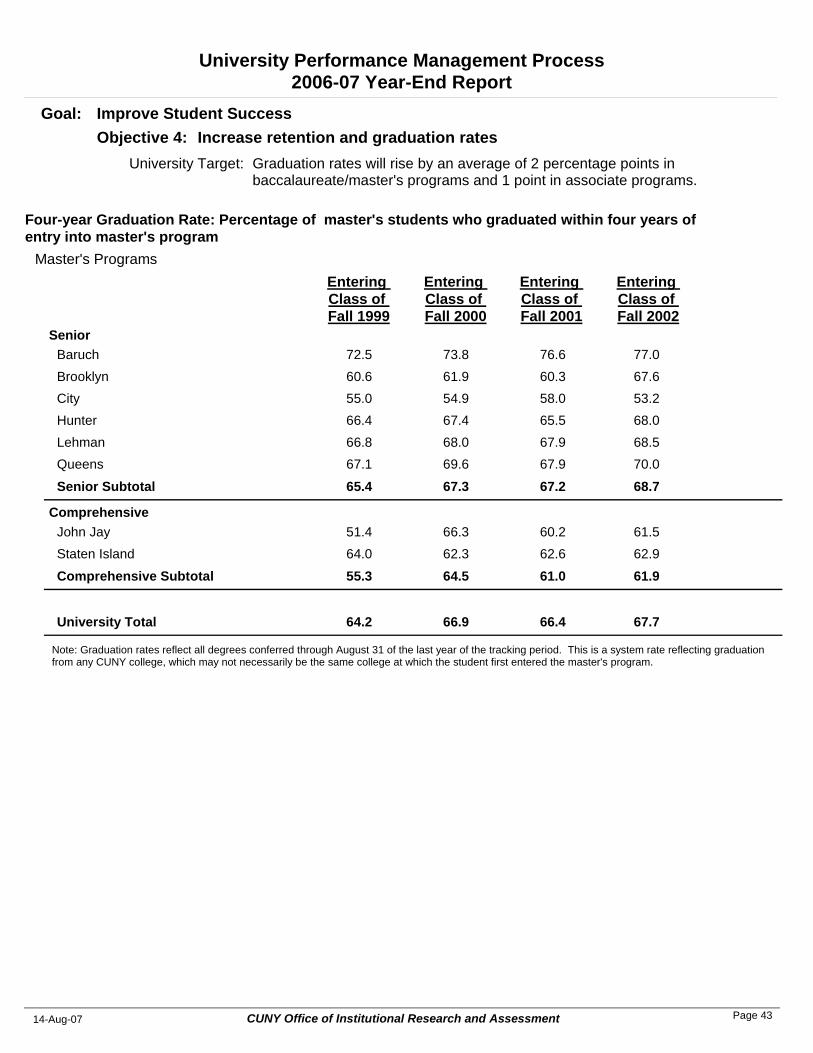
University Performance Management Process2006-07 Year-End Report
Graduation rates will rise by an average of 2 percentage points in baccalaureate/master's programs and 1 point in associate programs.
University Target:
Increase retention and graduation ratesObjective 4: Goal: Improve Student Success
Entering Class of Fall 2000
Entering Class of Fall 2001
Entering Class of Fall 2002
Master's Programs
Four-year Graduation Rate: Percentage of master's students who graduated within four years of entry into master's program
Entering Class of Fall 1999
SeniorBaruch 73.8 76.6 77.072.5Brooklyn 61.9 60.3 67.660.6City 54.9 58.0 53.255.0Hunter 67.4 65.5 68.066.4Lehman 68.0 67.9 68.566.8Queens 69.6 67.9 70.067.1
Senior Subtotal 67.3 67.2 68.765.4
ComprehensiveJohn Jay 66.3 60.2 61.551.4Staten Island 62.3 62.6 62.964.0
Comprehensive Subtotal 64.5 61.0 61.955.3
University Total 66.9 66.4 67.764.2
Note: Graduation rates reflect all degrees conferred through August 31 of the last year of the tracking period. This is a system rate reflecting graduation from any CUNY college, which may not necessarily be the same college at which the student first entered the master's program.
CUNY Office of Institutional Research and Assessment14-Aug-07 Page 43
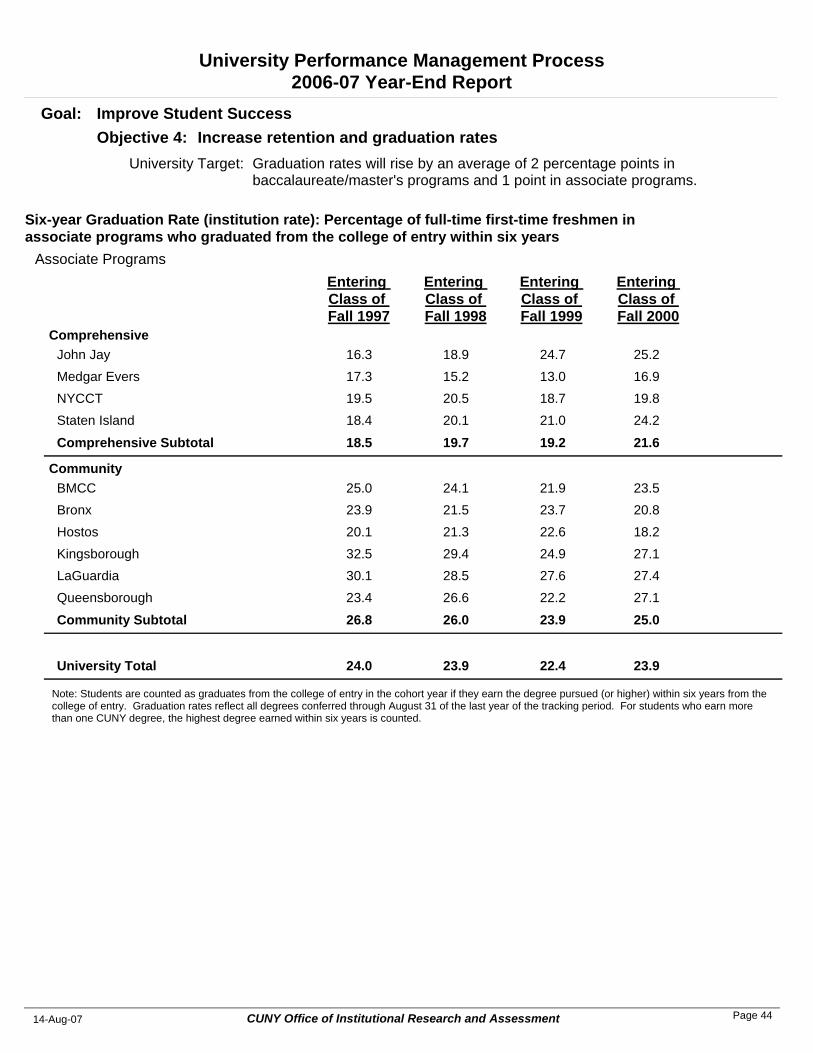
University Performance Management Process2006-07 Year-End Report
Graduation rates will rise by an average of 2 percentage points in baccalaureate/master's programs and 1 point in associate programs.
University Target:
Increase retention and graduation ratesObjective 4: Goal: Improve Student Success
Entering Class of Fall 1998
Entering Class of Fall 1999
Entering Class of Fall 2000
Associate Programs
Six-year Graduation Rate (institution rate): Percentage of full-time first-time freshmen in associate programs who graduated from the college of entry within six years
Entering Class of Fall 1997
ComprehensiveJohn Jay 18.9 24.7 25.216.3Medgar Evers 15.2 13.0 16.917.3NYCCT 20.5 18.7 19.819.5Staten Island 20.1 21.0 24.218.4
Comprehensive Subtotal 19.7 19.2 21.618.5
CommunityBMCC 24.1 21.9 23.525.0Bronx 21.5 23.7 20.823.9Hostos 21.3 22.6 18.220.1Kingsborough 29.4 24.9 27.132.5LaGuardia 28.5 27.6 27.430.1Queensborough 26.6 22.2 27.123.4
Community Subtotal 26.0 23.9 25.026.8
University Total 23.9 22.4 23.924.0
Note: Students are counted as graduates from the college of entry in the cohort year if they earn the degree pursued (or higher) within six years from the college of entry. Graduation rates reflect all degrees conferred through August 31 of the last year of the tracking period. For students who earn more than one CUNY degree, the highest degree earned within six years is counted.
CUNY Office of Institutional Research and Assessment14-Aug-07 Page 44
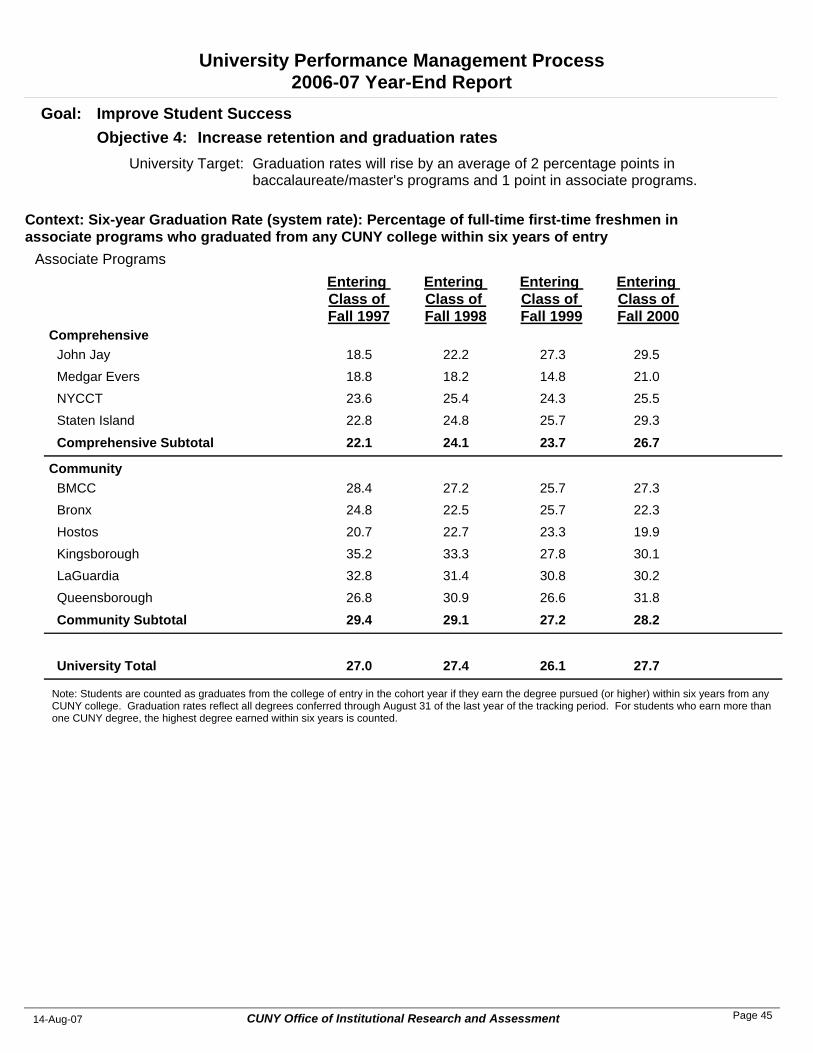
University Performance Management Process2006-07 Year-End Report
Graduation rates will rise by an average of 2 percentage points in baccalaureate/master's programs and 1 point in associate programs.
University Target:
Increase retention and graduation ratesObjective 4: Goal: Improve Student Success
Entering Class of Fall 1998
Entering Class of Fall 1999
Entering Class of Fall 2000
Associate Programs
Context: Six-year Graduation Rate (system rate): Percentage of full-time first-time freshmen in associate programs who graduated from any CUNY college within six years of entry
Entering Class of Fall 1997
ComprehensiveJohn Jay 22.2 27.3 29.518.5Medgar Evers 18.2 14.8 21.018.8NYCCT 25.4 24.3 25.523.6Staten Island 24.8 25.7 29.322.8
Comprehensive Subtotal 24.1 23.7 26.722.1
CommunityBMCC 27.2 25.7 27.328.4Bronx 22.5 25.7 22.324.8Hostos 22.7 23.3 19.920.7Kingsborough 33.3 27.8 30.135.2LaGuardia 31.4 30.8 30.232.8Queensborough 30.9 26.6 31.826.8
Community Subtotal 29.1 27.2 28.229.4
University Total 27.4 26.1 27.727.0
Note: Students are counted as graduates from the college of entry in the cohort year if they earn the degree pursued (or higher) within six years from any CUNY college. Graduation rates reflect all degrees conferred through August 31 of the last year of the tracking period. For students who earn more than one CUNY degree, the highest degree earned within six years is counted.
CUNY Office of Institutional Research and Assessment14-Aug-07 Page 45
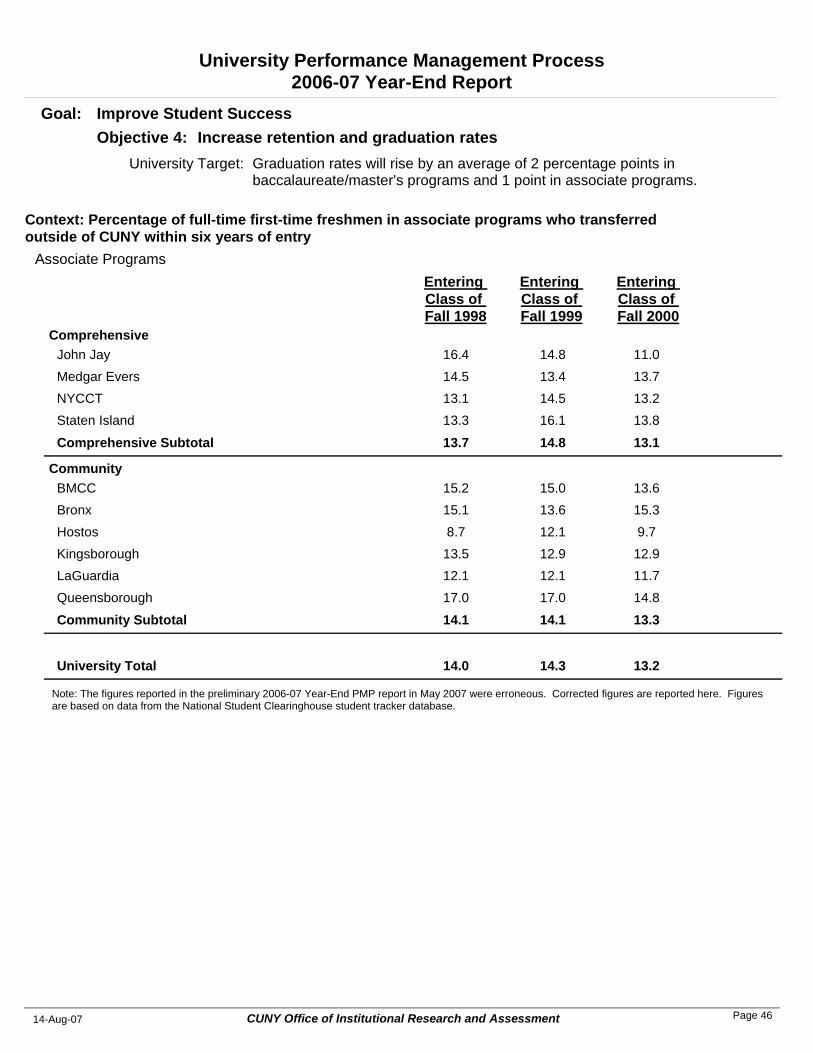
University Performance Management Process2006-07 Year-End Report
Graduation rates will rise by an average of 2 percentage points in baccalaureate/master's programs and 1 point in associate programs.
University Target:
Increase retention and graduation ratesObjective 4: Goal: Improve Student Success
Entering Class of Fall 1998
Entering Class of Fall 1999
Entering Class of Fall 2000
Associate Programs
Context: Percentage of full-time first-time freshmen in associate programs who transferred outside of CUNY within six years of entry
ComprehensiveJohn Jay 16.4 14.8 11.0Medgar Evers 14.5 13.4 13.7NYCCT 13.1 14.5 13.2Staten Island 13.3 16.1 13.8
Comprehensive Subtotal 13.7 14.8 13.1
CommunityBMCC 15.2 15.0 13.6Bronx 15.1 13.6 15.3Hostos 8.7 12.1 9.7Kingsborough 13.5 12.9 12.9LaGuardia 12.1 12.1 11.7Queensborough 17.0 17.0 14.8
Community Subtotal 14.1 14.1 13.3
University Total 14.0 14.3 13.2
Note: The figures reported in the preliminary 2006-07 Year-End PMP report in May 2007 were erroneous. Corrected figures are reported here. Figures are based on data from the National Student Clearinghouse student tracker database.
CUNY Office of Institutional Research and Assessment14-Aug-07 Page 46
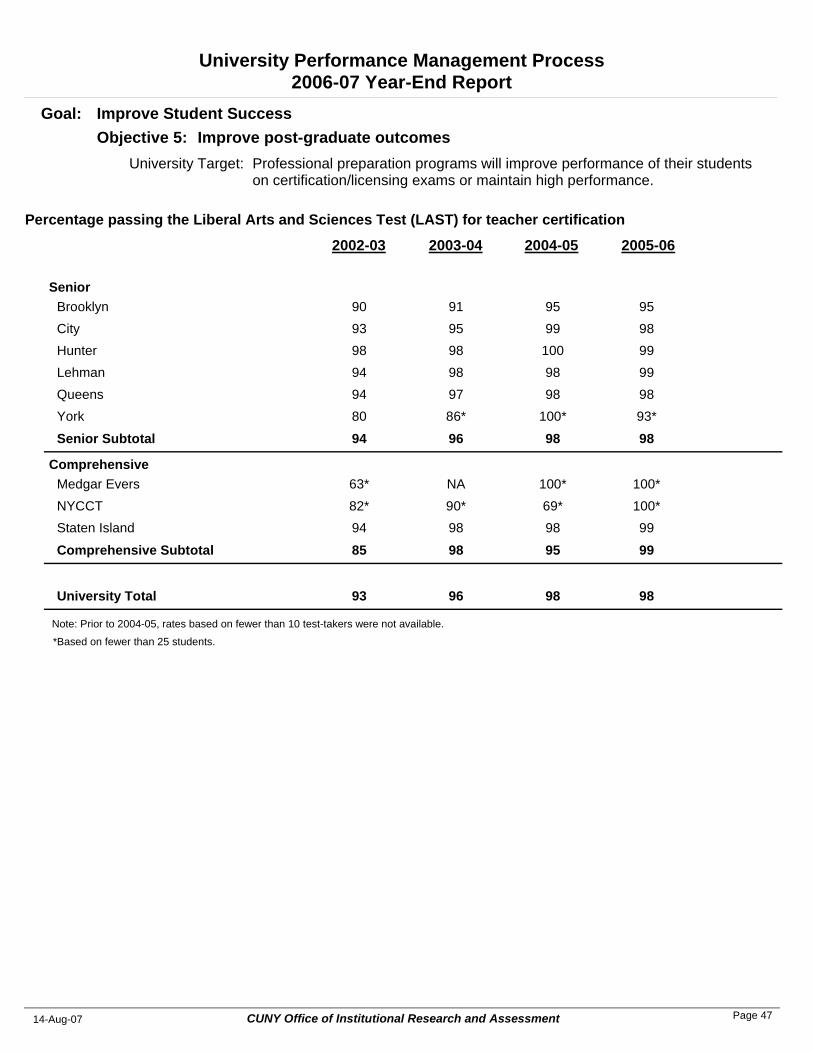
University Performance Management Process2006-07 Year-End Report
Professional preparation programs will improve performance of their students on certification/licensing exams or maintain high performance.
University Target:
Improve post-graduate outcomesObjective 5: Goal: Improve Student Success
2003-04 2004-05 2005-06
Percentage passing the Liberal Arts and Sciences Test (LAST) for teacher certification
2002-03
SeniorBrooklyn 91 95 9590City 95 99 9893Hunter 98 100 9998Lehman 98 98 9994Queens 97 98 9894York 86* 100* 93*80
Senior Subtotal 96 98 9894
ComprehensiveMedgar Evers NA 100* 100*63*NYCCT 90* 69* 100*82*Staten Island 98 98 9994
Comprehensive Subtotal 98 95 9985
University Total 96 98 9893
Note: Prior to 2004-05, rates based on fewer than 10 test-takers were not available.
*Based on fewer than 25 students.
CUNY Office of Institutional Research and Assessment14-Aug-07 Page 47
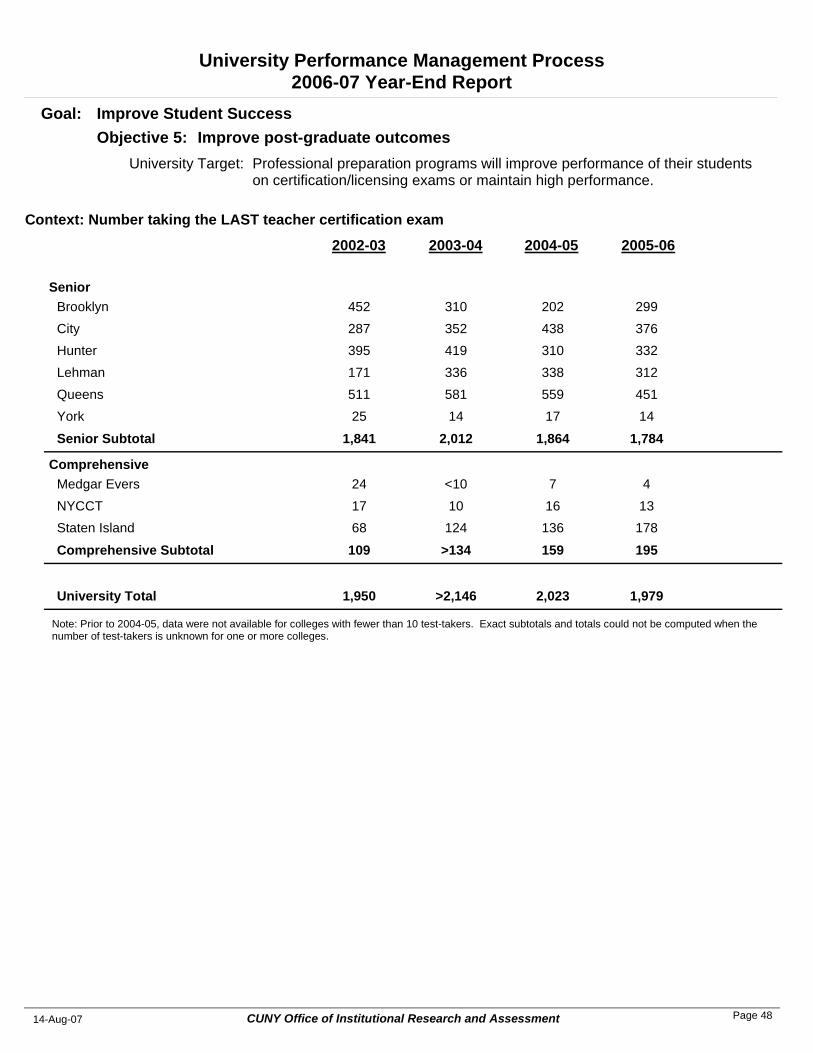
University Performance Management Process2006-07 Year-End Report
Professional preparation programs will improve performance of their students on certification/licensing exams or maintain high performance.
University Target:
Improve post-graduate outcomesObjective 5: Goal: Improve Student Success
2003-04 2004-05 2005-06
Context: Number taking the LAST teacher certification exam
2002-03
SeniorBrooklyn 310 202 299452City 352 438 376287Hunter 419 310 332395Lehman 336 338 312171Queens 581 559 451511York 14 17 1425
Senior Subtotal 2,012 1,864 1,7841,841
ComprehensiveMedgar Evers <10 7 424NYCCT 10 16 1317Staten Island 124 136 17868
Comprehensive Subtotal >134 159 195109
University Total >2,146 2,023 1,9791,950
Note: Prior to 2004-05, data were not available for colleges with fewer than 10 test-takers. Exact subtotals and totals could not be computed when the number of test-takers is unknown for one or more colleges.
CUNY Office of Institutional Research and Assessment14-Aug-07 Page 48
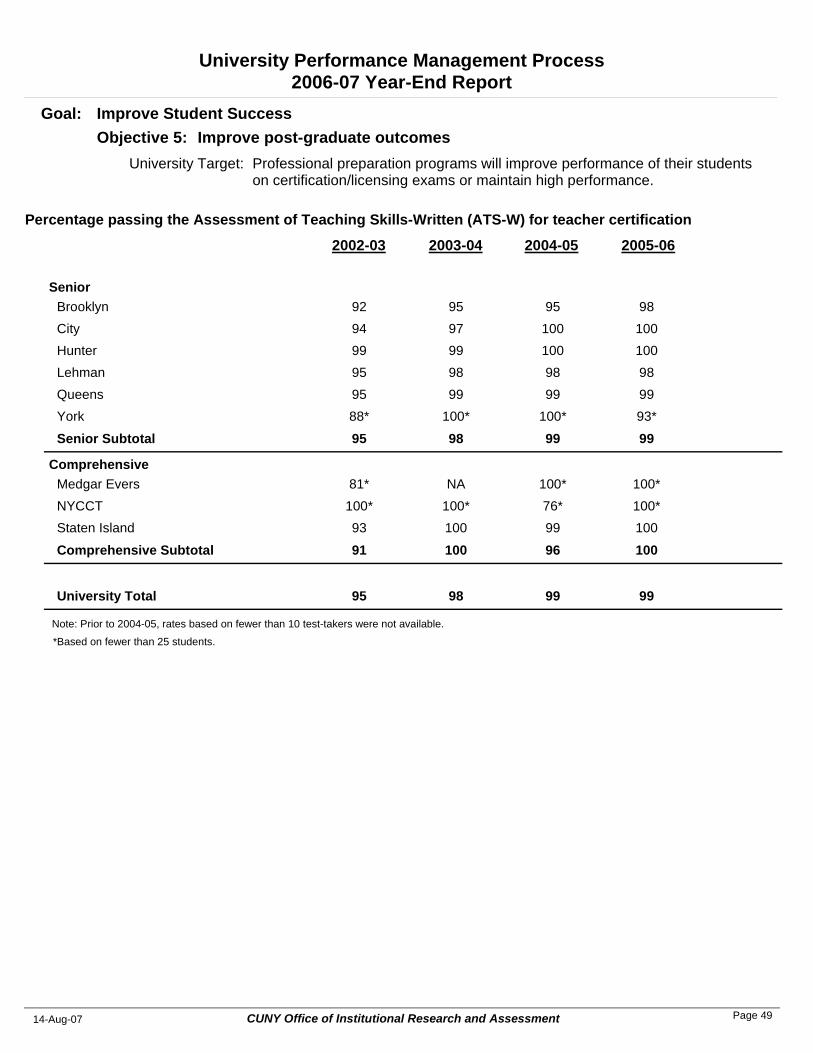
University Performance Management Process2006-07 Year-End Report
Professional preparation programs will improve performance of their students on certification/licensing exams or maintain high performance.
University Target:
Improve post-graduate outcomesObjective 5: Goal: Improve Student Success
2003-04 2004-05 2005-06
Percentage passing the Assessment of Teaching Skills-Written (ATS-W) for teacher certification
2002-03
SeniorBrooklyn 95 95 9892City 97 100 10094Hunter 99 100 10099Lehman 98 98 9895Queens 99 99 9995York 100* 100* 93*88*
Senior Subtotal 98 99 9995
ComprehensiveMedgar Evers NA 100* 100*81*NYCCT 100* 76* 100*100*Staten Island 100 99 10093
Comprehensive Subtotal 100 96 10091
University Total 98 99 9995
Note: Prior to 2004-05, rates based on fewer than 10 test-takers were not available.
*Based on fewer than 25 students.
CUNY Office of Institutional Research and Assessment14-Aug-07 Page 49
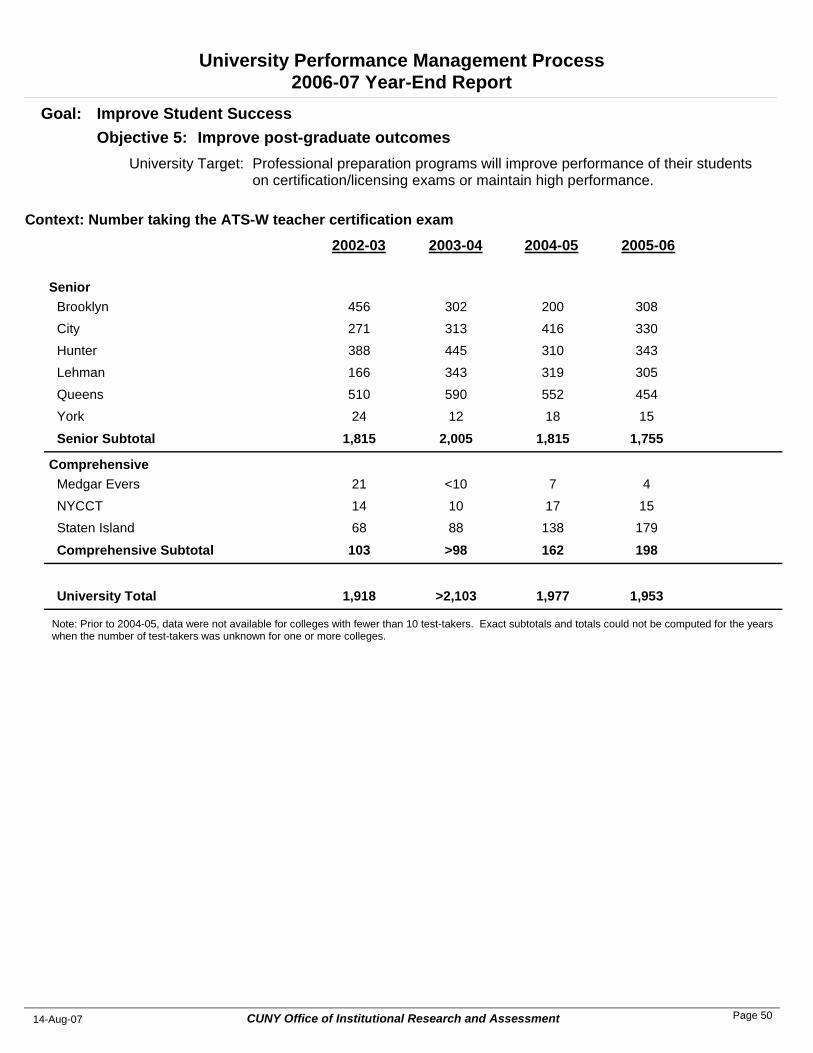
University Performance Management Process2006-07 Year-End Report
Professional preparation programs will improve performance of their students on certification/licensing exams or maintain high performance.
University Target:
Improve post-graduate outcomesObjective 5: Goal: Improve Student Success
2003-04 2004-05 2005-06
Context: Number taking the ATS-W teacher certification exam
2002-03
SeniorBrooklyn 302 200 308456City 313 416 330271Hunter 445 310 343388Lehman 343 319 305166Queens 590 552 454510York 12 18 1524
Senior Subtotal 2,005 1,815 1,7551,815
ComprehensiveMedgar Evers <10 7 421NYCCT 10 17 1514Staten Island 88 138 17968
Comprehensive Subtotal >98 162 198103
University Total >2,103 1,977 1,9531,918
Note: Prior to 2004-05, data were not available for colleges with fewer than 10 test-takers. Exact subtotals and totals could not be computed for the years when the number of test-takers was unknown for one or more colleges.
CUNY Office of Institutional Research and Assessment14-Aug-07 Page 50
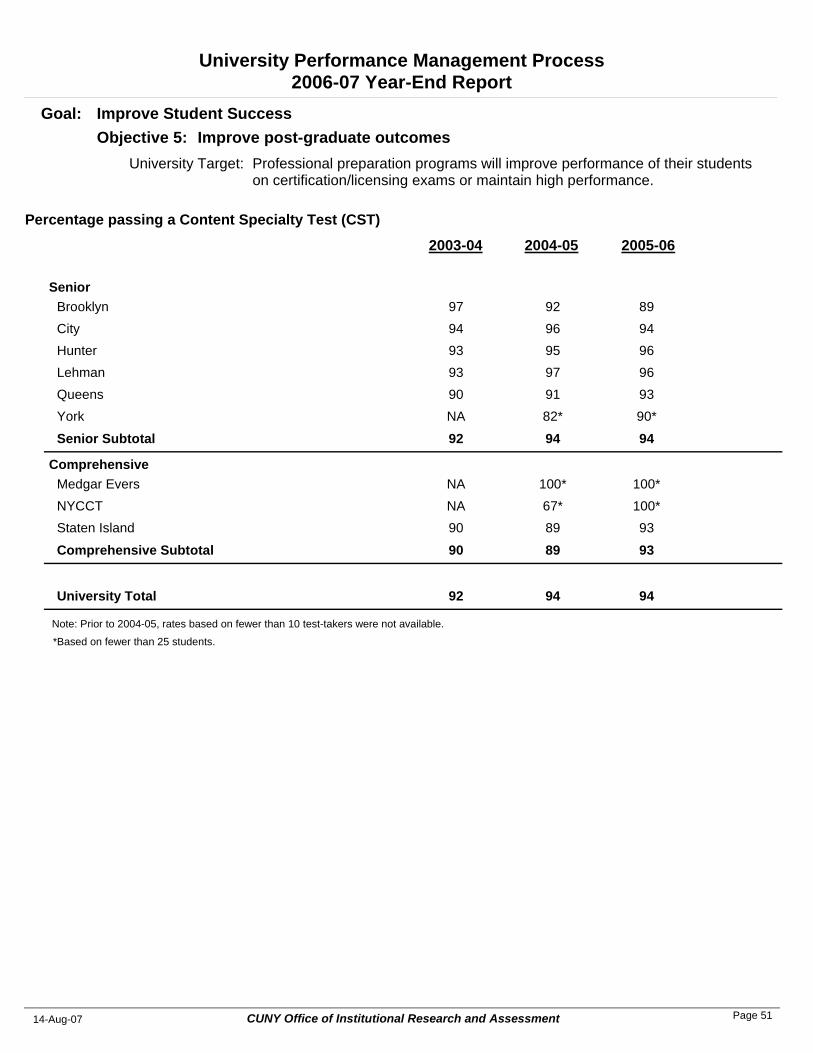
University Performance Management Process2006-07 Year-End Report
Professional preparation programs will improve performance of their students on certification/licensing exams or maintain high performance.
University Target:
Improve post-graduate outcomesObjective 5: Goal: Improve Student Success
2003-04 2004-05 2005-06
Percentage passing a Content Specialty Test (CST)
SeniorBrooklyn 97 92 89 City 94 96 94 Hunter 93 95 96 Lehman 93 97 96 Queens 90 91 93 York NA 82* 90*
Senior Subtotal 92 94 94
ComprehensiveMedgar Evers NA 100* 100* NYCCT NA 67* 100* Staten Island 90 89 93
Comprehensive Subtotal 90 89 93
University Total 92 94 94
Note: Prior to 2004-05, rates based on fewer than 10 test-takers were not available.
*Based on fewer than 25 students.
CUNY Office of Institutional Research and Assessment14-Aug-07 Page 51
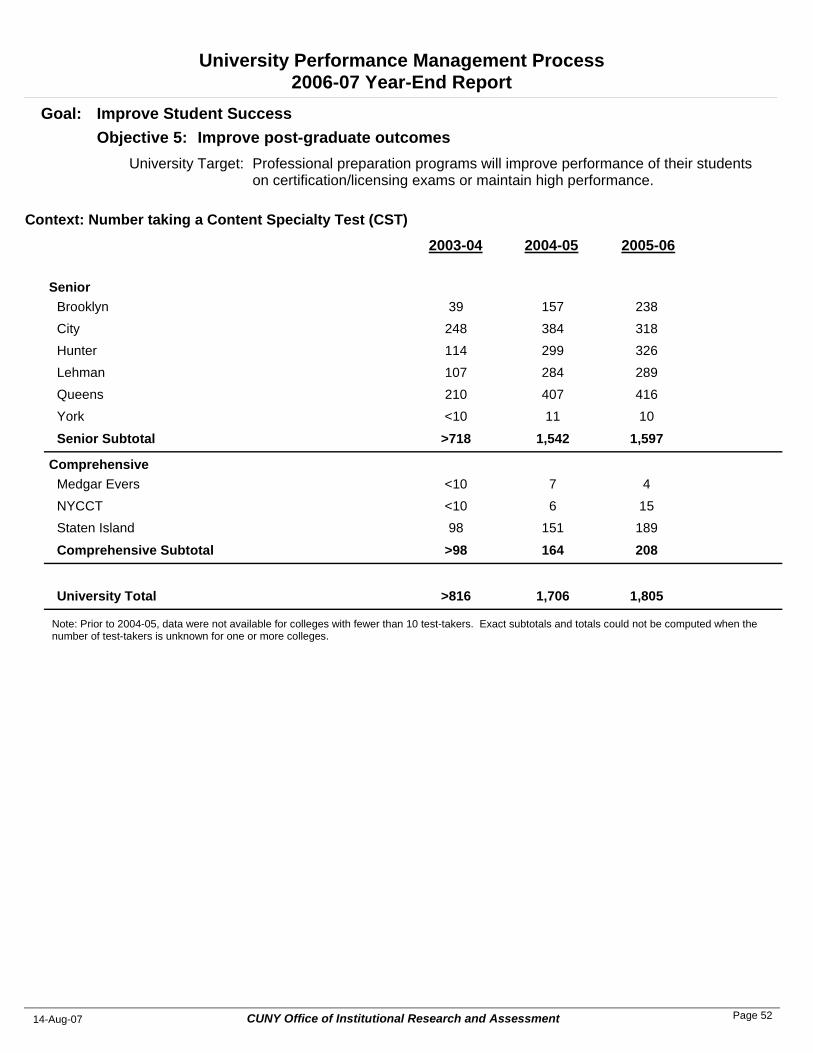
University Performance Management Process2006-07 Year-End Report
Professional preparation programs will improve performance of their students on certification/licensing exams or maintain high performance.
University Target:
Improve post-graduate outcomesObjective 5: Goal: Improve Student Success
2003-04 2004-05 2005-06
Context: Number taking a Content Specialty Test (CST)
SeniorBrooklyn 39 157 238 City 248 384 318 Hunter 114 299 326 Lehman 107 284 289 Queens 210 407 416 York <10 11 10
Senior Subtotal >718 1,542 1,597
ComprehensiveMedgar Evers <10 7 4 NYCCT <10 6 15 Staten Island 98 151 189
Comprehensive Subtotal >98 164 208
University Total >816 1,706 1,805
Note: Prior to 2004-05, data were not available for colleges with fewer than 10 test-takers. Exact subtotals and totals could not be computed when the number of test-takers is unknown for one or more colleges.
CUNY Office of Institutional Research and Assessment14-Aug-07 Page 52
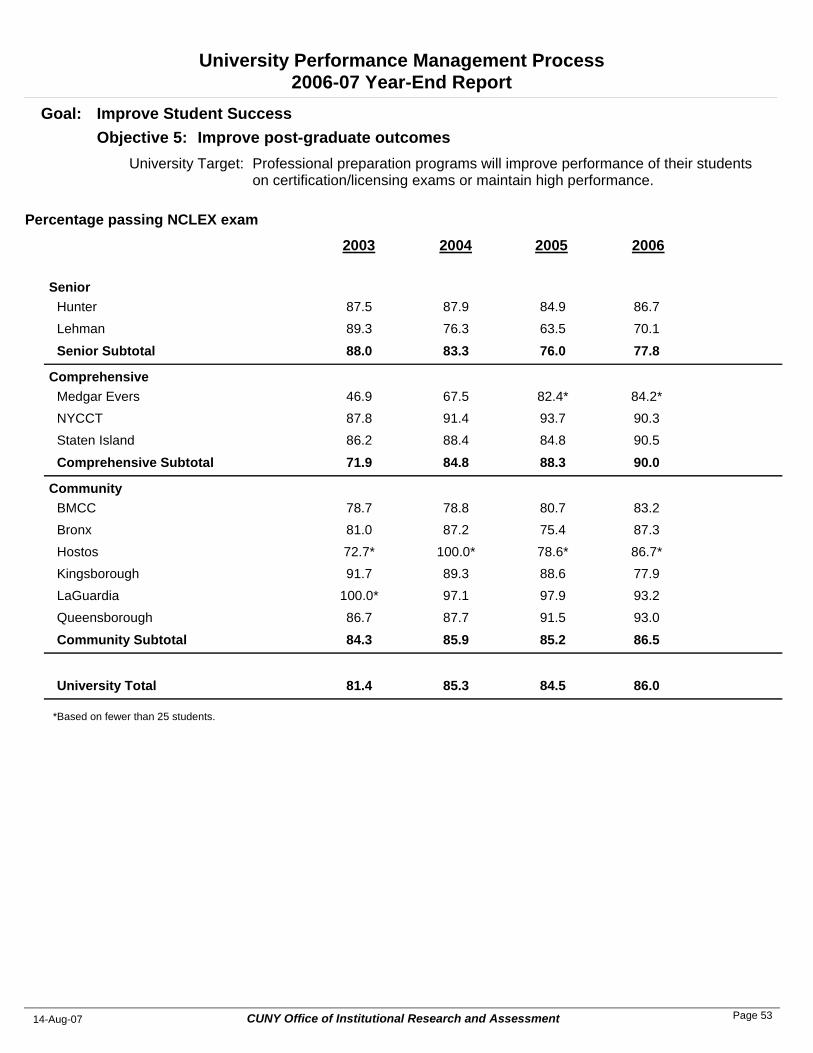
University Performance Management Process2006-07 Year-End Report
Professional preparation programs will improve performance of their students on certification/licensing exams or maintain high performance.
University Target:
Improve post-graduate outcomesObjective 5: Goal: Improve Student Success
2004 2005 2006
Percentage passing NCLEX exam
2003
SeniorHunter 87.9 84.9 86.787.5Lehman 76.3 63.5 70.189.3
Senior Subtotal 83.3 76.0 77.888.0
ComprehensiveMedgar Evers 67.5 82.4* 84.2*46.9NYCCT 91.4 93.7 90.387.8Staten Island 88.4 84.8 90.586.2
Comprehensive Subtotal 84.8 88.3 90.071.9
CommunityBMCC 78.8 80.7 83.278.7Bronx 87.2 75.4 87.381.0Hostos 100.0* 78.6* 86.7*72.7*Kingsborough 89.3 88.6 77.991.7LaGuardia 97.1 97.9 93.2100.0*Queensborough 87.7 91.5 93.086.7
Community Subtotal 85.9 85.2 86.584.3
University Total 85.3 84.5 86.081.4
*Based on fewer than 25 students.
CUNY Office of Institutional Research and Assessment14-Aug-07 Page 53
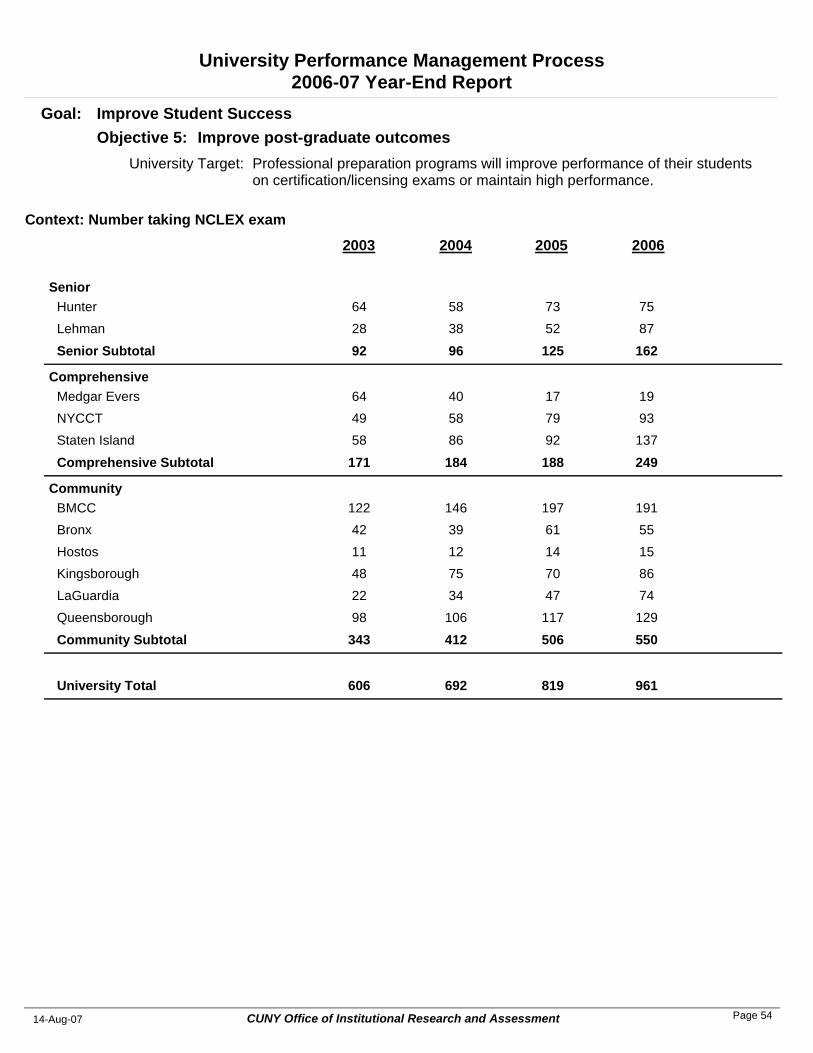
University Performance Management Process2006-07 Year-End Report
Professional preparation programs will improve performance of their students on certification/licensing exams or maintain high performance.
University Target:
Improve post-graduate outcomesObjective 5: Goal: Improve Student Success
2004 2005 2006
Context: Number taking NCLEX exam
2003
SeniorHunter 58 73 7564Lehman 38 52 8728
Senior Subtotal 96 125 16292
ComprehensiveMedgar Evers 40 17 1964NYCCT 58 79 9349Staten Island 86 92 13758
Comprehensive Subtotal 184 188 249171
CommunityBMCC 146 197 191122Bronx 39 61 5542Hostos 12 14 1511Kingsborough 75 70 8648LaGuardia 34 47 7422Queensborough 106 117 12998
Community Subtotal 412 506 550343
University Total 692 819 961606
CUNY Office of Institutional Research and Assessment14-Aug-07 Page 54
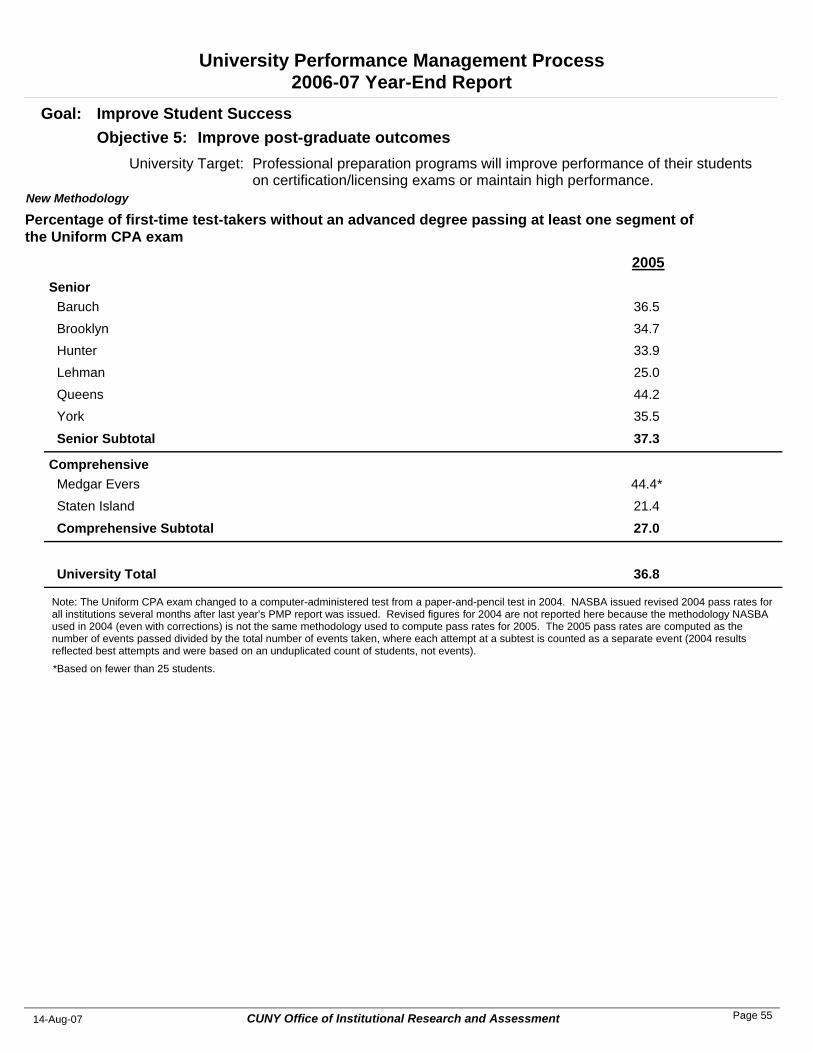
University Performance Management Process2006-07 Year-End Report
Professional preparation programs will improve performance of their students on certification/licensing exams or maintain high performance.
University Target:
Improve post-graduate outcomesObjective 5: Goal: Improve Student Success
2005
Percentage of first-time test-takers without an advanced degree passing at least one segment of the Uniform CPA exam
New Methodology
SeniorBaruch 36.5Brooklyn 34.7Hunter 33.9Lehman 25.0Queens 44.2York 35.5
Senior Subtotal 37.3
ComprehensiveMedgar Evers 44.4*Staten Island 21.4
Comprehensive Subtotal 27.0
University Total 36.8
Note: The Uniform CPA exam changed to a computer-administered test from a paper-and-pencil test in 2004. NASBA issued revised 2004 pass rates for all institutions several months after last year's PMP report was issued. Revised figures for 2004 are not reported here because the methodology NASBA used in 2004 (even with corrections) is not the same methodology used to compute pass rates for 2005. The 2005 pass rates are computed as the number of events passed divided by the total number of events taken, where each attempt at a subtest is counted as a separate event (2004 results reflected best attempts and were based on an unduplicated count of students, not events).
*Based on fewer than 25 students.
CUNY Office of Institutional Research and Assessment14-Aug-07 Page 55
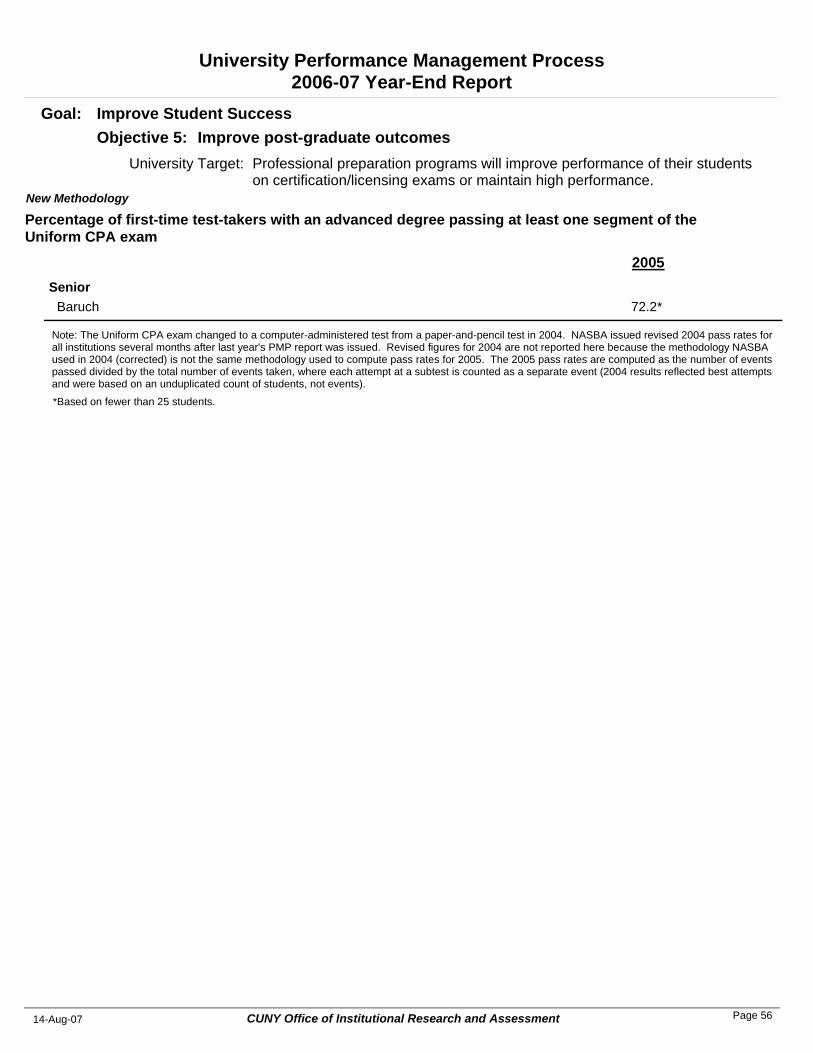
University Performance Management Process2006-07 Year-End Report
Professional preparation programs will improve performance of their students on certification/licensing exams or maintain high performance.
University Target:
Improve post-graduate outcomesObjective 5: Goal: Improve Student Success
2005
Percentage of first-time test-takers with an advanced degree passing at least one segment of the Uniform CPA exam
New Methodology
SeniorBaruch 72.2*
Note: The Uniform CPA exam changed to a computer-administered test from a paper-and-pencil test in 2004. NASBA issued revised 2004 pass rates for all institutions several months after last year's PMP report was issued. Revised figures for 2004 are not reported here because the methodology NASBA used in 2004 (corrected) is not the same methodology used to compute pass rates for 2005. The 2005 pass rates are computed as the number of events passed divided by the total number of events taken, where each attempt at a subtest is counted as a separate event (2004 results reflected best attempts and were based on an unduplicated count of students, not events).
*Based on fewer than 25 students.
CUNY Office of Institutional Research and Assessment14-Aug-07 Page 56
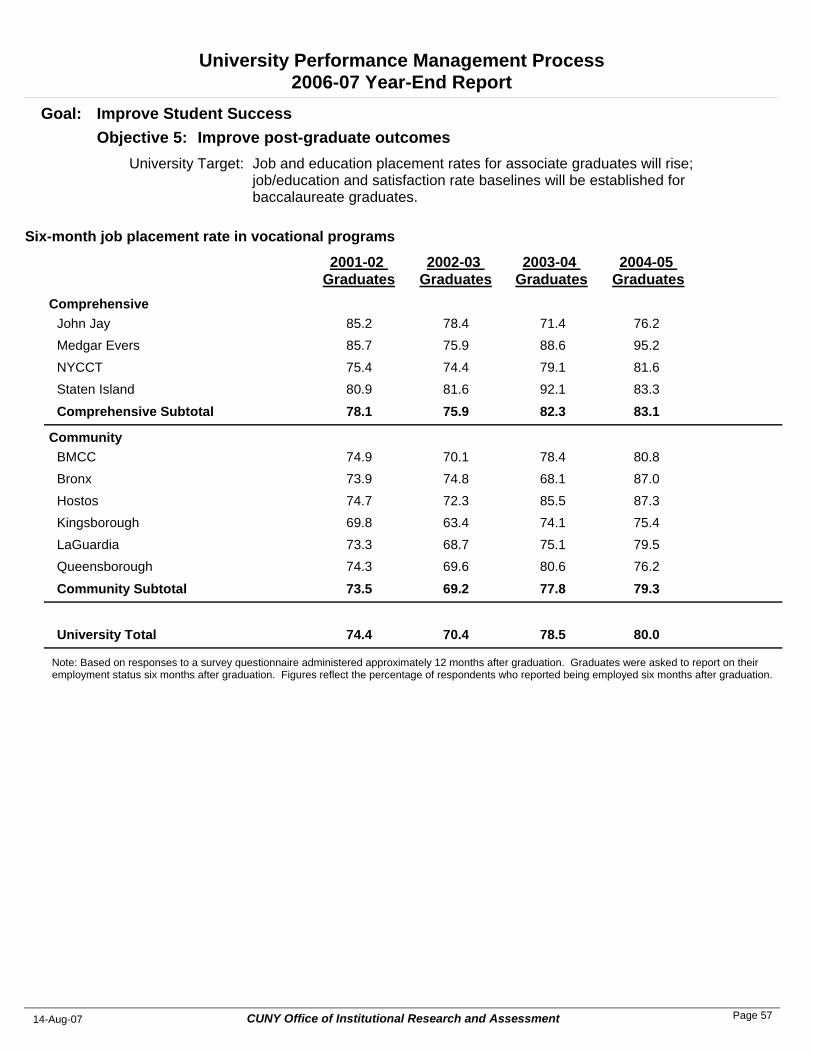
University Performance Management Process2006-07 Year-End Report
Job and education placement rates for associate graduates will rise; job/education and satisfaction rate baselines will be established for baccalaureate graduates.
University Target:
Improve post-graduate outcomesObjective 5: Goal: Improve Student Success
2002-03 Graduates
2003-04 Graduates
2004-05 Graduates
Six-month job placement rate in vocational programs
2001-02 Graduates
ComprehensiveJohn Jay 78.4 71.4 76.285.2Medgar Evers 75.9 88.6 95.285.7NYCCT 74.4 79.1 81.675.4Staten Island 81.6 92.1 83.380.9
Comprehensive Subtotal 75.9 82.3 83.178.1
CommunityBMCC 70.1 78.4 80.874.9Bronx 74.8 68.1 87.073.9Hostos 72.3 85.5 87.374.7Kingsborough 63.4 74.1 75.469.8LaGuardia 68.7 75.1 79.573.3Queensborough 69.6 80.6 76.274.3
Community Subtotal 69.2 77.8 79.373.5
University Total 70.4 78.5 80.074.4
Note: Based on responses to a survey questionnaire administered approximately 12 months after graduation. Graduates were asked to report on their employment status six months after graduation. Figures reflect the percentage of respondents who reported being employed six months after graduation.
CUNY Office of Institutional Research and Assessment14-Aug-07 Page 57
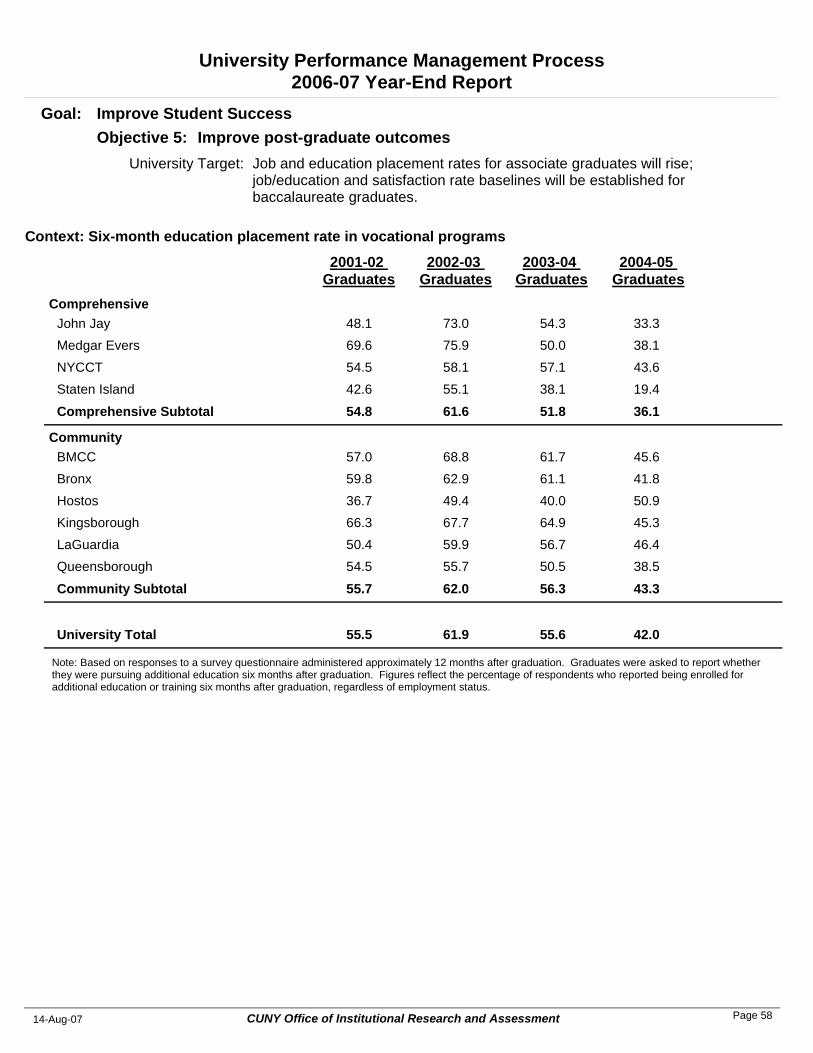
University Performance Management Process2006-07 Year-End Report
Job and education placement rates for associate graduates will rise; job/education and satisfaction rate baselines will be established for baccalaureate graduates.
University Target:
Improve post-graduate outcomesObjective 5: Goal: Improve Student Success
2002-03 Graduates
2003-04 Graduates
2004-05 Graduates
Context: Six-month education placement rate in vocational programs
2001-02 Graduates
ComprehensiveJohn Jay 73.0 54.3 33.348.1Medgar Evers 75.9 50.0 38.169.6NYCCT 58.1 57.1 43.654.5Staten Island 55.1 38.1 19.442.6
Comprehensive Subtotal 61.6 51.8 36.154.8
CommunityBMCC 68.8 61.7 45.657.0Bronx 62.9 61.1 41.859.8Hostos 49.4 40.0 50.936.7Kingsborough 67.7 64.9 45.366.3LaGuardia 59.9 56.7 46.450.4Queensborough 55.7 50.5 38.554.5
Community Subtotal 62.0 56.3 43.355.7
University Total 61.9 55.6 42.055.5
Note: Based on responses to a survey questionnaire administered approximately 12 months after graduation. Graduates were asked to report whether they were pursuing additional education six months after graduation. Figures reflect the percentage of respondents who reported being enrolled for additional education or training six months after graduation, regardless of employment status.
CUNY Office of Institutional Research and Assessment14-Aug-07 Page 58
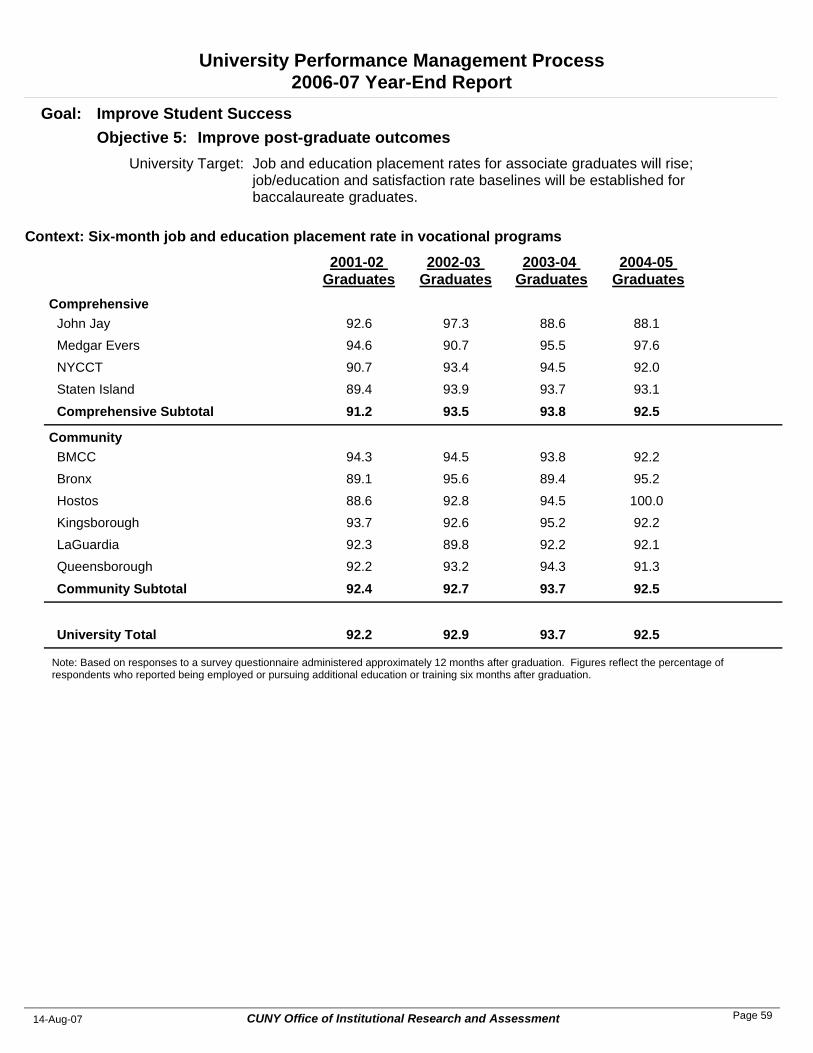
University Performance Management Process2006-07 Year-End Report
Job and education placement rates for associate graduates will rise; job/education and satisfaction rate baselines will be established for baccalaureate graduates.
University Target:
Improve post-graduate outcomesObjective 5: Goal: Improve Student Success
2002-03 Graduates
2003-04 Graduates
2004-05 Graduates
Context: Six-month job and education placement rate in vocational programs
2001-02 Graduates
ComprehensiveJohn Jay 97.3 88.6 88.192.6Medgar Evers 90.7 95.5 97.694.6NYCCT 93.4 94.5 92.090.7Staten Island 93.9 93.7 93.189.4
Comprehensive Subtotal 93.5 93.8 92.591.2
CommunityBMCC 94.5 93.8 92.294.3Bronx 95.6 89.4 95.289.1Hostos 92.8 94.5 100.088.6Kingsborough 92.6 95.2 92.293.7LaGuardia 89.8 92.2 92.192.3Queensborough 93.2 94.3 91.392.2
Community Subtotal 92.7 93.7 92.592.4
University Total 92.9 93.7 92.592.2
Note: Based on responses to a survey questionnaire administered approximately 12 months after graduation. Figures reflect the percentage of respondents who reported being employed or pursuing additional education or training six months after graduation.
CUNY Office of Institutional Research and Assessment14-Aug-07 Page 59
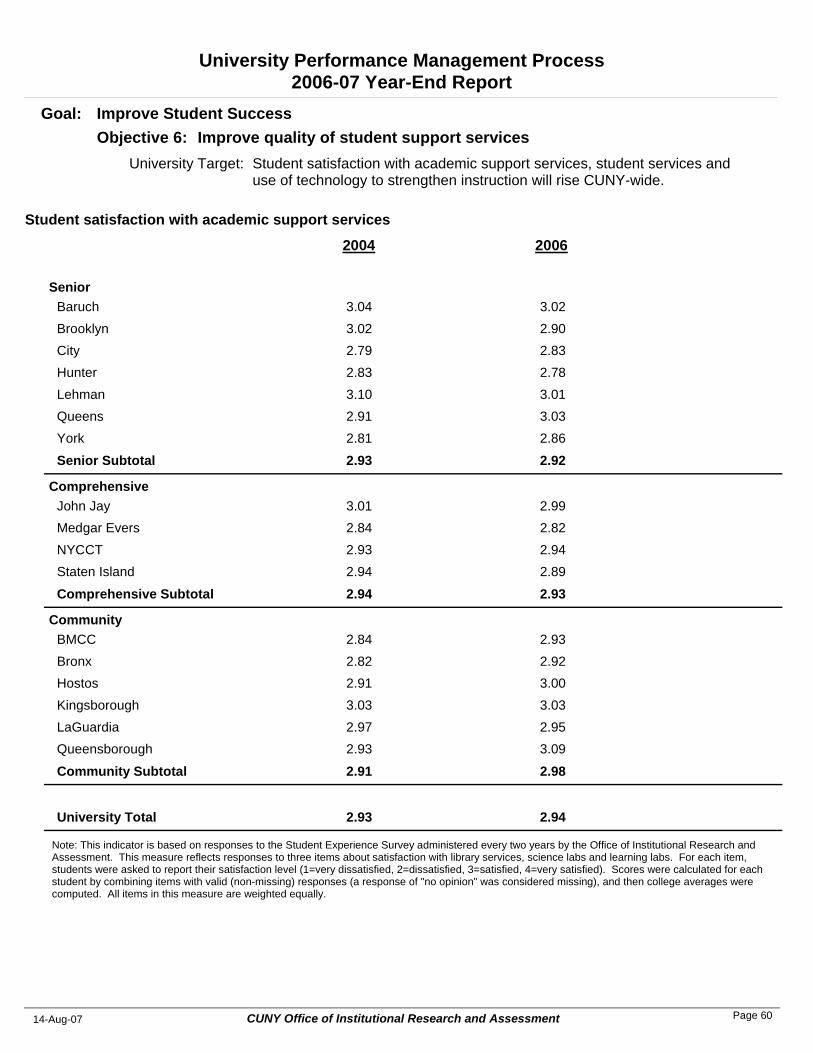
University Performance Management Process2006-07 Year-End Report
Student satisfaction with academic support services, student services and use of technology to strengthen instruction will rise CUNY-wide.
University Target:
Improve quality of student support servicesObjective 6: Goal: Improve Student Success
2006
Student satisfaction with academic support services
2004
SeniorBaruch 3.023.04Brooklyn 2.903.02City 2.832.79Hunter 2.782.83Lehman 3.013.10Queens 3.032.91York 2.862.81
Senior Subtotal 2.922.93
ComprehensiveJohn Jay 2.993.01Medgar Evers 2.822.84NYCCT 2.942.93Staten Island 2.892.94
Comprehensive Subtotal 2.932.94
CommunityBMCC 2.932.84Bronx 2.922.82Hostos 3.002.91Kingsborough 3.033.03LaGuardia 2.952.97Queensborough 3.092.93
Community Subtotal 2.982.91
University Total 2.942.93
Note: This indicator is based on responses to the Student Experience Survey administered every two years by the Office of Institutional Research and Assessment. This measure reflects responses to three items about satisfaction with library services, science labs and learning labs. For each item, students were asked to report their satisfaction level (1=very dissatisfied, 2=dissatisfied, 3=satisfied, 4=very satisfied). Scores were calculated for each student by combining items with valid (non-missing) responses (a response of "no opinion" was considered missing), and then college averages were computed. All items in this measure are weighted equally.
CUNY Office of Institutional Research and Assessment14-Aug-07 Page 60
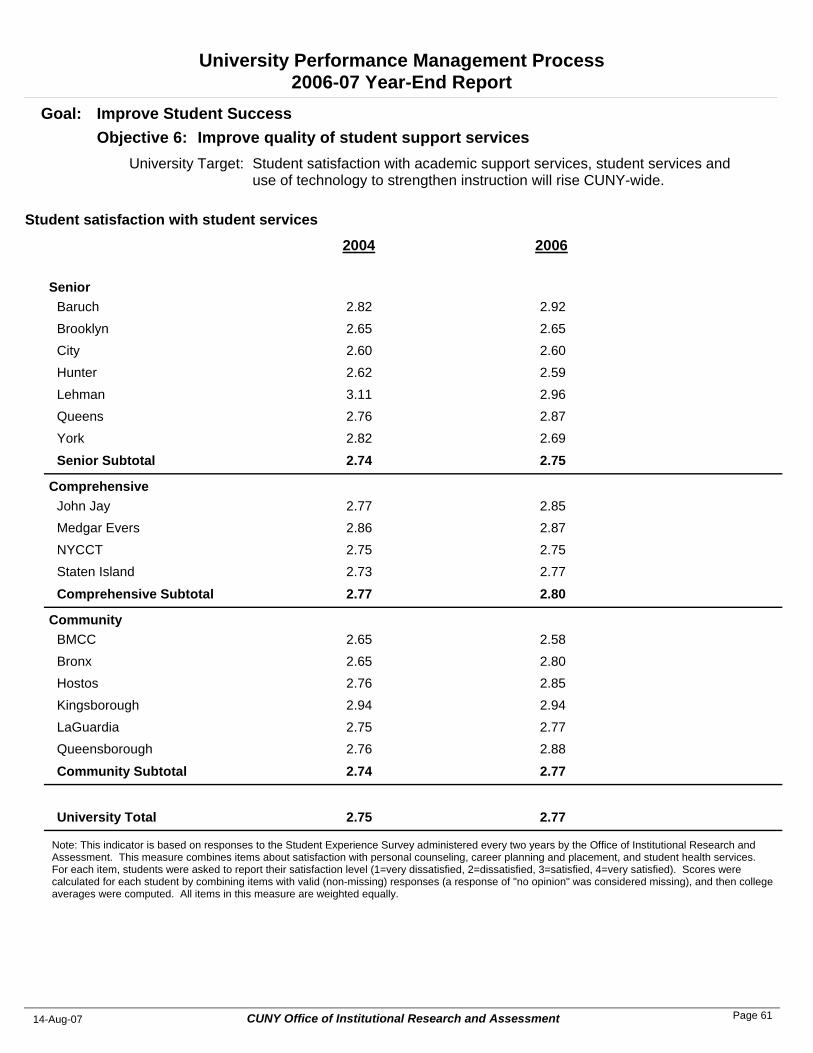
University Performance Management Process2006-07 Year-End Report
Student satisfaction with academic support services, student services and use of technology to strengthen instruction will rise CUNY-wide.
University Target:
Improve quality of student support servicesObjective 6: Goal: Improve Student Success
2006
Student satisfaction with student services
2004
SeniorBaruch 2.922.82Brooklyn 2.652.65City 2.602.60Hunter 2.592.62Lehman 2.963.11Queens 2.872.76York 2.692.82
Senior Subtotal 2.752.74
ComprehensiveJohn Jay 2.852.77Medgar Evers 2.872.86NYCCT 2.752.75Staten Island 2.772.73
Comprehensive Subtotal 2.802.77
CommunityBMCC 2.582.65Bronx 2.802.65Hostos 2.852.76Kingsborough 2.942.94LaGuardia 2.772.75Queensborough 2.882.76
Community Subtotal 2.772.74
University Total 2.772.75
Note: This indicator is based on responses to the Student Experience Survey administered every two years by the Office of Institutional Research and Assessment. This measure combines items about satisfaction with personal counseling, career planning and placement, and student health services. For each item, students were asked to report their satisfaction level (1=very dissatisfied, 2=dissatisfied, 3=satisfied, 4=very satisfied). Scores were calculated for each student by combining items with valid (non-missing) responses (a response of "no opinion" was considered missing), and then college averages were computed. All items in this measure are weighted equally.
CUNY Office of Institutional Research and Assessment14-Aug-07 Page 61
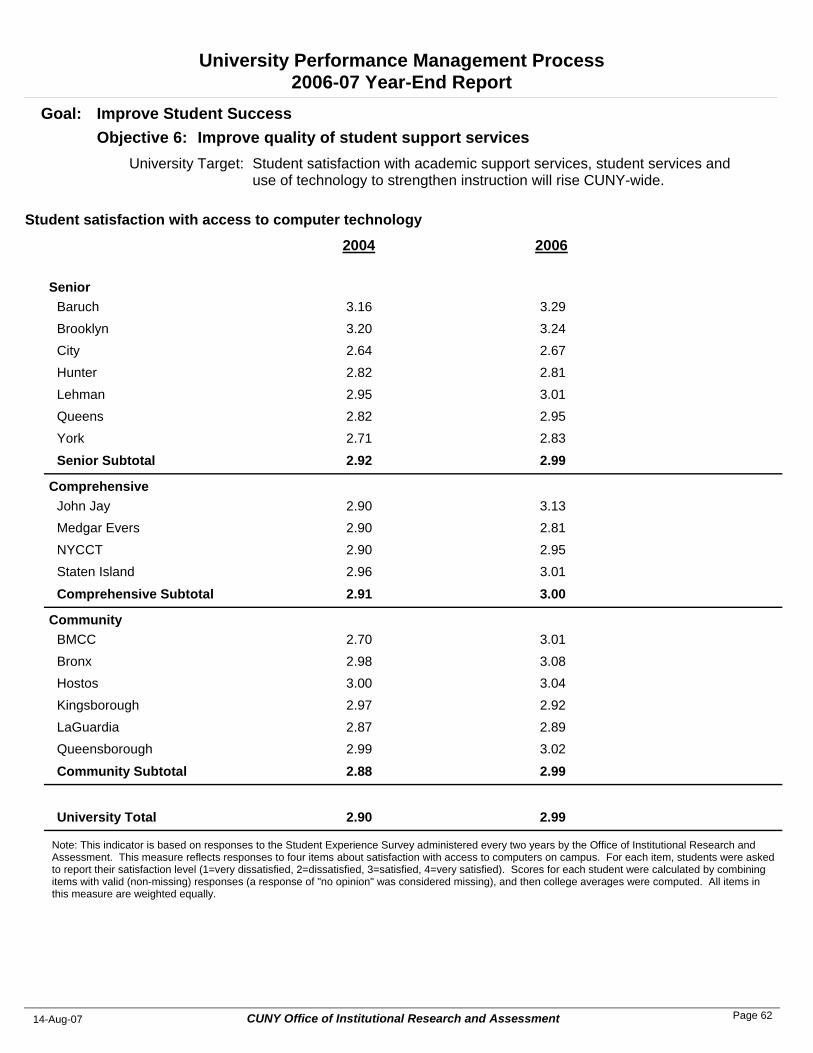
University Performance Management Process2006-07 Year-End Report
Student satisfaction with academic support services, student services and use of technology to strengthen instruction will rise CUNY-wide.
University Target:
Improve quality of student support servicesObjective 6: Goal: Improve Student Success
2006
Student satisfaction with access to computer technology
2004
SeniorBaruch 3.293.16Brooklyn 3.243.20City 2.672.64Hunter 2.812.82Lehman 3.012.95Queens 2.952.82York 2.832.71
Senior Subtotal 2.992.92
ComprehensiveJohn Jay 3.132.90Medgar Evers 2.812.90NYCCT 2.952.90Staten Island 3.012.96
Comprehensive Subtotal 3.002.91
CommunityBMCC 3.012.70Bronx 3.082.98Hostos 3.043.00Kingsborough 2.922.97LaGuardia 2.892.87Queensborough 3.022.99
Community Subtotal 2.992.88
University Total 2.992.90
Note: This indicator is based on responses to the Student Experience Survey administered every two years by the Office of Institutional Research and Assessment. This measure reflects responses to four items about satisfaction with access to computers on campus. For each item, students were asked to report their satisfaction level (1=very dissatisfied, 2=dissatisfied, 3=satisfied, 4=very satisfied). Scores for each student were calculated by combining items with valid (non-missing) responses (a response of "no opinion" was considered missing), and then college averages were computed. All items in this measure are weighted equally.
CUNY Office of Institutional Research and Assessment14-Aug-07 Page 62
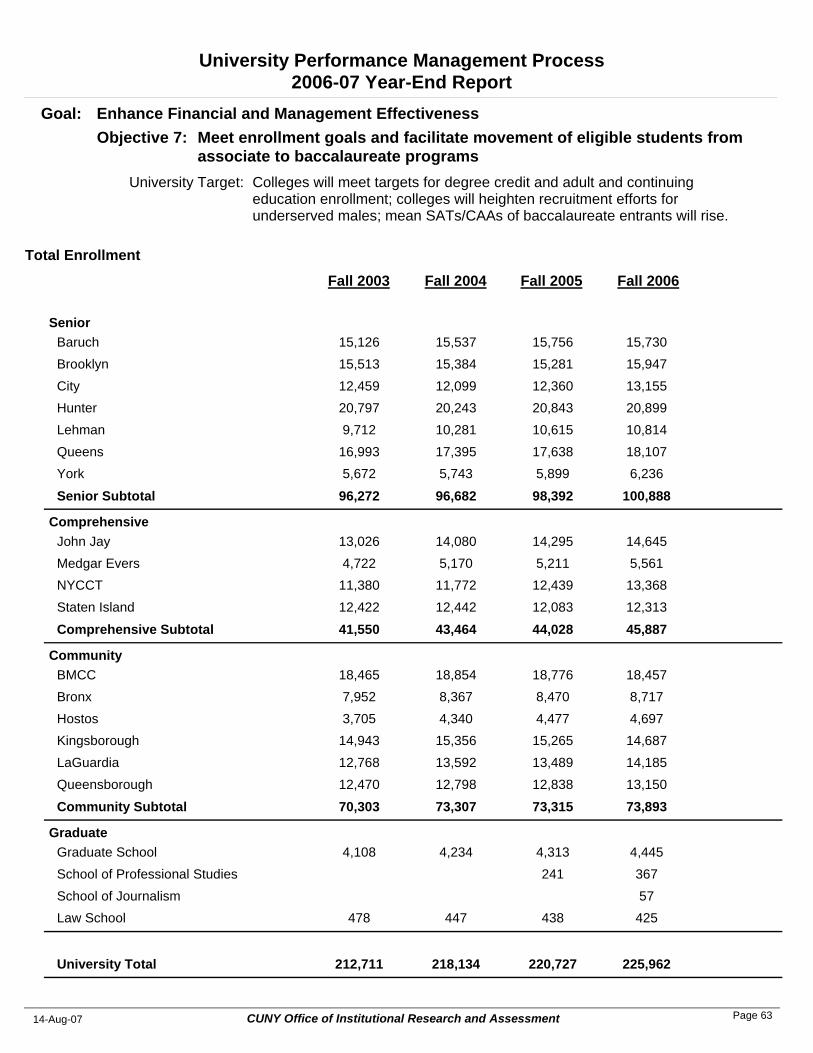
University Performance Management Process2006-07 Year-End Report
Colleges will meet targets for degree credit and adult and continuing education enrollment; colleges will heighten recruitment efforts for underserved males; mean SATs/CAAs of baccalaureate entrants will rise.
University Target:
Meet enrollment goals and facilitate movement of eligible students from associate to baccalaureate programs
Objective 7: Goal: Enhance Financial and Management Effectiveness
Fall 2004 Fall 2005 Fall 2006
Total Enrollment
Fall 2003
SeniorBaruch 15,537 15,756 15,73015,126Brooklyn 15,384 15,281 15,94715,513City 12,099 12,360 13,15512,459Hunter 20,243 20,843 20,89920,797Lehman 10,281 10,615 10,8149,712Queens 17,395 17,638 18,10716,993York 5,743 5,899 6,2365,672
Senior Subtotal 96,682 98,392 100,88896,272
ComprehensiveJohn Jay 14,080 14,295 14,64513,026Medgar Evers 5,170 5,211 5,5614,722NYCCT 11,772 12,439 13,36811,380Staten Island 12,442 12,083 12,31312,422
Comprehensive Subtotal 43,464 44,028 45,88741,550
CommunityBMCC 18,854 18,776 18,45718,465Bronx 8,367 8,470 8,7177,952Hostos 4,340 4,477 4,6973,705Kingsborough 15,356 15,265 14,68714,943LaGuardia 13,592 13,489 14,18512,768Queensborough 12,798 12,838 13,15012,470
Community Subtotal 73,307 73,315 73,89370,303
GraduateGraduate School 4,234 4,313 4,4454,108School of Professional Studies 241 367School of Journalism 57Law School 447 438 425478
University Total 218,134 220,727 225,962212,711
CUNY Office of Institutional Research and Assessment14-Aug-07 Page 63

University Performance Management Process2006-07 Year-End Report
Colleges will meet targets for degree credit and adult and continuing education enrollment; colleges will heighten recruitment efforts for underserved males; mean SATs/CAAs of baccalaureate entrants will rise.
University Target:
Meet enrollment goals and facilitate movement of eligible students from associate to baccalaureate programs
Objective 7: Goal: Enhance Financial and Management Effectiveness
Fall 2004 Fall 2005 Fall 2006
Total FTEs
Fall 2003
SeniorBaruch 12,223 12,527 12,60111,753Brooklyn 10,979 11,000 11,53010,768City 8,478 8,749 9,3558,513Hunter 14,065 14,668 14,64614,348Lehman 6,936 7,126 7,4856,461Queens 12,267 12,431 12,87311,809York 4,254 4,425 4,4154,105
Senior Subtotal 69,201 70,925 72,90467,758
ComprehensiveJohn Jay 10,799 11,076 11,38510,064Medgar Evers 3,565 3,677 3,9473,159NYCCT 8,778 8,892 9,5838,554Staten Island 9,168 8,868 9,2669,033
Comprehensive Subtotal 32,310 32,514 34,18130,809
CommunityBMCC 13,484 13,311 13,02913,411Bronx 6,089 6,242 6,3005,860Hostos 3,327 3,289 3,3693,092Kingsborough 10,989 10,855 10,52210,474LaGuardia 10,420 10,127 10,4479,772Queensborough 7,892 8,024 8,2417,912
Community Subtotal 52,202 51,847 51,90850,521
GraduateGraduate School 3,256 3,287 3,4463,176School of Professional Studies 76 178School of Journalism 72Law School 551 544 526595
University Total 157,520 159,193 163,216152,859
CUNY Office of Institutional Research and Assessment14-Aug-07 Page 64
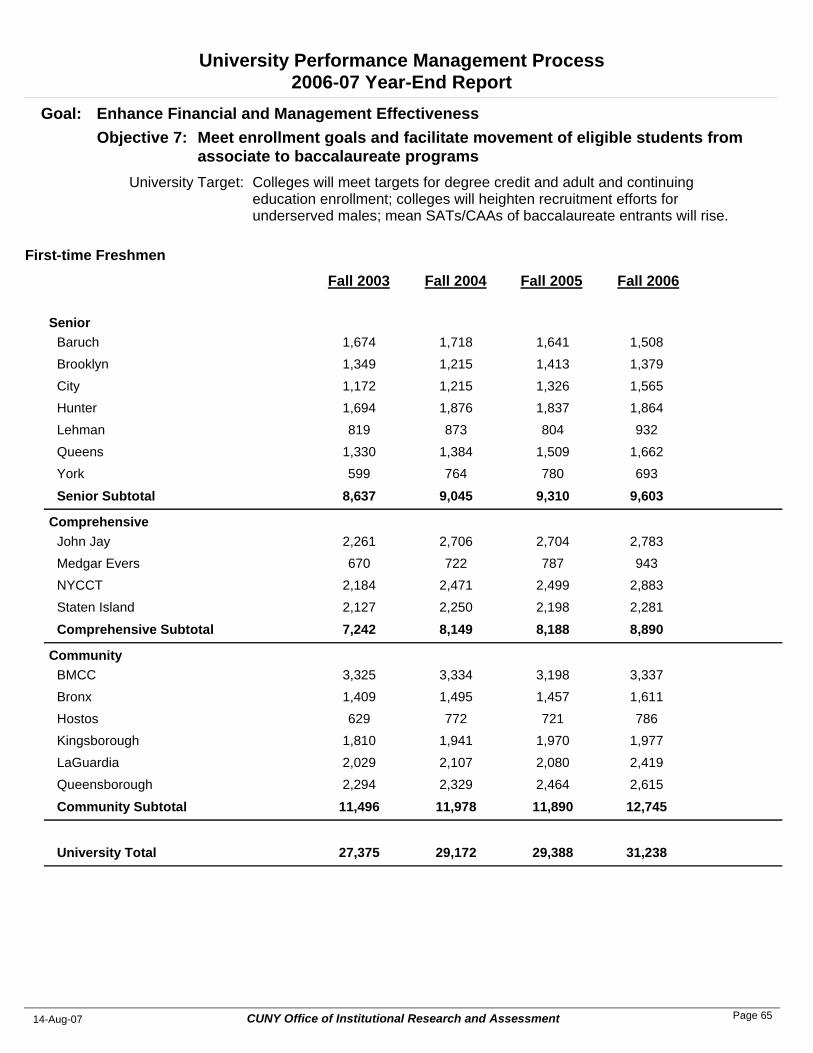
University Performance Management Process2006-07 Year-End Report
Colleges will meet targets for degree credit and adult and continuing education enrollment; colleges will heighten recruitment efforts for underserved males; mean SATs/CAAs of baccalaureate entrants will rise.
University Target:
Meet enrollment goals and facilitate movement of eligible students from associate to baccalaureate programs
Objective 7: Goal: Enhance Financial and Management Effectiveness
Fall 2004 Fall 2005 Fall 2006
First-time Freshmen
Fall 2003
SeniorBaruch 1,718 1,641 1,5081,674Brooklyn 1,215 1,413 1,3791,349City 1,215 1,326 1,5651,172Hunter 1,876 1,837 1,8641,694Lehman 873 804 932819Queens 1,384 1,509 1,6621,330York 764 780 693599
Senior Subtotal 9,045 9,310 9,6038,637
ComprehensiveJohn Jay 2,706 2,704 2,7832,261Medgar Evers 722 787 943670NYCCT 2,471 2,499 2,8832,184Staten Island 2,250 2,198 2,2812,127
Comprehensive Subtotal 8,149 8,188 8,8907,242
CommunityBMCC 3,334 3,198 3,3373,325Bronx 1,495 1,457 1,6111,409Hostos 772 721 786629Kingsborough 1,941 1,970 1,9771,810LaGuardia 2,107 2,080 2,4192,029Queensborough 2,329 2,464 2,6152,294
Community Subtotal 11,978 11,890 12,74511,496
University Total 29,172 29,388 31,23827,375
CUNY Office of Institutional Research and Assessment14-Aug-07 Page 65
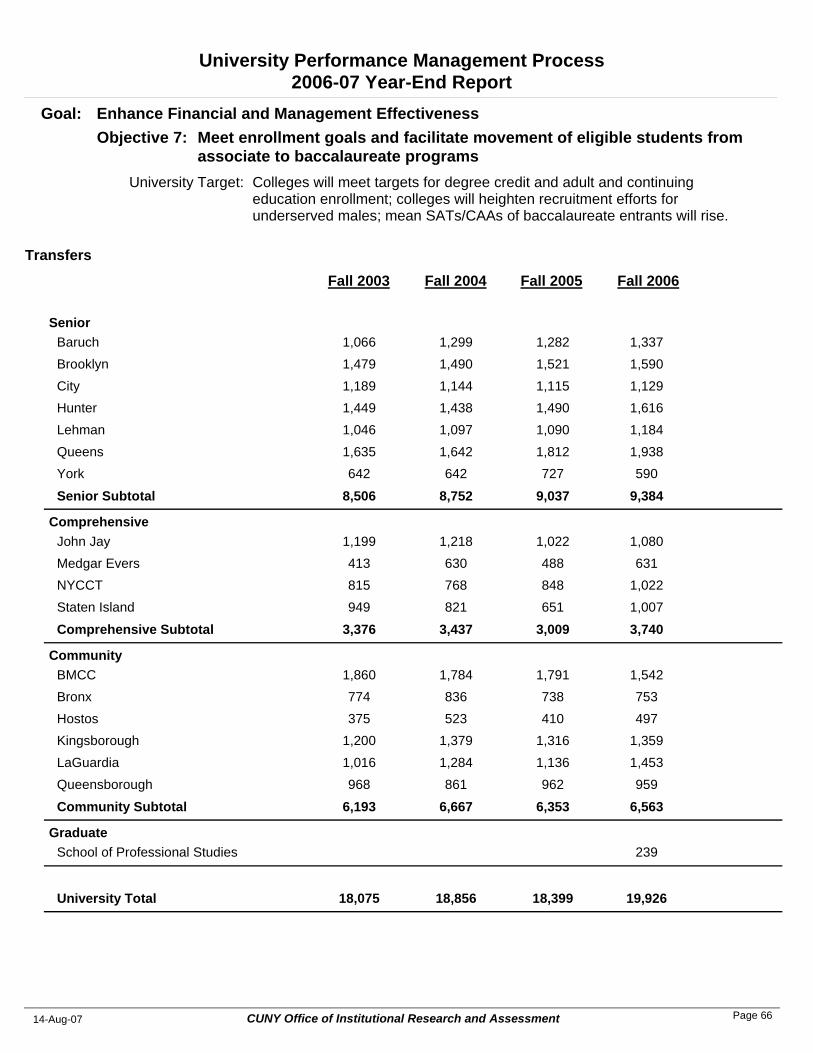
University Performance Management Process2006-07 Year-End Report
Colleges will meet targets for degree credit and adult and continuing education enrollment; colleges will heighten recruitment efforts for underserved males; mean SATs/CAAs of baccalaureate entrants will rise.
University Target:
Meet enrollment goals and facilitate movement of eligible students from associate to baccalaureate programs
Objective 7: Goal: Enhance Financial and Management Effectiveness
Fall 2004 Fall 2005 Fall 2006
Transfers
Fall 2003
SeniorBaruch 1,299 1,282 1,3371,066Brooklyn 1,490 1,521 1,5901,479City 1,144 1,115 1,1291,189Hunter 1,438 1,490 1,6161,449Lehman 1,097 1,090 1,1841,046Queens 1,642 1,812 1,9381,635York 642 727 590642
Senior Subtotal 8,752 9,037 9,3848,506
ComprehensiveJohn Jay 1,218 1,022 1,0801,199Medgar Evers 630 488 631413NYCCT 768 848 1,022815Staten Island 821 651 1,007949
Comprehensive Subtotal 3,437 3,009 3,7403,376
CommunityBMCC 1,784 1,791 1,5421,860Bronx 836 738 753774Hostos 523 410 497375Kingsborough 1,379 1,316 1,3591,200LaGuardia 1,284 1,136 1,4531,016Queensborough 861 962 959968
Community Subtotal 6,667 6,353 6,5636,193
GraduateSchool of Professional Studies 239
University Total 18,856 18,399 19,92618,075
CUNY Office of Institutional Research and Assessment14-Aug-07 Page 66
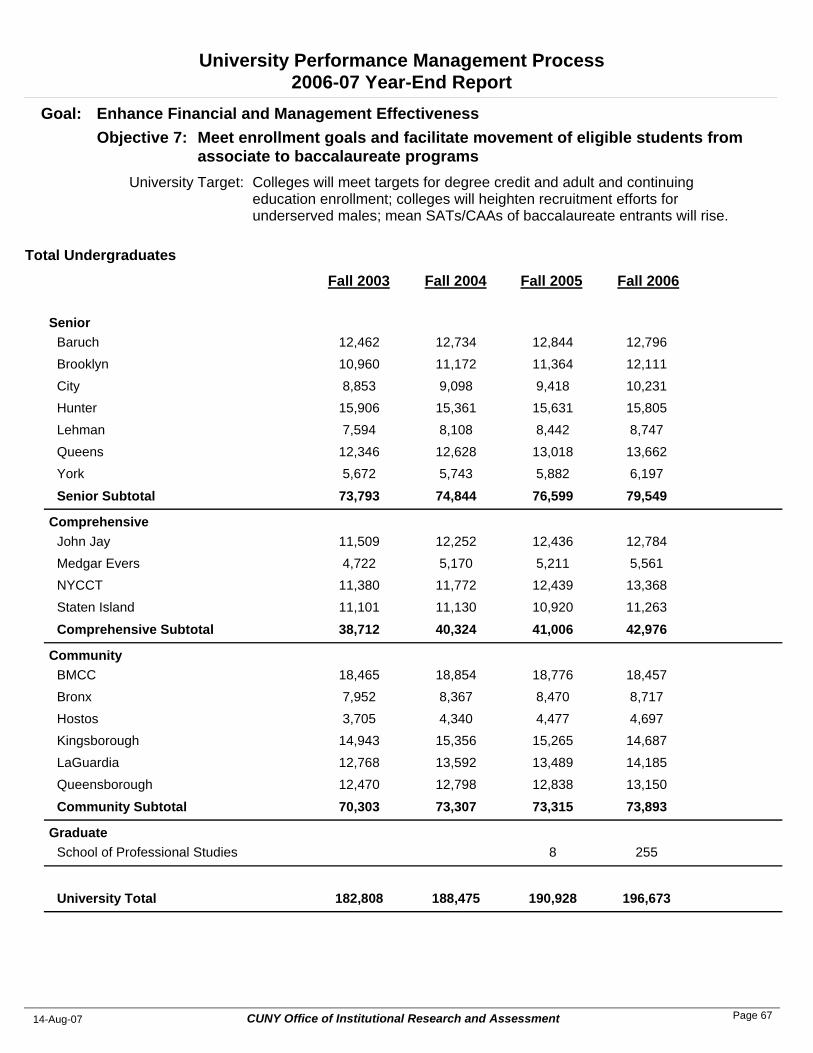
University Performance Management Process2006-07 Year-End Report
Colleges will meet targets for degree credit and adult and continuing education enrollment; colleges will heighten recruitment efforts for underserved males; mean SATs/CAAs of baccalaureate entrants will rise.
University Target:
Meet enrollment goals and facilitate movement of eligible students from associate to baccalaureate programs
Objective 7: Goal: Enhance Financial and Management Effectiveness
Fall 2004 Fall 2005 Fall 2006
Total Undergraduates
Fall 2003
SeniorBaruch 12,734 12,844 12,79612,462Brooklyn 11,172 11,364 12,11110,960City 9,098 9,418 10,2318,853Hunter 15,361 15,631 15,80515,906Lehman 8,108 8,442 8,7477,594Queens 12,628 13,018 13,66212,346York 5,743 5,882 6,1975,672
Senior Subtotal 74,844 76,599 79,54973,793
ComprehensiveJohn Jay 12,252 12,436 12,78411,509Medgar Evers 5,170 5,211 5,5614,722NYCCT 11,772 12,439 13,36811,380Staten Island 11,130 10,920 11,26311,101
Comprehensive Subtotal 40,324 41,006 42,97638,712
CommunityBMCC 18,854 18,776 18,45718,465Bronx 8,367 8,470 8,7177,952Hostos 4,340 4,477 4,6973,705Kingsborough 15,356 15,265 14,68714,943LaGuardia 13,592 13,489 14,18512,768Queensborough 12,798 12,838 13,15012,470
Community Subtotal 73,307 73,315 73,89370,303
GraduateSchool of Professional Studies 8 255
University Total 188,475 190,928 196,673182,808
CUNY Office of Institutional Research and Assessment14-Aug-07 Page 67
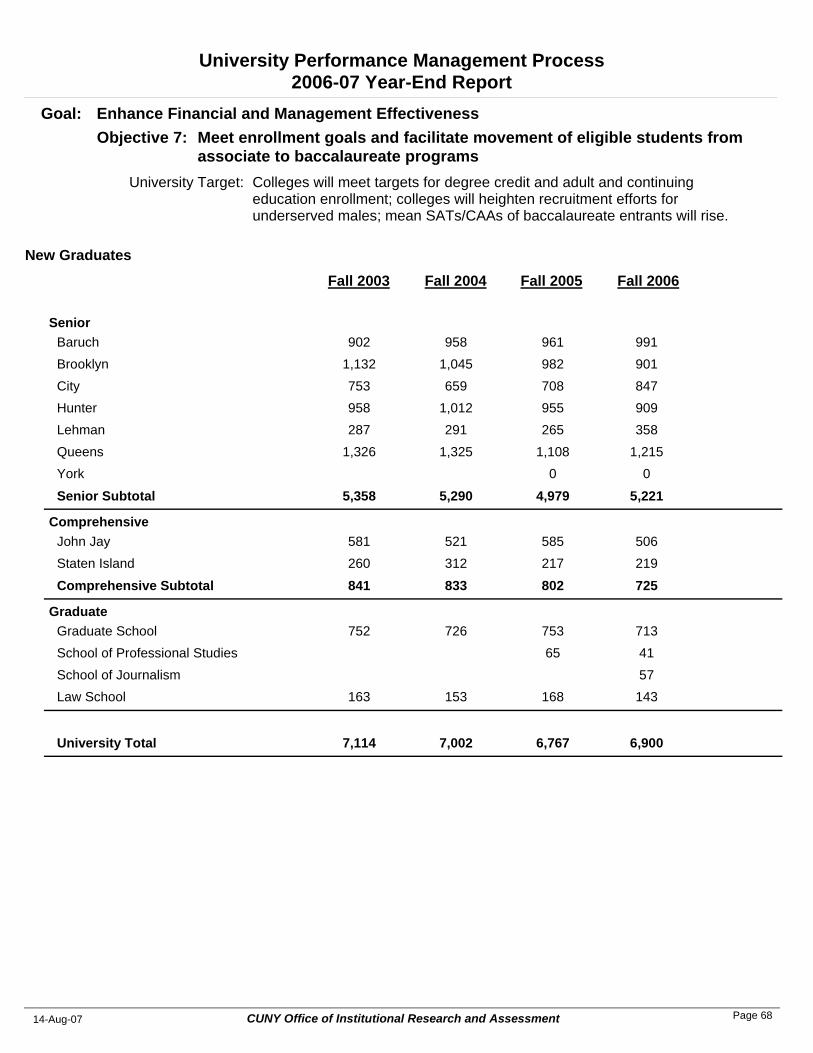
University Performance Management Process2006-07 Year-End Report
Colleges will meet targets for degree credit and adult and continuing education enrollment; colleges will heighten recruitment efforts for underserved males; mean SATs/CAAs of baccalaureate entrants will rise.
University Target:
Meet enrollment goals and facilitate movement of eligible students from associate to baccalaureate programs
Objective 7: Goal: Enhance Financial and Management Effectiveness
Fall 2004 Fall 2005 Fall 2006
New Graduates
Fall 2003
SeniorBaruch 958 961 991902Brooklyn 1,045 982 9011,132City 659 708 847753Hunter 1,012 955 909958Lehman 291 265 358287Queens 1,325 1,108 1,2151,326York 0 0
Senior Subtotal 5,290 4,979 5,2215,358
ComprehensiveJohn Jay 521 585 506581Staten Island 312 217 219260
Comprehensive Subtotal 833 802 725841
GraduateGraduate School 726 753 713752School of Professional Studies 65 41School of Journalism 57Law School 153 168 143163
University Total 7,002 6,767 6,9007,114
CUNY Office of Institutional Research and Assessment14-Aug-07 Page 68
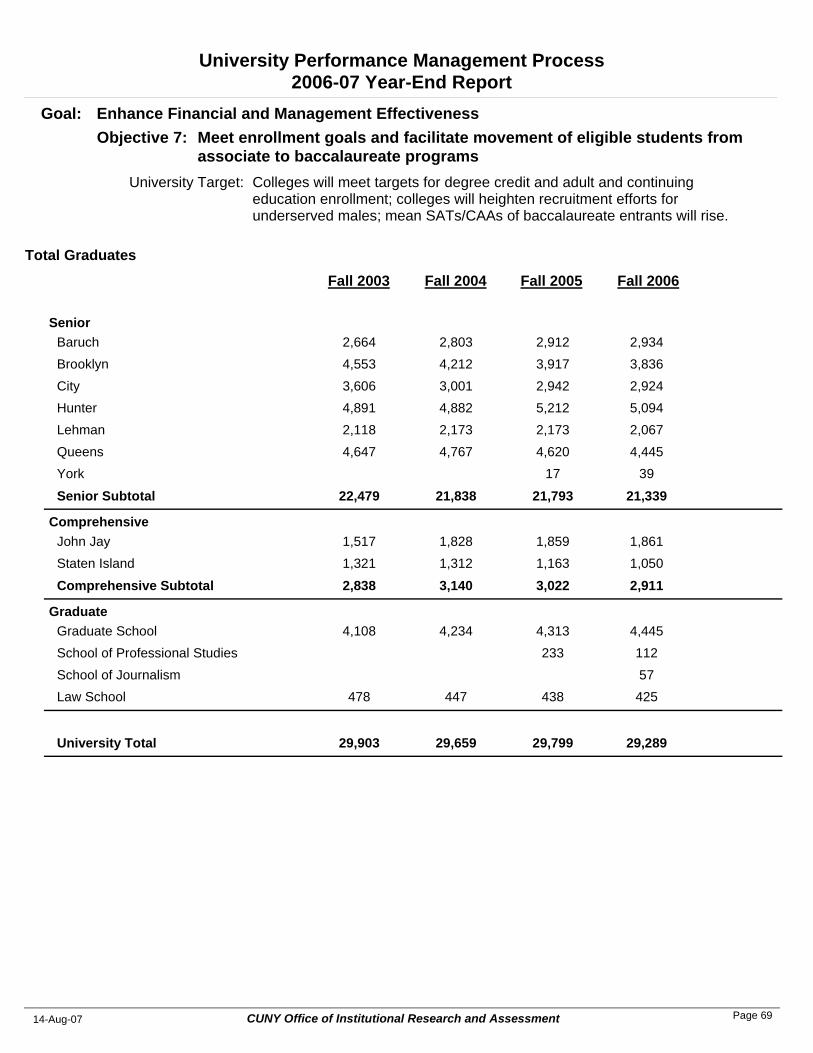
University Performance Management Process2006-07 Year-End Report
Colleges will meet targets for degree credit and adult and continuing education enrollment; colleges will heighten recruitment efforts for underserved males; mean SATs/CAAs of baccalaureate entrants will rise.
University Target:
Meet enrollment goals and facilitate movement of eligible students from associate to baccalaureate programs
Objective 7: Goal: Enhance Financial and Management Effectiveness
Fall 2004 Fall 2005 Fall 2006
Total Graduates
Fall 2003
SeniorBaruch 2,803 2,912 2,9342,664Brooklyn 4,212 3,917 3,8364,553City 3,001 2,942 2,9243,606Hunter 4,882 5,212 5,0944,891Lehman 2,173 2,173 2,0672,118Queens 4,767 4,620 4,4454,647York 17 39
Senior Subtotal 21,838 21,793 21,33922,479
ComprehensiveJohn Jay 1,828 1,859 1,8611,517Staten Island 1,312 1,163 1,0501,321
Comprehensive Subtotal 3,140 3,022 2,9112,838
GraduateGraduate School 4,234 4,313 4,4454,108School of Professional Studies 233 112School of Journalism 57Law School 447 438 425478
University Total 29,659 29,799 29,28929,903
CUNY Office of Institutional Research and Assessment14-Aug-07 Page 69
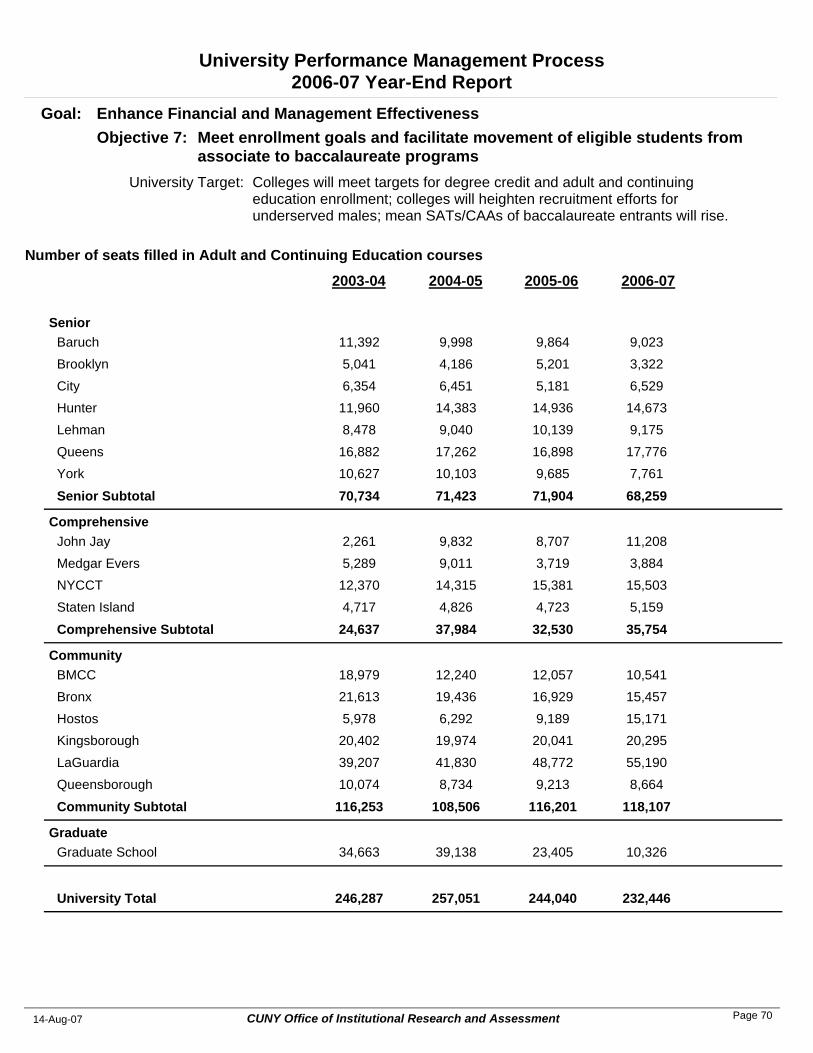
University Performance Management Process2006-07 Year-End Report
Colleges will meet targets for degree credit and adult and continuing education enrollment; colleges will heighten recruitment efforts for underserved males; mean SATs/CAAs of baccalaureate entrants will rise.
University Target:
Meet enrollment goals and facilitate movement of eligible students from associate to baccalaureate programs
Objective 7: Goal: Enhance Financial and Management Effectiveness
2004-05 2005-06 2006-07
Number of seats filled in Adult and Continuing Education courses
2003-04
SeniorBaruch 9,998 9,864 9,02311,392Brooklyn 4,186 5,201 3,3225,041City 6,451 5,181 6,5296,354Hunter 14,383 14,936 14,67311,960Lehman 9,040 10,139 9,1758,478Queens 17,262 16,898 17,77616,882York 10,103 9,685 7,76110,627
Senior Subtotal 71,423 71,904 68,25970,734
ComprehensiveJohn Jay 9,832 8,707 11,2082,261Medgar Evers 9,011 3,719 3,8845,289NYCCT 14,315 15,381 15,50312,370Staten Island 4,826 4,723 5,1594,717
Comprehensive Subtotal 37,984 32,530 35,75424,637
CommunityBMCC 12,240 12,057 10,54118,979Bronx 19,436 16,929 15,45721,613Hostos 6,292 9,189 15,1715,978Kingsborough 19,974 20,041 20,29520,402LaGuardia 41,830 48,772 55,19039,207Queensborough 8,734 9,213 8,66410,074
Community Subtotal 108,506 116,201 118,107116,253
GraduateGraduate School 39,138 23,405 10,32634,663
University Total 257,051 244,040 232,446246,287
CUNY Office of Institutional Research and Assessment14-Aug-07 Page 70
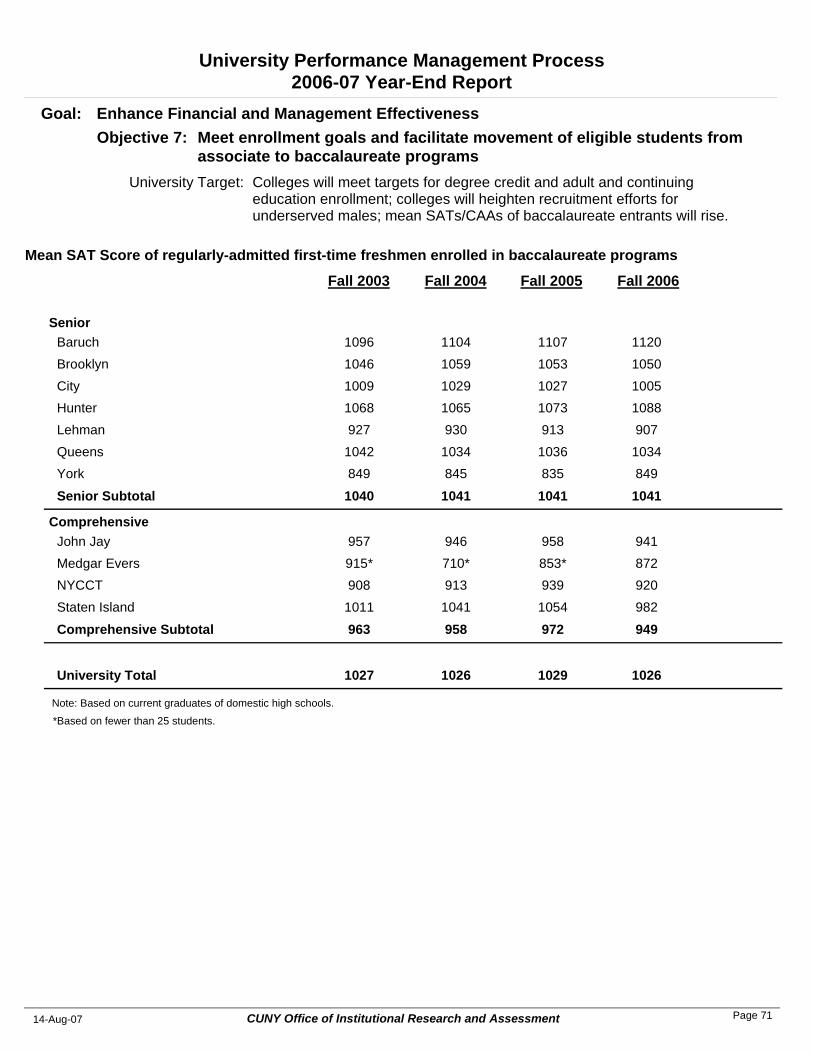
University Performance Management Process2006-07 Year-End Report
Colleges will meet targets for degree credit and adult and continuing education enrollment; colleges will heighten recruitment efforts for underserved males; mean SATs/CAAs of baccalaureate entrants will rise.
University Target:
Meet enrollment goals and facilitate movement of eligible students from associate to baccalaureate programs
Objective 7: Goal: Enhance Financial and Management Effectiveness
Fall 2004 Fall 2005 Fall 2006
Mean SAT Score of regularly-admitted first-time freshmen enrolled in baccalaureate programs
Fall 2003
SeniorBaruch 1104 1107 11201096Brooklyn 1059 1053 10501046City 1029 1027 10051009Hunter 1065 1073 10881068Lehman 930 913 907927Queens 1034 1036 10341042York 845 835 849849
Senior Subtotal 1041 1041 10411040
ComprehensiveJohn Jay 946 958 941957Medgar Evers 710* 853* 872915*NYCCT 913 939 920908Staten Island 1041 1054 9821011
Comprehensive Subtotal 958 972 949963
University Total 1026 1029 10261027
Note: Based on current graduates of domestic high schools.
*Based on fewer than 25 students.
CUNY Office of Institutional Research and Assessment14-Aug-07 Page 71
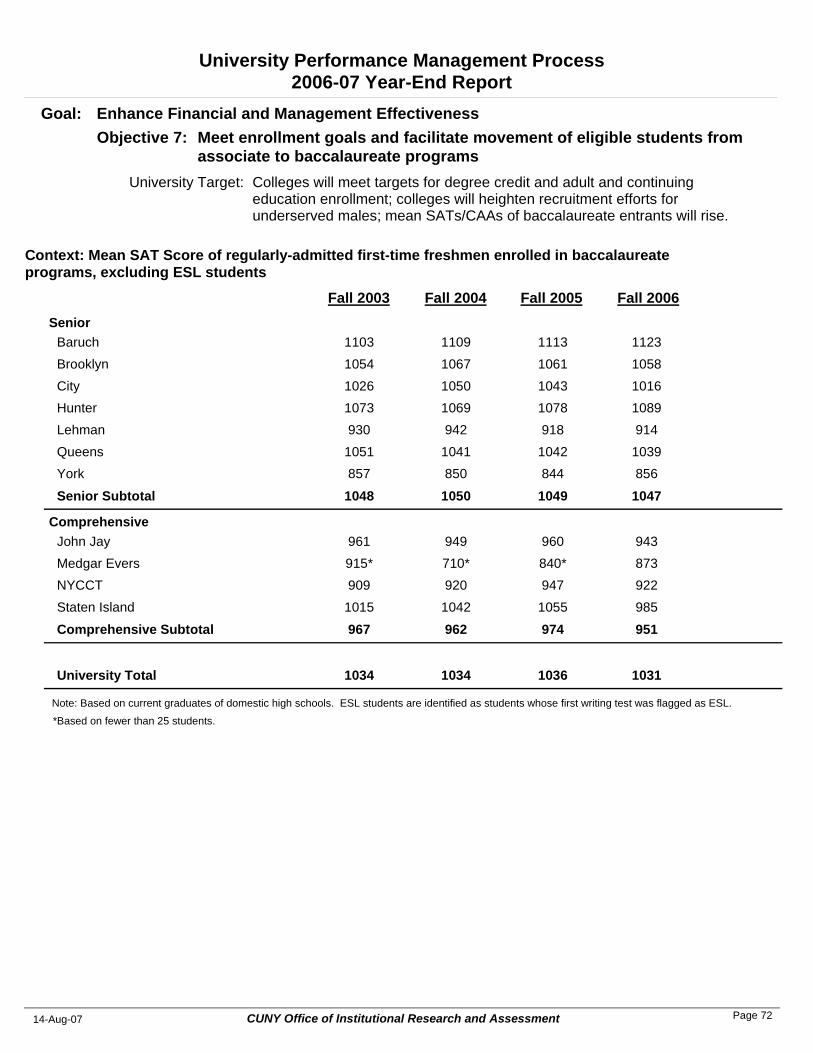
University Performance Management Process2006-07 Year-End Report
Colleges will meet targets for degree credit and adult and continuing education enrollment; colleges will heighten recruitment efforts for underserved males; mean SATs/CAAs of baccalaureate entrants will rise.
University Target:
Meet enrollment goals and facilitate movement of eligible students from associate to baccalaureate programs
Objective 7: Goal: Enhance Financial and Management Effectiveness
Fall 2004 Fall 2005 Fall 2006
Context: Mean SAT Score of regularly-admitted first-time freshmen enrolled in baccalaureate programs, excluding ESL students
Fall 2003Senior
Baruch 1109 1113 11231103Brooklyn 1067 1061 10581054City 1050 1043 10161026Hunter 1069 1078 10891073Lehman 942 918 914930Queens 1041 1042 10391051York 850 844 856857
Senior Subtotal 1050 1049 10471048
ComprehensiveJohn Jay 949 960 943961Medgar Evers 710* 840* 873915*NYCCT 920 947 922909Staten Island 1042 1055 9851015
Comprehensive Subtotal 962 974 951967
University Total 1034 1036 10311034
Note: Based on current graduates of domestic high schools. ESL students are identified as students whose first writing test was flagged as ESL.
*Based on fewer than 25 students.
CUNY Office of Institutional Research and Assessment14-Aug-07 Page 72
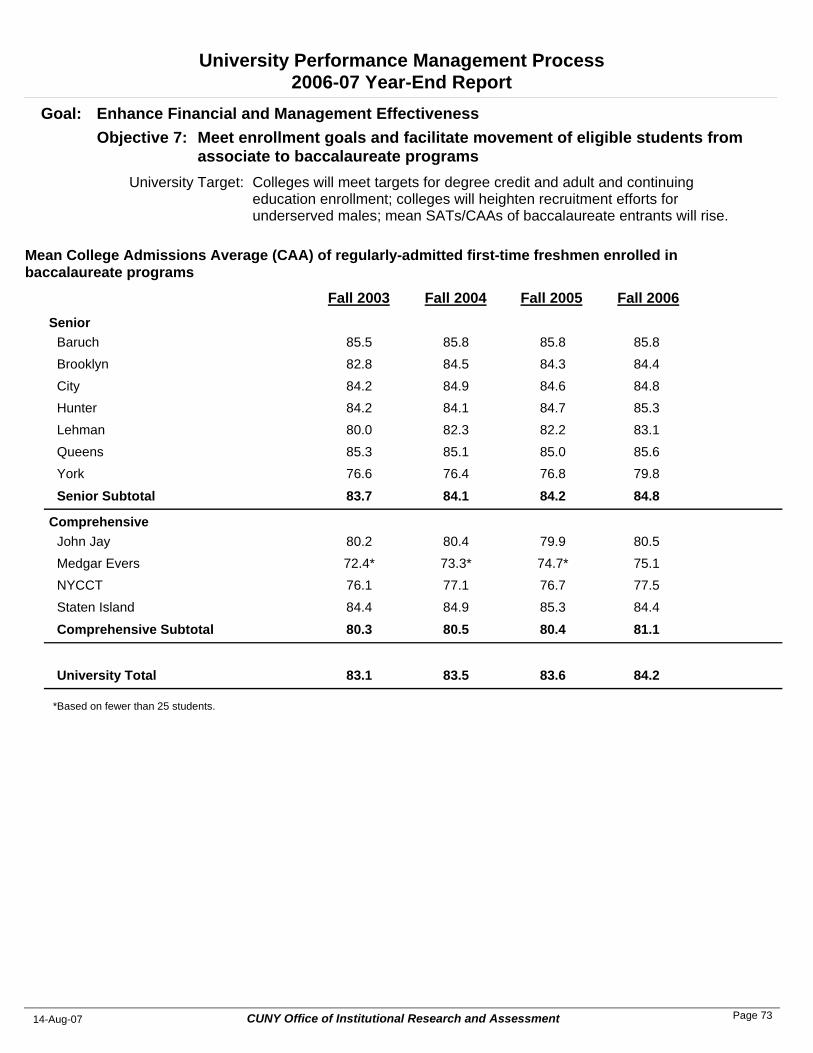
University Performance Management Process2006-07 Year-End Report
Colleges will meet targets for degree credit and adult and continuing education enrollment; colleges will heighten recruitment efforts for underserved males; mean SATs/CAAs of baccalaureate entrants will rise.
University Target:
Meet enrollment goals and facilitate movement of eligible students from associate to baccalaureate programs
Objective 7: Goal: Enhance Financial and Management Effectiveness
Fall 2004 Fall 2005 Fall 2006
Mean College Admissions Average (CAA) of regularly-admitted first-time freshmen enrolled in baccalaureate programs
Fall 2003Senior
Baruch 85.8 85.8 85.885.5Brooklyn 84.5 84.3 84.482.8City 84.9 84.6 84.884.2Hunter 84.1 84.7 85.384.2Lehman 82.3 82.2 83.180.0Queens 85.1 85.0 85.685.3York 76.4 76.8 79.876.6
Senior Subtotal 84.1 84.2 84.883.7
ComprehensiveJohn Jay 80.4 79.9 80.580.2Medgar Evers 73.3* 74.7* 75.172.4*NYCCT 77.1 76.7 77.576.1Staten Island 84.9 85.3 84.484.4
Comprehensive Subtotal 80.5 80.4 81.180.3
University Total 83.5 83.6 84.283.1
*Based on fewer than 25 students.
CUNY Office of Institutional Research and Assessment14-Aug-07 Page 73
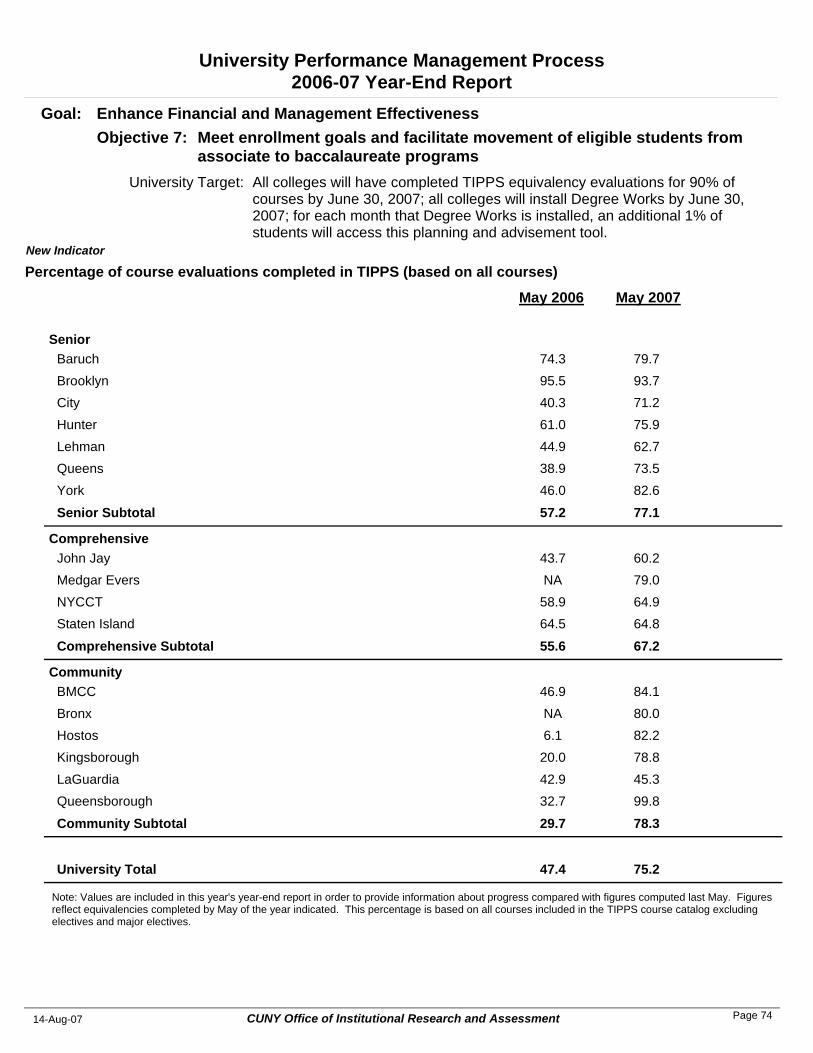
University Performance Management Process2006-07 Year-End Report
All colleges will have completed TIPPS equivalency evaluations for 90% of courses by June 30, 2007; all colleges will install Degree Works by June 30, 2007; for each month that Degree Works is installed, an additional 1% of students will access this planning and advisement tool.
University Target:
Meet enrollment goals and facilitate movement of eligible students from associate to baccalaureate programs
Objective 7: Goal: Enhance Financial and Management Effectiveness
May 2006 May 2007
Percentage of course evaluations completed in TIPPS (based on all courses)New Indicator
SeniorBaruch 74.3 79.7Brooklyn 95.5 93.7City 40.3 71.2Hunter 61.0 75.9Lehman 44.9 62.7Queens 38.9 73.5York 46.0 82.6
Senior Subtotal 57.2 77.1
ComprehensiveJohn Jay 43.7 60.2Medgar Evers NA 79.0NYCCT 58.9 64.9Staten Island 64.5 64.8
Comprehensive Subtotal 55.6 67.2
CommunityBMCC 46.9 84.1Bronx NA 80.0Hostos 6.1 82.2Kingsborough 20.0 78.8LaGuardia 42.9 45.3Queensborough 32.7 99.8
Community Subtotal 29.7 78.3
University Total 47.4 75.2
Note: Values are included in this year's year-end report in order to provide information about progress compared with figures computed last May. Figures reflect equivalencies completed by May of the year indicated. This percentage is based on all courses included in the TIPPS course catalog excluding electives and major electives.
CUNY Office of Institutional Research and Assessment14-Aug-07 Page 74
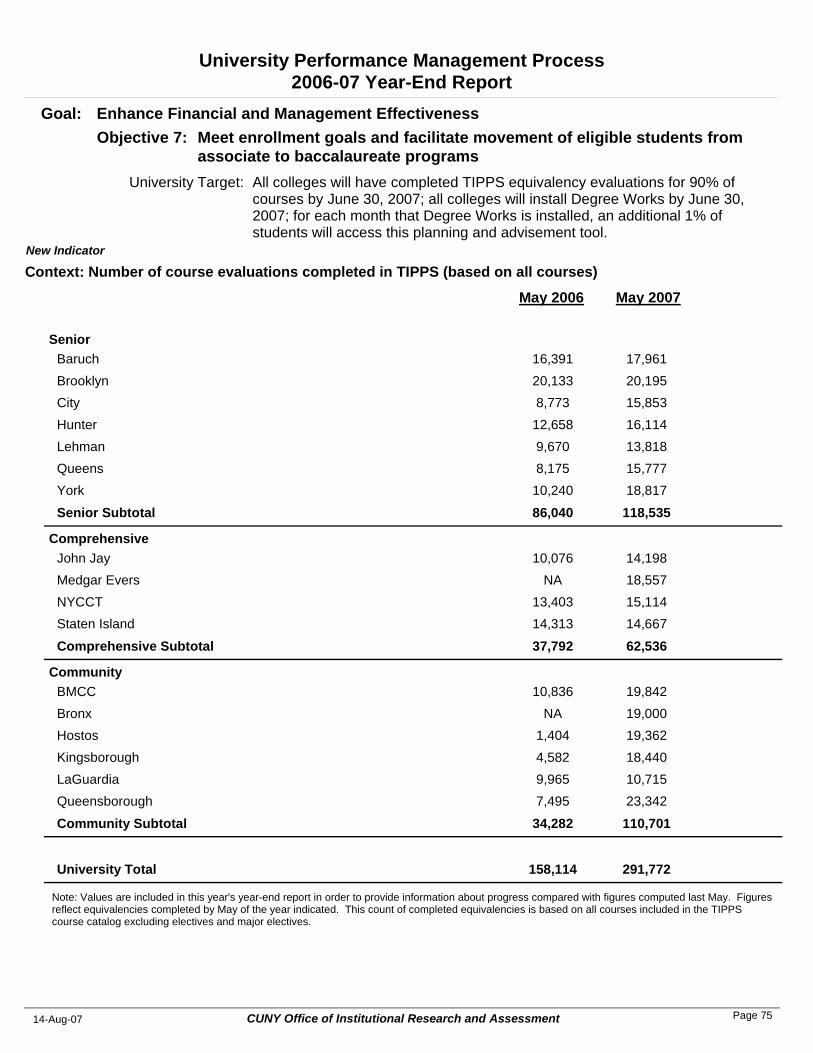
University Performance Management Process2006-07 Year-End Report
All colleges will have completed TIPPS equivalency evaluations for 90% of courses by June 30, 2007; all colleges will install Degree Works by June 30, 2007; for each month that Degree Works is installed, an additional 1% of students will access this planning and advisement tool.
University Target:
Meet enrollment goals and facilitate movement of eligible students from associate to baccalaureate programs
Objective 7: Goal: Enhance Financial and Management Effectiveness
May 2006 May 2007
Context: Number of course evaluations completed in TIPPS (based on all courses)New Indicator
SeniorBaruch 16,391 17,961Brooklyn 20,133 20,195City 8,773 15,853Hunter 12,658 16,114Lehman 9,670 13,818Queens 8,175 15,777York 10,240 18,817
Senior Subtotal 86,040 118,535
ComprehensiveJohn Jay 10,076 14,198Medgar Evers NA 18,557NYCCT 13,403 15,114Staten Island 14,313 14,667
Comprehensive Subtotal 37,792 62,536
CommunityBMCC 10,836 19,842Bronx NA 19,000Hostos 1,404 19,362Kingsborough 4,582 18,440LaGuardia 9,965 10,715Queensborough 7,495 23,342
Community Subtotal 34,282 110,701
University Total 158,114 291,772
Note: Values are included in this year's year-end report in order to provide information about progress compared with figures computed last May. Figures reflect equivalencies completed by May of the year indicated. This count of completed equivalencies is based on all courses included in the TIPPS course catalog excluding electives and major electives.
CUNY Office of Institutional Research and Assessment14-Aug-07 Page 75
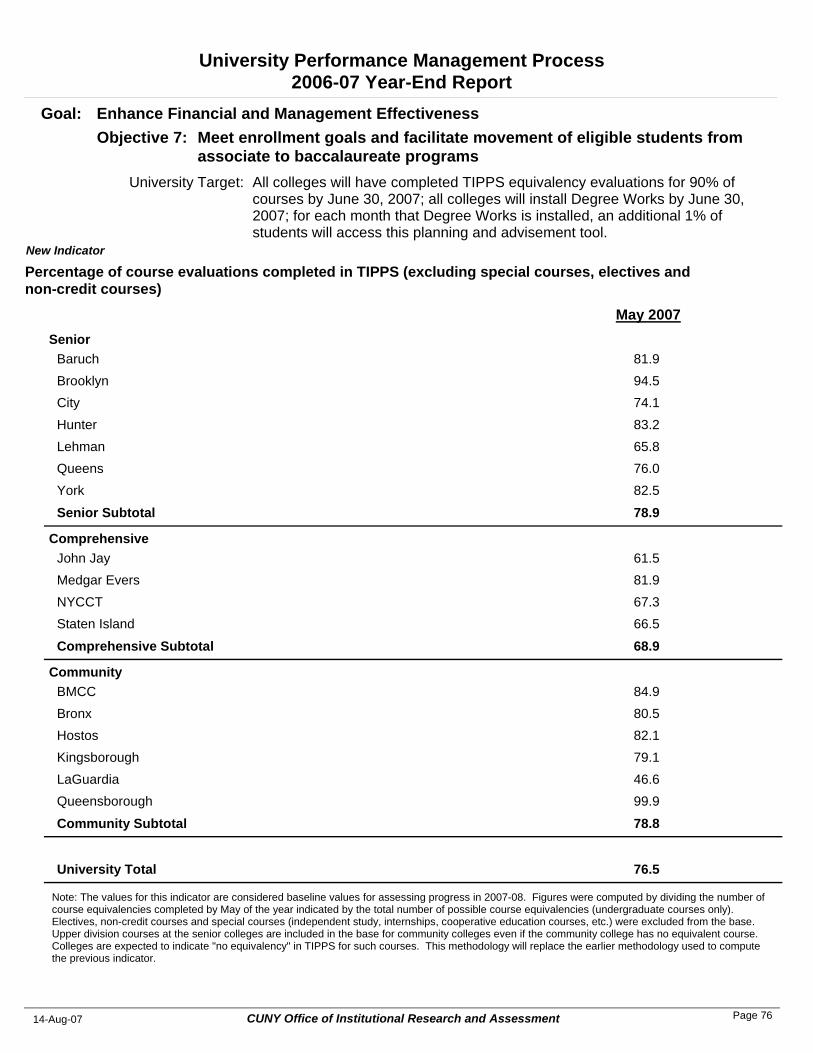
University Performance Management Process2006-07 Year-End Report
All colleges will have completed TIPPS equivalency evaluations for 90% of courses by June 30, 2007; all colleges will install Degree Works by June 30, 2007; for each month that Degree Works is installed, an additional 1% of students will access this planning and advisement tool.
University Target:
Meet enrollment goals and facilitate movement of eligible students from associate to baccalaureate programs
Objective 7: Goal: Enhance Financial and Management Effectiveness
May 2007
Percentage of course evaluations completed in TIPPS (excluding special courses, electives and non-credit courses)
New Indicator
SeniorBaruch 81.9Brooklyn 94.5City 74.1Hunter 83.2Lehman 65.8Queens 76.0York 82.5
Senior Subtotal 78.9
ComprehensiveJohn Jay 61.5Medgar Evers 81.9NYCCT 67.3Staten Island 66.5
Comprehensive Subtotal 68.9
CommunityBMCC 84.9Bronx 80.5Hostos 82.1Kingsborough 79.1LaGuardia 46.6Queensborough 99.9
Community Subtotal 78.8
University Total 76.5
Note: The values for this indicator are considered baseline values for assessing progress in 2007-08. Figures were computed by dividing the number of course equivalencies completed by May of the year indicated by the total number of possible course equivalencies (undergraduate courses only). Electives, non-credit courses and special courses (independent study, internships, cooperative education courses, etc.) were excluded from the base. Upper division courses at the senior colleges are included in the base for community colleges even if the community college has no equivalent course. Colleges are expected to indicate "no equivalency" in TIPPS for such courses. This methodology will replace the earlier methodology used to compute the previous indicator.
CUNY Office of Institutional Research and Assessment14-Aug-07 Page 76
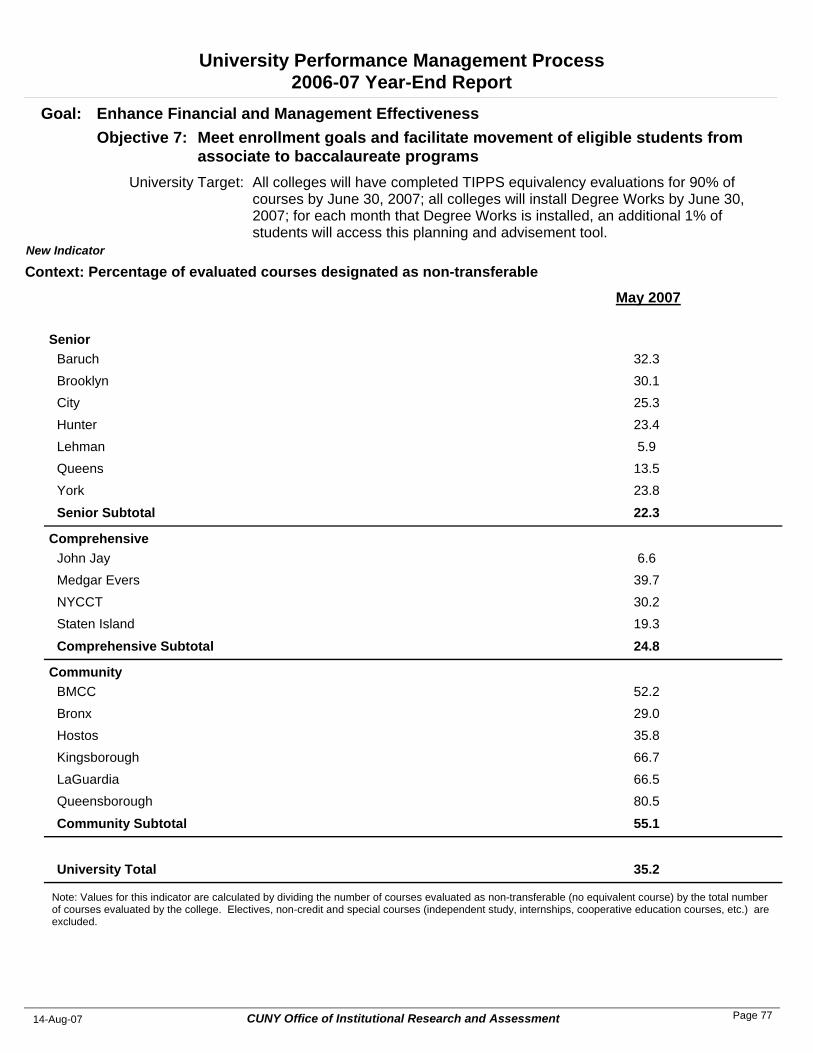
University Performance Management Process2006-07 Year-End Report
All colleges will have completed TIPPS equivalency evaluations for 90% of courses by June 30, 2007; all colleges will install Degree Works by June 30, 2007; for each month that Degree Works is installed, an additional 1% of students will access this planning and advisement tool.
University Target:
Meet enrollment goals and facilitate movement of eligible students from associate to baccalaureate programs
Objective 7: Goal: Enhance Financial and Management Effectiveness
May 2007
Context: Percentage of evaluated courses designated as non-transferableNew Indicator
SeniorBaruch 32.3Brooklyn 30.1City 25.3Hunter 23.4Lehman 5.9Queens 13.5York 23.8
Senior Subtotal 22.3
ComprehensiveJohn Jay 6.6Medgar Evers 39.7NYCCT 30.2Staten Island 19.3
Comprehensive Subtotal 24.8
CommunityBMCC 52.2Bronx 29.0Hostos 35.8Kingsborough 66.7LaGuardia 66.5Queensborough 80.5
Community Subtotal 55.1
University Total 35.2
Note: Values for this indicator are calculated by dividing the number of courses evaluated as non-transferable (no equivalent course) by the total number of courses evaluated by the college. Electives, non-credit and special courses (independent study, internships, cooperative education courses, etc.) are excluded.
CUNY Office of Institutional Research and Assessment14-Aug-07 Page 77

University Performance Management Process2006-07 Year-End Report
All colleges will have completed TIPPS equivalency evaluations for 90% of courses by June 30, 2007; all colleges will install Degree Works by June 30, 2007; for each month that Degree Works is installed, an additional 1% of students will access this planning and advisement tool.
University Target:
Meet enrollment goals and facilitate movement of eligible students from associate to baccalaureate programs
Objective 7: Goal: Enhance Financial and Management Effectiveness
Fall 2004 Fall 2005 Fall 2006Baccalaureate Programs
Context: Number of transfers from CUNY AA/AS programs
Fall 2003Senior
Baruch 355 343 351338Brooklyn 393 438 478351City 269 268 286243Hunter 359 358 360304Lehman 264 261 325268Queens 380 437 454312York 137 224 172157
Senior Subtotal 2,157 2,329 2,4261,973
ComprehensiveJohn Jay 347 276 306330Medgar Evers 15 17 3212NYCCT 39 48 4255Staten Island 112 43 234224
Comprehensive Subtotal 513 384 614621
University Total 2,670 2,713 3,0402,594
Note: Includes students who transferred with or without an associate degree.
CUNY Office of Institutional Research and Assessment14-Aug-07 Page 78
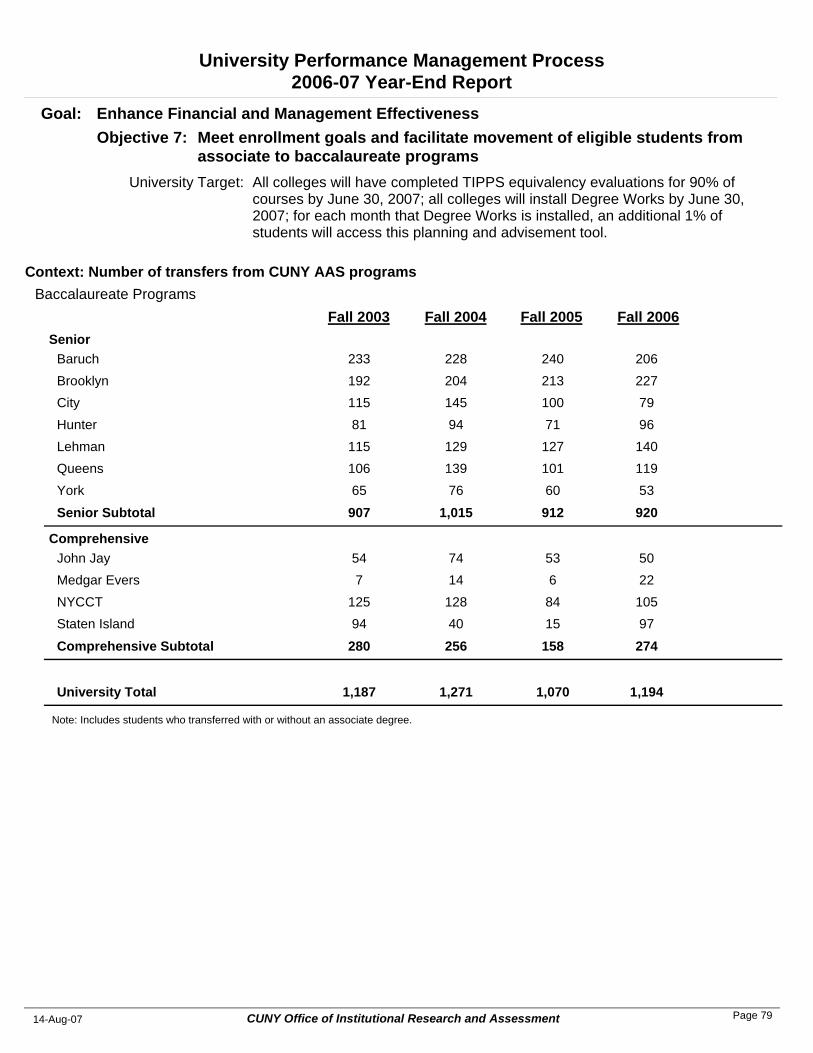
University Performance Management Process2006-07 Year-End Report
All colleges will have completed TIPPS equivalency evaluations for 90% of courses by June 30, 2007; all colleges will install Degree Works by June 30, 2007; for each month that Degree Works is installed, an additional 1% of students will access this planning and advisement tool.
University Target:
Meet enrollment goals and facilitate movement of eligible students from associate to baccalaureate programs
Objective 7: Goal: Enhance Financial and Management Effectiveness
Fall 2004 Fall 2005 Fall 2006Baccalaureate Programs
Context: Number of transfers from CUNY AAS programs
Fall 2003Senior
Baruch 228 240 206233Brooklyn 204 213 227192City 145 100 79115Hunter 94 71 9681Lehman 129 127 140115Queens 139 101 119106York 76 60 5365
Senior Subtotal 1,015 912 920907
ComprehensiveJohn Jay 74 53 5054Medgar Evers 14 6 227NYCCT 128 84 105125Staten Island 40 15 9794
Comprehensive Subtotal 256 158 274280
University Total 1,271 1,070 1,1941,187
Note: Includes students who transferred with or without an associate degree.
CUNY Office of Institutional Research and Assessment14-Aug-07 Page 79
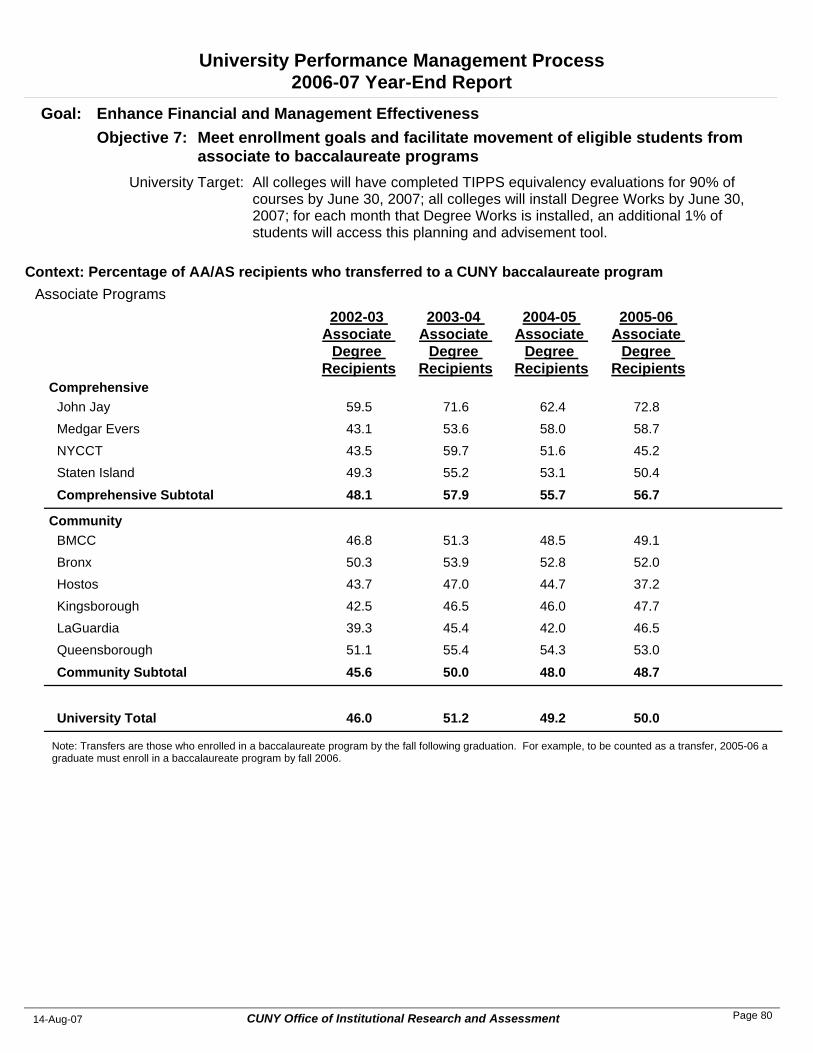
University Performance Management Process2006-07 Year-End Report
All colleges will have completed TIPPS equivalency evaluations for 90% of courses by June 30, 2007; all colleges will install Degree Works by June 30, 2007; for each month that Degree Works is installed, an additional 1% of students will access this planning and advisement tool.
University Target:
Meet enrollment goals and facilitate movement of eligible students from associate to baccalaureate programs
Objective 7: Goal: Enhance Financial and Management Effectiveness
2003-04 Associate
Degree Recipients
2004-05 Associate
Degree Recipients
2005-06 Associate
Degree Recipients
Associate ProgramsContext: Percentage of AA/AS recipients who transferred to a CUNY baccalaureate program
2002-03 Associate
Degree Recipients
ComprehensiveJohn Jay 71.6 62.4 72.859.5Medgar Evers 53.6 58.0 58.743.1NYCCT 59.7 51.6 45.243.5Staten Island 55.2 53.1 50.449.3
Comprehensive Subtotal 57.9 55.7 56.748.1
CommunityBMCC 51.3 48.5 49.146.8Bronx 53.9 52.8 52.050.3Hostos 47.0 44.7 37.243.7Kingsborough 46.5 46.0 47.742.5LaGuardia 45.4 42.0 46.539.3Queensborough 55.4 54.3 53.051.1
Community Subtotal 50.0 48.0 48.745.6
University Total 51.2 49.2 50.046.0
Note: Transfers are those who enrolled in a baccalaureate program by the fall following graduation. For example, to be counted as a transfer, 2005-06 a graduate must enroll in a baccalaureate program by fall 2006.
CUNY Office of Institutional Research and Assessment14-Aug-07 Page 80
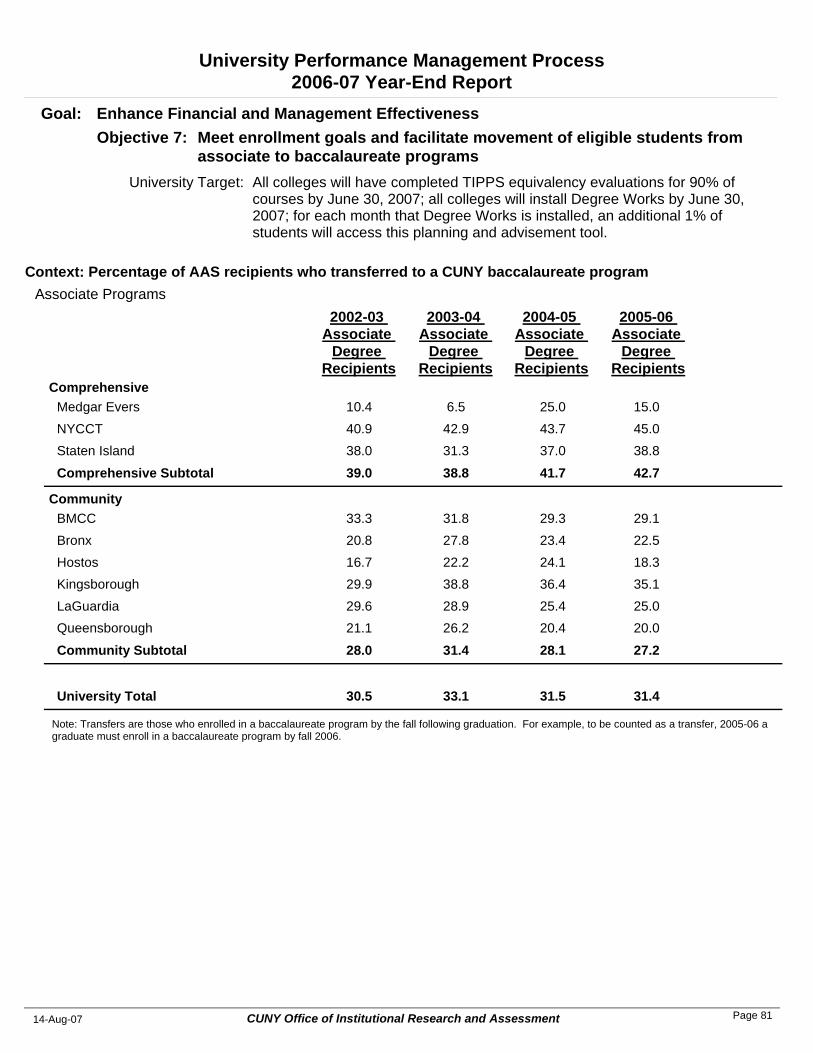
University Performance Management Process2006-07 Year-End Report
All colleges will have completed TIPPS equivalency evaluations for 90% of courses by June 30, 2007; all colleges will install Degree Works by June 30, 2007; for each month that Degree Works is installed, an additional 1% of students will access this planning and advisement tool.
University Target:
Meet enrollment goals and facilitate movement of eligible students from associate to baccalaureate programs
Objective 7: Goal: Enhance Financial and Management Effectiveness
2003-04 Associate
Degree Recipients
2004-05 Associate
Degree Recipients
2005-06 Associate
Degree Recipients
Associate ProgramsContext: Percentage of AAS recipients who transferred to a CUNY baccalaureate program
2002-03 Associate
Degree Recipients
ComprehensiveMedgar Evers 6.5 25.0 15.010.4NYCCT 42.9 43.7 45.040.9Staten Island 31.3 37.0 38.838.0
Comprehensive Subtotal 38.8 41.7 42.739.0
CommunityBMCC 31.8 29.3 29.133.3Bronx 27.8 23.4 22.520.8Hostos 22.2 24.1 18.316.7Kingsborough 38.8 36.4 35.129.9LaGuardia 28.9 25.4 25.029.6Queensborough 26.2 20.4 20.021.1
Community Subtotal 31.4 28.1 27.228.0
University Total 33.1 31.5 31.430.5
Note: Transfers are those who enrolled in a baccalaureate program by the fall following graduation. For example, to be counted as a transfer, 2005-06 a graduate must enroll in a baccalaureate program by fall 2006.
CUNY Office of Institutional Research and Assessment14-Aug-07 Page 81
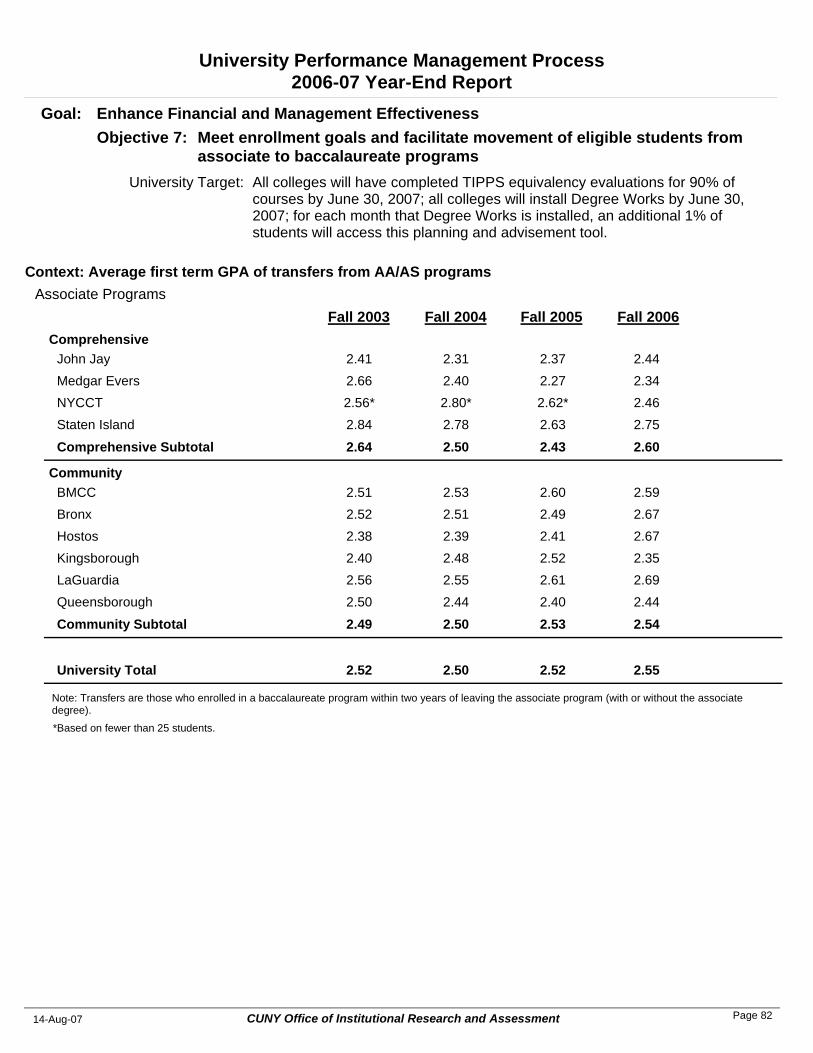
University Performance Management Process2006-07 Year-End Report
All colleges will have completed TIPPS equivalency evaluations for 90% of courses by June 30, 2007; all colleges will install Degree Works by June 30, 2007; for each month that Degree Works is installed, an additional 1% of students will access this planning and advisement tool.
University Target:
Meet enrollment goals and facilitate movement of eligible students from associate to baccalaureate programs
Objective 7: Goal: Enhance Financial and Management Effectiveness
Fall 2004 Fall 2005 Fall 2006Associate Programs
Context: Average first term GPA of transfers from AA/AS programs
Fall 2003Comprehensive
John Jay 2.31 2.37 2.442.41Medgar Evers 2.40 2.27 2.342.66NYCCT 2.80* 2.62* 2.462.56*Staten Island 2.78 2.63 2.752.84
Comprehensive Subtotal 2.50 2.43 2.602.64
CommunityBMCC 2.53 2.60 2.592.51Bronx 2.51 2.49 2.672.52Hostos 2.39 2.41 2.672.38Kingsborough 2.48 2.52 2.352.40LaGuardia 2.55 2.61 2.692.56Queensborough 2.44 2.40 2.442.50
Community Subtotal 2.50 2.53 2.542.49
University Total 2.50 2.52 2.552.52
Note: Transfers are those who enrolled in a baccalaureate program within two years of leaving the associate program (with or without the associate degree).
*Based on fewer than 25 students.
CUNY Office of Institutional Research and Assessment14-Aug-07 Page 82
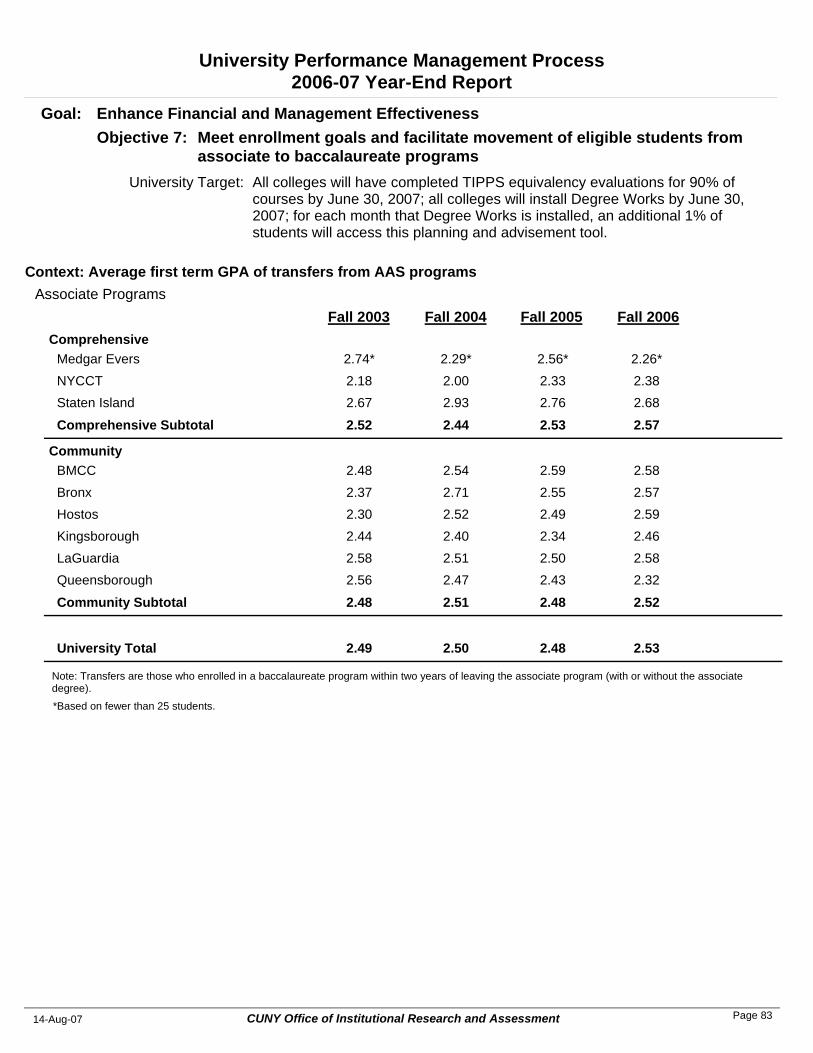
University Performance Management Process2006-07 Year-End Report
All colleges will have completed TIPPS equivalency evaluations for 90% of courses by June 30, 2007; all colleges will install Degree Works by June 30, 2007; for each month that Degree Works is installed, an additional 1% of students will access this planning and advisement tool.
University Target:
Meet enrollment goals and facilitate movement of eligible students from associate to baccalaureate programs
Objective 7: Goal: Enhance Financial and Management Effectiveness
Fall 2004 Fall 2005 Fall 2006Associate Programs
Context: Average first term GPA of transfers from AAS programs
Fall 2003Comprehensive
Medgar Evers 2.29* 2.56* 2.26*2.74*NYCCT 2.00 2.33 2.382.18Staten Island 2.93 2.76 2.682.67
Comprehensive Subtotal 2.44 2.53 2.572.52
CommunityBMCC 2.54 2.59 2.582.48Bronx 2.71 2.55 2.572.37Hostos 2.52 2.49 2.592.30Kingsborough 2.40 2.34 2.462.44LaGuardia 2.51 2.50 2.582.58Queensborough 2.47 2.43 2.322.56
Community Subtotal 2.51 2.48 2.522.48
University Total 2.50 2.48 2.532.49
Note: Transfers are those who enrolled in a baccalaureate program within two years of leaving the associate program (with or without the associate degree).
*Based on fewer than 25 students.
CUNY Office of Institutional Research and Assessment14-Aug-07 Page 83
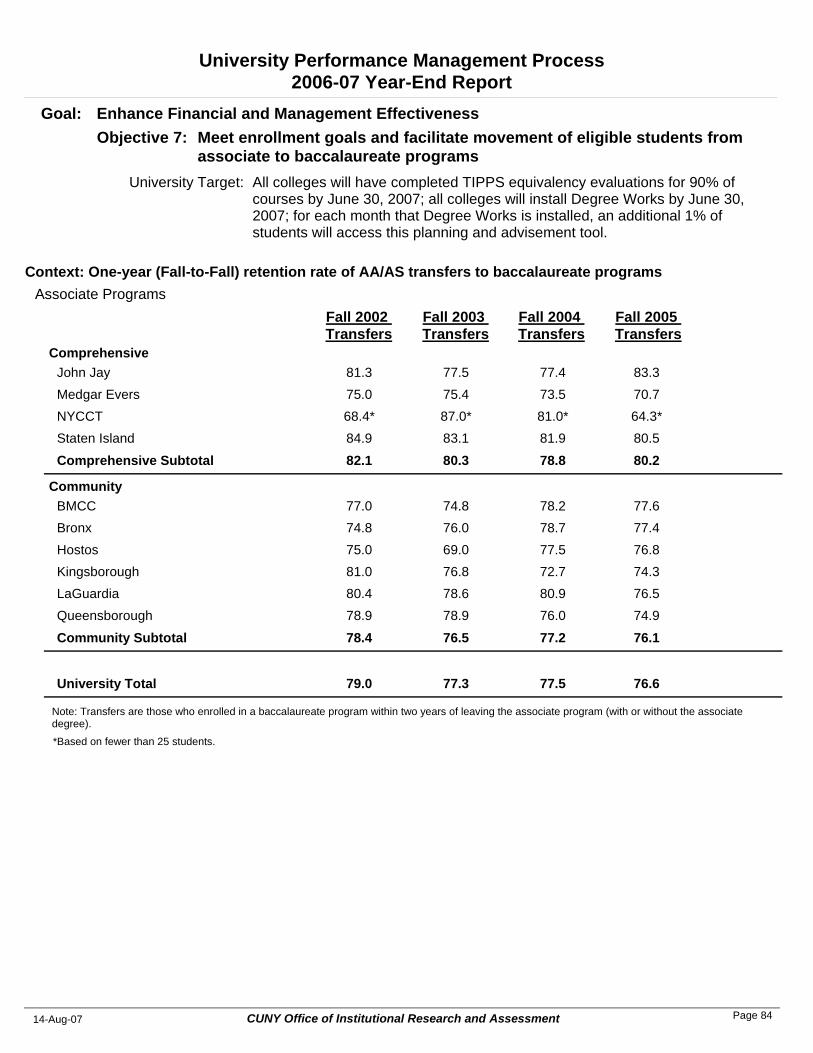
University Performance Management Process2006-07 Year-End Report
All colleges will have completed TIPPS equivalency evaluations for 90% of courses by June 30, 2007; all colleges will install Degree Works by June 30, 2007; for each month that Degree Works is installed, an additional 1% of students will access this planning and advisement tool.
University Target:
Meet enrollment goals and facilitate movement of eligible students from associate to baccalaureate programs
Objective 7: Goal: Enhance Financial and Management Effectiveness
Fall 2003 Transfers
Fall 2004 Transfers
Fall 2005 Transfers
Associate ProgramsContext: One-year (Fall-to-Fall) retention rate of AA/AS transfers to baccalaureate programs
Fall 2002 Transfers
ComprehensiveJohn Jay 77.5 77.4 83.381.3Medgar Evers 75.4 73.5 70.775.0NYCCT 87.0* 81.0* 64.3*68.4*Staten Island 83.1 81.9 80.584.9
Comprehensive Subtotal 80.3 78.8 80.282.1
CommunityBMCC 74.8 78.2 77.677.0Bronx 76.0 78.7 77.474.8Hostos 69.0 77.5 76.875.0Kingsborough 76.8 72.7 74.381.0LaGuardia 78.6 80.9 76.580.4Queensborough 78.9 76.0 74.978.9
Community Subtotal 76.5 77.2 76.178.4
University Total 77.3 77.5 76.679.0
Note: Transfers are those who enrolled in a baccalaureate program within two years of leaving the associate program (with or without the associate degree).
*Based on fewer than 25 students.
CUNY Office of Institutional Research and Assessment14-Aug-07 Page 84
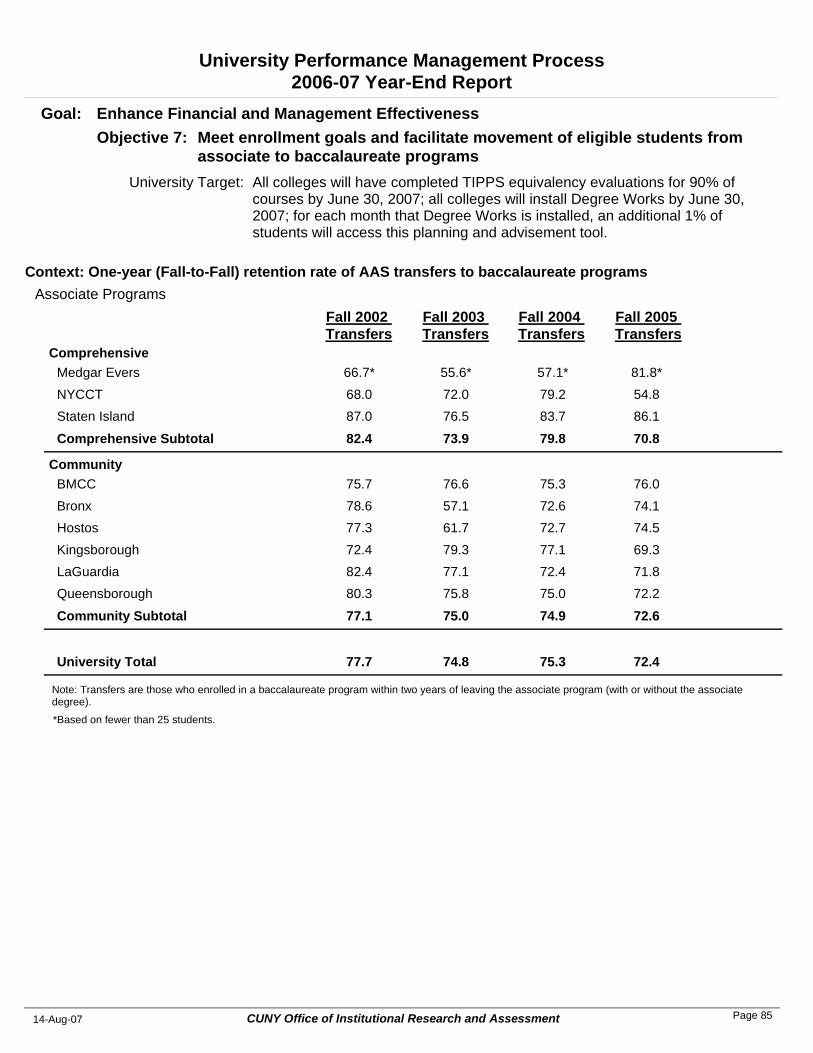
University Performance Management Process2006-07 Year-End Report
All colleges will have completed TIPPS equivalency evaluations for 90% of courses by June 30, 2007; all colleges will install Degree Works by June 30, 2007; for each month that Degree Works is installed, an additional 1% of students will access this planning and advisement tool.
University Target:
Meet enrollment goals and facilitate movement of eligible students from associate to baccalaureate programs
Objective 7: Goal: Enhance Financial and Management Effectiveness
Fall 2003 Transfers
Fall 2004 Transfers
Fall 2005 Transfers
Associate ProgramsContext: One-year (Fall-to-Fall) retention rate of AAS transfers to baccalaureate programs
Fall 2002 Transfers
ComprehensiveMedgar Evers 55.6* 57.1* 81.8*66.7*NYCCT 72.0 79.2 54.868.0Staten Island 76.5 83.7 86.187.0
Comprehensive Subtotal 73.9 79.8 70.882.4
CommunityBMCC 76.6 75.3 76.075.7Bronx 57.1 72.6 74.178.6Hostos 61.7 72.7 74.577.3Kingsborough 79.3 77.1 69.372.4LaGuardia 77.1 72.4 71.882.4Queensborough 75.8 75.0 72.280.3
Community Subtotal 75.0 74.9 72.677.1
University Total 74.8 75.3 72.477.7
Note: Transfers are those who enrolled in a baccalaureate program within two years of leaving the associate program (with or without the associate degree).
*Based on fewer than 25 students.
CUNY Office of Institutional Research and Assessment14-Aug-07 Page 85
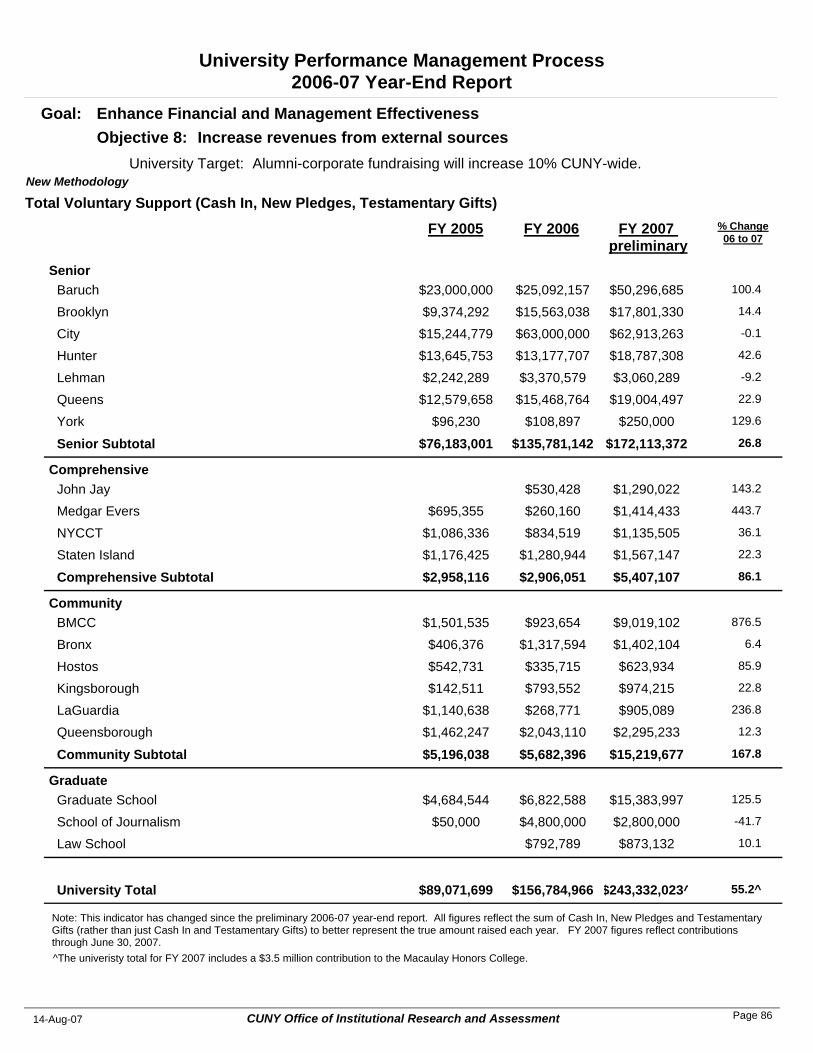
University Performance Management Process2006-07 Year-End Report
Alumni-corporate fundraising will increase 10% CUNY-wide.University Target:
Increase revenues from external sourcesObjective 8: Goal: Enhance Financial and Management Effectiveness
FY 2005 FY 2006 % Change06 to 07
FY 2007 preliminary
Total Voluntary Support (Cash In, New Pledges, Testamentary Gifts)New Methodology
SeniorBaruch $23,000,000 $25,092,157 $50,296,685 100.4 Brooklyn $9,374,292 $15,563,038 $17,801,330 14.4 City $15,244,779 $63,000,000 $62,913,263 -0.1 Hunter $13,645,753 $13,177,707 $18,787,308 42.6 Lehman $2,242,289 $3,370,579 $3,060,289 -9.2 Queens $12,579,658 $15,468,764 $19,004,497 22.9 York $96,230 $108,897 $250,000 129.6
Senior Subtotal $76,183,001 $135,781,142 $172,113,372 26.8
ComprehensiveJohn Jay $530,428 $1,290,022 143.2 Medgar Evers $695,355 $260,160 $1,414,433 443.7 NYCCT $1,086,336 $834,519 $1,135,505 36.1 Staten Island $1,176,425 $1,280,944 $1,567,147 22.3
Comprehensive Subtotal $2,958,116 $2,906,051 $5,407,107 86.1
CommunityBMCC $1,501,535 $923,654 $9,019,102 876.5 Bronx $406,376 $1,317,594 $1,402,104 6.4 Hostos $542,731 $335,715 $623,934 85.9 Kingsborough $142,511 $793,552 $974,215 22.8 LaGuardia $1,140,638 $268,771 $905,089 236.8 Queensborough $1,462,247 $2,043,110 $2,295,233 12.3
Community Subtotal $5,196,038 $5,682,396 $15,219,677 167.8
GraduateGraduate School $4,684,544 $6,822,588 $15,383,997 125.5
School of Journalism $50,000 $4,800,000 $2,800,000 -41.7 Law School $792,789 $873,132 10.1
University Total $89,071,699 $156,784,966 $243,332,023^ 55.2^
Note: This indicator has changed since the preliminary 2006-07 year-end report. All figures reflect the sum of Cash In, New Pledges and Testamentary Gifts (rather than just Cash In and Testamentary Gifts) to better represent the true amount raised each year. FY 2007 figures reflect contributions through June 30, 2007.^The univeristy total for FY 2007 includes a $3.5 million contribution to the Macaulay Honors College.
CUNY Office of Institutional Research and Assessment14-Aug-07 Page 86
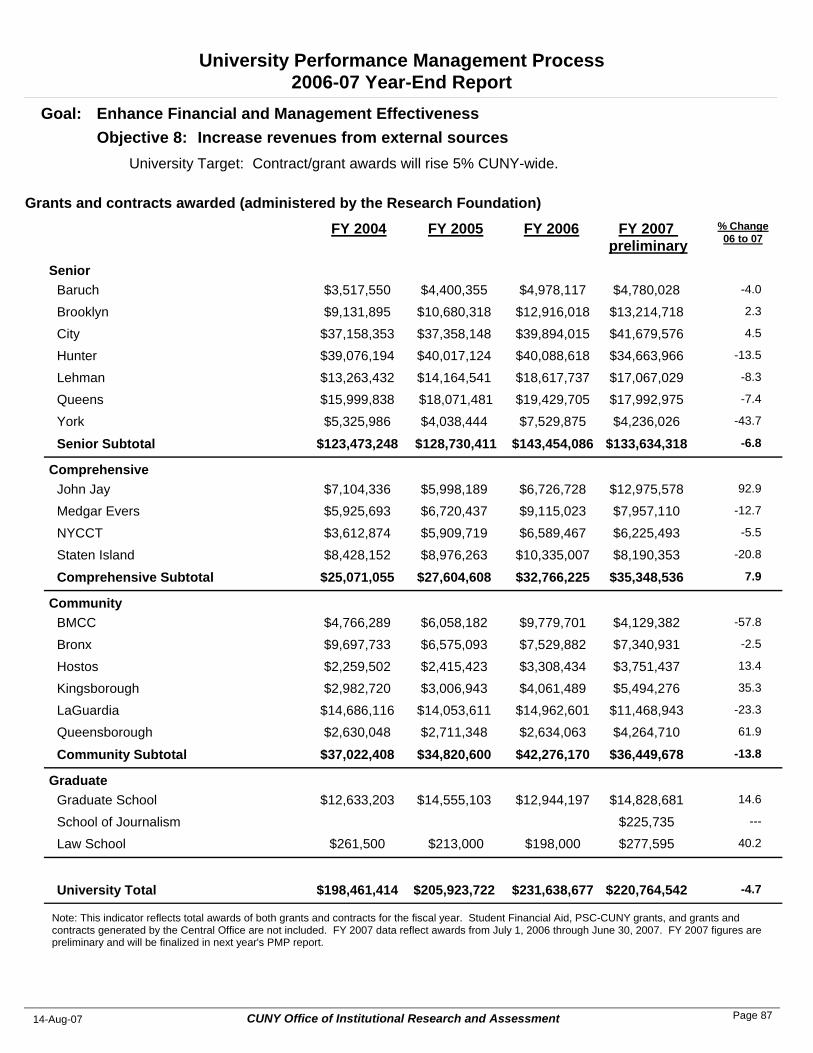
University Performance Management Process2006-07 Year-End Report
Contract/grant awards will rise 5% CUNY-wide.University Target:
Increase revenues from external sourcesObjective 8: Goal: Enhance Financial and Management Effectiveness
FY 2005 FY 2006 % Change06 to 07
FY 2007 preliminary
Grants and contracts awarded (administered by the Research Foundation)
FY 2004
SeniorBaruch $4,400,355 $4,978,117 $4,780,028 -4.0$3,517,550 Brooklyn $10,680,318 $12,916,018 $13,214,718 2.3$9,131,895 City $37,358,148 $39,894,015 $41,679,576 4.5$37,158,353 Hunter $40,017,124 $40,088,618 $34,663,966 -13.5$39,076,194 Lehman $14,164,541 $18,617,737 $17,067,029 -8.3$13,263,432 Queens $18,071,481 $19,429,705 $17,992,975 -7.4$15,999,838 York $4,038,444 $7,529,875 $4,236,026 -43.7$5,325,986
Senior Subtotal $128,730,411 $143,454,086 $133,634,318 -6.8$123,473,248
ComprehensiveJohn Jay $5,998,189 $6,726,728 $12,975,578 92.9$7,104,336 Medgar Evers $6,720,437 $9,115,023 $7,957,110 -12.7$5,925,693 NYCCT $5,909,719 $6,589,467 $6,225,493 -5.5$3,612,874 Staten Island $8,976,263 $10,335,007 $8,190,353 -20.8$8,428,152
Comprehensive Subtotal $27,604,608 $32,766,225 $35,348,536 7.9$25,071,055
CommunityBMCC $6,058,182 $9,779,701 $4,129,382 -57.8$4,766,289 Bronx $6,575,093 $7,529,882 $7,340,931 -2.5$9,697,733 Hostos $2,415,423 $3,308,434 $3,751,437 13.4$2,259,502 Kingsborough $3,006,943 $4,061,489 $5,494,276 35.3$2,982,720 LaGuardia $14,053,611 $14,962,601 $11,468,943 -23.3$14,686,116 Queensborough $2,711,348 $2,634,063 $4,264,710 61.9$2,630,048
Community Subtotal $34,820,600 $42,276,170 $36,449,678 -13.8$37,022,408
GraduateGraduate School $14,555,103 $12,944,197 $14,828,681 14.6$12,633,203 School of Journalism $225,735 ---
Law School $213,000 $198,000 $277,595 40.2$261,500
University Total $205,923,722 $231,638,677 $220,764,542 -4.7$198,461,414
Note: This indicator reflects total awards of both grants and contracts for the fiscal year. Student Financial Aid, PSC-CUNY grants, and grants and contracts generated by the Central Office are not included. FY 2007 data reflect awards from July 1, 2006 through June 30, 2007. FY 2007 figures are preliminary and will be finalized in next year's PMP report.
CUNY Office of Institutional Research and Assessment14-Aug-07 Page 87
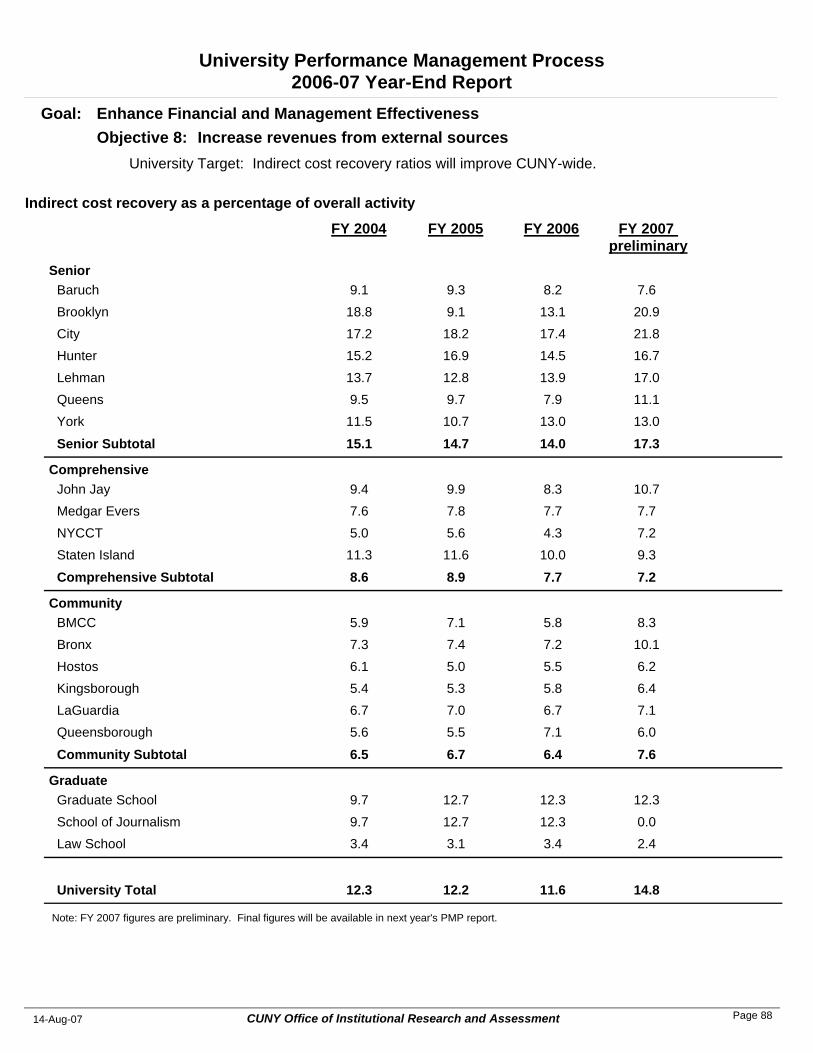
University Performance Management Process2006-07 Year-End Report
Indirect cost recovery ratios will improve CUNY-wide.University Target:
Increase revenues from external sourcesObjective 8: Goal: Enhance Financial and Management Effectiveness
FY 2005 FY 2006 FY 2007 preliminary
Indirect cost recovery as a percentage of overall activity
FY 2004
SeniorBaruch 9.3 8.2 7.69.1Brooklyn 9.1 13.1 20.918.8City 18.2 17.4 21.817.2Hunter 16.9 14.5 16.715.2Lehman 12.8 13.9 17.013.7Queens 9.7 7.9 11.19.5York 10.7 13.0 13.011.5
Senior Subtotal 14.7 14.0 17.315.1
ComprehensiveJohn Jay 9.9 8.3 10.79.4Medgar Evers 7.8 7.7 7.77.6NYCCT 5.6 4.3 7.25.0Staten Island 11.6 10.0 9.311.3
Comprehensive Subtotal 8.9 7.7 7.28.6
CommunityBMCC 7.1 5.8 8.35.9Bronx 7.4 7.2 10.17.3Hostos 5.0 5.5 6.26.1Kingsborough 5.3 5.8 6.45.4LaGuardia 7.0 6.7 7.16.7Queensborough 5.5 7.1 6.05.6
Community Subtotal 6.7 6.4 7.66.5
GraduateGraduate School 12.7 12.3 12.39.7School of Journalism 12.7 12.3 0.09.7Law School 3.1 3.4 2.43.4
University Total 12.2 11.6 14.812.3
Note: FY 2007 figures are preliminary. Final figures will be available in next year's PMP report.
CUNY Office of Institutional Research and Assessment14-Aug-07 Page 88
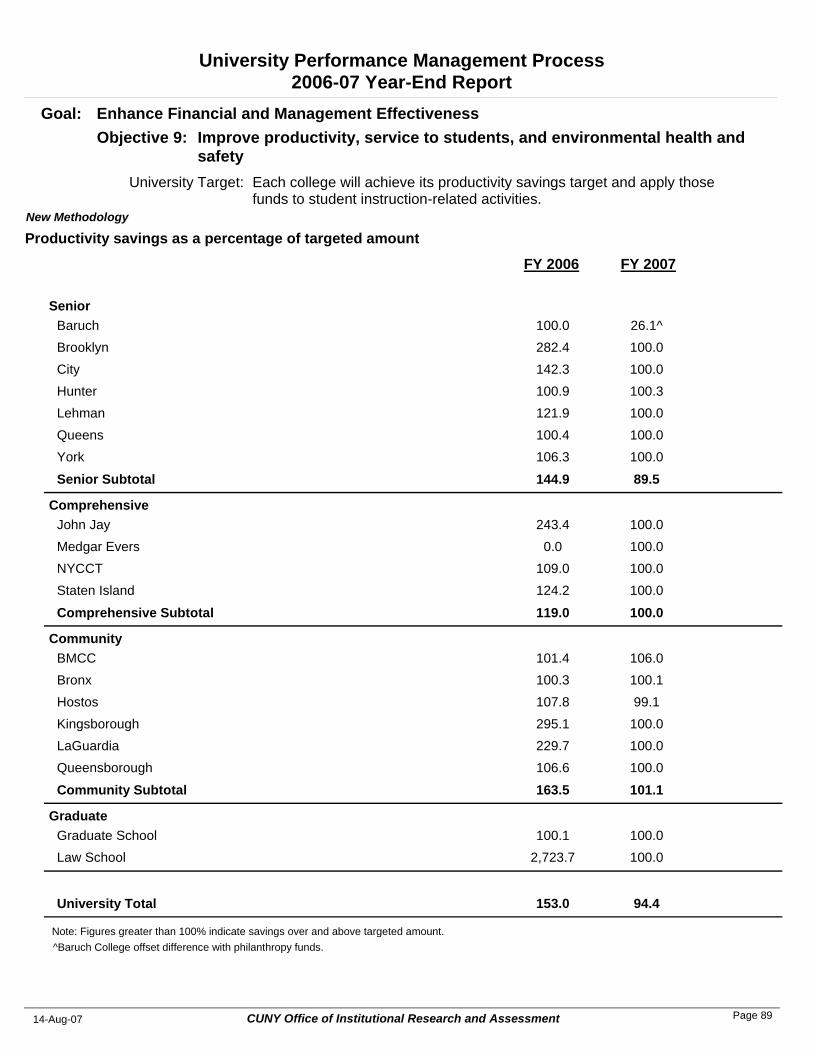
University Performance Management Process2006-07 Year-End Report
Each college will achieve its productivity savings target and apply those funds to student instruction-related activities.
University Target:
Improve productivity, service to students, and environmental health and safety
Objective 9: Goal: Enhance Financial and Management Effectiveness
FY 2006 FY 2007
Productivity savings as a percentage of targeted amountNew Methodology
SeniorBaruch 100.0 26.1^Brooklyn 282.4 100.0City 142.3 100.0Hunter 100.9 100.3Lehman 121.9 100.0Queens 100.4 100.0York 106.3 100.0
Senior Subtotal 144.9 89.5
ComprehensiveJohn Jay 243.4 100.0Medgar Evers 0.0 100.0NYCCT 109.0 100.0Staten Island 124.2 100.0
Comprehensive Subtotal 119.0 100.0
CommunityBMCC 101.4 106.0Bronx 100.3 100.1Hostos 107.8 99.1Kingsborough 295.1 100.0LaGuardia 229.7 100.0Queensborough 106.6 100.0
Community Subtotal 163.5 101.1
GraduateGraduate School 100.1 100.0Law School 2,723.7 100.0
University Total 153.0 94.4
Note: Figures greater than 100% indicate savings over and above targeted amount.^Baruch College offset difference with philanthropy funds.
CUNY Office of Institutional Research and Assessment14-Aug-07 Page 89
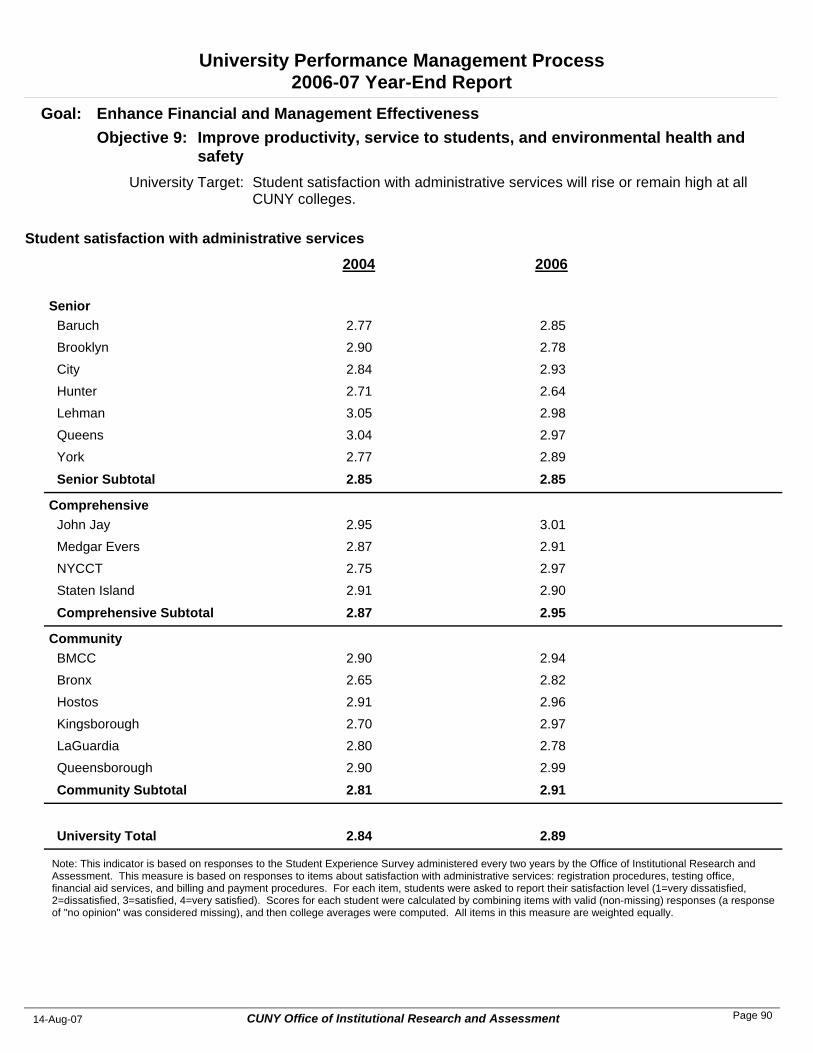
University Performance Management Process2006-07 Year-End Report
Student satisfaction with administrative services will rise or remain high at all CUNY colleges.
University Target:
Improve productivity, service to students, and environmental health and safety
Objective 9: Goal: Enhance Financial and Management Effectiveness
2006
Student satisfaction with administrative services
2004
SeniorBaruch 2.852.77Brooklyn 2.782.90City 2.932.84Hunter 2.642.71Lehman 2.983.05Queens 2.973.04York 2.892.77
Senior Subtotal 2.852.85
ComprehensiveJohn Jay 3.012.95Medgar Evers 2.912.87NYCCT 2.972.75Staten Island 2.902.91
Comprehensive Subtotal 2.952.87
CommunityBMCC 2.942.90Bronx 2.822.65Hostos 2.962.91Kingsborough 2.972.70LaGuardia 2.782.80Queensborough 2.992.90
Community Subtotal 2.912.81
University Total 2.892.84
Note: This indicator is based on responses to the Student Experience Survey administered every two years by the Office of Institutional Research and Assessment. This measure is based on responses to items about satisfaction with administrative services: registration procedures, testing office, financial aid services, and billing and payment procedures. For each item, students were asked to report their satisfaction level (1=very dissatisfied, 2=dissatisfied, 3=satisfied, 4=very satisfied). Scores for each student were calculated by combining items with valid (non-missing) responses (a response of "no opinion" was considered missing), and then college averages were computed. All items in this measure are weighted equally.
CUNY Office of Institutional Research and Assessment14-Aug-07 Page 90
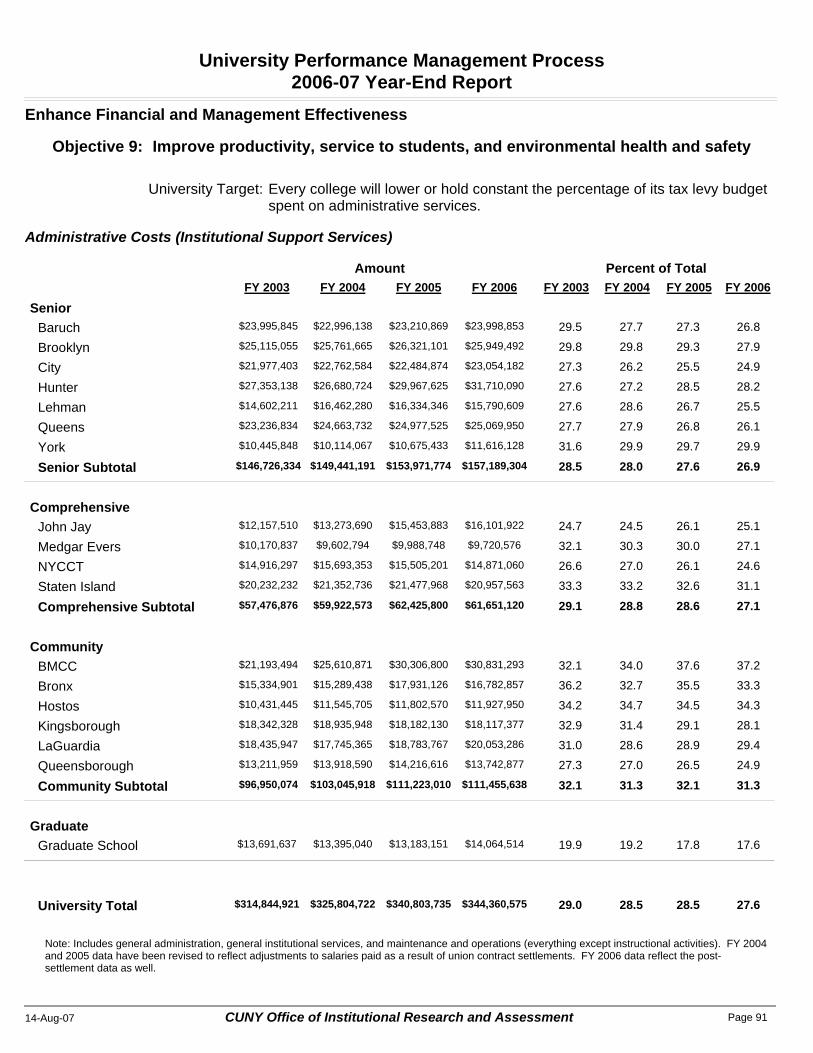
University Performance Management Process2006-07 Year-End Report
FY 2003 FY 2004 FY 2005 FY 2006 FY 2003 FY 2004 FY 2005 FY 2006
University Target:
Amount Percent of Total
Administrative Costs (Institutional Support Services)
Enhance Financial and Management Effectiveness
Objective 9: Improve productivity, service to students, and environmental health and safety
Every college will lower or hold constant the percentage of its tax levy budget spent on administrative services.
SeniorBaruch $23,995,845 $22,996,138 $23,210,869 $23,998,853 29.5 27.7 27.3 26.8
Brooklyn $25,115,055 $25,761,665 $26,321,101 $25,949,492 29.8 29.8 29.3 27.9
City $21,977,403 $22,762,584 $22,484,874 $23,054,182 27.3 26.2 25.5 24.9
Hunter $27,353,138 $26,680,724 $29,967,625 $31,710,090 27.6 27.2 28.5 28.2
Lehman $14,602,211 $16,462,280 $16,334,346 $15,790,609 27.6 28.6 26.7 25.5
Queens $23,236,834 $24,663,732 $24,977,525 $25,069,950 27.7 27.9 26.8 26.1
York $10,445,848 $10,114,067 $10,675,433 $11,616,128 31.6 29.9 29.7 29.9
Senior Subtotal $146,726,334 $149,441,191 $153,971,774 $157,189,304 28.5 28.0 27.6 26.9
ComprehensiveJohn Jay $12,157,510 $13,273,690 $15,453,883 $16,101,922 24.7 24.5 26.1 25.1
Medgar Evers $10,170,837 $9,602,794 $9,988,748 $9,720,576 32.1 30.3 30.0 27.1
NYCCT $14,916,297 $15,693,353 $15,505,201 $14,871,060 26.6 27.0 26.1 24.6
Staten Island $20,232,232 $21,352,736 $21,477,968 $20,957,563 33.3 33.2 32.6 31.1
Comprehensive Subtotal $57,476,876 $59,922,573 $62,425,800 $61,651,120 29.1 28.8 28.6 27.1
CommunityBMCC $21,193,494 $25,610,871 $30,306,800 $30,831,293 32.1 34.0 37.6 37.2
Bronx $15,334,901 $15,289,438 $17,931,126 $16,782,857 36.2 32.7 35.5 33.3
Hostos $10,431,445 $11,545,705 $11,802,570 $11,927,950 34.2 34.7 34.5 34.3
Kingsborough $18,342,328 $18,935,948 $18,182,130 $18,117,377 32.9 31.4 29.1 28.1
LaGuardia $18,435,947 $17,745,365 $18,783,767 $20,053,286 31.0 28.6 28.9 29.4
Queensborough $13,211,959 $13,918,590 $14,216,616 $13,742,877 27.3 27.0 26.5 24.9
Community Subtotal $96,950,074 $103,045,918 $111,223,010 $111,455,638 32.1 31.3 32.1 31.3
GraduateGraduate School $13,691,637 $13,395,040 $13,183,151 $14,064,514 19.9 19.2 17.8 17.6
University Total $314,844,921 $325,804,722 $340,803,735 $344,360,575 29.0 28.5 28.5 27.6
Note: Includes general administration, general institutional services, and maintenance and operations (everything except instructional activities). FY 2004 and 2005 data have been revised to reflect adjustments to salaries paid as a result of union contract settlements. FY 2006 data reflect the post-settlement data as well.
CUNY Office of Institutional Research and Assessment14-Aug-07 Page 91
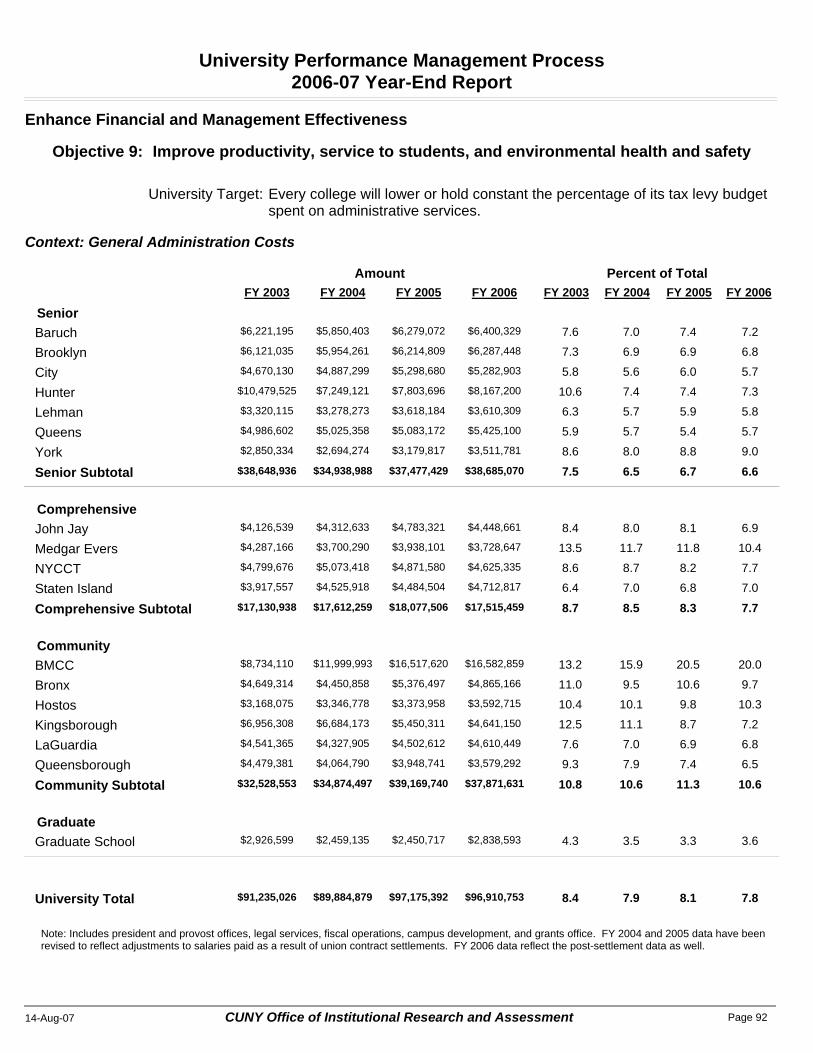
University Performance Management Process2006-07 Year-End Report
FY 2003 FY 2004 FY 2005 FY 2006 FY 2003 FY 2004 FY 2005 FY 2006
University Target:
Amount Percent of Total
Every college will lower or hold constant the percentage of its tax levy budget spent on administrative services.
Enhance Financial and Management Effectiveness
Objective 9:
Context: General Administration Costs
Improve productivity, service to students, and environmental health and safety
SeniorBaruch $6,221,195 $5,850,403 $6,279,072 $6,400,329 7.6 7.0 7.4 7.2
Brooklyn $6,121,035 $5,954,261 $6,214,809 $6,287,448 7.3 6.9 6.9 6.8
City $4,670,130 $4,887,299 $5,298,680 $5,282,903 5.8 5.6 6.0 5.7
Hunter $10,479,525 $7,249,121 $7,803,696 $8,167,200 10.6 7.4 7.4 7.3
Lehman $3,320,115 $3,278,273 $3,618,184 $3,610,309 6.3 5.7 5.9 5.8
Queens $4,986,602 $5,025,358 $5,083,172 $5,425,100 5.9 5.7 5.4 5.7
York $2,850,334 $2,694,274 $3,179,817 $3,511,781 8.6 8.0 8.8 9.0
Senior Subtotal $38,648,936 $34,938,988 $37,477,429 $38,685,070 7.5 6.5 6.7 6.6
ComprehensiveJohn Jay $4,126,539 $4,312,633 $4,783,321 $4,448,661 8.4 8.0 8.1 6.9
Medgar Evers $4,287,166 $3,700,290 $3,938,101 $3,728,647 13.5 11.7 11.8 10.4
NYCCT $4,799,676 $5,073,418 $4,871,580 $4,625,335 8.6 8.7 8.2 7.7
Staten Island $3,917,557 $4,525,918 $4,484,504 $4,712,817 6.4 7.0 6.8 7.0
Comprehensive Subtotal $17,130,938 $17,612,259 $18,077,506 $17,515,459 8.7 8.5 8.3 7.7
CommunityBMCC $8,734,110 $11,999,993 $16,517,620 $16,582,859 13.2 15.9 20.5 20.0
Bronx $4,649,314 $4,450,858 $5,376,497 $4,865,166 11.0 9.5 10.6 9.7
Hostos $3,168,075 $3,346,778 $3,373,958 $3,592,715 10.4 10.1 9.8 10.3
Kingsborough $6,956,308 $6,684,173 $5,450,311 $4,641,150 12.5 11.1 8.7 7.2
LaGuardia $4,541,365 $4,327,905 $4,502,612 $4,610,449 7.6 7.0 6.9 6.8
Queensborough $4,479,381 $4,064,790 $3,948,741 $3,579,292 9.3 7.9 7.4 6.5
Community Subtotal $32,528,553 $34,874,497 $39,169,740 $37,871,631 10.8 10.6 11.3 10.6
GraduateGraduate School $2,926,599 $2,459,135 $2,450,717 $2,838,593 4.3 3.5 3.3 3.6
University Total $91,235,026 $89,884,879 $97,175,392 $96,910,753 8.4 7.9 8.1 7.8
Note: Includes president and provost offices, legal services, fiscal operations, campus development, and grants office. FY 2004 and 2005 data have been revised to reflect adjustments to salaries paid as a result of union contract settlements. FY 2006 data reflect the post-settlement data as well.
CUNY Office of Institutional Research and Assessment14-Aug-07 Page 92
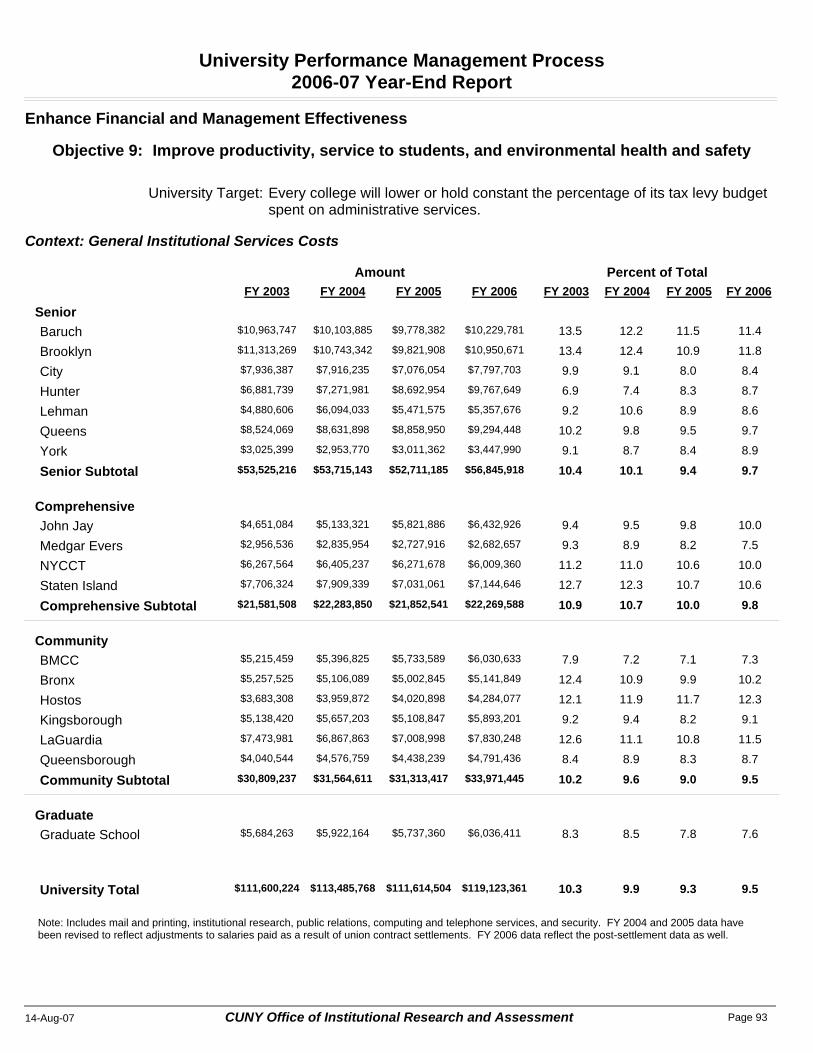
University Performance Management Process2006-07 Year-End Report
FY 2003 FY 2004 FY 2005 FY 2006 FY 2003 FY 2004 FY 2005 FY 2006
University Target:
Amount Percent of Total
Context: General Institutional Services Costs
Enhance Financial and Management Effectiveness
Objective 9: Improve productivity, service to students, and environmental health and safety
Every college will lower or hold constant the percentage of its tax levy budget spent on administrative services.
SeniorBaruch $10,963,747 $10,103,885 $9,778,382 $10,229,781 13.5 12.2 11.5 11.4
Brooklyn $11,313,269 $10,743,342 $9,821,908 $10,950,671 13.4 12.4 10.9 11.8
City $7,936,387 $7,916,235 $7,076,054 $7,797,703 9.9 9.1 8.0 8.4
Hunter $6,881,739 $7,271,981 $8,692,954 $9,767,649 6.9 7.4 8.3 8.7
Lehman $4,880,606 $6,094,033 $5,471,575 $5,357,676 9.2 10.6 8.9 8.6
Queens $8,524,069 $8,631,898 $8,858,950 $9,294,448 10.2 9.8 9.5 9.7
York $3,025,399 $2,953,770 $3,011,362 $3,447,990 9.1 8.7 8.4 8.9
Senior Subtotal $53,525,216 $53,715,143 $52,711,185 $56,845,918 10.4 10.1 9.4 9.7
ComprehensiveJohn Jay $4,651,084 $5,133,321 $5,821,886 $6,432,926 9.4 9.5 9.8 10.0
Medgar Evers $2,956,536 $2,835,954 $2,727,916 $2,682,657 9.3 8.9 8.2 7.5
NYCCT $6,267,564 $6,405,237 $6,271,678 $6,009,360 11.2 11.0 10.6 10.0
Staten Island $7,706,324 $7,909,339 $7,031,061 $7,144,646 12.7 12.3 10.7 10.6
Comprehensive Subtotal $21,581,508 $22,283,850 $21,852,541 $22,269,588 10.9 10.7 10.0 9.8
CommunityBMCC $5,215,459 $5,396,825 $5,733,589 $6,030,633 7.9 7.2 7.1 7.3
Bronx $5,257,525 $5,106,089 $5,002,845 $5,141,849 12.4 10.9 9.9 10.2
Hostos $3,683,308 $3,959,872 $4,020,898 $4,284,077 12.1 11.9 11.7 12.3
Kingsborough $5,138,420 $5,657,203 $5,108,847 $5,893,201 9.2 9.4 8.2 9.1
LaGuardia $7,473,981 $6,867,863 $7,008,998 $7,830,248 12.6 11.1 10.8 11.5
Queensborough $4,040,544 $4,576,759 $4,438,239 $4,791,436 8.4 8.9 8.3 8.7
Community Subtotal $30,809,237 $31,564,611 $31,313,417 $33,971,445 10.2 9.6 9.0 9.5
GraduateGraduate School $5,684,263 $5,922,164 $5,737,360 $6,036,411 8.3 8.5 7.8 7.6
University Total $111,600,224 $113,485,768 $111,614,504 $119,123,361 10.3 9.9 9.3 9.5
Note: Includes mail and printing, institutional research, public relations, computing and telephone services, and security. FY 2004 and 2005 data have been revised to reflect adjustments to salaries paid as a result of union contract settlements. FY 2006 data reflect the post-settlement data as well.
CUNY Office of Institutional Research and Assessment14-Aug-07 Page 93
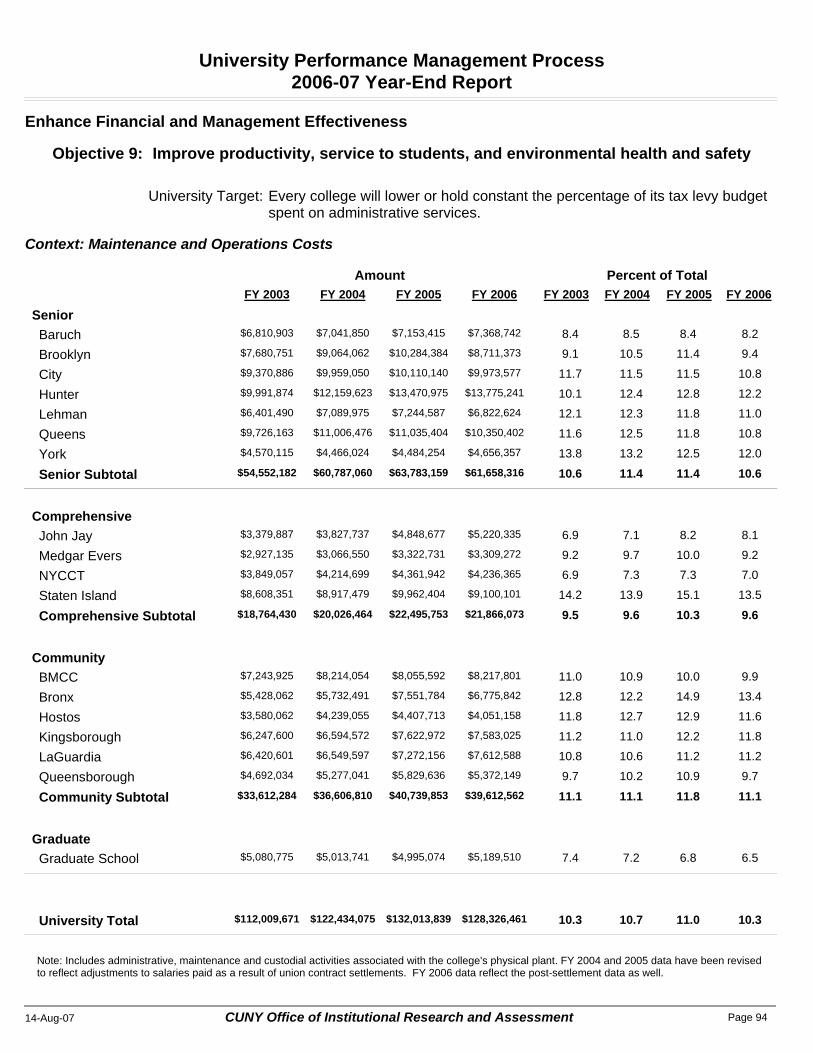
University Performance Management Process2006-07 Year-End Report
FY 2003 FY 2004 FY 2005 FY 2006 FY 2003 FY 2004 FY 2005 FY 2006
University Target:
Amount Percent of Total
Context: Maintenance and Operations Costs
Enhance Financial and Management Effectiveness
Objective 9: Improve productivity, service to students, and environmental health and safety
Every college will lower or hold constant the percentage of its tax levy budget spent on administrative services.
SeniorBaruch $6,810,903 $7,041,850 $7,153,415 $7,368,742 8.4 8.5 8.4 8.2
Brooklyn $7,680,751 $9,064,062 $10,284,384 $8,711,373 9.1 10.5 11.4 9.4
City $9,370,886 $9,959,050 $10,110,140 $9,973,577 11.7 11.5 11.5 10.8
Hunter $9,991,874 $12,159,623 $13,470,975 $13,775,241 10.1 12.4 12.8 12.2
Lehman $6,401,490 $7,089,975 $7,244,587 $6,822,624 12.1 12.3 11.8 11.0
Queens $9,726,163 $11,006,476 $11,035,404 $10,350,402 11.6 12.5 11.8 10.8
York $4,570,115 $4,466,024 $4,484,254 $4,656,357 13.8 13.2 12.5 12.0
Senior Subtotal $54,552,182 $60,787,060 $63,783,159 $61,658,316 10.6 11.4 11.4 10.6
ComprehensiveJohn Jay $3,379,887 $3,827,737 $4,848,677 $5,220,335 6.9 7.1 8.2 8.1
Medgar Evers $2,927,135 $3,066,550 $3,322,731 $3,309,272 9.2 9.7 10.0 9.2
NYCCT $3,849,057 $4,214,699 $4,361,942 $4,236,365 6.9 7.3 7.3 7.0
Staten Island $8,608,351 $8,917,479 $9,962,404 $9,100,101 14.2 13.9 15.1 13.5
Comprehensive Subtotal $18,764,430 $20,026,464 $22,495,753 $21,866,073 9.5 9.6 10.3 9.6
CommunityBMCC $7,243,925 $8,214,054 $8,055,592 $8,217,801 11.0 10.9 10.0 9.9
Bronx $5,428,062 $5,732,491 $7,551,784 $6,775,842 12.8 12.2 14.9 13.4
Hostos $3,580,062 $4,239,055 $4,407,713 $4,051,158 11.8 12.7 12.9 11.6
Kingsborough $6,247,600 $6,594,572 $7,622,972 $7,583,025 11.2 11.0 12.2 11.8
LaGuardia $6,420,601 $6,549,597 $7,272,156 $7,612,588 10.8 10.6 11.2 11.2
Queensborough $4,692,034 $5,277,041 $5,829,636 $5,372,149 9.7 10.2 10.9 9.7
Community Subtotal $33,612,284 $36,606,810 $40,739,853 $39,612,562 11.1 11.1 11.8 11.1
GraduateGraduate School $5,080,775 $5,013,741 $4,995,074 $5,189,510 7.4 7.2 6.8 6.5
University Total $112,009,671 $122,434,075 $132,013,839 $128,326,461 10.3 10.7 11.0 10.3
Note: Includes administrative, maintenance and custodial activities associated with the college's physical plant. FY 2004 and 2005 data have been revised to reflect adjustments to salaries paid as a result of union contract settlements. FY 2006 data reflect the post-settlement data as well.
CUNY Office of Institutional Research and Assessment14-Aug-07 Page 94
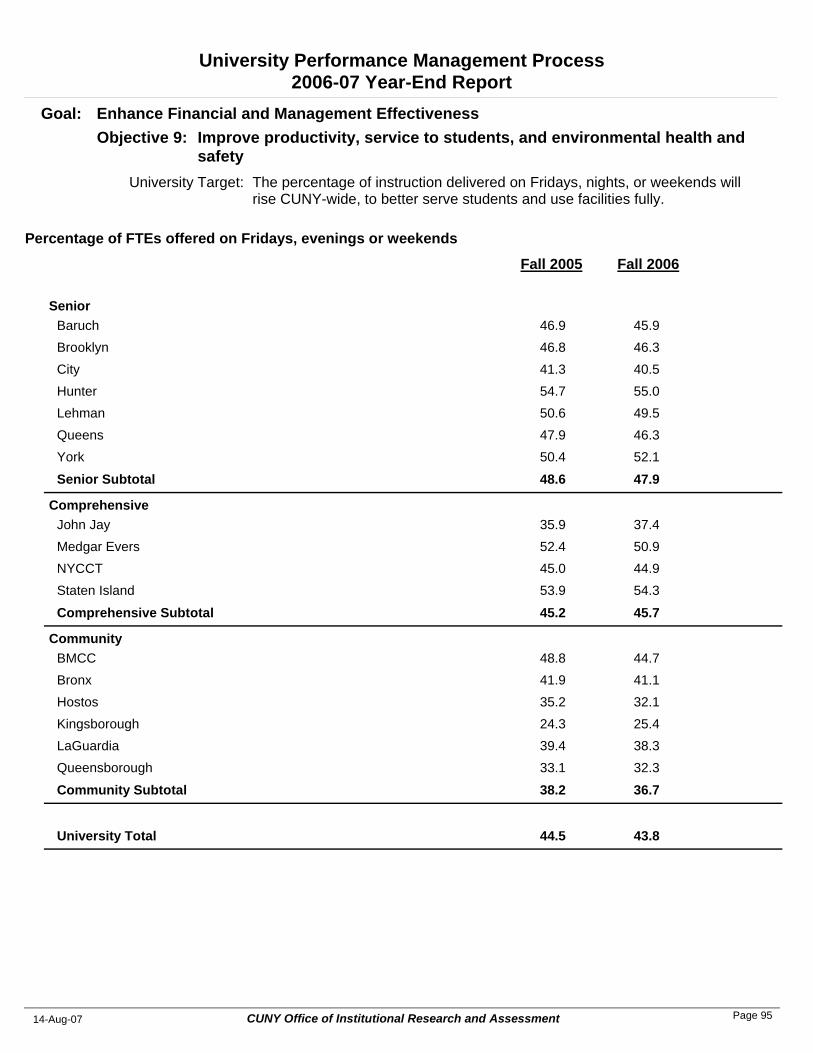
University Performance Management Process2006-07 Year-End Report
The percentage of instruction delivered on Fridays, nights, or weekends will rise CUNY-wide, to better serve students and use facilities fully.
University Target:
Improve productivity, service to students, and environmental health and safety
Objective 9: Goal: Enhance Financial and Management Effectiveness
Fall 2005 Fall 2006
Percentage of FTEs offered on Fridays, evenings or weekends
SeniorBaruch 46.9 45.9Brooklyn 46.8 46.3City 41.3 40.5Hunter 54.7 55.0Lehman 50.6 49.5Queens 47.9 46.3York 50.4 52.1
Senior Subtotal 48.6 47.9
ComprehensiveJohn Jay 35.9 37.4Medgar Evers 52.4 50.9NYCCT 45.0 44.9Staten Island 53.9 54.3
Comprehensive Subtotal 45.2 45.7
CommunityBMCC 48.8 44.7Bronx 41.9 41.1Hostos 35.2 32.1Kingsborough 24.3 25.4LaGuardia 39.4 38.3Queensborough 33.1 32.3
Community Subtotal 38.2 36.7
University Total 44.5 43.8
CUNY Office of Institutional Research and Assessment14-Aug-07 Page 95