Embed Size (px)
Citation preview

EL SALVADOR
“
PERFORMANCE MANAGEMENT PLAN (PMP)
CDCS 2020 - 2025
1
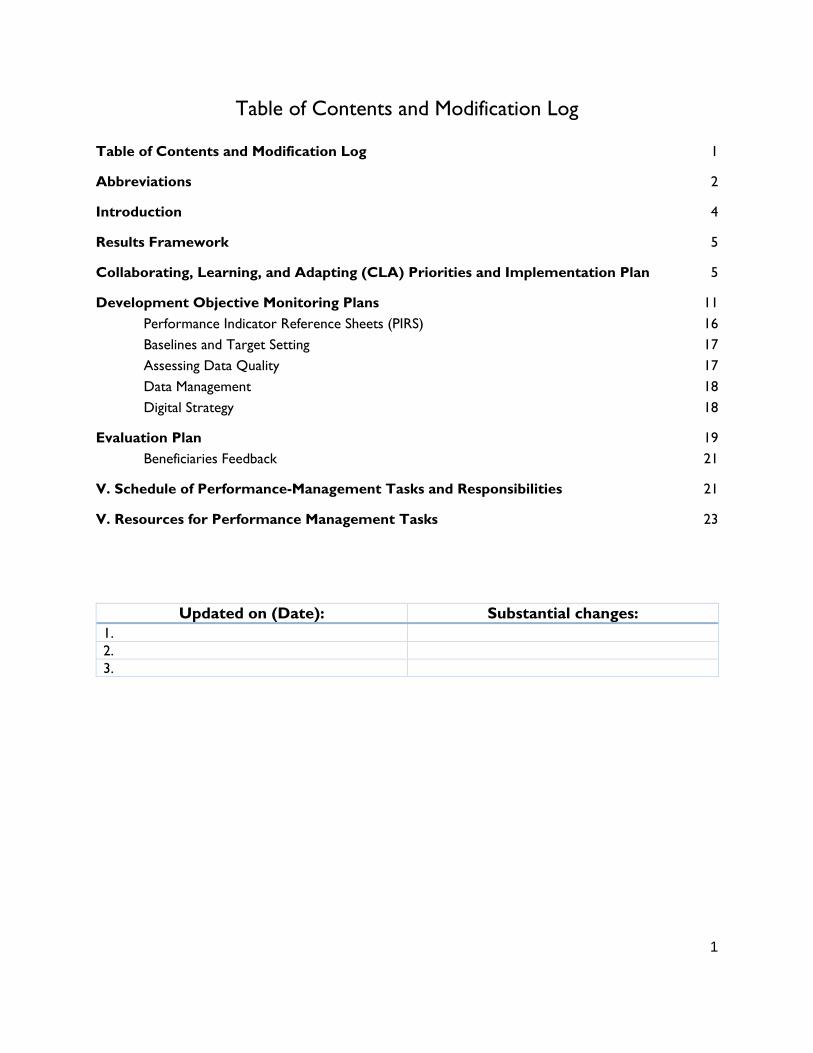
Table of Contents and Modification Log
Table of Contents and Modification Log 1
Abbreviations 2
Introduction 4
Results Framework 5
Collaborating, Learning, and Adapting (CLA) Priorities and Implementation Plan 5
Development Objective Monitoring Plans 11 Performance Indicator Reference Sheets (PIRS) 16 Baselines and Target Setting 17 Assessing Data Quality 17 Data Management 18 Digital Strategy 18
Evaluation Plan 19 Beneficiaries Feedback 21
V. Schedule of Performance-Management Tasks and Responsibilities 21
V. Resources for Performance Management Tasks 23
Updated on (Date): Substantial changes: 1. 2. 3.
2
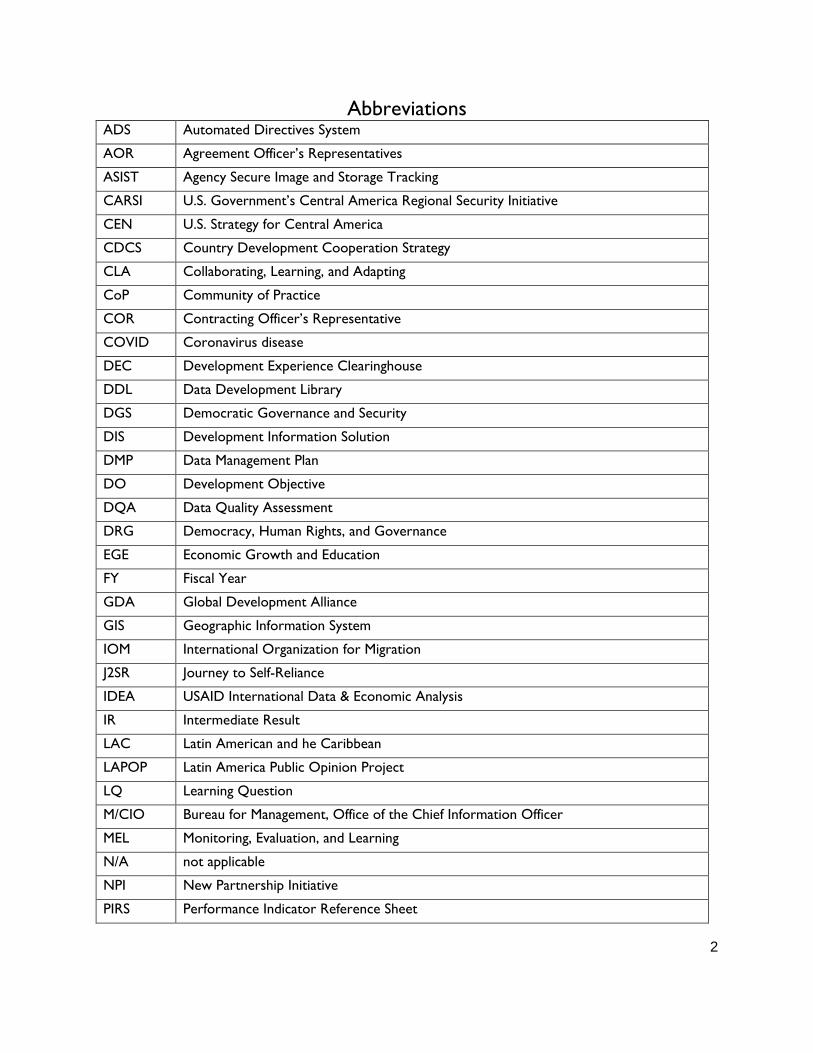
Abbreviations ADS Automated Directives System
AOR Agreement Officer’s Representatives
ASIST Agency Secure Image and Storage Tracking
CARSI U.S. Government’s Central America Regional Security Initiative
CEN U.S. Strategy for Central America
CDCS Country Development Cooperation Strategy
CLA Collaborating, Learning, and Adapting
CoP Community of Practice
COR Contracting Officer’s Representative
COVID Coronavirus disease
DEC Development Experience Clearinghouse
DDL Data Development Library
DGS Democratic Governance and Security
DIS Development Information Solution
DMP Data Management Plan
DO Development Objective
DQA Data Quality Assessment
DRG Democracy, Human Rights, and Governance
EGE Economic Growth and Education
FY Fiscal Year
GDA Global Development Alliance
GIS Geographic Information System
IOM International Organization for Migration
J2SR Journey to Self-Reliance
IDEA USAID International Data & Economic Analysis
IR Intermediate Result
LAC Latin American and he Caribbean
LAPOP Latin America Public Opinion Project
LQ Learning Question
M/CIO Bureau for Management, Office of the Chief Information Officer
MEL Monitoring, Evaluation, and Learning
N/A not applicable
NPI New Partnership Initiative
PIRS Performance Indicator Reference Sheet
3
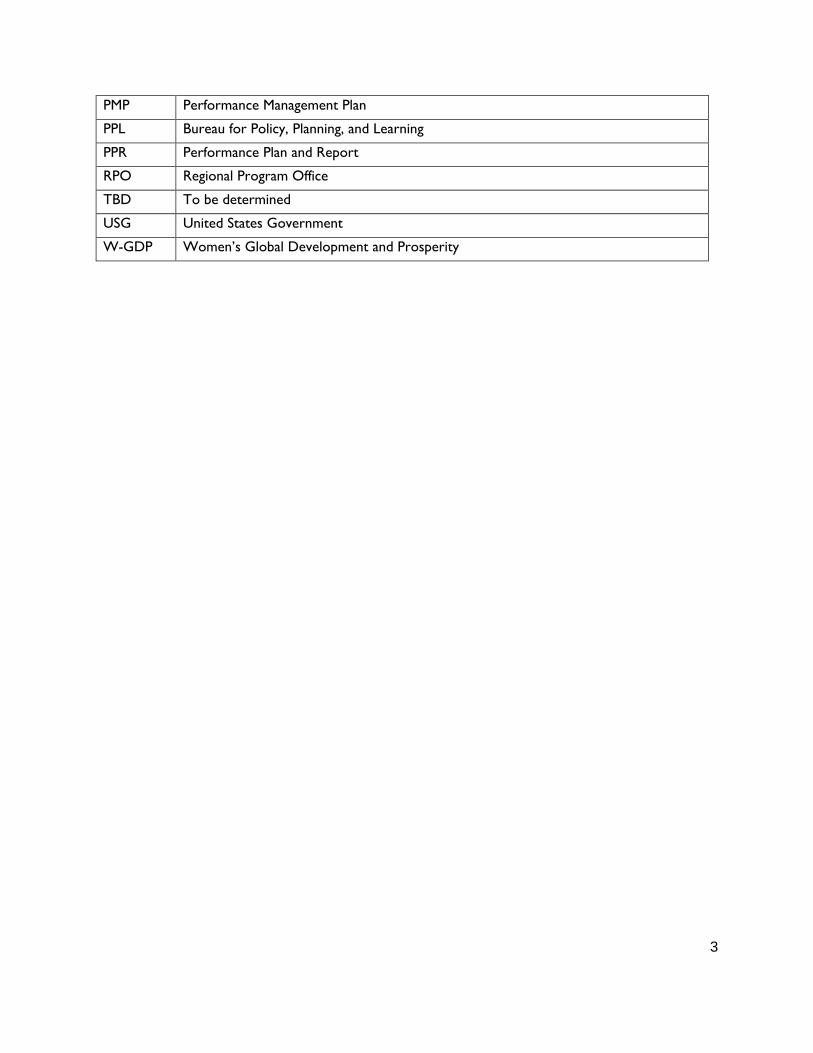
PMP Performance Management Plan
PPL Bureau for Policy, Planning, and Learning
PPR Performance Plan and Report
RPO Regional Program Office
TBD To be determined
USG United States Government
W-GDP Women’s Global Development and Prosperity
4
I. Introduction USAID/El Salvador’s Monitoring, Evaluation, and Learning (MEL) priority is to learn if the development hypothesis of the Country Development Cooperation Strategy (CDCS) 2020-2025 is correct, and how the interventions carried out under the strategy contribute to decreasing the drivers of irregular migration. USAID/El Salvador will use this Performance Management Plan (PMP) to assess progress toward the achievement of the goal and development objectives outlined in its CDCS. In addition to being aligned with the Agency’s Journey to Self-Reliance (J2SR) priorities, the CDCS is closely aligned with the goals of the Strategy for Central America (CEN Strategy), the U.S. Government’s Central America Regional Security Initiative (CARSI), the Women’s Global Development and Prosperity Initiative (W-GDP), and other Administration and Agency Initiatives. USAID/El Salvador developed this PMP through a series of consultations between the Regional Program Office (RPO) and both Technical Offices (Economic Growth and Education [EGE], and Democratic Governance and Security [DGS]). The Mission also took into consideration illustrative indicators and learning questions included in the CDCS and other Agency-level Learning Agendas such as the J2SR Learning Agenda, the DRG Learning Agenda, the Positive Youth Development Learning Agenda, and the Private Sector Engagement Evidence and Learning Plan. While developing this PMP, the Agency began deploying its new performance management system, the Development Information Solution (DIS). As part of the DIS roll out, USAID/El Salvador will be one of the first Missions to implement this system and use it as a tracking mechanism. USAID/El Salvador considers the indicators, evaluations, and related timelines and analysis plans outlined in this PMP to be appropriate and sufficient for tracking performance and enhancing learning through evidence-based program decision making and accountability. The PMP is in alignment with Automated Directives System (ADS) 201: Program Cycle Operational Policy (updated October 2020). In addition to the in-house capabilities of a team of integrated MEL Specialists in RPO and in each Technical Office, the Mission has the support of MEL Advisors at the Bureau for Latin America and the Caribbean (LAC) and a MEL platform activity managed by RPO. After the completion of the current contract for the Mission’s MEL platform in Summer 2021, the Mission will use other resources such as mechanisms managed in Washington available for buy-in as well as the services of USAID’s GeoCenter. The Mission developed the PMP, which mirrors the CDCS timeframe of FY 2020-FY 2025, in a period during which the COVID-19 pandemic changed the traditional approach to monitoring and evaluating activities, projects, and strategies. It is assumed that the identified activities in this PMP will be implemented either virtually or in-person, as conditions allow. This PMP is a living document, and it will be updated at least annually and timed with other program cycle milestones—for example, following portfolio reviews or when project or activity plans are updated. RPO, in conjunction with technical offices, will monitor other key opportunities to update the PMP. The PMP contains the following sections: Collaboration, Learning, and Adapting (CLA) Priorities and Implementation Plan; Development Objectives Monitoring Plans; Evaluation Plan; Schedule and Responsibilities; and Resources.
5
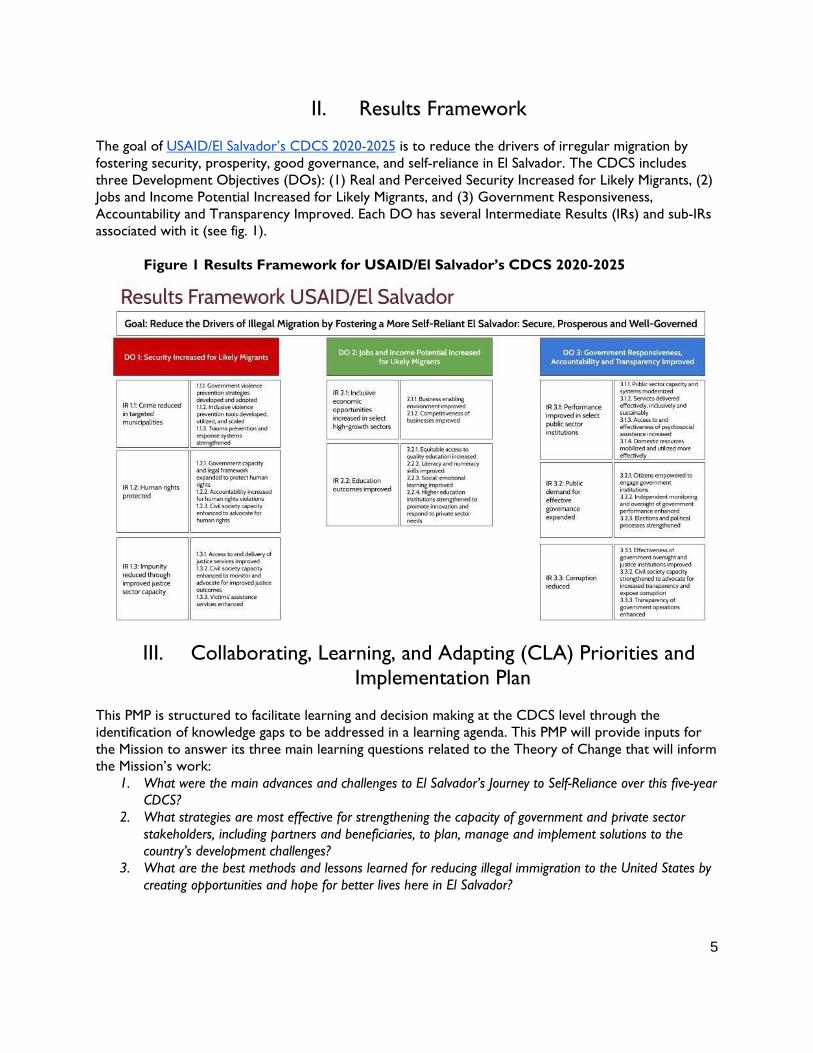
II. Results Framework The goal of USAID/El Salvador’s CDCS 2020-2025 is to reduce the drivers of irregular migration by fostering security, prosperity, good governance, and self-reliance in El Salvador. The CDCS includes three Development Objectives (DOs): (1) Real and Perceived Security Increased for Likely Migrants, (2) Jobs and Income Potential Increased for Likely Migrants, and (3) Government Responsiveness, Accountability and Transparency Improved. Each DO has several Intermediate Results (IRs) and sub-IRs associated with it (see fig. 1).
Figure 1 Results Framework for USAID/El Salvador’s CDCS 2020-2025
III. Collaborating, Learning, and Adapting (CLA) Priorities and Implementation Plan
This PMP is structured to facilitate learning and decision making at the CDCS level through the identification of knowledge gaps to be addressed in a learning agenda. This PMP will provide inputs for the Mission to answer its three main learning questions related to the Theory of Change that will inform the Mission’s work:
1. What were the main advances and challenges to El Salvador’s Journey to Self-Reliance over this five-year CDCS?
2. What strategies are most effective for strengthening the capacity of government and private sector stakeholders, including partners and beneficiaries, to plan, manage and implement solutions to the country’s development challenges?
3. What are the best methods and lessons learned for reducing illegal immigration to the United States by creating opportunities and hope for better lives here in El Salvador?
6
The Mission’s principal commitment is to improve ways in which we collaborate, learn, and adapt to become more agile in terms of organization, engagement, and functioning more efficiently. The goal of learning is for the Mission to be responsive in making adjustments based on evidence. Activities that can facilitate learning and adaptive management are those that compile, synthesize, and analyze information in ways that foster reflection, review, and dialogue. The development of the PMP CLA priorities and implementation plan entailed a participatory process in which the MEL working group was led by the Learning Advisor from USAID/Guatemala. The MEL working group first learned about the CLA theory, defined roles and responsibilities, established expected outcomes, and decided on a working timeline. As part of the same process, through a CLA maturity tool and matrix, the group identified priority areas from the CLA framework on which the Mission will focus during the CDCS. As the core work of the CLA process, the Mission revised its learning priorities. These priorities are the umbrella for the learning questions that facilitate adaptive management of PMP. Lastly, these learning questions were presented and discussed by DO with the Technical Offices and then adapted based on feedback from each team. The Mission identified DO-specific learning sub-questions linked to programming that will help answer the three main questions. Each of these questions meet the criteria for strong learning questions: they are focused and clear, feasible to answer in a timely manner, and useful to inform programmatic decisions and/or to identify specific actions that the Mission should take or avoid.
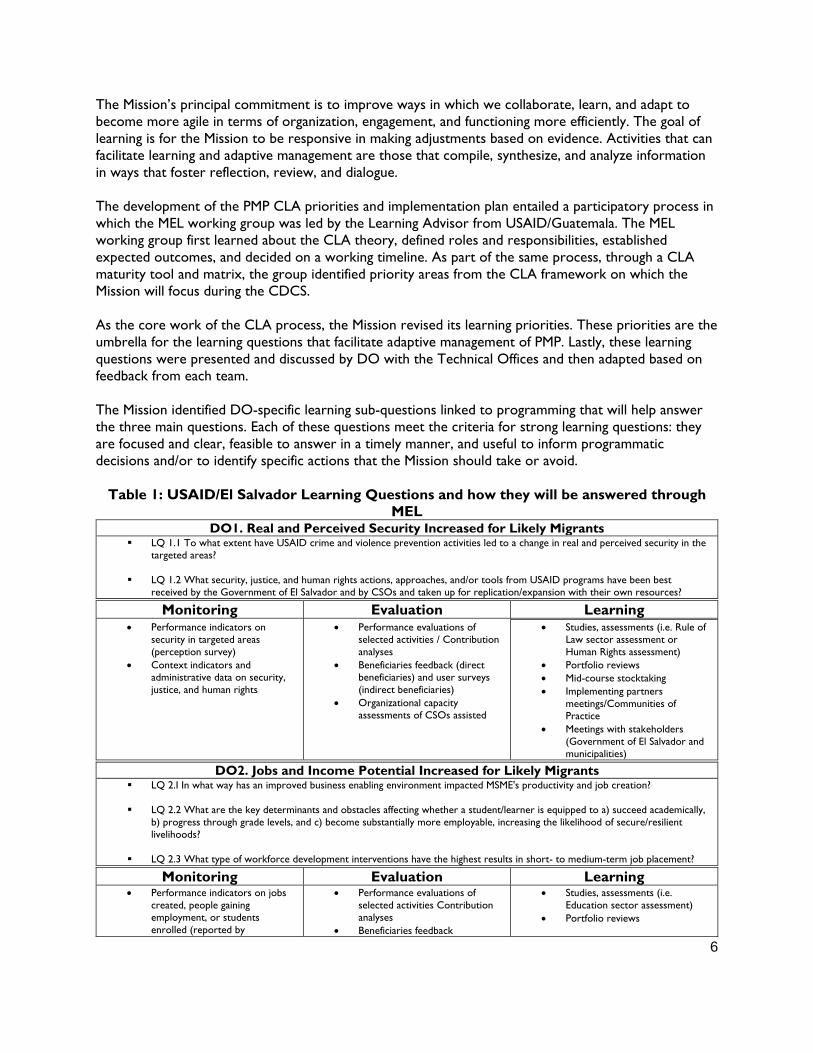
Table 1: USAID/El Salvador Learning Questions and how they will be answered through MEL
DO1. Real and Perceived Security Increased for Likely Migrants LQ 1.1 To what extent have USAID crime and violence prevention activities led to a change in real and perceived security in the
targeted areas?
LQ 1.2 What security, justice, and human rights actions, approaches, and/or tools from USAID programs have been best received by the Government of El Salvador and by CSOs and taken up for replication/expansion with their own resources?
Monitoring Evaluation Learning • Performance indicators on
security in targeted areas (perception survey)
• Context indicators and administrative data on security, justice, and human rights
• Performance evaluations of selected activities / Contribution analyses
• Beneficiaries feedback (direct beneficiaries) and user surveys (indirect beneficiaries)
• Organizational capacity assessments of CSOs assisted
• Studies, assessments (i.e. Rule of Law sector assessment or Human Rights assessment)
• Portfolio reviews • Mid-course stocktaking • Implementing partners
meetings/Communities of Practice
• Meetings with stakeholders (Government of El Salvador and municipalities)
DO2. Jobs and Income Potential Increased for Likely Migrants LQ 2.I In what way has an improved business enabling environment impacted MSME's productivity and job creation?
LQ 2.2 What are the key determinants and obstacles affecting whether a student/learner is equipped to a) succeed academically,
b) progress through grade levels, and c) become substantially more employable, increasing the likelihood of secure/resilient livelihoods?
LQ 2.3 What type of workforce development interventions have the highest results in short- to medium-term job placement?
Monitoring Evaluation Learning • Performance indicators on jobs
created, people gaining employment, or students enrolled (reported by
• Performance evaluations of selected activities Contribution analyses
• Beneficiaries feedback
• Studies, assessments (i.e. Education sector assessment)
• Portfolio reviews
7
Monitoring Evaluation Learning implementing partners)
• Success stories • Context indicators and
administrative data on education and economic variables
• Mid-course stocktaking • Implementing partners
meetings/Communities of Practice
• Donors roundtable by topic (Education)
• Data mining
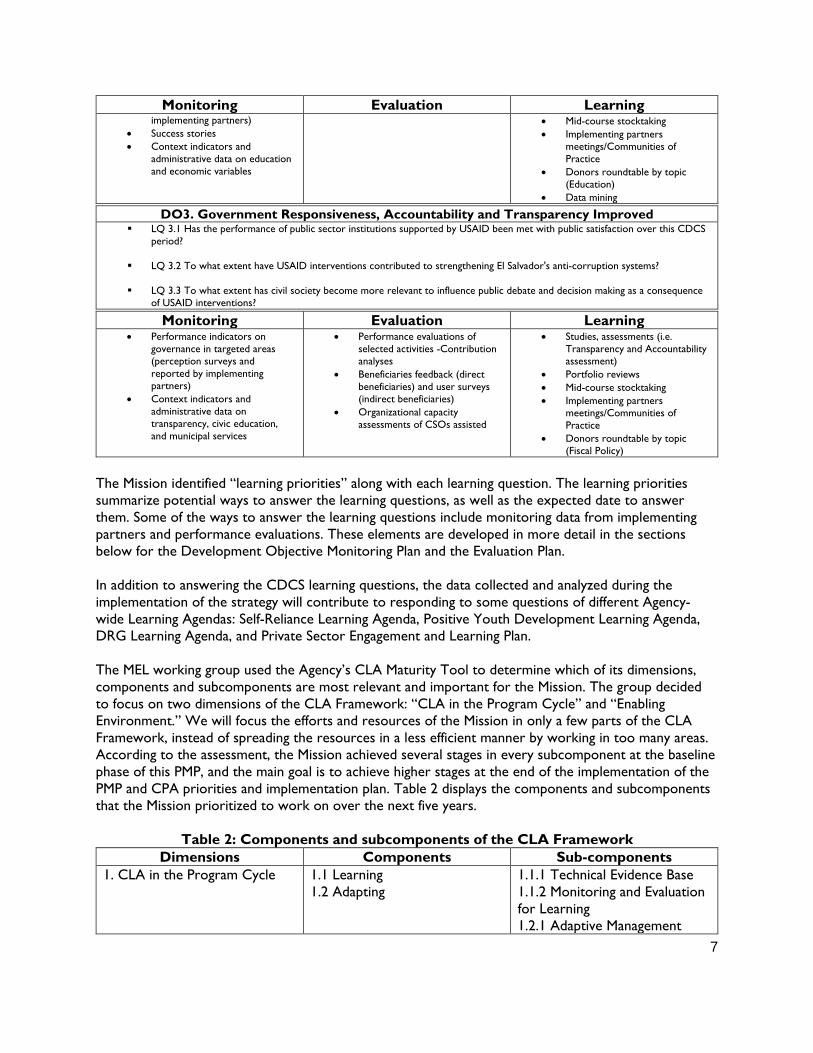
DO3. Government Responsiveness, Accountability and Transparency Improved LQ 3.1 Has the performance of public sector institutions supported by USAID been met with public satisfaction over this CDCS
period?
LQ 3.2 To what extent have USAID interventions contributed to strengthening El Salvador's anti-corruption systems?
LQ 3.3 To what extent has civil society become more relevant to influence public debate and decision making as a consequence of USAID interventions?
Monitoring Evaluation Learning • Performance indicators on
governance in targeted areas (perception surveys and reported by implementing partners)
• Context indicators and administrative data on transparency, civic education, and municipal services
• Performance evaluations of selected activities -Contribution analyses
• Beneficiaries feedback (direct beneficiaries) and user surveys (indirect beneficiaries)
• Organizational capacity assessments of CSOs assisted
• Studies, assessments (i.e. Transparency and Accountability assessment)
• Portfolio reviews • Mid-course stocktaking • Implementing partners
meetings/Communities of Practice
• Donors roundtable by topic (Fiscal Policy)
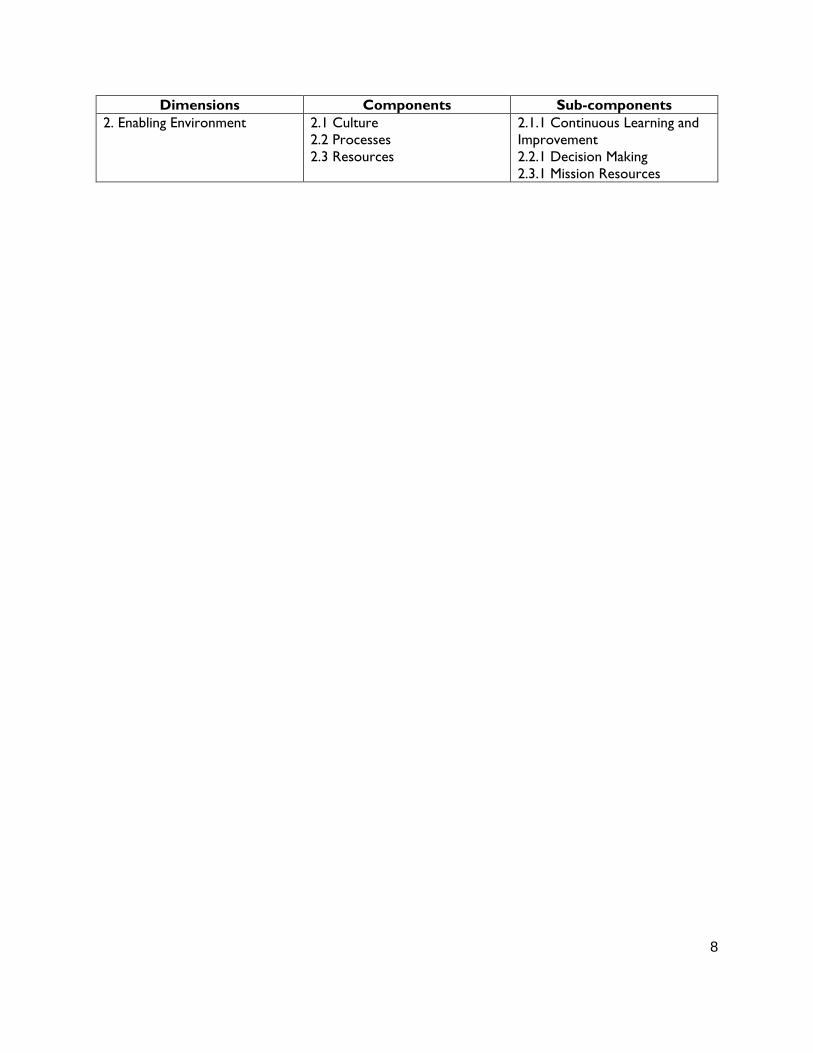
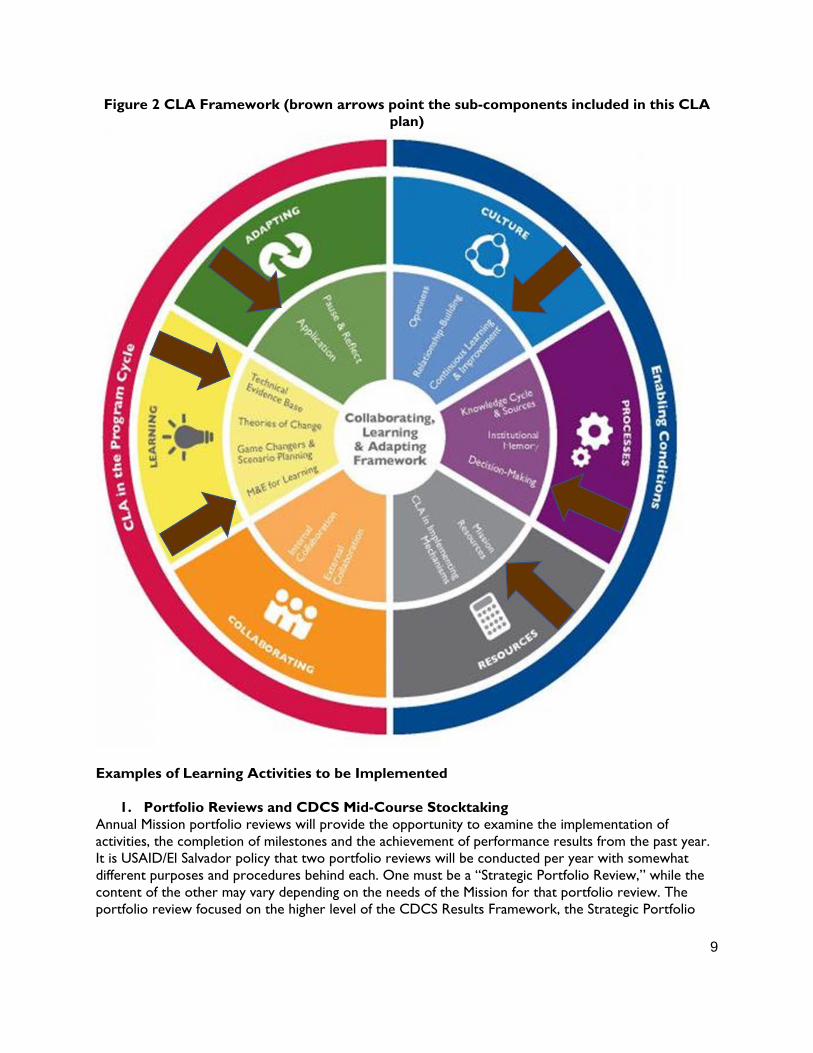
The Mission identified “learning priorities” along with each learning question. The learning priorities summarize potential ways to answer the learning questions, as well as the expected date to answer them. Some of the ways to answer the learning questions include monitoring data from implementing partners and performance evaluations. These elements are developed in more detail in the sections below for the Development Objective Monitoring Plan and the Evaluation Plan. In addition to answering the CDCS learning questions, the data collected and analyzed during the implementation of the strategy will contribute to responding to some questions of different Agency-wide Learning Agendas: Self-Reliance Learning Agenda, Positive Youth Development Learning Agenda, DRG Learning Agenda, and Private Sector Engagement and Learning Plan. The MEL working group used the Agency’s CLA Maturity Tool to determine which of its dimensions, components and subcomponents are most relevant and important for the Mission. The group decided to focus on two dimensions of the CLA Framework: “CLA in the Program Cycle” and “Enabling Environment.” We will focus the efforts and resources of the Mission in only a few parts of the CLA Framework, instead of spreading the resources in a less efficient manner by working in too many areas. According to the assessment, the Mission achieved several stages in every subcomponent at the baseline phase of this PMP, and the main goal is to achieve higher stages at the end of the implementation of the PMP and CPA priorities and implementation plan. Table 2 displays the components and subcomponents that the Mission prioritized to work on over the next five years.
Table 2: Components and subcomponents of the CLA Framework Dimensions Components Sub-components
1. CLA in the Program Cycle 1.1 Learning 1.2 Adapting
1.1.1 Technical Evidence Base 1.1.2 Monitoring and Evaluation for Learning 1.2.1 Adaptive Management
8
Dimensions Components Sub-components 2. Enabling Environment 2.1 Culture
2.2 Processes 2.3 Resources
2.1.1 Continuous Learning and Improvement 2.2.1 Decision Making 2.3.1 Mission Resources
9
Figure 2 CLA Framework (brown arrows point the sub-components included in this CLA plan)
Examples of Learning Activities to be Implemented
1. Portfolio Reviews and CDCS Mid-Course Stocktaking Annual Mission portfolio reviews will provide the opportunity to examine the implementation of activities, the completion of milestones and the achievement of performance results from the past year. It is USAID/El Salvador policy that two portfolio reviews will be conducted per year with somewhat different purposes and procedures behind each. One must be a “Strategic Portfolio Review,” while the content of the other may vary depending on the needs of the Mission for that portfolio review. The portfolio review focused on the higher level of the CDCS Results Framework, the Strategic Portfolio
10
Review, should focus on DO performance and examine a sample of indicators contained in the PMP as well as relevant evaluation findings. One of the Portfolio Reviews conducted in 2022 will also be the CDCS mid-course stocktaking and thus will focus on assessing how contextual changes and results to date confirm or challenge core assumptions of the strategy; and how implementation of the Mission’s portfolio (including projects and activities) supports the strategy’s development objectives in practice, and whether these could be better aligned. The Mid-Course Stocktaking will look at cumulative results from the CDCS implementation over the first half of the strategy, instead of taking a cumulative look during the last year of the strategy. The identified CDCS learning questions will be considered as part of the Mid-Course Stocktaking, and previous Portfolio Reviews (FY2020 and FY2021) serve as evidence. One of the portfolio reviews during the final year of the CDCS (FY 2025) will include a review of the cumulative achievements toward the DOs and IRs, with the results documented to support knowledge management.
2. Implementing Partners/Stakeholders Meetings At least once a year, the Mission will organize a “learning” implementing partners meeting, under the guidance of RPO. The meeting can be in-person or virtual, and it can focus on one or more of the following objectives:
- Introducing and sharing information, practices, innovations, and adaptations; - Addressing common challenges and obstacles geared towards problem solving; - Strengthening capacity or addressing knowledge gaps; - Finding and facilitating areas of collaboration, efficiencies, or co-creation; and - Coming to consensus or collective decision making
Technical and support offices will schedule implementing partner meetings for various reasons. These “learning” meetings would complement the partner meetings that other offices, or the Mission as a whole, might organize. However, the entire Mission will be encouraged to attend the all-implementing partners “learning” meetings to maximize impact and collective learning opportunities. Finally, the Mission may organize strategic meetings with additional stakeholders such as the donor community, private sector representatives, academia, civil society organizations, representatives of the central and municipal government, and others to learn more about the context where the portfolio is being implemented and to identify opportunities for collaboration and synergies. 3. Other Learning Activities The Mission will: ● Draft Close-out note of four ending projects from the previous CDCS to summarize progress toward the achievement of the projects’ purpose and end-of-project targets for key performance indicators and summarize key lessons learned that should apply to subsequent projects. ● Use complementary data sources. The MEL working group with input from the Technical Offices should identify annually the research, studies, or analysis that will help the Mission identify knowledge gaps. The need for these studies can be triggered at any moment, but it is preferred to identify them annually when preparing the work plan of the Mission MEL platform. Some of these needs are already regulated by the Agency's policies, such as the Economic Growth Policy (January 2021) that requires designs for economic-growth programs must be backed by USAID-led economic analysis. ● Organize and participate in communities of practice (CoPs). Creating spaces for dialogue and knowledge sharing among skilled practitioners can facilitate cross-pollination of ideas and inter-sectoral
11
learning. Possible fora for cultivating these types of communities of practice include: internal staff meetings, ad hoc cross-team/cross-office meetings, information discussion groups, brown bag presentations, and joint site visits and debriefs. An existing CoP is the LAC MEL Peer Network, a space for collaboration and learning among MEL Specialists and others interested in MEL topics in the LAC region, which fosters and facilitates the organization and utilization of the Missions' knowledge for better planning, learning and impact. The participation in the group gives its members immediate access to more similar MEL experiences within regional contexts. Another example of a CoP is the newly formalized Northern Triangle Central America Migration CoP to check-in regularly on topics such as migration research, indicators, mapping, among others. Other examples of CLA activities, such as Performance/Context Monitoring and Performance Evaluations, will be developed more deeply as part of the DO Monitoring Plans and the Evaluation Plan sections of this PMP.
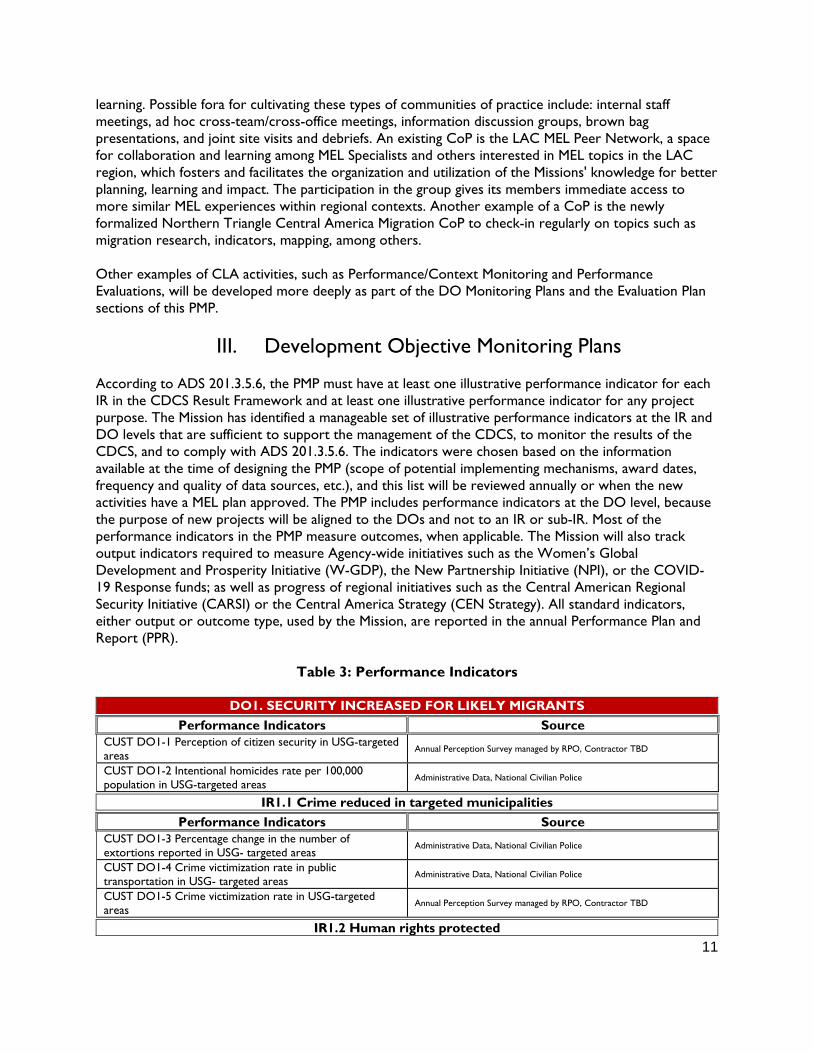
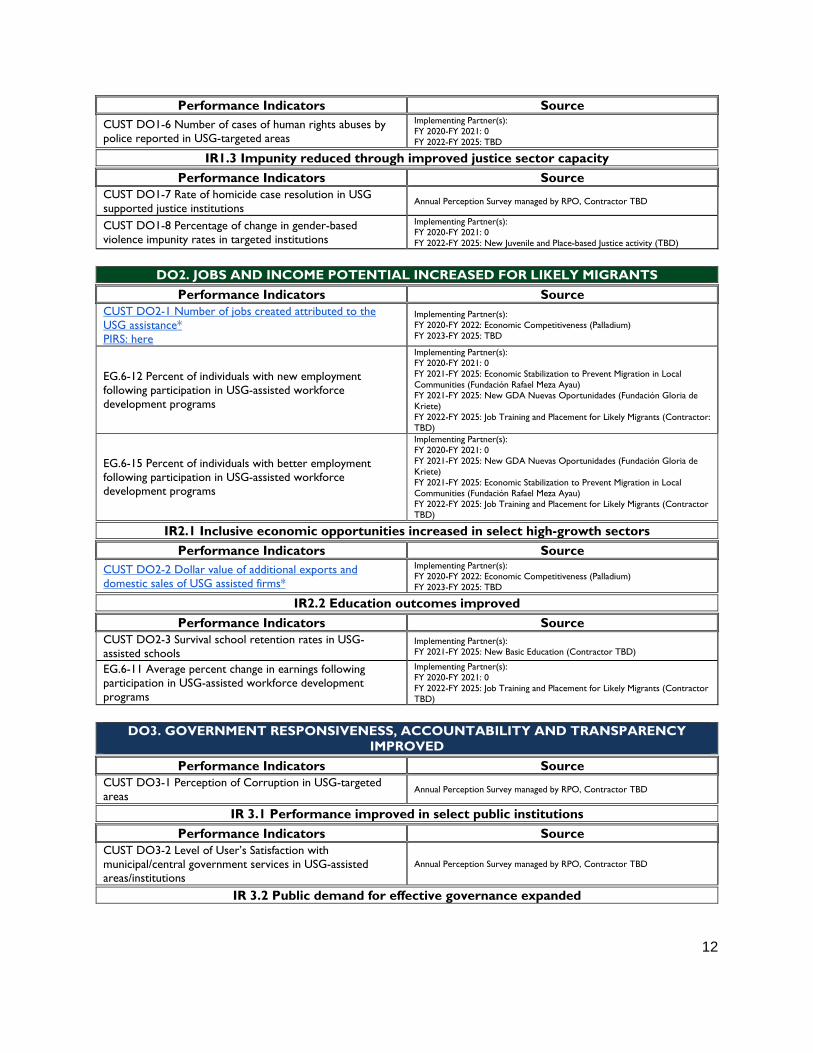
III. Development Objective Monitoring Plans According to ADS 201.3.5.6, the PMP must have at least one illustrative performance indicator for each IR in the CDCS Result Framework and at least one illustrative performance indicator for any project purpose. The Mission has identified a manageable set of illustrative performance indicators at the IR and DO levels that are sufficient to support the management of the CDCS, to monitor the results of the CDCS, and to comply with ADS 201.3.5.6. The indicators were chosen based on the information available at the time of designing the PMP (scope of potential implementing mechanisms, award dates, frequency and quality of data sources, etc.), and this list will be reviewed annually or when the new activities have a MEL plan approved. The PMP includes performance indicators at the DO level, because the purpose of new projects will be aligned to the DOs and not to an IR or sub-IR. Most of the performance indicators in the PMP measure outcomes, when applicable. The Mission will also track output indicators required to measure Agency-wide initiatives such as the Women’s Global Development and Prosperity Initiative (W-GDP), the New Partnership Initiative (NPI), or the COVID-19 Response funds; as well as progress of regional initiatives such as the Central American Regional Security Initiative (CARSI) or the Central America Strategy (CEN Strategy). All standard indicators, either output or outcome type, used by the Mission, are reported in the annual Performance Plan and Report (PPR).
Table 3: Performance Indicators
DO1. SECURITY INCREASED FOR LIKELY MIGRANTS
Performance Indicators Source CUST DO1-1 Perception of citizen security in USG-targeted areas Annual Perception Survey managed by RPO, Contractor TBD CUST DO1-2 Intentional homicides rate per 100,000 population in USG-targeted areas Administrative Data, National Civilian Police
IR1.1 Crime reduced in targeted municipalities
Performance Indicators Source CUST DO1-3 Percentage change in the number of extortions reported in USG- targeted areas Administrative Data, National Civilian Police CUST DO1-4 Crime victimization rate in public transportation in USG- targeted areas Administrative Data, National Civilian Police CUST DO1-5 Crime victimization rate in USG-targeted areas Annual Perception Survey managed by RPO, Contractor TBD
IR1.2 Human rights protected
12
Performance Indicators Source CUST DO1-6 Number of cases of human rights abuses by police reported in USG-targeted areas
Implementing Partner(s): FY 2020-FY 2021: 0 FY 2022-FY 2025: TBD
IR1.3 Impunity reduced through improved justice sector capacity
Performance Indicators Source CUST DO1-7 Rate of homicide case resolution in USG supported justice institutions Annual Perception Survey managed by RPO, Contractor TBD
CUST DO1-8 Percentage of change in gender-based violence impunity rates in targeted institutions
Implementing Partner(s): FY 2020-FY 2021: 0 FY 2022-FY 2025: New Juvenile and Place-based Justice activity (TBD)
DO2. JOBS AND INCOME POTENTIAL INCREASED FOR LIKELY MIGRANTS
Performance Indicators Source CUST DO2-1 Number of jobs created attributed to the USG assistance* PIRS: here
Implementing Partner(s): FY 2020-FY 2022: Economic Competitiveness (Palladium) FY 2023-FY 2025: TBD
EG.6-12 Percent of individuals with new employment following participation in USG-assisted workforce development programs
Implementing Partner(s): FY 2020-FY 2021: 0 FY 2021-FY 2025: Economic Stabilization to Prevent Migration in Local Communities (Fundación Rafael Meza Ayau) FY 2021-FY 2025: New GDA Nuevas Oportunidades (Fundación Gloria de Kriete) FY 2022-FY 2025: Job Training and Placement for Likely Migrants (Contractor: TBD)
EG.6-15 Percent of individuals with better employment following participation in USG-assisted workforce development programs
Implementing Partner(s): FY 2020-FY 2021: 0 FY 2021-FY 2025: New GDA Nuevas Oportunidades (Fundación Gloria de Kriete) FY 2021-FY 2025: Economic Stabilization to Prevent Migration in Local Communities (Fundación Rafael Meza Ayau) FY 2022-FY 2025: Job Training and Placement for Likely Migrants (Contractor TBD)
IR2.1 Inclusive economic opportunities increased in select high-growth sectors
Performance Indicators Source CUST DO2-2 Dollar value of additional exports and domestic sales of USG assisted firms*
Implementing Partner(s): FY 2020-FY 2022: Economic Competitiveness (Palladium) FY 2023-FY 2025: TBD
IR2.2 Education outcomes improved
Performance Indicators Source CUST DO2-3 Survival school retention rates in USG-assisted schools
Implementing Partner(s): FY 2021-FY 2025: New Basic Education (Contractor TBD)
EG.6-11 Average percent change in earnings following participation in USG-assisted workforce development programs
Implementing Partner(s): FY 2020-FY 2021: 0 FY 2022-FY 2025: Job Training and Placement for Likely Migrants (Contractor TBD)
DO3. GOVERNMENT RESPONSIVENESS, ACCOUNTABILITY AND TRANSPARENCY
IMPROVED
Performance Indicators Source CUST DO3-1 Perception of Corruption in USG-targeted areas Annual Perception Survey managed by RPO, Contractor TBD
IR 3.1 Performance improved in select public institutions
Performance Indicators Source CUST DO3-2 Level of User’s Satisfaction with municipal/central government services in USG-assisted areas/institutions
Annual Perception Survey managed by RPO, Contractor TBD
IR 3.2 Public demand for effective governance expanded
13
Performance Indicators Source CUST DO3-3 Number of CSO-led Citizen Oversight/Advocacy actions supported by USG
Implementing Partner(s) FY 2020-FY 2021: Government Integrity (Tetra Tech DPK) FY 2022-FY 2025: TBD
IR 3.3 Corruption reduced
Performance Indicators Source DR.2.2-4 Number of anti-corruption measures proposed, adopted or implemented due to USG assistance, to include laws, policies, or procedures
Implementing Partner(s) FY 2020-FY 2021: Government Integrity (Tetra Tech DPK) FY 2022-FY 2025: TBD
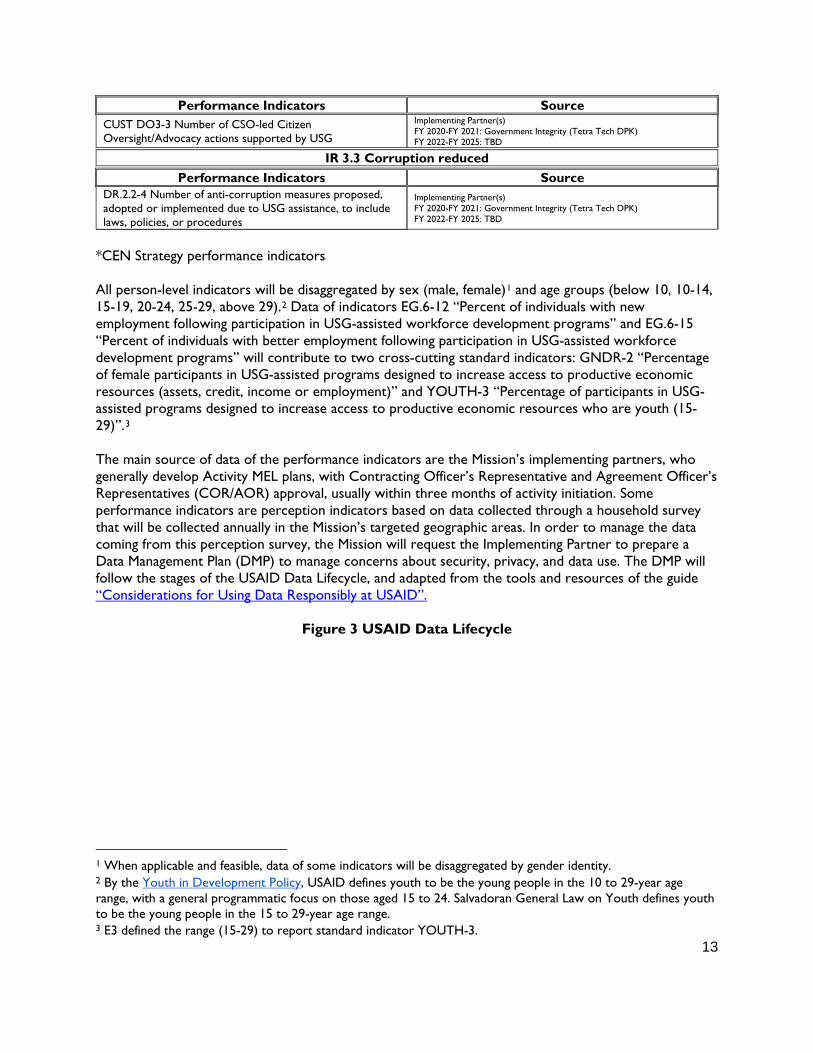
*CEN Strategy performance indicators All person-level indicators will be disaggregated by sex (male, female)1 and age groups (below 10, 10-14, 15-19, 20-24, 25-29, above 29).2 Data of indicators EG.6-12 “Percent of individuals with new employment following participation in USG-assisted workforce development programs” and EG.6-15 “Percent of individuals with better employment following participation in USG-assisted workforce development programs” will contribute to two cross-cutting standard indicators: GNDR-2 “Percentage of female participants in USG-assisted programs designed to increase access to productive economic resources (assets, credit, income or employment)” and YOUTH-3 “Percentage of participants in USG-assisted programs designed to increase access to productive economic resources who are youth (15-29)”.3 The main source of data of the performance indicators are the Mission’s implementing partners, who generally develop Activity MEL plans, with Contracting Officer’s Representative and Agreement Officer’s Representatives (COR/AOR) approval, usually within three months of activity initiation. Some performance indicators are perception indicators based on data collected through a household survey that will be collected annually in the Mission’s targeted geographic areas. In order to manage the data coming from this perception survey, the Mission will request the Implementing Partner to prepare a Data Management Plan (DMP) to manage concerns about security, privacy, and data use. The DMP will follow the stages of the USAID Data Lifecycle, and adapted from the tools and resources of the guide “Considerations for Using Data Responsibly at USAID”.
Figure 3 USAID Data Lifecycle
1 When applicable and feasible, data of some indicators will be disaggregated by gender identity. 2 By the Youth in Development Policy, USAID defines youth to be the young people in the 10 to 29-year age range, with a general programmatic focus on those aged 15 to 24. Salvadoran General Law on Youth defines youth to be the young people in the 15 to 29-year age range. 3 E3 defined the range (15-29) to report standard indicator YOUTH-3.
14
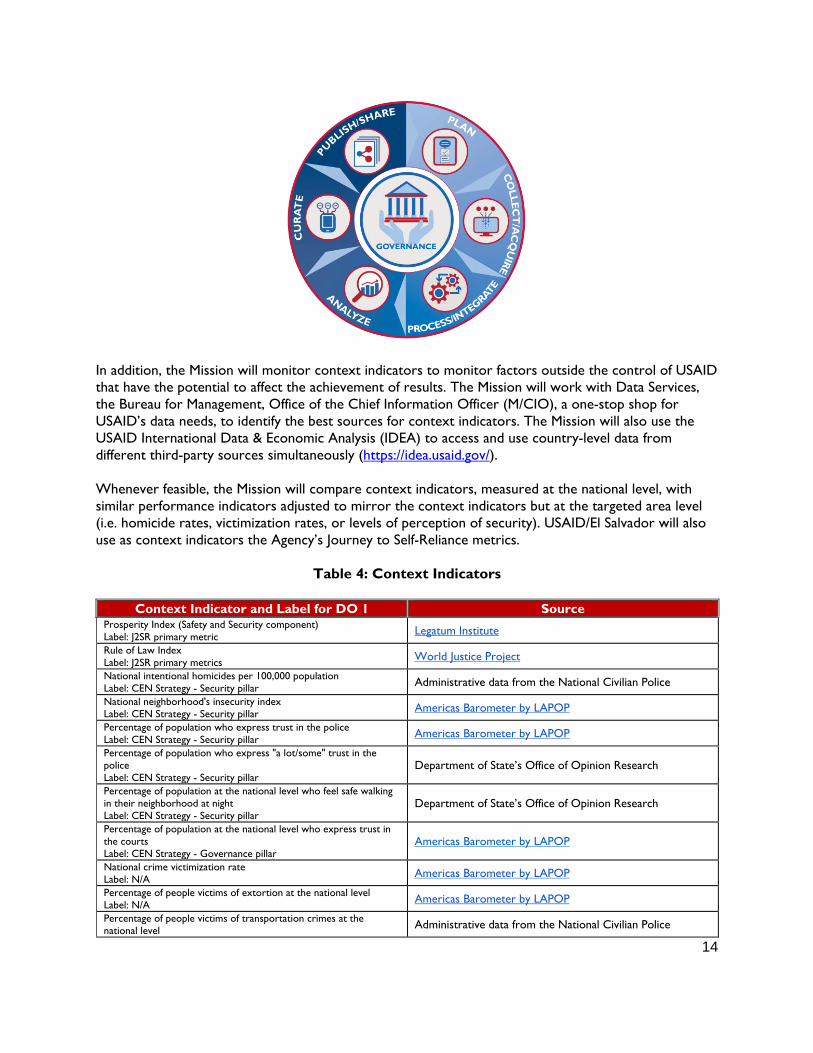
In addition, the Mission will monitor context indicators to monitor factors outside the control of USAID that have the potential to affect the achievement of results. The Mission will work with Data Services, the Bureau for Management, Office of the Chief Information Officer (M/CIO), a one-stop shop for USAID’s data needs, to identify the best sources for context indicators. The Mission will also use the USAID International Data & Economic Analysis (IDEA) to access and use country-level data from different third-party sources simultaneously (https://idea.usaid.gov/). Whenever feasible, the Mission will compare context indicators, measured at the national level, with similar performance indicators adjusted to mirror the context indicators but at the targeted area level (i.e. homicide rates, victimization rates, or levels of perception of security). USAID/El Salvador will also use as context indicators the Agency’s Journey to Self-Reliance metrics.
Table 4: Context Indicators
Context Indicator and Label for DO 1 Source Prosperity Index (Safety and Security component) Label: J2SR primary metric Legatum Institute Rule of Law Index Label: J2SR primary metrics World Justice Project National intentional homicides per 100,000 population Label: CEN Strategy - Security pillar Administrative data from the National Civilian Police National neighborhood's insecurity index Label: CEN Strategy - Security pillar Americas Barometer by LAPOP Percentage of population who express trust in the police Label: CEN Strategy - Security pillar Americas Barometer by LAPOP Percentage of population who express "a lot/some" trust in the police Label: CEN Strategy - Security pillar
Department of State’s Office of Opinion Research
Percentage of population at the national level who feel safe walking in their neighborhood at night Label: CEN Strategy - Security pillar
Department of State’s Office of Opinion Research
Percentage of population at the national level who express trust in the courts Label: CEN Strategy - Governance pillar
Americas Barometer by LAPOP
National crime victimization rate Label: N/A Americas Barometer by LAPOP Percentage of people victims of extortion at the national level Label: N/A Americas Barometer by LAPOP Percentage of people victims of transportation crimes at the national level Administrative data from the National Civilian Police
15
Context Indicator and Label for DO 1 Source Label: N/A Number of cases of human right abuses by the police reported at the national level Label: N/A
Human Rights Universitary Observatory
National rate of homicide case resolutions Label: N/A Administrative data from the National Civilian Police National gender-based violence impunity rate Label: N/A Administrative data from the National Civilian Police
Context Indicator and Label for DO 2 Source GDP per capita PPP at constant 2017 international US$ Label: J2SR primary metric World Bank Easy of Doing Business index score Label: CEN Strategy - Prosperity pillar World Bank Global Competitiveness Index score (skill of current workforce) Label: J2SR secondary metric World Economic Forum Urban underemployment rate at the national level Label: N/A General Directorate of Statistics and Census Number of new net formal jobs created at the national level Label: N/A Salvadoran Social Security Gross Fixed Capital Formation at current price US$ (million)- Private Label: N/A
Central Reserve Bank of El Salvador
Amount of exports of goods and services at current price US$ (thousands) Label: N/A
Central Reserve Bank of El Salvador
Context Indicator and Label for DO 3 Source Corruption Perception Index score Label: CEN Strategy - Governance pillar; J2SR secondary metric Transparency International Net tax revenue as a percentage of GDP Label: CEN Strategy - Governance pillar Ministry of Finance Liberal Democracy Index score Label: J2SR primary metric V-DEM Government Effectiveness indicator score Label: N/A World Bank Global Competitiveness Index score (public sector performance) Label: J2SR secondary metric World Economic Forum Global Competitiveness Index score (checks and balances) Label: J2SR secondary metric World Economic Forum Global Competitiveness Index score (transparency) Label: J2SR secondary metric World Economic Forum Percentage of Salvadorans who trust in their municipal government Label: N/A Americas Barometer by LAPOP Percentage of Salvadoran who are satisfied with the quality of municipal services Label: N/A
Americas Barometer by LAPOP
Percentage of Salvadorans that have been victims of corruption in the last 12 months Label: N/A
Americas Barometer by LAPOP
Percentage of Salvadorans that consider that corruption is generalized in the country Label: N/A
Americas Barometer by LAPOP
Percentage of Salvadoran who trust in elections Label: N/A Americas Barometer by LAPOP Percentage of Salvadoran who trust in political parties Label: N/A Americas Barometer by LAPOP
The Mission will use the J2SR roadmap to track the capacity of the Government of El Salvador to manage its own development journey as well as its laws, policies, actions, and informal governance mechanisms - such as cultures and norms - that support its progress towards self-reliance. Using as a
16
baseline the FY 2021 Country Roadmap, the average score of the capacity pillar is 0.56 and the average score of the commitment pillar is 0.49, in a scale of 0 to 1 (higher is better). Given that reducing the drivers of irregular migration is the goal of the strategy, USAID/El Salvador will also monitor a set of migration indicators that all Missions in the Central America Northern Triangle developed in collaboration with the LAC Bureau in order to assess the impact of relevant programs on migration. Data collected through these indicators track direct beneficiaries’ migration experiences, attitudes, and intentions; when combined with other sources of contextual data, this data will help the Mission monitor direct effects on migration. The seven migration indicators are:
1. Number of beneficiaries enrolled in programs in the reporting period 2. Number of returned migrants receiving U.S. Government assistance 3. Percentage of individuals beneficiaries who are returned migrants 4. Percentage of beneficiaries with a household member who has migrated 5. Percentage of enrolled beneficiaries who drop out due to migration to the U.S. 6. Percentage of beneficiaries who express intention to migrate in the next 3 years 7. Percentage of beneficiaries who plan to stay in their country of residence
All these migration indicators are not considered performance indicators and as such, there will not be targets set for them, but the data for the first indicator (Number of beneficiaries enrolled in programs in the reporting period) — which is the denominator of the five indicators that has “percentage” as the unit of measure — will come from performance indicators that implementing partners with direct beneficiaries4 already collect (i.e., data from standard indicators EG.6-14 “Percent of individuals who complete USG-assisted workforce development programs” and YOUTH-1 “Number of youth trained in soft skills/life skills through USG assisted programs”). The Mission plans to use the Development Information Solution (DIS) System as the repository for all performance indicators, including baseline values and timeframes, targets, and rationales for targets and actual values. This system is a multipurpose tool, as it can be a resource for performance monitoring, geospatial coding, fact sheets, success stories, and many other useful tools. RPO MEL staff, Front Office Economist/Data Specialist, and the MEL platform will track the context indicators. Performance Indicator Reference Sheets (PIRS) As required by ADS 201, all PMP indicators for which data is currently collected have a corresponding PIRS. For all foreign assistance standard indicators, the Mission will use all the standard titles and definitions provided by State/F. PIRS for all other custom indicators will be developed before data collection begins. AOR/CORs will share relevant PIRS with implementing partners to ensure they are able to adhere to standard definitions, especially in cases where more than one partner is reporting on the same indicator.
4 Direct beneficiaries include those who have enrolled in a program and are directly receiving training, technical assistance, services, products, or other direct support, as well as those who attend a school or health center or receive water or electric services from a system that has received support, and who are tracked as part of the monitoring of the support activities (Northern Triangle Migration Indicator Reference Sheets and Guidance, 2019)
17
The Mission expects to house the PIRS for the PMP indicators in the DIS. In addition, the PIRS that are part of the Activity MEL Plans will be saved in the official file of each activity5. The Regional Program Office will ensure that all PIRS are drafted in time for data collection and reporting, and will work with technical teams to update these files on a regular basis. In the case of context indicators, most of them, especially the CEN Strategy and the J2SR indicators, have a reference sheet —or a similar tool that describes their methodology — already developed, and the Mission will utilize them for this PMP. Baselines and Target Setting The Mission has identified two kinds of baseline scenarios according to the type of indicator related: (1) Baseline will be established, once the baseline of the perception survey is collected; and (2) Baseline is zero: this is the case for most of performance indicators (outcome or output) for which data come directly from implementation of activities. For those two performance indicators that the Mission used in the previous CDCS (1. Number of jobs created attributed to the USG assistance and 2. Dollar value of additional exports and domestic sales of USG assisted firms), the baseline will be the results reported in the USAID/El Salvador FY 2019 PPR (4,873 and $43,500,000, respectively). The Mission will set performance indicator targets on the basis of baseline data, historical trends, critical assumptions, and research. In addition, the main factors influencing target setting include availability of resources (e.g., funding, time, and capacity) as well as workplan and implementation approach, especially for those performance indicators at the activity level. Both baselines and targets of the indicators will be stored in DIS. Targets are assessed annually during the Performance Plan Report, and the Annual Portfolio Review (typically in January), and any result achieved outside of the 10 percent margin rule on performance indicators must be justified. Date and value of the baselines of the context and performance indicators whose data is being already collected can be found in the Performance Indicator Summary Table. Assessing Data Quality The Mission will seek rigorous, consistent, and timely collection of indicator data. This, in turn, involves periodic assessments of data quality according to USAID criteria as well as prompt action to address or respond to any identified data quality issues. The purpose of a data quality assessment (DQA) is to ensure that USAID management and staff are aware of the strengths and weaknesses of the data they obtain for strategy, project, and activity performance, as determined by reviewing actual data on indicators against USAID’s criteria for quality: validity, integrity, precision, reliability, and timeliness. DQAs facilitate Mission management and AOR/COR awareness of the extent to which data can be relied upon for management decisions and external reporting. For performance indicators that are reported externally (PPR, Fact Sheets, Bi-weekly bullets, etc.), the Mission will assess data quality when indicators are established and baseline data are collected, followed by reassessments at least once every three years. USAID is not required, nor does it expect, to conduct
5 For all awards made on or after June 26, 2018, the official file is the Agency Secure Image and Storage Tracking (ASIST).
18
DQAs for context indicators. To conduct the DQAs, the Mission will rely on the Data Management Plans (ADS 579.3.1) of the implementing partners, as well as the Data Management Plan of the organization in charge of the annual perception survey. The Mission will assure the correct management of Personal Identifiable Information. Date of the most recent or upcoming DQAs for each indicator can be found in the Performance Indicator Summary Table. Data Management The primary tool for performance monitoring and tracking will be the DIS, a cloud-based information management system that helps manage performance data related to the CDCS, projects, and activities, including indicator management. DIS allows AORs/CORs, USAID MEL Specialists, and implementing partners to consolidate all indicator data and implementing mechanism information (e.g., quarterly reports, geospatial coordinates, deviation narratives, DQAs, PIRS, photos, etc.) into an electronic portfolio. USAID/El Salvador is a pilot mission for DIS. At the moment of preparing this PMP (FY 2020), the Agency is still working on the Performance Management module and Budget modules of DIS, and they have not been rolled-out to all Missions. It is expected that during the first years of the CDCS, the DIS will be completely rolled-out and linked to other USAID applications such as the Development Experience Clearinghouse (DEC) and the Data Development Library (DDL). Digital Strategy The conditions due to the COVID-19 pandemic make it necessary to have new approaches for MEL that imply the incorporation of digital strategies. Virtual site visits, DQAs, and digital feedback will be necessary, at least during the initial phases of the CDCS. Regardless of conditions related to the COVID-19 pandemic, the PMP 2020-2025 will contribute to the USAID Digital Strategy 2020-2025, mainly to the first IR and its two first Sub-IRs: IR I: Secure and appropriate use of digital technology across USAID’s programming improves measurable development and humanitarian-assistance outcomes -Sub-IR 1.1: Insights from assessments of digital ecosystems and advanced data analysis used across USAID’s Program Cycle (to inform strategic planning and design). -Sub-IR 1.2: Established digital best practices integrated into Missions’ strategies, programming, monitoring, and evaluation. One example of implementation of the USAID Digital Strategy is the use of advanced methods of analyzing data such as data-visualization (dashboards using Tableau, ArcGIS6, or other tools) and geospatial analysis.
6 ArcGIS is a geographic information system used for creating and using maps, compiling geographic data, analyzing mapped information, sharing and discovering geographic information, using maps and geographic information in a range of applications, and managing geographic information in a database. It is the most common system used by several organizations, including USAID.
19
Geospatial Analysis: As required by ADS 579, the Mission will collect location data at the most detailed geographic level appropriate for each activity of the CDCS. Because the “targeted areas” mentioned in the Results Framework are at the municipal level, the mandatory Level of Geographic Detail for this PMP will be “Administrative Unit Areas.”7 This is the only Level of Geographic Detail used in DIS, the main repository of the Activity/Strategy Location Data. The data depicting the geographic location where the strategy is implemented will be collected at the municipal level (Administrative Unit 2), which is aligned with the targeted areas of the CDCS, excepting for those activities implemented at the national/Central Government level (Administrative Unit 0, Country). The authoritative administrative unit dataset (names, codes, geographic boundaries) comes from El Salvador’s Centro Nacional de Registros (www.cnr.gob.sv). All metadata must follow ISO 19115 (Geographic Information - Metadata) and ISO 11939 (XML implementation schema). In addition to the DIS, the Mission will use other secondary repositories, such as ArcGIS. Whenever feasible, data will be also collected for Level of Geographic Detail II “Populated Place Location.” Excepting for rare cases, the Mission generally does not expect to collect data for the other two USAID’s Levels of Geographic Details: “Exact Area or Line Feature” and “Exact Site Location.” Because storing the location data in ArcGIS allows more flexibility, the Mission will require when possible the implementing partners to also collect data of “Location of Intended Beneficiaries.” For example, indicators to measure the number of people trained, such as YOUTH-1 “Number of youth trained in soft skills/life skills through USG assisted programs,” that may count participants coming from parts of the country different than the location where the training is conducted, can be tracked by either the location of implementation and location of beneficiaries, and provide more useful information to support portfolio management and transparency and accountability objectives. The Mission, with the support of the USAID GeoCenter, will explore ways to build capacity for greater utilization of GIS-related tools and information. Greater use of GIS tools and information will assist the mission in coordinating implementing partners’ activities, providing relevant and timely data to partner government and other stakeholders, and improve accountability for activity and project results. In addition, USAID/El Salvador will explore ways to use GIS to improve decision making and management as part of PMP implementation.
IV. Evaluation Plan Evaluation is the systematic collection and analysis of information about the characteristics and outcomes of programs and projects as a basis for judgments to improve effectiveness, and/or inform decisions about current and future programming. The purpose of evaluations is to ensure accountability to stakeholders and to learn to improve effectiveness. USAID/El Salvador is committed to rigorous evaluation to contribute to evidence and learning related to its programs. The Mission appreciates the need to use the full range of evaluation methods to conduct evaluations, including performance and impact evaluations. The purpose of the evaluation and/or its use
7 According to ADS 579, the Mission must choose at least one of the four levels of geographic detail at which data be collected: 1. Administrative Unit Area, 2. Populated Place Location, 3. Exact Area or Line Feature, 4. Exact Site Locations. If Administrative Unit Area is selected, then data is collected by administrative units, such as country (administrative unit 0), department (administrative unit 1) or municipality (administrative unit 2) and visually represented by the entire area of the administrative unit. We will be collecting data at the municipal level.
20
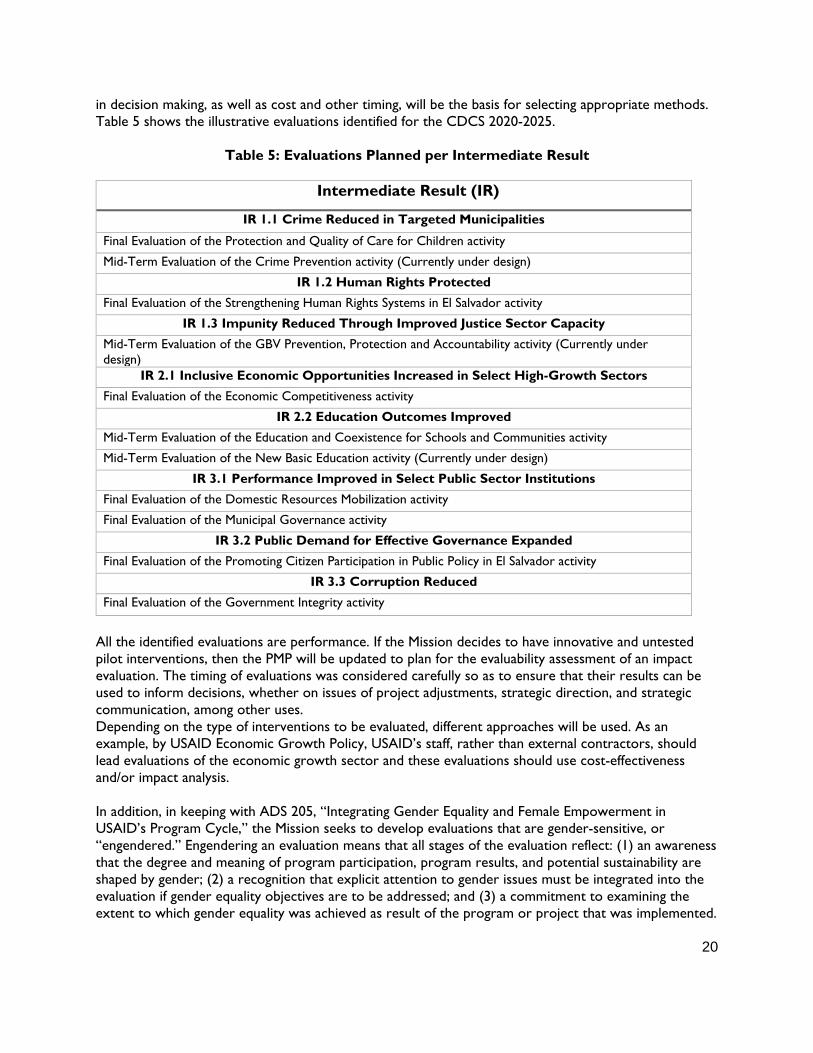
in decision making, as well as cost and other timing, will be the basis for selecting appropriate methods. Table 5 shows the illustrative evaluations identified for the CDCS 2020-2025.
Table 5: Evaluations Planned per Intermediate Result
Intermediate Result (IR)
IR 1.1 Crime Reduced in Targeted Municipalities Final Evaluation of the Protection and Quality of Care for Children activity Mid-Term Evaluation of the Crime Prevention activity (Currently under design)
IR 1.2 Human Rights Protected Final Evaluation of the Strengthening Human Rights Systems in El Salvador activity
IR 1.3 Impunity Reduced Through Improved Justice Sector Capacity Mid-Term Evaluation of the GBV Prevention, Protection and Accountability activity (Currently under design)
IR 2.1 Inclusive Economic Opportunities Increased in Select High-Growth Sectors Final Evaluation of the Economic Competitiveness activity
IR 2.2 Education Outcomes Improved Mid-Term Evaluation of the Education and Coexistence for Schools and Communities activity Mid-Term Evaluation of the New Basic Education activity (Currently under design)
IR 3.1 Performance Improved in Select Public Sector Institutions Final Evaluation of the Domestic Resources Mobilization activity Final Evaluation of the Municipal Governance activity
IR 3.2 Public Demand for Effective Governance Expanded Final Evaluation of the Promoting Citizen Participation in Public Policy in El Salvador activity
IR 3.3 Corruption Reduced Final Evaluation of the Government Integrity activity
All the identified evaluations are performance. If the Mission decides to have innovative and untested pilot interventions, then the PMP will be updated to plan for the evaluability assessment of an impact evaluation. The timing of evaluations was considered carefully so as to ensure that their results can be used to inform decisions, whether on issues of project adjustments, strategic direction, and strategic communication, among other uses. Depending on the type of interventions to be evaluated, different approaches will be used. As an example, by USAID Economic Growth Policy, USAID’s staff, rather than external contractors, should lead evaluations of the economic growth sector and these evaluations should use cost-effectiveness and/or impact analysis. In addition, in keeping with ADS 205, “Integrating Gender Equality and Female Empowerment in USAID’s Program Cycle,” the Mission seeks to develop evaluations that are gender-sensitive, or “engendered.” Engendering an evaluation means that all stages of the evaluation reflect: (1) an awareness that the degree and meaning of program participation, program results, and potential sustainability are shaped by gender; (2) a recognition that explicit attention to gender issues must be integrated into the evaluation if gender equality objectives are to be addressed; and (3) a commitment to examining the extent to which gender equality was achieved as result of the program or project that was implemented.
21
This Evaluation Plan will be used to inform and update the Evaluation Registry in the PPR. The Mission will revisit and update this priority list after the next portfolio review meeting. The Mission may determine that additional evaluations are needed. Per USAID guidance, the following situations may serve as possible evaluation “triggers” causing the mission to consider additional evaluations:
● A key management decision is required, but adequate information is lacking; ● Performance information indicates an unexpected result (positive or negative) that should be
explained, ● Beneficiary, partner, or other informed feedback (such as a contractor performance evaluation)
suggests implementation problems, unmet needs, or unintended consequences or impacts; ● Issues of sustainability, cost-effectiveness, or relevance arise; ● The validity of Results Framework hypotheses or critical assumptions is questioned, for
example, due to unanticipated changes in the host country environment; or ● Periodic Portfolio Reviews/Strategy Mid-Course Stocktaking have identified key questions that
need to be answered or require consensus. Beneficiaries Feedback The U.S. Consolidated Appropriations Act of 2020 mandates that funds available for monitoring and evaluation of assistance under the headings “Development Assistance,'' “International Disaster Assistance,'' and “Migration and Refugee Assistance'' shall, as appropriate, be made available for the regular collection of feedback obtained directly from beneficiaries on the quality and relevance of such assistance; and USAID shall regularly conduct oversight to ensure that such feedback is regularly collected and used by implementing partners to maximize the cost-effectiveness and utility of such assistance. While the Agency works on establishing the procedures for implementing partners for regular collection of and response to such feedback (including guidelines for the reporting on actions taken in response to the feedback received), the Mission will take advantage of the Performance Evaluations to include the beneficiaries’ feedback as part of the findings, and the evaluation recommendations should describe actions to address the feedback.
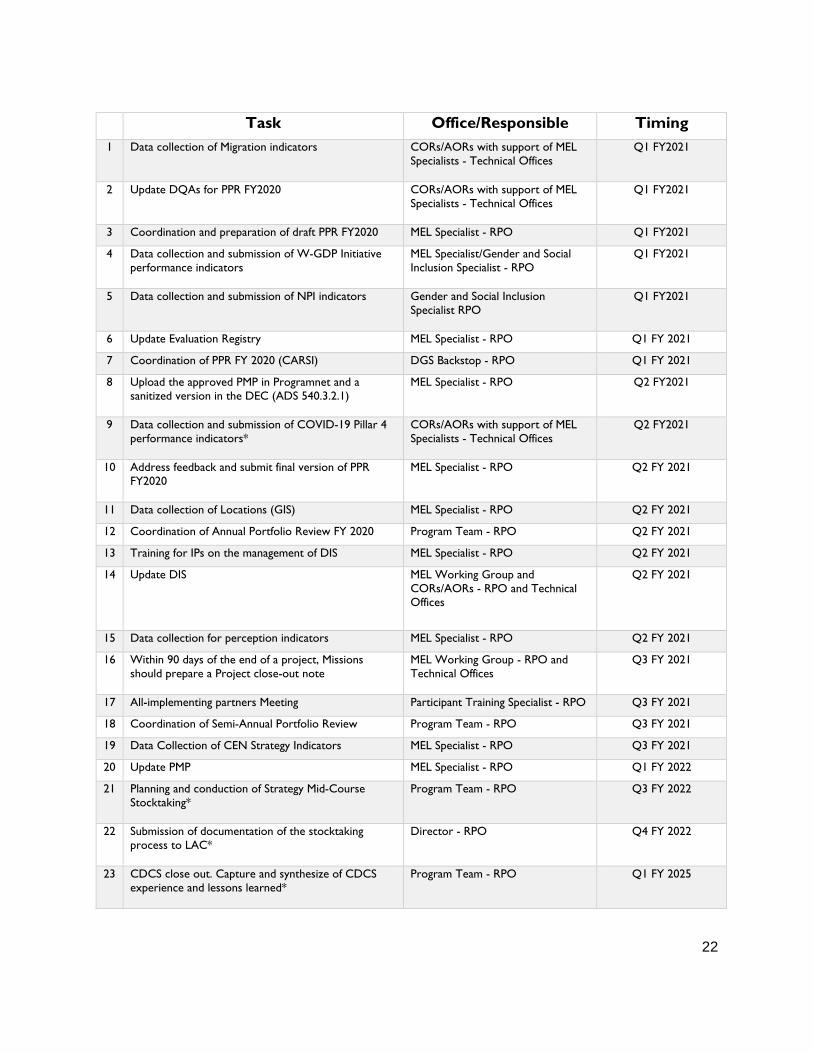
V. Schedule of Performance-Management Tasks and Responsibilities The design of the initial PMP was an effort led by the MEL Working Group with inputs from CORs/AORs, Office Directors, advisors in LAC and other Missions. However, the implementation of the activities described in this PMP will be the responsibility of a wide variety of actors, and not just the MEL Working Group. The PMP is a tool to guide the Mission in its performance management efforts and, as such, will be updated as necessary to reflect changes that naturally occur over the life of a typical five-year strategy. Indeed, PMP implementation is not a one-time occurrence, but rather an ongoing process of review, revision, and re-implementation. The Mission will update the PMP at least once per year in conjunction with the relevant Portfolio Reviews, or as needed. Technical Offices, with RPO support, will track results by regularly updating the DIS Tool. RPO will maintain a record of substantive changes made to the PMP (including rationale for the changes as well as management approval, when appropriate) and will archive retired versions of the PMP. Table 6 shows the main Schedule of Performance-Management Tasks and Responsibilities that the Mission can identify in advance.
Table 6 Schedule of Performance-Management Tasks and Responsibilities
22
Task Office/Responsible Timing 1 Data collection of Migration indicators CORs/AORs with support of MEL
Specialists - Technical Offices Q1 FY2021
2 Update DQAs for PPR FY2020 CORs/AORs with support of MEL Specialists - Technical Offices
Q1 FY2021
3 Coordination and preparation of draft PPR FY2020 MEL Specialist - RPO Q1 FY2021
4 Data collection and submission of W-GDP Initiative performance indicators
MEL Specialist/Gender and Social Inclusion Specialist - RPO
Q1 FY2021
5 Data collection and submission of NPI indicators Gender and Social Inclusion Specialist RPO
Q1 FY2021
6 Update Evaluation Registry MEL Specialist - RPO Q1 FY 2021
7 Coordination of PPR FY 2020 (CARSI) DGS Backstop - RPO Q1 FY 2021
8 Upload the approved PMP in Programnet and a sanitized version in the DEC (ADS 540.3.2.1)
MEL Specialist - RPO Q2 FY2021
9 Data collection and submission of COVID-19 Pillar 4 performance indicators*
CORs/AORs with support of MEL Specialists - Technical Offices
Q2 FY2021
10 Address feedback and submit final version of PPR FY2020
MEL Specialist - RPO Q2 FY 2021
11 Data collection of Locations (GIS) MEL Specialist - RPO Q2 FY 2021
12 Coordination of Annual Portfolio Review FY 2020 Program Team - RPO Q2 FY 2021
13 Training for IPs on the management of DIS MEL Specialist - RPO Q2 FY 2021
14 Update DIS MEL Working Group and CORs/AORs - RPO and Technical Offices
Q2 FY 2021
15 Data collection for perception indicators MEL Specialist - RPO Q2 FY 2021
16 Within 90 days of the end of a project, Missions should prepare a Project close-out note
MEL Working Group - RPO and Technical Offices
Q3 FY 2021
17 All-implementing partners Meeting Participant Training Specialist - RPO Q3 FY 2021
18 Coordination of Semi-Annual Portfolio Review Program Team - RPO Q3 FY 2021
19 Data Collection of CEN Strategy Indicators MEL Specialist - RPO Q3 FY 2021
20 Update PMP MEL Specialist - RPO Q1 FY 2022
21 Planning and conduction of Strategy Mid-Course Stocktaking*
Program Team - RPO Q3 FY 2022
22 Submission of documentation of the stocktaking process to LAC*
Director - RPO Q4 FY 2022
23 CDCS close out. Capture and synthesize of CDCS experience and lessons learned*
Program Team - RPO Q1 FY 2025
23
The Mission will conduct the tasks annually until the end of the CDCS, except for those tasks marked with (*), which will be done only once during the life of the CDCS.
VI. Resources for Performance Management Tasks
The Mission has a MEL Working Group whose members represent the RPO (MEL Specialist, Gender and Social Inclusion Point of Contact, Program Officer, Participant Training Coordinator) and includes the MEL Specialists of the Technical Offices. Three members of the Working Group are full-time MEL Specialists (at least 75 percent of their Position Description relates to MEL functions). Other members of the Mission, such as CORs/AORs, sectorial specialists (i.e. Education Officer, Environment Officer, etc.), Mission Economist, Program Team Backstops, and/or the officer who manages donor coordination can support the MEL Working Group to identify data sources for context indicators, establish relationships with third party data sources or data owners and sectoral specialists, design evaluations or other specialized studies and work as peer reviewers, etc. To implement this PMP, the MEL Working Group will also have the support of a network of peers and advisors in Washington and the LAC region. As described in the CLA Plan, the Mission participates in the LAC MEL Peer Network, which includes MEL Specialists from all Missions in the LAC Region, MEL Advisors and Fellows from the LAC Bureau, and MEL Specialists from PPL. If needed, the MEL Working Group will also request the support of the MEL Specialists from the Pillar Bureaus, Geospatial Analysts from the U.S. Global Development Lab/GeoCenter, and Data Analysts from M/CIO. Depending on the needs of the Mission (and the type of funds obligated in the MEL mechanism), the Mission can use this platform to train staff. In addition, the MEL Working Group will design activities to build Technical Office staff skill and experience in MEL, disseminate materials and opportunities for virtual or presential training sessions, and coordinate with the Executive Office regarding any potential USAID MEL-related training that can be conducted in the El Salvador training hub.


![[Andy Crowe PMP PgMP] the PMP Exam Quick Referen(BookZZ.org)](https://img.pdfslide.us/doc/110x75/577c79d11a28abe054940b45/andy-crowe-pmp-pgmp-the-pmp-exam-quick-referenbookzzorg.jpg)