Embed Size (px)
Citation preview
PMO – The Value Journey
Page 1Public
March, 29th 2011
Cindy Donovan, PMP
“How do you eat an elephant?”
“One bite at a time!”
“How do you create a valuable PMO?”
Page 2Public
“One step at a time!”

Today’s Journey
Decide to take a trip Need a PMO
Gather destination ideas & needs Research PMO Models & functions
Determine destination Define PMO Mission
Check the weather Understand organizational culture and current state
Pack Identify Process Management Methods
Page 3Public
Pack Identify Process Management Methods and Tools
Put in your starting point, map the route and start driving
Drive Process, Change & Value
Year 1, Year 2, Year 3 and beyond
Make stops along the way and adjust route where necessary
Measure value, assess lessons learned & drive continuous Improvement
Check the rearview mirror Value Momentum

Gather destination ideas & needs
Page 4Public

The PMO Value Proposition
Page 5Public
Copyright 2008 Forrester, Inc. All Rights Reserved

Framing the Mission of the PMOIn
vo
lve
me
nt
in
Pro
jec
t E
xe
cu
tio
n
Coach
Auditor Fin. Advisor
Enterprise
Standards & Approach
Standards & Approach
Measure Standards & Approach
Measure
Project
Transition
Portfolio
Measure
Portfolio
Page 6Public
Coach Auditor Financial Advisor Enterprise
Mission:
• Share Project Management Best Practices
Tasks:
• Develop Standards & Methodologies
• Facilitate Project Manager Development
Success Metrics:
• Project Management Standards Compliance
• Methodology-Driven Project Delivery Improvement
Mission:
• Create Visibility into project queue performance
Tasks:
• Track & report project status
• Administer stage-gating and mid-project reviews
• Project Execution Post-Mortems
Success Metrics:
• Reduce Incremental Project Funding
• Reduce Controllable Project Failures
Mission:
• Facilitate Project Portfolio Optimization
Tasks:
• Support portfolio definition and asset allocation
• Guide Portfolio prioritization decisions
• Conduct Business Case Realization Audits
Success Metrics:
• Total Portfolio Returns
• IT Strategic Alignment
Degree of Authority over Benefits Realization & Risk Management
Portfolio
Mission:
• Optimize project portfolio, maximize throughput, and Drive Successful Project Delivery
Tasks:
• Oversee Project Managers
• Support Project Planning Process
Success Metrics:
• On-Time Delivery
• On-Budget Delivery
• On-Scope Delivery

Determine Destination
Page 7Public
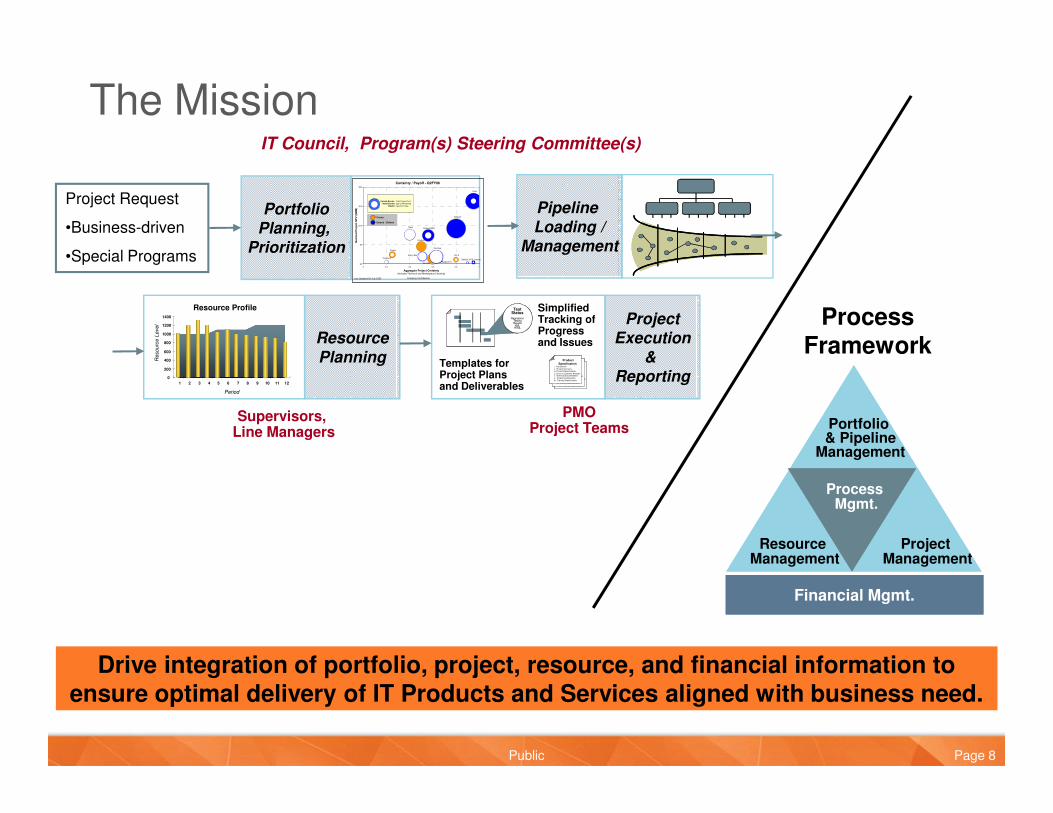
PortfolioPlanning,
Prioritization
Resource Profile
0
200
400
600
800
1000
1200
1400
1 2 3 4 5 6 7 8 9 10 11 12
Period
Resourc
e L
evel
Test Status
RegressionTestingResultsXMLHTML
Templates forProject Plans and Deliverables
SimplifiedTracking of Progress and Issues
Product Specification
i. Introductionii. Product Overviewiii. Product Requirementsiv. Voice of Customer Analysisv. Technical Documentationvi. Product Configurationvi i. Training Requirements
Product Specification
i. Introductionii. Product Overviewiii. Product Requirementsiv. Voice of Customer Analysisv. Technical Documentationvi. Product Configurationvii. Training Requirements
Product Specification
i. Introductionii. Product Overviewiii. Product Requirementsiv. Voice of Customer Analysisv. Technical Documentationvi. Product Configurationvii. Training Requirements
Product Specification
i. Introductionii. Product Overviewiii. Product Requirementsiv. Voice of Customer Analysisv. Technical Documentationvi. Product Configurationvi i. Training Requirements
Product Specification
i. Introductionii. Product Overviewiii. Product Requirementsiv. Voice of Customer Analysisv. Technical Documentationvi. Product Configurationvii. Training Requirements
Product Specification
i. Introductionii. Product Overviewiii. Product Requirementsiv. Voice of Customer Analysisv. Technical Documentationvi. Product Configurationvii. Training Requirements
ProjectExecution
& Reporting
Pipeline Loading /
Management
ResourcePlanning
Certainty / Payoff - Q2FY06
Ballpark
Ballpark HI
Ballpark MDC
Ballpark UCB
Caesar
Frank
Freebird
Freeworld
Hermes
Impera
Omnibus
Knex
PFLSRising Star
$0
$5
$10
$15
$20
0 0.2 0.4 0.6 0.8 1
Aggregate Project Certainty(Includes Technical and Marketplace Certainty)
No
min
al P
roje
ct
NP
V (
$M
M)
Outside Border: Total Project Cost
Inside Border: Spend Remaining
Washer: Spend to Date
Company ConfidentialLast Updated 28 July 2005
Extend / Defend
Create
Project Request
•Business-driven
•Special Programs
IT Council, Program(s) Steering Committee(s)
PMO
Process Framework
The Mission
Page 8Public
Portfolio & Pipeline
Management
Process Mgmt.
Resource Management
ProjectManagement
Supervisors, Line Managers
Financial Mgmt.
PMOProject Teams
Drive integration of portfolio, project, resource, and financial information to ensure optimal delivery of IT Products and Services aligned with business need.

The Foundation - Pillars of the PMO
Governance Standards and
Best Practices
Coaching, Mentoring &Training
Page 9Public
Project Execution Oversight
Dashboards and Scorecards
Gate Reviews
Project Risk Assessments
Stakeholder Management
Change Management
Master Planning
Benefits Realization - Post Project Review
Alignment with PMBOK
Project Delivery Methodology
Project Management Tools
Standards, Best Practices & Templates
Scope Management
Schedule Management
Cost Management
Resource Management
Quality Management
Lessons Learned Cycle
Knowledge Sharing
PM Community / Forum
PMO Steward Support
Training and Certification Program
PM Expectations
PM Effectiveness Measures

Check the weather – PMO assessment
Starting Point
Culture • Risk Adverse
• Change Resistant
PMO Model • Ineffective Project Management Office – Too low in the organization
• PMs dispersed across organizations
Portfolio Management Non Existent
Governance • Internally Focused
Page 10Public
Governance• Inconsistent ability to execute
• Weak stakeholder network
Standards & Best Practices • Overly complex, outdated project delivery methodology
• Lessons Learned process ad hoc
Coaching, Mentoring & Training • Project managers typically assigned based on available capacity
• Project managers usually multi hatted as design or technical lead and SME
Value Lack of confidence from the company & business in the ability of the IT organization to lead, plan and execute a portfolio of strategic projects.

Pack the tools
Page 11Public
11
Copyright 2009 Planview, Inc. All Rights Reserved

The trip began…
Year 1
Culture • Risk Adverse
• Change Resistant
• Afraid to escalate
PMO Model • Executive Sponsorship
• PMO elevated to report to CIO
• PMs dispersed across organizations
Portfolio Management • Established a project scoring system and portfolio management process balancing risk, cost and return
Page 12Public
Portfolio Managementmanagement process balancing risk, cost and return
• Portfolio Planner Role created
Governance • Standard Project Status Reporting
• Project Risk Review Process
• Defined Project Stakeholder Network
Standards & Best Practices • PMO PMP Certified
• Project Initiation & Project Closure Templates
Coaching, Mentoring & Training
• PM Community forum established
• PMO Website launched
• Microsoft Project Schedule training

Year 1 – Accomplishment Examples
Page 13Public

Year 1 - Lessons LearnedLessons Learned Actions
Struggled with New Platforms Introduce prototype phase to understand technology and business process impacts
Under estimated stabilization Add 3 month standard stabilization timeframe for new platforms
Lack of stakeholder engagement
Enforce governance model and rigid gate 0 compliance
Weak Gate 1 • Implement stakeholder signoff at Gate 1 of business requirements
Page 14Public
requirements
• Add Charter to Requirements scope review
Shortage of critical resources • Targeted hires in skill gap areas
• Implement resource constraint reporting
Complex Project Management Methodology and inadequate tools
• Transform the methodology aligned with industry standards
• Mandate PM tools and provided training and best practices
Lack of escalation of resource issues
Make the environment safe to escalate bad news in a timely fashion

The trip continued….
Year 2
Culture Overcompensating
PMO Model Hybrid
- Applications: Balanced Matrix
- Infrastructure: Strong Matrix
Portfolio Management • Established Project Launch (Kick) Process
• Project Charter Process Improvements
Page 15Public
• Estimating Improvements
Governance • Improved Stakeholder Network governance
• PMO Monthly In-flight Projects Review
Standards & Best Practices • Introduced Prototyping Project framework
• Project Methodology Makeover
• Lessons Learned Template improvements
Coaching, Mentoring & Training
• PMO Steward Role
• PM Expectations
• PM Forum Improvements

Year 2 – Accomplishment Examples
Project has been Launched via KICK process and in Accept Status in PV.Project Charter complete and approved.Architecture alignment with Enterprise roadmap confirmed.Stakeholder network identified.
Launch the project based on approved Project CharterGate 0: Initation
Gate Compliance Checks:Objective:Gate
Project Delivery Methodology Makeover
PDX Framework
Page 16Public
Asset Management Tasks completeSponsor agreement that Charter objectives have been satisfied, or revised with approvalLessons Learned CapturedProject Team Celebration taken placeAll Issues and Risks ClosedProject Stabilization Criteria metUpdates to Application portolio are complete
Confirmation from the project, sites, master data, and production support that the system stabilization has been achieved. Confirmation that the sites fully accept the system.
Gate 4A:Stabilization
Formal Business Project Lead Acceptance (of System Test results)Compliance Manager(s) approvals(s) (e.g., SOD, FDA, PCI, Data)Operations Service Delivery Ready for Go LiveGo / No Go Meeting ScheduledStabilization Criteria DefinedUser and Support Resources Training is CompleteBusiness Readiness Confirmed - Training Complete, Organization process changes implemented
Confirmation that cutover plans are in place, and all IT components (App, Data, Infrastructure), are ready for go-live. Confirmation that the sites are ready and committed to a successful implementation
Gate 3: Deployment Readiness and Approval
Compliance Manager(s) approvals(s) (e.g., SOD, FDA, PCI, Data)Application Development Complete or On Plan for Go LiveData Cleanup Complete, Data Loads & Conversions Complete or On PlanInfrastructure Environments On PlanSystem testing is completeFormal Stakeholder Acceptance (of Config Buildout)
Development is Complete, or on plan to support go liveProject is on plan for go-liveSoftware can be migrated into production
Gate 2: Development and Verification
Compliance Manager(s) approvals(s) (e.g., SOD, FDA, PCI, Data)Project resources are confirmed for the projectFormal Acceptance of Planned ScopeProject Cost, Schedule and Scope is complete, reviewed and base linedDesign is complete (Application, Data and Infrastructure)RM Confirmation that requirements are still aligned w/ Project Charter
Plans are complete for the project schedule, budget, resource needs, communication events, and risk responses.The project Scope and Design are complete and Ready to begin Development
Gate 1: Planning and Design
Stakeholder network identified.Regulatory Impact Assessed.
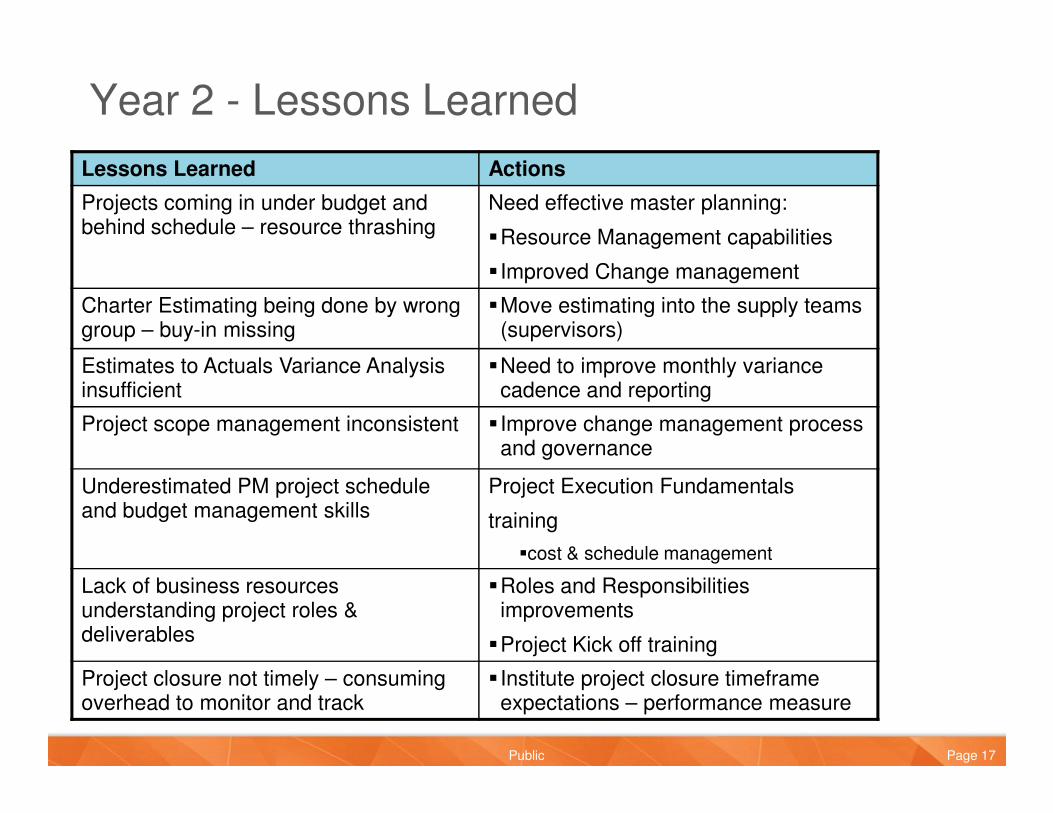
Year 2 - Lessons Learned
Lessons Learned Actions
Projects coming in under budget and behind schedule – resource thrashing
Need effective master planning:
�Resource Management capabilities
� Improved Change management
Charter Estimating being done by wrong group – buy-in missing
�Move estimating into the supply teams (supervisors)
Estimates to Actuals Variance Analysis insufficient
�Need to improve monthly variance cadence and reporting
Page 17Public
Project scope management inconsistent � Improve change management process and governance
Underestimated PM project schedule and budget management skills
Project Execution Fundamentals
training
�cost & schedule management
Lack of business resources understanding project roles & deliverables
�Roles and Responsibilities improvements
�Project Kick off training
Project closure not timely – consuming overhead to monitor and track
� Institute project closure timeframe expectations – performance measure
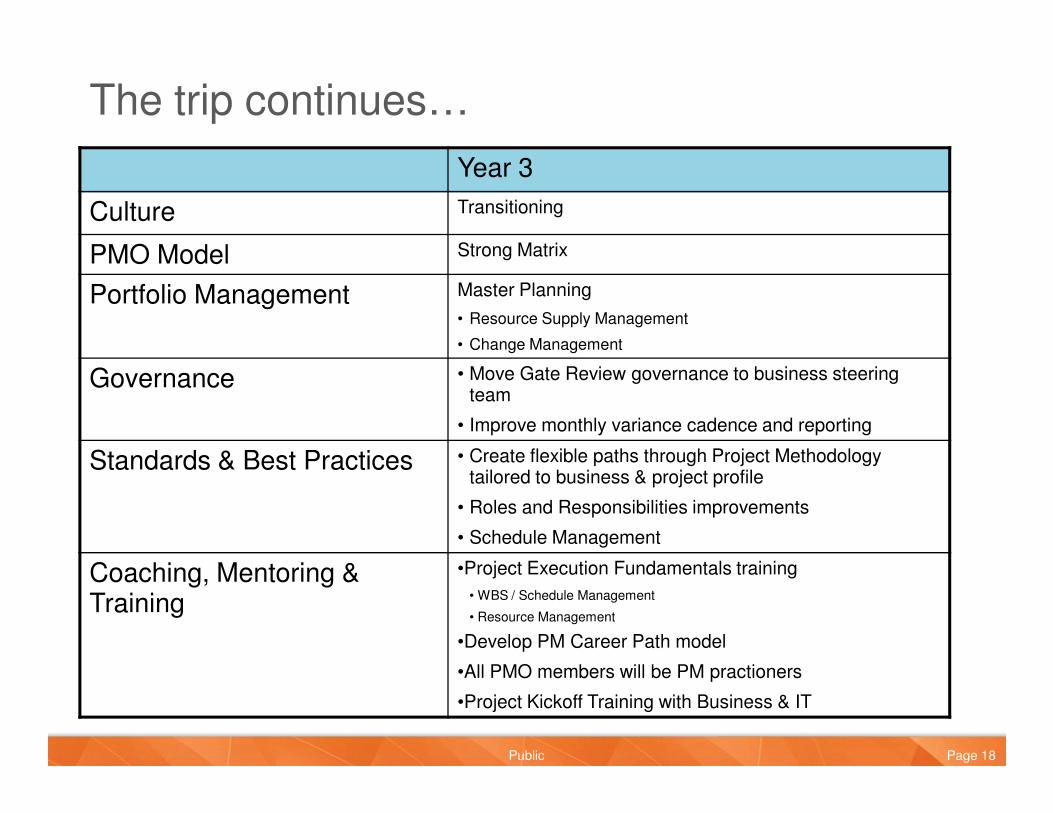
The trip continues…
Year 3
Culture Transitioning
PMO Model Strong Matrix
Portfolio Management Master Planning
• Resource Supply Management
• Change Management
Governance • Move Gate Review governance to business steering team
Page 18Public
• Improve monthly variance cadence and reporting
Standards & Best Practices • Create flexible paths through Project Methodology tailored to business & project profile
• Roles and Responsibilities improvements
• Schedule Management
Coaching, Mentoring & Training
•Project Execution Fundamentals training
• WBS / Schedule Management
• Resource Management
•Develop PM Career Path model
•All PMO members will be PM practioners
•Project Kickoff Training with Business & IT

Year 3 – One of the Focus Areas
�List of projects�Driven business programs and ASR�Sequenced by ROI�Cross-project dependencies captured (IT and Business)
�Internal labor capacity outlook�Depicts time-phased supply of internal skills to work on Investment Projects
10
Business and IT Projects Driven by the EBITDA ProgramTotal Costs: Internal IT Labor & External Costs
Note: No provision or allowance yet provided for Sales / Use Taxes nor FX
Projects
CM
I
De
nta
l
Eq
uip
me
nt
EH
S
Fin
an
ce
HR IT
Le
ga
l
MF
AP
S
Pro
cure
men
t
RD
E, R
&I,
IP,
& T
C&
L
Rerg
Su
pp
ly C
hain
Sa
les &
Se
rvic
e
Tota
l
DMS003-1 : Equipment Mfg Changes 1,482
DMS003-2 : Equipment Mfg Changes 879EHS002 : MSDS Replacement 139
FI001 : Implement BW-SEM/BPS Module 1,808FI002 : Implement SAP for Practicworks - US 736
FI003 : Equip.Rev.Rec, R&D Reporting - Implement SAP PS 998FI005: Migrate Practiceworks International to SAP 705
FI007 : FCW--> SAP Conversion 884
HR003 : HR SAP Poliferation 2,728IT011: Complete Mainframe retirement 1,249
IT013 : Optimize Managed Server Services \ Data Center 1,396IT015 : Optimize Server Hardware Architecture 738
PR004 - Corporate Spend Control – Strategy 243RDE001 : Move R&D infra under IT server services-Shanghai 2,384
RDE002 : Replacement of EQDS/Teamcenter (infrastructure) 61
RDE005: Build out Centralized Global QA test infrastructure 37RDE008 : Synergy and Focal Point 26
RDE009: Softw Conf Mgnt Expansion 26SC003 : Replace ICOM with SAP 1,230
SC004 : Replace SUN with SAP 1,490
SC007A - Logistics NW Changes - US1 397SC007B - Logistics NW Changes - US2 314
SC007C - Logistics NW Changes - nonUS major 347SC007D - Logistics NW Changes - minor 40
SC007D - Logistics NW Changes - minor 40
Subtotal 2,361 139 7,851 2,728 3,383 243 2,534 1,138 20,377
Contingency 30% 30% 15% 15% 15% 30% 30% 30%Total w\ Contingency 3,070 181 9,028 3,137 3,891 316 3,294 1,480 24,396
20
2008 Internal Labor Utilization Forecast
111 111 111 111 111111 111 111 111
Demand Exceeds Supply
-5 -3
110
10
43
269
Apr-08
-4
103
10
46
255
May-08
0
89
10
41
247
Jun-08
0
81
10
38
237
Jul-08
16
60
10
33
231
Aug-08
27
47
10
25
221
Sep-08
33
37
10
24
215
Oct-08
50
-15
1019
215
Nov-08
57
21
10
25
215
Dec-08
Available capacity
CHIP IT Demand
KIR
Management and Admin
IT Investment Projects
16
Demand exceeds Supply
Lab
or
Capacity
(F
TE
)
Based on the current plans some capacity becomes available in H2
Project Demand Resource Supply
Page 19Public
�Project demand expressed in-phased requirements for:
�Internal Skills �Funds availability
�Supply / availability of �Internal Skills �Funds�External Supply assumed not to be a constraint
5
8
10
5
5
5
5
5
10
1
3
1
5
31
1
Apr-08
16
Aug-08
31
12
1 13
1
GDW
Helpdesk/Desktop
HR
Master Data Management
4
7
4
3
4
3
Non SAP ERP
OTC
57
Dec-08
Finance
5
2
22
2
12
7
4
3
42
50
Nov-08
5
2
May-08 Jun-08 Jul-08
1
11
22
1
2
12
1
27
Sep-08
31
21
2
11
7
311
33
Oct-08
1
Project Manager
R&D
Sales and Marketing
Service
Telecom/Network
Architects
Manufacturing
TAS/BASIS
System Admin
5
8
10
5
5
5
5
5
10
1
3
1
5
31
1
Apr-08
16
Aug-08
31
12
1 13
1
GDW
Helpdesk/Desktop
HR
Master Data Management
4
7
4
3
4
3
Non SAP ERP
OTC
57
Dec-08
Finance
5
2
22
2
12
7
4
3
42
50
Nov-08
5
2
May-08 Jun-08 Jul-08
1
11
22
1
2
12
1
27
Sep-08
31
21
2
11
7
311
33
Oct-08
1
Project Manager
R&D
Sales and Marketing
Service
Telecom/Network
Architects
Manufacturing
TAS/BASIS
System Admin
383635 3927 32 3428 29 30 31 33
Q3
37
7/28/08
Quarter
Activity
Project 1
Project 6
Project 5
Project 4
Project 3
Project 2
Project Roadmap
MASTER PLANNING -Overall Supply /
Demand Balancing Approach

The trip summary so farYear 1 Year 2 Year 3
Culture • Risk Adverse
• Change Resistant
• Afraid to escalate
Overcompensating Transitioning
PMO Model • Executive Sponsorship
• PMO elevated to report to CIO
• PMs dispersed across organizations
Hybrid
- Applications: Balanced Matrix
- Infrastructure: Strong Matrix
Strong Matrix
Portfolio Management
• Established a project scoring system and portfolio management process balancing risk, cost and return
• Portfolio Planner Role created
• Established Project Launch (Kick) Process
• Project Charter Process Improvements
• Estimating Improvements
Master Planning
•Resource Supply Management
•Change Management
Page 20Public
Governance • Standard Project Status Reporting
• Project Risk Review Process
• Defined Project Stakeholder Network
• Improved Stakeholder Network governance
• PMO Monthly In-flight Projects Review
• Move Gate Review governance to business steering team
• Improve monthly variance cadence and reporting
Standards & Best Practices
• PMO PMP Certified
• Project Initiation & Project Closure Templates
• Introduced Prototyping Project framework
• Project Methodology Makeover
• Lessons Learned Template improvements
• Create flexible paths through Project Methodology tailored to business & project profile
• Roles and Responsibilities improvements
• Schedule Management
Coaching, Mentoring & Training
• PM Community forum established
• PMO Website launched
• Microsoft Project Schedule training
• PMO Steward Role
• PM Expectations
• PM Forum Improvements
• Project Execution Fundamentals training
• WBS / Schedule Management
• Resource Management
• Develop PM Career Path model
• All PMO members will be PM practioners
• Project Kickoff Training with Business & IT

Where the journey is going
Strategic “Destination”
Culture • Process Driven, results oriented with a focus on execution• Respected and sought after
PMO Model • PMO Model – Strong Matrix
• Federated PMOs across the business
Portfolio Management Portfolio Management processes and tools that are leveraged by the business to achieve maximum return on investments
Governance Business ownership of projects
Page 21Public
Governance
Standards & Best Practices
• Standards and Best Practices adopted by the company
• Lean with Quality
• Strong lessons learned process
Coaching, Mentoring & Training
• Ability to offer Project Managers and / or Project Manager coaching and training to the company
• PMP Certified PMs
Value Consist, repeatable project delivery – on time, on budget, on scope with quality – that satisfies expected business benefits that match executive expectations

The PMO Value Proposition
Value Momentum
Page 22Public
Copyright 2008 Forrester, Inc. All Rights Reserved

The PMO Value Journey….
….prove the Value one mile
Page 23Public
….prove the Value one mile at a time!