Embed Size (px)
Citation preview

Headline PMI 2
Output 5
New orders &
new export orders 7
Backlogs of orders 10
Stocks of finished
goods & major inputs 11
Purchases of inputs 11
Input prices 14
Imports 17
Employment 19
Suppliers’ delivery time 21
Business expectation 22
Helen Chin
Tel: (852) 2300 2471
The Fung Business Intelligence
Centre
10/F, Li Fung Tower,
888 Cheung Sha Wan Road,
Hong Kong
Tel : (852) 2300 2470
Fax : (852) 2635 1598
E-mail : [email protected]
http://www.funggroup.com
IN THIS ISSUE :
PMI Quarterly on China Manufacturing April 2014 Issue 16
FU
NG
BU
SIN
ES
S IN
TE
LL
IGE
NC
E C
EN
TR
E
ww
w.lifu
ng
gro
up
.co
m
PMI points to growth stabilization
Output growth moderated.
New orders index and new export orders index indicate stable
domestic demand and recovering external demand.
Backlogs of orders stayed in the contractionary zone.
Destocking activities continued.
Purchases of inputs decelerated.
Upstream cost pressure eased.
Imports remained weak.
Employment index has fluctuated within a narrow range.
Suppliers’ delivery slowed down.
Chinese manufacturers have become more optimistic.
PMI Quarterly on China Manufacturing
2
April 2014 Issue 16
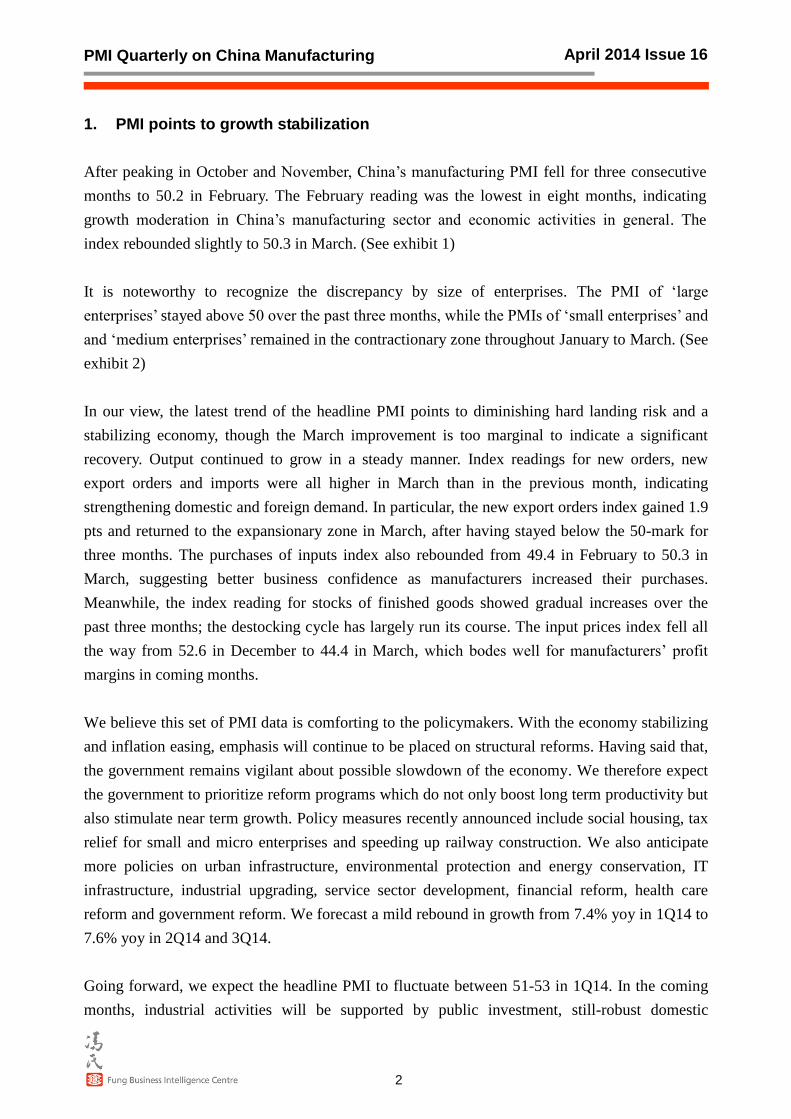
1. PMI points to growth stabilization
After peaking in October and November, China’s manufacturing PMI fell for three consecutive
months to 50.2 in February. The February reading was the lowest in eight months, indicating
growth moderation in China’s manufacturing sector and economic activities in general. The
index rebounded slightly to 50.3 in March. (See exhibit 1)
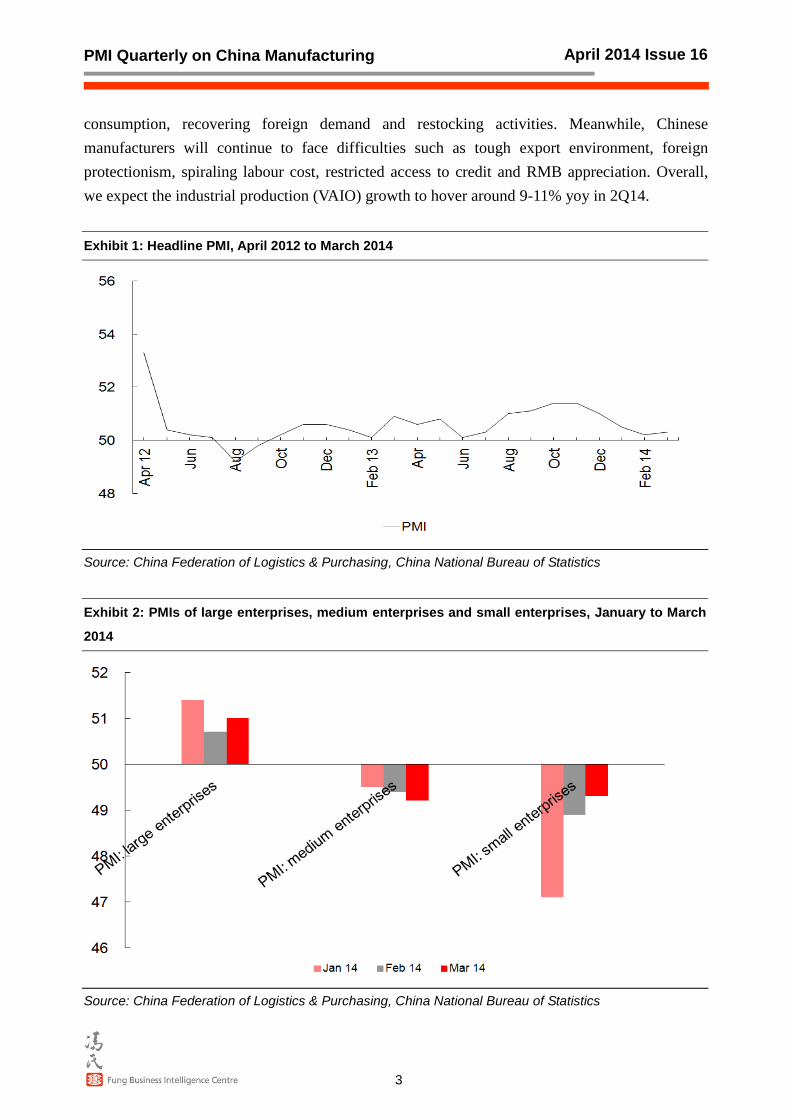
It is noteworthy to recognize the discrepancy by size of enterprises. The PMI of ‘large
enterprises’ stayed above 50 over the past three months, while the PMIs of ‘small enterprises’ and
and ‘medium enterprises’ remained in the contractionary zone throughout January to March. (See
exhibit 2)
In our view, the latest trend of the headline PMI points to diminishing hard landing risk and a
stabilizing economy, though the March improvement is too marginal to indicate a significant
recovery. Output continued to grow in a steady manner. Index readings for new orders, new
export orders and imports were all higher in March than in the previous month, indicating
strengthening domestic and foreign demand. In particular, the new export orders index gained 1.9
pts and returned to the expansionary zone in March, after having stayed below the 50-mark for
three months. The purchases of inputs index also rebounded from 49.4 in February to 50.3 in
March, suggesting better business confidence as manufacturers increased their purchases.
Meanwhile, the index reading for stocks of finished goods showed gradual increases over the
past three months; the destocking cycle has largely run its course. The input prices index fell all
the way from 52.6 in December to 44.4 in March, which bodes well for manufacturers’ profit
margins in coming months.
We believe this set of PMI data is comforting to the policymakers. With the economy stabilizing
and inflation easing, emphasis will continue to be placed on structural reforms. Having said that,
the government remains vigilant about possible slowdown of the economy. We therefore expect
the government to prioritize reform programs which do not only boost long term productivity but
also stimulate near term growth. Policy measures recently announced include social housing, tax
relief for small and micro enterprises and speeding up railway construction. We also anticipate
more policies on urban infrastructure, environmental protection and energy conservation, IT
infrastructure, industrial upgrading, service sector development, financial reform, health care
reform and government reform. We forecast a mild rebound in growth from 7.4% yoy in 1Q14 to
7.6% yoy in 2Q14 and 3Q14.
Going forward, we expect the headline PMI to fluctuate between 51-53 in 1Q14. In the coming
months, industrial activities will be supported by public investment, still-robust domestic
PMI Quarterly on China Manufacturing
3
April 2014 Issue 16
consumption, recovering foreign demand and restocking activities. Meanwhile, Chinese
manufacturers will continue to face difficulties such as tough export environment, foreign
protectionism, spiraling labour cost, restricted access to credit and RMB appreciation. Overall,
we expect the industrial production (VAIO) growth to hover around 9-11% yoy in 2Q14.
Exhibit 1: Headline PMI, April 2012 to March 2014
Source: China Federation of Logistics & Purchasing, China National Bureau of Statistics
Exhibit 2: PMIs of large enterprises, medium enterprises and small enterprises, January to March
2014
Source: China Federation of Logistics & Purchasing, China National Bureau of Statistics
PMI Quarterly on China Manufacturing
4
April 2014 Issue 16
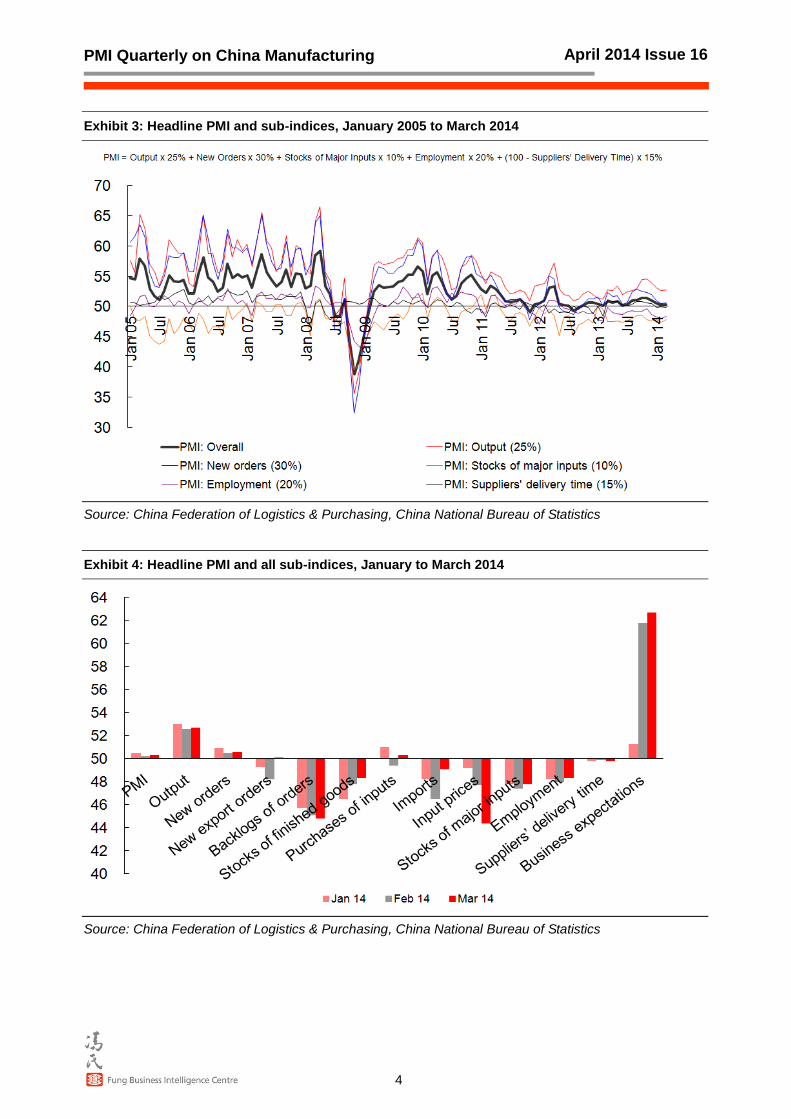
Exhibit 3: Headline PMI and sub-indices, January 2005 to March 2014
Source: China Federation of Logistics & Purchasing, China National Bureau of Statistics
Exhibit 4: Headline PMI and all sub-indices, January to March 2014
Source: China Federation of Logistics & Purchasing, China National Bureau of Statistics
PMI Quarterly on China Manufacturing
5
April 2014 Issue 16
Exhibit 3 shows that the headline PMI moderation over the past three months was mainly
attributed to the marked fall in the new orders index (which weighs 30% in the computation of
the headline PMI) and the output index (weighs 25%). Among the 11 sub-indices (i.e. excluding
the suppliers’ delivery time index), only 3 (output, new orders and business expectations) stayed
in the expansionary zone over the past three months. The indices of backlogs of orders, stocks of
finished goods, stocks of major inputs, imports, input prices and employment remained below 50
throughout the past three months. (See exhibit 4)
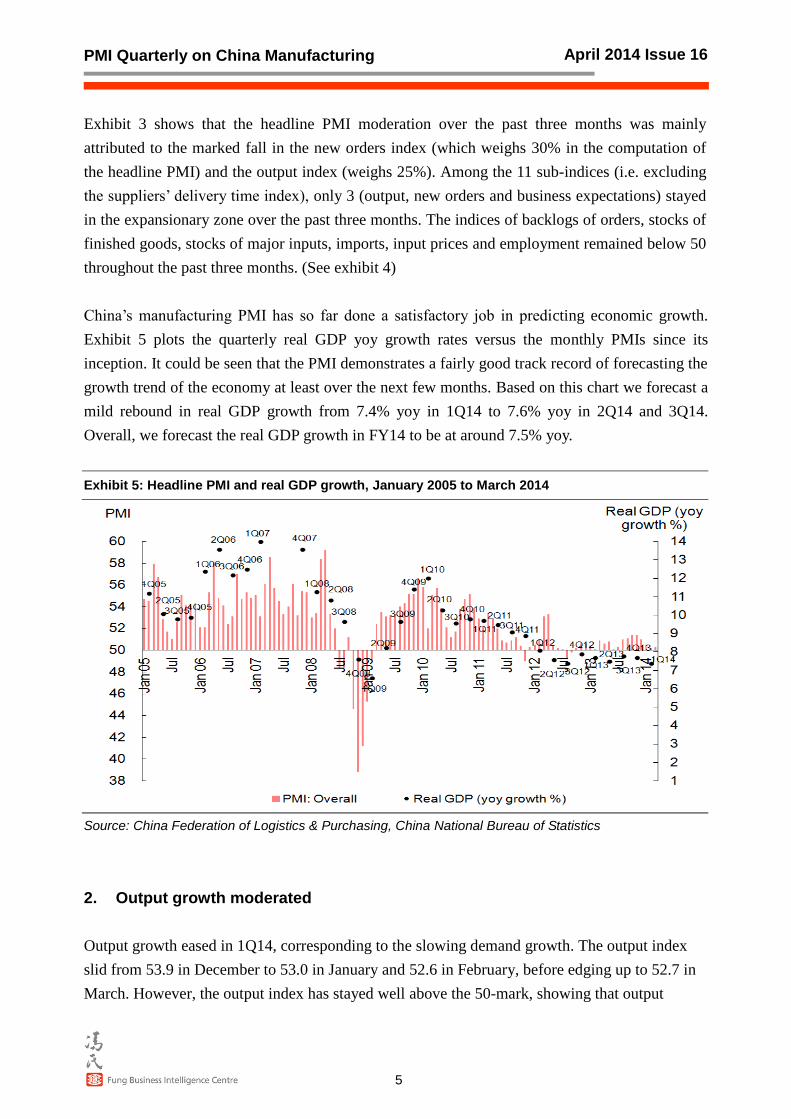
China’s manufacturing PMI has so far done a satisfactory job in predicting economic growth.
Exhibit 5 plots the quarterly real GDP yoy growth rates versus the monthly PMIs since its
inception. It could be seen that the PMI demonstrates a fairly good track record of forecasting the
growth trend of the economy at least over the next few months. Based on this chart we forecast a
mild rebound in real GDP growth from 7.4% yoy in 1Q14 to 7.6% yoy in 2Q14 and 3Q14.
Overall, we forecast the real GDP growth in FY14 to be at around 7.5% yoy.
Exhibit 5: Headline PMI and real GDP growth, January 2005 to March 2014
Source: China Federation of Logistics & Purchasing, China National Bureau of Statistics
2. Output growth moderated
Output growth eased in 1Q14, corresponding to the slowing demand growth. The output index
slid from 53.9 in December to 53.0 in January and 52.6 in February, before edging up to 52.7 in
March. However, the output index has stayed well above the 50-mark, showing that output

PMI Quarterly on China Manufacturing
6
April 2014 Issue 16
growth was still robust. (See exhibit 6)
Exhibit 7 shows that the deceleration in production growth in the past three months was mainly
attributable to the moderating growth of new orders instead of destocking activities. It is
noteworthy that the stocks of finished goods index has been rising for three consecutive months,
gradually approaching the neutral 50-line. The pace of inventory liquidation has slowed. Output
may grow strongly later when manufacturers have finally run out of their inventories or regained
confidence to restock.
Exhibit 6: Output index, April 2012 to March 2014
Source: China Federation of Logistics & Purchasing, China National Bureau of Statistics
Exhibit 7: Output, new orders and stocks of finished goods, January 2005 to March 2014
Source: China Federation of Logistics & Purchasing, China National Bureau of Statistics

PMI Quarterly on China Manufacturing
7
April 2014 Issue 16
Exhibit 8 demonstrates the correlation (with some lags) between the output index and the yoy
growth of value-added of industrial output (VAIO). The VAIO growth has largely trended
downward since October last year. Looking ahead, we expect the VAIO growth to hover around
9-11% yoy in 2Q14. In the coming months, industrial activities will be supported by public
investment, still-robust domestic consumption, recovering foreign demand and restocking
activities. Meanwhile, Chinese manufacturers will continue to face difficulties such as tough
export environment, foreign protectionism, spiraling labour cost, restricted access to credit and
RMB appreciation.
Exhibit 8: Output index and industrial production growth, January 2005 to March 2014
Source: China Federation of Logistics & Purchasing, China National Bureau of Statistics
3. New orders index and new export orders index indicate stable domestic
demand and recovering external demand
The new orders index fell to an eight-month low of 50.5 in February, before improving
marginally to 50.6 in March. In any case, the index has stayed in the expansionary zone for
eighteen months, showing that domestic demand has been stable. The new export orders index
had stayed below the 50-mark throughout December to February, before it gained 1.9 pts to
reach 50.1 in March. External demand has stabilized and started to recover.1 (See exhibit 9)
Exhibit 10 shows that the new orders index generally leads industrial production by about 2 to 3
months. The new orders index suggests stable growth of industrial production in coming months.
Again, the projection based on the new orders index is that the VAIO growth is likely to hover
1 We have received a number of enquiries on this point. The ‘new orders index’ covers both domestic orders and export orders. That is to say, the
manufacturers are not asked to differentiate between domestic orders and export orders when filing in the questionnaires.

PMI Quarterly on China Manufacturing
8
April 2014 Issue 16
around 9-11% yoy in 2Q14.
Exhibit 9: New orders index and new export orders index, January 2005 to March 2014
Source: China Federation of Logistics & Purchasing, China National Bureau of Statistics
Exhibit 10: New orders index and industrial production growth, January 2005 to March 2014
Source: China Federation of Logistics & Purchasing, China National Bureau of Statistics
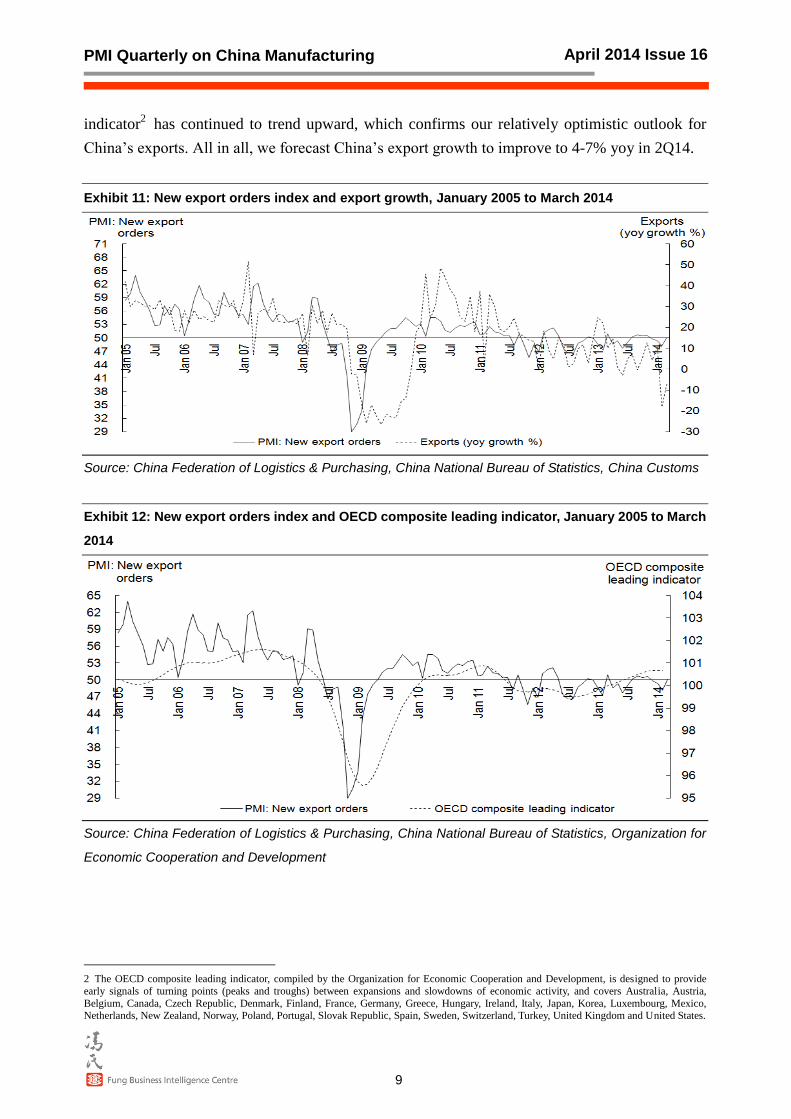
Exhibit 11 plots the new export orders index against the yoy growth rates of China’s exports. The
correlation between the two is fairly high, with the new export orders index leading the export
yoy growth rate by about 3 months (except in early last year, when the export figures were
greatly inflated by fake exports). With the new export orders index rising above the critical
50-mark again, we have become more optimistic over China’s export outlook. Besides, from
exhibit 12 we can see that the new export orders index has been strongly correlated to the
external economies, especially the developed economies. The OECD composite leading
PMI Quarterly on China Manufacturing
9
April 2014 Issue 16
indicator2 has continued to trend upward, which confirms our relatively optimistic outlook for
China’s exports. All in all, we forecast China’s export growth to improve to 4-7% yoy in 2Q14.
Exhibit 11: New export orders index and export growth, January 2005 to March 2014
Source: China Federation of Logistics & Purchasing, China National Bureau of Statistics, China Customs
Exhibit 12: New export orders index and OECD composite leading indicator, January 2005 to March
2014
Source: China Federation of Logistics & Purchasing, China National Bureau of Statistics, Organization for
Economic Cooperation and Development
2 The OECD composite leading indicator, compiled by the Organization for Economic Cooperation and Development, is designed to provide
early signals of turning points (peaks and troughs) between expansions and slowdowns of economic activity, and covers Australia, Austria,
Belgium, Canada, Czech Republic, Denmark, Finland, France, Germany, Greece, Hungary, Ireland, Italy, Japan, Korea, Luxembourg, Mexico, Netherlands, New Zealand, Norway, Poland, Portugal, Slovak Republic, Spain, Sweden, Switzerland, Turkey, United Kingdom and United States.
PMI Quarterly on China Manufacturing
10
April 2014 Issue 16
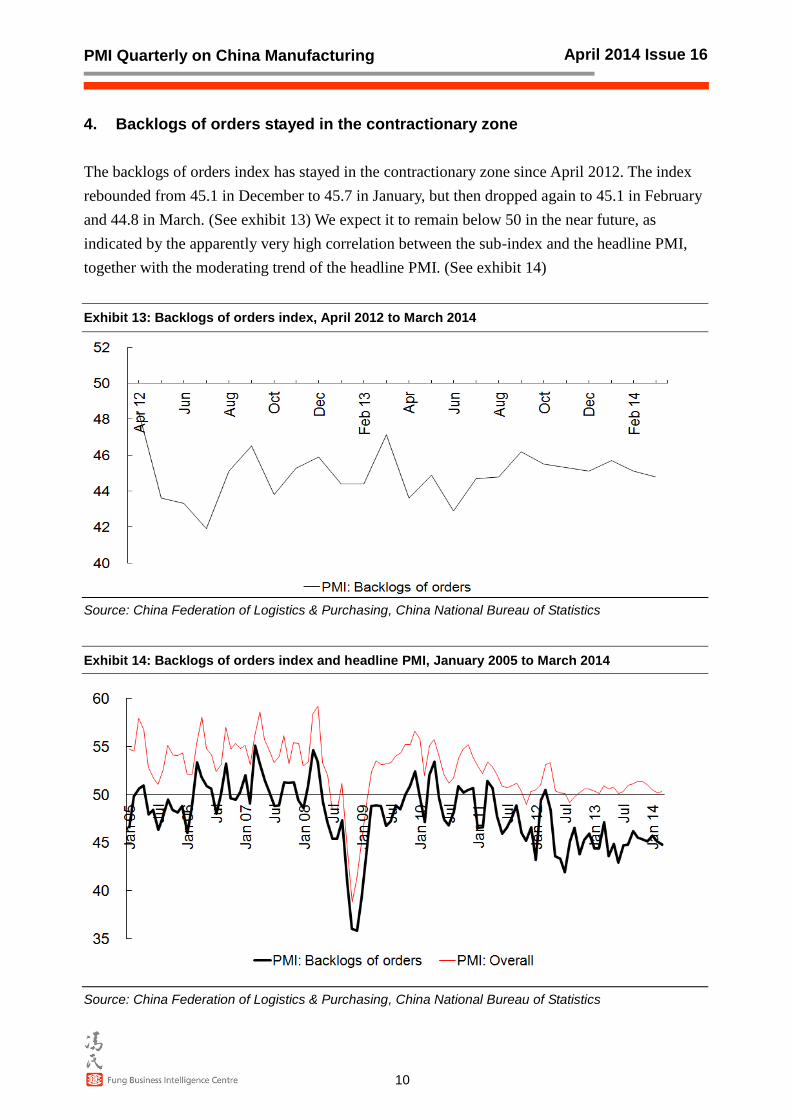
4. Backlogs of orders stayed in the contractionary zone
The backlogs of orders index has stayed in the contractionary zone since April 2012. The index
rebounded from 45.1 in December to 45.7 in January, but then dropped again to 45.1 in February
and 44.8 in March. (See exhibit 13) We expect it to remain below 50 in the near future, as
indicated by the apparently very high correlation between the sub-index and the headline PMI,
together with the moderating trend of the headline PMI. (See exhibit 14)
Exhibit 13: Backlogs of orders index, April 2012 to March 2014
Source: China Federation of Logistics & Purchasing, China National Bureau of Statistics
Exhibit 14: Backlogs of orders index and headline PMI, January 2005 to March 2014
Source: China Federation of Logistics & Purchasing, China National Bureau of Statistics
PMI Quarterly on China Manufacturing
11
April 2014 Issue 16
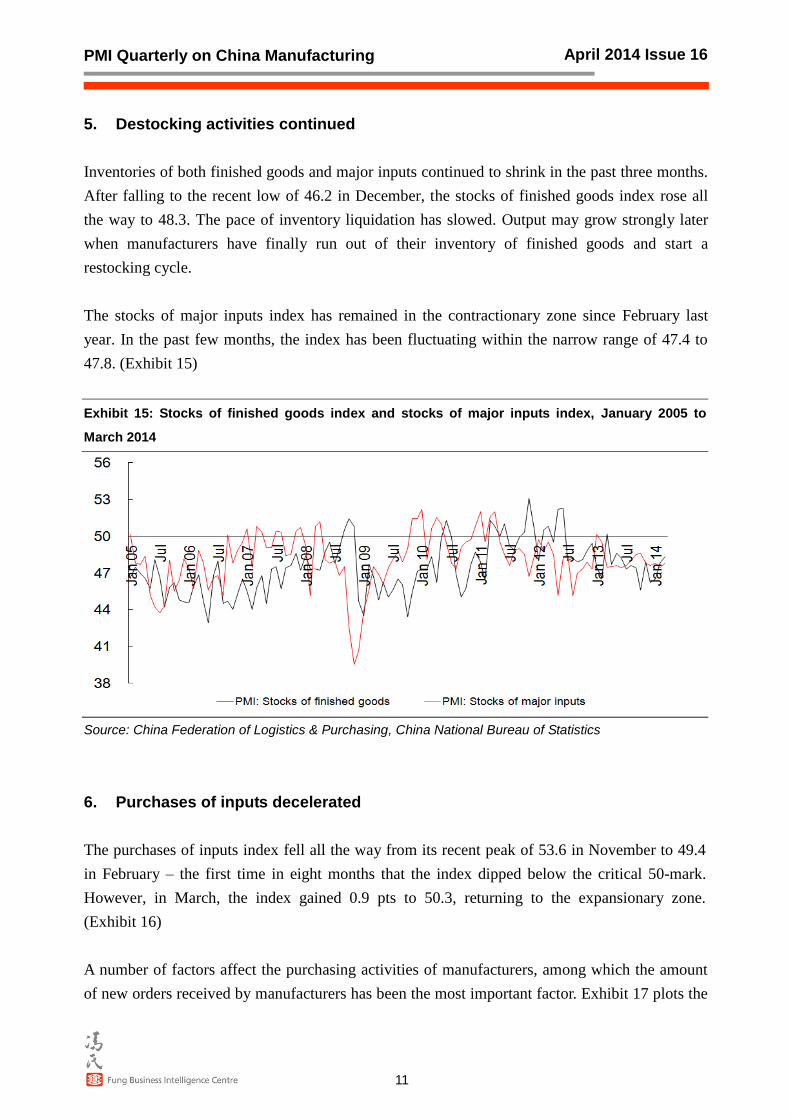
5. Destocking activities continued
Inventories of both finished goods and major inputs continued to shrink in the past three months.
After falling to the recent low of 46.2 in December, the stocks of finished goods index rose all
the way to 48.3. The pace of inventory liquidation has slowed. Output may grow strongly later
when manufacturers have finally run out of their inventory of finished goods and start a
restocking cycle.
The stocks of major inputs index has remained in the contractionary zone since February last
year. In the past few months, the index has been fluctuating within the narrow range of 47.4 to
47.8. (Exhibit 15)
Exhibit 15: Stocks of finished goods index and stocks of major inputs index, January 2005 to
March 2014
Source: China Federation of Logistics & Purchasing, China National Bureau of Statistics
6. Purchases of inputs decelerated
The purchases of inputs index fell all the way from its recent peak of 53.6 in November to 49.4
in February – the first time in eight months that the index dipped below the critical 50-mark.
However, in March, the index gained 0.9 pts to 50.3, returning to the expansionary zone.
(Exhibit 16)
A number of factors affect the purchasing activities of manufacturers, among which the amount
of new orders received by manufacturers has been the most important factor. Exhibit 17 plots the

PMI Quarterly on China Manufacturing
12
April 2014 Issue 16
purchases of inputs index against the new orders index. The correlation between the two
sub-indices is very strong. This is intuitively easy to explain – as manufacturers usually need to
purchase extra inputs to cope with new orders. We expect to see continuous increase in purchases
if the rise in new orders persists. The purchasing activities also reflect business confidence.
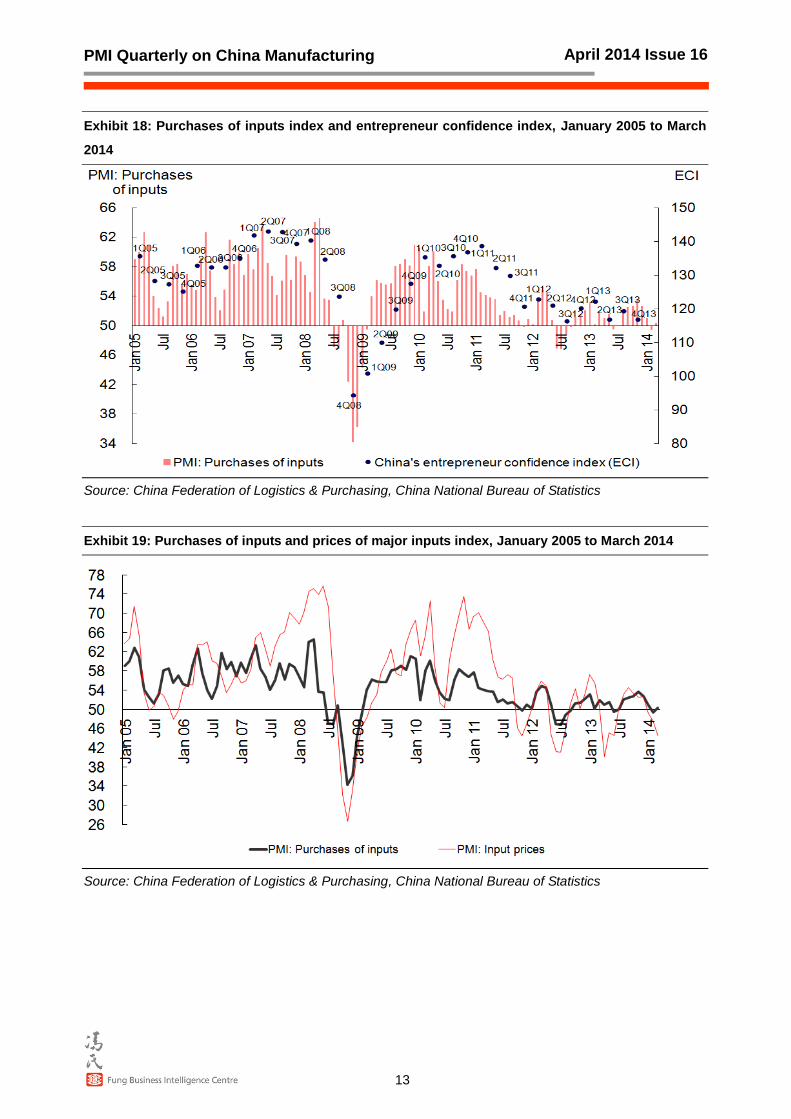
Exhibit 18 shows the association between the purchases of inputs index and the entrepreneur
confidence index (ECI). Credit conditions could be another factor. Finally, exhibit 19 shows that
input prices, as well as the expected trend of input prices, are also important considerations when
making purchasing decisions.
Exhibit 16: Purchases of inputs index, April 2012 to March 2014
Source: China Federation of Logistics & Purchasing, China National Bureau of Statistics
Exhibit 17: Purchases of inputs and new orders, January 2005 to March 2014
Source: China Federation of Logistics & Purchasing, China National Bureau of Statistics
PMI Quarterly on China Manufacturing
13
April 2014 Issue 16
Exhibit 18: Purchases of inputs index and entrepreneur confidence index, January 2005 to March
2014
Source: China Federation of Logistics & Purchasing, China National Bureau of Statistics
Exhibit 19: Purchases of inputs and prices of major inputs index, January 2005 to March 2014
Source: China Federation of Logistics & Purchasing, China National Bureau of Statistics
PMI Quarterly on China Manufacturing
14
April 2014 Issue 16
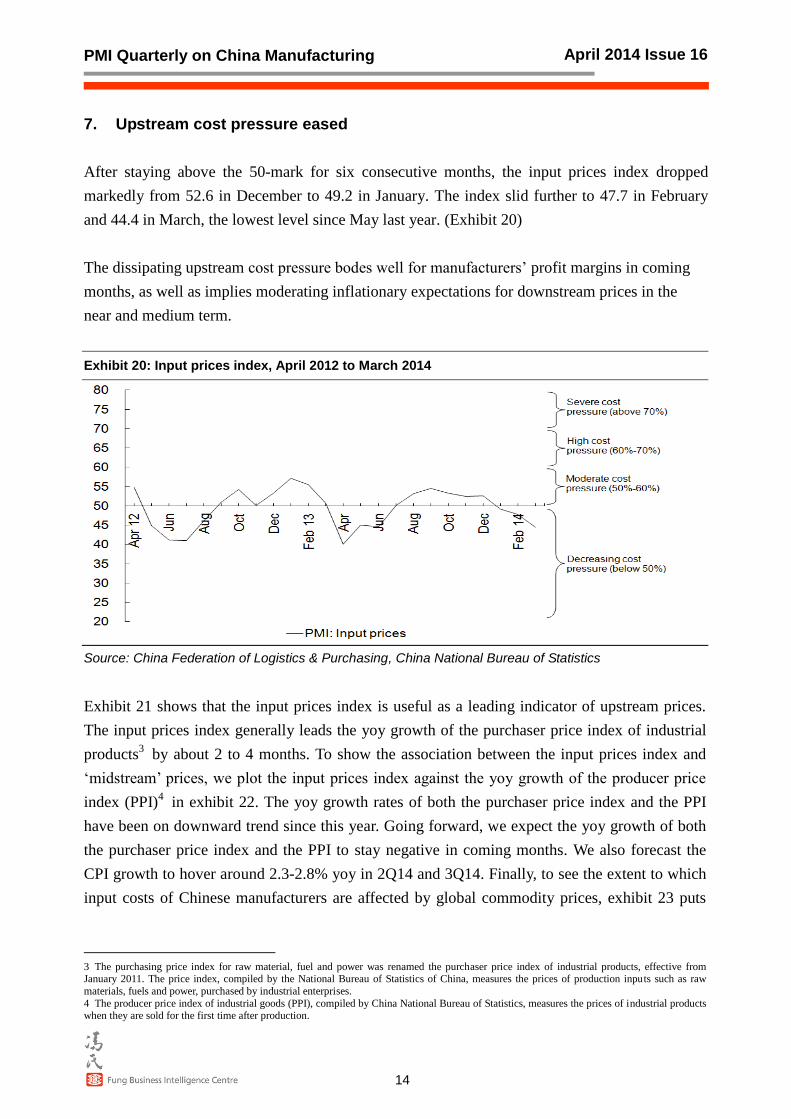
7. Upstream cost pressure eased
After staying above the 50-mark for six consecutive months, the input prices index dropped
markedly from 52.6 in December to 49.2 in January. The index slid further to 47.7 in February
and 44.4 in March, the lowest level since May last year. (Exhibit 20)
The dissipating upstream cost pressure bodes well for manufacturers’ profit margins in coming
months, as well as implies moderating inflationary expectations for downstream prices in the
near and medium term.
Exhibit 20: Input prices index, April 2012 to March 2014
Source: China Federation of Logistics & Purchasing, China National Bureau of Statistics
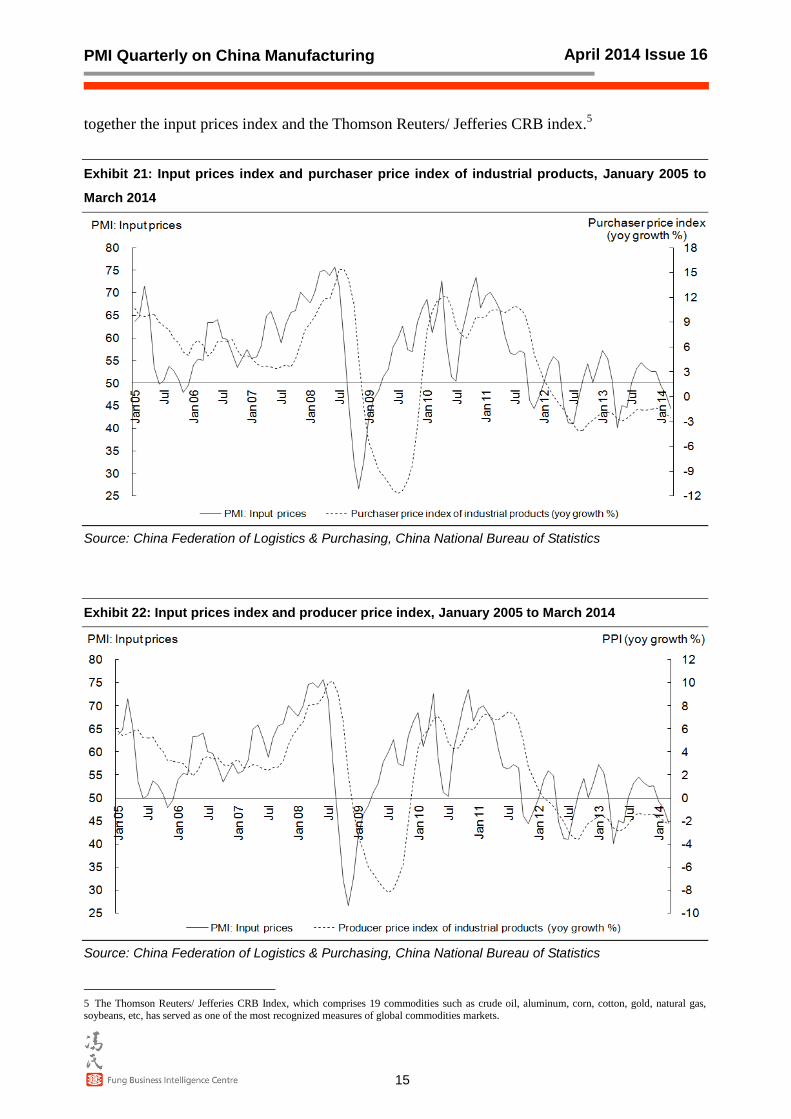
Exhibit 21 shows that the input prices index is useful as a leading indicator of upstream prices.
The input prices index generally leads the yoy growth of the purchaser price index of industrial
products3 by about 2 to 4 months. To show the association between the input prices index and
‘midstream’ prices, we plot the input prices index against the yoy growth of the producer price
index (PPI)4 in exhibit 22. The yoy growth rates of both the purchaser price index and the PPI
have been on downward trend since this year. Going forward, we expect the yoy growth of both
the purchaser price index and the PPI to stay negative in coming months. We also forecast the
CPI growth to hover around 2.3-2.8% yoy in 2Q14 and 3Q14. Finally, to see the extent to which
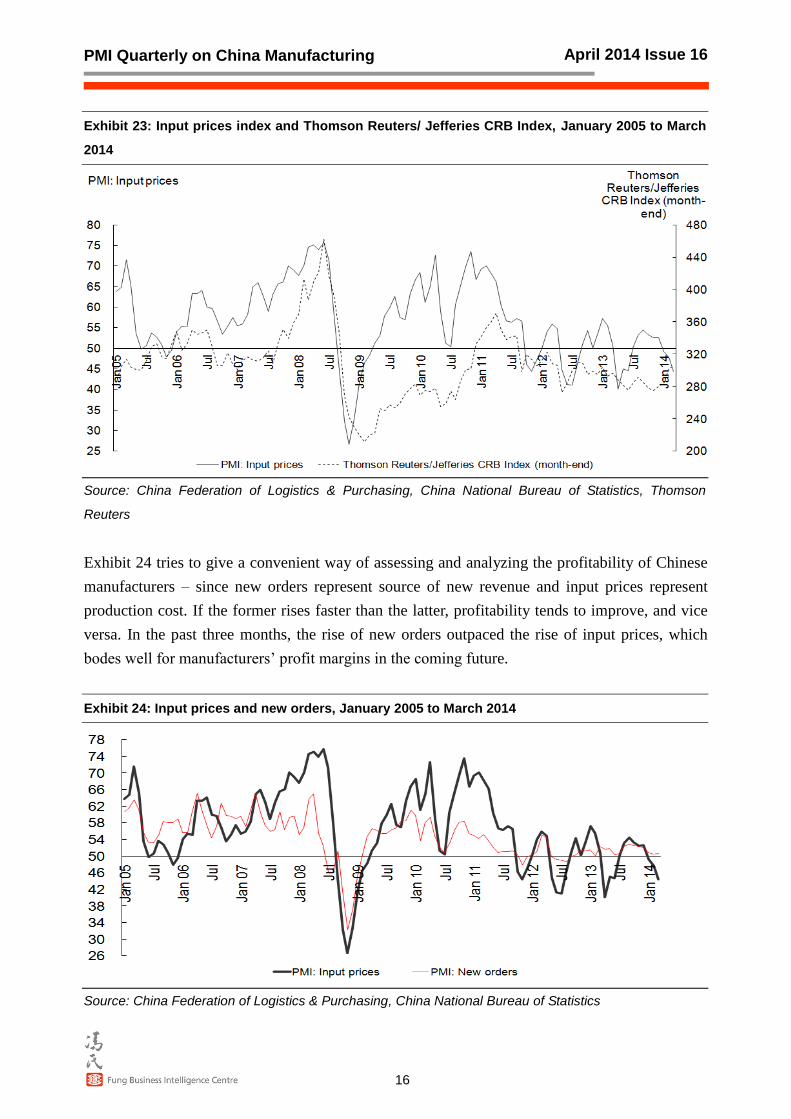
input costs of Chinese manufacturers are affected by global commodity prices, exhibit 23 puts
3 The purchasing price index for raw material, fuel and power was renamed the purchaser price index of industrial products, effective from January 2011. The price index, compiled by the National Bureau of Statistics of China, measures the prices of production inputs such as raw
materials, fuels and power, purchased by industrial enterprises.
4 The producer price index of industrial goods (PPI), compiled by China National Bureau of Statistics, measures the prices of industrial products when they are sold for the first time after production.
PMI Quarterly on China Manufacturing
15
April 2014 Issue 16
together the input prices index and the Thomson Reuters/ Jefferies CRB index.5
Exhibit 21: Input prices index and purchaser price index of industrial products, January 2005 to
March 2014
Source: China Federation of Logistics & Purchasing, China National Bureau of Statistics
Exhibit 22: Input prices index and producer price index, January 2005 to March 2014
Source: China Federation of Logistics & Purchasing, China National Bureau of Statistics
5 The Thomson Reuters/ Jefferies CRB Index, which comprises 19 commodities such as crude oil, aluminum, corn, cotton, gold, natural gas, soybeans, etc, has served as one of the most recognized measures of global commodities markets.
PMI Quarterly on China Manufacturing
16
April 2014 Issue 16
Exhibit 23: Input prices index and Thomson Reuters/ Jefferies CRB Index, January 2005 to March
2014
Source: China Federation of Logistics & Purchasing, China National Bureau of Statistics, Thomson
Reuters
Exhibit 24 tries to give a convenient way of assessing and analyzing the profitability of Chinese
manufacturers – since new orders represent source of new revenue and input prices represent
production cost. If the former rises faster than the latter, profitability tends to improve, and vice
versa. In the past three months, the rise of new orders outpaced the rise of input prices, which
bodes well for manufacturers’ profit margins in the coming future.
Exhibit 24: Input prices and new orders, January 2005 to March 2014
Source: China Federation of Logistics & Purchasing, China National Bureau of Statistics
PMI Quarterly on China Manufacturing
17
April 2014 Issue 16
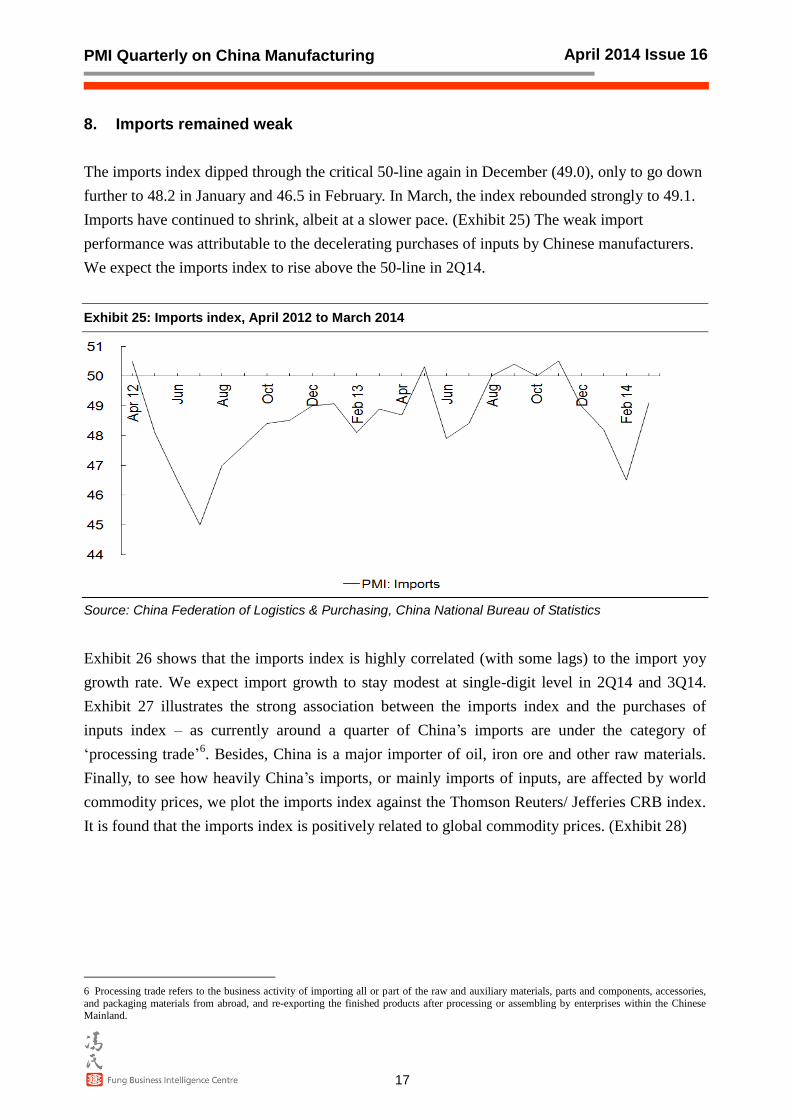
8. Imports remained weak
The imports index dipped through the critical 50-line again in December (49.0), only to go down
further to 48.2 in January and 46.5 in February. In March, the index rebounded strongly to 49.1.
Imports have continued to shrink, albeit at a slower pace. (Exhibit 25) The weak import
performance was attributable to the decelerating purchases of inputs by Chinese manufacturers.
We expect the imports index to rise above the 50-line in 2Q14.
Exhibit 25: Imports index, April 2012 to March 2014
Source: China Federation of Logistics & Purchasing, China National Bureau of Statistics
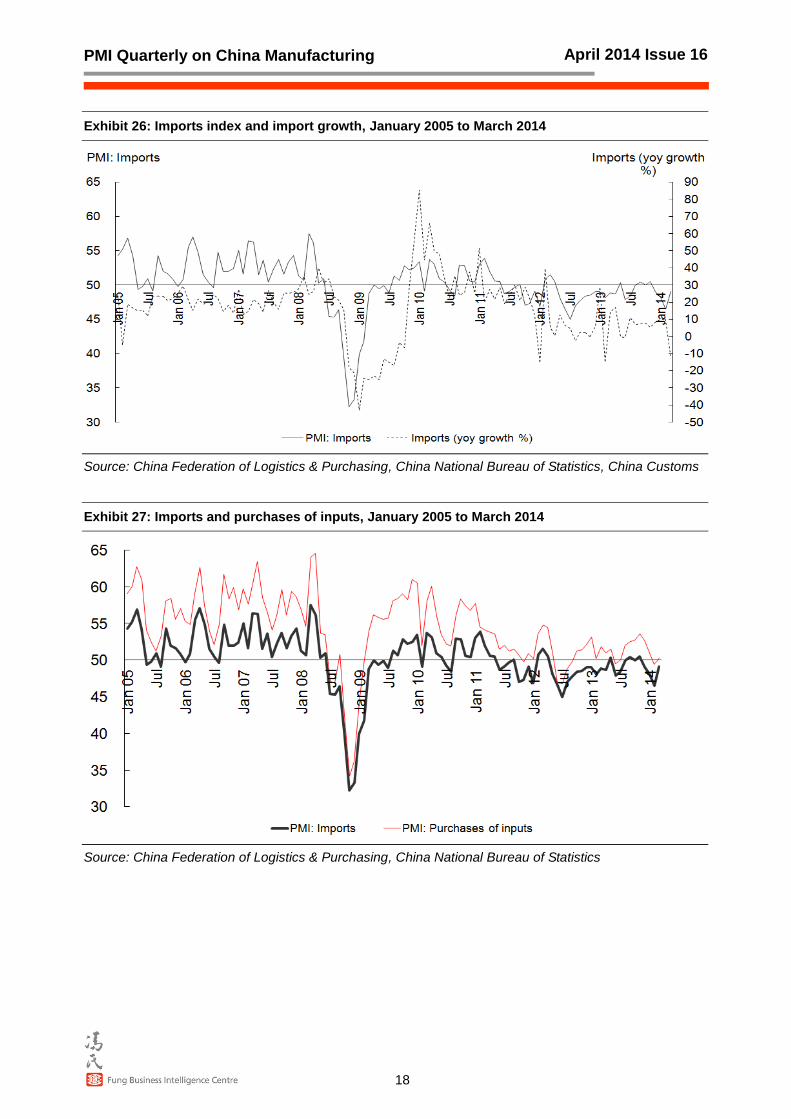
Exhibit 26 shows that the imports index is highly correlated (with some lags) to the import yoy
growth rate. We expect import growth to stay modest at single-digit level in 2Q14 and 3Q14.
Exhibit 27 illustrates the strong association between the imports index and the purchases of
inputs index – as currently around a quarter of China’s imports are under the category of
‘processing trade’6. Besides, China is a major importer of oil, iron ore and other raw materials.
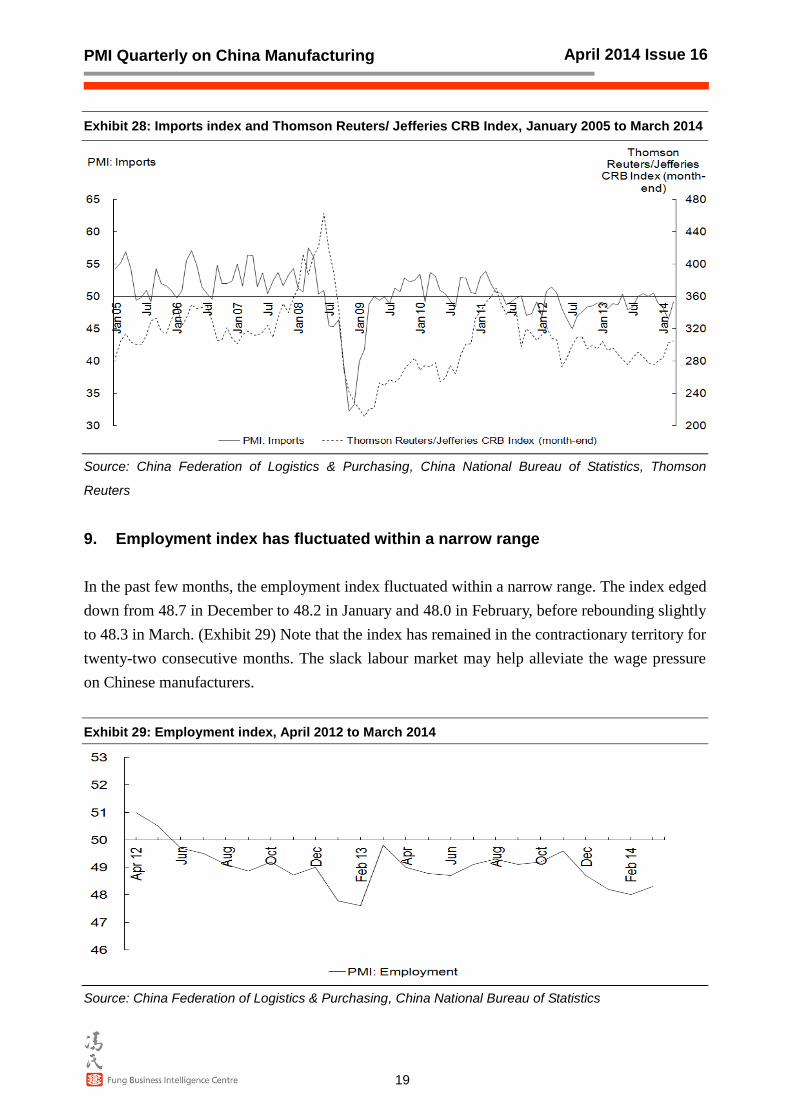
Finally, to see how heavily China’s imports, or mainly imports of inputs, are affected by world
commodity prices, we plot the imports index against the Thomson Reuters/ Jefferies CRB index.
It is found that the imports index is positively related to global commodity prices. (Exhibit 28)
6 Processing trade refers to the business activity of importing all or part of the raw and auxiliary materials, parts and components, accessories,
and packaging materials from abroad, and re-exporting the finished products after processing or assembling by enterprises within the Chinese Mainland.
PMI Quarterly on China Manufacturing
18
April 2014 Issue 16
Exhibit 26: Imports index and import growth, January 2005 to March 2014
Source: China Federation of Logistics & Purchasing, China National Bureau of Statistics, China Customs
Exhibit 27: Imports and purchases of inputs, January 2005 to March 2014
Source: China Federation of Logistics & Purchasing, China National Bureau of Statistics
PMI Quarterly on China Manufacturing
19
April 2014 Issue 16
Exhibit 28: Imports index and Thomson Reuters/ Jefferies CRB Index, January 2005 to March 2014
Source: China Federation of Logistics & Purchasing, China National Bureau of Statistics, Thomson
Reuters
9. Employment index has fluctuated within a narrow range
In the past few months, the employment index fluctuated within a narrow range. The index edged
down from 48.7 in December to 48.2 in January and 48.0 in February, before rebounding slightly
to 48.3 in March. (Exhibit 29) Note that the index has remained in the contractionary territory for
twenty-two consecutive months. The slack labour market may help alleviate the wage pressure
on Chinese manufacturers.
Exhibit 29: Employment index, April 2012 to March 2014
Source: China Federation of Logistics & Purchasing, China National Bureau of Statistics
PMI Quarterly on China Manufacturing
20
April 2014 Issue 16
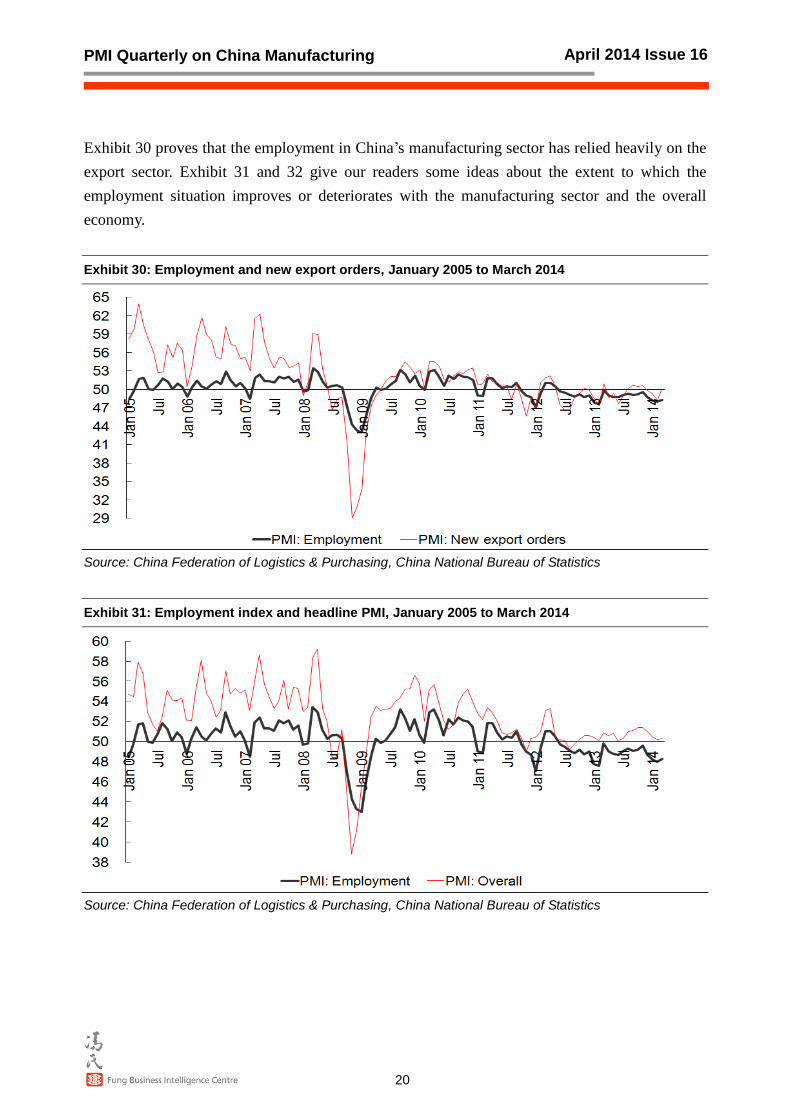
Exhibit 30 proves that the employment in China’s manufacturing sector has relied heavily on the
export sector. Exhibit 31 and 32 give our readers some ideas about the extent to which the
employment situation improves or deteriorates with the manufacturing sector and the overall
economy.
Exhibit 30: Employment and new export orders, January 2005 to March 2014
Source: China Federation of Logistics & Purchasing, China National Bureau of Statistics
Exhibit 31: Employment index and headline PMI, January 2005 to March 2014
Source: China Federation of Logistics & Purchasing, China National Bureau of Statistics
PMI Quarterly on China Manufacturing
21
April 2014 Issue 16
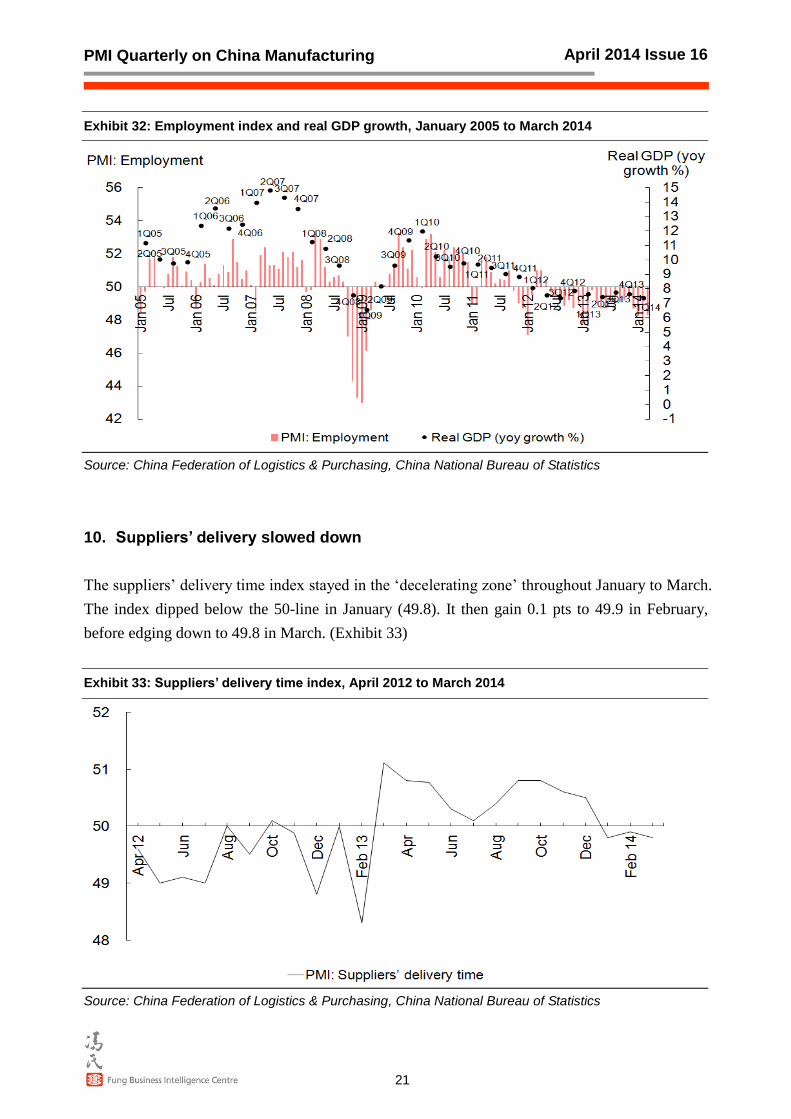
Exhibit 32: Employment index and real GDP growth, January 2005 to March 2014
Source: China Federation of Logistics & Purchasing, China National Bureau of Statistics
10. Suppliers’ delivery slowed down
The suppliers’ delivery time index stayed in the ‘decelerating zone’ throughout January to March.
The index dipped below the 50-line in January (49.8). It then gain 0.1 pts to 49.9 in February,
before edging down to 49.8 in March. (Exhibit 33)
Exhibit 33: Suppliers’ delivery time index, April 2012 to March 2014
Source: China Federation of Logistics & Purchasing, China National Bureau of Statistics
PMI Quarterly on China Manufacturing
22
April 2014 Issue 16
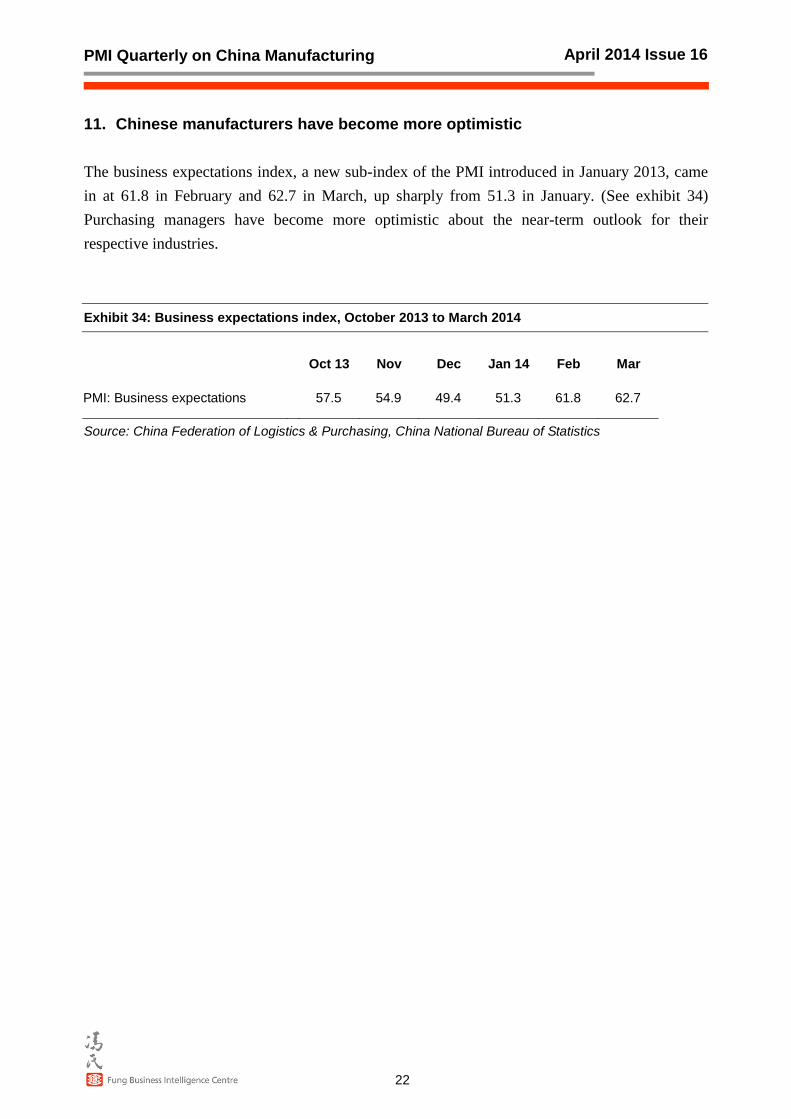
11. Chinese manufacturers have become more optimistic
The business expectations index, a new sub-index of the PMI introduced in January 2013, came
in at 61.8 in February and 62.7 in March, up sharply from 51.3 in January. (See exhibit 34)
Purchasing managers have become more optimistic about the near-term outlook for their
respective industries.
Exhibit 34: Business expectations index, October 2013 to March 2014
Oct 13 Nov Dec Jan 14 Feb Mar
PMI: Business expectations
57.5 54.9 49.4 51.3 61.8 62.7
Source: China Federation of Logistics & Purchasing, China National Bureau of Statistics
PMI Quarterly on China Manufacturing
23
April 2014 Issue 16
About China Manufacturing PMI:
China Manufacturing Purchasing Managers’ Index (PMI) provides an early indication each month of
economic activities in the Chinese manufacturing sector. It is jointly published by China Federation of
Logistics & Purchasing (CFLP) and the National Bureau of Statistics (NBS). The Fung Business
Intelligence Centre is responsible for drafting and disseminating the English PMI report.
Every month questionnaires are sent to 3,000 manufacturing enterprises all over China. The data
presented herein is compiled from the enterprises’ responses about their purchasing activities and supply
situations. CFLP makes no representation regarding the data collection procedures, nor does it disclose
any data of individual enterprises. The PMI should be compared to other economic data sources when
used in decision-making.
3,000 manufacturing enterprises in 21 industries from Eastern, Northeastern, Central and Western China
are surveyed. The sampling of the enterprises involves the use of Probability Proportional to Size
Sampling (PPS), which means the selection of enterprises surveyed is largely based on each industry’s
contribution to GDP, and the representation of each geographical region.
Survey responses reflect the change of each indicator, if any, in the current month compared to the
previous month. There are 12 indicators in the survey: Output, New Orders, New Export Orders, Backlogs
of Orders, Stocks of Finished Goods, Purchases of Inputs, Imports, Input Prices, Stocks of Major Inputs,
Employment, Suppliers’ Delivery Time and Business Expectations. For each of the indicators, this report
shows the percentage of enterprises reporting each response, the difference between the percentage of
responses in the positive economic direction and the negative economic direction, and the diffusion index.
The diffusion index is the sum of the positive responses plus a half of those responding ‘the same’.
Diffusion indices have the properties of leading indicators and are convenient summary measures showing
the prevailing direction of change and the scope of change. An index reading above 50 indicates an overall
positive change in that variable; below 50, an overall negative change.
The PMI is a composite index based on the seasonally adjusted diffusion indices for five of the indicators
with varying weights: New Orders—30%; Output—25%; Employment—20%; Suppliers’ Delivery
Time—15%; and Stocks of Major Inputs—10%. A PMI reading above 50 indicates an overall expansion in
the manufacturing sector; below 50, an overall contraction.
Currently there are 22 countries and regions conducting the PMI survey and compilation, based on an
internationally standardized methodology.
PMI Quarterly on China Manufacturing
24
April 2014 Issue 16
The Fung Group is a privately held multinational group of companies headquartered in Hong Kong whose core businesses are trading, logistics, distribution and retailing. The Fung Group employs over 43,000 people across 40 economies worldwide, generating total revenue of more than US$21.9 billion in 2012. Fung Holdings (1937) Limited, a privately held business entity headquartered in Hong Kong, is the major shareholder of the Fung group of companies. Please visit www.funggroup.com for more about the Fung Group. Through exceptional relationships and deep networks, the Fung Business Intelligence Centre (formerly known as the Li & Fung Research Centre) collects and analyses market data on China's economy, with special reference to sourcing, supply chains, distribution and retail. It also produces reports on sourcing and trading in other Asian countries. Serving as a knowledge bank for the Fung Group, the Centre makes its market data and analysis available to businesses, scholars and governments around the world. It has become an impartial thought leader on issues shaping the future of manufacturing, distribution, logistics and retailing in China, and regularly provides advice and consultancy services to internal and external clients.
© Copyright 2014 The Fung Business Intelligence Centre. All rights reserved.
Though the Fung Business Intelligence Centre endeavours to ensure the information provided in this publication is accurate and updated, no legal liability can be attached as to the contents hereof. Reproduction or redistribution of this material without prior written consent of the Fung Business Intelligence Centre is prohibited.