Embed Size (px)
Citation preview
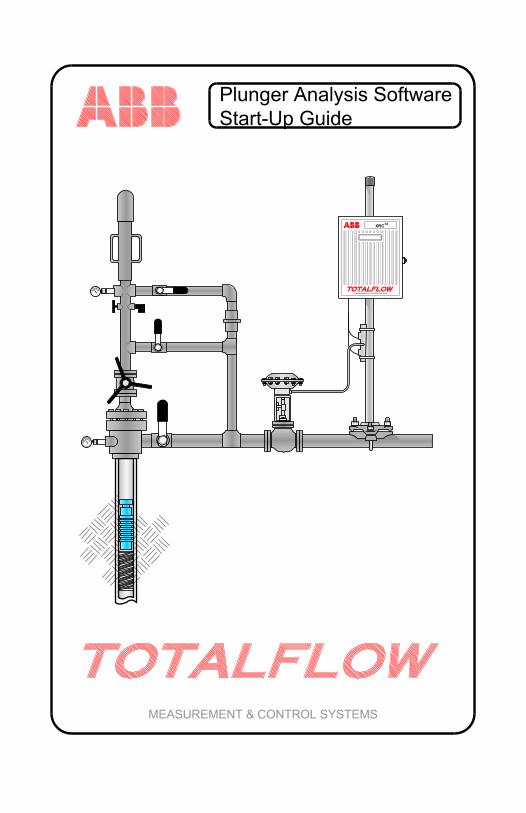
MEASUREMENT & CONTROL SYSTEMS
Plunger Analysis Software Start-Up Guide
G4XRC
Intellectual Property & Copyright Notice ©2010 by ABB Inc., Totalflow Products (“Owner”), Bartlesville, Oklahoma 74006, U.S.A. All rights reserved.
Any and all derivatives of, including translations thereof, shall remain the sole property of the Owner, regardless of any circumstances.
The original US English version of this manual shall be deemed the only valid version. Translated versions, in any other language, shall be maintained as accurately as possible. Should any discrepancies exist, the US English version will be considered final. ABB is not liable for any errors and omissions in the translated materials.
Notice: This publication is for information only. The contents are subject to change without notice and should not be construed as a commitment, representation, warranty, or guarantee of any method, product, or device by Owner.
Inquiries regarding this manual should be addressed to ABB Inc., Totalflow Products, Technical Communications, 7051 Industrial Blvd., Bartlesville, Oklahoma 74006, U.S.A.
Introduction ABB Totalflow® has developed a Plunger Analysis software package that can help the user better understand how to fully use the Totalflow Plunger system that is available in the XSeries® (8-bit and 32-bit) units. The tool is a stand-alone application that analyzes plunger lift cycles via trend files and calculates set points based on averages and other statistical data.
The Plunger Analysis software comes in two specific modes:
Batch – The standard application can be run as a batch service, if that service has been purchased. Command line parameters are passed when calling the executable. The batch service analyzes the entire plunger lift trend .csv’s in a particular directory. The output will be recommended set point settings and other statistical data that is relevant for each well that is analyzed. GUI – This is the default mode. When the executable is initiated, the standard graphical user interface is displayed, and a .csv file will need to be manually loaded via the tool bar or menu bar.
1
Before Beginning While the Plunger Analysis software can be used with a 8-bit (G3) or 32-bit (G4) device, the following will assume that the user is on a G4 device. The start-up guide will walk the user through the steps for setting up trend files necessary to collect the data that is needed by the program, ways to save the data for importing into the program, importing the data, analyzing the data and saving and printing reports from the analysis.
Basic Installation Step 1 Setting Up a Trend File
The user will need to open PCCU and move into Entry mode.
1A Click the Station ID at the top of the tree-view. Click the Applications tab. The user needs to instantiate both the Plunger and Trend System applications. Move to slot 95, and select Trend System from the drop-down menu. Next, move to slot 121 thru 127, and select Plunger Control from the drop-down menu. When through, click the Send button.
1B Gather all the app/array/register numbers for the five parameters that the Plunger Analysis program needs. For the purpose of this manual, they are as follows:
• Casing – 7.4.3 • Tubing – 7.4.4 • Line Pressure – 11.3.0 • Flow Rate – 11.7.19 • Arrival Time – 121.4.72
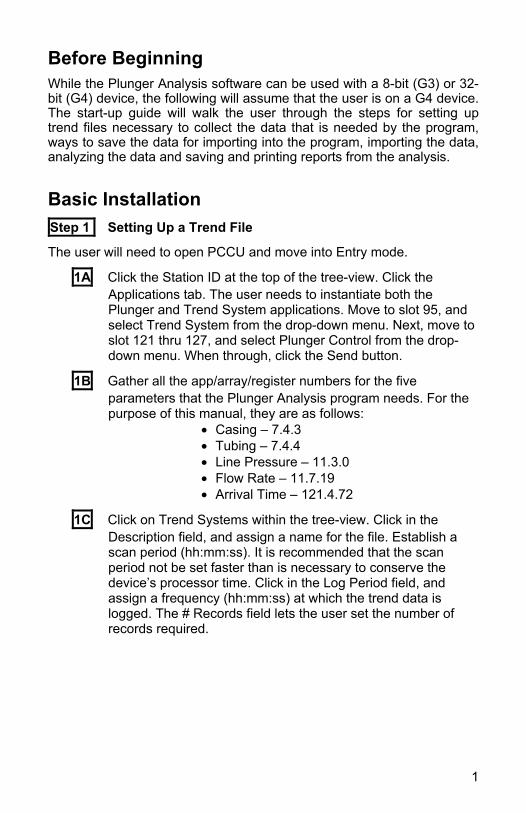
1C Click on Trend Systems within the tree-view. Click in the Description field, and assign a name for the file. Establish a scan period (hh:mm:ss). It is recommended that the scan period not be set faster than is necessary to conserve the device’s processor time. Click in the Log Period field, and assign a frequency (hh:mm:ss) at which the trend data is logged. The # Records field lets the user set the number of records required.
2
Figure 1 – Trend Files Screen
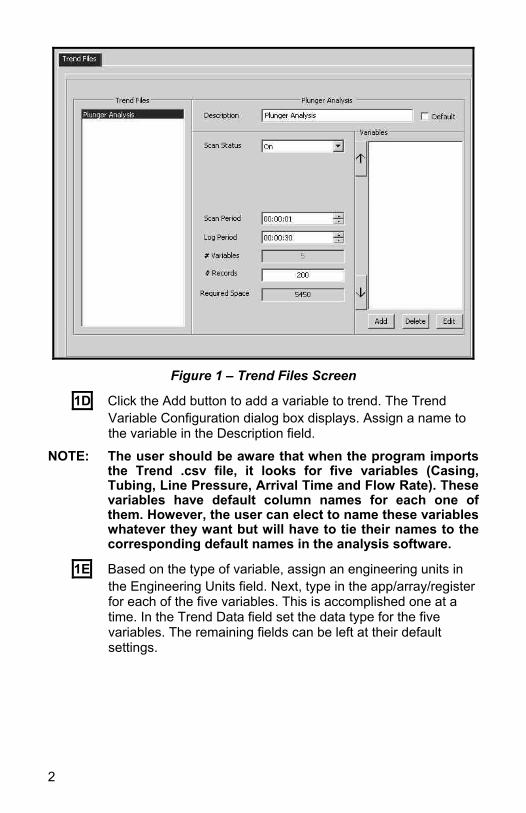
1D Click the Add button to add a variable to trend. The Trend Variable Configuration dialog box displays. Assign a name to the variable in the Description field.
NOTE: The user should be aware that when the program imports the Trend .csv file, it looks for five variables (Casing, Tubing, Line Pressure, Arrival Time and Flow Rate). These variables have default column names for each one of them. However, the user can elect to name these variables whatever they want but will have to tie their names to the corresponding default names in the analysis software.
1E Based on the type of variable, assign an engineering units in the Engineering Units field. Next, type in the app/array/register for each of the five variables. This is accomplished one at a time. In the Trend Data field set the data type for the five variables. The remaining fields can be left at their default settings.
3
Figure 2 – Trend Variable Configuration Dialog Box
1F After all the variable information has been collected, click the Send button. A Enter File Name dialog box displays. Assign a name to the trend file, and click the OK button. Click the Collect icon on the PCCU tool bar. The Collect window displays.
1G To ensure that the user has a trend file that can be imported into the analysis program, place a check mark in the Archive File checkbox. This outputs the file as a .csv file in the spreadsh\archive\TOTALFLOW sub-folder under the PCCU folder that the user happens to be using. Click the OK button. The system will collect the data and output the data as a line graph and tabular data.
Step 2 Starting the Plunger Analysis Tool
The following assumes that the user has installed the Plunger Analysis software on their system.
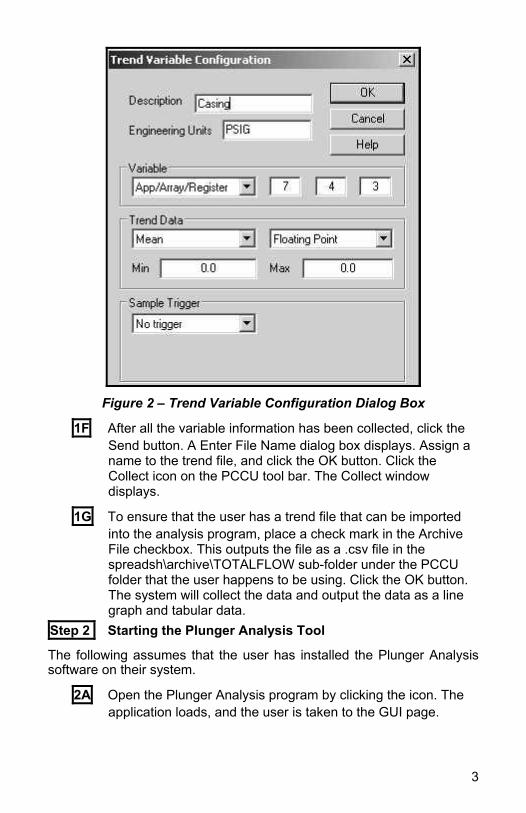
2A Open the Plunger Analysis program by clicking the icon. The application loads, and the user is taken to the GUI page.
4
Figure 3 – Plunger Analysis Main Screen
2B Click on File in the application’s tool bar. Select Open from the drop-down menu. Navigate to where the user elected to save the .csv file. Once located, select the file, and click Open. This will bring up the trend file in the analysis program.
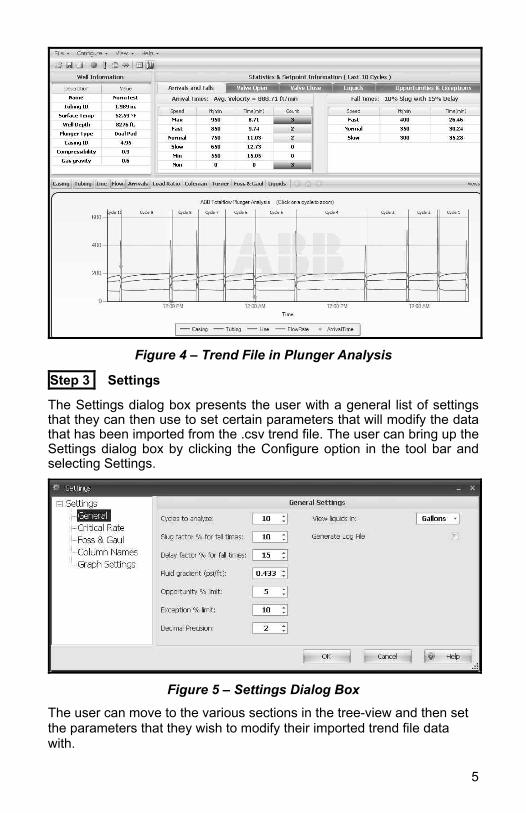
5
Figure 4 – Trend File in Plunger Analysis
Step 3 Settings
The Settings dialog box presents the user with a general list of settings that they can then use to set certain parameters that will modify the data that has been imported from the .csv trend file. The user can bring up the Settings dialog box by clicking the Configure option in the tool bar and selecting Settings.
Figure 5 – Settings Dialog Box
The user can move to the various sections in the tree-view and then set the parameters that they wish to modify their imported trend file data with.
6
Step 4 Setting Up a Batch Process
The following information will detail the steps necessary to set up a Batch process.
4A After the installation and the user has installed Batch, launch the software. After the application opens, click Configure. From the drop-down menu, select Batch Mode.
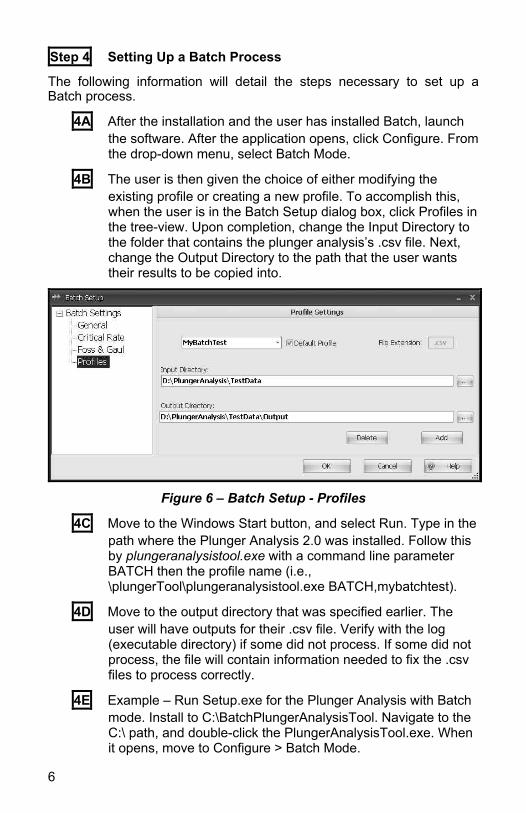
4B The user is then given the choice of either modifying the existing profile or creating a new profile. To accomplish this, when the user is in the Batch Setup dialog box, click Profiles in the tree-view. Upon completion, change the Input Directory to the folder that contains the plunger analysis’s .csv file. Next, change the Output Directory to the path that the user wants their results to be copied into.
Figure 6 – Batch Setup - Profiles
4C Move to the Windows Start button, and select Run. Type in the path where the Plunger Analysis 2.0 was installed. Follow this by plungeranalysistool.exe with a command line parameter BATCH then the profile name (i.e., \plungerTool\plungeranalysistool.exe BATCH,mybatchtest).
4D Move to the output directory that was specified earlier. The user will have outputs for their .csv file. Verify with the log (executable directory) if some did not process. If some did not process, the file will contain information needed to fix the .csv files to process correctly.
4E Example – Run Setup.exe for the Plunger Analysis with Batch mode. Install to C:\BatchPlungerAnalysisTool. Navigate to the C:\ path, and double-click the PlungerAnalysisTool.exe. When it opens, move to Configure > Batch Mode.
7
4F Select Profiles in the tree-view, and modify the existing profile that is checked as the default profile. Make the Input Directory the following: C\BatchPlungerAnalysisTool\ExampleData. Make the Output Directory: C\BatchPlungerAnalysisTool\ExampleData\Output. Save the profile.
4G Move to the Windows Start button, and select run. Type in the following: C:\BatchPlungerAnalysisTool\PlungerAnalysisTool.exe BATCH. An XML file is outputted for each plunger .csv file that was processed. Names are based on the well name that is located inside the file. Outputs can be 1 of 5 different types: • (Well Name).Ex – Exception file. This file will contain all
the set point settings (rise and fall time, pressure averages, etc.), but it was out of range for exception % limit range based on the tolerance set point defined in the .csv file (i.e, if tubing-line pressure was greater than exception % limit from the tolerance level defined in the .csv file).
• (Well Name).Op – Opportunity file. This file also contains all the set point settings, but it was out of range for the opportunity % limit range based on the tolerance set point defined in the .csv file.
• (Well Name).Nr – Normal. This file will contain all the set point settings, and all the exception and opportunity set points are within optimal range of their respective tolerance set points.
• (Well Name).Np – No Optimization. This indicates the .csv file was processed, and all the set point settings were calculated OK, but there were no tolerance set points defined in the .csv file for opportunity or exception checking.
• (Well Name).Fl – Failed. The .csv failed to be processed. The reason is given inside the .xml file or in the batch log file.
8
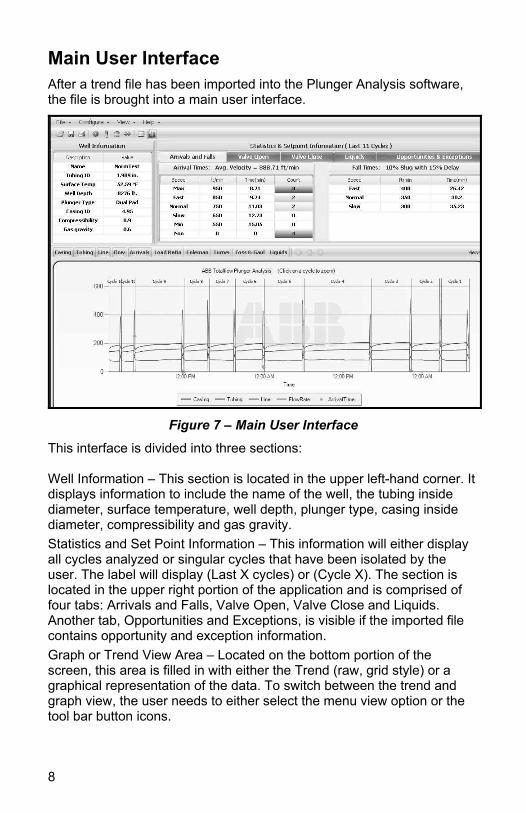
Main User Interface After a trend file has been imported into the Plunger Analysis software, the file is brought into a main user interface.
Figure 7 – Main User Interface
This interface is divided into three sections: Well Information – This section is located in the upper left-hand corner. It displays information to include the name of the well, the tubing inside diameter, surface temperature, well depth, plunger type, casing inside diameter, compressibility and gas gravity. Statistics and Set Point Information – This information will either display all cycles analyzed or singular cycles that have been isolated by the user. The label will display (Last X cycles) or (Cycle X). The section is located in the upper right portion of the application and is comprised of four tabs: Arrivals and Falls, Valve Open, Valve Close and Liquids. Another tab, Opportunities and Exceptions, is visible if the imported file contains opportunity and exception information. Graph or Trend View Area – Located on the bottom portion of the screen, this area is filled in with either the Trend (raw, grid style) or a graphical representation of the data. To switch between the trend and graph view, the user needs to either select the menu view option or the tool bar button icons.

9
CSV Format Definitions The following are the current definitions for the .csv file format. Some fields are required while others are considered optional. Since .csv is a comma separated value, locations are referred to as row x, column y.
1. Row 1: Must exist but is not used for any data processing.
2. Row 2 (Well Name) • Column 10 (or Cell J) - This field is optional and is not required;
however, it can be used if the description of the trend file is not the actual well name. The end user or third party vendor must write to this cell, if this option is needed. The field must be Well Name. Column 12 is used in conjunction with this column.
• Column 12 (or Cell L) - This field is optional and can only be used if Column 10 is being used. It contains the Well Name that the plunger is being used on. The combination of Column 10 and 12 override the Column 1 Well Name, if present.
• Column 1 (or Cell A) - This will contain the trend file name followed by a dash and then the trend file description. In most instances, the description represents the well name or tube. The description here will be read as the well name for the Plunger Analysis software. Again, if items A and C are being used, this column will be ignored.
3. Row 3 (Column Names) • Column 1 (or Cell A) - Must exist but is not used. This should
always be the Device ID. • Column 2 (or Cell B) - Time stamp column. Must contain a date
time stamp in the format of MM/DD/YYYY HH:MM. There must be a stamp for each record (or row) for plunger data points.
• Column 3, 4, 5, 6 and 7 (Cell C, D, E, F, G) - The default order is Casing, Tubing, Line, Flow Rate and Arrival Time. When loading manually through the analysis tool, these columns can be in any order. The program will attempt to match up the default column names in the Column Names section with those found in the .csv file. If any do not match, the program will check to see if the user has data in the well settings for this particular well. If it does, it will attempt to match the column names saved there with those found in the .csv file. If it still cannot match up the names, the user is prompted to match up the column names found in the .csv file with the appropriate data points. For example, if the user called casing pressure CA and the default column name in Configure>Settings>Column Names for casing pressure was CasePres and no well settings were available for this well, the user would be prompted to match up CA to the data point, casing pressure. Once the user saves this, the next time that data is loaded from the same well it will know how to match the data point, casing pressure, to CA. If the user is in batch mode and these column names cannot be matched up, an error will be logged for that file, and batch will continue with the next .csv file.
10
4. Row 4 (Units and Well Data) • Column 3, 4, 5, 6 and 7 (Cell C, D, E, F, G) - These are the units
that the data points are measured in PSIG, MCF/Day and seconds. These are typically populated from the units string in the plunger trend file for that variable. These are not currently used by the analysis software, but may be used for reading international or metric units.
• Column 10, 11, 12 and 13 (Cell J, K, L, M) - These are the well properties cells. These values are required for plunger calculations; however, it is not mandatory for them to be in the .csv file. If the user is running the application (not batch) and these items are not present in the .csv file, the user will be prompted to enter them manually. It is then saved in the Well Settings information for that particular meter. If a user is running in batch and these items are not present in the .csv and the application cannot import that particular well's data, an error will be generated, and the batch process will continue with the next file.
• Column 10 (Cell J) - Well depth in feet • Column 11 (Cell K) - Tubing Inside Diameter in inches • Column 12 (Cell L) - Surface Temperature - in deg F • Column 13 (Cell M) - Plunger Type. The plunger type
must exist in Plunger Types. If a plunger type is defined here and does not exist in the Plunger Types list, it is invalid. the user will need to add that plunger type to the list and add arrival times and fall times for the plunger prior to proceeding.
• Column 14, 15, and 16 (Cell N, O, P) - Completely optional. These are more well properties, but default values have been set in Settings.
• Column 14 (Cell N) - Casing Inside Diameter in inches • Column 15 (Cell O) - Compressibility of the well • Column 16 (Cell P) - Gas gravity of the well
5. Row 5 and Beyond – • The raw data points for each of the main columns: Casing,
Tubing, Line, Flow Rate and Arrival Time.
6. Opportunity and Exception Tolerance Criteria – • At the end of the data points, the program will look two rows past
the last row of data points in Column 1 for the string, Options. If that is found, it signals the program to look for Exception and Opportunity Tolerance criteria. For example, the row is labelled that has Options in Column 1 as Row x. Totalflow does not enter this information into a .csv generated by a trend file. A user or third party vendor must put these along with their respective Tolerance criteria.
• Row N+1 - Exception Criteria Labels. These must be matched exactly.
11
• Column 1 (Cell A) - T-L Open: Represents Tubing Pressure - Line Pressure at valve open.
• Column 2 (Cell B) - C-L&T-L: Represents Casing Pressure - Line Pressure AND Tubing Pressure - Line Pressure at valve open. The label is necessary, but the values for this condition are not necessary.
• Column 3 (Cell C) - C-T&T-L Open: Represents Casing - Tubing AND Tubing - Line at valve open. Again, the label is necessary, but values for this condition are not.
• Column 4 (Cell D) - C-L Open: Casing - Line Pressure at valve open.
• Column 5 (Cell E) - C-T Open: Casing - Tubing Pressure at valve open.
• Column 6 (Cell F) - LR Open - Load Ratio at valve open. • Column 7 (Cell G) - Tube Open: Tubing Pressure at
valve open. • Column 8 (Cell H) - Case Open: Casing Pressure at
valve open. • Column 9 (Cell I) - Static Open: Line Pressure at valve
open. • Column 10 (Cell J) - Turner FR Close: Turner flow rate
calculation at valve close. • Column 11 (Cell K) - LR Close: Load Ratio at valve
close. • Column 12 (Cell L) - DP Low Close: DP low at valve
close. The label is needed, but the condition is not used currently.
• Column 13 (Cell M) - FR Close: Coleman flow rate at valve close.
• Column 14 (Cell N) - T-L Close: Tubing - Line at valve close.
• Column 15 (Cell O) - C-T Close: Casing - Tubing at valve close.
• Column 16 (Cell P) - Tube Close: Tubing Pressure at valve close.
• Column 17 (Cell Q) - Case Close: Casing Pressure at valve close.
• Column 18 (Cell R) - Static Close: Line Pressure at valve close.
• Row N+2: Either a 1 or 0 is entered for each column listed above. 1 means enable, and 0 means disable for each corresponding condition (listed above).
• Row N+3: A floating point number representing a Tolerance for each column listed above. This number is the threshold or baseline for Exception and Opportunity criteria.
• Example:

12
Row N+2, Column 1 = 1 Row N+3, Column 1 = 130.0 At runtime, the program will calculate all the Tubing
- Line Pressures at valve open. This value will be the recommended value. If the recommended value deviated from the threshold by a percent greater than that defined in Program Settings, the program would throw an Exception or Opportunity (whichever condition was worse). If the recommended value is within tolerance, Opportunity or Exception is not thrown, and the condition is labeled optimal.
7. Notepad view and Excel view of data.
Figure 8 – Notepad View of Row 1, 2, 3, 4, 5, etc
Figure 9 – Excel View of Row 1, 2, 3, 4, 5, etc.
13
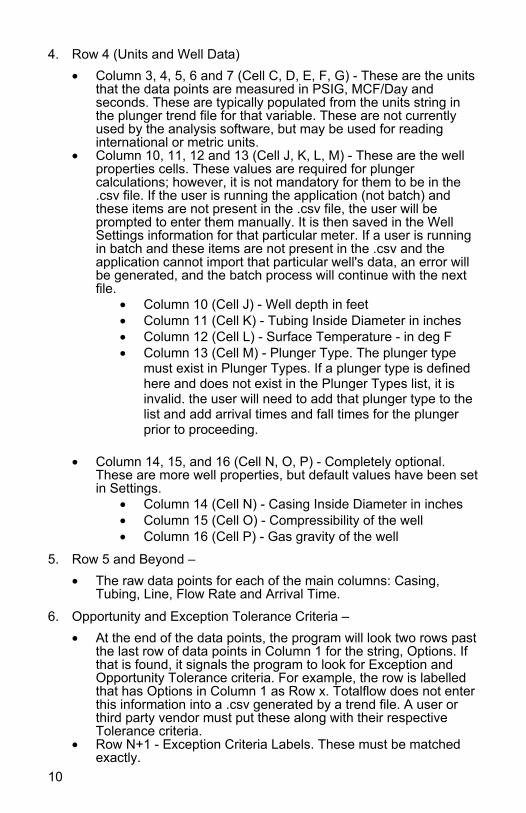
Figure 10 – Notepad View of Exception and Opportunity Definitions
Within a .CSV File
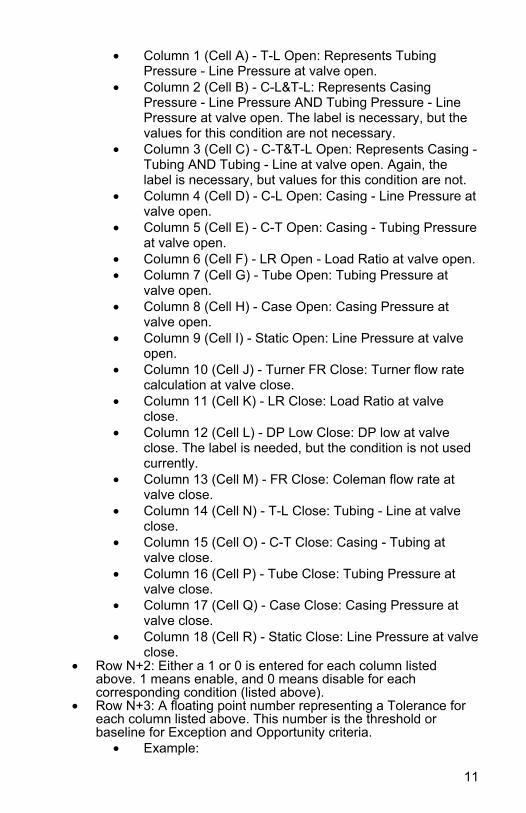
Figure 11 – Excel View of Exception and Opportunity Definitions
Within a .CSV File

ABB Inc. Totalflow Products 7051 Industrial Blvd. Bartlesville, Oklahoma 74006 Tel: USA (800) 442-3097
International 001-918-338-4880