Embed Size (px)
Citation preview
ww
w.in
l.gov
Plug-In Electric Vehicle Infrastructure Options and Use
Jim FrancfortZEV Infrastructure Panel and Discussion -Pacific Coast Collaborative (PCC) Workshop on Zero Emission Vehicles in FleetsPortland, OregonJuly 23, 2014
This presentation does not contain any proprietary, confidential, or otherwise restricted information
INL/CON-14-32571
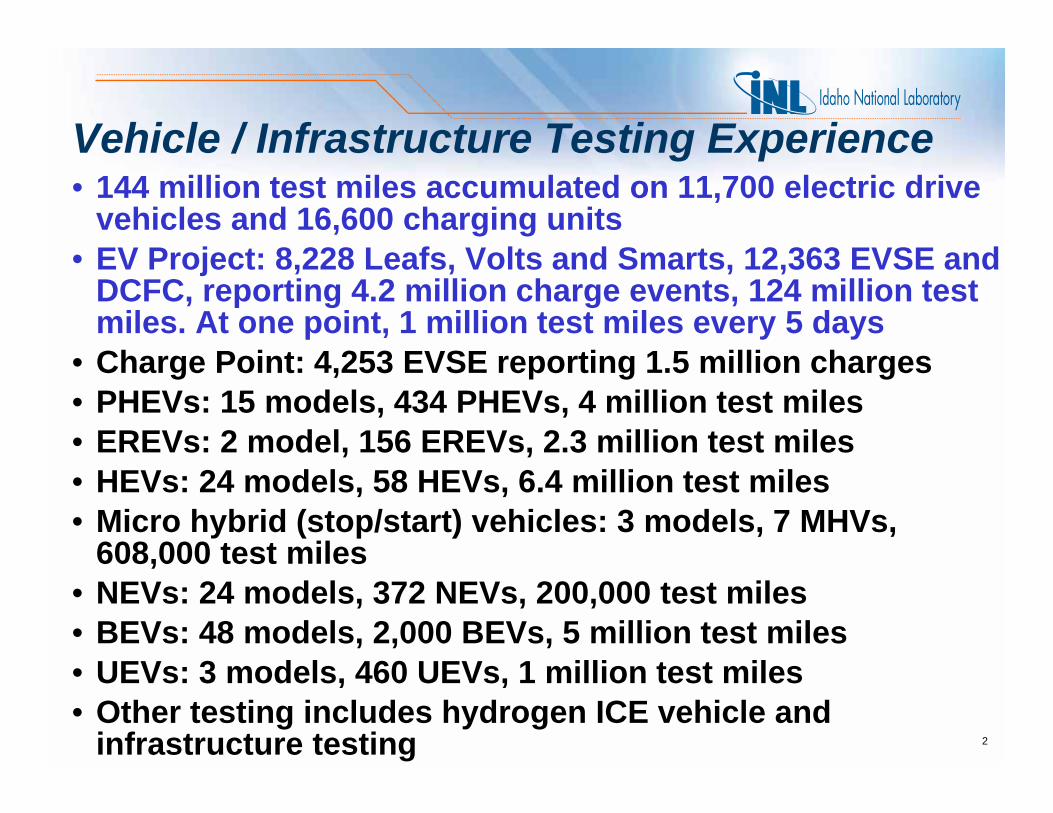
Vehicle / Infrastructure Testing Experience• 144 million test miles accumulated on 11,700 electric drive
vehicles and 16,600 charging units• EV Project: 8,228 Leafs, Volts and Smarts, 12,363 EVSE and
DCFC, reporting 4.2 million charge events, 124 million test miles. At one point, 1 million test miles every 5 days
• Charge Point: 4,253 EVSE reporting 1.5 million charges• PHEVs: 15 models, 434 PHEVs, 4 million test miles• EREVs: 2 model, 156 EREVs, 2.3 million test miles• HEVs: 24 models, 58 HEVs, 6.4 million test miles • Micro hybrid (stop/start) vehicles: 3 models, 7 MHVs,
608,000 test miles • NEVs: 24 models, 372 NEVs, 200,000 test miles • BEVs: 48 models, 2,000 BEVs, 5 million test miles • UEVs: 3 models, 460 UEVs, 1 million test miles• Other testing includes hydrogen ICE vehicle and
infrastructure testing 2
Areas of Concern with Transportation Oil Dependency – Long Term• Energy security
– Insufficient domestic supply of easily obtainable oil forces us to rely on imports
– Global supply has reached “Peak Oil” (?)• Global climate change
– Tailpipe and smoke stack CO2 emissions• Economic stability
– Unbalanced supply and demand affect all levels of the economy (global, national, personal)
3
Advantages to PEVs as a Solution to Oil Dependency • Displace petroleum consumption with electricity• Diversify our transportation energy sources• Enable alternatives
– Use domestically generated electricity from a variety of sources
– Use existing infrastructure – Leverage nuclear and renewable energy sources
(wind, solar, hydropower, geothermal)
4
Challenges of PEVs as a Solution to Oil Dependency• Current technology limitations (batteries) and potentially
a shortage of domestic rare earth materials• Some infrastructure required
– Charging stations (short term)– Communication between vehicles and electric grid
(mid-term)– Additional electricity generation / transmission /
distribution (long-term) or distributed storage is required
5
Vehicle Technology Summary• ICE: only energy storage is hydrocarbon fuel – typically
gasoline or diesel • HEV: has 2 onboard energy sources – typically gasoline and
electricity. All energy originates from gasoline and the battery is only used to recover braking energy. It can be charged by the ICE engine when it is efficient to do so
• PHEV: can be fueled with both gasoline from the pump and electricity from the grid. When the battery is charged, the gasoline engine may not even be used (All Electric Capable), or is used when the electric motor is not powerful enough by itself (Blended). When the battery is nearly empty, the vehicle operates like a typical HEV
• BEV: has one onboard energy source – electricity, obtained by plugging in (charging). When the battery is depleted, BEVs can’t be driven until recharged - like running out of gas, but takes longer to ‘refuel’
• A PEV includes both PHEVs and BEVs – both are “plugged in”6

Vehicle Electrification: Grid Impacts• In the U.S., current grid capacity could
supply electricity for 70% of our vehicles without adding capacity, but assumes:– Vehicles would only charge off-peak– “Perfect” distribution of electricity– No local impacts such as overburdening
neighborhood transformers• PEVs will not cause a grid “meltdown” but
we clearly need to work to reduce vehicle rollout impacts
• Smart charging will be key to lowering costs and minimizing impacts
• Time of day pricing is important
7
Charging Definitions• Defined in Society of Automotive Engineers (SAE) J1772
– AC (On-board vehicle charger)• Level 1: 120V AC (up to 16 Amps, ~ 1.92kW Max)• Level 2: 240V AC (up to 80 Amps, ~ 20kW Max)• Level 3: > 20kW (proposed)
– DC Charging (Off-board vehicle charger)• Level 1: Up to 20kW (proposed)• Level 2: Up to 80kW (proposed)• Level 3: >80kW (proposed)
– There may be other levels proposed• What is called “fast charging” today is DC Level 2• Most vehicles have onboard chargers that operate at 3.3
or 6.6 kW. Tesla charges at 10 kW. Energy is supplied to the vehicle via electric vehicle supply equipment (EVSE) at AC Level 2 8
Selecting the EVSE or DCFC Type & Rate• AC Level 1 (supplies electricity to on-board DC Charger)
– 110 VAC EVSE should be connected to commercial grade NEMA outlet and dedicated branch circuit
– Convenience charge cord typically provided with PEV used for emergency purposes.
– Charge times range from 6+ hours (PHEV) to 24+ hours (BEV) for a full recharge
– Could be used to charge PHEV on a daily basis but dissatisfaction can occur if PHEV does not fully charge
• AC Level 2 (supplies electricity to on-board DC Charger)– 240 VAC EVSE connected to dedicated branch circuit– Charge times range from 2 (PHEV) to 8 hours (BEV) for
a full recharge– Good for malls, movie theatres, work place
9

Selecting the EVSE or DCFC Type & Rate • DC (Off-board Charger, directly charges the vehicle
battery pack. Does not use the onboard charger)– DC Level 2 (>20kW and up to 80kW)– 50kW is the most commonly used power output
today (Nissan Leaf)– Provides 2 to 4 miles range per minute of charge– Good for City corridors, convenience stores, fast
food restaurants, and vehicles with large energy storage batteries
10
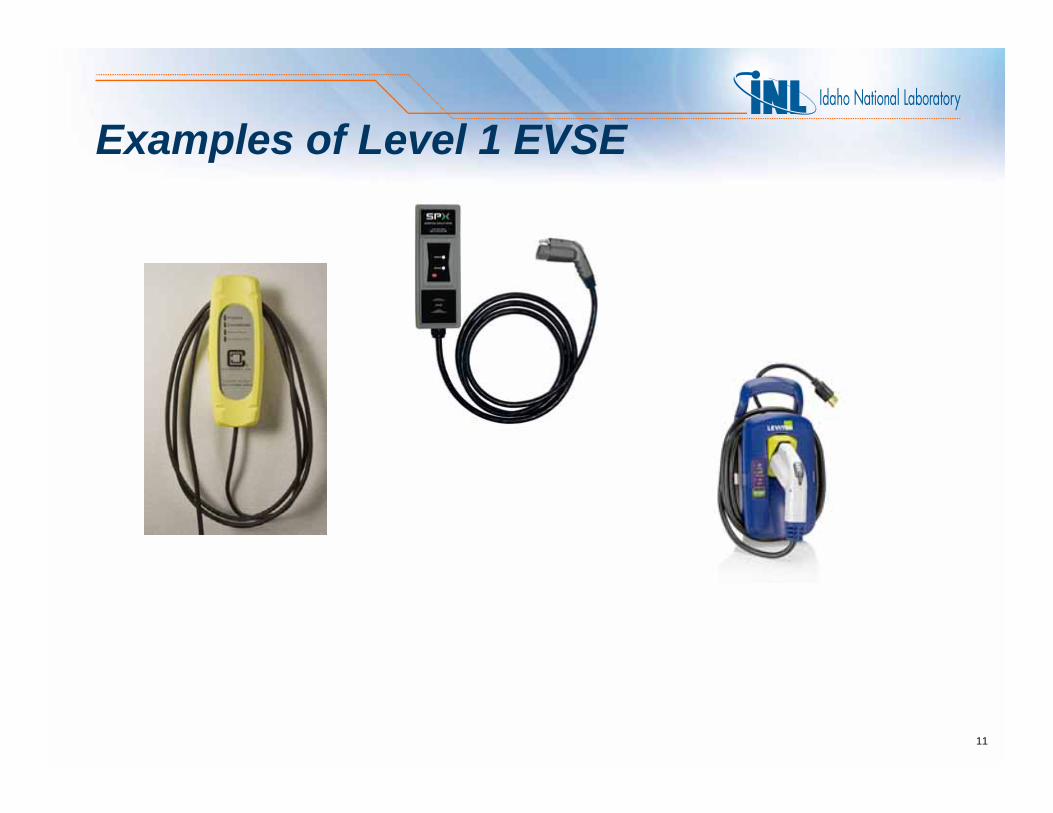
Examples of Level 1 EVSE
11

Examples of Level 2 EVSE Hardware
12
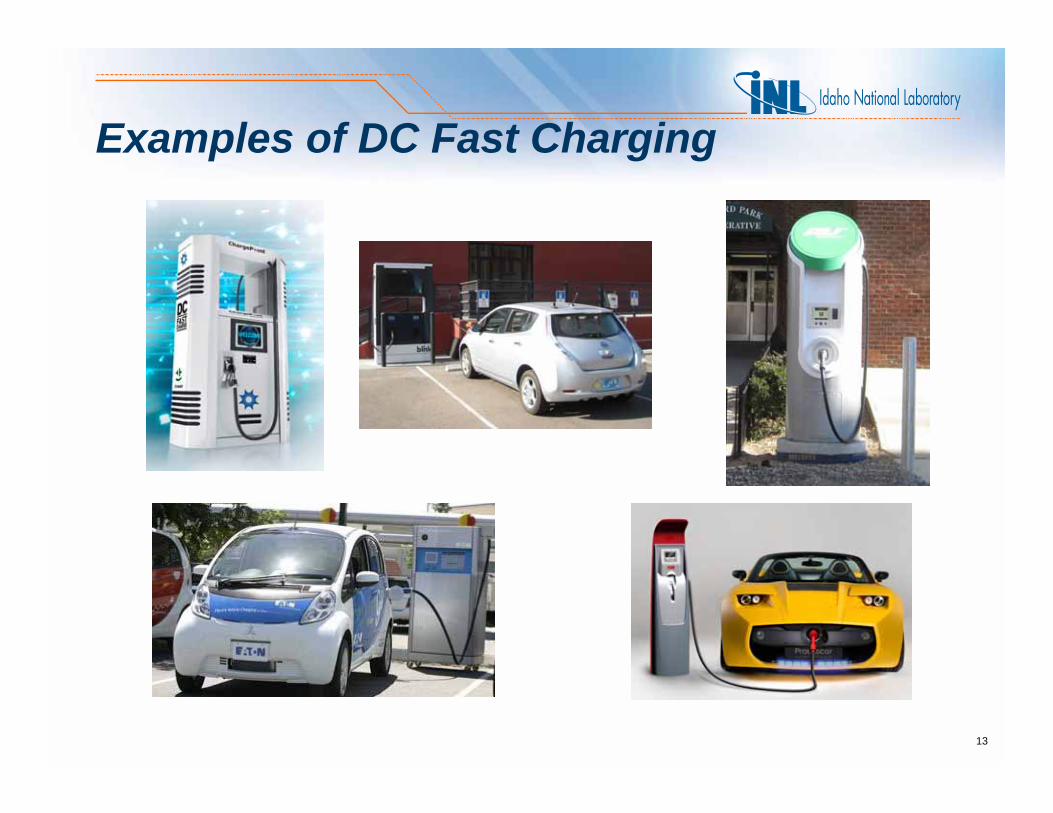
Examples of DC Fast Charging
13

Commercial Site Considerations• Geographic Coverage / Planning• Local attraction(s)• Proper charger level for location• ADA Requirements • Lighting / Security• Signage• Access• Local Permitting Authority
14
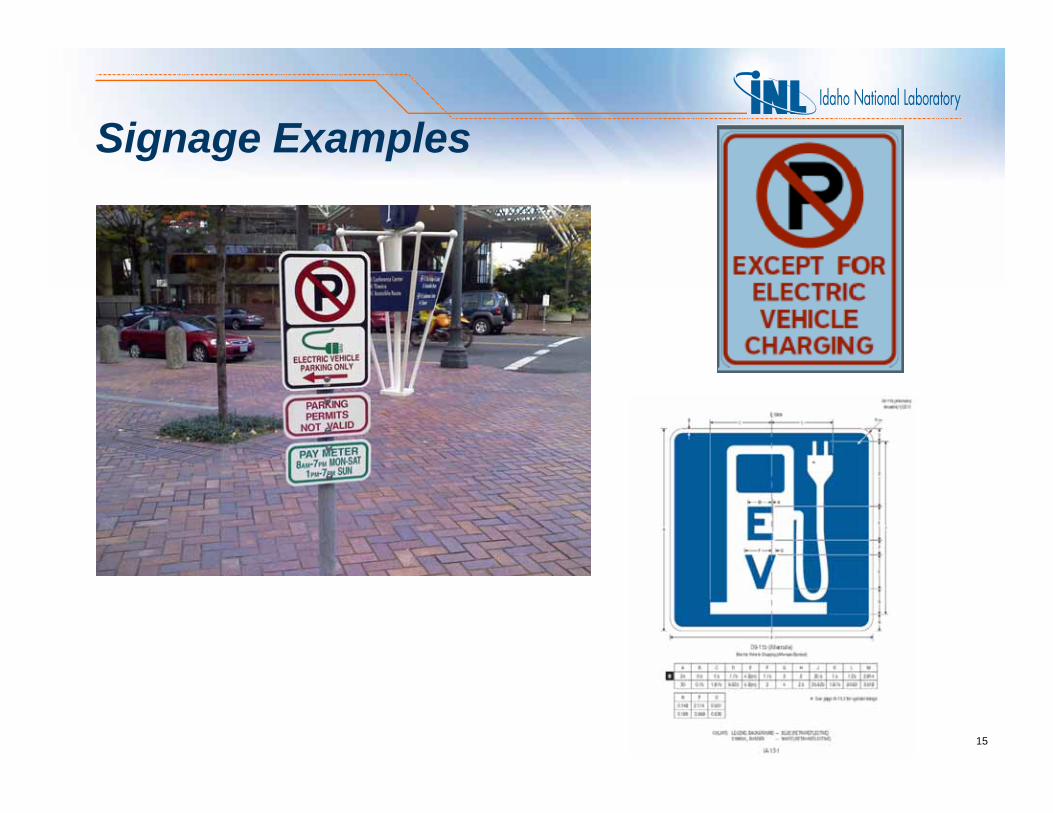
Signage Examples
15
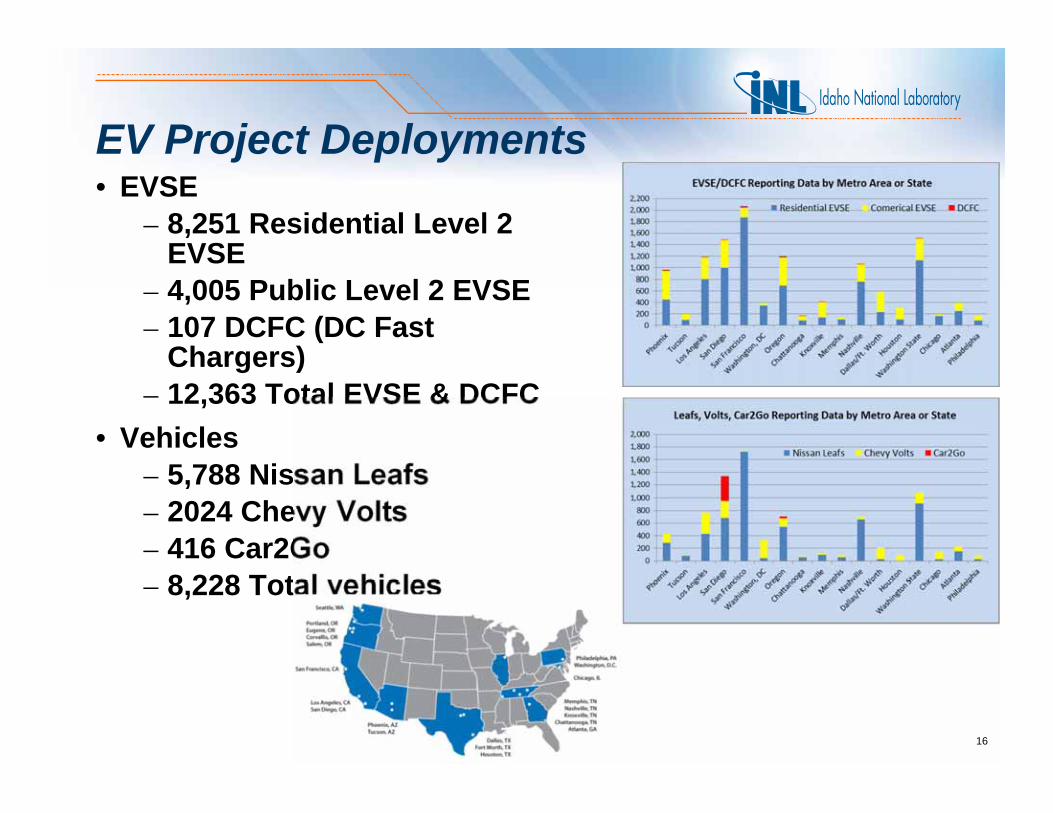
EV Project Deployments• EVSE
– 8,251 Residential Level 2 EVSE
– 4,005 Public Level 2 EVSE– 107 DCFC (DC Fast
Chargers)– 12,363 Total EVSE & DCFC
• Vehicles– 5,788 Nissan Leafs– 2024 Chevy Volts– 416 Car2Go– 8,228 Total vehicles
16
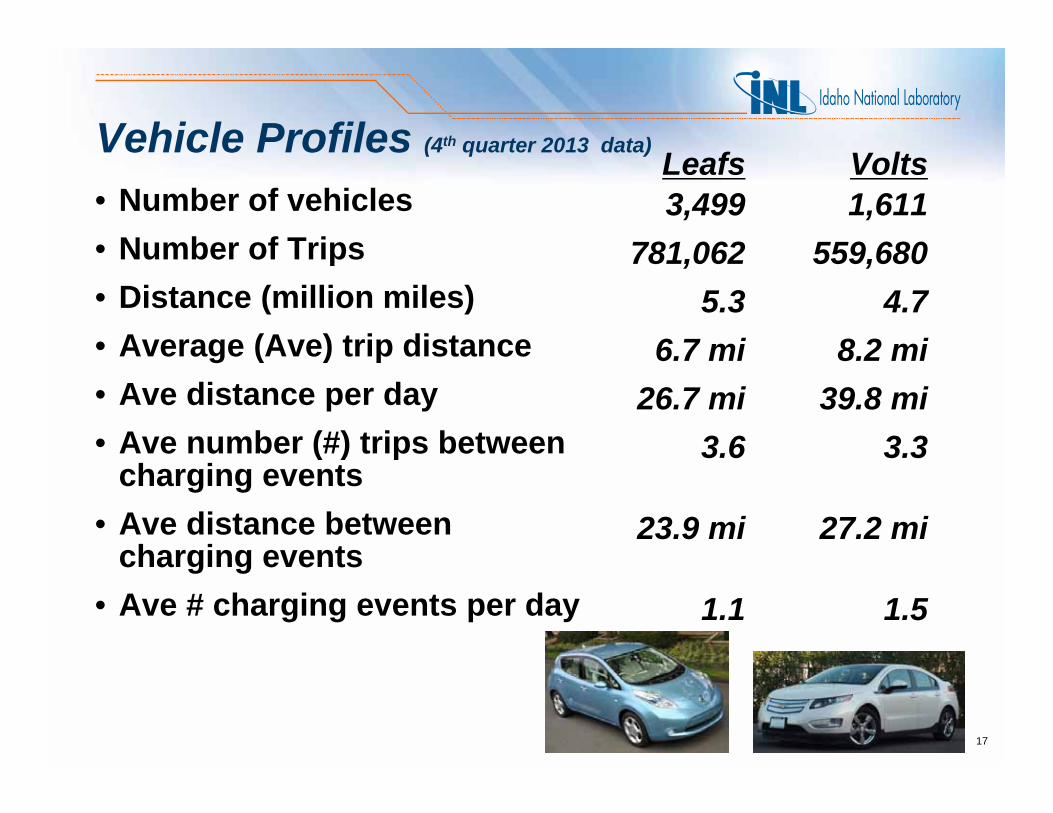
Vehicle Profiles (4th quarter 2013 data)
• Number of vehicles• Number of Trips• Distance (million miles)• Average (Ave) trip distance• Ave distance per day• Ave number (#) trips between
charging events• Ave distance between
charging events• Ave # charging events per day
Leafs3,499
781,0625.3
6.7 mi26.7 mi
3.6
23.9 mi
1.1
Volts1,611
559,6804.7
8.2 mi39.8 mi
3.3
27.2 mi
1.5
17
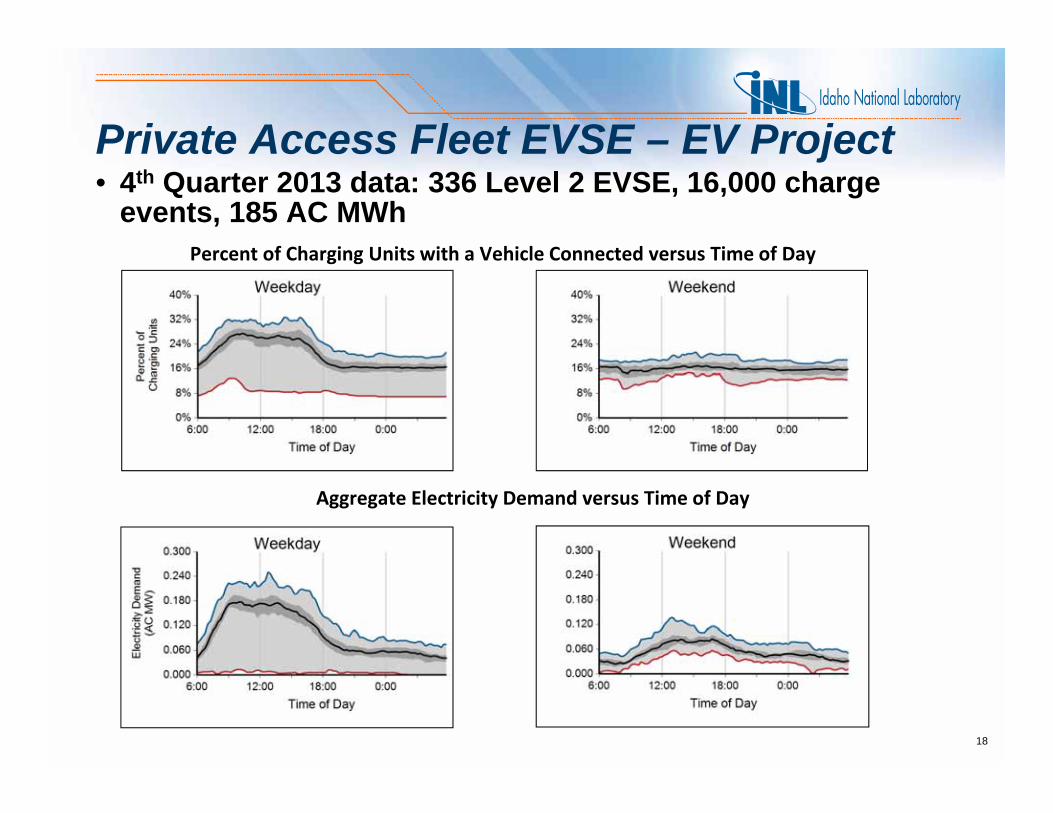
Private Access Fleet EVSE – EV Project• 4th Quarter 2013 data: 336 Level 2 EVSE, 16,000 charge
events, 185 AC MWh
Aggregate Electricity Demand versus Time of Day
Percent of Charging Units with a Vehicle Connected versus Time of Day
18
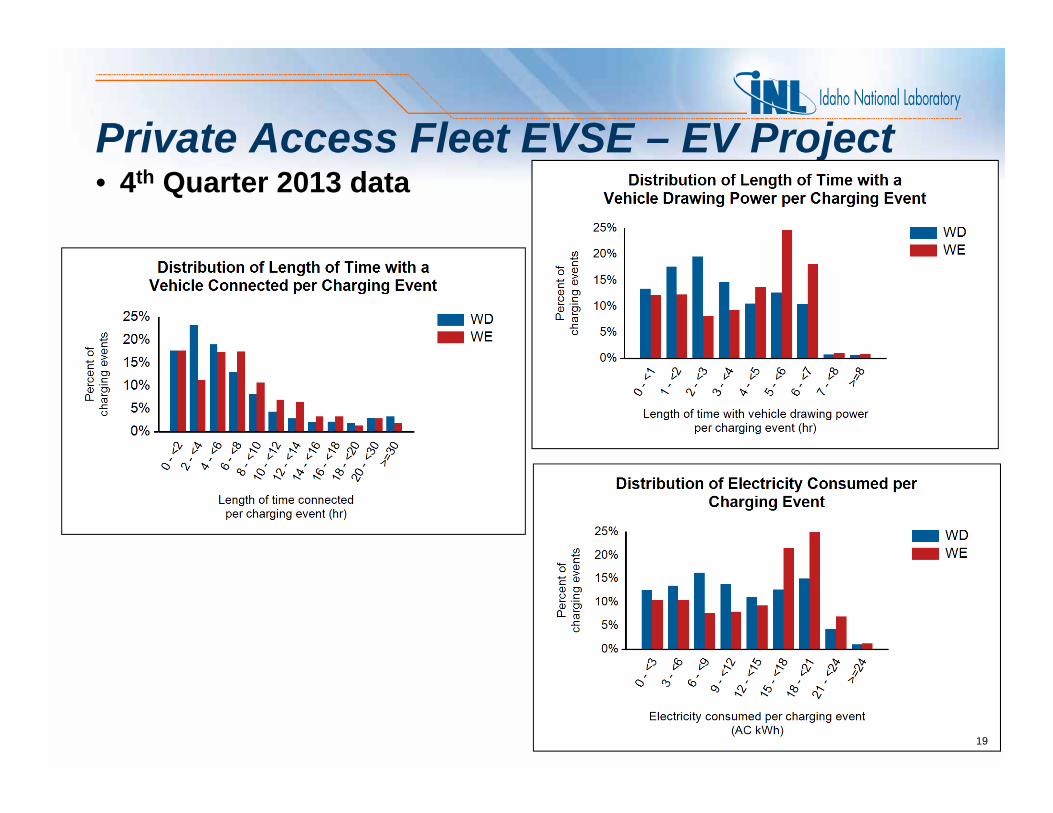
Private Access Fleet EVSE – EV Project
19
• 4th Quarter 2013 data
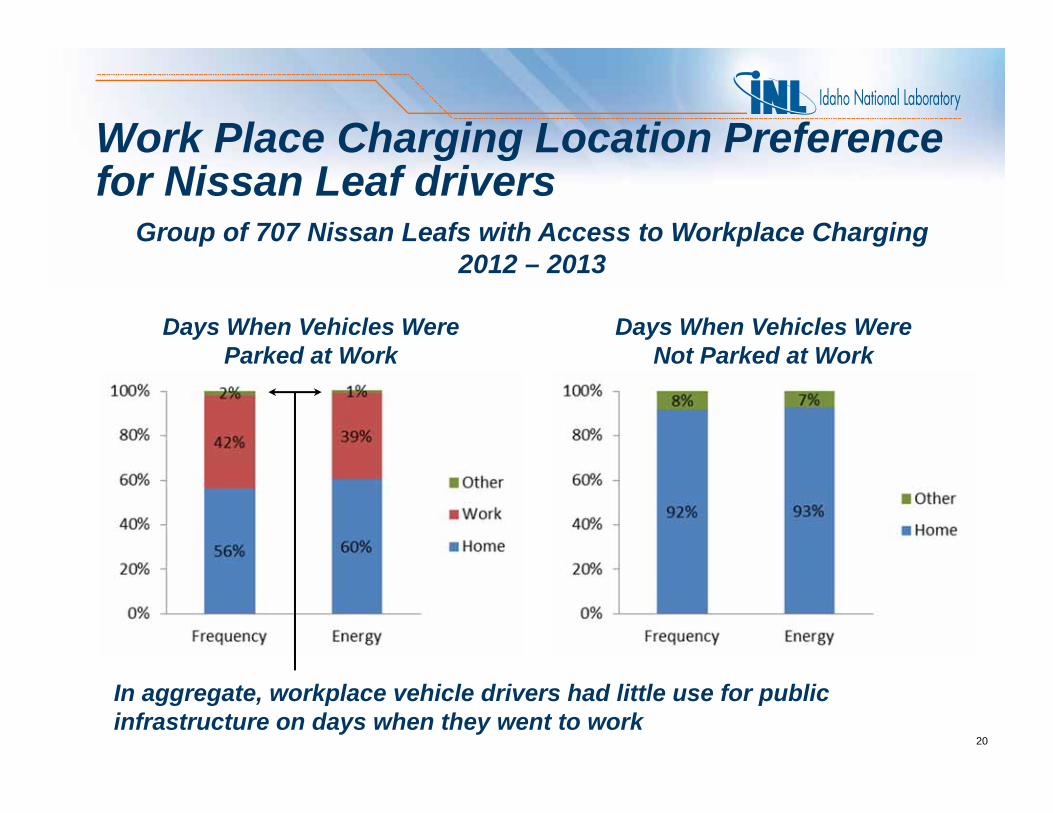
Work Place Charging Location Preference for Nissan Leaf drivers
20
Group of 707 Nissan Leafs with Access to Workplace Charging2012 – 2013
Days When Vehicles Were Not Parked at Work
Days When Vehicles Were Parked at Work
In aggregate, workplace vehicle drivers had little use for public infrastructure on days when they went to work

Public DC Fast Charger (DCFC) Use• 4th quarter 2013, DCFC weekday use profiles• 95 DCFC, 11,704 charge events, & 109 AC MWh
Weekday Connected Profile
Weekday Demand Profile
• EV Project Leafs 18% charge events and 16% energy used
• 1.3 average charge events per day per DCFC
• 24.6 minutes average time connected • 24.6 minutes average time drawing
energy• 9.3 kWh average energy consumed
per charge
21

DC Fast Charging Impact Study on 2012 Leafs• Quantify in field & lab settings,
impacts on battery performance and life
• DCFC 27% & L2 25% capacity losses at 50k miles/vehicle
• Phoenix heat likely accelerates results - largest decreases in capacity from test before occurred during high heat charging operation
22

DC Fast Charging @ 0, 25 & 50 C Impacts – 2013 Nissan Leaf • After 30 minutes:
• 50 C: 77% SOC• 25 C: 77% SOC• 0 C: 53% SOC
• At charge end:• 50 C: 87% SOC
at 62 minutes• 25 C: 91% SOC
at 67 minutes• 0 C: 91% SOC
at 121 minutes• Total kWh:• 50 C: 17.9 kwh• 25 C: 18.2 kWh• 0 C: 17.4 kWh0 C = 32 F25 C = 77 F50 C = 122 F
Preliminary Data Results23
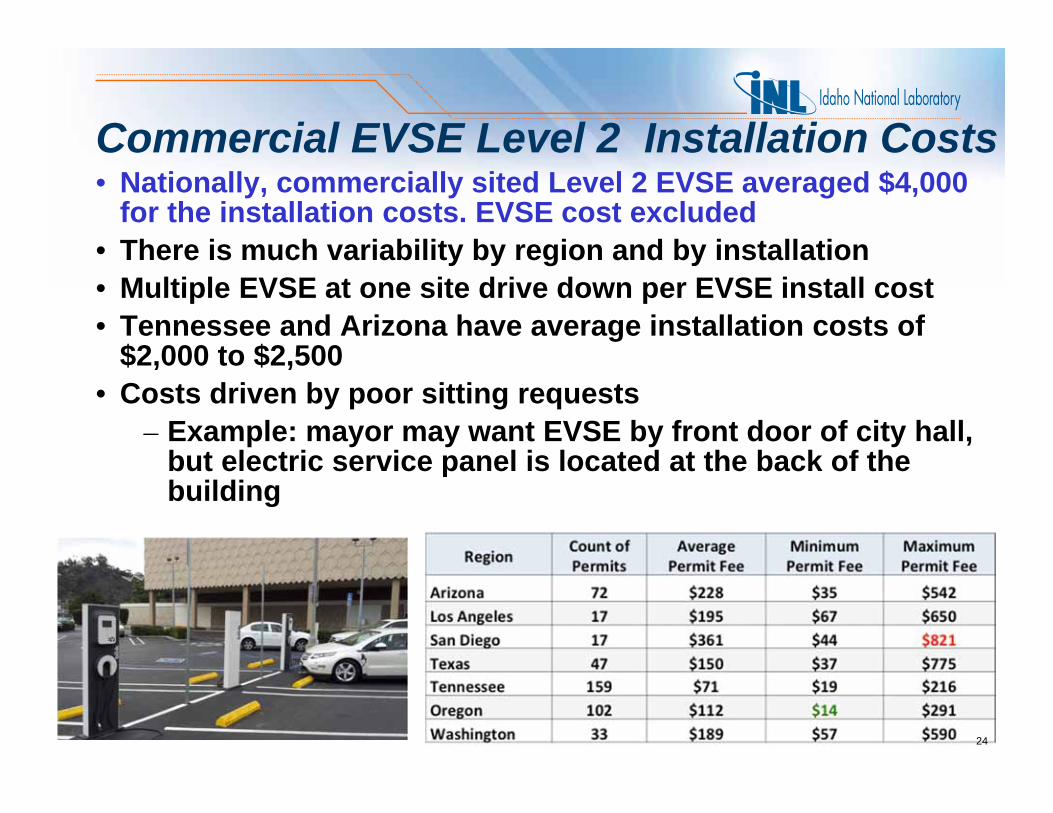
Commercial EVSE Level 2 Installation Costs• Nationally, commercially sited Level 2 EVSE averaged $4,000
for the installation costs. EVSE cost excluded• There is much variability by region and by installation• Multiple EVSE at one site drive down per EVSE install cost• Tennessee and Arizona have average installation costs of
$2,000 to $2,500• Costs driven by poor sitting requests
– Example: mayor may want EVSE by front door of city hall, but electric service panel is located at the back of the building
24
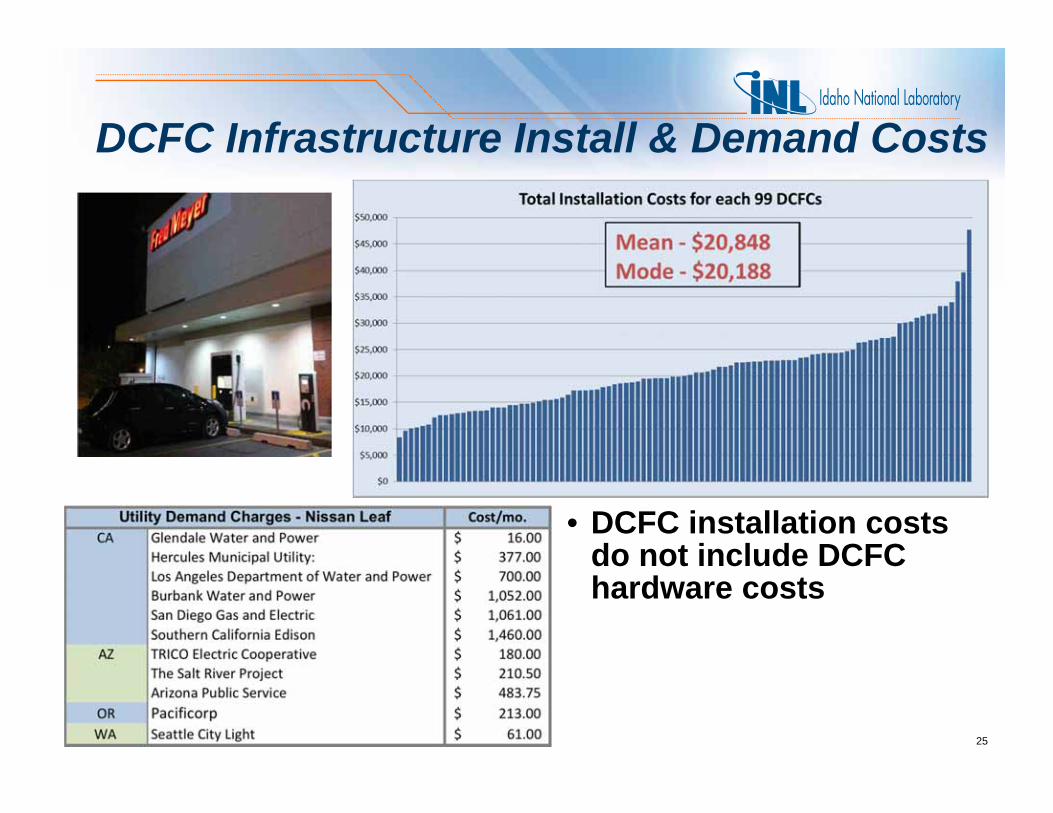
DCFC Infrastructure Install & Demand Costs
• DCFC installation costs do not include DCFC hardware costs
25
Additional Information
For publications and general plug-in electric vehicle performance, visithttp://avt.inl.gov
26