Embed Size (px)
Citation preview
Plot Scale
© Oregon State University
Isotope Hydrology Shortcourse
Prof. Jeff McDonnellRichardson Chair in Watershed Science
Dept. of Forest Engineering
Oregon State University
HydrologicModels
Isotopes in Hydrological Models

Plot Scale
© Oregon State University
Outline
Day 1 Morning: Introduction, Isotope Geochemistry Basics Afternoon: Isotope Geochemistry Basics ‘cont, Examples
Day 2 Morning: Groundwater Surface Water Interaction, Hydrograph separation
basics, time source separations, geographic source separations, practical issues
Afternoon: Processes explaining isotope evidence, groundwater ridging, transmissivity feedback, subsurface stormflow, saturation overland flow
Day 3 Morning: Mean residence time computation Afternoon: Stable isotopes in watershed models, mean residence time and
model strcutures, two-box models with isotope time series, 3-box models and use of isotope tracers as soft data
Day 4 Field Trip to Hydrohill or nearby research site
Catchment Scale
IsotopeBasics
ConcludingStatementsHydrologic
Models
Plot Scale
© Oregon State University
Example 1
HydrologicModels

Plot Scale
© Oregon State University
Svartberget Sweden
Isotopes in model validation

Plot Scale
© Oregon State University
Svartberget Sweden
Isotopes in model validation
Plot Scale
© Oregon State University
Example 2
HydrologicModels
Plot Scale
© Oregon State University
Maimai New Zealand
Isotopes in model calibration
Plot Scale
© Oregon State University
Catchment
Scale
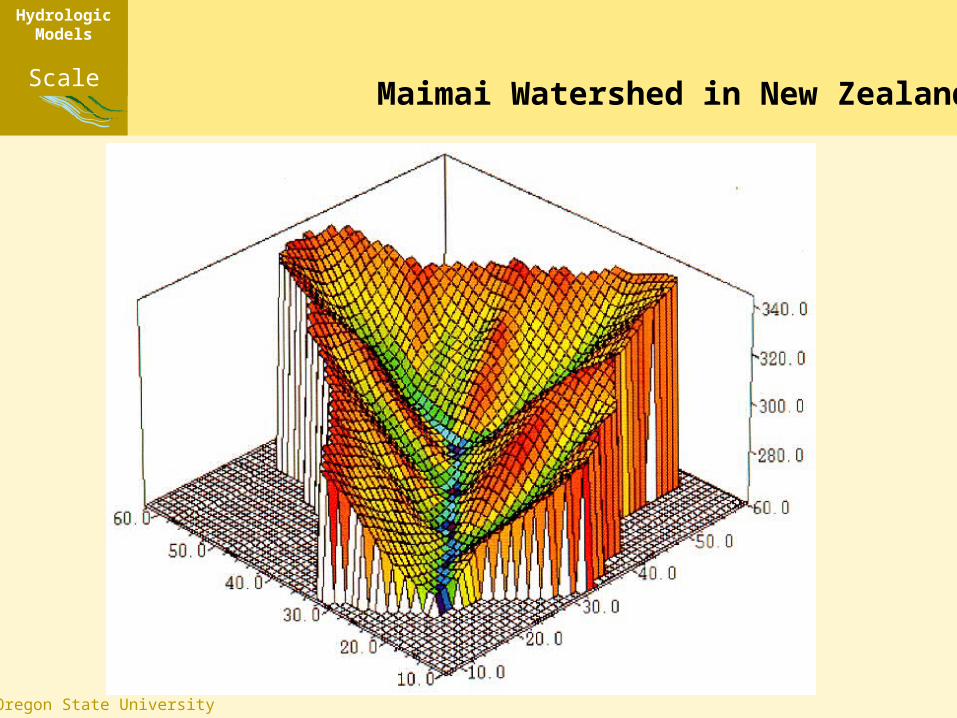
Maimai Watershed in New Zealand
HydrologicModels
Plot Scale
© Oregon State University
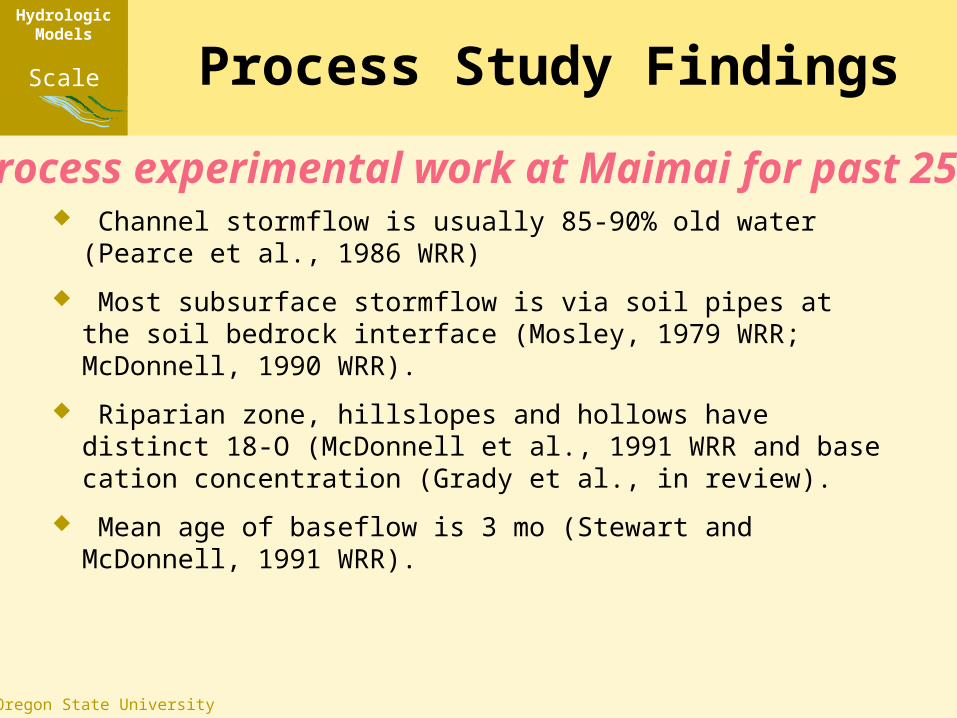
Process Study Findings
Channel stormflow is usually 85-90% old water (Pearce et al., 1986 WRR)
Most subsurface stormflow is via soil pipes at the soil bedrock interface (Mosley, 1979 WRR; McDonnell, 1990 WRR).
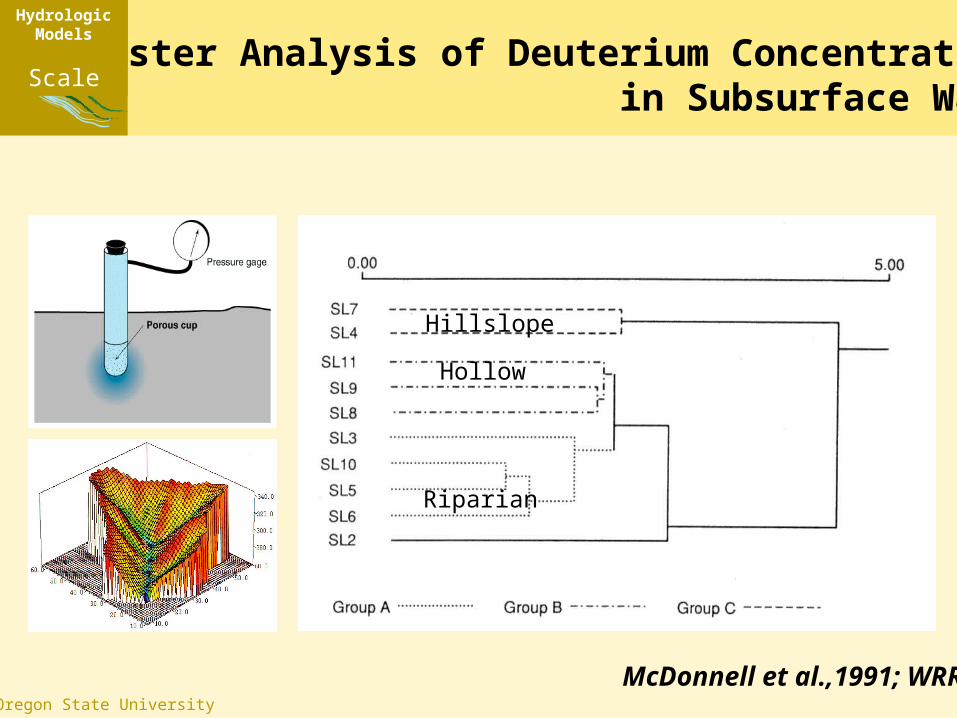
Riparian zone, hillslopes and hollows have distinct 18-O (McDonnell et al., 1991 WRR and base cation concentration (Grady et al., in review).
Mean age of baseflow is 3 mo (Stewart and McDonnell, 1991 WRR).
…process experimental work at Maimai for past 25 yr
Catchment Scale
HydrologicModels
Plot Scale
© Oregon State University
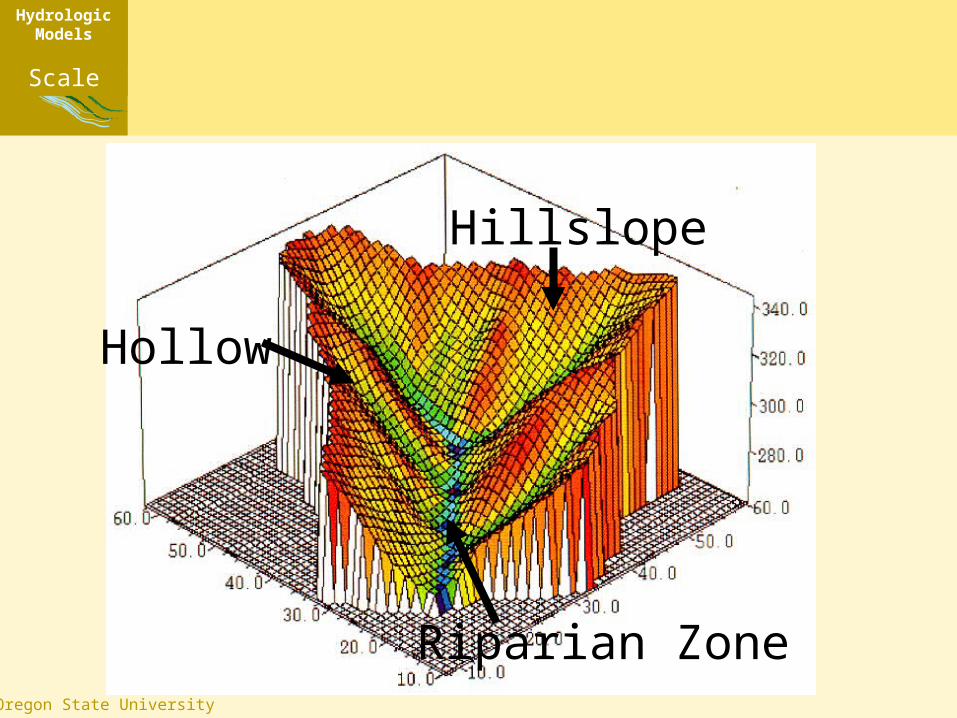
Hillslope
Riparian Zone
Hollow
Catchment Scale
HydrologicModels
Plot Scale
© Oregon State University
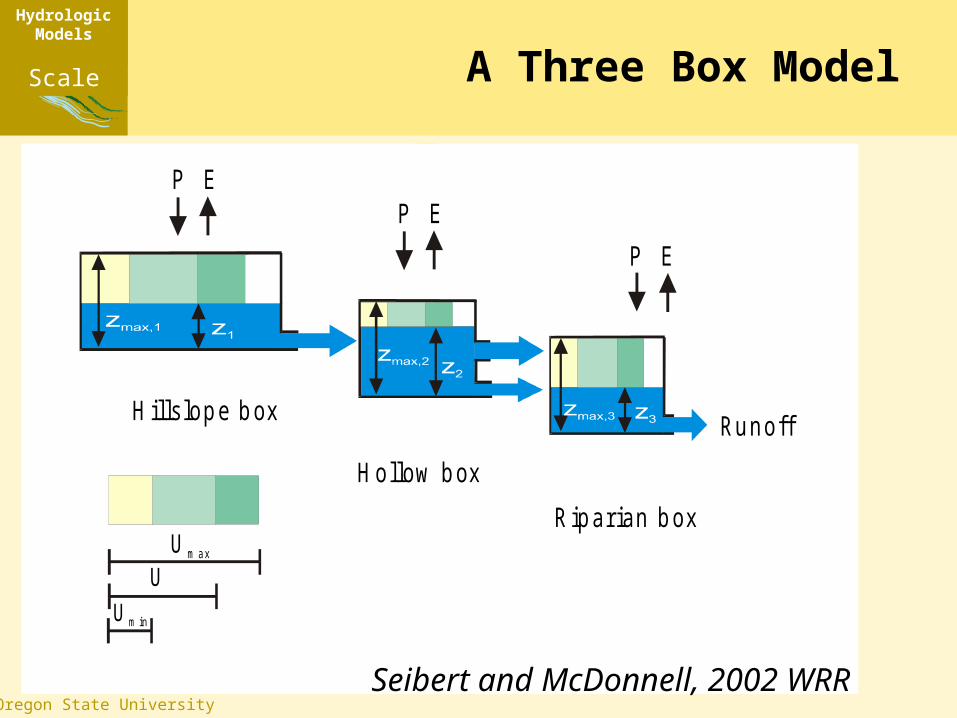
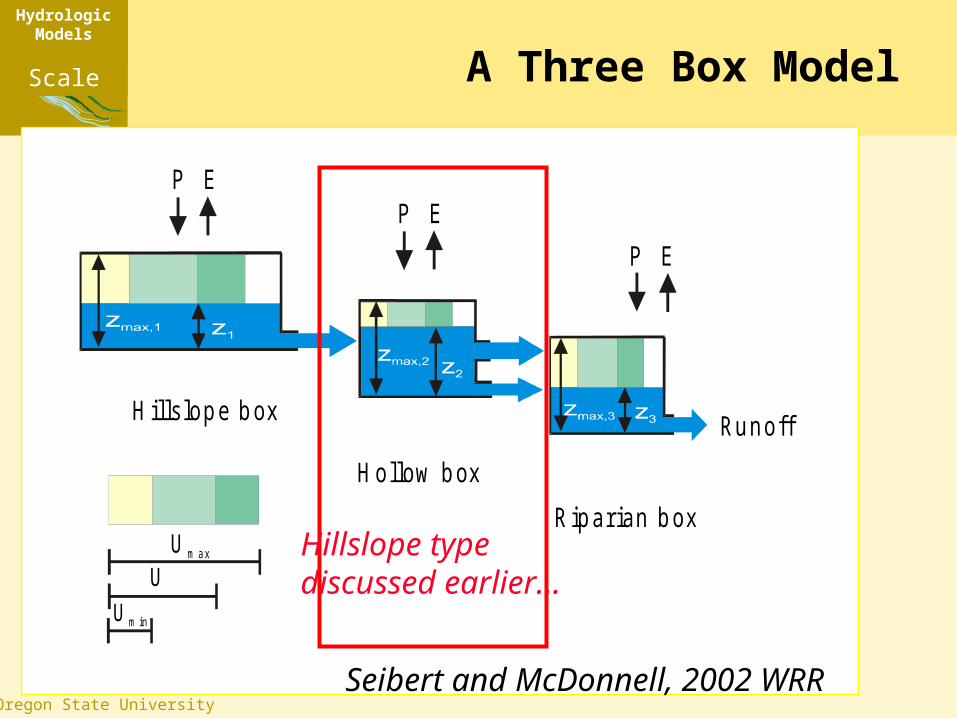
A Three Box Model
H ills lope box
R iparian box
P E
Runoff
U m ax
UU m in
H ollow box
P E
P E
Seibert and McDonnell, 2002 WRR
Catchment Scale
HydrologicModels
Plot Scale
© Oregon State University
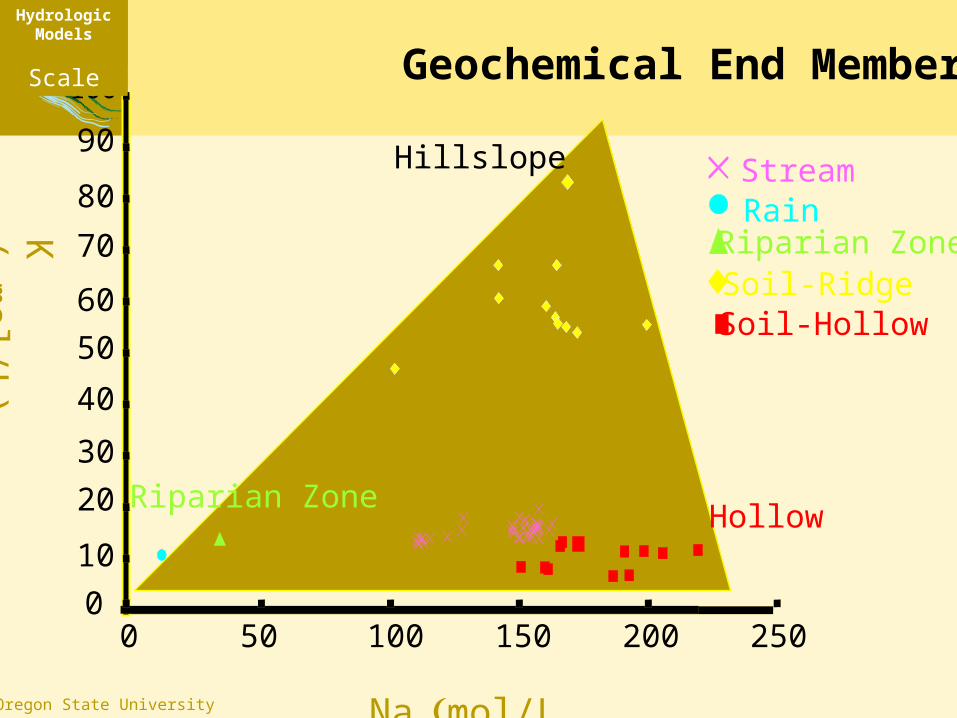
Namol/L)
0
10
20
30
40
50
60
70
80
90
100
K (
mol/L)
StreamRainRiparian ZoneSoil-RidgeSoil-Hollow
0 50 100 150 200 250
Riparian ZoneHollow
Hillslope
Geochemical End MembersCatchment
Scale
HydrologicModels
Plot Scale
© Oregon State University
McDonnell et al.,1991; WRR)
Hillslope
Hollow
Riparian
Cluster Analysis of Deuterium Concentration in Subsurface Water
Catchment Scale
HydrologicModels
Plot Scale
© Oregon State University
A Three Box Model
H ills lope box
R iparian box
P E
Runoff
U m ax
UU m in
H ollow box
P E
P E
Hillslope typediscussed earlier…
Seibert and McDonnell, 2002 WRR
Catchment Scale
HydrologicModels
Plot Scale
© Oregon State University
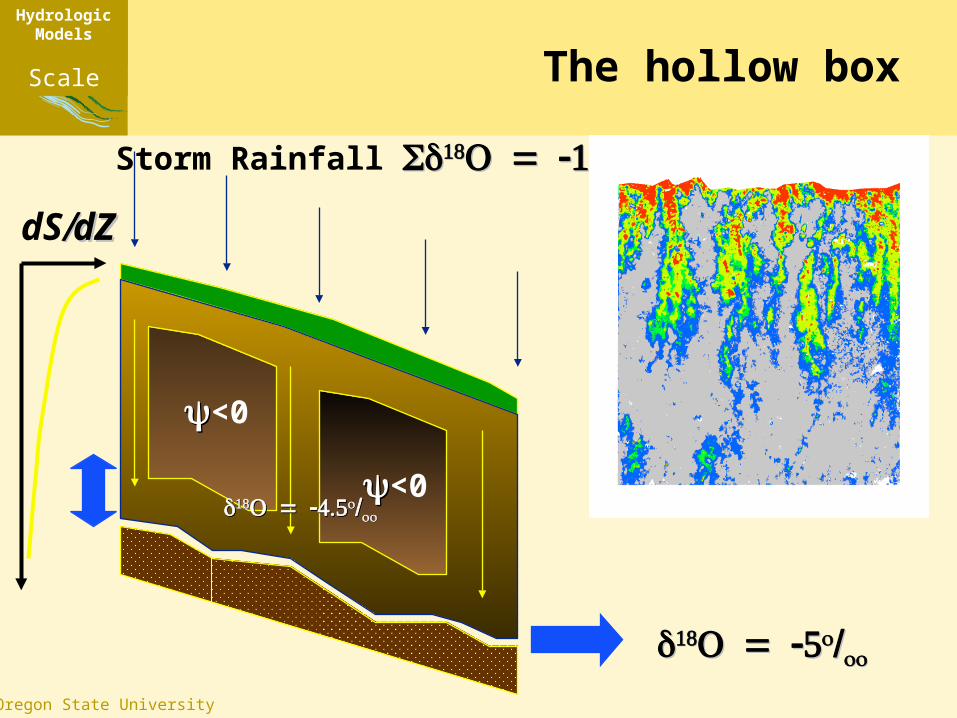
The hollow box
<0
<0
dSdZdZ
Storm Rainfall
Catchment Scale
HydrologicModels
Plot Scale
© Oregon State University
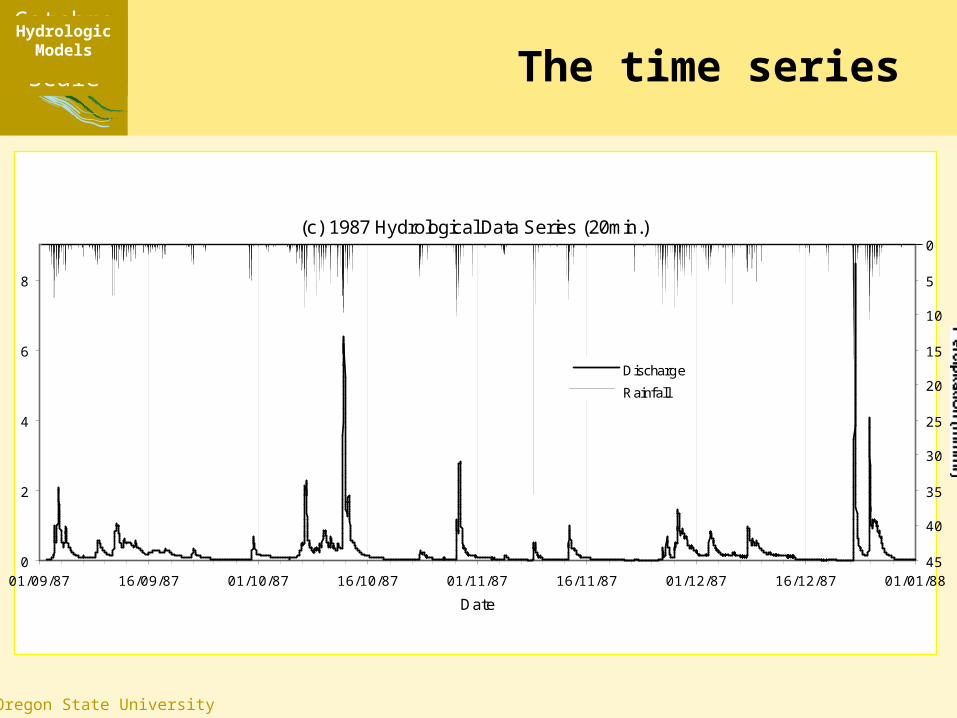
The time series
(c) 1987 Hydrological Data Series (20min.)
0
2
4
6
8
01/09/87 16/09/87 01/10/87 16/10/87 01/11/87 16/11/87 01/12/87 16/12/87 01/01/88
Date
0
5
10
15
20
25
30
35
40
45
Discharge
Rainfall
Catchment Scale
HydrologicModels
Plot Scale
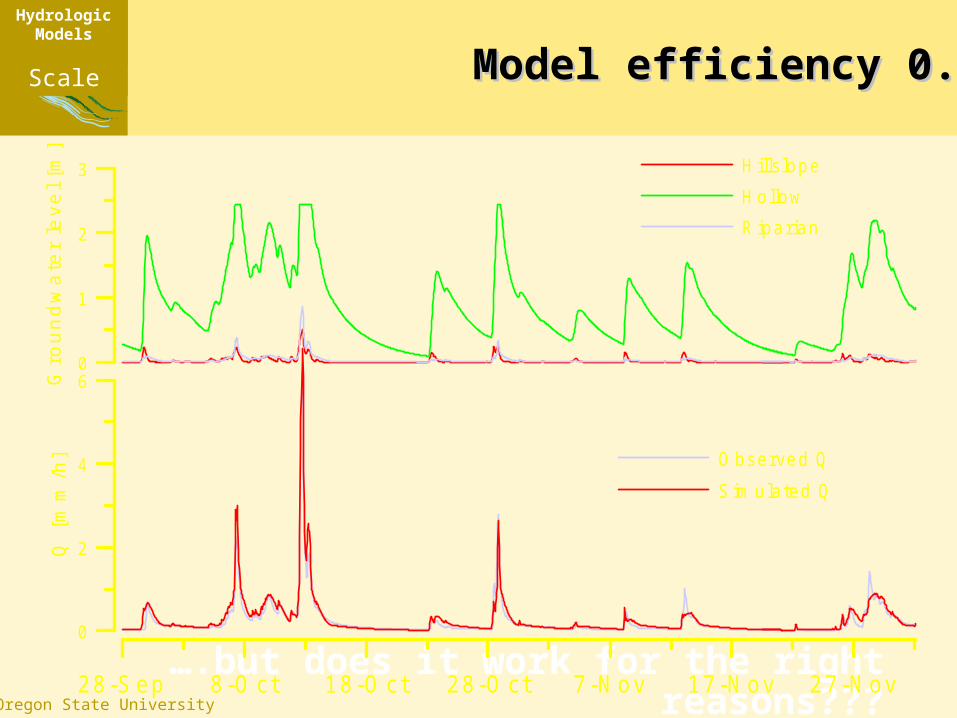
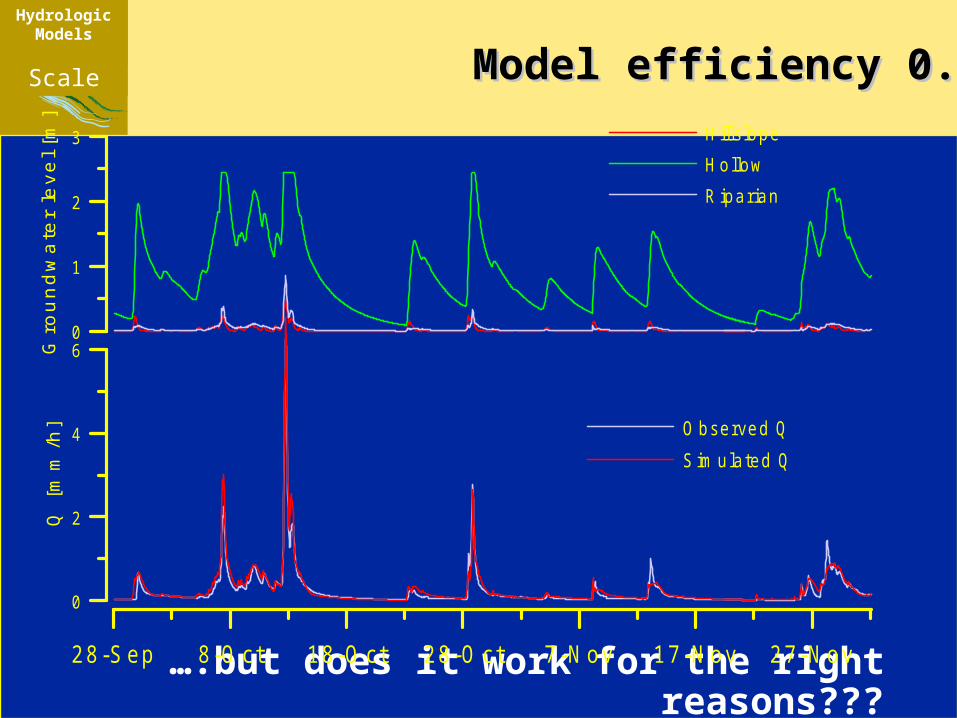
© Oregon State University….but does it work for the right reasons???28-Sep 8-O ct 18-O ct 28-O ct 7-N ov 17-N ov 27-N ov
0
2
4
6
Q [
mm
/h]
0
1
2
3
Gro
undw
ater
leve
l [m
]
O bserved QSim ulated Q
Hills lopeHollowR iparian
Model efficiency 0.93Model efficiency 0.93Catchment
Scale
HydrologicModels
Plot Scale
© Oregon State University
But does this agree with our conceptual picture of the how the watershed works based on our isotope information????
HydrologicModels
Plot Scale
© Oregon State University
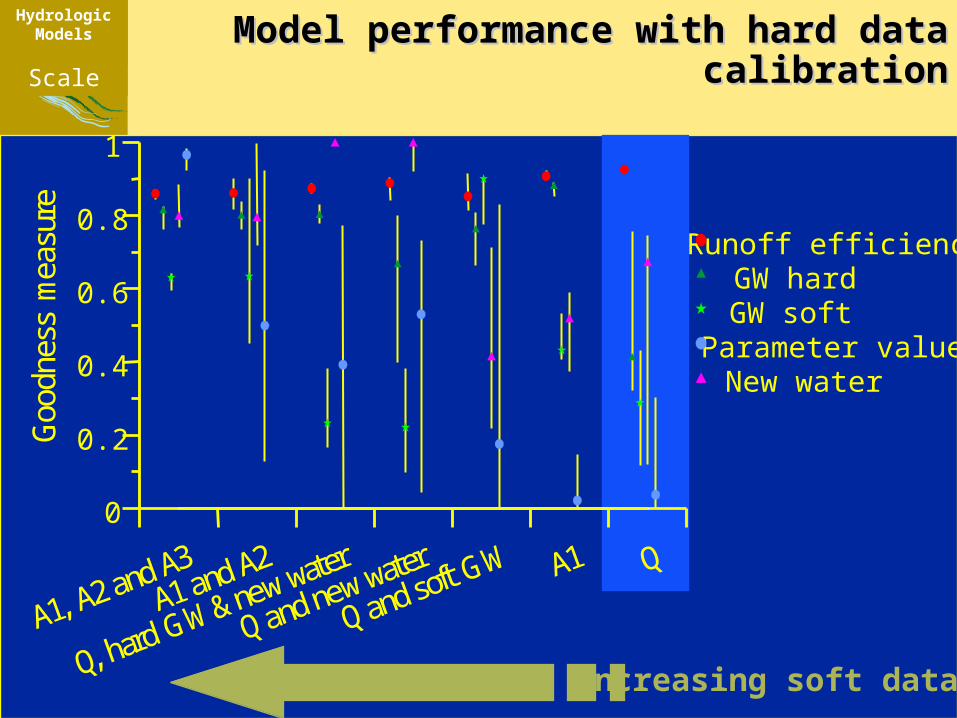
Model performance with hard data Model performance with hard data calibrationcalibration
0
0.2
0.4
0.6
0.8
1
Goo
dnes
s m
easu
re
A1, A2 and A3A1 and A2
Q, hard GW & new water
Q and new water
Q and soft GW A1 Q
Runoff efficiencyGW hardGW soft
Parameter valuesNew water
Increasing soft data
Catchment Scale
HydrologicModels
Plot Scale
© Oregon State University
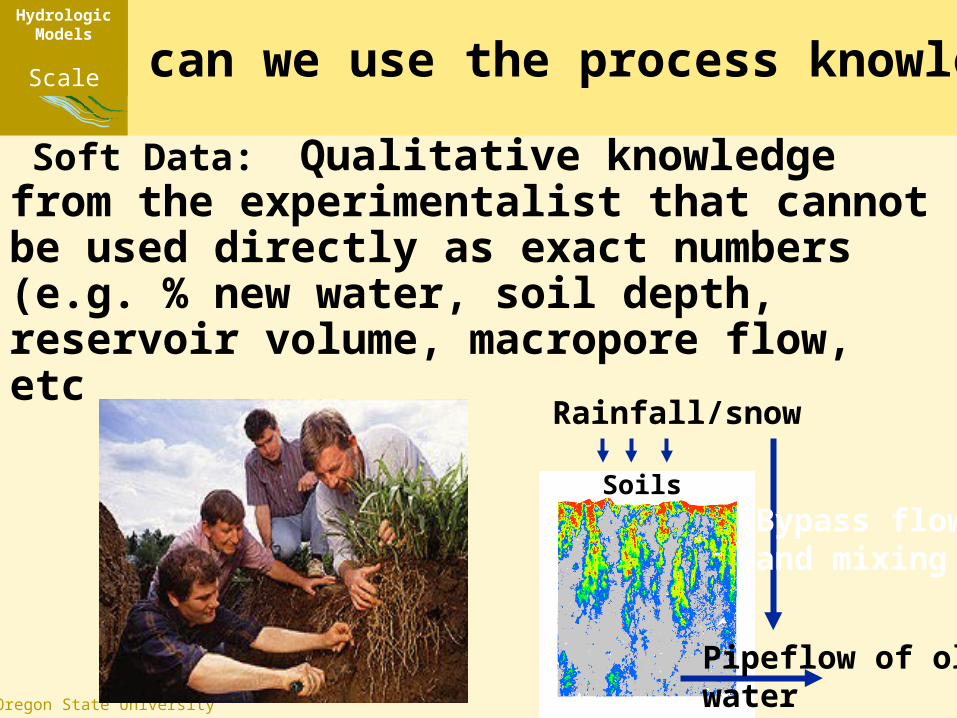
Soft Data: Qualitative knowledge from the experimentalist that cannot be used directly as exact numbers (e.g. % new water, soil depth, reservoir volume, macropore flow, etc
Bypass flowand mixing
Pipeflow of oldwater
Rainfall/snow
How can we use the process knowledge
Soils
Catchment Scale
HydrologicModels
Plot Scale
© Oregon State University
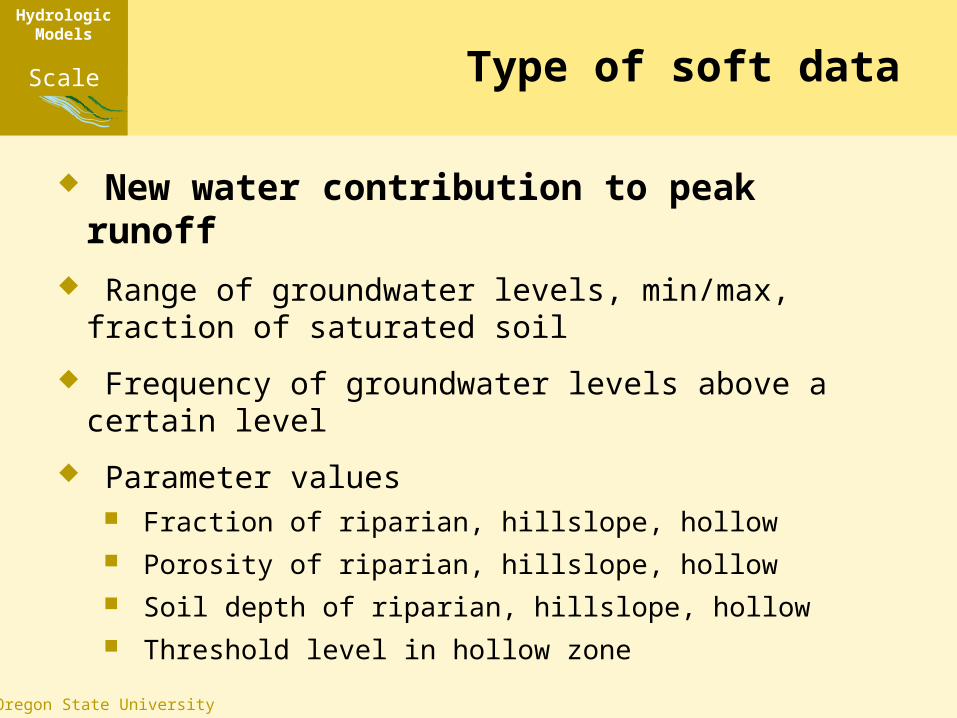
Type of soft data
New water contribution to peak runoff
Range of groundwater levels, min/max, fraction of saturated soil
Frequency of groundwater levels above a certain level
Parameter values Fraction of riparian, hillslope, hollow Porosity of riparian, hillslope, hollow Soil depth of riparian, hillslope, hollow Threshold level in hollow zone
Catchment Scale
HydrologicModels
Plot Scale
© Oregon State University
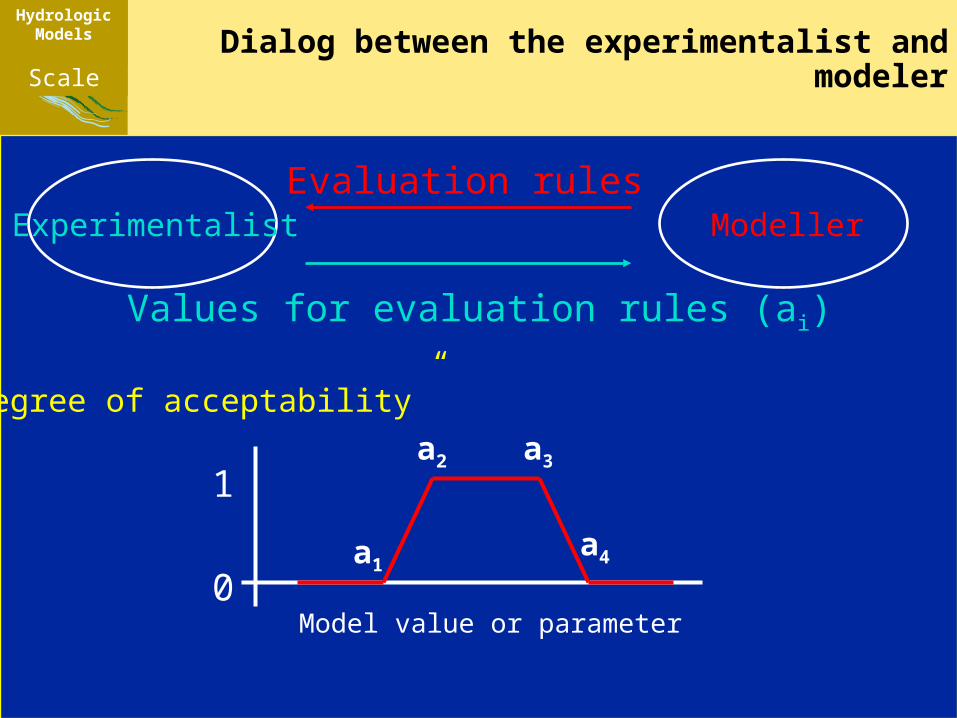
Dialog between the experimentalist and modeler
Experimentalist ModellerEvaluation rules
Values for evaluation rules (ai)
a1
a2 a3
a4
0
1
Model value or parameter
“Degree of acceptability”
Catchment Scale
HydrologicModels
Plot Scale
© Oregon State University
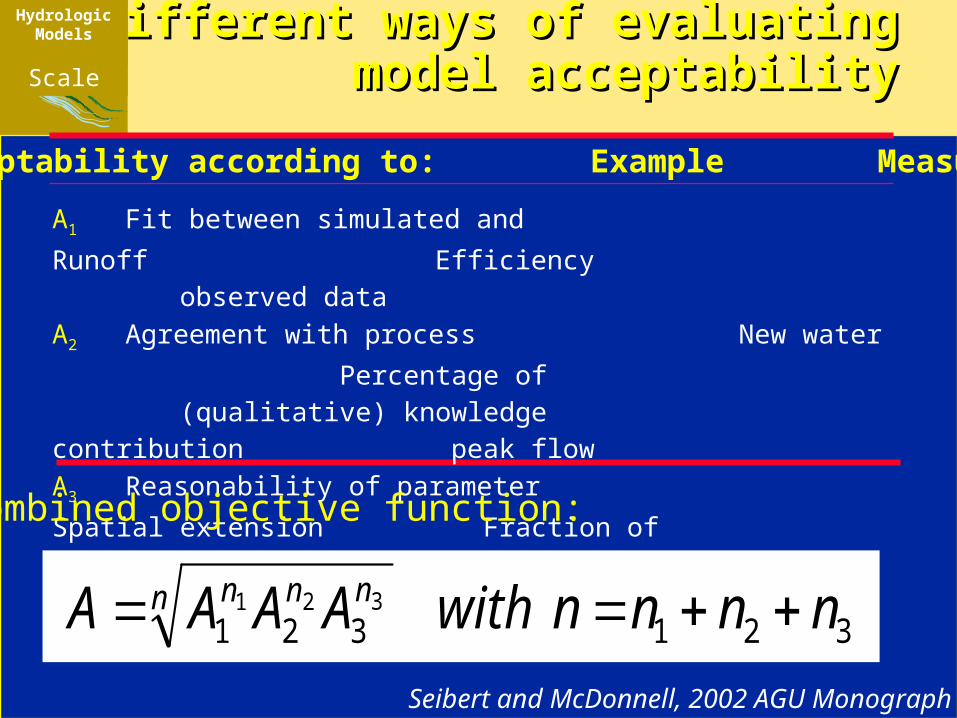
Different ways of evaluating Different ways of evaluating model acceptabilitymodel acceptability
Acceptability according to: Example Measure
A1 Fit between simulated and Runoff
Efficiency observed dataA2 Agreement with process New water
Percentage of (qualitative) knowledge contribution peak flowA3 Reasonability of parameter Spatial extension
Fraction of values according to of riparian zone catchment area experimentalist 321321
321 nnnnwithAAAA n nnn
Combined objective function:
Seibert and McDonnell, 2002 AGU Monograph
Catchment Scale
HydrologicModels
Plot Scale
© Oregon State University
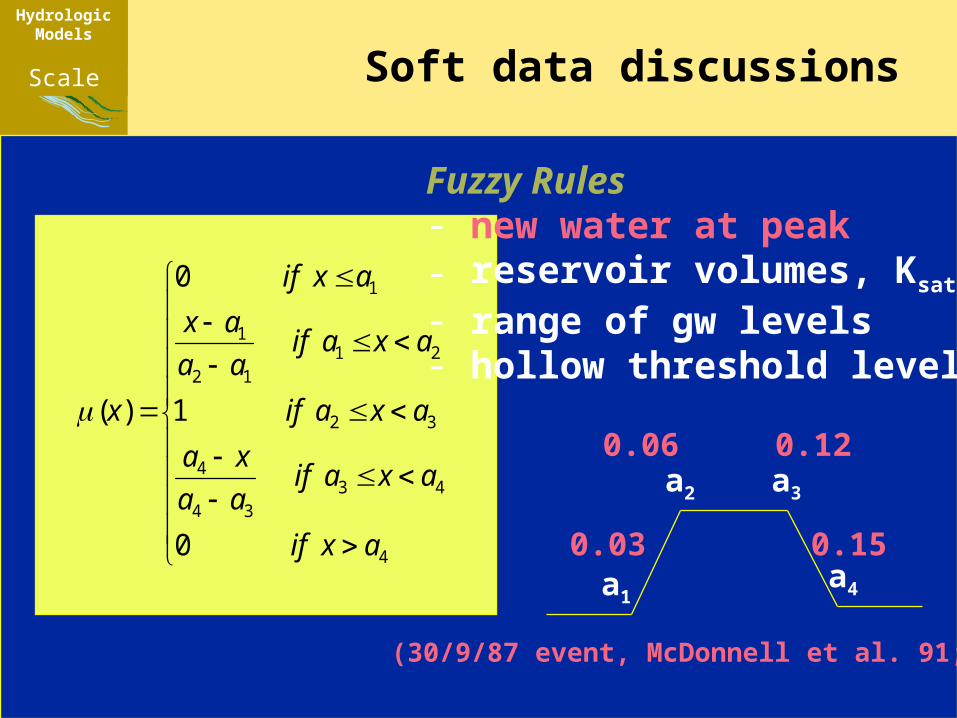
Soft data discussions
4
4334
4
32
2112
1
1
0
1
0
)(
axif
axaifaa
xa
axaif
axaifaa
ax
axif
x
a1
a2 a3
a4
Fuzzy Rules- new water at peak- reservoir volumes, Ksat etc- range of gw levels- hollow threshold level
0.03
0.06 0.12
0.15
(30/9/87 event, McDonnell et al. 91; WRR)
Catchment Scale
HydrologicModels

Plot Scale
© Oregon State University
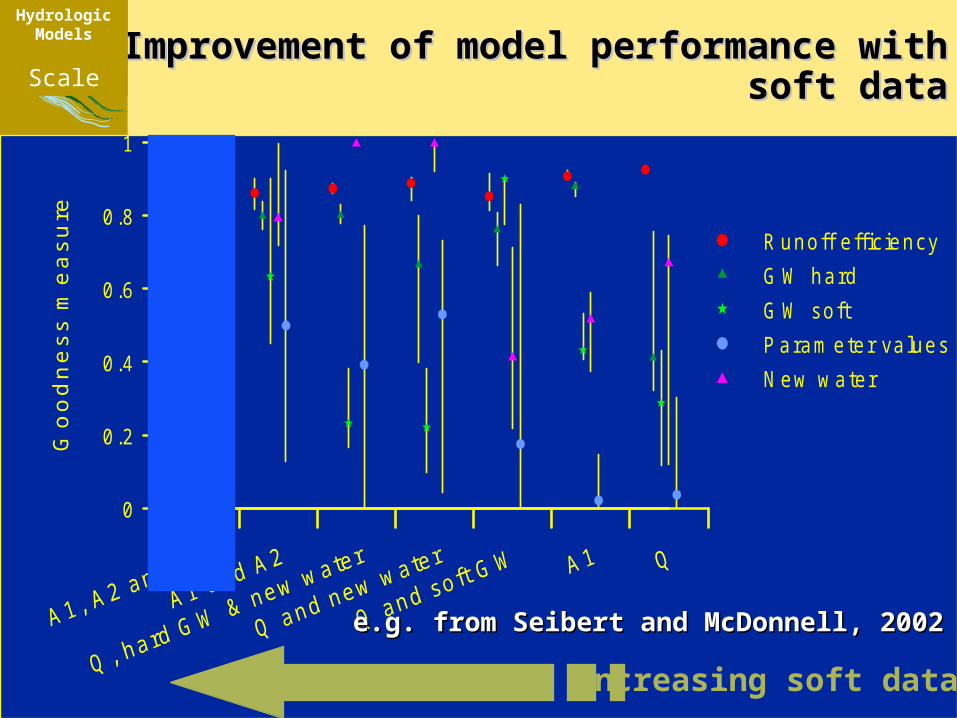
Improvement of model performance with Improvement of model performance with soft datasoft data
0
0.2
0.4
0.6
0.8
1
Goo
dnes
s m
easu
re
R unoff effic iencyG W hardG W softParam eter va luesN ew w ater
Increasing soft data
e.g. from Seibert and McDonnell, 2002 WRRe.g. from Seibert and McDonnell, 2002 WRR
Catchment Scale
HydrologicModels
Plot Scale
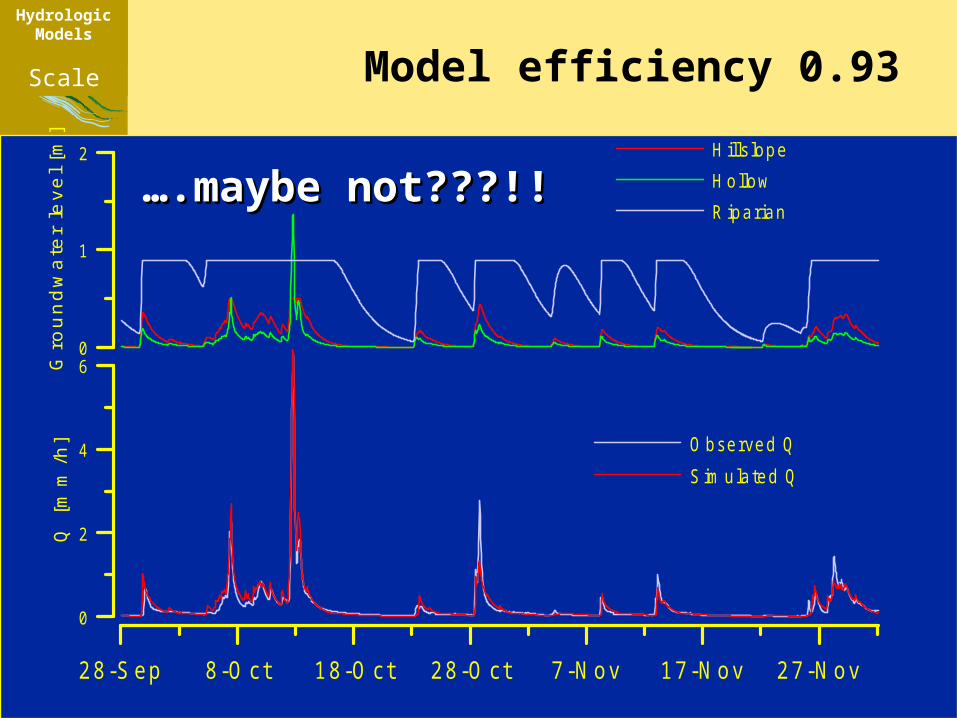
© Oregon State University….but does it work for the right reasons???
28-Sep 8-O ct 18-O ct 28-O ct 7-Nov 17-N ov 27-N ov
0
2
4
6
Q [
mm
/h]
0
1
2
3
Gro
undw
ater
leve
l [m
]
O bserved QSim ulated Q
H ills lopeH ollowR iparian
Model efficiency 0.93Model efficiency 0.93Catchment
Scale
HydrologicModels
Plot Scale
© Oregon State University
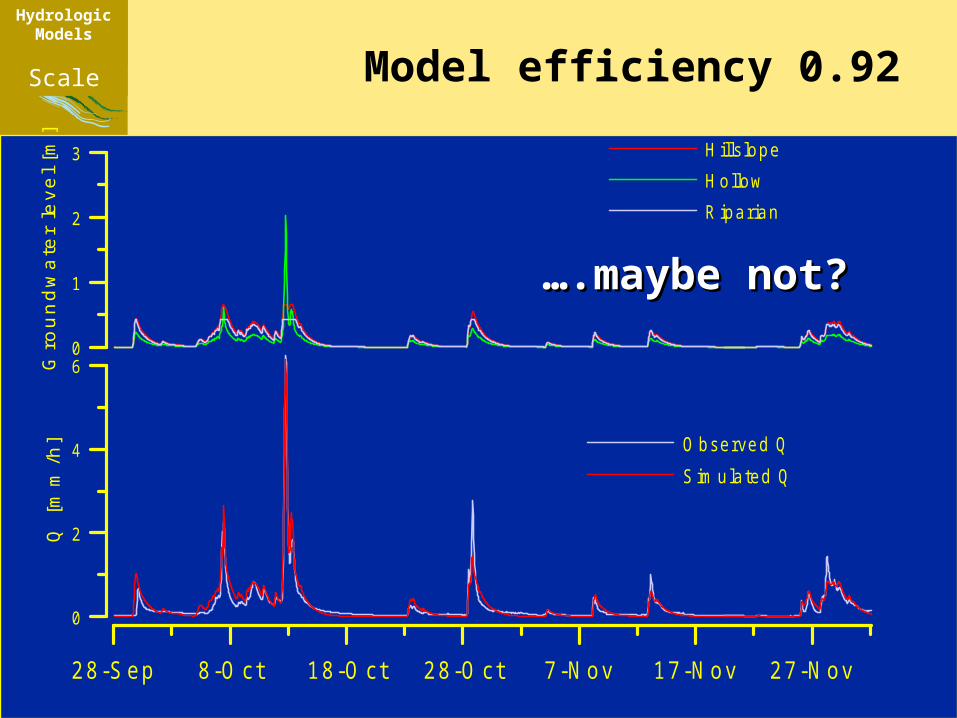
Model efficiency 0.92
28-Sep 8-O ct 18-O ct 28-O ct 7-Nov 17-N ov 27-N ov
0
2
4
6
Q [
mm
/h]
0
1
2
3
Gro
undw
ater
leve
l [m
]
O bserved QSim ulated Q
H ills lopeH ollowR iparian
…….maybe not?.maybe not?
Catchment Scale
HydrologicModels
Plot Scale
© Oregon State University
Model efficiency 0.93
28-Sep 8-O ct 18-O ct 28-O ct 7-Nov 17-N ov 27-N ov
0
2
4
6
Q [
mm
/h]
0
1
2
Gro
undw
ater
leve
l [m
]
O bserved QSim ulated Q
H ills lopeH ollowR iparian
…….maybe not???!!.maybe not???!!
Catchment Scale
HydrologicModels
Plot Scale
© Oregon State University
Improvement of model performance with Improvement of model performance with soft datasoft data
0
0.2
0.4
0.6
0.8
1
Goo
dnes
s m
easu
re
R unoff effic iencyG W hardG W softParam eter va luesN ew w ater
Increasing soft data
e.g. from Seibert and McDonnell, 2002 WRRe.g. from Seibert and McDonnell, 2002 WRR
Catchment Scale
HydrologicModels
Plot Scale
© Oregon State University
Example 3
Catchment Scale
HydrologicModels
Plot Scale
© Oregon State University
Brugga Basin, Germany
Isotopes in model structure
Plot Scale
© Oregon State University
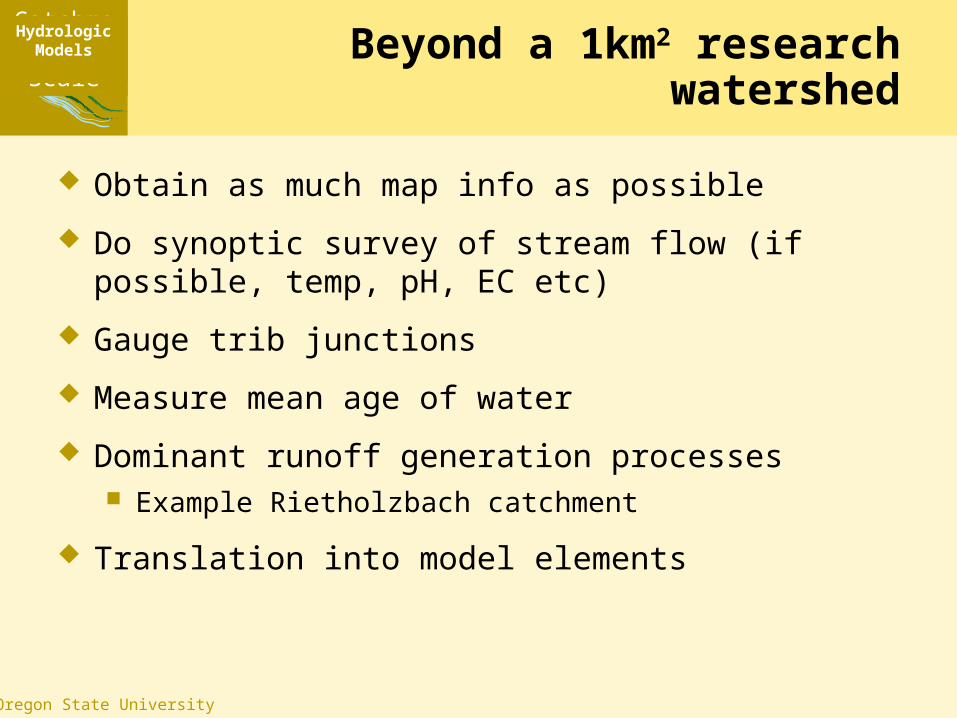
Beyond a 1km2 research watershed
Obtain as much map info as possible
Do synoptic survey of stream flow (if possible, temp, pH, EC etc)
Gauge trib junctions
Measure mean age of water
Dominant runoff generation processes Example Rietholzbach catchment
Translation into model elements
Catchment Scale
HydrologicModels
Plot Scale
© Oregon State University
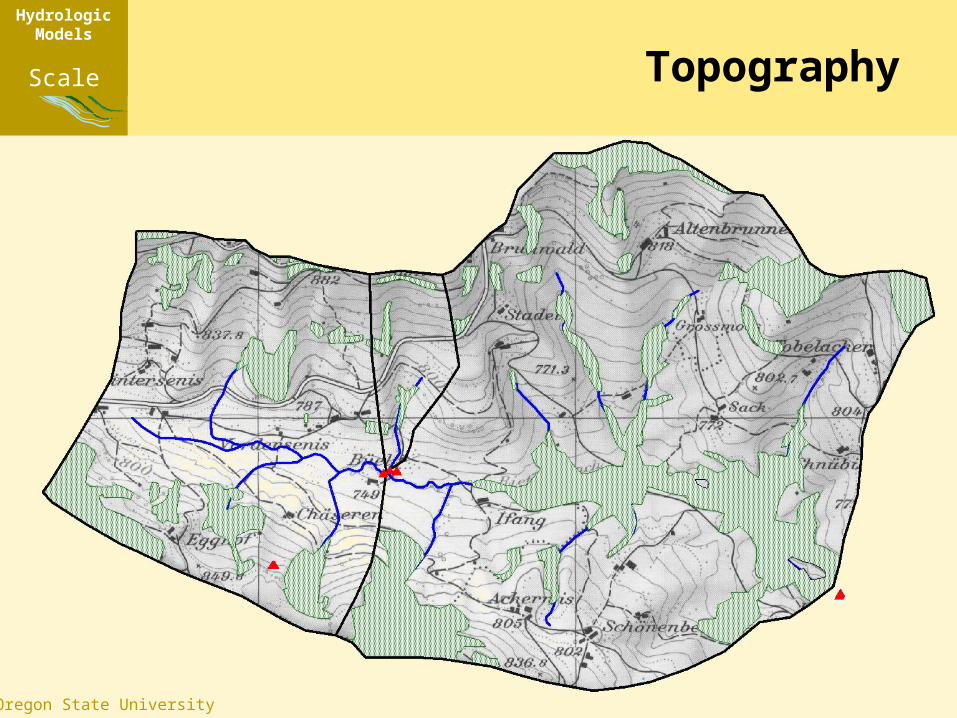
TopographyCatchment
Scale
HydrologicModels
Plot Scale
© Oregon State University
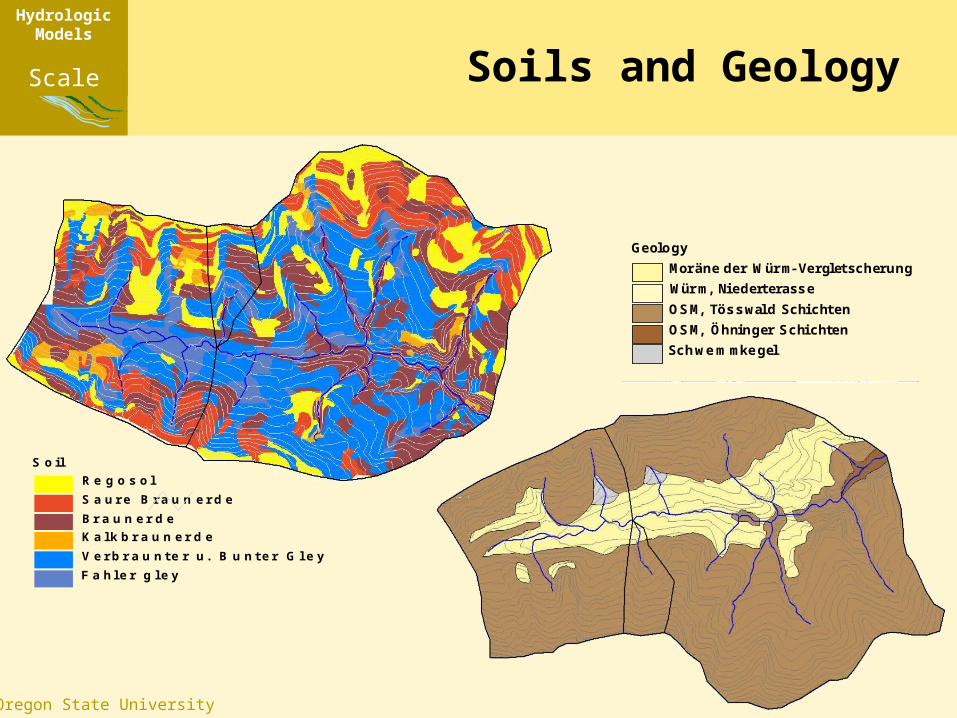
Soils and Geology
S o il
R e g o s o l
S a u r e B r a u n e r d e
B r a u n e r d e
K a lk b r a u n e r d e
V e r b r a u n t e r u . B u n t e r G l e y
F a h le r g le y
Geology
Moräne der W ürm-Vergletscherung
Würm, Niederterasse
OSM, Tösswald Schichten
OSM, Öhninger Schichten
Schw emmkegel
Catchment Scale
HydrologicModels
Plot Scale
© Oregon State University
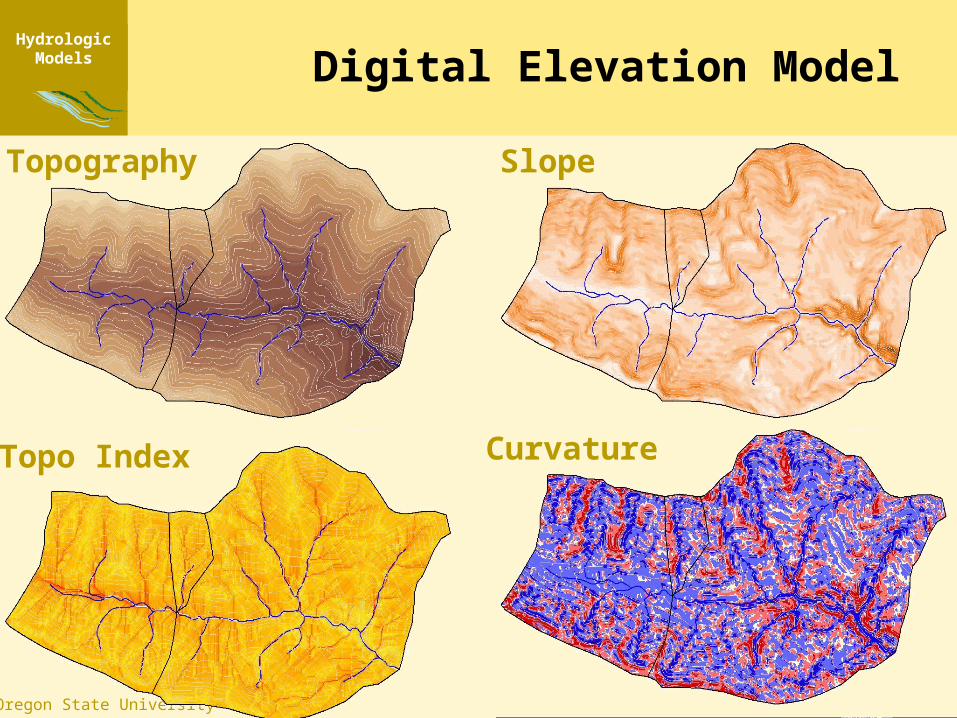
Digital Elevation Model
Topo Index
Topography Slope
Curvature
HydrologicModels
Plot Scale
© Oregon State University
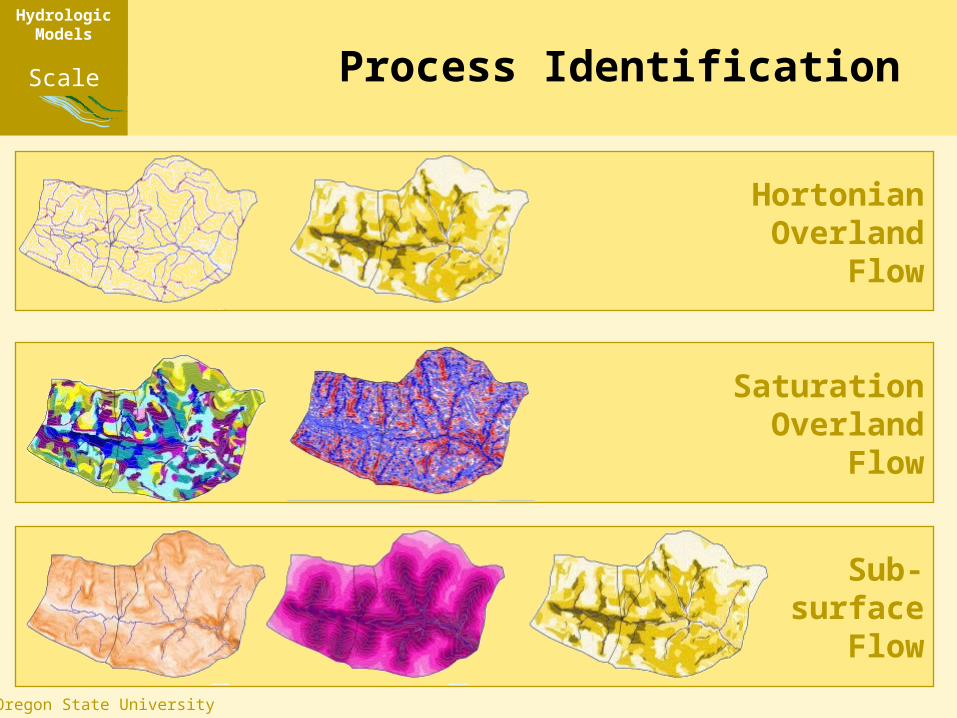
HortonianOverland
Flow
SaturationOverland
Flow
Sub-surface
Flow
Process IdentificationCatchment
Scale
HydrologicModels
Plot Scale
© Oregon State University
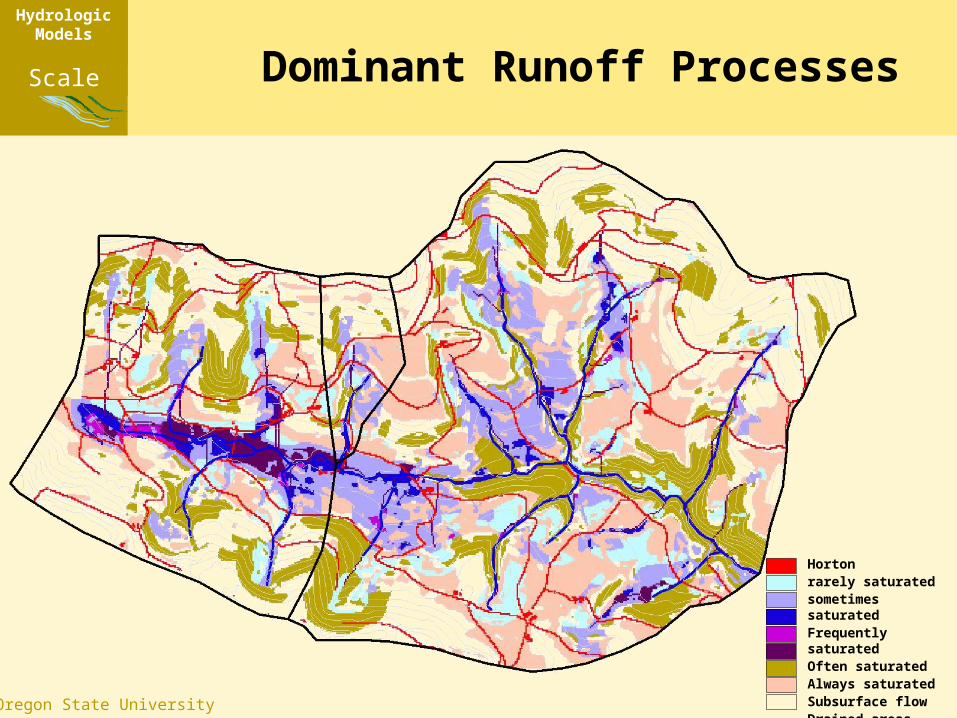
Dominant Runoff Processes
Hortonrarely saturatedsometimes saturatedFrequently saturatedOften saturatedAlways saturatedSubsurface flowDrained areasNo runoff
Catchment Scale
HydrologicModels
Plot Scale
© Oregon State University
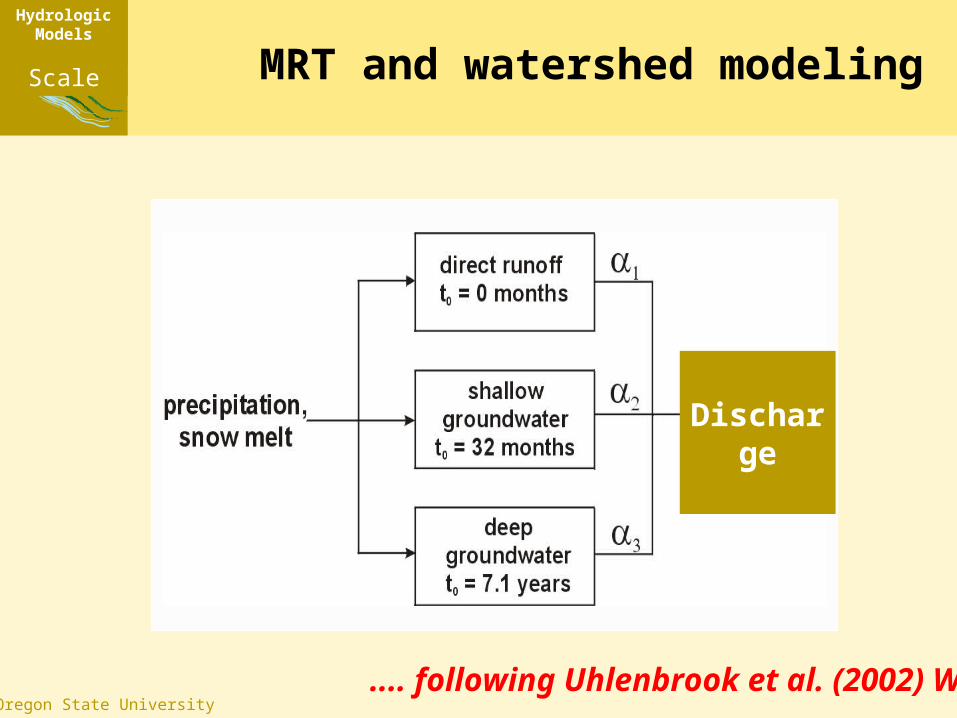
MRT and watershed modeling
.... following Uhlenbrook et al. (2002) WRR
Discharge
Catchment Scale
HydrologicModels
Plot Scale
© Oregon State University
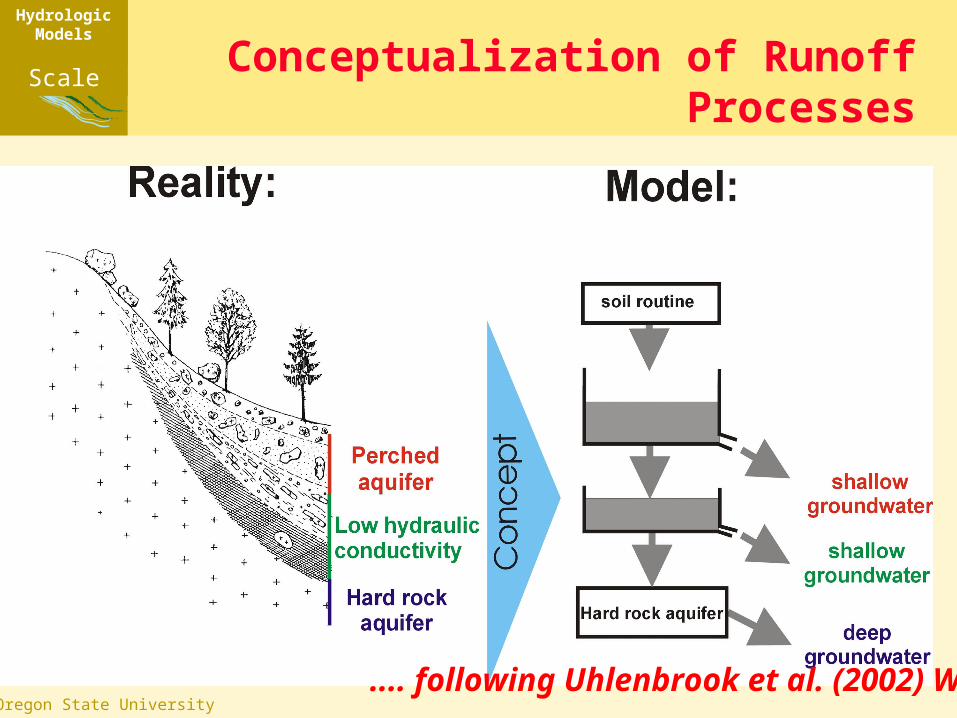
Conceptualization of Runoff Processes
.... following Uhlenbrook et al. (2002) WRR
Catchment Scale
HydrologicModels
Plot Scale
© Oregon State University
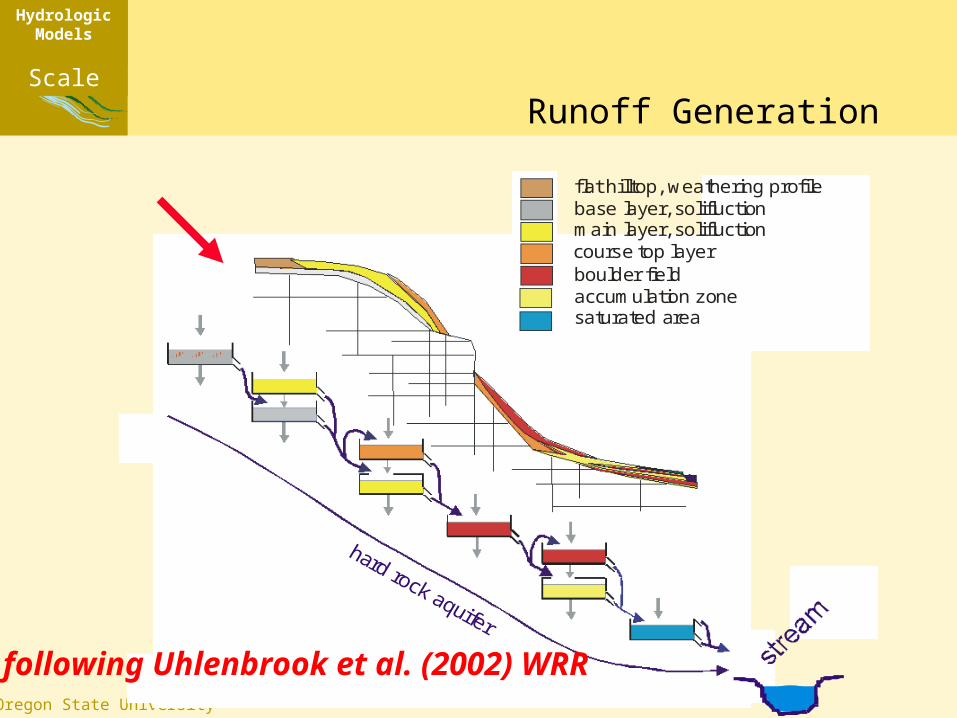
Runoff Generation
flat hilltop, weathering profile base layer, solifluction main layer, solifluction course top layer boulder fieldaccumulation zonesaturated area
.... following Uhlenbrook et al. (2002) WRR
Catchment Scale
HydrologicModels
Plot Scale
© Oregon State University
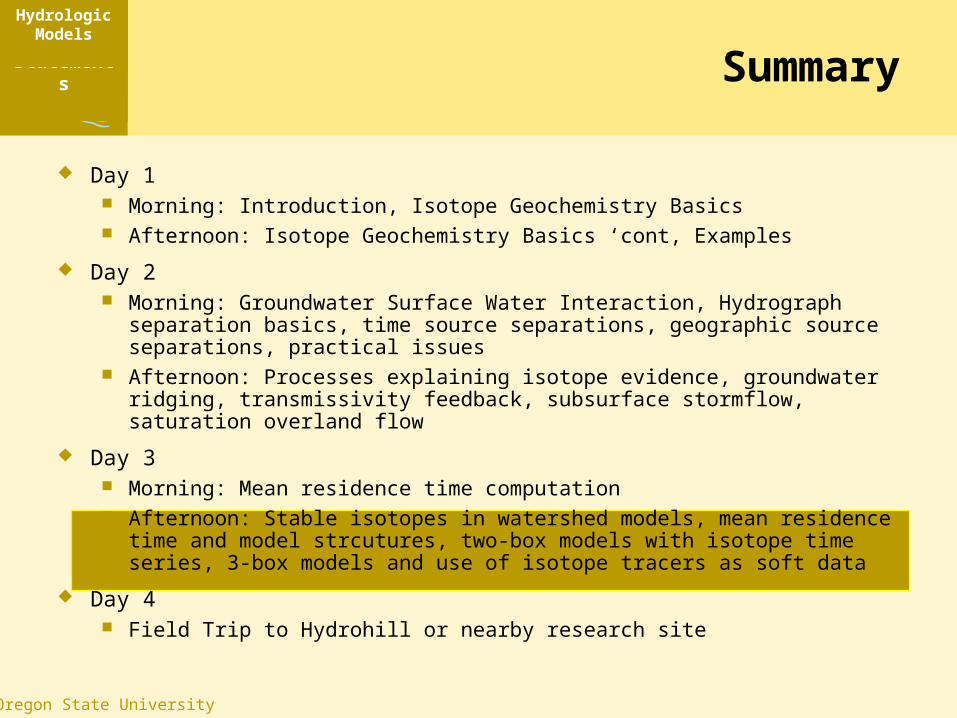
Summary
Day 1 Morning: Introduction, Isotope Geochemistry Basics Afternoon: Isotope Geochemistry Basics ‘cont, Examples
Day 2 Morning: Groundwater Surface Water Interaction, Hydrograph separation
basics, time source separations, geographic source separations, practical issues
Afternoon: Processes explaining isotope evidence, groundwater ridging, transmissivity feedback, subsurface stormflow, saturation overland flow
Day 3 Morning: Mean residence time computation Afternoon: Stable isotopes in watershed models, mean residence time and
model strcutures, two-box models with isotope time series, 3-box models and use of isotope tracers as soft data
Day 4 Field Trip to Hydrohill or nearby research site
Catchment Scale
IsotopeBasics
ConcludingStatementsHydrologic
Models