Embed Size (px)
Citation preview
1
Finding Genes with Genomics Technologies
PLNT2530 Plant Biotechnology2020Unit 7
Unless otherwise cited or referenced, all content of this presenataion is licensed under the Creative Commons License Attribution Share-Alike 2.5 Canada
2
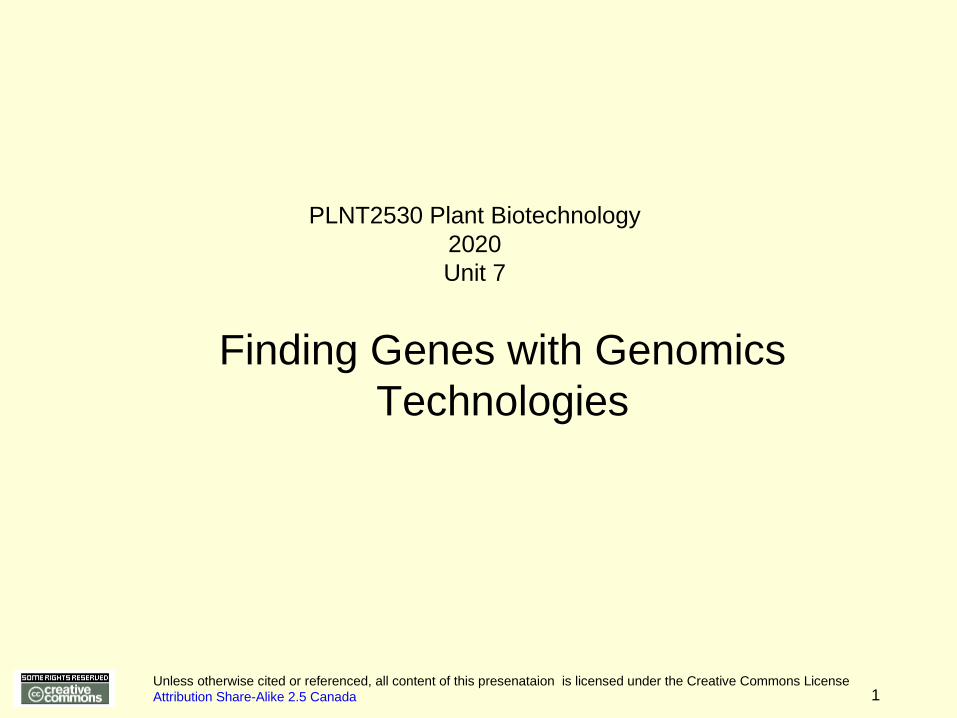
“Omics” technologies
Technology Description What you learn
Genomics High throughput DNA sequencing of genomic DNA
which genes are present in an organism, and which alleles
Transcriptomics High throughput sequencing of RNA populations
which genes are transcribed in a tissue, cell type, or in response to environmental stimuli
Proteomics Identification of proteins in a protein population using mass spectrometry of oligopeptides
which proteins are expressed
Metabolomics Identification of metabolites in cells
which biochemical products are produced, allowing inference of biochemical pathways
3
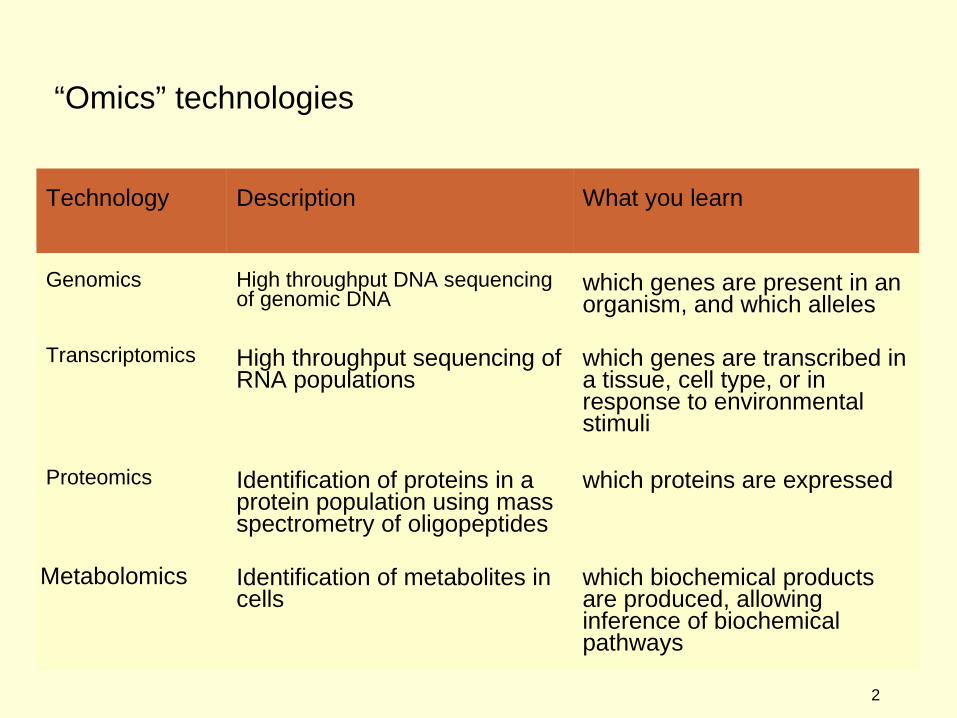
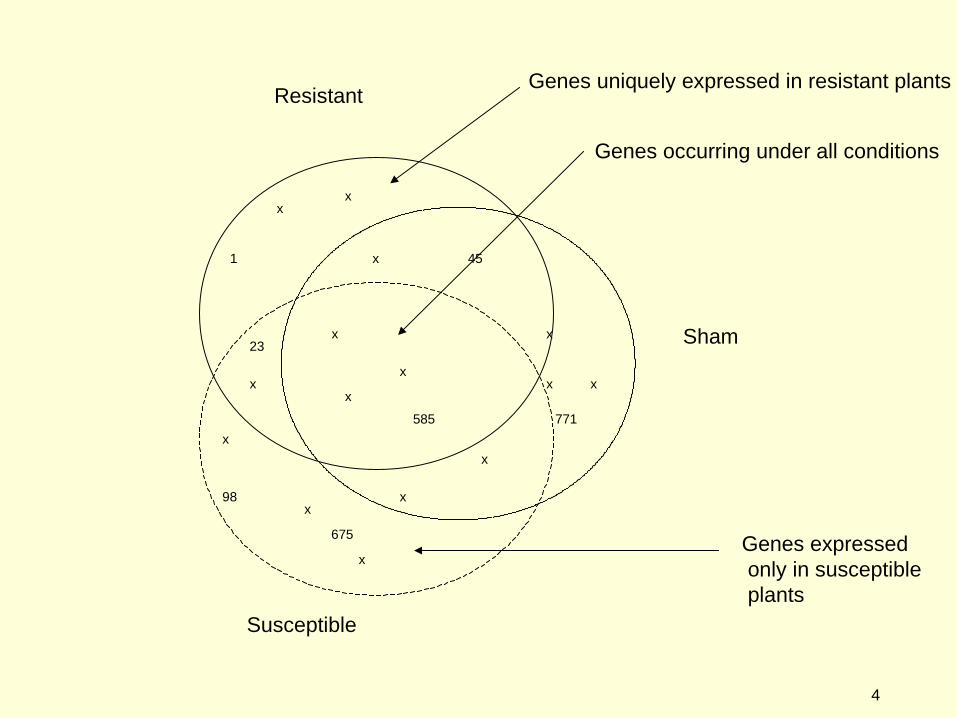
Example: What genes are involved in a disease-resistance reaction?
Disease inoculated Resistant plants
Sham inoculated plants
mRNAmRNA
Identify genes showing differential expression between treatments, either from RNAseq data, and isearch GenBank for the homologous genes of known function. Hope to see different transcripts are present in resistant plant, vs susceptible vs sham inoculated
mRNA
RNAseq
Disease inoculated Susceptible plants
RNAseq RNAseq
4
Resistant
Susceptible
Sham
1
23
x
x
x
x
x
x
x
x
x
x
x
x
x
x
45
98
675
585
x
771
Genes occurring under all conditions
Genes uniquely expressed in resistant plants
Genes expressed only in susceptible plants
5
RNA-seq (RNA sequencing)
http://finchtalk.geospiza.com/2009/05/small-rnas-get-smaller.html
Another approach to measuring gene expression: Just sequence the entire mRNA population!
NGS now lets us do millions of reads at a reasonable price.
Why not just sequence a few million cDNAs?In principle, the number of transcripts found for each geneshould be a good measure of the relative levels of mRNAfor each gene.
Shouldn't it?
6
RNA-seq (RNA sequencing)
http://finchtalk.geospiza.com/2009/05/small-rnas-get-smaller.html
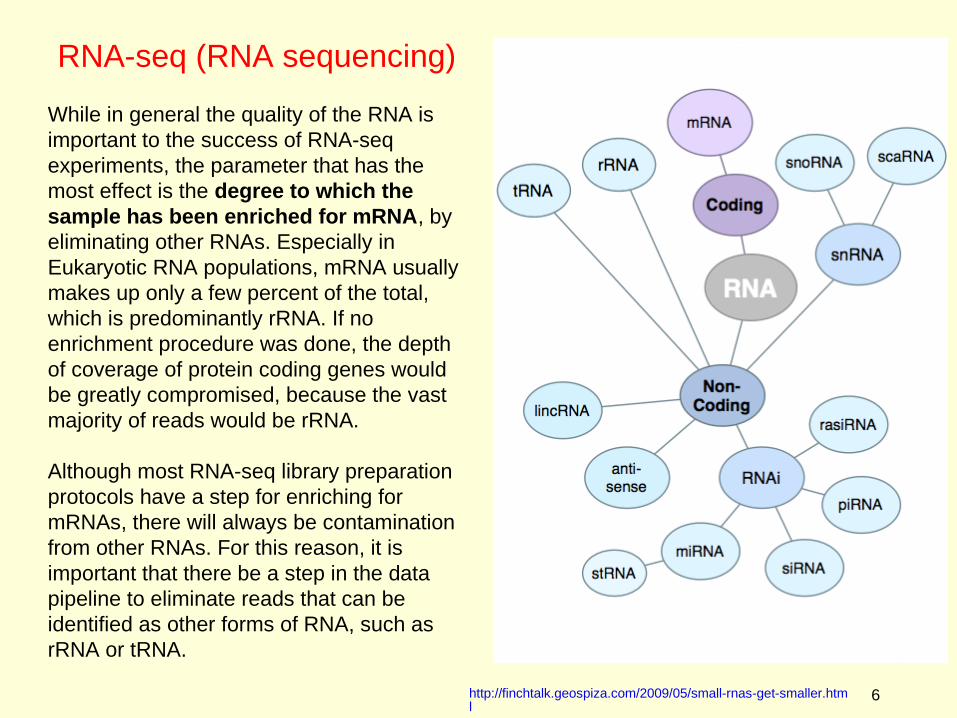
While in general the quality of the RNA is important to the success of RNA-seq experiments, the parameter that has the most effect is the degree to which the sample has been enriched for mRNA, by eliminating other RNAs. Especially in Eukaryotic RNA populations, mRNA usually makes up only a few percent of the total, which is predominantly rRNA. If no enrichment procedure was done, the depth of coverage of protein coding genes would be greatly compromised, because the vast majority of reads would be rRNA.
Although most RNA-seq library preparation protocols have a step for enriching for mRNAs, there will always be contamination from other RNAs. For this reason, it is important that there be a step in the data pipeline to eliminate reads that can be identified as other forms of RNA, such as rRNA or tRNA.
7
AAAAAAA
AAAAAAA
AAAAAAA
AAAAAAA
AAAAAAA
AAAAAAAAAAAAAAAAAAAAA
TTTTTTT
TTTTTTT
TTTTTTT
TTTTTTT
TTTTTTT
AAAAAAA
TTTTTTT
TTTTTTT
TTTTTTT
AAAAAAA AAAAAAA
AAAAAAA
AAAAAAA
AAAAAAA
AAAAAAA
AAAAAAA AAAAAAA
AAAAAAA
AAAAAAAAAAAAAA
AAAAAAA
AAAAAAA
AAAAAAA
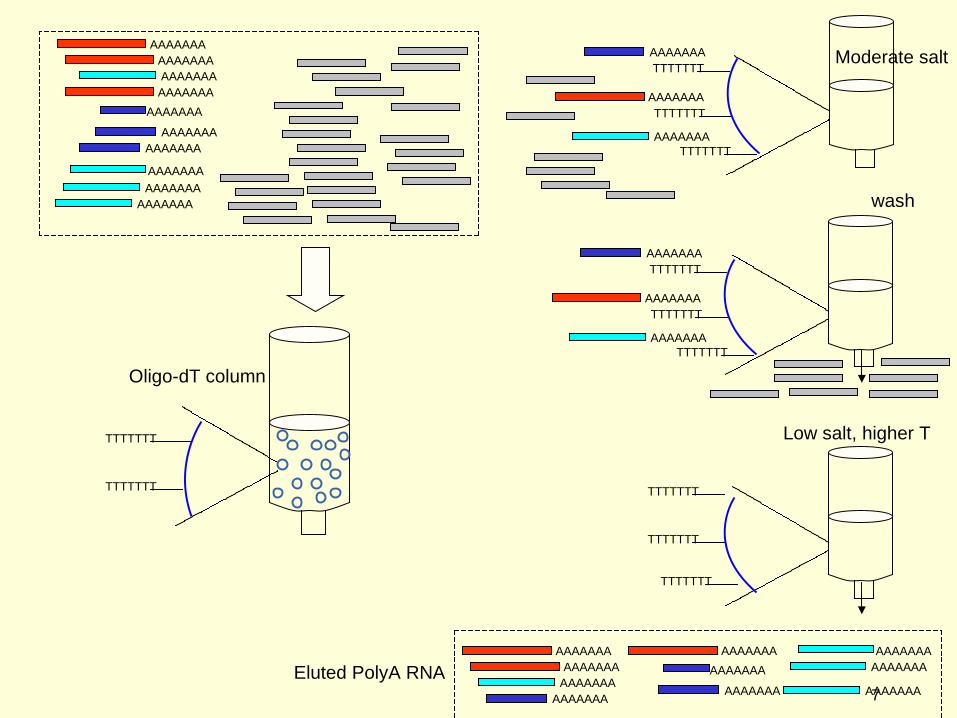
Low salt, higher T
Moderate salt
Eluted PolyA RNA
Oligo-dT column
wash
TTTTTTT
TTTTTTT
TTTTTTT
AAAAAAA
AAAAAAA
AAAAAAA
8
RNA-seq - General strategy
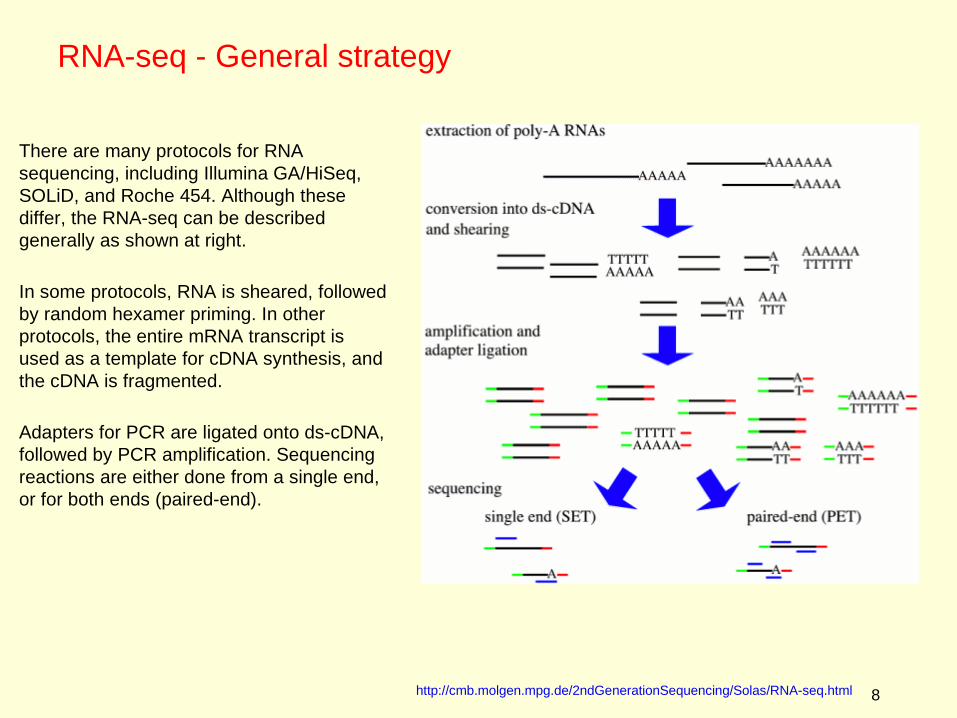
There are many protocols for RNA sequencing, including Illumina GA/HiSeq, SOLiD, and Roche 454. Although these differ, the RNA-seq can be described generally as shown at right.
In some protocols, RNA is sheared, followed by random hexamer priming. In other protocols, the entire mRNA transcript is used as a template for cDNA synthesis, and the cDNA is fragmented.
Adapters for PCR are ligated onto ds-cDNA, followed by PCR amplification. Sequencing reactions are either done from a single end, or for both ends (paired-end).
http://cmb.molgen.mpg.de/2ndGenerationSequencing/Solas/RNA-seq.html
9
RNA-seq - introns complicate the assembly process
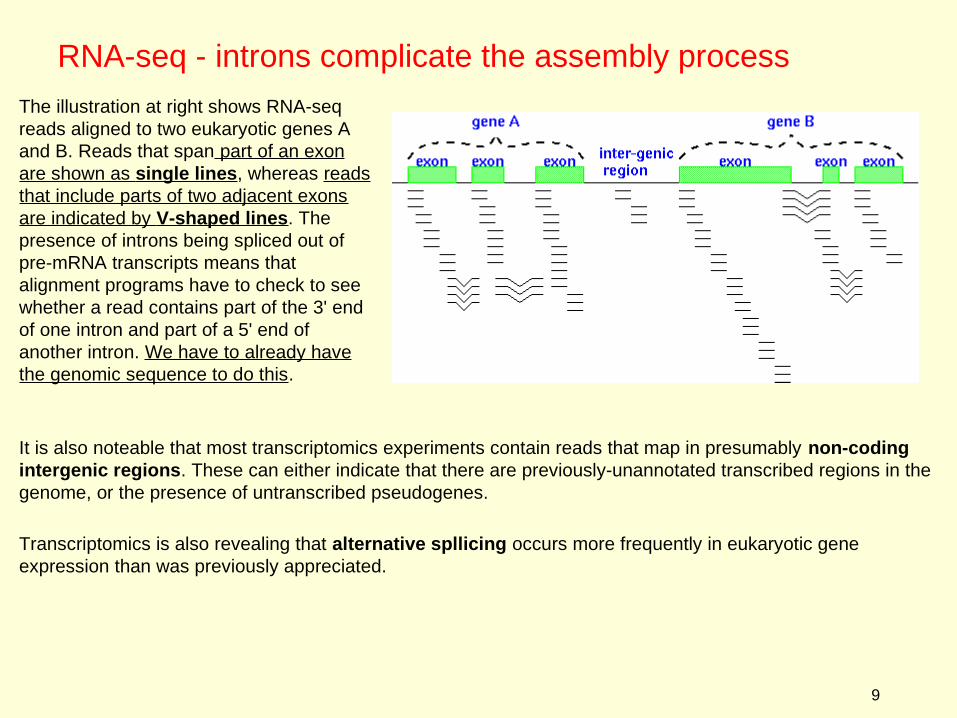
The illustration at right shows RNA-seq reads aligned to two eukaryotic genes A and B. Reads that span part of an exon are shown as single lines, whereas reads that include parts of two adjacent exons are indicated by V-shaped lines. The presence of introns being spliced out of pre-mRNA transcripts means that alignment programs have to check to see whether a read contains part of the 3' end of one intron and part of a 5' end of another intron. We have to already have the genomic sequence to do this.
It is also noteable that most transcriptomics experiments contain reads that map in presumably non-coding intergenic regions. These can either indicate that there are previously-unannotated transcribed regions in the genome, or the presence of untranscribed pseudogenes.
Transcriptomics is also revealing that alternative spllicing occurs more frequently in eukaryotic gene expression than was previously appreciated.
10
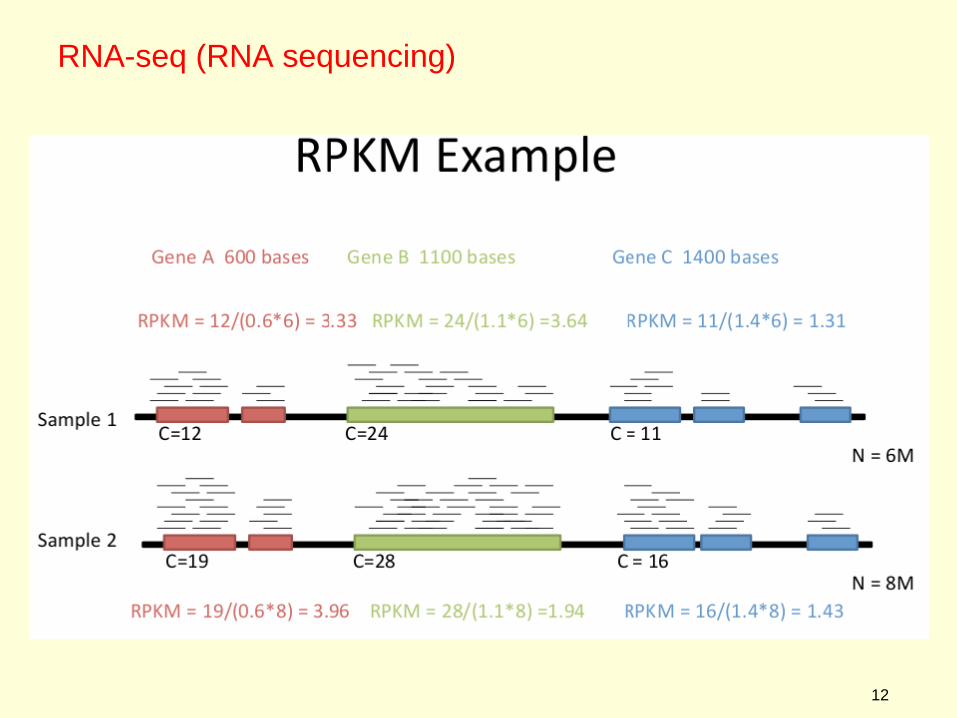
RNA-seq - Normalization
As shown in the illustration above, more reads will be found for larger genes than for smaller genes. In other words, we want to find out the number of reads or fragments that were mapped to each gene in the genome or transcriptome. Consequently, it is necessary to correct gene expression levels for
●The size of each gene. ●The total number of reads in the dataset. This makes results comparable across experiments
Depending on whether you are doing single reads or paired-end reads, there are two almost identical formulae.
11
RNA-seq - Normalization
Depending on whether you are doing single reads or paired-end reads, there are two almost identical formulae.
RPKM - Reads Per Kilobase of transcript per Million mapped reads
RPKM = C/LN
where C :number of mappable reads on a feature = #reads for single-end readsL : Length of feature (in kb)N: Total number of mappable features (in millions)
FPKM - Fragments Per Kilobase of transcript per Million mapped reads
FPKM = F/LN
whereF :number of mappable reads on a feature* = #reads/2 for paried end readsL : Length of feature (in kb)
N: Total number of mappable features (in millions)
*feature - a small contig representing a particular mRNA
12
RNA-seq (RNA sequencing)
13
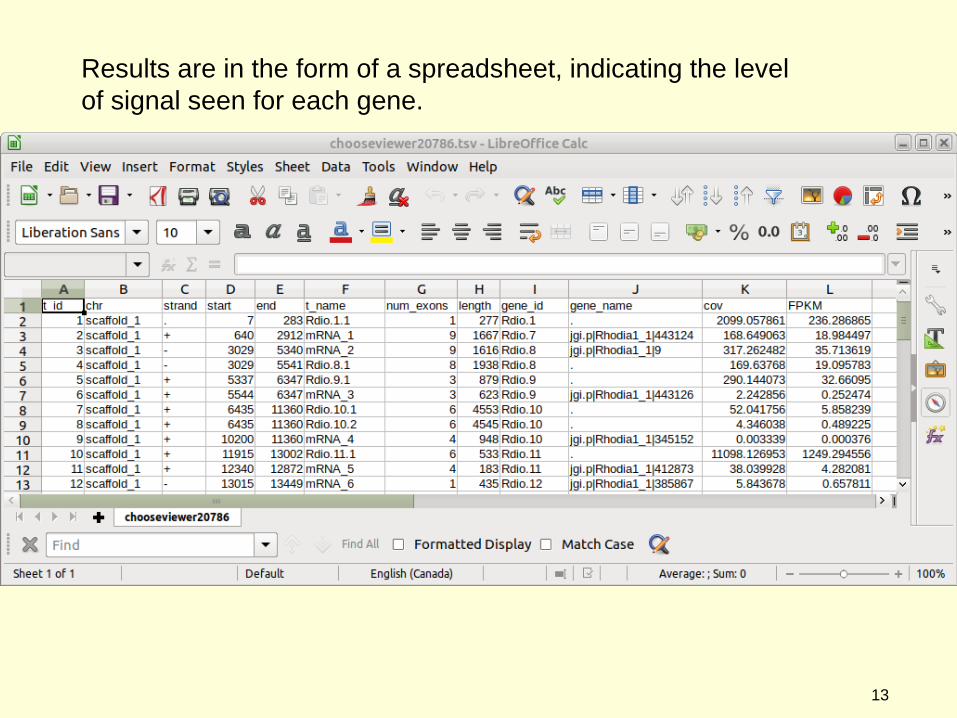
Results are in the form of a spreadsheet, indicating the level of signal seen for each gene.
14
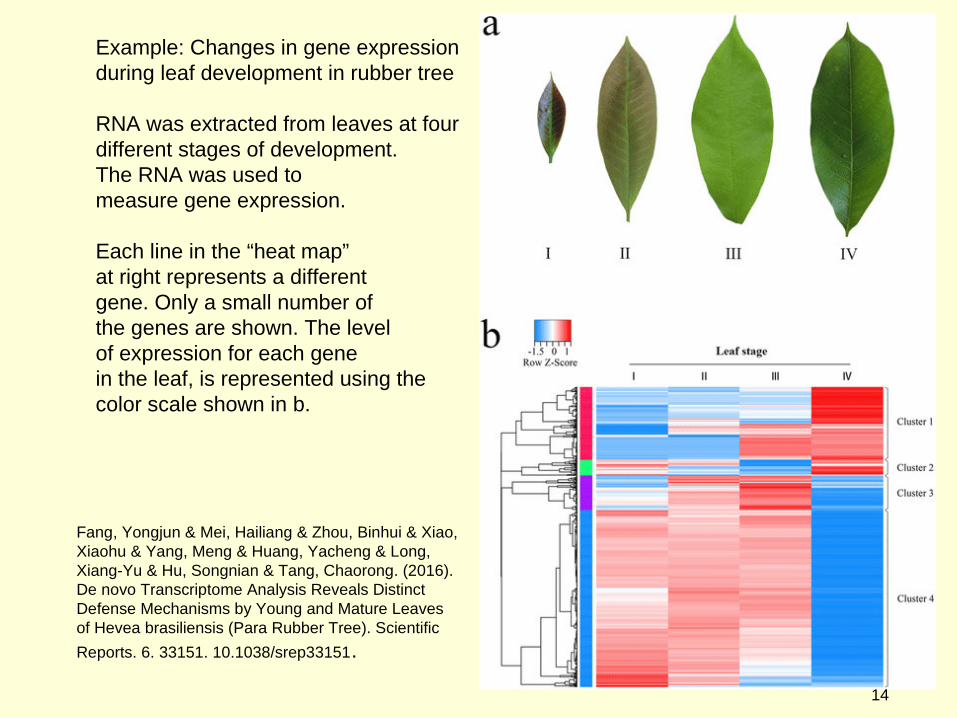
Fang, Yongjun & Mei, Hailiang & Zhou, Binhui & Xiao, Xiaohu & Yang, Meng & Huang, Yacheng & Long, Xiang-Yu & Hu, Songnian & Tang, Chaorong. (2016). De novo Transcriptome Analysis Reveals Distinct Defense Mechanisms by Young and Mature Leaves of Hevea brasiliensis (Para Rubber Tree). Scientific
Reports. 6. 33151. 10.1038/srep33151.
Example: Changes in gene expression during leaf development in rubber tree
RNA was extracted from leaves at four different stages of development.The RNA was used to measure gene expression.
Each line in the “heat map”at right represents a differentgene. Only a small number ofthe genes are shown. The levelof expression for each genein the leaf, is represented using the color scale shown in b.
15
Proteomics
A family of methods for identifying and quantifying proteins which are expressed under specific conditions.
● Older methods involved isolation of proteins by 2D electrophoresis, but more recent approaches employ more high-throughput methods
● There are many different strategies. We will only talk about one method of the global strategy for studying the entire population of proteins in cells or tissues.
16
Proteomics
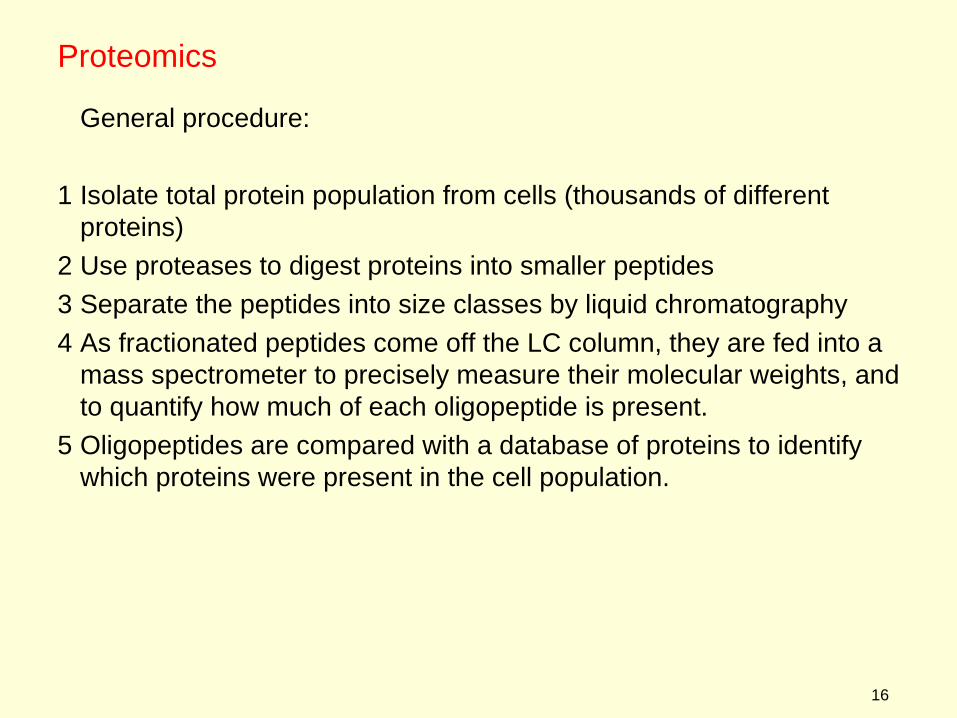
General procedure:
1 Isolate total protein population from cells (thousands of different proteins)
2 Use proteases to digest proteins into smaller peptides
3 Separate the peptides into size classes by liquid chromatography
4 As fractionated peptides come off the LC column, they are fed into a mass spectrometer to precisely measure their molecular weights, and to quantify how much of each oligopeptide is present.
5 Oligopeptides are compared with a database of proteins to identify which proteins were present in the cell population.
17
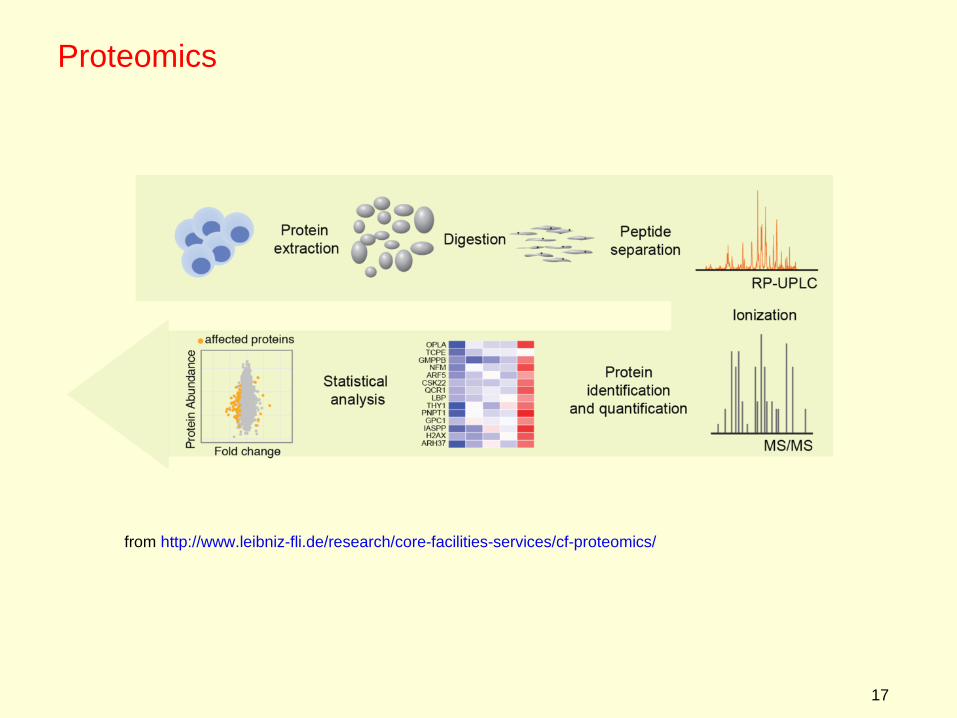
Proteomics
from http://www.leibniz-fli.de/research/core-facilities-services/cf-proteomics/
18
Proteomics
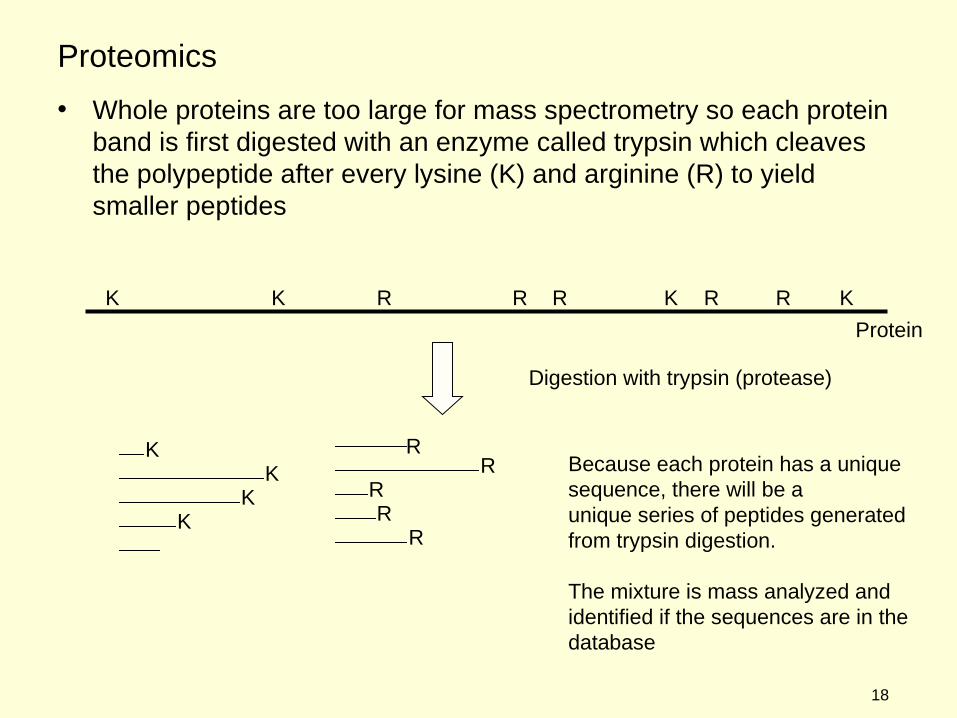
• Whole proteins are too large for mass spectrometry so each protein band is first digested with an enzyme called trypsin which cleaves the polypeptide after every lysine (K) and arginine (R) to yield smaller peptides
K R R RRRK KK
Digestion with trypsin (protease)
Protein
KK
KK
RR
RR
RBecause each protein has a unique sequence, there will be a unique series of peptides generatedfrom trypsin digestion.
The mixture is mass analyzed andidentified if the sequences are in the database
19
Proteomics for measuring gene expression
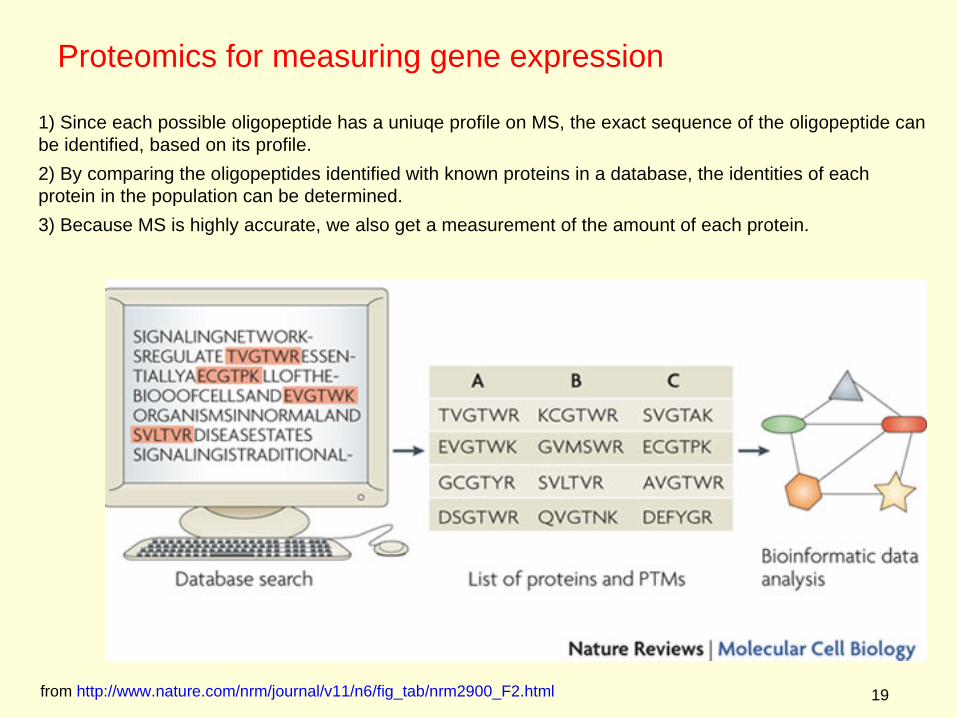
1) Since each possible oligopeptide has a uniuqe profile on MS, the exact sequence of the oligopeptide can be identified, based on its profile.
2) By comparing the oligopeptides identified with known proteins in a database, the identities of each protein in the population can be determined.
3) Because MS is highly accurate, we also get a measurement of the amount of each protein.
from http://www.nature.com/nrm/journal/v11/n6/fig_tab/nrm2900_F2.html
20
• Similarly many of the proteins in a cell are enzymes which catalyze reactions leading to a large set of products.
• The set of primary and secondary products produced from the enzymes of metabolism in the cell at any instance is referred to as the metabolome.
• primary metabolism: eg amino acids, sugars, nucleotides
• Secondary metabolism: eg. carotenoids, phenolic cmps
10,000+ metabolites in a cell at any instant
Metabolomics: A family of techniques for separating metabolitesfrom a cell based on charge, molecular weight, and other characteristics.
Metabolomics
21
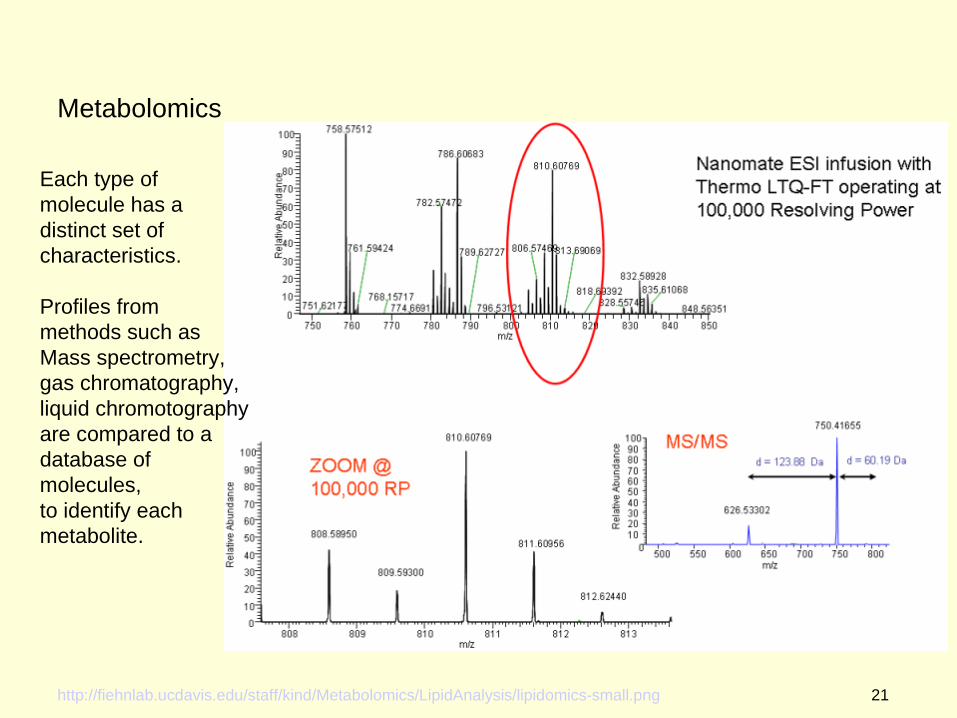
Metabolomics
http://fiehnlab.ucdavis.edu/staff/kind/Metabolomics/LipidAnalysis/lipidomics-small.png
Each type of molecule has adistinct set ofcharacteristics.
Profiles from methods such as Mass spectrometry,gas chromatography,liquid chromotography are compared to a database of molecules,to identify each metabolite.
22
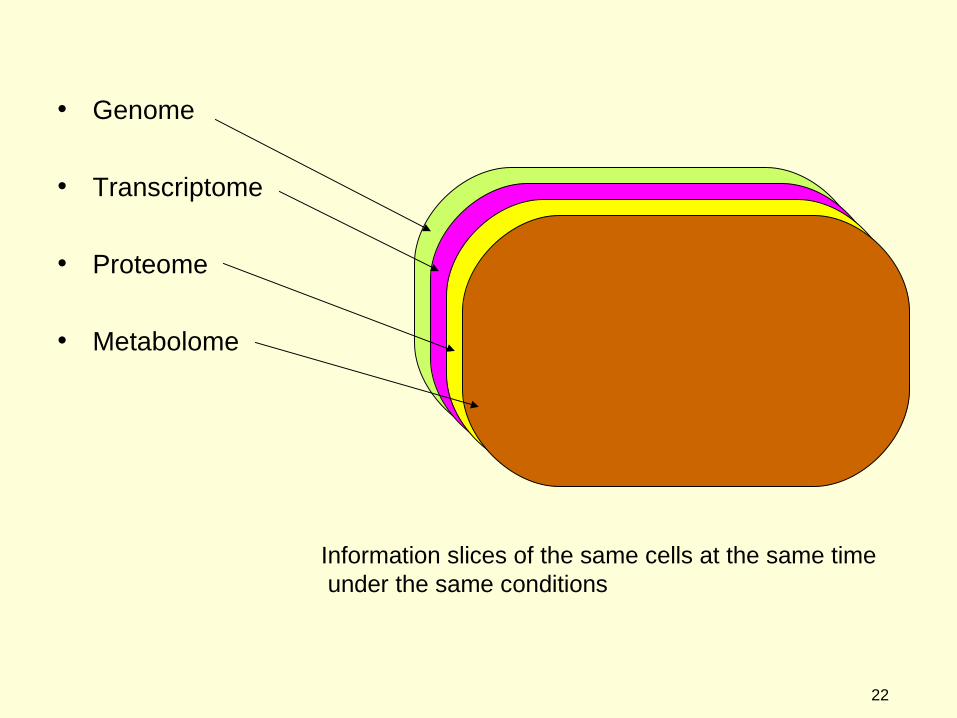
• Genome
• Transcriptome
• Proteome
• Metabolome
Information slices of the same cells at the same time under the same conditions