Embed Size (px)
Citation preview

For Private Circulation OnlyAs on 28th February, 2009.
Please refer back cover - page for risk factors.
Mutual Funds investments are subject to market risks, read the offer document carefully before investing.
*
*For performance refer page no. 4
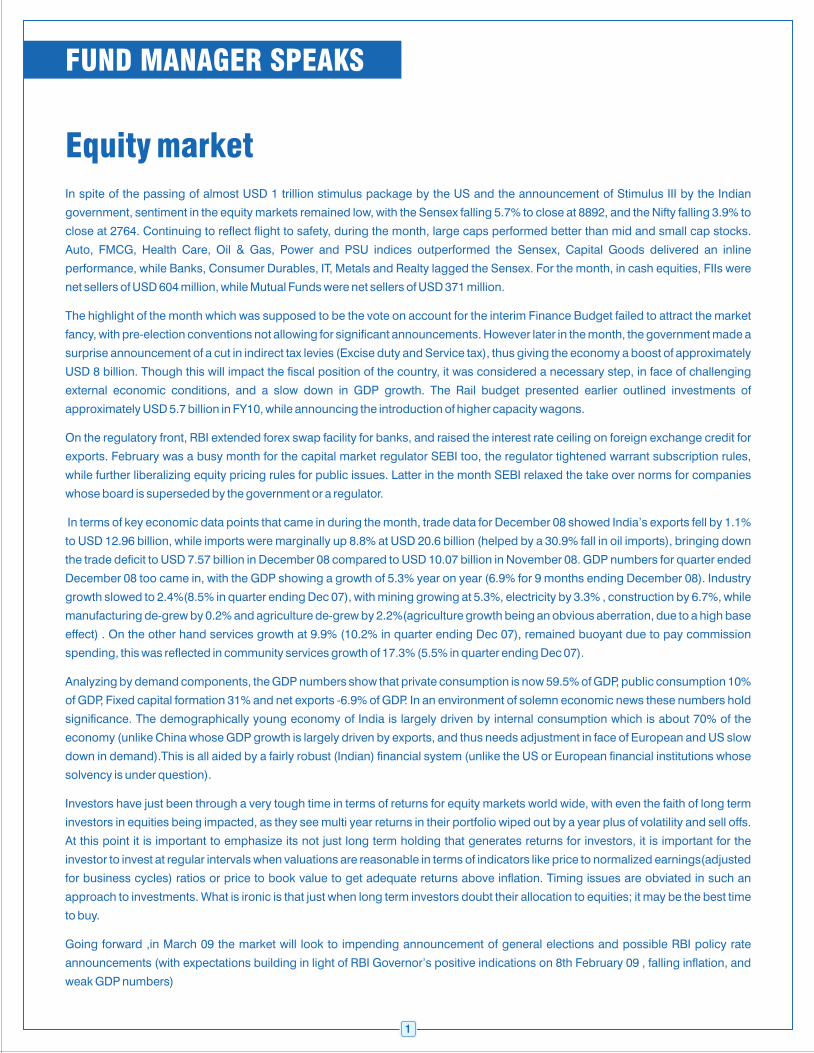
FUND MANAGER SPEAKS
Equity marketIn spite of the passing of almost USD 1 trillion stimulus package by the US and the announcement of Stimulus III by the Indian
government, sentiment in the equity markets remained low, with the Sensex falling 5.7% to close at 8892, and the Nifty falling 3.9% to
close at 2764. Continuing to reflect flight to safety, during the month, large caps performed better than mid and small cap stocks.
Auto, FMCG, Health Care, Oil & Gas, Power and PSU indices outperformed the Sensex, Capital Goods delivered an inline
performance, while Banks, Consumer Durables, IT, Metals and Realty lagged the Sensex. For the month, in cash equities, FIIs were
net sellers of USD 604 million, while Mutual Funds were net sellers of USD 371 million.
The highlight of the month which was supposed to be the vote on account for the interim Finance Budget failed to attract the market
fancy, with pre-election conventions not allowing for significant announcements. However later in the month, the government made a
surprise announcement of a cut in indirect tax levies (Excise duty and Service tax), thus giving the economy a boost of approximately
USD 8 billion. Though this will impact the fiscal position of the country, it was considered a necessary step, in face of challenging
external economic conditions, and a slow down in GDP growth. The Rail budget presented earlier outlined investments of
approximately USD 5.7 billion in FY10, while announcing the introduction of higher capacity wagons.
On the regulatory front, RBI extended forex swap facility for banks, and raised the interest rate ceiling on foreign exchange credit for
exports. February was a busy month for the capital market regulator SEBI too, the regulator tightened warrant subscription rules,
while further liberalizing equity pricing rules for public issues. Latter in the month SEBI relaxed the take over norms for companies
whose board is superseded by the government or a regulator.
In terms of key economic data points that came in during the month, trade data for December 08 showed India’s exports fell by 1.1%
to USD 12.96 billion, while imports were marginally up 8.8% at USD 20.6 billion (helped by a 30.9% fall in oil imports), bringing down
the trade deficit to USD 7.57 billion in December 08 compared to USD 10.07 billion in November 08. GDP numbers for quarter ended
December 08 too came in, with the GDP showing a growth of 5.3% year on year (6.9% for 9 months ending December 08). Industry
growth slowed to 2.4%(8.5% in quarter ending Dec 07), with mining growing at 5.3%, electricity by 3.3% , construction by 6.7%, while
manufacturing de-grew by 0.2% and agriculture de-grew by 2.2%(agriculture growth being an obvious aberration, due to a high base
effect) . On the other hand services growth at 9.9% (10.2% in quarter ending Dec 07), remained buoyant due to pay commission
spending, this was reflected in community services growth of 17.3% (5.5% in quarter ending Dec 07).
Analyzing by demand components, the GDP numbers show that private consumption is now 59.5% of GDP, public consumption 10%
of GDP, Fixed capital formation 31% and net exports -6.9% of GDP. In an environment of solemn economic news these numbers hold
significance. The demographically young economy of India is largely driven by internal consumption which is about 70% of the
economy (unlike China whose GDP growth is largely driven by exports, and thus needs adjustment in face of European and US slow
down in demand).This is all aided by a fairly robust (Indian) financial system (unlike the US or European financial institutions whose
solvency is under question).
Investors have just been through a very tough time in terms of returns for equity markets world wide, with even the faith of long term
investors in equities being impacted, as they see multi year returns in their portfolio wiped out by a year plus of volatility and sell offs.
At this point it is important to emphasize its not just long term holding that generates returns for investors, it is important for the
investor to invest at regular intervals when valuations are reasonable in terms of indicators like price to normalized earnings(adjusted
for business cycles) ratios or price to book value to get adequate returns above inflation. Timing issues are obviated in such an
approach to investments. What is ironic is that just when long term investors doubt their allocation to equities; it may be the best time
to buy.
Going forward ,in March 09 the market will look to impending announcement of general elections and possible RBI policy rate
announcements (with expectations building in light of RBI Governor’s positive indications on 8th February 09 , falling inflation, and
weak GDP numbers)
1
FUND MANAGER SPEAKS
Debt marketThe month of February remained very choppy and volatile for the gilts market. The incremental market borrowing of INR 460 bn for
the current fiscal ending March’09 and additional fiscal deficit of INR 410 bn to be financed through non-market route turned the
market sentiments negative. Further, the Interim Budget unveiled in mid-February projected a net borrowing of INR 3090 bn, larger
than market expectations of INR 2,500-2,750 bn. The 10-year benchmark bond touched a 2 months high of 6.68% during the month.
Even though RBI announced the purchase of securities through the open market operations (OMO) route, the sentiments remained
weak. On the macro economic front, December industrial output contracted by 2%, exports declined by 1.1% year on year and
imports grew by 8.8%.
One silver lining was inflation which continued to moderate and was last reported at 3.92% for the week ended Feb 07, 2009. As a
further stimulus to revive economic momentum, the govt reduced service tax to 10% and cut excise duty on bulk cement to 8%. This
may help support a revival of economy through increasing the fiscal deficit by a likely INR 250-300 bn.
On the International developments, Bank of England slashed key lending rate by 50 bps to 1% and the 10-yr US treasury yield
continued its upward trend because of supply pressures. Crude oil prices plunges to USD 37.51 per barrel after touching high of USD
41.59 per barrel.
Corporate bond markets opened the month on a positive note with insurance companies and provident funds buying in anticipation
of huge premium collections. However, the market turned lackluster as yields rose tracking rise in G-sec yields. A further increase of
volatility in the market discouraged investors from investing funds in bonds.
The undertone in the money markets remained positive with liquidity overhang and expectations of further rate cuts by RBI. Money
market liquidity continued to remain in the comfortable territory of around Rs.35000 crores during the month despite additional
supply pressure from the dated issuances.
Consistent dollar demand from importers amid high dollar selling by exporters kept rupee range bound during the month.
On the basis of the indications from various statements made by government and regulators, market participants expect further rate
reductions in the near term. In addition, regular OMO purchases in combination with Market Stabilisation Scheme (MSS) unwinding
by RBI should effectively cap any meaningful upside in g-sec yields from current levels. Given the size of the borrowing program, it is
likely that the government is considering tapping overseas markets. Until then, markets may remain range bound. Outlook for short
term rates is positive, in line with expectation of further rate cuts. Short-medium term corporate bonds are also likely to provide a
good option in a volatile gilts market.
2
3
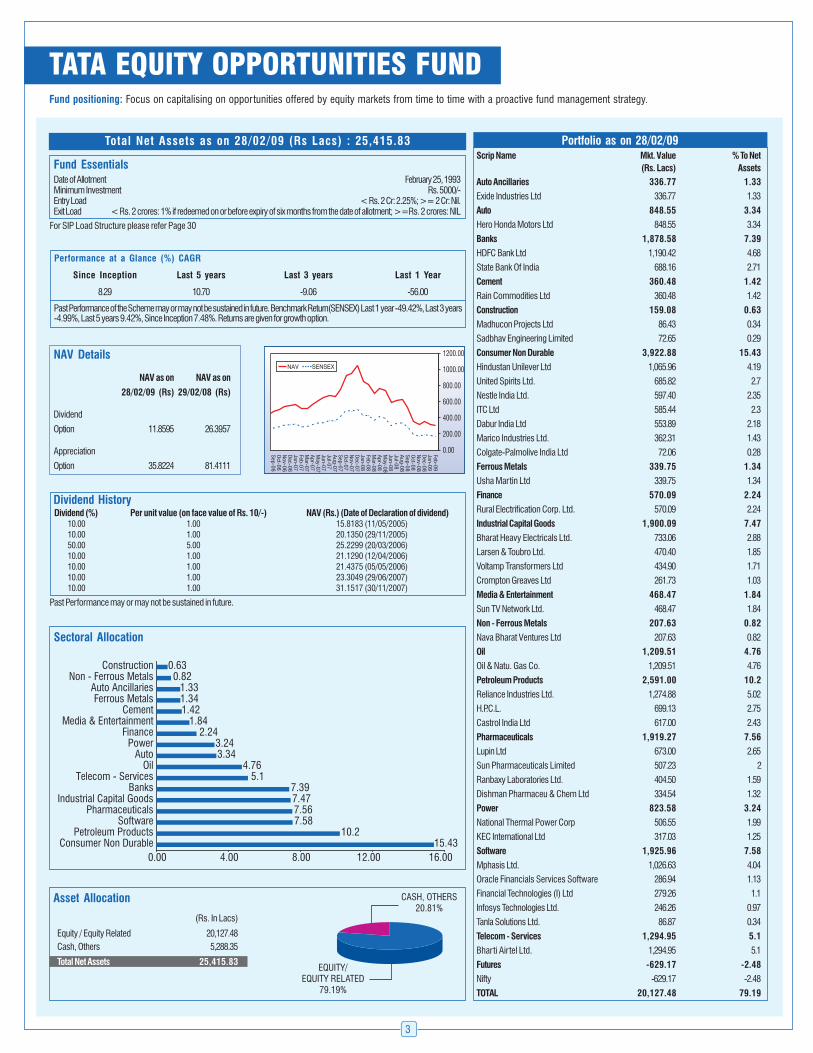
Portfolio as on 28/02/09Scrip Name Mkt. Value % To Net
(Rs. Lacs) Assets
Auto Ancillaries 336.77 1.33
Exide Industries Ltd 336.77 1.33
Auto 848.55 3.34
Hero Honda Motors Ltd 848.55 3.34
Banks 1,878.58 7.39
HDFC Bank Ltd 1,190.42 4.68
State Bank Of India 688.16 2.71
Cement 360.48 1.42
Rain Commodities Ltd 360.48 1.42
Construction 159.08 0.63
Madhucon Projects Ltd 86.43 0.34
Sadbhav Engineering Limited 72.65 0.29
Consumer Non Durable 3,922.88 15.43
Hindustan Unilever Ltd 1,065.96 4.19
United Spirits Ltd. 685.82 2.7
Nestle India Ltd. 597.40 2.35
ITC Ltd 585.44 2.3
Dabur India Ltd 553.89 2.18
Marico Industries Ltd. 362.31 1.43
Colgate-Palmolive India Ltd 72.06 0.28
Ferrous Metals 339.75 1.34
Usha Martin Ltd 339.75 1.34
Finance 570.09 2.24
Rural Electrification Corp. Ltd. 570.09 2.24
Industrial Capital Goods 1,900.09 7.47
Bharat Heavy Electricals Ltd. 733.06 2.88
Larsen & Toubro Ltd. 470.40 1.85
Voltamp Transformers Ltd 434.90 1.71
Crompton Greaves Ltd 261.73 1.03
Media & Entertainment 468.47 1.84
Sun TV Network Ltd. 468.47 1.84
Non - Ferrous Metals 207.63 0.82
Nava Bharat Ventures Ltd 207.63 0.82
Oil 1,209.51 4.76
Oil & Natu. Gas Co. 1,209.51 4.76
Petroleum Products 2,591.00 10.2
Reliance Industries Ltd. 1,274.88 5.02
H.P.C.L. 699.13 2.75
Castrol India Ltd 617.00 2.43
Pharmaceuticals 1,919.27 7.56
Lupin Ltd 673.00 2.65
Sun Pharmaceuticals Limited 507.23 2
Ranbaxy Laboratories Ltd. 404.50 1.59
Dishman Pharmaceu & Chem Ltd 334.54 1.32
Power 823.58 3.24
National Thermal Power Corp 506.55 1.99
KEC International Ltd 317.03 1.25
Software 1,925.96 7.58
Mphasis Ltd. 1,026.63 4.04
Oracle Financials Services Software 286.94 1.13
Financial Technologies (I) Ltd 279.26 1.1
Infosys Technologies Ltd. 246.26 0.97
Tanla Solutions Ltd. 86.87 0.34
Telecom - Services 1,294.95 5.1
Bharti Airtel Ltd. 1,294.95 5.1
Futures -629.17 -2.48
Nifty -629.17 -2.48
TOTAL 20,127.48 79.19
Fund positioning: Focus on capitalising on opportunities offered by equity markets from time to time with a proactive fund management strategy.
Past Performance of the Scheme may or may not be sustained in future. Benchmark Return(SENSEX) Last 1 year -49.42%, Last 3 years-4.99%, Last 5 years 9.42%, Since Inception 7.48%. Returns are given for growth option.
Performance at a Glance (%) CAGR
Since Inception Last 5 years Last 3 years Last 1 Year
8.29 10.70 -9.06 -56.00
Total Net Assets as on 28/02/09 (Rs Lacs) : 25,415.83
TATA EQUITY OPPORTUNITIES FUND
Dividend HistoryDividend (%) Per unit value (on face value of Rs. 10/-) NAV (Rs.) (Date of Declaration of dividend)
10.00 1.00 15.8183 (11/05/2005)
10.00 1.00 20.1350 (29/11/2005)
50.00 5.00 25.2299 (20/03/2006)
10.00 1.00 21.1290 (12/04/2006)
10.00 1.00 21.4375 (05/05/2006)
10.00 1.00 23.3049 (29/06/2007)
10.00 1.00 31.1517 (30/11/2007)
Past Performance may or may not be sustained in future.
Sectoral Allocation
15.4310.2
7.587.567.477.39
5.14.76
3.343.24
2.241.84
1.421.341.33
0.820.63
0.00 4.00 8.00 12.00 16.00Consumer Non Durable
Petroleum ProductsSoftware
PharmaceuticalsIndustrial Capital Goods
BanksTelecom - Services
OilAuto
PowerFinance
Media & EntertainmentCement
Ferrous MetalsAuto Ancillaries
Non - Ferrous MetalsConstruction
Asset Allocation
(Rs. In Lacs)
Equity / Equity Related 20,127.48
Cash, Others 5,288.35
Total Net Assets 25,415.83
Fund EssentialsDate of Allotment February 25, 1993Minimum Investment Rs. 5000/-Entry Load < Rs. 2 Cr: 2.25%; >= 2 Cr: Nil.Exit Load < Rs. 2 crores: 1% if redeemed on or before expiry of six months from the date of allotment; >=Rs. 2 crores: NIL
For SIP Load Structure please refer Page 30
NAV Details
NAV as on NAV as on
28/02/09 (Rs) 29/02/08 (Rs)
Dividend
Option 11.8595 26.3957
Appreciation
Option 35.8224 81.4111
4
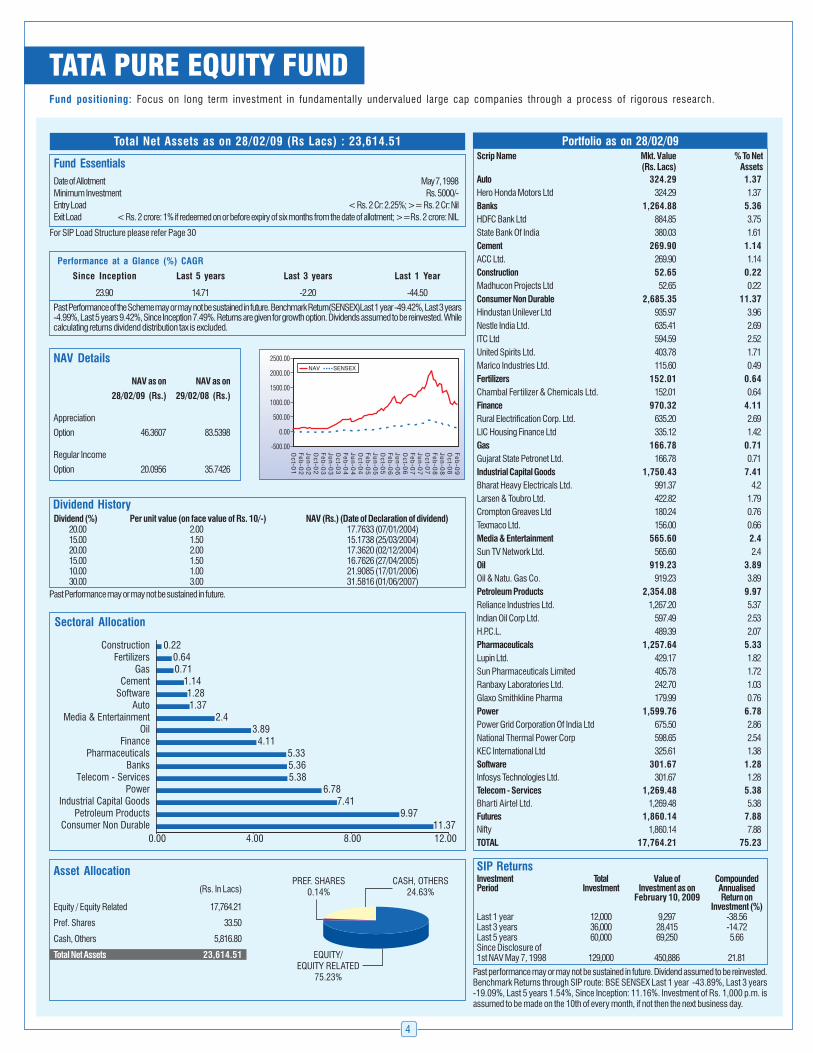
TATA PURE EQUITY FUND
Total Net Assets as on 28/02/09 (Rs Lacs) : 23,614.51 Portfolio as on 28/02/09Scrip Name Mkt. Value % To Net
(Rs. Lacs) Assets
Auto 324.29 1.37
Hero Honda Motors Ltd 324.29 1.37
Banks 1,264.88 5.36
HDFC Bank Ltd 884.85 3.75
State Bank Of India 380.03 1.61
Cement 269.90 1.14
ACC Ltd. 269.90 1.14
Construction 52.65 0.22
Madhucon Projects Ltd 52.65 0.22
Consumer Non Durable 2,685.35 11.37
Hindustan Unilever Ltd 935.97 3.96
Nestle India Ltd. 635.41 2.69
ITC Ltd 594.59 2.52
United Spirits Ltd. 403.78 1.71
Marico Industries Ltd. 115.60 0.49
Fertilizers 152.01 0.64
Chambal Fertilizer & Chemicals Ltd. 152.01 0.64
Finance 970.32 4.11
Rural Electrification Corp. Ltd. 635.20 2.69
LIC Housing Finance Ltd 335.12 1.42
Gas 166.78 0.71
Gujarat State Petronet Ltd. 166.78 0.71
Industrial Capital Goods 1,750.43 7.41
Bharat Heavy Electricals Ltd. 991.37 4.2
Larsen & Toubro Ltd. 422.82 1.79
Crompton Greaves Ltd 180.24 0.76
Texmaco Ltd. 156.00 0.66
Media & Entertainment 565.60 2.4
Sun TV Network Ltd. 565.60 2.4
Oil 919.23 3.89
Oil & Natu. Gas Co. 919.23 3.89
Petroleum Products 2,354.08 9.97
Reliance Industries Ltd. 1,267.20 5.37
Indian Oil Corp Ltd. 597.49 2.53
H.P.C.L. 489.39 2.07
Pharmaceuticals 1,257.64 5.33
Lupin Ltd. 429.17 1.82
Sun Pharmaceuticals Limited 405.78 1.72
Ranbaxy Laboratories Ltd. 242.70 1.03
Glaxo Smithkline Pharma 179.99 0.76
Power 1,599.76 6.78
Power Grid Corporation Of India Ltd 675.50 2.86
National Thermal Power Corp 598.65 2.54
KEC International Ltd 325.61 1.38
Software 301.67 1.28
Infosys Technologies Ltd. 301.67 1.28
Telecom - Services 1,269.48 5.38
Bharti Airtel Ltd. 1,269.48 5.38
Futures 1,860.14 7.88
Nifty 1,860.14 7.88
TOTAL 17,764.21 75.23
Fund positioning: Focus on long term investment in fundamentally undervalued large cap companies through a process of rigorous research.
Past Performance of the Scheme may or may not be sustained in future. Benchmark Return(SENSEX)Last 1 year -49.42%, Last 3 years-4.99%, Last 5 years 9.42%, Since Inception 7.49%. Returns are given for growth option. Dividends assumed to be reinvested. Whilecalculating returns dividend distribution tax is excluded.
Performance at a Glance (%) CAGR
Since Inception Last 5 years Last 3 years Last 1 Year
23.90 14.71 -2.20 -44.50
SIP ReturnsInvestment Total Value of CompoundedPeriod Investment Investment as on Annualised
February 10, 2009 Return onInvestment (%)
Last 1 year 12,000 9,297 -38.56Last 3 years 36,000 28,415 -14.72Last 5 years 60,000 69,250 5.66Since Disclosure of1st NAV May 7, 1998 129,000 450,886 21.81
Past performance may or may not be sustained in future. Dividend assumed to be reinvested.Benchmark Returns through SIP route: BSE SENSEX Last 1 year -43.89%, Last 3 years-19.09%, Last 5 years 1.54%, Since Inception: 11.16%. Investment of Rs. 1,000 p.m. isassumed to be made on the 10th of every month, if not then the next business day.
Sectoral Allocation
11.379.97
7.416.78
5.385.365.33
4.113.89
2.41.371.28
1.140.710.64
0.22
0.00 4.00 8.00 12.00Consumer Non Durable
Petroleum ProductsIndustrial Capital Goods
PowerTelecom - Services
BanksPharmaceuticals
FinanceOil
Media & EntertainmentAuto
SoftwareCement
GasFertilizers
Construction
Asset Allocation
(Rs. In Lacs)
Equity / Equity Related 17,764.21
Pref. Shares 33.50
Cash, Others 5,816.80
Total Net Assets 23,614.51
Dividend HistoryDividend (%) Per unit value (on face value of Rs. 10/-) NAV (Rs.) (Date of Declaration of dividend)
20.00 2.00 17.7633 (07/01/2004)15.00 1.50 15.1738 (25/03/2004)20.00 2.00 17.3620 (02/12/2004)15.00 1.50 16.7626 (27/04/2005)10.00 1.00 21.9085 (17/01/2006)30.00 3.00 31.5816 (01/06/2007)
Past Performance may or may not be sustained in future.
Fund Essentials
Date of Allotment May 7, 1998
Minimum Investment Rs. 5000/-
Entry Load < Rs. 2 Cr: 2.25%; >= Rs. 2 Cr: Nil
Exit Load < Rs. 2 crore: 1% if redeemed on or before expiry of six months from the date of allotment; >=Rs. 2 crore: NIL
For SIP Load Structure please refer Page 30
NAV Details
NAV as on NAV as on
28/02/09 (Rs.) 29/02/08 (Rs.)
Appreciation
Option 46.3607 83.5398
Regular Income
Option 20.0956 35.7426
5
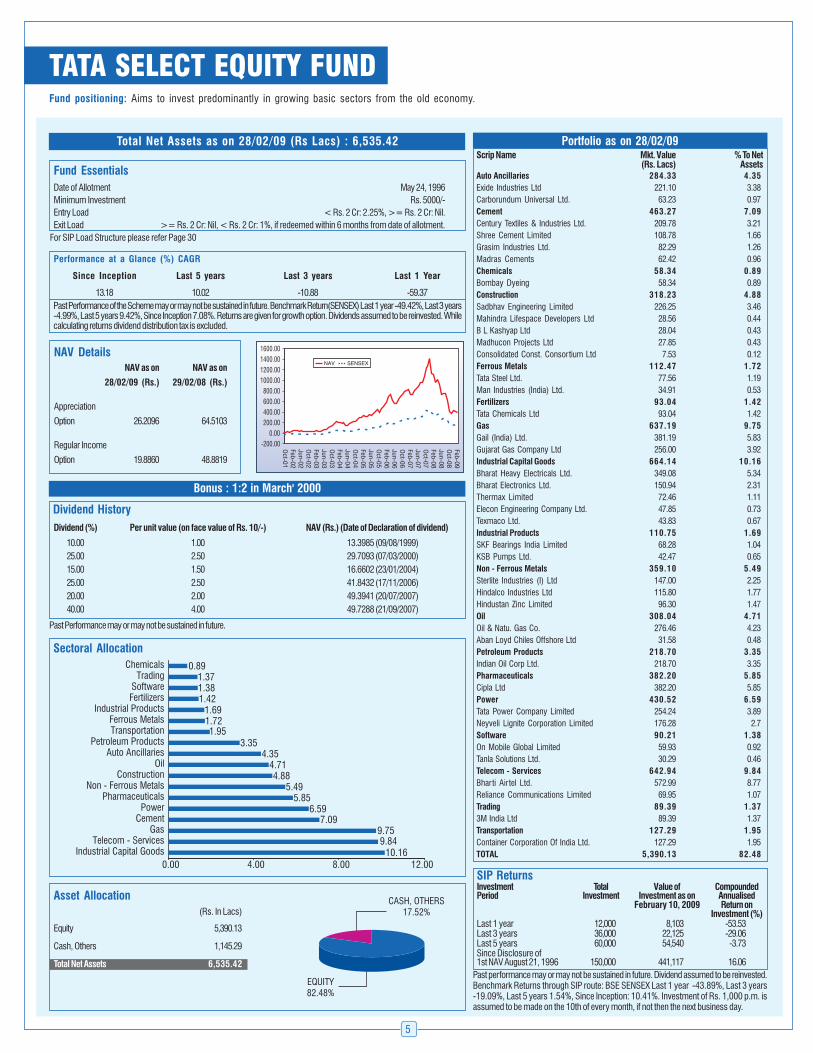
TATA SELECT EQUITY FUNDFund positioning: Aims to invest predominantly in growing basic sectors from the old economy.
Past Performance of the Scheme may or may not be sustained in future. Benchmark Return(SENSEX) Last 1 year -49.42%, Last 3 years-4.99%, Last 5 years 9.42%, Since Inception 7.08%. Returns are given for growth option. Dividends assumed to be reinvested. Whilecalculating returns dividend distribution tax is excluded.
Performance at a Glance (%) CAGR
Since Inception Last 5 years Last 3 years Last 1 Year
13.18 10.02 -10.88 -59.37
Portfolio as on 28/02/09Scrip Name Mkt. Value % To Net
(Rs. Lacs) AssetsAuto Ancillaries 284.33 4.35
Exide Industries Ltd 221.10 3.38
Carborundum Universal Ltd. 63.23 0.97
Cement 463.27 7.09
Century Textiles & Industries Ltd. 209.78 3.21
Shree Cement Limited 108.78 1.66
Grasim Industries Ltd. 82.29 1.26
Madras Cements 62.42 0.96
Chemicals 58.34 0.89
Bombay Dyeing 58.34 0.89
Construction 318.23 4.88
Sadbhav Engineering Limited 226.25 3.46
Mahindra Lifespace Developers Ltd 28.56 0.44
B L Kashyap Ltd 28.04 0.43
Madhucon Projects Ltd 27.85 0.43
Consolidated Const. Consortium Ltd 7.53 0.12
Ferrous Metals 112.47 1.72
Tata Steel Ltd. 77.56 1.19
Man Industries (India) Ltd. 34.91 0.53
Fertilizers 93.04 1.42
Tata Chemicals Ltd 93.04 1.42
Gas 637.19 9.75
Gail (India) Ltd. 381.19 5.83
Gujarat Gas Company Ltd 256.00 3.92
Industrial Capital Goods 664.14 10.16
Bharat Heavy Electricals Ltd. 349.08 5.34
Bharat Electronics Ltd. 150.94 2.31
Thermax Limited 72.46 1.11
Elecon Engineering Company Ltd. 47.85 0.73
Texmaco Ltd. 43.83 0.67
Industrial Products 110.75 1.69
SKF Bearings India Limited 68.28 1.04
KSB Pumps Ltd. 42.47 0.65
Non - Ferrous Metals 359.10 5.49
Sterlite Industries (I) Ltd 147.00 2.25
Hindalco Industries Ltd 115.80 1.77
Hindustan Zinc Limited 96.30 1.47
Oil 308.04 4.71
Oil & Natu. Gas Co. 276.46 4.23
Aban Loyd Chiles Offshore Ltd 31.58 0.48
Petroleum Products 218.70 3.35
Indian Oil Corp Ltd. 218.70 3.35
Pharmaceuticals 382.20 5.85
Cipla Ltd 382.20 5.85
Power 430.52 6.59
Tata Power Company Limited 254.24 3.89
Neyveli Lignite Corporation Limited 176.28 2.7
Software 90.21 1.38
On Mobile Global Limited 59.93 0.92
Tanla Solutions Ltd. 30.29 0.46
Telecom - Services 642.94 9.84
Bharti Airtel Ltd. 572.99 8.77
Reliance Communications Limited 69.95 1.07
Trading 89.39 1.37
3M India Ltd 89.39 1.37
Transportation 127.29 1.95
Container Corporation Of India Ltd. 127.29 1.95
TOTAL 5,390.13 82.48
SIP ReturnsInvestment Total Value of CompoundedPeriod Investment Investment as on Annualised
February 10, 2009 Return onInvestment (%)
Last 1 year 12,000 8,103 -53.53Last 3 years 36,000 22,125 -29.06Last 5 years 60,000 54,540 -3.73Since Disclosure of1st NAV August 21, 1996 150,000 441,117 16.06
Past performance may or may not be sustained in future. Dividend assumed to be reinvested.Benchmark Returns through SIP route: BSE SENSEX Last 1 year -43.89%, Last 3 years-19.09%, Last 5 years 1.54%, Since Inception: 10.41%. Investment of Rs. 1,000 p.m. isassumed to be made on the 10th of every month, if not then the next business day.
Fund Essentials
Date of Allotment May 24, 1996
Minimum Investment Rs. 5000/-
Entry Load < Rs. 2 Cr: 2.25%, >= Rs. 2 Cr: Nil.
Exit Load >= Rs. 2 Cr: Nil, < Rs. 2 Cr: 1%, if redeemed within 6 months from date of allotment.
For SIP Load Structure please refer Page 30
Total Net Assets as on 28/02/09 (Rs Lacs) : 6,535.42
Sectoral Allocation
10.169.84
9.757.09
6.595.85
5.494.88
4.714.35
3.351.95
1.721.69
1.421.381.37
0.89
0.00 4.00 8.00 12.00Industrial Capital Goods
Telecom - ServicesGas
CementPower
PharmaceuticalsNon - Ferrous Metals
ConstructionOil
Auto AncillariesPetroleum Products
TransportationFerrous Metals
Industrial ProductsFertilizersSoftware
TradingChemicals
Asset Allocation
(Rs. In Lacs)
Equity 5,390.13
Cash, Others 1,145.29
Total Net Assets 6,535.42
Dividend History
Dividend (%) Per unit value (on face value of Rs. 10/-) NAV (Rs.) (Date of Declaration of dividend)
10.00 1.00 13.3985 (09/08/1999)
25.00 2.50 29.7093 (07/03/2000)
15.00 1.50 16.6602 (23/01/2004)
25.00 2.50 41.8432 (17/11/2006)
20.00 2.00 49.3941 (20/07/2007)
40.00 4.00 49.7288 (21/09/2007)
Bonus : 1:2 in March' 2000
Past Performance may or may not be sustained in future.
NAV Details
NAV as on NAV as on
28/02/09 (Rs.) 29/02/08 (Rs.)
Appreciation
Option 26.2096 64.5103
Regular Income
Option 19.8860 48.8819
6
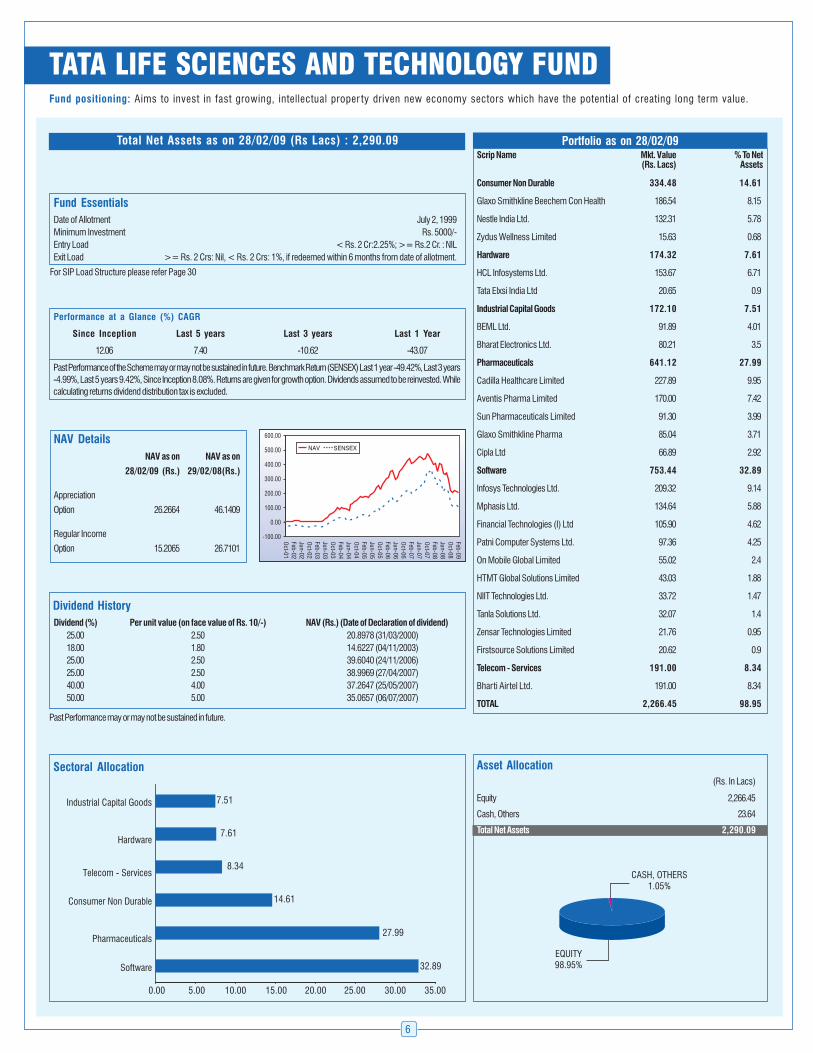
TATA LIFE SCIENCES AND TECHNOLOGY FUND
Portfolio as on 28/02/09Scrip Name Mkt. Value % To Net
(Rs. Lacs) Assets
Consumer Non Durable 334.48 14.61
Glaxo Smithkline Beechem Con Health 186.54 8.15
Nestle India Ltd. 132.31 5.78
Zydus Wellness Limited 15.63 0.68
Hardware 174.32 7.61
HCL Infosystems Ltd. 153.67 6.71
Tata Elxsi India Ltd 20.65 0.9
Industrial Capital Goods 172.10 7.51
BEML Ltd. 91.89 4.01
Bharat Electronics Ltd. 80.21 3.5
Pharmaceuticals 641.12 27.99
Cadilla Healthcare Limited 227.89 9.95
Aventis Pharma Limited 170.00 7.42
Sun Pharmaceuticals Limited 91.30 3.99
Glaxo Smithkline Pharma 85.04 3.71
Cipla Ltd 66.89 2.92
Software 753.44 32.89
Infosys Technologies Ltd. 209.32 9.14
Mphasis Ltd. 134.64 5.88
Financial Technologies (I) Ltd 105.90 4.62
Patni Computer Systems Ltd. 97.36 4.25
On Mobile Global Limited 55.02 2.4
HTMT Global Solutions Limited 43.03 1.88
NIIT Technologies Ltd. 33.72 1.47
Tanla Solutions Ltd. 32.07 1.4
Zensar Technologies Limited 21.76 0.95
Firstsource Solutions Limited 20.62 0.9
Telecom - Services 191.00 8.34
Bharti Airtel Ltd. 191.00 8.34
TOTAL 2,266.45 98.95
Fund positioning: Aims to invest in fast growing, intellectual proper ty driven new economy sectors which have the potential of creating long term value.
Past Performance of the Scheme may or may not be sustained in future. Benchmark Return (SENSEX) Last 1 year -49.42%, Last 3 years
-4.99%, Last 5 years 9.42%, Since Inception 8.08%. Returns are given for growth option. Dividends assumed to be reinvested. While
calculating returns dividend distribution tax is excluded.
Performance at a Glance (%) CAGR
Since Inception Last 5 years Last 3 years Last 1 Year
12.06 7.40 -10.62 -43.07
Dividend History
Dividend (%) Per unit value (on face value of Rs. 10/-) NAV (Rs.) (Date of Declaration of dividend)
25.00 2.50 20.8978 (31/03/2000)
18.00 1.80 14.6227 (04/11/2003)
25.00 2.50 39.6040 (24/11/2006)
25.00 2.50 38.9969 (27/04/2007)
40.00 4.00 37.2647 (25/05/2007)
50.00 5.00 35.0657 (06/07/2007)
Past Performance may or may not be sustained in future.
Fund Essentials
Date of Allotment July 2, 1999
Minimum Investment Rs. 5000/-
Entry Load < Rs. 2 Cr:2.25%; >= Rs.2 Cr. : NIL
Exit Load >= Rs. 2 Crs: Nil, < Rs. 2 Crs: 1%, if redeemed within 6 months from date of allotment.
For SIP Load Structure please refer Page 30
Total Net Assets as on 28/02/09 (Rs Lacs) : 2,290.09
Asset Allocation
(Rs. In Lacs)
Equity 2,266.45
Cash, Others 23.64
Total Net Assets 2,290.09
Sectoral Allocation
32.89
27.99
14.61
8.34
7.61
7.51
0.00 5.00 10.00 15.00 20.00 25.00 30.00 35.00
Software
Pharmaceuticals
Consumer Non Durable
Telecom - Services
Hardware
Industrial Capital Goods
NAV Details
NAV as on NAV as on
28/02/09 (Rs.) 29/02/08(Rs.)
Appreciation
Option 26.2664 46.1409
Regular Income
Option 15.2065 26.7101

7
TATA TAX SAVING FUND
Portfolio as on 28/02/09Scrip Name Mkt. Value % To Net
(Rs. Lacs) Assets
Auto Ancillaries 40.94 0.46Amara Raja Batteries Ltd 40.94 0.46Auto 232.56 2.63Hero Honda Motors Ltd 232.56 2.63Banks 432.24 4.89State Bank Of India 276.80 3.13HDFC Bank Ltd 70.79 0.8ICICI Bank Ltd 49.22 0.56Punjab National Bank 35.44 0.4Cement 343.89 3.89Grasim Industries Ltd. 274.30 3.1Rain Commodities Ltd 69.59 0.79Chemicals 74.28 0.84Hikal Limited 74.27 0.84Construction 66.31 0.75IVRCL Infrastructures & Project Ltd 66.31 0.75Consumer Non Durable 1,140.46 12.9Hindustan Unilever Ltd 408.62 4.62ITC Ltd 274.43 3.11Dabur India Ltd 227.38 2.57United Spirits Ltd. 192.57 2.18Nestle India Ltd. 37.47 0.42Ferrous Metals 135.64 1.53Welspun Gujarat Stahl Rohren Ltd 74.34 0.84Maharashtra Seamless Ltd. 61.30 0.69Finance 218.45 2.48Crisil 112.75 1.28IDFC Ltd 105.70 1.2Gas 458.01 5.18Gujarat State Petronet Ltd. 196.20 2.22Gujarat Gas Company Ltd 139.83 1.58Gail (India) Ltd. 121.98 1.38Industrial Capital Goods 1,092.40 12.36Bharat Heavy Electricals Ltd. 259.71 2.94Bharat Electronics Ltd. 215.63 2.44Larsen & Toubro Ltd. 214.01 2.42AIA Engineering Ltd 185.84 2.1Crompton Greaves Ltd 130.73 1.48Texmaco Ltd. 67.43 0.76Sunil Hitech Engineers Ltd 19.07 0.22Media & Entertainment 187.24 2.12ZEE News Ltd. 172.21 1.95IBN18 Broadcast Ltd 15.03 0.17Oil 352.49 3.99Oil & Natu. Gas Co. 352.49 3.99Petroleum Products 84.36 0.95BPCL 84.36 0.95Pharmaceuticals 561.31 6.35Cipla Ltd 315.32 3.57Ranbaxy Laboratories Ltd. 161.80 1.83Dabur Pharma Ltd. 84.20 0.95Power 502.38 5.68Tata Power Company Limited 276.03 3.12Power Grid Corporation Of India Ltd 157.30 1.78KEC International Ltd 69.05 0.78Software 322.18 3.65Mphasis Ltd. 168.30 1.9Zenith Infotech Limited 80.00 0.91Infosys Technologies Ltd. 73.88 0.84Telecom - Services 553.30 6.26Bharti Airtel Ltd. 424.33 4.8Idea Cellular Ltd 128.98 1.46Transportation 17.17 0.19Mercator Lines Ltd. 17.17 0.19TOTAL 6,815.62 77.10
Fund positioning: An equity linked tax savings scheme (ELSS) aiming to provide medium to long term capital gains along with income tax benefit under Section 80C of the Income Tax Act.
Past Performance of the Scheme may or may not be sustained in future. Benchmark Return(SENSEX) Last 1 year -49.42%, Last 3 years-4.99%, Last 5 years 9.42%, Since Inception 7.81%. Dividends assumed to be reinvested. While calculating returns dividend distributiontax is excluded.
Performance at a Glance (%) CAGR
Since Inception Last 5 years Last 3 years Last 1 Year18.55 7.99 -10.50 -49.45
Total Net Assets as on 28/02/09 (Rs Lacs) : 8,838.03
SIP ReturnsInvestment Total Value of CompoundedPeriod Investment Investment as on Annualised
February 10, 2009 Return onInvestment (%)
Last 1 year 12,000 8,790 -45.08Last 3 years 36,000 24,728 -22.83Last 5 years 60,000 54,455 -3.80Since Disclosure of1st NAV June 28,1996 152,000 578,630 19.44
Past performance may or may not be sustained in future. Dividend assumed to be reinvested.Benchmark Returns through SIP route: BSE SENSEX Last 1 year -43.89%, Last 3 years-19.09%, Last 5 years 1.54%, Since Inception: 10.32%. Investment of Rs. 1,000 p.m. isassumed to be made on the 10th of every month, if not then the next business day.
Fund Essentials
Date of Allotment March 31, 1996
Minimum Investment Rs. 500/-
Entry Load <Rs. 2 crores:2.25%, >= Rs. 2 crores:Nil
Exit Load Nil
For SIP Load Structure please refer Page 30
Bonus : 1:1 in March' 2000
Dividend History
Dividend (%) Per unit value (on face value of Rs. 10/-) NAV (Rs.) (Date of Declaration of dividend)
20.00 2.00 16.8910 (15/06/1999)20.00 2.00 41.4920 (14/01/2000)10.00 1.00 23.9770 (10/12/2003)
101.00 10.10 40.1923 (20/10/2005)30.00 3.00 63.7228 (14/12/2007)
Past Performance may or may not be sustained in future.
NAV Details
NAV as on 28/02/09(Rs) 25.9155
NAV as on 29/02/08(Rs) 51.2705
Sectoral Allocation
12.912.36
6.356.26
5.685.18
4.893.993.89
3.652.63
2.482.12
1.530.95
0.840.75
0.460.19
0.00 2.00 4.00 6.00 8.00 10.00 12.00 14.00Consumer Non Durable
Pharmaceuticals
Power
Banks
Cement
Auto
Media & Entertainment
Petroleum Products
Construction
Transportation
Asset Allocation
(Rs. In Lacs)
Equity 6,815.62
Cash, Others 2,022.41
Total Net Assets 8,838.03
8
Portfolio as on 28/02/09Scrip Name Mkt. Value % To Net
(Rs. Lacs) Assets
Auto Ancillaries 80.80 2.41
Amara Raja Batteries Ltd 40.60 1.21
Exide Industries Ltd 40.20 1.2
Banks 138.38 4.14
Federal Bank Ltd . 49.62 1.48
Union Bank Of India 45.36 1.36
Bank Of Baroda 43.40 1.3
Construction 61.46 1.83
Madhucon Projects Ltd 22.19 0.66
IVRCL Infrastructures & Project Ltd 21.74 0.65
Consolidated Const. Consortium Ltd 17.54 0.52
Consumer Durables 18.38 0.55
Voltas Limited 18.38 0.55
Consumer Non Durable 339.90 10.15
ITC Ltd 128.07 3.83
United Spirits Ltd. 77.65 2.32
Advanta India Limited 50.24 1.5
Colgate-Palmolive India Ltd 46.33 1.38
Titan Industries Limited 37.62 1.12
Ferrous Metals 37.17 1.11
Welspun Gujarat Stahl Rohren Ltd 37.17 1.11
Finance 131.29 3.93
Power Finance Corporation 100.98 3.02
LIC Housing Finance Ltd 30.31 0.91
Gas 151.16 4.52
Gujarat State Petronet Ltd. 89.93 2.69
Indraprastha Gas Ltd. 61.23 1.83
Industrial Capital Goods 177.12 5.29
Larsen & Toubro Ltd. 85.60 2.56
Jyoti Structures Ltd. 56.65 1.69
AIA Engineering Ltd 25.88 0.77
Bharat Electronics Ltd. 8.99 0.27
Media & Entertainment 64.64 1.93
Sun TV Network Ltd. 64.64 1.93
Oil 215.49 6.44
Oil & Natu. Gas Co. 145.14 4.34
GE Offshore Ltd. 27.45 0.82
Shiv-Vani Oil&Gas Explor Serv.Ltd. 27.12 0.81
Aban Loyd Chiles Offshore Ltd 15.79 0.47
Petroleum Products 100.21 2.99
H.P.C.L. 55.93 1.67
Reliance Industries Ltd. 44.28 1.32
Pharmaceuticals 204.14 6.1
Lupin Ltd 107.29 3.21
Opto Circuits (India) Ltd 96.85 2.89
Power 244.77 7.31
Tata Power Company Limited 116.22 3.47
GVK Power & Infrastructure Ltd 80.20 2.4
CESC Limited 48.34 1.44
Software 159.62 4.77
Zenith Infotech Limited 58.34 1.74
Geodesic Limited 42.42 1.27
Educomp Limited 32.88 0.98
Tanla Solutions Ltd. 25.98 0.78
Transportation 104.37 3.12
Container Corporation Of India Ltd. 66.36 1.98
Mercator Lines Ltd. 38.02 1.14
Futures 164.13 4.90
Nifty 164.13 4.90
TOTAL 2,393.02 71.49
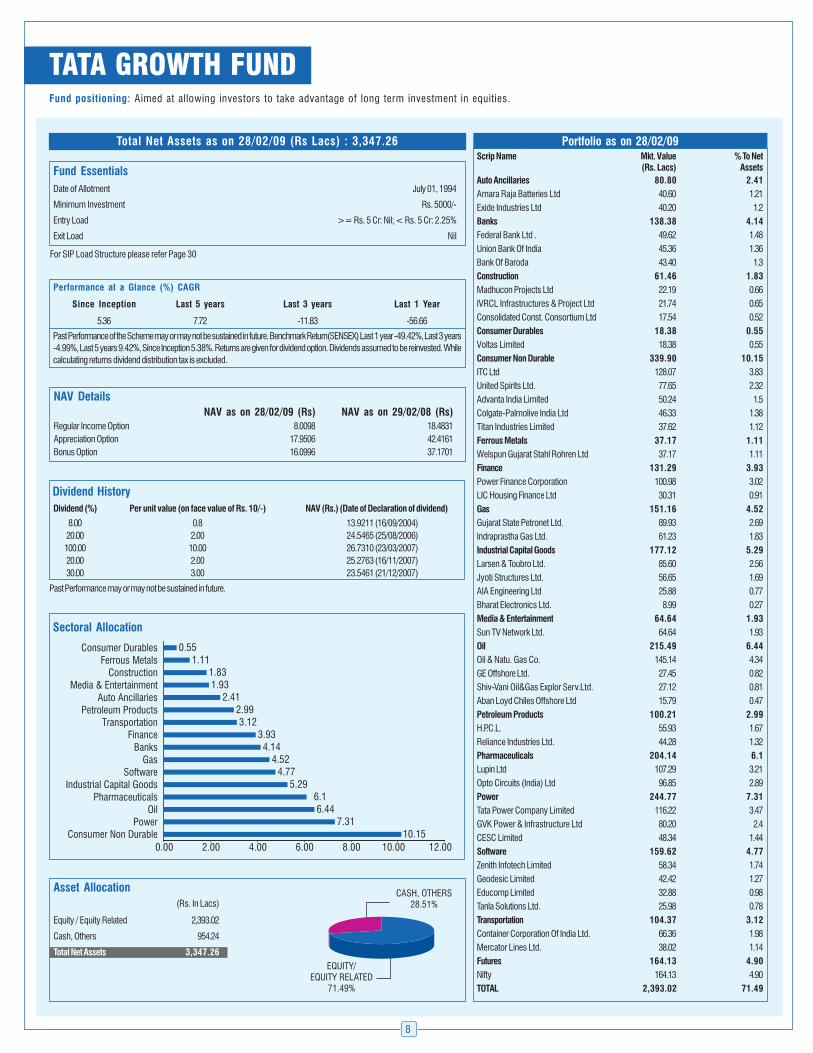
Fund positioning: Aimed at allowing investors to take advantage of long term investment in equities.
NAV Details
NAV as on 28/02/09 (Rs) NAV as on 29/02/08 (Rs)
Regular Income Option 8.0098 18.4831
Appreciation Option 17.9506 42.4161
Bonus Option 16.0996 37.1701
Past Performance of the Scheme may or may not be sustained in future. Benchmark Return(SENSEX) Last 1 year -49.42%, Last 3 years
-4.99%, Last 5 years 9.42%, Since Inception 5.38%. Returns are given for dividend option. Dividends assumed to be reinvested. While
calculating returns dividend distribution tax is excluded.
Performance at a Glance (%) CAGR
Since Inception Last 5 years Last 3 years Last 1 Year
5.36 7.72 -11.83 -56.66
Total Net Assets as on 28/02/09 (Rs Lacs) : 3,347.26
TATA GROWTH FUND
Dividend History
Dividend (%) Per unit value (on face value of Rs. 10/-) NAV (Rs.) (Date of Declaration of dividend)
8.00 0.8 13.9211 (16/09/2004)
20.00 2.00 24.5465 (25/08/2006)
100.00 10.00 26.7310 (23/03/2007)
20.00 2.00 25.2763 (16/11/2007)
30.00 3.00 23.5461 (21/12/2007)
Past Performance may or may not be sustained in future.
Fund Essentials
Date of Allotment July 01, 1994
Minimum Investment Rs. 5000/-
Entry Load >= Rs. 5 Cr: Nil; < Rs. 5 Cr: 2.25%
Exit Load Nil
For SIP Load Structure please refer Page 30
Sectoral Allocation
10.157.31
6.446.1
5.294.77
4.524.14
3.933.12
2.992.41
1.931.83
1.110.55
0.00 2.00 4.00 6.00 8.00 10.00 12.00Consumer Non Durable
PowerOil
PharmaceuticalsIndustrial Capital Goods
SoftwareGas
BanksFinance
TransportationPetroleum Products
Auto AncillariesMedia & Entertainment
ConstructionFerrous Metals
Consumer Durables
Asset Allocation
(Rs. In Lacs)
Equity / Equity Related 2,393.02
Cash, Others 954.24
Total Net Assets 3,347.26
9
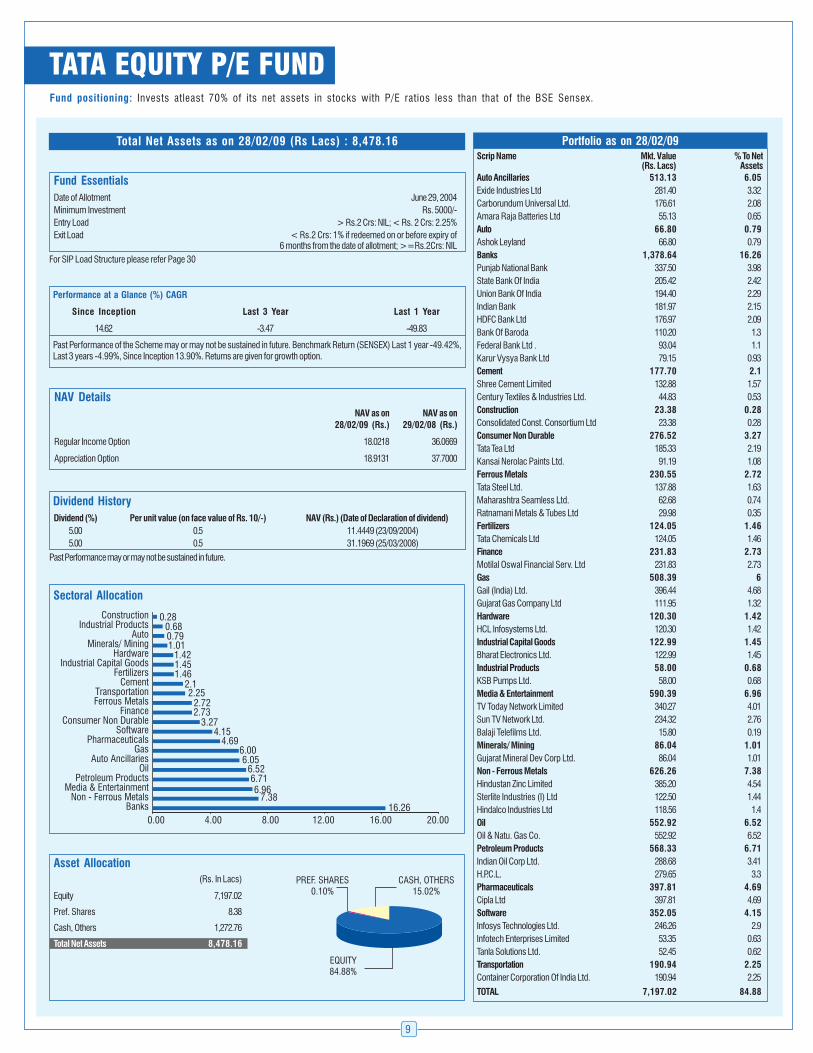
TATA EQUITY P/E FUND
Portfolio as on 28/02/09Scrip Name Mkt. Value % To Net
(Rs. Lacs) Assets
Auto Ancillaries 513.13 6.05
Exide Industries Ltd 281.40 3.32
Carborundum Universal Ltd. 176.61 2.08
Amara Raja Batteries Ltd 55.13 0.65
Auto 66.80 0.79
Ashok Leyland 66.80 0.79
Banks 1,378.64 16.26
Punjab National Bank 337.50 3.98
State Bank Of India 205.42 2.42
Union Bank Of India 194.40 2.29
Indian Bank 181.97 2.15
HDFC Bank Ltd 176.97 2.09
Bank Of Baroda 110.20 1.3
Federal Bank Ltd . 93.04 1.1
Karur Vysya Bank Ltd 79.15 0.93
Cement 177.70 2.1
Shree Cement Limited 132.88 1.57
Century Textiles & Industries Ltd. 44.83 0.53
Construction 23.38 0.28
Consolidated Const. Consortium Ltd 23.38 0.28
Consumer Non Durable 276.52 3.27
Tata Tea Ltd 185.33 2.19
Kansai Nerolac Paints Ltd. 91.19 1.08
Ferrous Metals 230.55 2.72
Tata Steel Ltd. 137.88 1.63
Maharashtra Seamless Ltd. 62.68 0.74
Ratnamani Metals & Tubes Ltd 29.98 0.35
Fertilizers 124.05 1.46
Tata Chemicals Ltd 124.05 1.46
Finance 231.83 2.73
Motilal Oswal Financial Serv. Ltd 231.83 2.73
Gas 508.39 6
Gail (India) Ltd. 396.44 4.68
Gujarat Gas Company Ltd 111.95 1.32
Hardware 120.30 1.42
HCL Infosystems Ltd. 120.30 1.42
Industrial Capital Goods 122.99 1.45
Bharat Electronics Ltd. 122.99 1.45
Industrial Products 58.00 0.68
KSB Pumps Ltd. 58.00 0.68
Media & Entertainment 590.39 6.96
TV Today Network Limited 340.27 4.01
Sun TV Network Ltd. 234.32 2.76
Balaji Telefilms Ltd. 15.80 0.19
Minerals/ Mining 86.04 1.01
Gujarat Mineral Dev Corp Ltd. 86.04 1.01
Non - Ferrous Metals 626.26 7.38
Hindustan Zinc Limited 385.20 4.54
Sterlite Industries (I) Ltd 122.50 1.44
Hindalco Industries Ltd 118.56 1.4
Oil 552.92 6.52
Oil & Natu. Gas Co. 552.92 6.52
Petroleum Products 568.33 6.71
Indian Oil Corp Ltd. 288.68 3.41
H.P.C.L. 279.65 3.3
Pharmaceuticals 397.81 4.69
Cipla Ltd 397.81 4.69
Software 352.05 4.15
Infosys Technologies Ltd. 246.26 2.9
Infotech Enterprises Limited 53.35 0.63
Tanla Solutions Ltd. 52.45 0.62
Transportation 190.94 2.25
Container Corporation Of India Ltd. 190.94 2.25
TOTAL 7,197.02 84.88
Fund positioning: Invests atleast 70% of its net assets in stocks with P/E ratios less than that of the BSE Sensex.
NAV Details
NAV as on NAV as on
28/02/09 (Rs.) 29/02/08 (Rs.)
Regular Income Option 18.0218 36.0669
Appreciation Option 18.9131 37.7000
Total Net Assets as on 28/02/09 (Rs Lacs) : 8,478.16
Past Performance of the Scheme may or may not be sustained in future. Benchmark Return (SENSEX) Last 1 year -49.42%,Last 3 years -4.99%, Since Inception 13.90%. Returns are given for growth option.
Performance at a Glance (%) CAGR
Since Inception Last 3 Year Last 1 Year
14.62 -3.47 -49.83
Fund Essentials
Date of Allotment June 29, 2004
Minimum Investment Rs. 5000/-
Entry Load > Rs.2 Crs: NIL; < Rs. 2 Crs: 2.25%
Exit Load < Rs.2 Crs: 1% if redeemed on or before expiry of6 months from the date of allotment; >=Rs.2Crs: NIL
For SIP Load Structure please refer Page 30
Dividend History
Dividend (%) Per unit value (on face value of Rs. 10/-) NAV (Rs.) (Date of Declaration of dividend)
5.00 0.5 11.4449 (23/09/2004)
5.00 0.5 31.1969 (25/03/2008)
Past Performance may or may not be sustained in future.
Sectoral Allocation
16.267.38
6.966.71
6.526.05
6.004.69
4.153.27
2.732.72
2.252.1
1.461.451.42
1.010.790.68
0.28
0.00 4.00 8.00 12.00 16.00 20.00Banks
Non - Ferrous MetalsMedia & Entertainment
Petroleum ProductsOil
Auto AncillariesGas
PharmaceuticalsSoftware
Consumer Non DurableFinance
Ferrous MetalsTransportation
CementFertilizers
Industrial Capital GoodsHardware
Minerals/ MiningAuto
Industrial ProductsConstruction
Asset Allocation
(Rs. In Lacs)
Equity 7,197.02
Pref. Shares 8.38
Cash, Others 1,272.76
Total Net Assets 8,478.16
10
Past Performance of the Scheme may or may not be sustained in future. Benchmark Return (SENSEX) Last 1 year -49.42%,
Last 3 years -4.99%, Since Inception 9.80%. Returns are given for growth option.
Performance at a Glance (%) CAGR
Since Inception Last 3 Years Last 1 Year
6.19 -6.70 -46.73
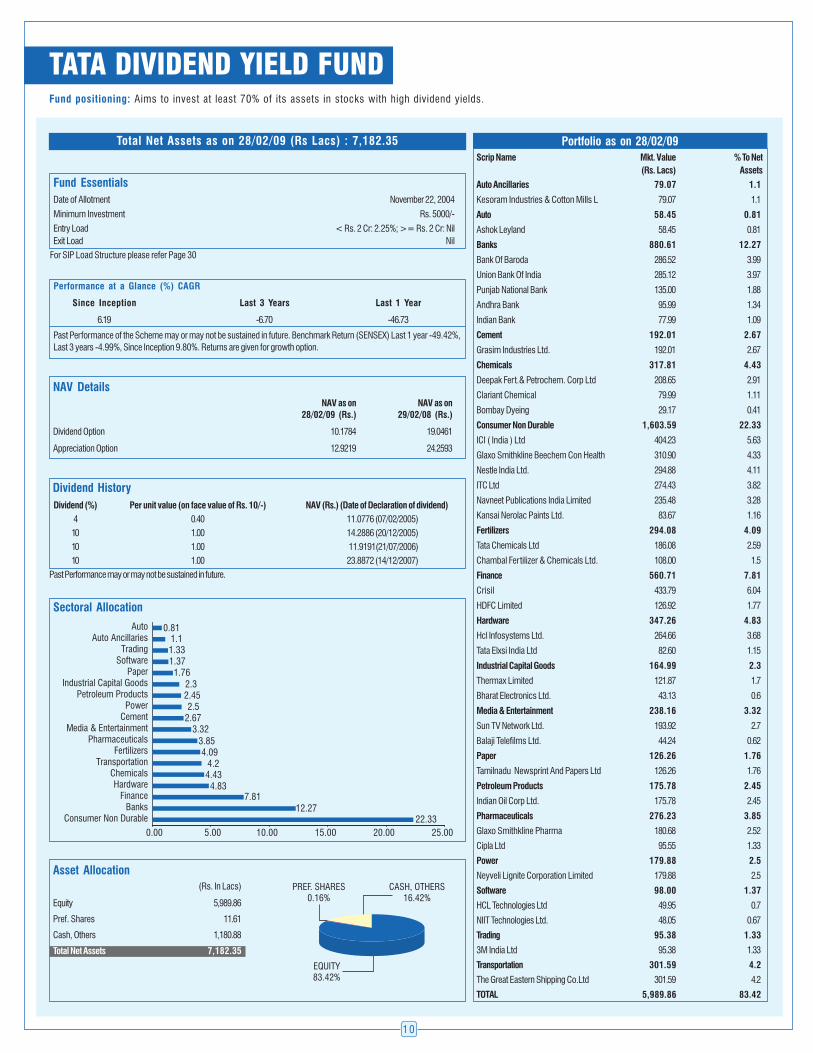
TATA DIVIDEND YIELD FUND
Portfolio as on 28/02/09
Scrip Name Mkt. Value % To Net
(Rs. Lacs) Assets
Auto Ancillaries 79.07 1.1
Kesoram Industries & Cotton Mills L 79.07 1.1
Auto 58.45 0.81
Ashok Leyland 58.45 0.81
Banks 880.61 12.27
Bank Of Baroda 286.52 3.99
Union Bank Of India 285.12 3.97
Punjab National Bank 135.00 1.88
Andhra Bank 95.99 1.34
Indian Bank 77.99 1.09
Cement 192.01 2.67
Grasim Industries Ltd. 192.01 2.67
Chemicals 317.81 4.43
Deepak Fert.& Petrochem. Corp Ltd 208.65 2.91
Clariant Chemical 79.99 1.11
Bombay Dyeing 29.17 0.41
Consumer Non Durable 1,603.59 22.33
ICI ( India ) Ltd 404.23 5.63
Glaxo Smithkline Beechem Con Health 310.90 4.33
Nestle India Ltd. 294.88 4.11
ITC Ltd 274.43 3.82
Navneet Publications India Limited 235.48 3.28
Kansai Nerolac Paints Ltd. 83.67 1.16
Fertilizers 294.08 4.09
Tata Chemicals Ltd 186.08 2.59
Chambal Fertilizer & Chemicals Ltd. 108.00 1.5
Finance 560.71 7.81
Crisil 433.79 6.04
HDFC Limited 126.92 1.77
Hardware 347.26 4.83
Hcl Infosystems Ltd. 264.66 3.68
Tata Elxsi India Ltd 82.60 1.15
Industrial Capital Goods 164.99 2.3
Thermax Limited 121.87 1.7
Bharat Electronics Ltd. 43.13 0.6
Media & Entertainment 238.16 3.32
Sun TV Network Ltd. 193.92 2.7
Balaji Telefilms Ltd. 44.24 0.62
Paper 126.26 1.76
Tamilnadu Newsprint And Papers Ltd 126.26 1.76
Petroleum Products 175.78 2.45
Indian Oil Corp Ltd. 175.78 2.45
Pharmaceuticals 276.23 3.85
Glaxo Smithkline Pharma 180.68 2.52
Cipla Ltd 95.55 1.33
Power 179.88 2.5
Neyveli Lignite Corporation Limited 179.88 2.5
Software 98.00 1.37
HCL Technologies Ltd 49.95 0.7
NIIT Technologies Ltd. 48.05 0.67
Trading 95.38 1.33
3M India Ltd 95.38 1.33
Transportation 301.59 4.2
The Great Eastern Shipping Co.Ltd 301.59 4.2
TOTAL 5,989.86 83.42
NAV Details
NAV as on NAV as on
28/02/09 (Rs.) 29/02/08 (Rs.)
Dividend Option 10.1784 19.0461
Appreciation Option 12.9219 24.2593
Total Net Assets as on 28/02/09 (Rs Lacs) : 7,182.35
Fund Essentials
Date of Allotment November 22, 2004
Minimum Investment Rs. 5000/-
Entry Load < Rs. 2 Cr: 2.25%; >= Rs. 2 Cr: Nil
Exit Load Nil
For SIP Load Structure please refer Page 30
Dividend History
Dividend (%) Per unit value (on face value of Rs. 10/-) NAV (Rs.) (Date of Declaration of dividend)
4 0.40 11.0776 (07/02/2005)
10 1.00 14.2886 (20/12/2005)
10 1.00 11.9191(21/07/2006)
10 1.00 23.8872 (14/12/2007)
Past Performance may or may not be sustained in future.
Sectoral Allocation
22.3312.27
7.814.83
4.434.2
4.093.85
3.322.672.5
2.452.3
1.761.371.331.1
0.81
0.00 5.00 10.00 15.00 20.00 25.00
Consumer Non DurableBanks
FinanceHardware
ChemicalsTransportation
FertilizersPharmaceuticals
Media & EntertainmentCement
PowerPetroleum Products
Industrial Capital GoodsPaper
SoftwareTrading
Auto AncillariesAuto
Asset Allocation
(Rs. In Lacs)
Equity 5,989.86
Pref. Shares 11.61
Cash, Others 1,180.88
Total Net Assets 7,182.35
Fund positioning: Aims to invest at least 70% of its assets in stocks with high dividend yields.

11
Portfolio as on 28/02/09Scrip Name Mkt. Value % To Net
(Rs. Lacs) Assets
Banks 17,167.81 12.66
HDFC Bank Ltd 6,556.83 4.84
State Bank Of India 5,097.19 3.76
Punjab National Bank 2,142.97 1.58
Bank Of Baroda 1,457.50 1.07
AXIS Bank Limited 1,043.85 0.77
ICICI Bank Ltd 869.47 0.64
Cement 1,351.08 1
Rain Commodities Ltd 676.33 0.5
ACC Ltd. 674.75 0.5
Construction 4,182.08 3.09
IVRCL Infrastructures & Project Ltd 1,027.79 0.76
GMR Infrastructure Ltd 996.61 0.74
Jai Prakash Associates Limited 924.88 0.68
Nagarjuna Construction Co Ltd 665.62 0.49
Simplex Infrastructures Ltd. 567.18 0.42
Ferrous Metals 5,420.03 3.99
Jindal Steel & Power Ltd. 2,829.50 2.09
Steel Authority Of India Ltd. 1,535.96 1.13
Usha Martin Ltd 533.19 0.39
Welspun Gujarat Stahl Rohren Ltd 521.38 0.38
Finance 5,471.92 4.04
Rural Electrification Corp. Ltd. 1,532.42 1.13
HDFC Limited 1,479.89 1.09
LIC Housing Finance Ltd 1,297.68 0.96
IDFC Ltd 1,161.93 0.86
Gas 327.00 0.24
Gujarat State Petronet Ltd. 327.00 0.24
Industrial Capital Goods 18,702.36 13.8
Bharat Heavy Electricals Ltd. 8,039.07 5.93
Larsen & Toubro Ltd. 4,437.78 3.27
Crompton Greaves Ltd 2,070.87 1.53
Areva T & D India Ltd. 1,522.13 1.12
Texmaco Ltd. 731.28 0.54
Thermax Limited 726.11 0.54
AIA Engineering Ltd 592.13 0.44
Jyoti Structures Ltd. 582.98 0.43
Industrial Products 503.98 0.37
KSB Pumps Ltd. 503.98 0.37
Oil 9,431.08 6.96
Oil & Natu. Gas Co. 7,710.47 5.69
Cairn India Ltd. 1,720.62 1.27
Petroleum Products 9,744.60 7.19
Reliance Industries Ltd. 6,479.88 4.78
H.P.C.L. 2,167.29 1.6
Indian Oil Corp Ltd. 1,097.44 0.81
Power 15,430.81 11.37
Power Grid Corporation Of India Ltd 6,929.30 5.11
Tata Power Company Limited 4,043.13 2.98
National Thermal Power Corp 1,381.50 1.02
GVK Power & Infrastructure Ltd 1,362.12 1
Reliance Infrastructure Limited 981.20 0.72
KEC International Ltd 733.55 0.54
Telecom - Services 7,837.27 5.78
Bharti Airtel Ltd. 6,283.74 4.63
Reliance Communications Limited 1,553.53 1.15
Futures 7,057.59 5.21
Nifty 7,057.59 5.21
TOTAL 102,627.61 75.69
Fund positioning: Invests predominantly in companies with potential of creating long term value from expected investments in infrastructure oriented sectors.
Total Net Assets as on 28/02/09 (Rs Lacs) : 135,587.22
NAV Details
NAV as on NAV as on
28/02/09 (Rs.) 29/02/08 (Rs.)
Dividend Option 11.8412 26.5895
Appreciation Option 16.7080 36.0571
TATA INFRASTRUCTURE FUND
Fund Essentials
Date of Allotment December 31, 2004
Minimum Investment Rs. 5000/-
Entry Load < Rs. 2 Cr: 2.25%; >= Rs.2 Cr: Nil
Exit Load < Rs. 2 crores: 1% if redeemed on or before expiry of six months from the date of allotment; >=Rs. 2 crores: NIL
For SIP Load Structure please refer Page 30
Dividend History
Dividend (%) Per unit value (on face value of Rs. 10/-) NAV (Rs.) (Date of Declaration of dividend)
4.50 0.45 11.4230 (07/07/2005)
15.00 1.50 22.0400 (10/11/2006)
20.00 2.00 19.0546 (09/03/2007)
20.00 2.00 24.0726 (14/09/2007)
10.00 1.00 24.6787 (11/03/2008)
Past Performance may or may not be sustained in future.
Past Performance of the Scheme may or may not be sustained in future. Returns are given for growth option. Benchmark Return (SENSEX)
Last 1 year -49.42%, Last 3 years -4.99%, Since Inception 7.41%.
Performance at a Glance (%) - CAGR
Since Inception Last 3 Years Last 1 Year
13.12 -1.34 -53.66
Sectoral Allocation
13.8
12.66
11.37
7.196.96
5.78
4.04
3.99
3.09
1
0.37
0.24
0.00 4.00 8.00 12.00 16.00
Industrial Capital Goods
Banks
Power
Petroleum Products
Oil
Telecom - Services
Finance
Ferrous Metals
Construction
Cement
Industrial Products
Gas
Asset Allocation
(Rs. In Lacs)
Equity / Equity Related 102,627.61
Pref. Shares 131.62
Cash, Others 32,827.99
Total Net Assets 135,587.22
12
Portfolio as on 28/02/09Scrip Name Mkt. Value % To Net
(Rs. Lacs) Assets
Banks 1,095.53 15.35
HDFC Bank Ltd 374.29 5.24
Bank Of Baroda 286.74 4.02
Union Bank Of India 226.80 3.18
ICICI Bank Ltd 104.99 1.47
State Bank Of India 102.71 1.44
Construction 408.58 5.72
IVRCL Infrastructures & Project Ltd 163.05 2.28
JMC Projects India Ltd 89.05 1.25
Nagarjuna Construction Co Ltd 84.91 1.19
Simplex Infrastructures Ltd. 49.14 0.69
Sadbhav Engineering Limited 22.43 0.31
Finance 690.77 9.68
Rural Electrification Corp. Ltd. 238.20 3.34
LIC Housing Finance Ltd 196.32 2.75
IDFC Ltd 132.13 1.85
India Infoline Ltd 124.12 1.74
Media & Entertainment 377.81 5.29
ZEE News Ltd. 242.15 3.39
TV Today Network Limited 91.45 1.28
UTV Software Communication Ltd 42.11 0.59
Network 18 Media & Investment Ltd 2.11 0.03
Oil 138.23 1.94
Oil & Natu. Gas Co. 138.23 1.94
Power 653.04 9.15
National Thermal Power Corp 276.30 3.87
Tata Power Company Limited 254.09 3.56
Reliance Infrastructure Limited 122.65 1.72
Software 1,417.56 19.86
Mphasis Ltd. 343.33 4.81
Infosys Technologies Ltd. 246.26 3.45
Oracle Financials Services Software 179.34 2.51
Financial Technologies (I) Ltd 176.64 2.48
On Mobile Global Limited 163.44 2.29
Geodesic Limited 85.11 1.19
Zenith Infotech Limited 78.67 1.1
Tanla Solutions Ltd. 72.69 1.02
NIIT Technologies Ltd. 72.08 1.01
Telecom - Services 155.45 2.18
Reliance Communications Limited 155.45 2.18
Futures 328.26 4.60
Nifty 328.26 4.60
TOTAL 5,265.24 73.78
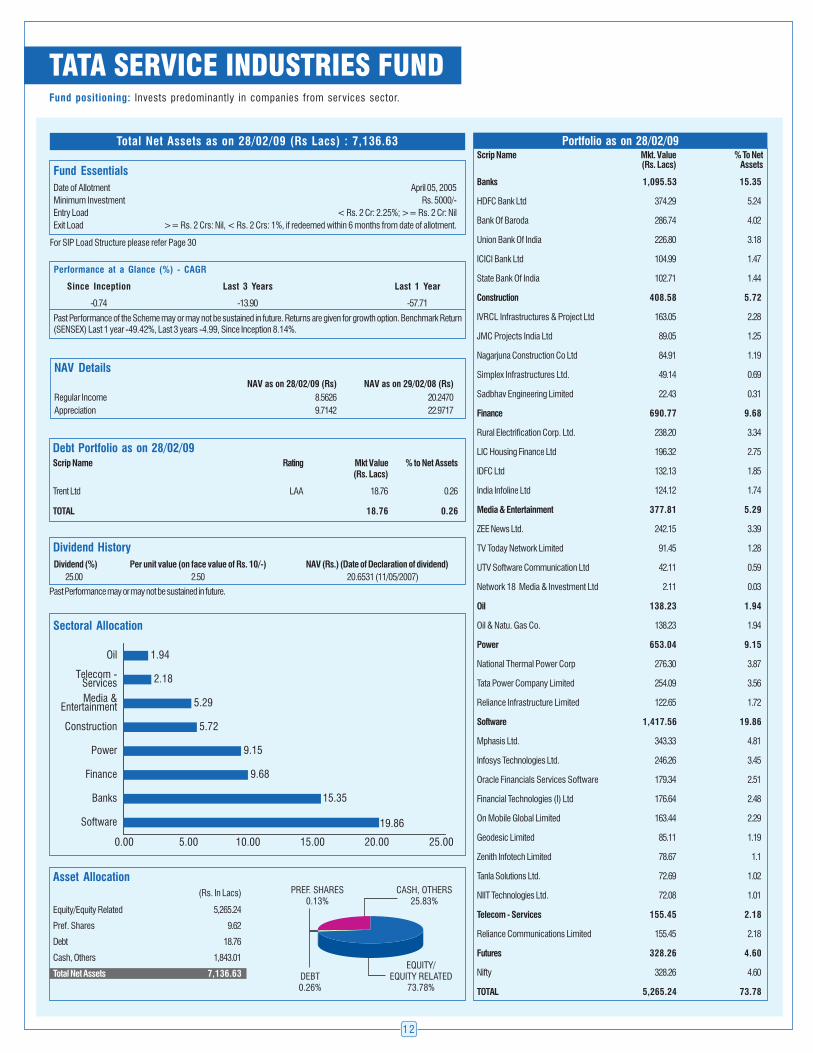
Fund positioning: Invests predominantly in companies from services sector.
NAV Details
NAV as on 28/02/09 (Rs) NAV as on 29/02/08 (Rs)
Regular Income 8.5626 20.2470
Appreciation 9.7142 22.9717
Debt Portfolio as on 28/02/09Scrip Name Rating Mkt Value % to Net Assets
(Rs. Lacs)
Trent Ltd LAA 18.76 0.26
TOTAL 18.76 0.26
Total Net Assets as on 28/02/09 (Rs Lacs) : 7,136.63
Fund Essentials
Date of Allotment April 05, 2005
Minimum Investment Rs. 5000/-
Entry Load < Rs. 2 Cr: 2.25%; >= Rs. 2 Cr: Nil
Exit Load >= Rs. 2 Crs: Nil, < Rs. 2 Crs: 1%, if redeemed within 6 months from date of allotment.
For SIP Load Structure please refer Page 30
TATA SERVICE INDUSTRIES FUND
Dividend History
Dividend (%) Per unit value (on face value of Rs. 10/-) NAV (Rs.) (Date of Declaration of dividend)
25.00 2.50 20.6531 (11/05/2007)
Past Performance may or may not be sustained in future.
Sectoral Allocation
19.86
15.35
9.68
9.15
5.72
5.29
2.18
1.94
0.00 5.00 10.00 15.00 20.00 25.00
Software
Banks
Finance
Power
Construction
Media &Entertainment
Telecom -Services
Oil
Asset Allocation
(Rs. In Lacs)
Equity/Equity Related 5,265.24
Pref. Shares 9.62
Debt 18.76
Cash, Others 1,843.01
Total Net Assets 7,136.63
Past Performance of the Scheme may or may not be sustained in future. Returns are given for growth option. Benchmark Return(SENSEX) Last 1 year -49.42%, Last 3 years -4.99, Since Inception 8.14%.
Performance at a Glance (%) - CAGR
Since Inception Last 3 Years Last 1 Year
-0.74 -13.90 -57.71
13
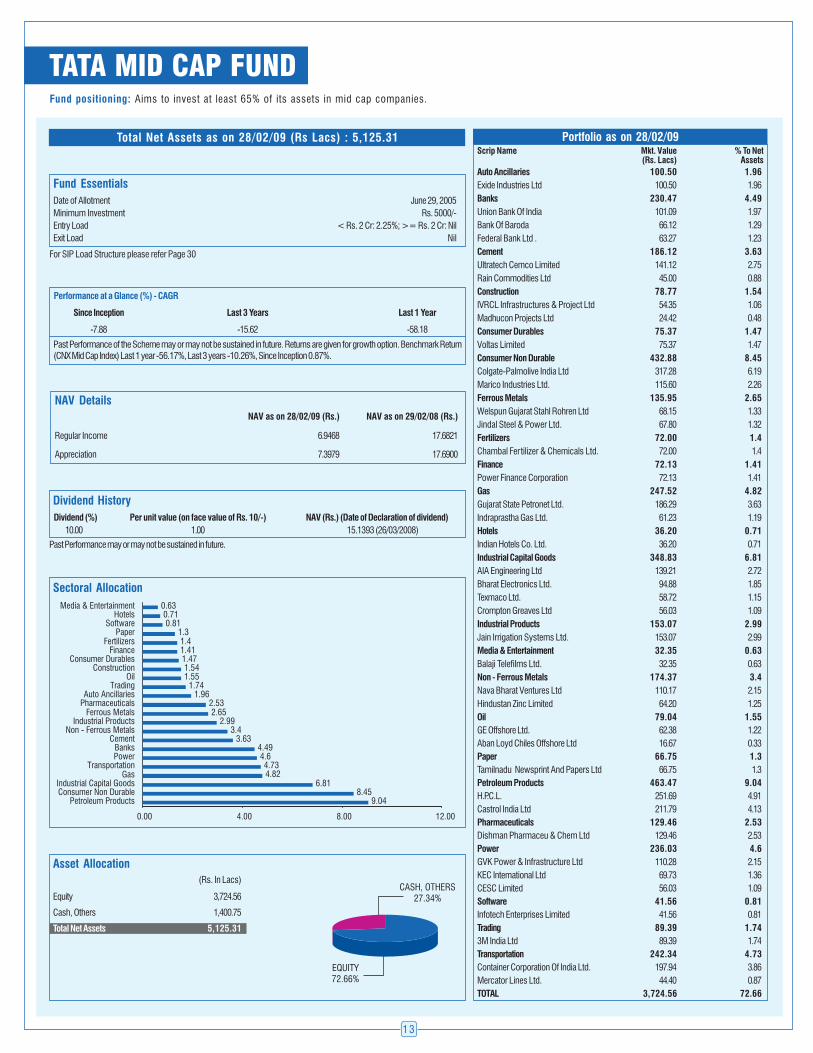
TATA MID CAP FUND
Portfolio as on 28/02/09Scrip Name Mkt. Value % To Net
(Rs. Lacs) Assets
Auto Ancillaries 100.50 1.96
Exide Industries Ltd 100.50 1.96
Banks 230.47 4.49
Union Bank Of India 101.09 1.97
Bank Of Baroda 66.12 1.29
Federal Bank Ltd . 63.27 1.23
Cement 186.12 3.63
Ultratech Cemco Limited 141.12 2.75
Rain Commodities Ltd 45.00 0.88
Construction 78.77 1.54
IVRCL Infrastructures & Project Ltd 54.35 1.06
Madhucon Projects Ltd 24.42 0.48
Consumer Durables 75.37 1.47
Voltas Limited 75.37 1.47
Consumer Non Durable 432.88 8.45
Colgate-Palmolive India Ltd 317.28 6.19
Marico Industries Ltd. 115.60 2.26
Ferrous Metals 135.95 2.65
Welspun Gujarat Stahl Rohren Ltd 68.15 1.33
Jindal Steel & Power Ltd. 67.80 1.32
Fertilizers 72.00 1.4
Chambal Fertilizer & Chemicals Ltd. 72.00 1.4
Finance 72.13 1.41
Power Finance Corporation 72.13 1.41
Gas 247.52 4.82
Gujarat State Petronet Ltd. 186.29 3.63
Indraprastha Gas Ltd. 61.23 1.19
Hotels 36.20 0.71
Indian Hotels Co. Ltd. 36.20 0.71
Industrial Capital Goods 348.83 6.81
AIA Engineering Ltd 139.21 2.72
Bharat Electronics Ltd. 94.88 1.85
Texmaco Ltd. 58.72 1.15
Crompton Greaves Ltd 56.03 1.09
Industrial Products 153.07 2.99
Jain Irrigation Systems Ltd. 153.07 2.99
Media & Entertainment 32.35 0.63
Balaji Telefilms Ltd. 32.35 0.63
Non - Ferrous Metals 174.37 3.4
Nava Bharat Ventures Ltd 110.17 2.15
Hindustan Zinc Limited 64.20 1.25
Oil 79.04 1.55
GE Offshore Ltd. 62.38 1.22
Aban Loyd Chiles Offshore Ltd 16.67 0.33
Paper 66.75 1.3
Tamilnadu Newsprint And Papers Ltd 66.75 1.3
Petroleum Products 463.47 9.04
H.P.C.L. 251.69 4.91
Castrol India Ltd 211.79 4.13
Pharmaceuticals 129.46 2.53
Dishman Pharmaceu & Chem Ltd 129.46 2.53
Power 236.03 4.6
GVK Power & Infrastructure Ltd 110.28 2.15
KEC International Ltd 69.73 1.36
CESC Limited 56.03 1.09
Software 41.56 0.81
Infotech Enterprises Limited 41.56 0.81
Trading 89.39 1.74
3M India Ltd 89.39 1.74
Transportation 242.34 4.73
Container Corporation Of India Ltd. 197.94 3.86
Mercator Lines Ltd. 44.40 0.87
TOTAL 3,724.56 72.66
Fund positioning: Aims to invest at least 65% of its assets in mid cap companies.
Total Net Assets as on 28/02/09 (Rs Lacs) : 5,125.31
NAV Details
NAV as on 28/02/09 (Rs.) NAV as on 29/02/08 (Rs.)
Regular Income 6.9468 17.6821
Appreciation 7.3979 17.6900
Fund Essentials
Date of Allotment June 29, 2005
Minimum Investment Rs. 5000/-
Entry Load < Rs. 2 Cr: 2.25%; >= Rs. 2 Cr: Nil
Exit Load Nil
For SIP Load Structure please refer Page 30
Past Performance of the Scheme may or may not be sustained in future. Returns are given for growth option. Benchmark Return(CNX Mid Cap Index) Last 1 year -56.17%, Last 3 years -10.26%, Since Inception 0.87%.
Performance at a Glance (%) - CAGR
Since Inception Last 3 Years Last 1 Year
-7.88 -15.62 -58.18
Dividend History
Dividend (%) Per unit value (on face value of Rs. 10/-) NAV (Rs.) (Date of Declaration of dividend)
10.00 1.00 15.1393 (26/03/2008)
Past Performance may or may not be sustained in future.
Asset Allocation
(Rs. In Lacs)
Equity 3,724.56
Cash, Others 1,400.75
Total Net Assets 5,125.31
Sectoral Allocation
14
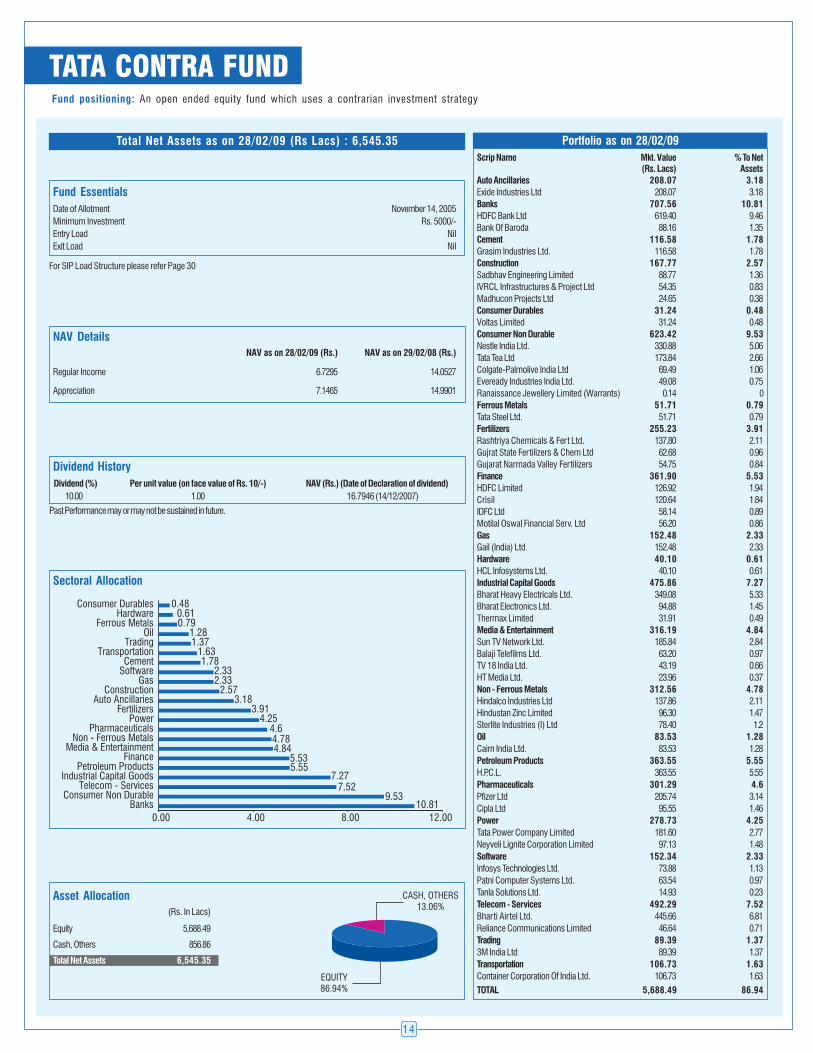
Fund positioning: An open ended equity fund which uses a contrarian investment strategy
TATA CONTRA FUND
Portfolio as on 28/02/09
Scrip Name Mkt. Value % To Net(Rs. Lacs) Assets
Auto Ancillaries 208.07 3.18
Exide Industries Ltd 208.07 3.18
Banks 707.56 10.81
HDFC Bank Ltd 619.40 9.46
Bank Of Baroda 88.16 1.35
Cement 116.58 1.78
Grasim Industries Ltd. 116.58 1.78
Construction 167.77 2.57
Sadbhav Engineering Limited 88.77 1.36
IVRCL Infrastructures & Project Ltd 54.35 0.83
Madhucon Projects Ltd 24.65 0.38
Consumer Durables 31.24 0.48
Voltas Limited 31.24 0.48
Consumer Non Durable 623.42 9.53
Nestle India Ltd. 330.88 5.06
Tata Tea Ltd 173.84 2.66
Colgate-Palmolive India Ltd 69.49 1.06
Eveready Industries India Ltd. 49.08 0.75
Ranaissance Jewellery Limited (Warrants) 0.14 0
Ferrous Metals 51.71 0.79
Tata Steel Ltd. 51.71 0.79
Fertilizers 255.23 3.91
Rashtriya Chemicals & Fert Ltd. 137.80 2.11
Gujrat State Fertilizers & Chem Ltd 62.68 0.96
Gujarat Narmada Valley Fertilizers 54.75 0.84
Finance 361.90 5.53
HDFC Limited 126.92 1.94
Crisil 120.64 1.84
IDFC Ltd 58.14 0.89
Motilal Oswal Financial Serv. Ltd 56.20 0.86
Gas 152.48 2.33
Gail (India) Ltd. 152.48 2.33
Hardware 40.10 0.61
HCL Infosystems Ltd. 40.10 0.61
Industrial Capital Goods 475.86 7.27
Bharat Heavy Electricals Ltd. 349.08 5.33
Bharat Electronics Ltd. 94.88 1.45
Thermax Limited 31.91 0.49
Media & Entertainment 316.19 4.84
Sun TV Network Ltd. 185.84 2.84
Balaji Telefilms Ltd. 63.20 0.97
TV 18 India Ltd. 43.19 0.66
HT Media Ltd. 23.96 0.37
Non - Ferrous Metals 312.56 4.78
Hindalco Industries Ltd 137.86 2.11
Hindustan Zinc Limited 96.30 1.47
Sterlite Industries (I) Ltd 78.40 1.2
Oil 83.53 1.28
Cairn India Ltd. 83.53 1.28
Petroleum Products 363.55 5.55
H.P.C.L. 363.55 5.55
Pharmaceuticals 301.29 4.6
Pfizer Ltd 205.74 3.14
Cipla Ltd 95.55 1.46
Power 278.73 4.25
Tata Power Company Limited 181.60 2.77
Neyveli Lignite Corporation Limited 97.13 1.48
Software 152.34 2.33
Infosys Technologies Ltd. 73.88 1.13
Patni Computer Systems Ltd. 63.54 0.97
Tanla Solutions Ltd. 14.93 0.23
Telecom - Services 492.29 7.52
Bharti Airtel Ltd. 445.66 6.81
Reliance Communications Limited 46.64 0.71
Trading 89.39 1.37
3M India Ltd 89.39 1.37
Transportation 106.73 1.63
Container Corporation Of India Ltd. 106.73 1.63
TOTAL 5,688.49 86.94
Total Net Assets as on 28/02/09 (Rs Lacs) : 6,545.35
NAV Details
NAV as on 28/02/09 (Rs.) NAV as on 29/02/08 (Rs.)
Regular Income 6.7295 14.0527
Appreciation 7.1465 14.9901
Fund Essentials
Date of Allotment November 14, 2005
Minimum Investment Rs. 5000/-
Entry Load Nil
Exit Load Nil
For SIP Load Structure please refer Page 30
Sectoral Allocation
10.819.53
7.527.27
5.555.53
4.844.784.6
4.253.91
3.182.57
2.332.33
1.781.63
1.371.28
0.790.61
0.48
0.00 4.00 8.00 12.00Banks
Consumer Non DurableTelecom - Services
Industrial Capital GoodsPetroleum Products
FinanceMedia & Entertainment
Non - Ferrous MetalsPharmaceuticals
PowerFertilizers
Auto AncillariesConstruction
GasSoftwareCement
TransportationTrading
OilFerrous Metals
HardwareConsumer Durables
Asset Allocation
(Rs. In Lacs)
Equity 5,688.49
Cash, Others 856.86
Total Net Assets 6,545.35
Dividend History
Dividend (%) Per unit value (on face value of Rs. 10/-) NAV (Rs.) (Date of Declaration of dividend)
10.00 1.00 16.7946 (14/12/2007)
Past Performance may or may not be sustained in future.
15
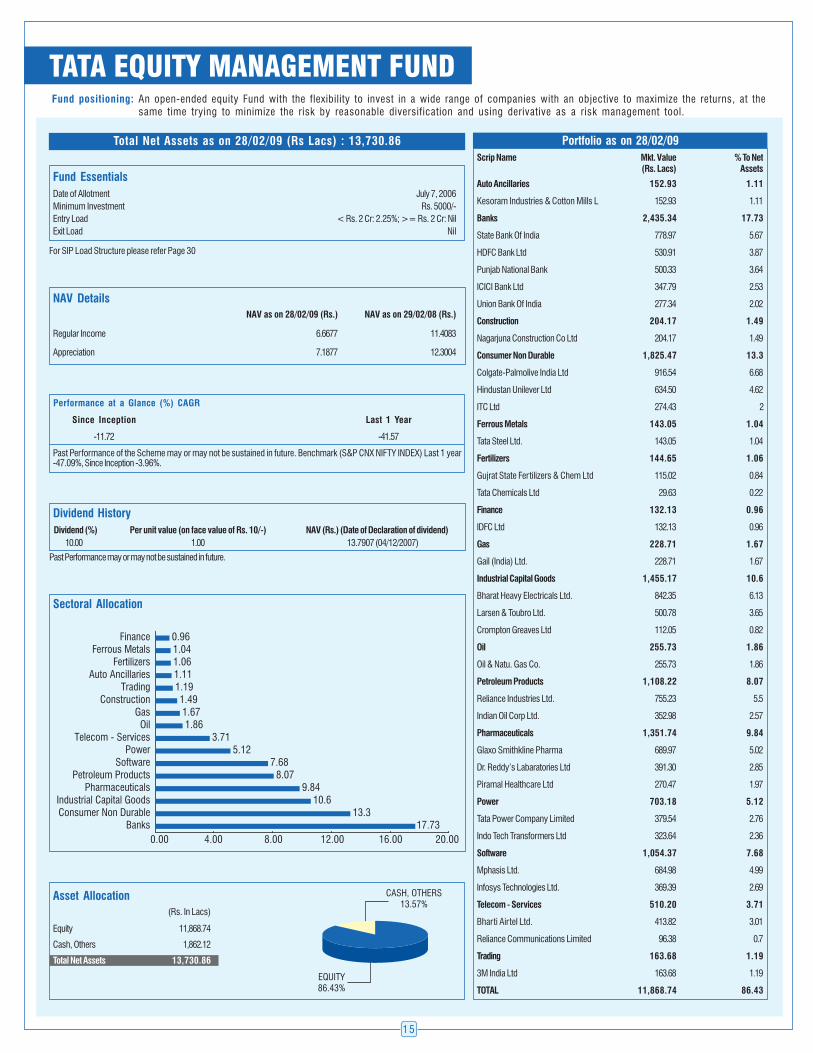
Fund positioning: An open-ended equity Fund with the flexibility to invest in a wide range of companies with an objective to maximize the returns, at thesame time trying to minimize the risk by reasonable diversification and using derivative as a risk management tool.
TATA EQUITY MANAGEMENT FUND
Portfolio as on 28/02/09
Scrip Name Mkt. Value % To Net(Rs. Lacs) Assets
Auto Ancillaries 152.93 1.11
Kesoram Industries & Cotton Mills L 152.93 1.11
Banks 2,435.34 17.73
State Bank Of India 778.97 5.67
HDFC Bank Ltd 530.91 3.87
Punjab National Bank 500.33 3.64
ICICI Bank Ltd 347.79 2.53
Union Bank Of India 277.34 2.02
Construction 204.17 1.49
Nagarjuna Construction Co Ltd 204.17 1.49
Consumer Non Durable 1,825.47 13.3
Colgate-Palmolive India Ltd 916.54 6.68
Hindustan Unilever Ltd 634.50 4.62
ITC Ltd 274.43 2
Ferrous Metals 143.05 1.04
Tata Steel Ltd. 143.05 1.04
Fertilizers 144.65 1.06
Gujrat State Fertilizers & Chem Ltd 115.02 0.84
Tata Chemicals Ltd 29.63 0.22
Finance 132.13 0.96
IDFC Ltd 132.13 0.96
Gas 228.71 1.67
Gail (India) Ltd. 228.71 1.67
Industrial Capital Goods 1,455.17 10.6
Bharat Heavy Electricals Ltd. 842.35 6.13
Larsen & Toubro Ltd. 500.78 3.65
Crompton Greaves Ltd 112.05 0.82
Oil 255.73 1.86
Oil & Natu. Gas Co. 255.73 1.86
Petroleum Products 1,108.22 8.07
Reliance Industries Ltd. 755.23 5.5
Indian Oil Corp Ltd. 352.98 2.57
Pharmaceuticals 1,351.74 9.84
Glaxo Smithkline Pharma 689.97 5.02
Dr. Reddy’s Labaratories Ltd 391.30 2.85
Piramal Healthcare Ltd 270.47 1.97
Power 703.18 5.12
Tata Power Company Limited 379.54 2.76
Indo Tech Transformers Ltd 323.64 2.36
Software 1,054.37 7.68
Mphasis Ltd. 684.98 4.99
Infosys Technologies Ltd. 369.39 2.69
Telecom - Services 510.20 3.71
Bharti Airtel Ltd. 413.82 3.01
Reliance Communications Limited 96.38 0.7
Trading 163.68 1.19
3M India Ltd 163.68 1.19
TOTAL 11,868.74 86.43
Total Net Assets as on 28/02/09 (Rs Lacs) : 13,730.86
NAV Details
NAV as on 28/02/09 (Rs.) NAV as on 29/02/08 (Rs.)
Regular Income 6.6677 11.4083
Appreciation 7.1877 12.3004
Fund Essentials
Date of Allotment July 7, 2006
Minimum Investment Rs. 5000/-
Entry Load < Rs. 2 Cr: 2.25%; >= Rs. 2 Cr: Nil
Exit Load Nil
For SIP Load Structure please refer Page 30
Sectoral Allocation
0.00 4.00 8.00 12.00 16.00 20.0017.73
13.310.6
9.848.07
7.685.12
3.711.86
1.671.49
1.191.111.061.040.96
BanksConsumer Non DurableIndustrial Capital Goods
PharmaceuticalsPetroleum Products
SoftwarePower
Telecom - ServicesOil
GasConstruction
TradingAuto Ancillaries
FertilizersFerrous Metals
Finance
Dividend History
Dividend (%) Per unit value (on face value of Rs. 10/-) NAV (Rs.) (Date of Declaration of dividend)
10.00 1.00 13.7907 (04/12/2007)
Past Performance may or may not be sustained in future.
Past Performance of the Scheme may or may not be sustained in future. Benchmark (S&P CNX NIFTY INDEX) Last 1 year-47.09%, Since Inception -3.96%.
Performance at a Glance (%) CAGR
Since Inception Last 1 Year
-11.72 -41.57
Asset Allocation
(Rs. In Lacs)
Equity 11,868.74
Cash, Others 1,862.12
Total Net Assets 13,730.86
16
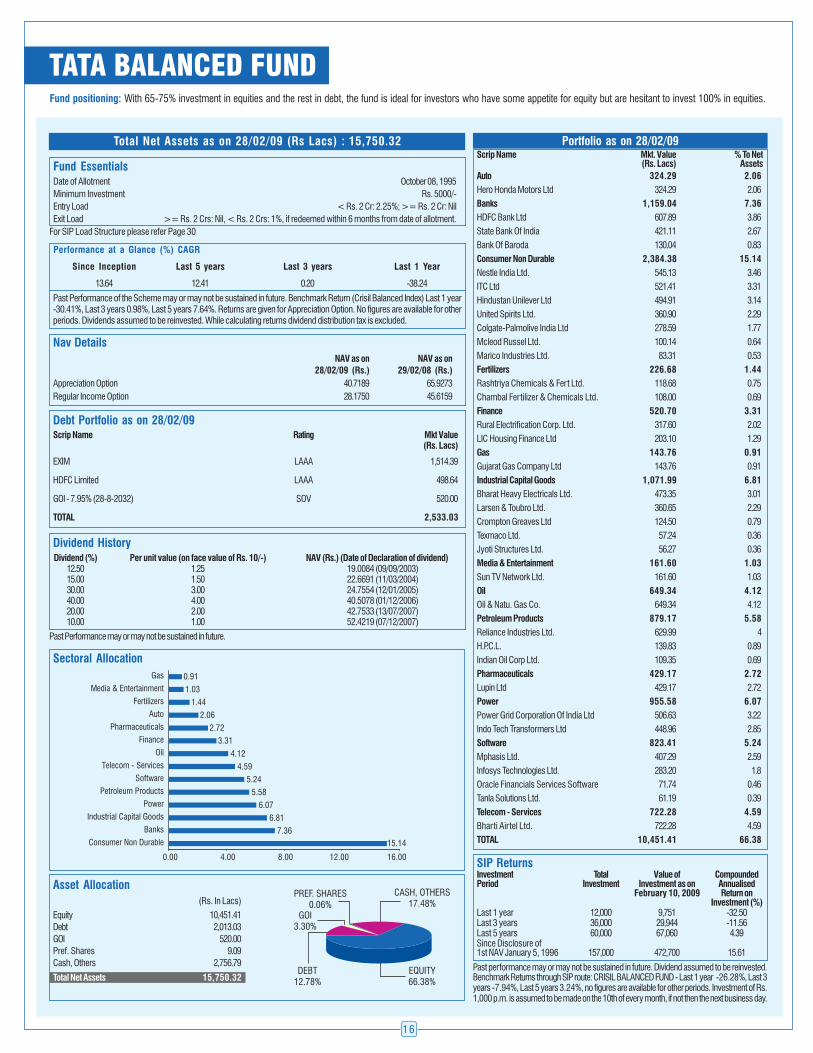
TATA BALANCED FUND
Portfolio as on 28/02/09Scrip Name Mkt. Value % To Net
(Rs. Lacs) Assets
Auto 324.29 2.06
Hero Honda Motors Ltd 324.29 2.06
Banks 1,159.04 7.36
HDFC Bank Ltd 607.89 3.86
State Bank Of India 421.11 2.67
Bank Of Baroda 130.04 0.83
Consumer Non Durable 2,384.38 15.14
Nestle India Ltd. 545.13 3.46
ITC Ltd 521.41 3.31
Hindustan Unilever Ltd 494.91 3.14
United Spirits Ltd. 360.90 2.29
Colgate-Palmolive India Ltd 278.59 1.77
Mcleod Russel Ltd. 100.14 0.64
Marico Industries Ltd. 83.31 0.53
Fertilizers 226.68 1.44
Rashtriya Chemicals & Fert Ltd. 118.68 0.75
Chambal Fertilizer & Chemicals Ltd. 108.00 0.69
Finance 520.70 3.31
Rural Electrification Corp. Ltd. 317.60 2.02
LIC Housing Finance Ltd 203.10 1.29
Gas 143.76 0.91
Gujarat Gas Company Ltd 143.76 0.91
Industrial Capital Goods 1,071.99 6.81
Bharat Heavy Electricals Ltd. 473.35 3.01
Larsen & Toubro Ltd. 360.65 2.29
Crompton Greaves Ltd 124.50 0.79
Texmaco Ltd. 57.24 0.36
Jyoti Structures Ltd. 56.27 0.36
Media & Entertainment 161.60 1.03
Sun TV Network Ltd. 161.60 1.03
Oil 649.34 4.12
Oil & Natu. Gas Co. 649.34 4.12
Petroleum Products 879.17 5.58
Reliance Industries Ltd. 629.99 4
H.P.C.L. 139.83 0.89
Indian Oil Corp Ltd. 109.35 0.69
Pharmaceuticals 429.17 2.72
Lupin Ltd 429.17 2.72
Power 955.58 6.07
Power Grid Corporation Of India Ltd 506.63 3.22
Indo Tech Transformers Ltd 448.96 2.85
Software 823.41 5.24
Mphasis Ltd. 407.29 2.59
Infosys Technologies Ltd. 283.20 1.8
Oracle Financials Services Software 71.74 0.46
Tanla Solutions Ltd. 61.19 0.39
Telecom - Services 722.28 4.59
Bharti Airtel Ltd. 722.28 4.59
TOTAL 10,451.41 66.38
Fund positioning: With 65-75% investment in equities and the rest in debt, the fund is ideal for investors who have some appetite for equity but are hesitant to invest 100% in equities.
Past Performance of the Scheme may or may not be sustained in future. Benchmark Return (Crisil Balanced Index) Last 1 year-30.41%, Last 3 years 0.98%, Last 5 years 7.64%. Returns are given for Appreciation Option. No figures are available for otherperiods. Dividends assumed to be reinvested. While calculating returns dividend distribution tax is excluded.
Performance at a Glance (%) CAGR
Since Inception Last 5 years Last 3 years Last 1 Year
13.64 12.41 0.20 -38.24
Nav Details
NAV as on NAV as on
28/02/09 (Rs.) 29/02/08 (Rs.)
Appreciation Option 40.7189 65.9273
Regular Income Option 28.1750 45.6159
Total Net Assets as on 28/02/09 (Rs Lacs) : 15,750.32
Fund EssentialsDate of Allotment October 08, 1995
Minimum Investment Rs. 5000/-
Entry Load < Rs. 2 Cr: 2.25%; >= Rs. 2 Cr: Nil
Exit Load >= Rs. 2 Crs: Nil, < Rs. 2 Crs: 1%, if redeemed within 6 months from date of allotment.
For SIP Load Structure please refer Page 30
Debt Portfolio as on 28/02/09Scrip Name Rating Mkt Value
(Rs. Lacs)
EXIM LAAA 1,514.39
HDFC Limited LAAA 498.64
GOI - 7.95% (28-8-2032) SOV 520.00
TOTAL 2,533.03
Dividend HistoryDividend (%) Per unit value (on face value of Rs. 10/-) NAV (Rs.) (Date of Declaration of dividend)
12.50 1.25 19.0084 (09/09/2003)15.00 1.50 22.6691 (11/03/2004)30.00 3.00 24.7554 (12/01/2005)40.00 4.00 40.5078 (01/12/2006)20.00 2.00 42.7533 (13/07/2007)10.00 1.00 52.4219 (07/12/2007)
Past Performance may or may not be sustained in future.
Sectoral Allocation
15.147.36
6.81
6.07
5.58
5.24
4.59
4.12
3.31
2.72
2.06
1.44
1.03
0.91
0.00 4.00 8.00 12.00 16.00
Consumer Non Durable
Banks
Industrial Capital Goods
Power
Petroleum Products
Software
Telecom - Services
Oil
Finance
Pharmaceuticals
Auto
Fertilizers
Media & Entertainment
Gas
Asset Allocation
(Rs. In Lacs)
Equity 10,451.41
Debt 2,013.03
GOI 520.00
Pref. Shares 9.09
Cash, Others 2,756.79
Total Net Assets 15,750.32
SIP ReturnsInvestment Total Value of CompoundedPeriod Investment Investment as on Annualised
February 10, 2009 Return onInvestment (%)
Last 1 year 12,000 9,751 -32.50Last 3 years 36,000 29,944 -11.56Last 5 years 60,000 67,060 4.39Since Disclosure of1st NAV January 5, 1996 157,000 472,700 15.61
Past performance may or may not be sustained in future. Dividend assumed to be reinvested.Benchmark Returns through SIP route: CRISIL BALANCED FUND - Last 1 year -26.28%, Last 3years -7.94%, Last 5 years 3.24%, no figures are available for other periods. Investment of Rs.1,000 p.m. is assumed to be made on the 10th of every month, if not then the next business day.
17
TATA YOUNG CITIZENS' FUND
Portfolio as on 28/02/09Scrip Name Mkt. Value % To Net
(Rs. Lacs) Assets
Auto Ancillaries 103.35 0.83
Mico - Motor Industries Co. Ltd 103.35 0.83
Auto 74.31 0.59
Mahindra & Mahindra Ltd. 74.31 0.59
Banks 623.66 4.99
HDFC Bank Ltd 309.70 2.48
Punjab National Bank 203.80 1.63
Union Bank Of India 110.16 0.88
Consumer Non Durable 1,347.88 10.77
Hindustan Unilever Ltd 634.50 5.07
Colgate-Palmolive India Ltd 347.44 2.78
ITC Ltd 182.95 1.46
Titan Industries Limited 67.72 0.54
Advanta India Limited 62.48 0.50
Glaxo Smithkline Beechem Con Health 52.80 0.42
Ferrous Metals 235.38 1.88
Jindal Steel & Power Ltd. 156.47 1.25
Tata Steel Ltd. 64.63 0.52
PSL Limited 14.28 0.11
Industrial Capital Goods 613.82 4.90
Crompton Greaves Ltd 183.02 1.46
Thermax Limited 111.76 0.89
ABB Ltd 104.19 0.83
Jyoti Structures Ltd. 76.73 0.61
Larsen & Toubro Ltd. 74.60 0.60
Bharat Heavy Electricals Ltd. 63.53 0.51
Oil 82.34 0.66
GE Offshore Ltd. 82.34 0.66
Pesticides 76.10 0.61
United Phosphorus Ltd. 76.10 0.61
Petroleum Products 215.06 1.72
Reliance Industries Ltd. 215.06 1.72
Pharmaceuticals 276.21 2.21
Lupin Ltd 115.97 0.93
Dr. Reddy’s Labaratories Ltd 97.83 0.78
Piramal Healthcare Ltd 62.42 0.50
Power 572.08 4.57
National Thermal Power Corp 184.20 1.47
Tata Power Company Limited 181.60 1.45
Power Grid Corporation Of India Ltd 116.10 0.93
KEC International Ltd 90.18 0.72
Software 357.75 2.86
Mphasis Ltd. 291.16 2.33
Tata Consultancy Services Limited 66.59 0.53
Telecom - Services 181.74 1.45
Bharti Airtel Ltd. 127.33 1.02
Reliance Communications Limited 54.41 0.43
Trading 35.75 0.29
3M India Ltd 35.75 0.29
TOTAL 4,795.45 38.33
Bonus HistoryBonus Units in March' 1999 1:3
Bonus Units in March' 2000 1:2
Bonus Units in Nov' 2003 1:4
Bonus Units in Nov' 2007 1:2
Fund positioning: An open-ended balanced scheme aimed at helping parents / guardians / well-wishers to save for the financial needs of growing children.
Past Performance of the Scheme may or may not be sustained in future. Benchmark Return (Crisil Balanced Index) Last 1 year -30.41%,Last 3 years 18.98%, Last 5 years 7.64%. No figures are available for other periods.
Performance at a Glance (%) CAGR
Since Inception Last 5 years Last 3 years Last 1 Year
12.51 8.41 0.23 -22.69
NAV Details
NAV as on 28/02/09(Rs) 12.9180
NAV as on 29/02/08(Rs) 16.7101
Total Net Assets as on 28/02/09 (Rs Lacs) : 12,509.81
Fund EssentialsDate of Allotment October 14, 1995
Minimum Investment Rs. 500/-Entry Load: Compulsory Lock-in Option: 2.5%. Anytime Exit Option: 2.5%.
Exit Load: Compulsory Lock-in Option: 3% if redeemed on or before expiry of 3 years from the date of allotment. (Thisload will be applicable when the lock-in period expires before 3 years from the date of allotment). Anytime Exit Option:If child attains majority after 7 years from the date of allotment: If redeemed on or before expiry of 3 years from thedate of allotment: 3% If redeemed after 3 years but on or before 7 years from the date of allotment: 2% If redeemedafter 7 years but before child attains majority: 1% No load after the child attains majority If child attains majority before7 years from the date of allotment: If redeemed on or before expiry of 3 years from the date of allotment: 3% Ifredeemed after 3 years but on or before 7 years from the date of allotment: 2% If redeemed after 7 years: Nil.
For SIP Load Structure please refer Page 30
Debt Portfolio as on 28/02/09Scrip Name Rating Mkt Value
(Rs. Lacs)
EXIM LAAA 2,020.18
State Bank Of Travancore LAAA 544.91
NABARD AAA 519.18
Punjab National Bank F1+ 499.88
AXIS Bank Limited LAA+ 478.66
Bank Of Baroda A1+ 471.85
Power Finance Corporation AAA 1,393.22
TOTAL 5,927.87
Past Performance of the Scheme may or may not be sustained in future.
Sectoral Allocation
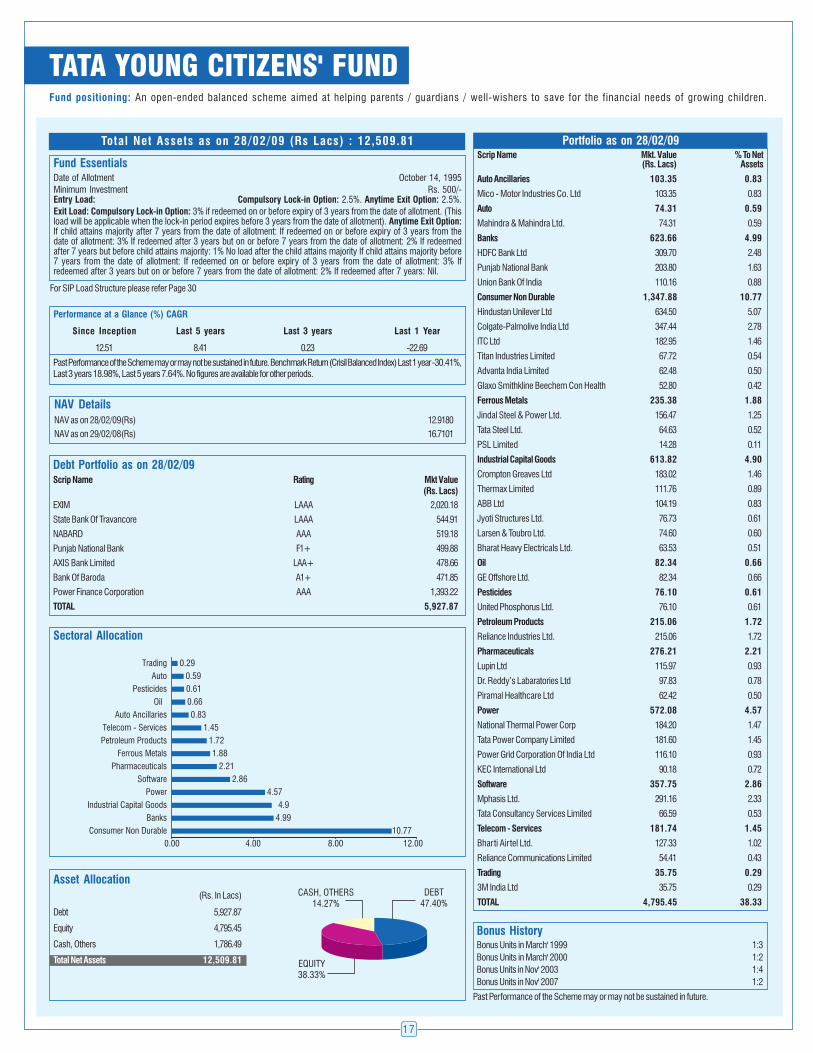
10.774.994.9
4.572.86
2.211.88
1.721.45
0.830.660.610.59
0.29
0.00 4.00 8.00 12.00Consumer Non Durable
BanksIndustrial Capital Goods
PowerSoftware
PharmaceuticalsFerrous Metals
Petroleum ProductsTelecom - Services
Auto AncillariesOil
PesticidesAuto
Trading
Asset Allocation
(Rs. In Lacs)
Debt 5,927.87
Equity 4,795.45
Cash, Others 1,786.49
Total Net Assets 12,509.81
18
TATA FLOATER FUND
Fund Essentials
Date of Allotment: September 06, 2005
Average Maturity: 0.24 years
Minimum Investment: Rs. 10,000/-
Entry Load 0.5%<= Rs. 5 lacs; Nil > Rs. 5 lacs.
Exit Load For amt < Rs. 5 Lakhs: 0.50% if redeemed before expiry of
30 days from the date of allotment. For amt >= Rs. 5 Lakhs: Nil.
Total Net Assets as on 28/02/09 (Rs Lacs) : 612,165.96
Nav DetailsOption NAV as on 28/02/09 (Rs) NAV as on 29/02/08 (Rs)
DIV DAILY 10.0356 10.0356
DIV WEEKLY 10.0893 10.0876
GROWTH 12.9984 11.8987
Debt Portfolio as on 28/02/09Scrip Name Rating Mkt. Value (Rs. Lacs)ICICI Bank Ltd A1+ 62,645.77Canara Bank P1+ 44,574.08Punjab National Bank F1+ 38,176.37UCO Bank P1+ 37,236.55Allahabad Bank A1+ 24,424.86Vijaya Bank PR1+ 16,121.47IDBI Bank Ltd. A1+ 15,319.18Dena Bank F1+ 14,151.06AXIS Bank Limited P1+ 13,611.15State Bank Of Bikaner & Jaipur P1+ 12,200.98NABARD AAA 10,524.39State Bank Of Mysore A1+ 9,803.91Corporation Bank P1+ 9,753.84State Bank Of Patiala A1+ 8,806.50Karnataka Bank Ltd A1+ 7,320.71Canara Bank A1+ 4,971.86Hongkong & Shanghai Banking Corpn L A1+ 4,872.20Federal Bank Ltd . F1+ 4,318.47Jammu And Kashmir Bank P1+ 4,318.47ICICI Bank Ltd AAA 3,962.43Kotak Mahindra Bank P1+ 2,443.67Syndicate Bank PR1+ 2,428.04National Housing Bank AAA 1,455.82State Bank Of Bikaner & Jaipur A1+ 1,180.65Indian Bank F1+ 996.61YES Bank Ltd. A1+ 986.12Centurion Bank Of Punjab Ltd F1+ 99.78Tata Tea Ltd AA+ 508.05Sundaram Fin Ltd LAA+ 10,000.00Global Trade Finance Limited P1+ 9,963.31Gruh Finance Limited P1+ 9,945.41HDFC Limited LAAA 7,958.73IL&FS Ltd F1+ 5,000.00Sbi Factors & Com Ser Pvt.Ltd A1+ 5,000.00L & T Finance Ltd PR1+ 4,914.24IDBI Homefinance Ltd A1+ 4,889.59HDFC Limited A1+ 4,856.96Cholamandalam DBS Fin Ltd A1+ 4,837.96Corporate Debt Trust 2008-09 SR 5 AAA SO 4,704.18Indian Corp Loan Sec Trust-SR LXI AAA SO 4,001.94HDFC Limited AAA 3,562.69Corp Loan Sec SR XXIX Trust 2006 P1+ SO 2,585.09Mah & Mah Fin Ser Ltd AA+ 2,541.18Cholamandalam Dbs Fin Ltd LAA 2,520.04Indian Railway Finance Corp AAA 2,500.86Power Finance Corporation AAA 2,438.13Kotak Mahindra Prime Ltd LAA 2,092.65IDFC Ltd LAAA 1,521.81Sundaram Fin Ltd AA+ 1,398.56Indian Retail ABS Trust 85 AAA 1,320.64Power Finance Corporation P1+ 937.49Citifinancial Retail Serv AA+ 499.37DSP Merill Lynch Capital Ltd AA+ 493.77Citifinancial Consumer Limited AA+ 438.64Indian Railway Finance Corp LAAA 206.05Indian Retail ABS Trust 83 LAAA 123.22Rural Electrification Corp. Ltd. AAA 104.75Citicorp Maru Fin Ltd. AA+ 30.17LIC Housing Finance Ltd AAA 19.54GOI 6.96% Oil Bond 2009 SOV 16,038.40T Bill SOV 7,421.75Raymond Ltd. PR1+ 2,893.14Aditya Birla Nuvo Ltd A1+ 2,413.92TOTAL 487,387.15
Asset Allocation
(Rs. In Lacs)
Debt 463,927.00
GOI / T BILL 23,460.15
Cash, Others 124,778.81
Total Net Assets 612,165.96
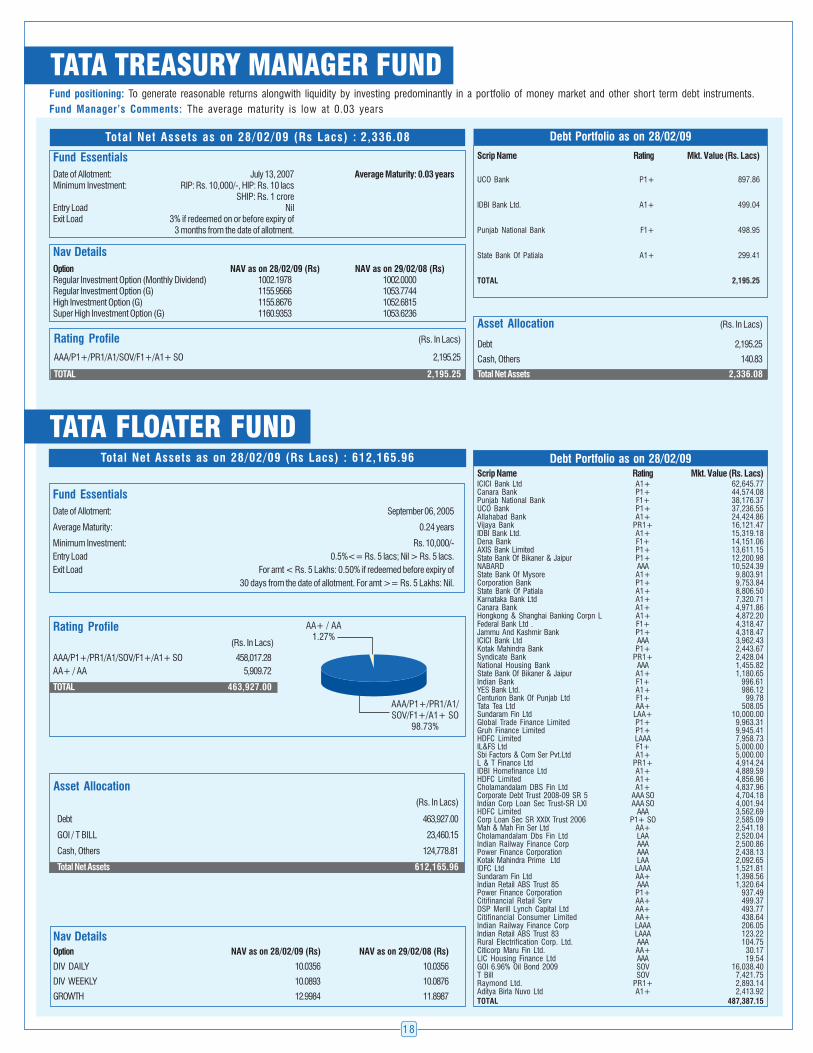
Rating Profile
(Rs. In Lacs)
AAA/P1+/PR1/A1/SOV/F1+/A1+ SO 458,017.28
AA+ / AA 5,909.72
TOTAL 463,927.00
Fund positioning: To generate reasonable returns alongwith liquidity by investing predominantly in a portfolio of money market and other short term debt instruments.
Fund Manager’s Comments: The average maturity is low at 0.03 years
Total Net Assets as on 28/02/09 (Rs Lacs) : 2,336.08
TATA TREASURY MANAGER FUND
Debt Portfolio as on 28/02/09
Scrip Name Rating Mkt. Value (Rs. Lacs)
UCO Bank P1+ 897.86
IDBI Bank Ltd. A1+ 499.04
Punjab National Bank F1+ 498.95
State Bank Of Patiala A1+ 299.41
TOTAL 2,195.25
Nav Details
Option NAV as on 28/02/09 (Rs) NAV as on 29/02/08 (Rs)Regular Investment Option (Monthly Dividend) 1002.1978 1002.0000Regular Investment Option (G) 1155.9566 1053.7744High Investment Option (G) 1155.8676 1052.6815Super High Investment Option (G) 1160.9353 1053.6236
Fund Essentials
Date of Allotment: July 13, 2007 Average Maturity: 0.03 yearsMinimum Investment: RIP: Rs. 10,000/-, HIP: Rs. 10 lacs
SHIP: Rs. 1 croreEntry Load NilExit Load 3% if redeemed on or before expiry of
3 months from the date of allotment.
Asset Allocation (Rs. In Lacs)
Debt 2,195.25
Cash, Others 140.83
Total Net Assets 2,336.08
Rating Profile (Rs. In Lacs)
AAA/P1+/PR1/A1/SOV/F1+/A1+ SO 2,195.25
TOTAL 2,195.25
19
TATA LIQUID FUNDFund positioning: To generate steady income through investments in short dated papers and maintain high liquidity of the portfolio.
Fund Manager’s Comments: The average maturity is low at 1.72 months
NAV Details
Option As On 28/02/09 As On 29/02/08
Regular Investment Option (Fortnightly) 1145.1858 1144.9739
Regular Investment Option (Growth) 2021.1629 1860.6786
High Investment Option (G) 1459.7170 1342.3722
Super High Investment Option (G) 1618.1448 1484.6496
Debt Portfolio as on 28/02/09Scrip Name Rating Mkt. Value
(Rs. Lacs)
Exide Industries Ltd A1+ 2,987.30
State Bank Of Hyderabad A1+ 43,872.19
ICICI Bank Ltd A1+ 43,627.48
Punjab National Bank F1+ 42,487.07
IDBI Bank Ltd. A1+ 40,788.02
NABARD AAA 14,747.79
Allahabad Bank P1+ 13,494.09
AXIS Bank Limited P1+ 11,718.87
State Bank Of Indore Ltd P1+ 11,256.91
State Bank Of Patiala A1+ 10,778.73
State Bank Of India P1+ 9,975.57
State Bank Of Travancore P1+ 9,778.86
Oriental Bank Of Commerce P1+ 8,568.85
YES Bank Ltd. A1+ 7,884.40
Centurion Bank Of Punjab Ltd F1+ 7,882.83
Union Bank Of India AA+ 4,998.05
Indian Overseas Bank A1+ 4,981.52
Canara Bank P1+ 4,908.92
Karnataka Bank Ltd A1+ 2,790.52
IDBI Bank Ltd. P1+ 2,734.68
State Bank Of Mysore A1+ 2,495.38
Vijaya Bank PR1+ 2,491.67
Andhra Bank F1+ 2,448.81
Dena Bank F1+ 2,441.50
IDBI Bank Ltd. AA+ 2,000.00
Punjab National Bank PR1+ 1,468.44
EXIM A1+ 973.05
State Bank Of Bikaner & Jaipur A1+ 599.88
EXIM AAA 385.81
UCO Bank P1+ 229.46
Union Bank Of India A1+ 9.52
Ultratech Cemco Limited AAA 2,496.27
Marico Industries Ltd. P1+ 3,379.35
Global Trade Finance Limited P1+ 19,963.31
Sundaram Fin Ltd LAA+ 15,000.00
LIC Housing Finance Ltd AAA 14,183.85
ICICI Securities Ltd P1+ 10,000.00
Gruh Finance Limited P1+ 9,954.07
HDFC Limited A1+ 9,807.62
HDFC Limited AAA 9,429.60
Power Finance Corporation AAA 5,523.12
Indian Corp Loan Sec Trust-SR LXI AAA SO 5,002.42
Sundaram Fin Ltd A1+ 4,916.00
Cholamandalam DBS Fin Ltd A1+ 4,837.96
Citifinancial Consumer Limited AA+ 2,059.84
ICICI Home Finance Co.Ltd LAAA 1,913.10
Sundaram Fin Ltd AA+ 1,098.87
G. E. Capital Services AAA 359.40
T Bill SOV 1,995.40
Aditya Birla Nuvo Ltd A1+ 2,456.82
TOTAL 440,183.17
Total Net Assets as on 28/02/09 (Rs Lacs) : 498,185.75
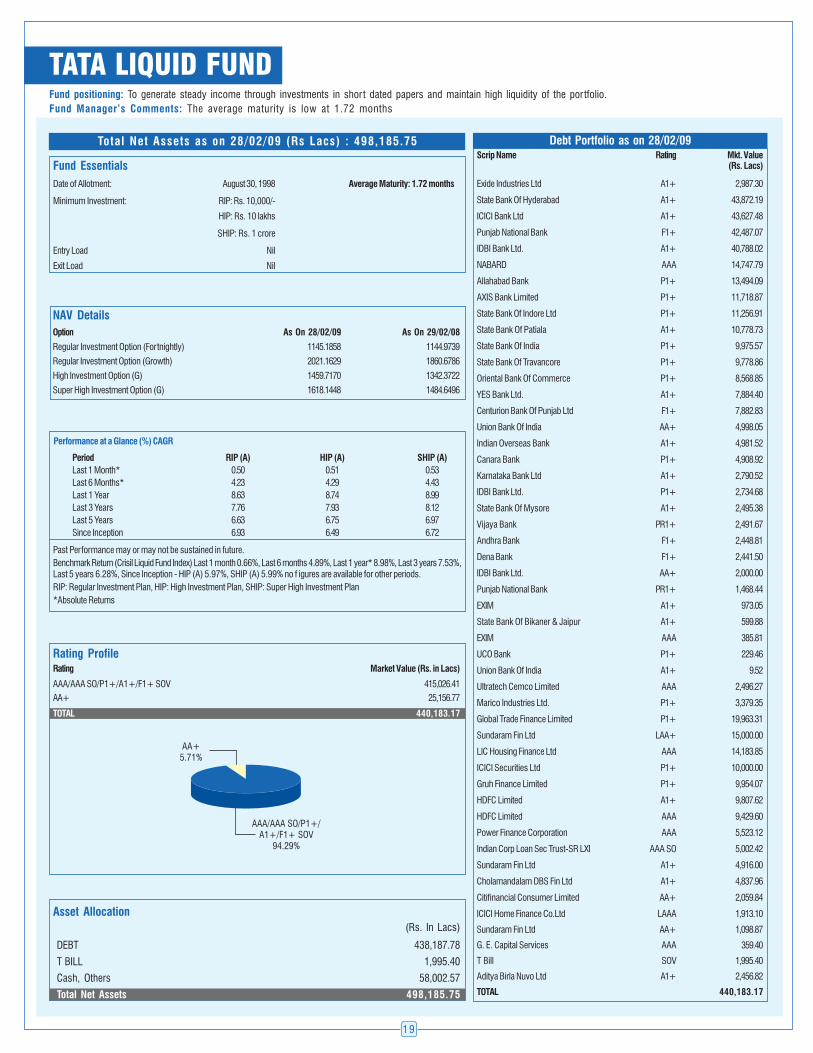
Rating ProfileRating Market Value (Rs. in Lacs)
AAA/AAA SO/P1+/A1+/F1+ SOV 415,026.41
AA+ 25,156.77
TOTAL 440,183.17
Past Performance may or may not be sustained in future.
Benchmark Return (Crisil Liquid Fund Index) Last 1 month 0.66%, Last 6 months 4.89%, Last 1 year* 8.98%, Last 3 years 7.53%,Last 5 years 6.28%, Since Inception - HIP (A) 5.97%, SHIP (A) 5.99% no f igures are available for other periods.
RIP: Regular Investment Plan, HIP: High Investment Plan, SHIP: Super High Investment Plan
*Absolute Returns
Performance at a Glance (%) CAGR
Period RIP (A) HIP (A) SHIP (A)
Last 1 Month* 0.50 0.51 0.53
Last 6 Months* 4.23 4.29 4.43
Last 1 Year 8.63 8.74 8.99
Last 3 Years 7.76 7.93 8.12
Last 5 Years 6.63 6.75 6.97
Since Inception 6.93 6.49 6.72
Fund Essentials
Date of Allotment: August 30, 1998 Average Maturity: 1.72 months
Minimum Investment: RIP: Rs. 10,000/-
HIP: Rs. 10 lakhs
SHIP: Rs. 1 crore
Entry Load Nil
Exit Load Nil
Asset Allocation
(Rs. In Lacs)
DEBT 438,187.78
T BILL 1,995.40
Cash, Others 58,002.57
Total Net Assets 498,185.75
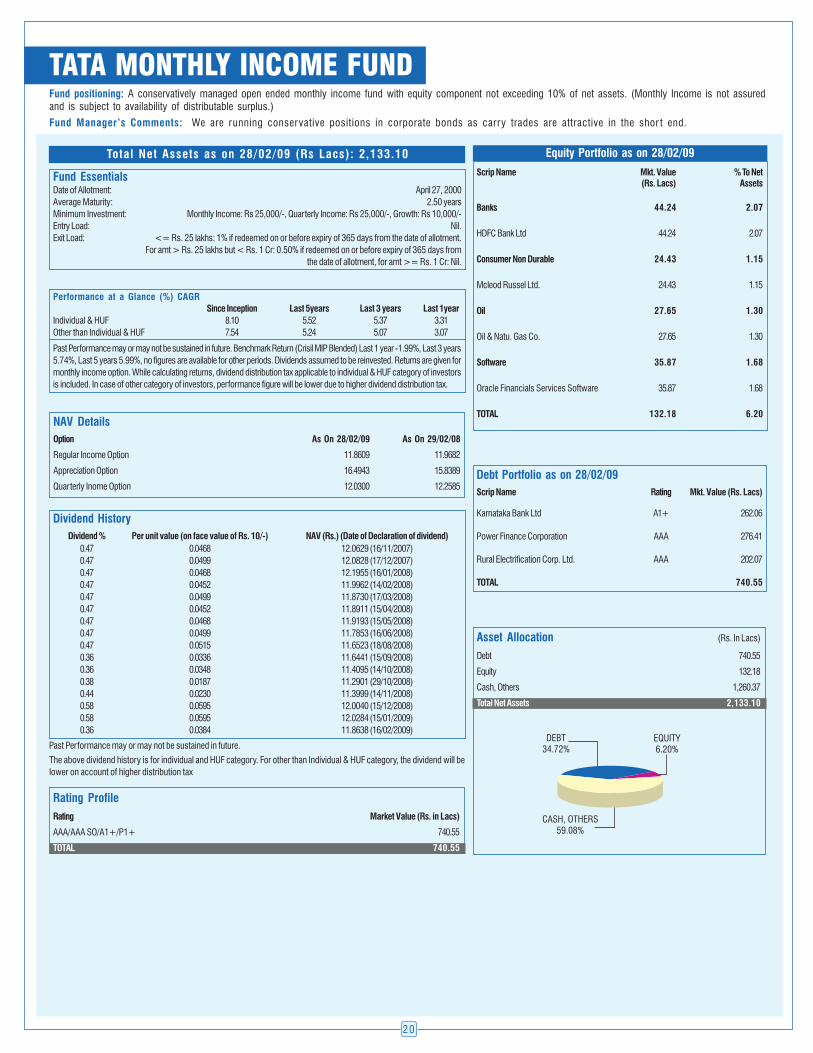
20
Fund positioning: A conservatively managed open ended monthly income fund with equity component not exceeding 10% of net assets. (Monthly Income is not assuredand is subject to availability of distributable surplus.)
Total Net Assets as on 28/02/09 (Rs Lacs): 2,133.10
TATA MONTHLY INCOME FUND
Fund Manager’s Comments: We are running conservative positions in corporate bonds as carry trades are attractive in the shor t end.
Rating Profile
Rating Market Value (Rs. in Lacs)
AAA/AAA SO/A1+/P1+ 740.55
TOTAL 740.55
Equity Portfolio as on 28/02/09
Scrip Name Mkt. Value % To Net(Rs. Lacs) Assets
Banks 44.24 2.07
HDFC Bank Ltd 44.24 2.07
Consumer Non Durable 24.43 1.15
Mcleod Russel Ltd. 24.43 1.15
Oil 27.65 1.30
Oil & Natu. Gas Co. 27.65 1.30
Software 35.87 1.68
Oracle Financials Services Software 35.87 1.68
TOTAL 132.18 6.20NAV Details
Option As On 28/02/09 As On 29/02/08
Regular Income Option 11.8609 11.9682
Appreciation Option 16.4943 15.8389
Quarterly Inome Option 12.0300 12.2585
Past Performance may or may not be sustained in future. Benchmark Return (Crisil MIP Blended) Last 1 year -1.99%, Last 3 years
5.74%, Last 5 years 5.99%, no figures are available for other periods. Dividends assumed to be reinvested. Returns are given for
monthly income option. While calculating returns, dividend distribution tax applicable to individual & HUF category of investors
is included. In case of other category of investors, performance figure will be lower due to higher dividend distribution tax.
Performance at a Glance (%) CAGR
Since Inception Last 5years Last 3 years Last 1year
Individual & HUF 8.10 5.52 5.37 3.31
Other than Individual & HUF 7.54 5.24 5.07 3.07
Fund EssentialsDate of Allotment: April 27, 2000
Average Maturity: 2.50 years
Minimum Investment: Monthly Income: Rs 25,000/-, Quarterly Income: Rs 25,000/-, Growth: Rs 10,000/-
Entry Load: Nil.
Exit Load: <= Rs. 25 lakhs: 1% if redeemed on or before expiry of 365 days from the date of allotment.
For amt > Rs. 25 lakhs but < Rs. 1 Cr: 0.50% if redeemed on or before expiry of 365 days from
the date of allotment, for amt >= Rs. 1 Cr: Nil.
Debt Portfolio as on 28/02/09
Scrip Name Rating Mkt. Value (Rs. Lacs)
Karnataka Bank Ltd A1+ 262.06
Power Finance Corporation AAA 276.41
Rural Electrification Corp. Ltd. AAA 202.07
TOTAL 740.55
Dividend History
Dividend % Per unit value (on face value of Rs. 10/-) NAV (Rs.) (Date of Declaration of dividend)
0.47 0.0468 12.0629 (16/11/2007)
0.47 0.0499 12.0828 (17/12/2007)
0.47 0.0468 12.1955 (16/01/2008)
0.47 0.0452 11.9962 (14/02/2008)
0.47 0.0499 11.8730 (17/03/2008)
0.47 0.0452 11.8911 (15/04/2008)
0.47 0.0468 11.9193 (15/05/2008)
0.47 0.0499 11.7853 (16/06/2008)
0.47 0.0515 11.6523 (18/08/2008)
0.36 0.0336 11.6441 (15/09/2008)
0.36 0.0348 11.4095 (14/10/2008)
0.38 0.0187 11.2901 (29/10/2008)
0.44 0.0230 11.3999 (14/11/2008)
0.58 0.0595 12.0040 (15/12/2008)
0.58 0.0595 12.0284 (15/01/2009)
0.36 0.0384 11.8638 (16/02/2009)
The above dividend history is for individual and HUF category. For other than Individual & HUF category, the dividend will be
lower on account of higher distribution tax
Past Performance may or may not be sustained in future.
Asset Allocation (Rs. In Lacs)
Debt 740.55
Equity 132.18
Cash, Others 1,260.37
Total Net Assets 2,133.10
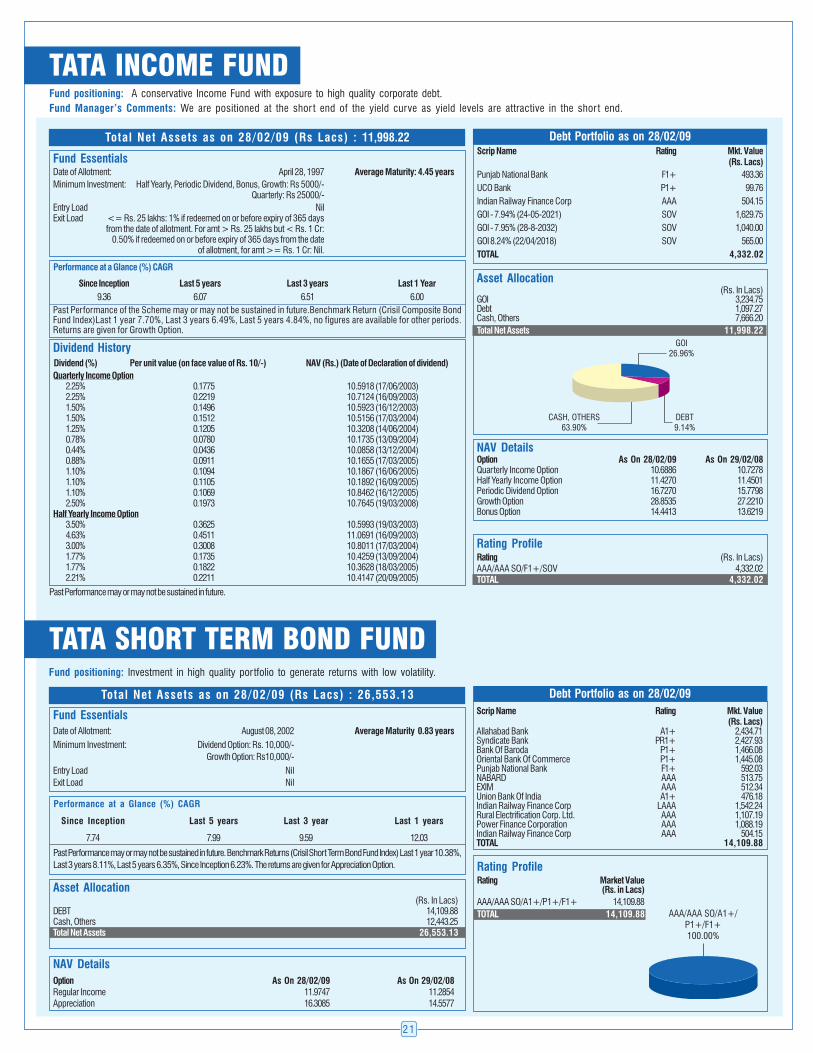
21
Fund EssentialsDate of Allotment: April 28, 1997 Average Maturity: 4.45 years
Minimum Investment: Half Yearly, Periodic Dividend, Bonus, Growth: Rs 5000/-Quarterly: Rs 25000/-
Entry Load NilExit Load <= Rs. 25 lakhs: 1% if redeemed on or before expiry of 365 days
from the date of allotment. For amt > Rs. 25 lakhs but < Rs. 1 Cr:0.50% if redeemed on or before expiry of 365 days from the date
of allotment, for amt >= Rs. 1 Cr: Nil.
TATA INCOME FUNDFund positioning: A conservative Income Fund with exposure to high quality corporate debt.
Fund Manager’s Comments: We are positioned at the shor t end of the yield curve as yield levels are attractive in the shor t end.
Past Performance of the Scheme may or may not be sustained in future.Benchmark Return (Crisil Composite BondFund Index)Last 1 year 7.70%, Last 3 years 6.49%, Last 5 years 4.84%, no figures are available for other periods.Returns are given for Growth Option.
Performance at a Glance (%) CAGR
Since Inception Last 5 years Last 3 years Last 1 Year
9.36 6.07 6.51 6.00
Total Net Assets as on 28/02/09 (Rs Lacs) : 11,998.22 Debt Portfolio as on 28/02/09Scrip Name Rating Mkt. Value
(Rs. Lacs)
Punjab National Bank F1+ 493.36
UCO Bank P1+ 99.76
Indian Railway Finance Corp AAA 504.15
GOI - 7.94% (24-05-2021) SOV 1,629.75
GOI - 7.95% (28-8-2032) SOV 1,040.00
GOI 8.24% (22/04/2018) SOV 565.00
TOTAL 4,332.02
TATA SHORT TERM BOND FUNDFund positioning: Investment in high quality portfolio to generate returns with low volatility.
Total Net Assets as on 28/02/09 (Rs Lacs) : 26,553.13
NAV Details
Option As On 28/02/09 As On 29/02/08
Regular Income 11.9747 11.2854Appreciation 16.3085 14.5577
Past Performance may or may not be sustained in future. Benchmark Returns (Crisil Short Term Bond Fund Index) Last 1 year 10.38%,
Last 3 years 8.11%, Last 5 years 6.35%, Since Inception 6.23%. The returns are given for Appreciation Option.
Performance at a Glance (%) CAGR
Since Inception Last 5 years Last 3 year Last 1 years
7.74 7.99 9.59 12.03
Fund Essentials
Date of Allotment: August 08, 2002 Average Maturity 0.83 years
Minimum Investment: Dividend Option: Rs. 10,000/-
Growth Option: Rs10,000/-
Entry Load Nil
Exit Load Nil
Asset Allocation(Rs. In Lacs)
DEBT 14,109.88Cash, Others 12,443.25Total Net Assets 26,553.13
Dividend History
Dividend (%) Per unit value (on face value of Rs. 10/-) NAV (Rs.) (Date of Declaration of dividend)
Quarterly Income Option2.25% 0.1775 10.5918 (17/06/2003)2.25% 0.2219 10.7124 (16/09/2003)1.50% 0.1496 10.5923 (16/12/2003)1.50% 0.1512 10.5156 (17/03/2004)1.25% 0.1205 10.3208 (14/06/2004)0.78% 0.0780 10.1735 (13/09/2004)0.44% 0.0436 10.0858 (13/12/2004)0.88% 0.0911 10.1655 (17/03/2005)1.10% 0.1094 10.1867 (16/06/2005)1.10% 0.1105 10.1892 (16/09/2005)1.10% 0.1069 10.8462 (16/12/2005)2.50% 0.1973 10.7645 (19/03/2008)
Half Yearly Income Option3.50% 0.3625 10.5993 (19/03/2003)4.63% 0.4511 11.0691 (16/09/2003)3.00% 0.3008 10.8011 (17/03/2004)1.77% 0.1735 10.4259 (13/09/2004)1.77% 0.1822 10.3628 (18/03/2005)2.21% 0.2211 10.4147 (20/09/2005)
Past Performance may or may not be sustained in future.
NAV DetailsOption As On 28/02/09 As On 29/02/08Quarterly Income Option 10.6886 10.7278Half Yearly Income Option 11.4270 11.4501Periodic Dividend Option 16.7270 15.7798Growth Option 28.8535 27.2210Bonus Option 14.4413 13.6219
Asset Allocation(Rs. In Lacs)
GOI 3,234.75Debt 1,097.27Cash, Others 7,666.20
Total Net Assets 11,998.22
Rating ProfileRating (Rs. In Lacs)AAA/AAA SO/F1+/SOV 4,332.02TOTAL 4,332.02
Rating ProfileRating Market Value
(Rs. in Lacs)
AAA/AAA SO/A1+/P1+/F1+ 14,109.88
TOTAL 14,109.88
Debt Portfolio as on 28/02/09
Scrip Name Rating Mkt. Value(Rs. Lacs)
Allahabad Bank A1+ 2,434.71Syndicate Bank PR1+ 2,427.93Bank Of Baroda P1+ 1,466.08Oriental Bank Of Commerce P1+ 1,445.08Punjab National Bank F1+ 592.03NABARD AAA 513.75EXIM AAA 512.34Union Bank Of India A1+ 476.18Indian Railway Finance Corp LAAA 1,542.24Rural Electrification Corp. Ltd. AAA 1,107.19Power Finance Corporation AAA 1,088.19Indian Railway Finance Corp AAA 504.15TOTAL 14,109.88
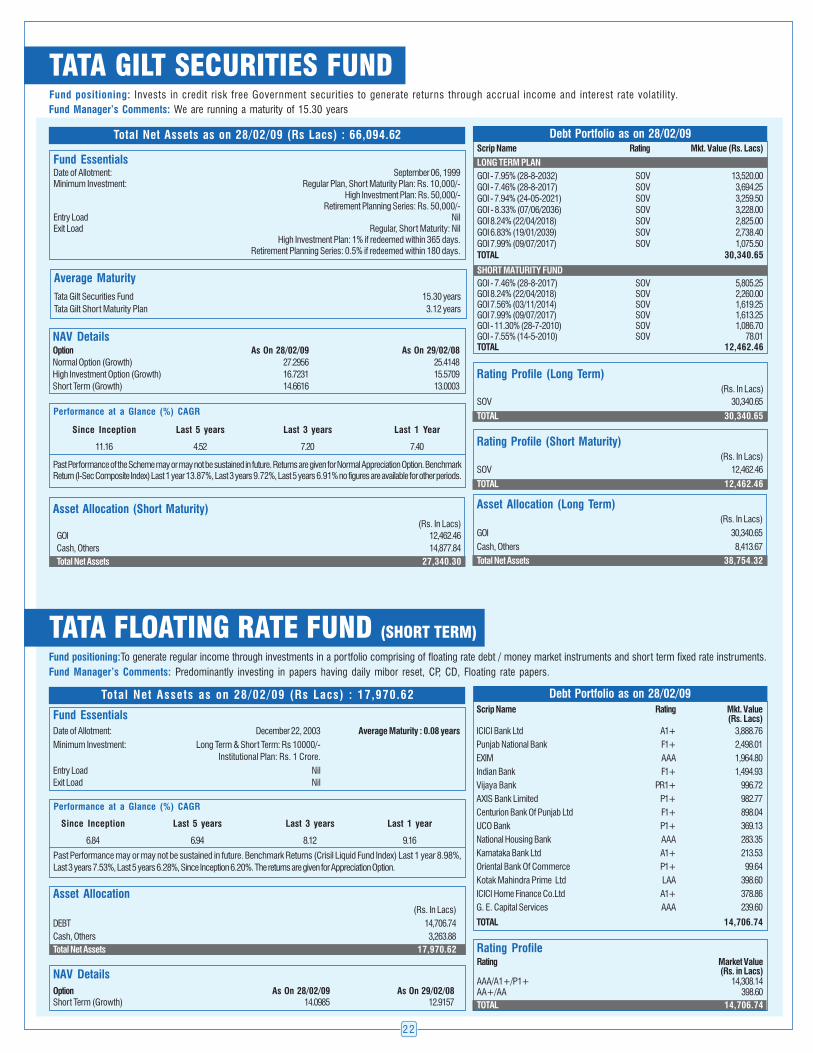
22
Fund positioning: Invests in credit risk free Government securities to generate returns through accrual income and interest rate volatility.
Fund Manager’s Comments: We are running a maturity of 15.30 years
Total Net Assets as on 28/02/09 (Rs Lacs) : 66,094.62
Average Maturity
Tata Gilt Securities Fund 15.30 years
Tata Gilt Short Maturity Plan 3.12 years
Past Performance of the Scheme may or may not be sustained in future. Returns are given for Normal Appreciation Option. BenchmarkReturn (I-Sec Composite Index) Last 1 year 13.87%, Last 3 years 9.72%, Last 5 years 6.91% no figures are available for other periods.
Performance at a Glance (%) CAGR
Since Inception Last 5 years Last 3 years Last 1 Year
11.16 4.52 7.20 7.40 Rating Profile (Short Maturity)(Rs. In Lacs)
SOV 12,462.46
TOTAL 12,462.46
Rating Profile (Long Term)(Rs. In Lacs)
SOV 30,340.65
TOTAL 30,340.65
Asset Allocation (Long Term)(Rs. In Lacs)
GOI 30,340.65
Cash, Others 8,413.67
Total Net Assets 38,754.32
Debt Portfolio as on 28/02/09Scrip Name Rating Mkt. Value (Rs. Lacs)
LONG TERM PLAN
GOI - 7.95% (28-8-2032) SOV 13,520.00GOI - 7.46% (28-8-2017) SOV 3,694.25GOI - 7.94% (24-05-2021) SOV 3,259.50GOI - 8.33% (07/06/2036) SOV 3,228.00GOI 8.24% (22/04/2018) SOV 2,825.00GOI 6.83% (19/01/2039) SOV 2,738.40GOI 7.99% (09/07/2017) SOV 1,075.50TOTAL 30,340.65
SHORT MATURITY FUND
GOI - 7.46% (28-8-2017) SOV 5,805.25GOI 8.24% (22/04/2018) SOV 2,260.00GOI 7.56% (03/11/2014) SOV 1,619.25GOI 7.99% (09/07/2017) SOV 1,613.25GOI - 11.30% (28-7-2010) SOV 1,086.70GOI - 7.55% (14-5-2010) SOV 78.01TOTAL 12,462.46
Asset Allocation (Short Maturity)(Rs. In Lacs)
GOI 12,462.46
Cash, Others 14,877.84
Total Net Assets 27,340.30
NAV DetailsOption As On 28/02/09 As On 29/02/08
Normal Option (Growth) 27.2956 25.4148
High Investment Option (Growth) 16.7231 15.5709
Short Term (Growth) 14.6616 13.0003
Fund EssentialsDate of Allotment: September 06, 1999Minimum Investment: Regular Plan, Short Maturity Plan: Rs. 10,000/-
High Investment Plan: Rs. 50,000/-Retirement Planning Series: Rs. 50,000/-
Entry Load NilExit Load Regular, Short Maturity: Nil
High Investment Plan: 1% if redeemed within 365 days.Retirement Planning Series: 0.5% if redeemed within 180 days.
TATA FLOATING RATE FUND (SHORT TERM)
Total Net Assets as on 28/02/09 (Rs Lacs) : 17,970.62 Debt Portfolio as on 28/02/09
Scrip Name Rating Mkt. Value(Rs. Lacs)
ICICI Bank Ltd A1+ 3,888.76
Punjab National Bank F1+ 2,498.01
EXIM AAA 1,964.80
Indian Bank F1+ 1,494.93
Vijaya Bank PR1+ 996.72
AXIS Bank Limited P1+ 982.77
Centurion Bank Of Punjab Ltd F1+ 898.04
UCO Bank P1+ 369.13
National Housing Bank AAA 283.35
Karnataka Bank Ltd A1+ 213.53
Oriental Bank Of Commerce P1+ 99.64
Kotak Mahindra Prime Ltd LAA 398.60
ICICI Home Finance Co.Ltd A1+ 378.86
G. E. Capital Services AAA 239.60
TOTAL 14,706.74
NAV Details
Option As On 28/02/09 As On 29/02/08
Short Term (Growth) 14.0985 12.9157
Past Performance may or may not be sustained in future. Benchmark Returns (Crisil Liquid Fund Index) Last 1 year 8.98%,
Last 3 years 7.53%, Last 5 years 6.28%, Since Inception 6.20%. The returns are given for Appreciation Option.
Performance at a Glance (%) CAGR
Since Inception Last 5 years Last 3 years Last 1 year
6.84 6.94 8.12 9.16
Fund Essentials
Date of Allotment: December 22, 2003 Average Maturity : 0.08 years
Minimum Investment: Long Term & Short Term: Rs 10000/-
Institutional Plan: Rs. 1 Crore.
Entry Load Nil
Exit Load Nil
Fund positioning:To generate regular income through investments in a portfolio comprising of floating rate debt / money market instruments and short term fixed rate instruments.
Fund Manager’s Comments: Predominantly investing in papers having daily mibor reset, CP, CD, Floating rate papers.
Rating ProfileRating Market Value
(Rs. in Lacs)AAA/A1+/P1+ 14,308.14AA+/AA 398.60
TOTAL 14,706.74
Asset Allocation
(Rs. In Lacs)
DEBT 14,706.74
Cash, Others 3,263.88
Total Net Assets 17,970.62
TATA GILT SECURITIES FUND

23
Fund positioning: An open ended Income fund which seeks to generate returns through investments in high quality debt and equity (up to 20%)(Monthly Income is not assured and is subject to availability of distributable surplus.)
Total Net Assets as on 28/02/09 (Rs Lacs) : 3,402.40
TATA MIP PLUS FUND
NAV Details
Option As On 28/02/09 As On 29/02/08
Monthly Income Option 9.9752 10.8588
Quarterly Income Option 9.8883 10.8820
Half Yearly Option 10.3906 11.4122
Appreciation Option 12.6379 13.2933
Equity Portfolio as on 28/02/09
Scrip Name Mkt. Value % To Net Assets
(Rs. Lacs)
Banks 130.07 3.82
HDFC Bank Ltd 130.07 3.82
Industrial Capital Goods 132.65 3.90
Bharat Heavy Electricals Ltd. 132.65 3.90
Petroleum Products 129.04 3.79
Reliance Industries Ltd. 129.04 3.79
Software 98.50 2.90
Infosys Technologies Ltd. 98.50 2.90
TOTAL 490.26 14.41
Past Performance may or may not be sustained in future. Benchmark Return (Crisil MIP Blended) Last 1 year -1.99%,
Last 3 years 5.74%,Since Inception 6.00%. Returns are given for growth option.
Performance at a Glance (%) CAGR
Since Inception Last 3 Years Last 1 Year
4.84 3.48 -4.93
Past Performance may or may not be sustained in future.
Dividend HistoryDividend (%) Per unit value (on face value of Rs. 10/-) NAV (Rs.) (Date of Declaration of dividend)
0.4745 0.0499 10.9981 (16/10/2007)
0.4745 0.0468 11.1391 (16/11/2007)
0.4745 0.0499 11.2801 (17/12/2007)
0.4745 0.0468 11.3933 (16/01/2008)
0.4970 0.0452 10.9610 (14/02/2008)
0.4745 0.0499 10.5319 (17/03/2008)
0.4745 0.0452 10.5667 (15/04/2008)
0.4745 0.0468 10.6638 (15/05/2008)
0.4745 0.0499 10.4105 (17/06/2008)
0.4745 0.515 10.3218 (18/08/2008)
0.3650 0.0336 10.1044 (15/09/2008)
0.3650 0.0372 10.0786 (15/01/2009)
Fund EssentialsDate of Allotment : March 19, 2004
Average Maturity : 8.72 years
Minimum Investment : Monthly Income: Rs. 25,000/-, Quarterly,Half Yearly: Rs. 10,000/-, Growth Option: Rs. 5,000/-
Entry Load : Nil
Exit Load : For amt <= Rs. 25 lakhs: 1% if redeemed on or before expiry of 365 days from the date of allotment.
For amt > Rs. 25 lakhs but < Rs. 1 Cr: 0.50% if redeemed on or before expiry of 365 days from the
date of allotment, for amt >= Rs. 1 Cr: Nil.
Asset Allocation(Rs. In Lacs)
Debt 1,357.58
GOI 538.00
Equity 490.26
Cash, Others 1,016.56
Total Net Assets 3,402.40
Rating ProfileRating Market Value (Rs. in Lacs)
AAA SO/ AAA/A1+/P1+/F1+/SOV 1,507.31
AA+ 388.27
TOTAL 1,895.58
Debt Portfolio as on 28/02/09
Scrip Name Rating Mkt. Value
(Rs. Lacs)
Mahindra & Mahindra Ltd. LAA+ 388.27
ICICI Bank Ltd A1+ 498.25
Power Finance Corporation AAA 276.41
Rural Electrification Corp. Ltd. AAA 194.65
GOI - 8.33% (07/06/2036) SOV 538.00
TOTAL 1,895.58
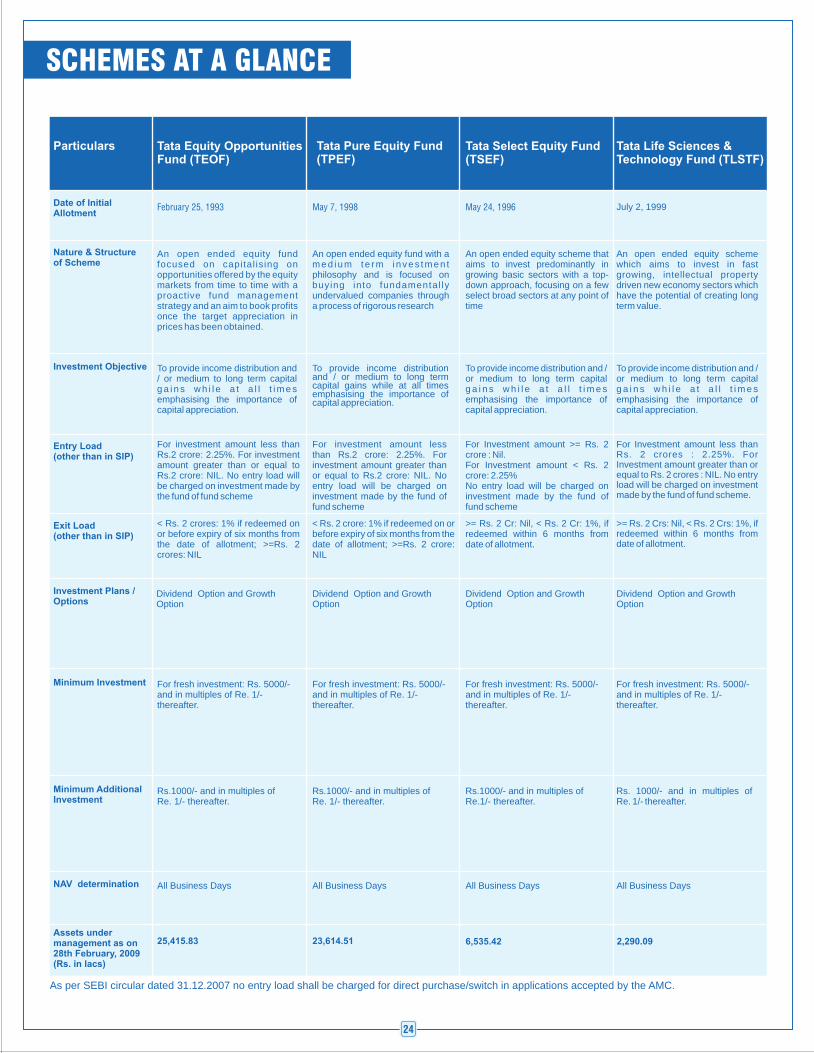
SCHEMES AT A GLANCE
NAV determination
Assets under management as on 28th February, 2009(Rs. in lacs)
Date of Initial Allotment
Nature & Structure of Scheme
Investment Objective
Investment Plans / Options
Entry Load(other than in SIP)
Minimum AdditionalInvestment
Minimum Investment
Exit Load(other than in SIP)
Tata Pure Equity Fund(TPEF)
May 7, 1998
All Business Days
An open ended equity fund with a m e d i u m t e r m i n v e s t m e n t philosophy and is focused on buying into fundamental ly undervalued companies through a process of rigorous research
To provide income distribution and / or medium to long term capital gains while at all times emphasising the importance of capital appreciation.
Dividend Option and Growth Option
For investment amount lessthan Rs.2 crore: 2.25%. For investment amount greater than or equal to Rs.2 crore: NIL. No entry load will be charged on investment made by the fund of fund scheme
Rs.1000/- and in multiples of Re. 1/- thereafter.
For fresh investment: Rs. 5000/- and in multiples of Re. 1/- thereafter.
23,614.51
Tata Equity Opportunities Fund (TEOF)
February 25, 1993
All Business Days
An open ended equity fund focused on capital ising on opportunities offered by the equity markets from time to time with a proactive fund management strategy and an aim to book profits once the target appreciation in prices has been obtained.
To provide income distribution and / or medium to long term capital g a i n s w h i l e a t a l l t i m e s emphasising the importance of capital appreciation.
Dividend Option and Growth Option
For investment amount less than Rs.2 crore: 2.25%. For investment amount greater than or equal to Rs.2 crore: NIL. No entry load will be charged on investment made by the fund of fund scheme
Rs.1000/- and in multiples of Re. 1/- thereafter.
For fresh investment: Rs. 5000/- and in multiples of Re. 1/- thereafter.
25,415.83
Tata Select Equity Fund(TSEF)
May 24, 1996
All Business Days
An open ended equity scheme that aims to invest predominantly in growing basic sectors with a top-down approach, focusing on a few select broad sectors at any point of time
To provide income distribution and / or medium to long term capital g a i n s w h i l e a t a l l t i m e s emphasising the importance of capital appreciation.
Dividend Option and Growth Option
For Investment amount >= Rs. 2 crore : Nil. For Investment amount < Rs. 2 crore: 2.25%No entry load will be charged on investment made by the fund of fund scheme
>= Rs. 2 Cr: Nil, < Rs. 2 Cr: 1%, if redeemed within 6 months from date of allotment.
Rs.1000/- and in multiples of Re.1/- thereafter.
For fresh investment: Rs. 5000/- and in multiples of Re. 1/- thereafter.
6,535.42
July 2, 1999
An open ended equity scheme which aims to invest in fast growing, intellectual property driven new economy sectors which have the potential of creating long term value.
To provide income distribution and / or medium to long term capital g a i n s w h i l e a t a l l t i m e s emphasising the importance of capital appreciation.
For Investment amount less than Rs. 2 crores : 2.25%. For Investment amount greater than or equal to Rs. 2 crores : NIL. No entry load will be charged on investment made by the fund of fund scheme.
>= Rs. 2 Crs: Nil, < Rs. 2 Crs: 1%, if redeemed within 6 months from date of allotment.
For fresh investment: Rs. 5000/- and in multiples of Re. 1/-thereafter.
Rs. 1000/- and in multiples ofRe. 1/- thereafter.
All Business Days
Tata Life Sciences & Technology Fund (TLSTF)
2,290.09
Dividend Option and Growth Option
Particulars
< Rs. 2 crores: 1% if redeemed on or before expiry of six months from the date of allotment; >=Rs. 2 crores: NIL
< Rs. 2 crore: 1% if redeemed on or before expiry of six months from the date of allotment; >=Rs. 2 crore: NIL
24
As per SEBI circular dated 31.12.2007 no entry load shall be charged for direct purchase/switch in applications accepted by the AMC.
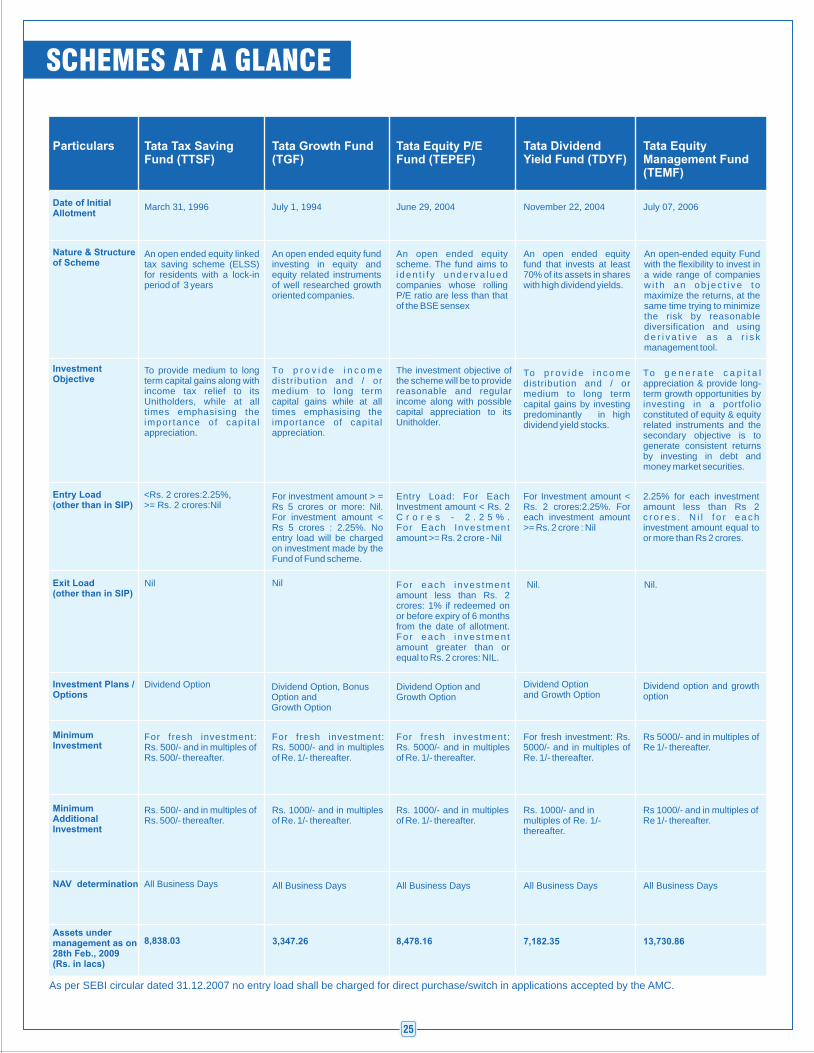
For fresh investment: Rs. 5000/- and in multiples of Re. 1/- thereafter.
An open ended equity fund that invests at least 70% of its assets in shares with high dividend yields.
To p r o v i d e i n c o m e distribution and / or medium to long term capital gains by investing predominantly in high dividend yield stocks.
Nil.
For Investment amount < Rs. 2 crores:2.25%. For each investment amount >= Rs. 2 crore : Nil
Rs. 1000/- and in multiples of Re. 1/- thereafter.
NAV determination
Assets under management as on 28th Feb., 2009(Rs. in lacs)
Particulars
Date of Initial Allotment
Nature & Structure of Scheme
Investment Objective
Investment Plans / Options
Entry Load(other than in SIP)
Minimum AdditionalInvestment
Minimum Investment
Exit Load(other than in SIP)
Tata Tax Saving Fund (TTSF)
March 31, 1996
All Business Days
Rs. 500/- and in multiples ofRs. 500/- thereafter.
For fresh investment: Rs. 500/- and in multiples of Rs. 500/- thereafter.
Dividend Option
<Rs. 2 crores:2.25%,>= Rs. 2 crores:Nil
To provide medium to long term capital gains along with income tax relief to its Unitholders, while at all times emphasising the impor tance of cap i ta l appreciation.
An open ended equity linked tax saving scheme (ELSS) for residents with a lock-in period of 3 years
Nil
8,838.03
Tata Growth Fund(TGF)
July 1, 1994
All Business Days
Rs. 1000/- and in multiples of Re. 1/- thereafter.
For fresh investment: Rs. 5000/- and in multiples of Re. 1/- thereafter.
Dividend Option, Bonus Option and Growth Option
For investment amount > = Rs 5 crores or more: Nil. For investment amount < Rs 5 crores : 2.25%. No entry load will be charged on investment made by the Fund of Fund scheme.
To p r o v i d e i n c o m e distr ibut ion and / or medium to long term capital gains while at all times emphasising the importance of capital appreciation.
An open ended equity fund investing in equity and equity related instruments of well researched growth oriented companies.
3,347.26
Tata Equity P/E Fund (TEPEF)
June 29, 2004
An open ended equity scheme. The fund aims to i den t i f y unde rva lued companies whose rolling P/E ratio are less than that of the BSE sensex
The investment objective of the scheme will be to provide reasonable and regular income along with possible capital appreciation to its Unitholder.
Entry Load: For Each Investment amount < Rs. 2 C r o r e s - 2 . 2 5 % . For Each Investment amount >= Rs. 2 crore - Nil
Fo r each inves tment amount less than Rs. 2 crores: 1% if redeemed on or before expiry of 6 months from the date of allotment. Fo r each inves tment amount greater than or equal to Rs. 2 crores: NIL.
Nil
Dividend Option and Growth Option
For fresh investment:Rs. 5000/- and in multiples of Re. 1/- thereafter.
Rs. 1000/- and in multiples of Re. 1/- thereafter.
All Business Days
8,478.16
Tata Dividend Yield Fund (TDYF)
Tata Equity Management Fund(TEMF)
November 22, 2004
Dividend Option and Growth Option
All Business Days
7,182.35
SCHEMES AT A GLANCE
25
As per SEBI circular dated 31.12.2007 no entry load shall be charged for direct purchase/switch in applications accepted by the AMC.
To g e n e r a t e c a p i t a l appreciation & provide long-term growth opportunities by investing in a portfolio constituted of equity & equity related instruments and the secondary objective is to generate consistent returns by investing in debt and money market securities.
An open-ended equity Fund with the flexibility to invest in a wide range of companies w i t h a n o b j e c t i v e t o maximize the returns, at the same time trying to minimize the risk by reasonable diversification and using d e r i v a t i v e a s a r i s k management tool.
Dividend option and growth option
Nil.
July 07, 2006
2.25% for each investment amount less than Rs 2 c r o r e s . N i l f o r e a c h investment amount equal to or more than Rs 2 crores.
Rs 5000/- and in multiples of Re 1/- thereafter.
All Business Days
Rs 1000/- and in multiples of Re 1/- thereafter.
13,730.86
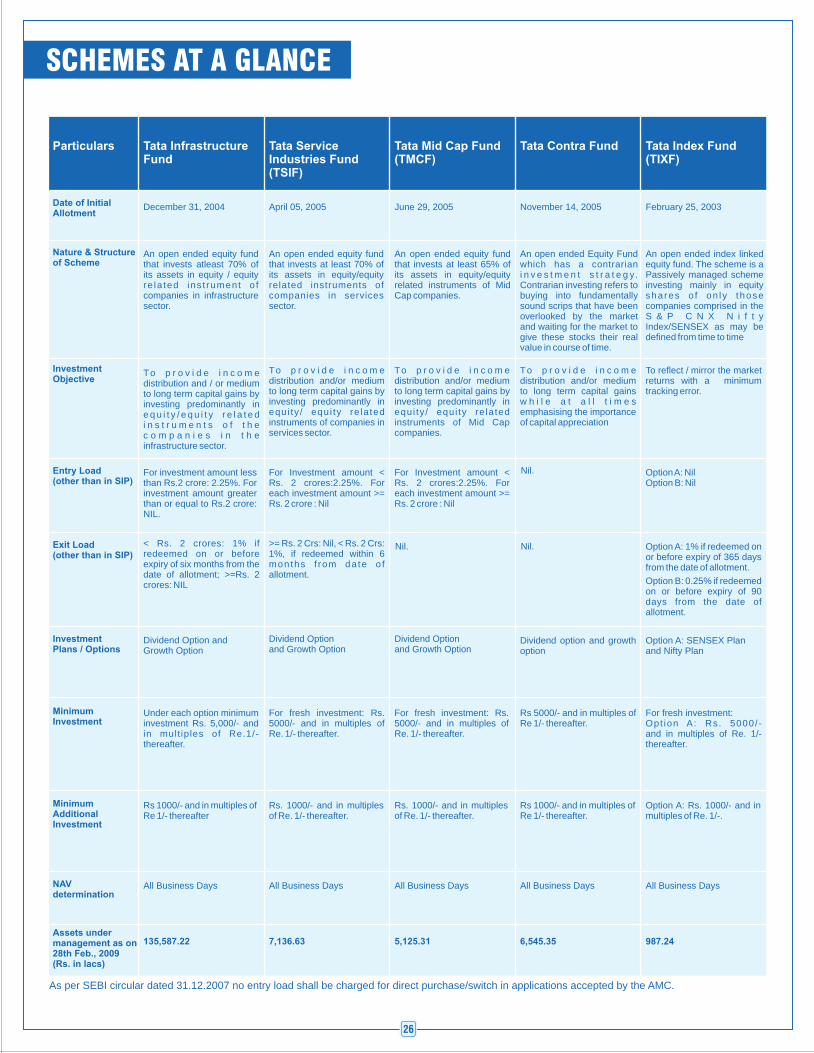
NAV determination
Assets under management as on 28th Feb., 2009(Rs. in lacs)
Particulars
Date of Initial Allotment
Nature & Structure of Scheme
Investment Objective
Investment Plans / Options
Entry Load(other than in SIP)
Minimum AdditionalInvestment
Minimum Investment
Exit Load(other than in SIP)
For fresh investment: Rs. 5000/- and in multiples of Re. 1/- thereafter.
Tata Service Industries Fund(TSIF)
An open ended equity fund that invests at least 70% of its assets in equity/equity related instruments of companies in services sector.
April 05, 2005
To p r o v i d e i n c o m e distribution and/or medium to long term capital gains by investing predominantly in equi ty / equi ty re la ted instruments of companies in services sector.
For Investment amount < Rs. 2 crores:2.25%. For each investment amount >= Rs. 2 crore : Nil
>= Rs. 2 Crs: Nil, < Rs. 2 Crs: 1%, if redeemed within 6 months f rom da te o f allotment.
Dividend Option and Growth Option
Rs. 1000/- and in multiples of Re. 1/- thereafter.
All Business Days
7,136.63
For fresh investment: Rs. 5000/- and in multiples of Re. 1/- thereafter.
Tata Mid Cap Fund(TMCF)
An open ended equity fund that invests at least 65% of its assets in equity/equity related instruments of Mid Cap companies.
June 29, 2005
To p r o v i d e i n c o m e distribution and/or medium to long term capital gains by investing predominantly in equi ty / equi ty re lated instruments of Mid Cap companies.
Nil.
For Investment amount < Rs. 2 crores:2.25%. For each investment amount >= Rs. 2 crore : Nil
Dividend Option and Growth Option
Rs. 1000/- and in multiples of Re. 1/- thereafter.
All Business Days
5,125.31
Tata Index Fund(TIXF)
For fresh investment: Opt ion A: Rs. 5000/ - and in multiples of Re. 1/- thereafter.
An open ended index linked equity fund. The scheme is a Passively managed scheme investing mainly in equity shares o f on ly those companies comprised in the S & P C N X N i f t y Index/SENSEX as may be defined from time to time
An open ended Equity Fund which has a contrarian i n v e s t m e n t s t r a t e g y. Contrarian investing refers to buying into fundamentally sound scrips that have been overlooked by the market and waiting for the market to give these stocks their real value in course of time.
To reflect / mirror the market returns with a minimum tracking error.
To p r o v i d e i n c o m e distribution and/or medium to long term capital gains w h i l e a t a l l t i m e s emphasising the importance of capital appreciation
Option A: NilOption B: Nil
Option A: SENSEX Planand Nifty Plan
Dividend option and growth option
All Business Days
Option A: Rs. 1000/- and in multiples of Re. 1/-.
987.24
Nil.
December 31, 2004
An open ended equity fund that invests atleast 70% of its assets in equity / equity re la ted ins t rument o f companies in infrastructure sector.
To p r o v i d e i n c o m e distribution and / or medium to long term capital gains by investing predominantly in e q u i t y / e q u i t y r e l a t e d i n s t r u m e n t s o f t h e c o m p a n i e s i n t h e infrastructure sector.
All Business Days
Tata Infrastructure Fund
Under each option minimum investment Rs. 5,000/- and in mult iples of Re.1/- thereafter.
Rs 1000/- and in multiples of Re 1/- thereafter
135,587.22
For investment amount less than Rs.2 crore: 2.25%. For investment amount greater than or equal to Rs.2 crore: NIL.
Dividend Option and Growth Option
< Rs. 2 crores: 1% if redeemed on or before expiry of six months from the date of allotment; >=Rs. 2 crores: NIL
Tata Contra Fund
February 25, 2003November 14, 2005
Rs 5000/- and in multiples of Re 1/- thereafter.
All Business Days
Rs 1000/- and in multiples of Re 1/- thereafter.
6,545.35
SCHEMES AT A GLANCE
26
As per SEBI circular dated 31.12.2007 no entry load shall be charged for direct purchase/switch in applications accepted by the AMC.
Nil.
Option A: 1% if redeemed on or before expiry of 365 days from the date of allotment.
Option B: 0.25% if redeemed on or before expiry of 90 days from the date of allotment.
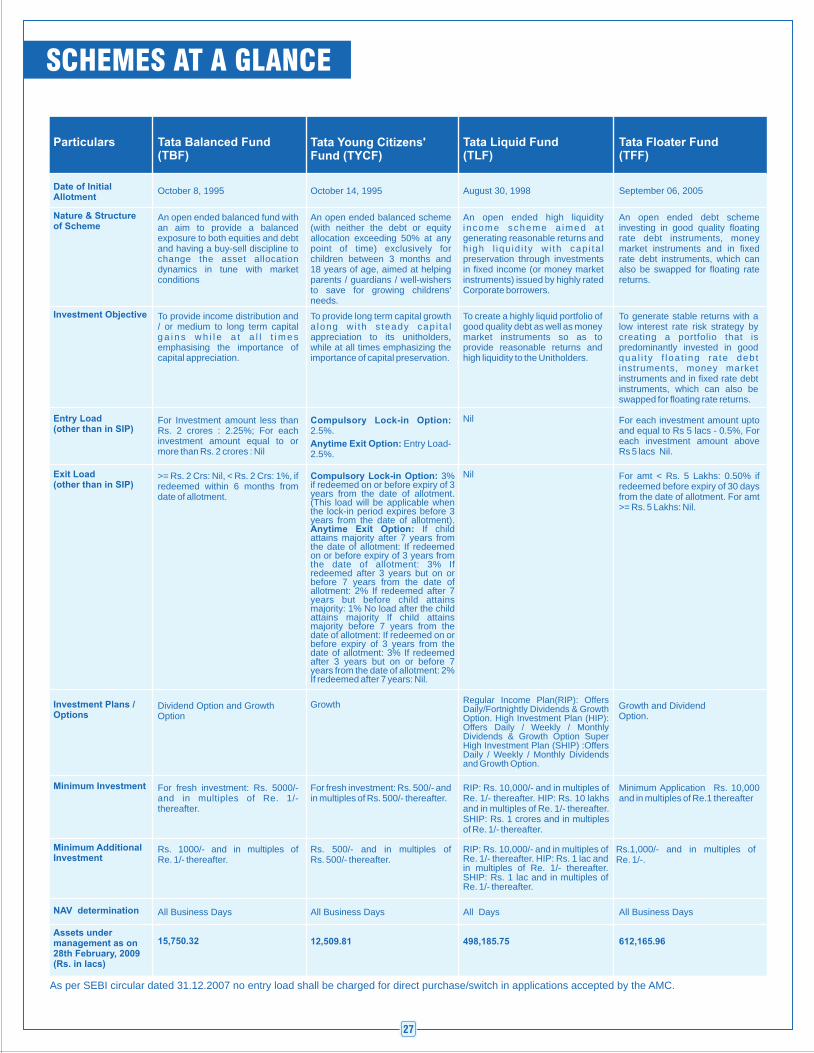
Tata Young Citizens' Fund (TYCF)
October 14, 1995
An open ended balanced scheme (with neither the debt or equity allocation exceeding 50% at any point of time) exclusively for children between 3 months and18 years of age, aimed at helping parents / guardians / well-wishers to save for growing childrens' needs.
To provide long term capital growth a long w i th s teady cap i ta l appreciation to its unitholders, while at all times emphasizing the importance of capital preservation.
Compulsory Lock-in Option: 2.5%.
Anytime Exit Option: Entry Load- 2.5%.
Growth
For fresh investment: Rs. 500/- and in multiples of Rs. 500/- thereafter.
All Business Days
Rs. 500/- and in multiples ofRs. 500/- thereafter.
Compulsory Lock-in Option: 3% if redeemed on or before expiry of 3 years from the date of allotment. (This load will be applicable when the lock-in period expires before 3 years from the date of allotment). Anytime Exit Option: If child attains majority after 7 years from the date of allotment: If redeemed on or before expiry of 3 years from the date of allotment: 3% If redeemed after 3 years but on or before 7 years from the date of allotment: 2% If redeemed after 7 years but before child attains majority: 1% No load after the child attains majority If child attains majority before 7 years from the date of allotment: If redeemed on or before expiry of 3 years from the date of allotment: 3% If redeemed after 3 years but on or before 7 years from the date of allotment: 2% If redeemed after 7 years: Nil.
12,509.81
Tata Balanced Fund(TBF)
October 8, 1995
An open ended balanced fund with an aim to provide a balanced exposure to both equities and debt and having a buy-sell discipline to change the asset allocation dynamics in tune with market conditions
To provide income distribution and / or medium to long term capital g a i n s w h i l e a t a l l t i m e s emphasising the importance of capital appreciation.
For Investment amount less than Rs. 2 crores : 2.25%; For each investment amount equal to or more than Rs. 2 crores : Nil
>= Rs. 2 Crs: Nil, < Rs. 2 Crs: 1%, if redeemed within 6 months from date of allotment.
Dividend Option and GrowthOption
All Business Days
Rs. 1000/- and in multiples ofRe. 1/- thereafter.
15,750.32
For fresh investment: Rs. 5000/- and in multiples of Re. 1/- thereafter.
NAV determination
Assets under management as on 28th February, 2009(Rs. in lacs)
Particulars
Date of Initial Allotment
Nature & Structure of Scheme
Investment Objective
Investment Plans / Options
Entry Load(other than in SIP)
Minimum AdditionalInvestment
Minimum Investment
Exit Load(other than in SIP)
Tata Floater Fund(TFF)
September 06, 2005
An open ended debt scheme investing in good quality floating rate debt instruments, money market instruments and in fixed rate debt instruments, which can also be swapped for floating rate returns.
To generate stable returns with a low interest rate risk strategy by creating a portfolio that is predominantly invested in good qua l i t y f loa t ing ra te deb t instruments, money market instruments and in fixed rate debt instruments, which can also be swapped for floating rate returns.
For each investment amount upto and equal to Rs 5 lacs - 0.5%, For each investment amount aboveRs 5 lacs Nil.
For amt < Rs. 5 Lakhs: 0.50% if redeemed before expiry of 30 days from the date of allotment. For amt >= Rs. 5 Lakhs: Nil.
August 30, 1998
An open ended high liquidity i ncome scheme a imed a t generating reasonable returns and h igh l iqu id i ty w i th cap i ta l preservation through investments in fixed income (or money market instruments) issued by highly rated Corporate borrowers.
To create a highly liquid portfolio of good quality debt as well as money market instruments so as to provide reasonable returns and high liquidity to the Unitholders.
Nil
Regular Income Plan(RIP): Offers Daily/Fortnightly Dividends & Growth Option. High Investment Plan (HIP): Offers Daily / Weekly / Monthly Dividends & Growth Option Super High Investment Plan (SHIP) :Offers Daily / Weekly / Monthly Dividends and Growth Option.
All Days
Tata Liquid Fund(TLF)
RIP: Rs. 10,000/- and in multiples of Re. 1/- thereafter. HIP: Rs. 10 lakhs and in multiples of Re. 1/- thereafter. SHIP: Rs. 1 crores and in multiples of Re. 1/- thereafter.
RIP: Rs. 10,000/- and in multiples of Re. 1/- thereafter. HIP: Rs. 1 lac and in multiples of Re. 1/- thereafter. SHIP: Rs. 1 lac and in multiples of Re. 1/- thereafter.
Nil
498,185.75
Growth and DividendOption.
Minimum Application Rs. 10,000 and in multiples of Re.1 thereafter
Rs.1,000/- and in multiples ofRe. 1/-.
All Business Days
612,165.96
SCHEMES AT A GLANCE
27
As per SEBI circular dated 31.12.2007 no entry load shall be charged for direct purchase/switch in applications accepted by the AMC.
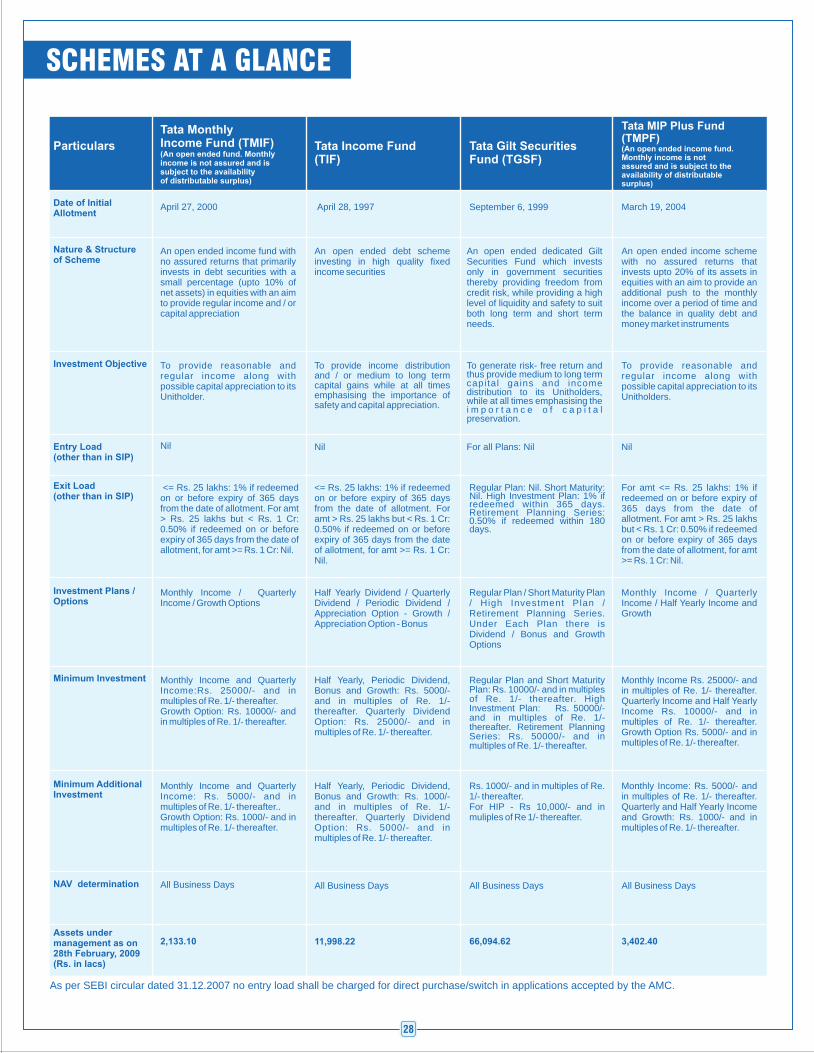
NAV determination
Assets under management as on 28th February, 2009(Rs. in lacs)
Particulars
Date of Initial Allotment
Nature & Structure of Scheme
Investment Objective
Investment Plans / Options
Entry Load(other than in SIP)
Minimum AdditionalInvestment
Minimum Investment
Exit Load(other than in SIP)
Tata MonthlyIncome Fund (TMIF) (An open ended fund. Monthlyincome is not assured and issubject to the availabilityof distributable surplus)
April 27, 2000
An open ended income fund with no assured returns that primarily invests in debt securities with a small percentage (upto 10% of net assets) in equities with an aim to provide regular income and / or capital appreciation
To provide reasonable and regular income along with possible capital appreciation to its Unitholder.
Nil
Monthly Income / Quarterly Income / Growth Options
Monthly Income and Quarterly Income:Rs. 25000/- and in multiples of Re. 1/- thereafter.Growth Option: Rs. 10000/- and in multiples of Re. 1/- thereafter.
Monthly Income and Quarterly Income: Rs. 5000/- and in multiples of Re. 1/- thereafter..Growth Option: Rs. 1000/- and in multiples of Re. 1/- thereafter.
All Business Days
2,133.10
<= Rs. 25 lakhs: 1% if redeemed on or before expiry of 365 days from the date of allotment. For amt > Rs. 25 lakhs but < Rs. 1 Cr: 0.50% if redeemed on or before expiry of 365 days from the date of allotment, for amt >= Rs. 1 Cr: Nil.
Tata Income Fund(TIF)
April 28, 1997
An open ended debt scheme investing in high quality fixed income securities
To provide income distribution and / or medium to long term capital gains while at all times emphasising the importance of safety and capital appreciation.
Nil
Half Yearly Dividend / Quarterly Dividend / Periodic Dividend / Appreciation Option - Growth / Appreciation Option - Bonus
Half Yearly, Periodic Dividend, Bonus and Growth: Rs. 5000/- and in multiples of Re. 1/- thereafter. Quarterly Dividend Option: Rs. 25000/- and in multiples of Re. 1/- thereafter.
Half Yearly, Periodic Dividend, Bonus and Growth: Rs. 1000/- and in multiples of Re. 1/- thereafter. Quarterly Dividend Option: Rs. 5000/- and in multiples of Re. 1/- thereafter.
All Business Days
11,998.22
Tata Gilt Securities Fund (TGSF)
September 6, 1999
An open ended dedicated Gilt Securities Fund which invests only in government securities thereby providing freedom from credit risk, while providing a high level of liquidity and safety to suit both long term and short term needs.
To generate risk- free return and thus provide medium to long term capital gains and income distribution to its Unitholders, while at all times emphasising the i m p o r t a n c e o f c a p i t a l preservation.
For all Plans: Nil
Regular Plan: Nil. Short Maturity: Nil. High Investment Plan: 1% if redeemed within 365 days. Retirement Planning Series: 0.50% if redeemed within 180 days.
Regular Plan / Short Maturity Plan / High Investment Plan / Retirement Planning Series. Under Each Plan there is Dividend / Bonus and Growth Options
Regular Plan and Short Maturity Plan: Rs. 10000/- and in multiples of Re. 1/- thereafter. High Investment Plan: Rs. 50000/- and in multiples of Re. 1/- thereafter. Retirement Planning Series: Rs. 50000/- and in multiples of Re. 1/- thereafter.
Rs. 1000/- and in multiples of Re. 1/- thereafter.For HIP - Rs 10,000/- and in muliples of Re 1/- thereafter.
All Business Days
66,094.62
Tata MIP Plus Fund(TMPF) (An open ended income fund. Monthly income is notassured and is subject to theavailability of distributablesurplus)
March 19, 2004
An open ended income scheme with no assured returns that invests upto 20% of its assets in equities with an aim to provide an additional push to the monthly income over a period of time and the balance in quality debt and money market instruments
To provide reasonable and regular income along with possible capital appreciation to its Unitholders.
Nil
Monthly Income / Quarterly Income / Half Yearly Income and Growth
Monthly Income Rs. 25000/- and in multiples of Re. 1/- thereafter. Quarterly Income and Half Yearly Income Rs. 10000/- and in multiples of Re. 1/- thereafter. Growth Option Rs. 5000/- and in multiples of Re. 1/- thereafter.
Monthly Income: Rs. 5000/- and in multiples of Re. 1/- thereafter. Quarterly and Half Yearly Income and Growth: Rs. 1000/- and in multiples of Re. 1/- thereafter.
All Business Days
3,402.40
<= Rs. 25 lakhs: 1% if redeemed on or before expiry of 365 days from the date of allotment. For amt > Rs. 25 lakhs but < Rs. 1 Cr: 0.50% if redeemed on or before expiry of 365 days from the date of allotment, for amt >= Rs. 1 Cr: Nil.
For amt <= Rs. 25 lakhs: 1% if redeemed on or before expiry of 365 days from the date of allotment. For amt > Rs. 25 lakhs but < Rs. 1 Cr: 0.50% if redeemed on or before expiry of 365 days from the date of allotment, for amt >= Rs. 1 Cr: Nil.
SCHEMES AT A GLANCE
28
As per SEBI circular dated 31.12.2007 no entry load shall be charged for direct purchase/switch in applications accepted by the AMC.
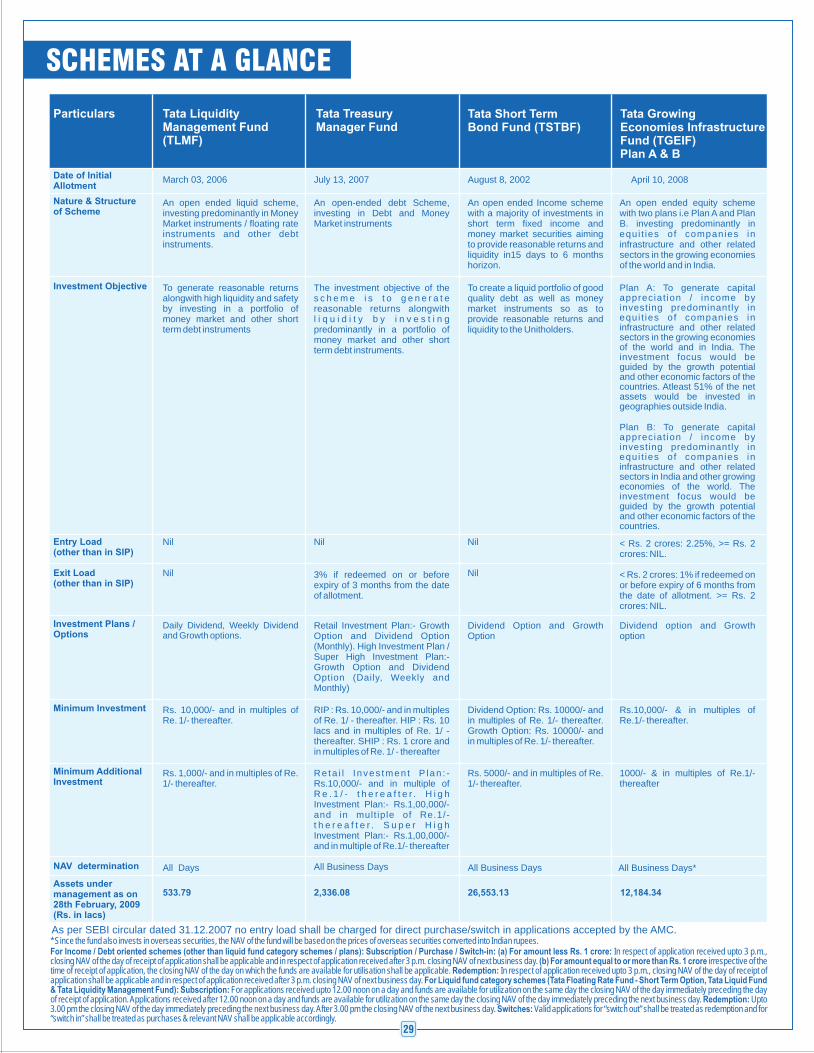
NAV determination
Assets under management as on 28th February, 2009(Rs. in lacs)
Particulars
Date of Initial Allotment
Nature & Structure of Scheme
Investment Objective
Investment Plans / Options
Minimum AdditionalInvestment
Minimum Investment
Exit Load(other than in SIP)
Tata Short Term Bond Fund (TSTBF)
August 8, 2002
An open ended Income scheme with a majority of investments in short term fixed income and money market securities aiming to provide reasonable returns and liquidity in15 days to 6 months horizon.
To create a liquid portfolio of good quality debt as well as money market instruments so as to provide reasonable returns and liquidity to the Unitholders.
Nil
Dividend Option and Growth Option
Dividend Option: Rs. 10000/- and in multiples of Re. 1/- thereafter. Growth Option: Rs. 10000/- and in multiples of Re. 1/- thereafter.
Rs. 5000/- and in multiples of Re. 1/- thereafter.
All Business Days
26,553.13
Tata Growing Economies InfrastructureFund (TGEIF)
April 10, 2008
An open ended equity scheme with two plans i.e Plan A and Plan B. investing predominantly in equi t ies of companies in infrastructure and other related sectors in the growing economies of the world and in India.
Plan A: To generate capital appreciat ion / income by investing predominantly in equi t ies of companies in infrastructure and other related sectors in the growing economies of the world and in India. The investment focus would be guided by the growth potential and other economic factors of the countries. Atleast 51% of the net assets would be invested in geographies outside India.
Plan B: To generate capital appreciat ion / income by investing predominantly in equi t ies of companies in infrastructure and other related sectors in India and other growing economies of the world. The investment focus would be guided by the growth potential and other economic factors of the countries.
< Rs. 2 crores: 1% if redeemed on or before expiry of 6 months from the date of allotment. >= Rs. 2 crores: NIL.
3% if redeemed on or before expiry of 3 months from the date of allotment.
Dividend option and Growth option
Rs.10,000/- & in multiples of Re.1/- thereafter.
1000/- & in multiples of Re.1/- thereafter
All Business Days*
12,184.34
Tata Treasury Manager Fund
July 13, 2007
An open-ended debt Scheme, investing in Debt and Money Market instruments
The investment objective of the s c h e m e i s t o g e n e r a t e reasonable returns alongwith l i q u i d i t y b y i n v e s t i n g predominantly in a portfolio of money market and other short term debt instruments.
Retail Investment Plan:- Growth Option and Dividend Option (Monthly). High Investment Plan / Super High Investment Plan:- Growth Option and Dividend Option (Daily, Weekly and Monthly)
RIP : Rs. 10,000/- and in multiples of Re. 1/ - thereafter. HIP : Rs. 10 lacs and in multiples of Re. 1/ - thereafter. SHIP : Rs. 1 crore and in multiples of Re. 1/ - thereafter
Re ta i l I nves tmen t P lan : - Rs.10,000/- and in multiple of R e . 1 / - t h e r e a f t e r . H i g h Investment Plan:- Rs.1,00,000/- and in mult iple of Re.1/- t h e r e a f t e r . S u p e r H i g h Investment Plan:- Rs.1,00,000/- and in multiple of Re.1/- thereafter
All Business Days
2,336.08
SCHEMES AT A GLANCE
29
* Since the fund also invests in overseas securities, the NAV of the fund will be based on the prices of overseas securities converted into Indian rupees.For Income / Debt oriented schemes (other than liquid fund category schemes / plans): Subscription / Purchase / Switch-in: (a) For amount less Rs. 1 crore: In respect of application received upto 3 p.m., closing NAV of the day of receipt of application shall be applicable and in respect of application received after 3 p.m. closing NAV of next business day. (b) For amount equal to or more than Rs. 1 crore irrespective of the time of receipt of application, the closing NAV of the day on which the funds are available for utilisation shall be applicable. Redemption: In respect of application received upto 3 p.m., closing NAV of the day of receipt of application shall be applicable and in respect of application received after 3 p.m. closing NAV of next business day. For Liquid fund category schemes (Tata Floating Rate Fund - Short Term Option, Tata Liquid Fund & Tata Liquidity Management Fund): Subscription: For applications received upto 12.00 noon on a day and funds are available for utilization on the same day the closing NAV of the day immediately preceding the day of receipt of application. Applications received after 12.00 noon on a day and funds are available for utilization on the same day the closing NAV of the day immediately preceding the next business day. Redemption: Upto 3.00 pm the closing NAV of the day immediately preceding the next business day. After 3.00 pm the closing NAV of the next business day. Switches: Valid applications for “switch out” shall be treated as redemption and for “switch in” shall be treated as purchases & relevant NAV shall be applicable accordingly.
As per SEBI circular dated 31.12.2007 no entry load shall be charged for direct purchase/switch in applications accepted by the AMC.
Tata LiquidityManagement Fund(TLMF)
533.79
March 03, 2006
An open ended liquid scheme, investing predominantly in Money Market instruments / floating rate instruments and other debt instruments.
All Days
To generate reasonable returns alongwith high liquidity and safety by investing in a portfolio of money market and other short term debt instruments
Entry Load(other than in SIP)
Nil Nil < Rs. 2 crores: 2.25%, >= Rs. 2 crores: NIL.
Nil
Nil
Daily Dividend, Weekly Dividend and Growth options.
Rs. 10,000/- and in multiples of Re. 1/- thereafter.
Rs. 1,000/- and in multiples of Re. 1/- thereafter.
Plan A & B
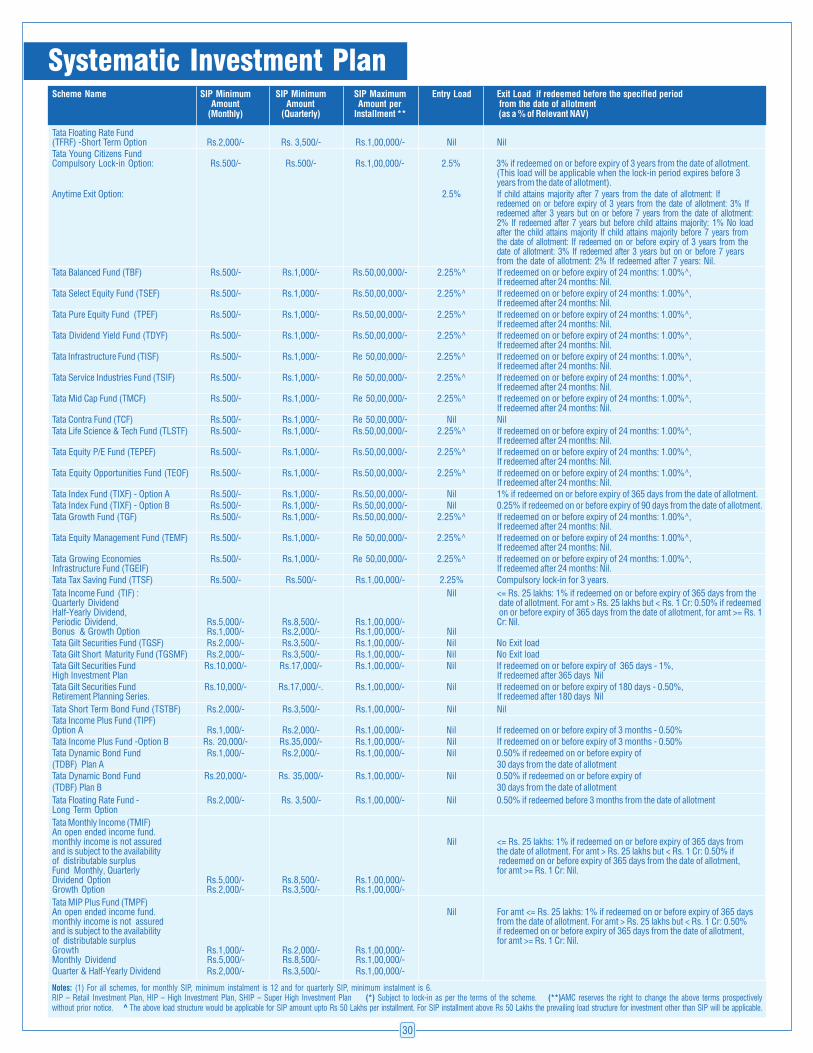
30
Scheme Name SIP Minimum SIP Minimum SIP Maximum Entry Load Exit Load if redeemed before the specified periodAmount Amount Amount per from the date of allotment
(Monthly) (Quarterly) Installment ** (as a % of Relevant NAV)
Tata Floating Rate Fund(TFRF) -Short Term Option Rs.2,000/- Rs. 3,500/- Rs.1,00,000/- Nil Nil
Tata Young Citizens FundCompulsory Lock-in Option: Rs.500/- Rs.500/- Rs.1,00,000/- 2.5% 3% if redeemed on or before expiry of 3 years from the date of allotment.
(This load will be applicable when the lock-in period expires before 3years from the date of allotment).
Anytime Exit Option: 2.5% If child attains majority after 7 years from the date of allotment: Ifredeemed on or before expiry of 3 years from the date of allotment: 3% Ifredeemed after 3 years but on or before 7 years from the date of allotment:2% If redeemed after 7 years but before child attains majority: 1% No loadafter the child attains majority If child attains majority before 7 years fromthe date of allotment: If redeemed on or before expiry of 3 years from thedate of allotment: 3% If redeemed after 3 years but on or before 7 yearsfrom the date of allotment: 2% If redeemed after 7 years: Nil.
Tata Balanced Fund (TBF) Rs.500/- Rs.1,000/- Rs.50,00,000/- 2.25%^ If redeemed on or before expiry of 24 months: 1.00%^,If redeemed after 24 months: Nil.
Tata Select Equity Fund (TSEF) Rs.500/- Rs.1,000/- Rs.50,00,000/- 2.25%^ If redeemed on or before expiry of 24 months: 1.00%^,If redeemed after 24 months: Nil.
Tata Pure Equity Fund (TPEF) Rs.500/- Rs.1,000/- Rs.50,00,000/- 2.25%^ If redeemed on or before expiry of 24 months: 1.00%^,If redeemed after 24 months: Nil.
Tata Dividend Yield Fund (TDYF) Rs.500/- Rs.1,000/- Rs.50,00,000/- 2.25%^ If redeemed on or before expiry of 24 months: 1.00%^,If redeemed after 24 months: Nil.
Tata Infrastructure Fund (TISF) Rs.500/- Rs.1,000/- Re 50,00,000/- 2.25%^ If redeemed on or before expiry of 24 months: 1.00%^,If redeemed after 24 months: Nil.
Tata Service Industries Fund (TSIF) Rs.500/- Rs.1,000/- Re 50,00,000/- 2.25%^ If redeemed on or before expiry of 24 months: 1.00%^,If redeemed after 24 months: Nil.
Tata Mid Cap Fund (TMCF) Rs.500/- Rs.1,000/- Re 50,00,000/- 2.25%^ If redeemed on or before expiry of 24 months: 1.00%^,If redeemed after 24 months: Nil.
Tata Contra Fund (TCF) Rs.500/- Rs.1,000/- Re 50,00,000/- Nil Nil
Tata Life Science & Tech Fund (TLSTF) Rs.500/- Rs.1,000/- Rs.50,00,000/- 2.25%^ If redeemed on or before expiry of 24 months: 1.00%^,If redeemed after 24 months: Nil.
Tata Equity P/E Fund (TEPEF) Rs.500/- Rs.1,000/- Rs.50,00,000/- 2.25%^ If redeemed on or before expiry of 24 months: 1.00%^,If redeemed after 24 months: Nil.
Tata Equity Opportunities Fund (TEOF) Rs.500/- Rs.1,000/- Rs.50,00,000/- 2.25%^ If redeemed on or before expiry of 24 months: 1.00%^,If redeemed after 24 months: Nil.
Tata Index Fund (TIXF) - Option A Rs.500/- Rs.1,000/- Rs.50,00,000/- Nil 1% if redeemed on or before expiry of 365 days from the date of allotment.Tata Index Fund (TIXF) - Option B Rs.500/- Rs.1,000/- Rs.50,00,000/- Nil 0.25% if redeemed on or before expiry of 90 days from the date of allotment.
Tata Growth Fund (TGF) Rs.500/- Rs.1,000/- Rs.50,00,000/- 2.25%^ If redeemed on or before expiry of 24 months: 1.00%^,If redeemed after 24 months: Nil.
Tata Equity Management Fund (TEMF) Rs.500/- Rs.1,000/- Re 50,00,000/- 2.25%^ If redeemed on or before expiry of 24 months: 1.00%^,If redeemed after 24 months: Nil.
Tata Growing Economies Rs.500/- Rs.1,000/- Re 50,00,000/- 2.25%^ If redeemed on or before expiry of 24 months: 1.00%^,Infrastructure Fund (TGEIF) If redeemed after 24 months: Nil.
Tata Tax Saving Fund (TTSF) Rs.500/- Rs.500/- Rs.1,00,000/- 2.25% Compulsory lock-in for 3 years.
Tata Income Fund (TIF) : Nil <= Rs. 25 lakhs: 1% if redeemed on or before expiry of 365 days from theQuarterly Dividend date of allotment. For amt > Rs. 25 lakhs but < Rs. 1 Cr: 0.50% if redeemedHalf-Yearly Dividend, on or before expiry of 365 days from the date of allotment, for amt >= Rs. 1Periodic Dividend, Rs.5,000/- Rs.8,500/- Rs.1,00,000/- Cr: Nil.Bonus & Growth Option Rs.1,000/- Rs.2,000/- Rs.1,00,000/- Nil
Tata Gilt Securities Fund (TGSF) Rs.2,000/- Rs.3,500/- Rs.1,00,000/- Nil No Exit loadTata Gilt Short Maturity Fund (TGSMF) Rs.2,000/- Rs.3,500/- Rs.1,00,000/- Nil No Exit load
Tata Gilt Securities Fund Rs.10,000/- Rs.17,000/- Rs.1,00,000/- Nil If redeemed on or before expiry of 365 days - 1%,High Investment Plan If redeemed after 365 days Nil
Tata Gilt Securities Fund Rs.10,000/- Rs.17,000/-. Rs.1,00,000/- Nil If redeemed on or before expiry of 180 days - 0.50%,Retirement Planning Series. If redeemed after 180 days Nil
Tata Short Term Bond Fund (TSTBF) Rs.2,000/- Rs.3,500/- Rs.1,00,000/- Nil NilTata Income Plus Fund (TIPF)Option A Rs.1,000/- Rs.2,000/- Rs.1,00,000/- Nil If redeemed on or before expiry of 3 months - 0.50%
Tata Income Plus Fund -Option B Rs. 20,000/- Rs.35,000/- Rs.1,00,000/- Nil If redeemed on or before expiry of 3 months - 0.50%
Tata Dynamic Bond Fund Rs.1,000/- Rs.2,000/- Rs.1,00,000/- Nil 0.50% if redeemed on or before expiry of(TDBF) Plan A 30 days from the date of allotment
Tata Dynamic Bond Fund Rs.20,000/- Rs. 35,000/- Rs.1,00,000/- Nil 0.50% if redeemed on or before expiry of
(TDBF) Plan B 30 days from the date of allotment
Tata Floating Rate Fund - Rs.2,000/- Rs. 3,500/- Rs.1,00,000/- Nil 0.50% if redeemed before 3 months from the date of allotmentLong Term Option
Tata Monthly Income (TMIF)An open ended income fund.monthly income is not assured Nil <= Rs. 25 lakhs: 1% if redeemed on or before expiry of 365 days fromand is subject to the availability the date of allotment. For amt > Rs. 25 lakhs but < Rs. 1 Cr: 0.50% ifof distributable surplus redeemed on or before expiry of 365 days from the date of allotment,Fund Monthly, Quarterly for amt >= Rs. 1 Cr: Nil.Dividend Option Rs.5,000/- Rs.8,500/- Rs.1,00,000/-Growth Option Rs.2,000/- Rs.3,500/- Rs.1,00,000/-
Tata MIP Plus Fund (TMPF)An open ended income fund. Nil For amt <= Rs. 25 lakhs: 1% if redeemed on or before expiry of 365 daysmonthly income is not assured from the date of allotment. For amt > Rs. 25 lakhs but < Rs. 1 Cr: 0.50%and is subject to the availability if redeemed on or before expiry of 365 days from the date of allotment,of distributable surplus for amt >= Rs. 1 Cr: Nil.Growth Rs.1,000/- Rs.2,000/- Rs.1,00,000/-Monthly Dividend Rs.5,000/- Rs.8,500/- Rs.1,00,000/-Quarter & Half-Yearly Dividend Rs.2,000/- Rs.3,500/- Rs.1,00,000/-
Systematic Investment Plan
Notes: (1) For all schemes, for monthly SIP, minimum instalment is 12 and for quarterly SIP, minimum instalment is 6.RIP – Retail Investment Plan, HIP – High Investment Plan, SHIP – Super High Investment Plan (*) Subject to lock-in as per the terms of the scheme. (**)AMC reserves the right to change the above terms prospectivelywithout prior notice. ^ The above load structure would be applicable for SIP amount upto Rs 50 Lakhs per installment. For SIP installment above Rs 50 Lakhs the prevailing load structure for investment other than SIP will be applicable.
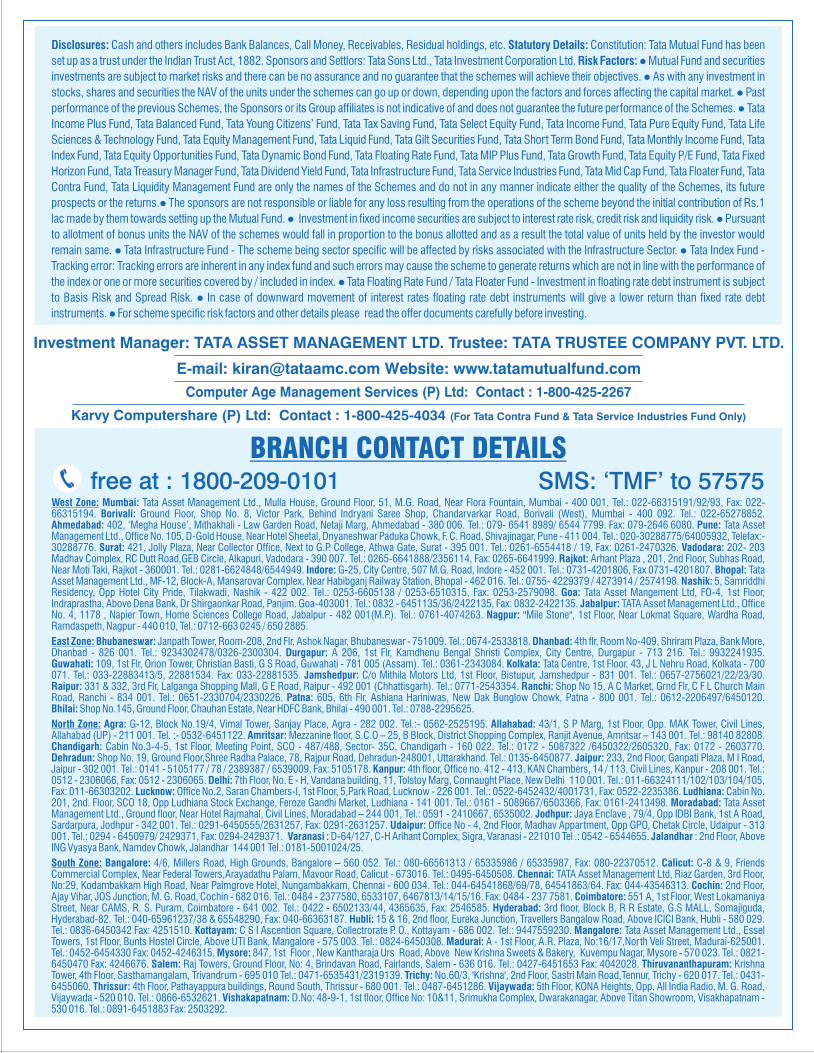
Disclosures: Cash and others includes Bank Balances, Call Money, Receivables, Residual holdings, etc. Statutory Details: Constitution: Tata Mutual Fund has been
set up as a trust under the Indian Trust Act, 1882. Sponsors and Settlors: Tata Sons Ltd., Tata Investment Corporation Ltd. Risk Factors: l Mutual Fund and securities
investments are subject to market risks and there can be no assurance and no guarantee that the schemes will achieve their objectives. l As with any investment in
stocks, shares and securities the NAV of the units under the schemes can go up or down, depending upon the factors and forces affecting the capital market. l Past
performance of the previous Schemes, the Sponsors or its Group affiliates is not indicative of and does not guarantee the future performance of the Schemes. l Tata
Income Plus Fund, Tata Balanced Fund, Tata Young Citizens’ Fund, Tata Tax Saving Fund, Tata Select Equity Fund, Tata Income Fund, Tata Pure Equity Fund, Tata Life
Sciences & Technology Fund, Tata Equity Management Fund, Tata Liquid Fund, Tata Gilt Securities Fund, Tata Short Term Bond Fund, Tata Monthly Income Fund, Tata
Index Fund, Tata Equity Opportunities Fund, Tata Dynamic Bond Fund, Tata Floating Rate Fund, Tata MIP Plus Fund, Tata Growth Fund, Tata Equity P/E Fund, Tata Fixed
Horizon Fund, Tata Treasury Manager Fund, Tata Dividend Yield Fund, Tata Infrastructure Fund, Tata Service Industries Fund, Tata Mid Cap Fund, Tata Floater Fund, Tata
Contra Fund, Tata Liquidity Management Fund are only the names of the Schemes and do not in any manner indicate either the quality of the Schemes, its future
prospects or the returns.l The sponsors are not responsible or liable for any loss resulting from the operations of the scheme beyond the initial contribution of Rs.1
lac made by them towards setting up the Mutual Fund. l Investment in fixed income securities are subject to interest rate risk, credit risk and liquidity risk. l Pursuant
to allotment of bonus units the NAV of the schemes would fall in proportion to the bonus allotted and as a result the total value of units held by the investor would
remain same. l Tata Infrastructure Fund - The scheme being sector specific will be affected by risks associated with the Infrastructure Sector. l Tata Index Fund -
Tracking error: Tracking errors are inherent in any index fund and such errors may cause the scheme to generate returns which are not in line with the performance of
the index or one or more securities covered by / included in index. l Tata Floating Rate Fund / Tata Floater Fund - Investment in floating rate debt instrument is subject
to Basis Risk and Spread Risk. l In case of downward movement of interest rates floating rate debt instruments will give a lower return than fixed rate debt
instruments. l For scheme specific risk factors and other details please read the offer documents carefully before investing.
Investment Manager: TATA ASSET MANAGEMENT LTD. Trustee: TATA TRUSTEE COMPANY PVT. LTD.
E-mail: [email protected] Website: www.tatamutualfund.com
Karvy Computershare (P) Ltd: Contact : 1-800-425-4034 (For Tata Contra Fund & Tata Service Industries Fund Only)
Computer Age Management Services (P) Ltd: Contact : 1-800-425-2267
BRANCH CONTACT DETAILSfree at : 1800-209-0101 SMS: ‘TMF’ to 57575
West Zone: Mumbai: Tata Asset Management Ltd., Mulla House, Ground Floor, 51, M.G. Road, Near Flora Fountain, Mumbai - 400 001. Tel.: 022-66315191/92/93, Fax: 022- 66315194. Borivali: Ground Floor, Shop No. 8, Victor Park, Behind Indryani Saree Shop, Chandarvarkar Road, Borivali (West), Mumbai - 400 092. Tel.: 022-65278852.Ahmedabad: 402, ‘Megha House’, Mithakhali - Law Garden Road, Netaji Marg, Ahmedabad - 380 006. Tel.: 079- 6541 8989/ 6544 7799. Fax: 079-2646 6080. Pune: Tata Asset Management Ltd., Office No. 105, D-Gold House, Near Hotel Sheetal, Dnyaneshwar Paduka Chowk, F. C. Road, Shivajinagar, Pune - 411 004. Tel.: 020-30288775/64005932, Telefax:- 30288776. Surat: 421, Jolly Plaza, Near Collector Office, Next to G.P. College, Athwa Gate, Surat - 395 001. Tel.: 0261-6554418 / 19, Fax: 0261-2470326. Vadodara: 202- 203 Madhav Complex, RC Dutt Road,GEB Circle, Alkapuri, Vadodara - 390 007. Tel.: 0265-6641888/2356114, Fax: 0265-6641999. Rajkot: Arhant Plaza , 201, 2nd Floor, Subhas Road, Near Moti Taki, Rajkot - 360001. Tel.: 0281-6624848/6544949. Indore: G-25, City Centre, 507 M.G. Road, Indore - 452 001. Tel.: 0731-4201806, Fax 0731-4201807. Bhopal: Tata Asset Management Ltd., MF-12, Block-A, Mansarovar Complex, Near Habibganj Railway Station, Bhopal - 462 016. Tel.: 0755- 4229379 / 4273914 / 2574198. Nashik: 5, Samriddhi Residency, Opp Hotel City Pride, Tilakwadi, Nashik - 422 002. Tel.: 0253-6605138 / 0253-6510315, Fax: 0253-2579098. Goa: Tata Asset Mangement Ltd, FO-4, 1st Floor, Indraprastha, Above Dena Bank, Dr Shirgaonkar Road, Panjim. Goa-403001. Tel.: 0832 - 6451135/36/2422135, Fax: 0832-2422135. Jabalpur: TATA Asset Management Ltd., Office No. 4, 1178 , Napier Town, Home Sciences College Road, Jabalpur - 482 001(M.P.). Tel.: 0761-4074263. Nagpur: "Mile Stone", 1st Floor, Near Lokmat Square, Wardha Road, Ramdaspeth, Nagpur - 440 010, Tel.: 0712-663 0245 / 650 2885.
East Zone: Bhubaneswar: Janpath Tower, Room-208, 2nd Flr, Ashok Nagar, Bhubaneswar - 751009. Tel.: 0674-2533818. Dhanbad: 4th flr, Room No-409, Shriram Plaza, Bank More, Dhanbad - 826 001. Tel.: 9234302478/0326-2300304. Durgapur: A 206, 1st Flr, Kamdhenu Bengal Shristi Complex, City Centre, Durgapur - 713 216. Tel.: 9932241935.Guwahati: 109, 1st Flr, Orion Tower, Christian Basti, G S Road, Guwahati - 781 005 (Assam). Tel.: 0361-2343084. Kolkata: Tata Centre, 1st Floor, 43, J L Nehru Road, Kolkata - 700 071. Tel.: 033-22883413/5, 22881534. Fax: 033-22881535. Jamshedpur: C/o Mithila Motors Ltd, 1st Floor, Bistupur, Jamshedpur - 831 001. Tel.: 0657-2756021/22/23/30. Raipur: 331 & 332, 3rd Flr, Lalganga Shopping Mall, G E Road, Raipur - 492 001 (Chhattisgarh). Tel.: 0771-2543354. Ranchi: Shop No 15, A C Market, Grnd Flr, C F L Church Main Road, Ranchi - 834 001. Tel.: 0651-2330704/2330226. Patna: 605, 6th Flr, Ashiana Hariniwas, New Dak Bunglow Chowk, Patna - 800 001. Tel.: 0612-2206497/6450120. Bhilai: Shop No.145, Ground Floor, Chauhan Estate, Near HDFC Bank, Bhilai - 490 001. Tel.: 0788-2295625.
North Zone: Agra: G-12, Block No.19/4, Vimal Tower, Sanjay Place, Agra - 282 002. Tel.:- 0562-2525195. Allahabad: 43/1, S P Marg, 1st Floor, Opp. MAK Tower, Civil Lines, Allahabad (UP) - 211 001. Tel. :- 0532-6451122. Amritsar: Mezzanine floor, S.C.O – 25, B Block, District Shopping Complex, Ranjit Avenue, Amritsar – 143 001. Tel.: 98140 82808. Chandigarh: Cabin No.3-4-5, 1st Floor, Meeting Point, SCO - 487/488, Sector- 35C, Chandigarh - 160 022. Tel.: 0172 - 5087322 /6450322/2605320, Fax: 0172 - 2603770. Dehradun: Shop No. 19, Ground Floor,Shree Radha Palace, 78, Rajpur Road, Dehradun-248001, Uttarakhand. Tel.: 0135-6450877. Jaipur: 233, 2nd Floor, Ganpati Plaza, M I Road, Jaipur - 302 001. Tel.: 0141 - 5105177 / 78 / 2389387 / 6539009, Fax: 5105178. Kanpur: 4th floor, Office no. 412 - 413, KAN Chambers, 14 / 113, Civil Lines, Kanpur - 208 001. Tel.: 0512 - 2306066, Fax: 0512 - 2306065. Delhi: 7th Floor, No. E - H, Vandana building, 11, Tolstoy Marg, Connaught Place, New Delhi 110 001. Tel.: 011-66324111/102/103/104/105, Fax: 011-66303202. Lucknow: Office No.2, Saran Chambers-I, 1st Floor, 5,Park Road, Lucknow - 226 001. Tel.: 0522-6452432/4001731, Fax: 0522-2235386. Ludhiana: Cabin No. 201, 2nd. Floor, SCO 18, Opp Ludhiana Stock Exchange, Feroze Gandhi Market, Ludhiana - 141 001. Tel.: 0161 - 5089667/6503366, Fax: 0161-2413498. Moradabad: Tata Asset Management Ltd., Ground floor, Near Hotel Rajmahal, Civil Lines, Moradabad – 244 001, Tel.: 0591 - 2410667, 6535002. Jodhpur: Jaya Enclave , 79/4, Opp IDBI Bank, 1st A Road, Sardarpura, Jodhpur - 342 001. Tel.: 0291-6450555/2631257, Fax: 0291-2631257. Udaipur: Office No - 4, 2nd Floor, Madhav Appartment, Opp GPO, Chetak Circle, Udaipur - 313 001. Tel.: 0294 - 6450979/ 2429371, Fax: 0294-2429371. Varanasi : D-64/127, C-H Arihant Complex, Sigra, Varanasi - 221010 Tel .: 0542 - 6544655. Jalandhar : 2nd Floor, Above ING Vyasya Bank, Namdev Chowk, Jalandhar 144 001 Tel.: 0181-5001024/25.
South Zone: Bangalore: 4/6, Millers Road, High Grounds, Bangalore – 560 052. Tel.: 080-66561313 / 65335986 / 65335987, Fax: 080-22370512. Calicut: C-8 & 9, Friends Commercial Complex, Near Federal Towers,Arayadathu Palam, Mavoor Road, Calicut - 673016. Tel.: 0495-6450508. Chennai: TATA Asset Management Ltd, Riaz Garden, 3rd Floor, No:29, Kodambakkam High Road, Near Palmgrove Hotel, Nungambakkam, Chennai - 600 034. Tel.: 044-64541868/69/78, 64541863/64. Fax: 044-43546313. Cochin: 2nd Floor, Ajay Vihar, JOS Junction, M. G. Road, Cochin - 682 016. Tel.: 0484 - 2377580, 6533107, 6467813/14/15/16. Fax: 0484 - 237 7581. Coimbatore: 551 A, 1st Floor, West Lokamaniya Street, Near CAMS, R. S. Puram, Coimbatore - 641 002. Tel.: 0422 - 6502133/44, 4365635, Fax: 2546585. Hyderabad: 3rd floor, Block B, R R Estate, G.S MALL, Somajiguda, Hyderabad-82. Tel.: 040-65961237/38 & 65548290, Fax: 040-66363187. Hubli: 15 & 16, 2nd floor, Eureka Junction, Travellers Bangalow Road, Above ICICI Bank, Hubli - 580 029. Tel.: 0836-6450342 Fax: 4251510. Kottayam: C S I Ascention Square, Collectrorate P. O., Kottayam - 686 002. Tel.: 9447559230. Mangalore: Tata Asset Management Ltd., Essel Towers, 1st Floor, Bunts Hostel Circle, Above UTI Bank, Mangalore - 575 003. Tel.: 0824-6450308. Madurai: A - 1st Floor, A.R. Plaza, No:16/17,North Veli Street, Madurai-625001.Tel.: 0452-6454330 Fax: 0452-4246315. Mysore: 847, 1st Floor , New Kantharaja Urs Road, Above New Krishna Sweets & Bakery, Kuvempu Nagar, Mysore - 570 023. Tel.: 0821-6450470 Fax: 4246676. Salem: Raj Towers, Ground Floor, No: 4, Brindavan Road, Fairlands, Salem - 636 016. Tel.: 0427-6451653 Fax: 4042028. Thiruvananthapuram: Krishna Tower, 4th Floor, Sasthamangalam, Trivandrum - 695 010 Tel.: 0471-6535431/2319139. Trichy: No.60/3, 'Krishna', 2nd Floor, Sastri Main Road,Tennur, Trichy - 620 017. Tel.: 0431-6455060. Thrissur: 4th Floor, Pathayappura buildings, Round South, Thrissur - 680 001. Tel.: 0487-6451286. Vijaywada: 5th Floor, KONA Heights, Opp. All India Radio, M. G. Road, Vijaywada - 520 010. Tel.: 0866-6532621. Vishakapatnam: D.No: 48-9-1, 1st floor, Office No: 10&11, Srimukha Complex, Dwarakanagar, Above Titan Showroom, Visakhapatnam - 530 016. Tel.: 0891-6451883 Fax: 2503292.