Embed Size (px)
Citation preview
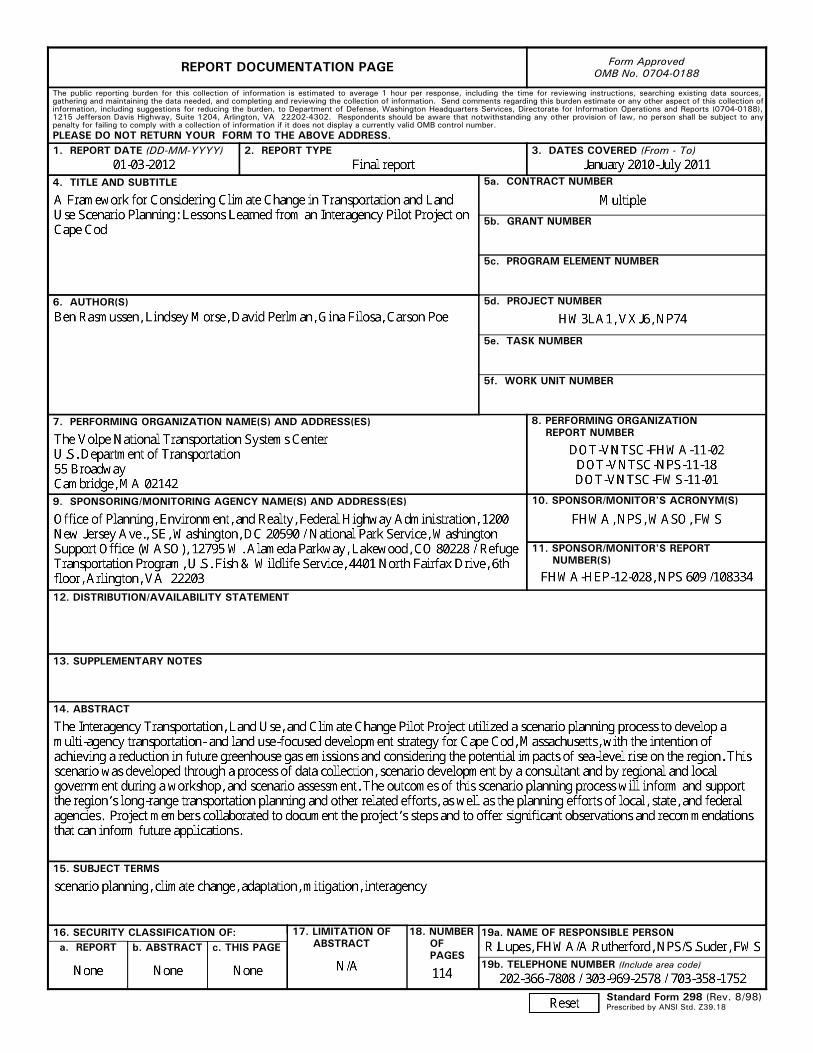
Standard Form 298 (Rev. 8/98)
REPORT DOCUMENTATION PAGE
Prescribed by ANSI Std. Z39.18
Form Approved OMB No. 0704-0188
The public reporting burden for this collection of information is estimated to average 1 hour per response, including the time for reviewing instructions, searching existing data sources, gathering and maintaining the data needed, and completing and reviewing the collection of information. Send comments regarding this burden estimate or any other aspect of this collection of information, including suggestions for reducing the burden, to Department of Defense, Washington Headquarters Services, Directorate for Information Operations and Reports (0704-0188), 1215 Jefferson Davis Highway, Suite 1204, Arlington, VA 22202-4302. Respondents should be aware that notwithstanding any other provision of law, no person shall be subject to any penalty for failing to comply with a collection of information if it does not display a currently valid OMB control number. PLEASE DO NOT RETURN YOUR FORM TO THE ABOVE ADDRESS. 1. REPORT DATE (DD-MM-YYYY) 2. REPORT TYPE 3. DATES COVERED (From - To)
4. TITLE AND SUBTITLE 5a. CONTRACT NUMBER
5b. GRANT NUMBER
5c. PROGRAM ELEMENT NUMBER
5d. PROJECT NUMBER
5e. TASK NUMBER
5f. WORK UNIT NUMBER
6. AUTHOR(S)
7. PERFORMING ORGANIZATION NAME(S) AND ADDRESS(ES) 8. PERFORMING ORGANIZATION REPORT NUMBER
9. SPONSORING/MONITORING AGENCY NAME(S) AND ADDRESS(ES) 10. SPONSOR/MONITOR'S ACRONYM(S)
11. SPONSOR/MONITOR'S REPORT NUMBER(S)
12. DISTRIBUTION/AVAILABILITY STATEMENT
13. SUPPLEMENTARY NOTES
14. ABSTRACT
15. SUBJECT TERMS
16. SECURITY CLASSIFICATION OF: a. REPORT b. ABSTRACT c. THIS PAGE
17. LIMITATION OF ABSTRACT
18. NUMBER OF PAGES
19a. NAME OF RESPONSIBLE PERSON
19b. TELEPHONE NUMBER (Include area code)
A Framework for Considering Climate Change in Transportation and Land Use Scenario Planning Lessons Learned from an Interagency Pilot Project on Cape Cod March 2012
FHWA-HEP-12-028
NPS 609 /108334
Federal Highway Administration National Park Service U.S. Fish and Wildlife Service

The Interagency Transportation, Land Use, and Climate Change Pilot Project utilized a scenario planning process to develop a multi-agency transportation- and land use-focused development strategy for Cape Cod, Massachusetts, with the intention of achieving a reduction in future greenhouse gas emissions and considering the potential impacts of sea-level rise on the region. The outcomes of this scenario planning process will inform and support the region’s long-range transportation planning and other related efforts, as well as the planning efforts of local, state, and federal agencies.
Project members collaborated to document the project’s steps and to offer significant observations and recommendations that can inform future applications. This information is presented in this report. The appendices and a separate document, the Technical Scenario Report, developed by the scenario planning consultants, provide supporting documentation.
Table of Contents
Overview ........................................................ i
I. Introduction ............................................... 1
II. Project Definition ........................................ 7
III. Data Requirements .................................. 16
IV. Scenario Development ............................. 27
V. Assessment of Scenarios ......................... 47
VI. Conclusion .............................................. 54
Appendices
Appendix A: Planning Group and Technical Committee Charters and Rosters
Appendix B: Literature Review
Appendix C: Request for Proposals
Appendix D: List of Potential Performance Indicators
Appendix E: Vulnerable Area Map and Key
Appendix F: Potential GHG Reduction Strategies
Appendix G: Priority Transportation Strategies for Cape Cod
Appendix H: Scenario Planning Workshop Agenda
Final Report Interagency Transportation, Land Use, and Climate Change Pilot Project
Report Notes and Acknowledgements This report was prepared by the U.S. Department of Transportation John A. Volpe National Transportation Systems Center in Cambridge, MA, for the Federal Highway Administration, National Park Service, and Fish and Wildlife Service. The project team was led by Benjamin Rasmussen of the Transportation Planning Division and included Lindsey Morse, also of the Transportation Planning Division, and Gina Filosa, David Perlman, and Carson Poe of the Program and Organizational Performance Division. The project team would like to thank the sponsors, Planning Group, Technical Committee, and local and regional stakeholders – in particular the Cape Cod Commission, Cape Cod National Seashore, Cape Cod Regional Transit Authority, and towns – for their participation and contributions.
Final Report Interagency Transportation, Land Use, and Climate Change Pilot Project i
Overview Project The Interagency Transportation, Land Use, and Climate Change Cape Cod Pilot Project (Pilot Project) is a federally-sponsored project that took place between early 2010 and mid 2011. Initiated by a federal interagency working group, the Pilot Project resulted in a multi-agency transportation and land use development scenario for Cape Cod, Massachusetts, focused on reducing future greenhouse gas (GHG) emissions and considering the potential impacts of sea-level rise (SLR) on the region. This scenario was developed through a process of data collection, scenario development by a consultant and by regional and local government during a workshop, and scenario assessment. The outcomes of this scenario planning process will inform and support the region’s long-range transportation planning and other related efforts, as well as the planning efforts of local, state, and federal agencies. This project represents one approach to climate change and scenario planning; other methods exist and can be pursued separately or in concert with this approach. Project members collaborated to document the project’s steps and to offer significant observations and recommendations that can inform future applications. This information is presented in this report.
Report Purpose and Audience The purpose of this report is to document the process followed by, successes of, and lessons learned during the Pilot Project in order to provide other communities with recommendations on how to replicate or build upon this process in the future.
This report provides a framework for federal, state, regional, and local agencies to use to work collaboratively to reduce GHG emissions and to assess, mitigate, and adapt to SLR and other potential climate change effects and impacts in transportation and land use planning using scenario planning. General observations and recommendations are applicable to other areas throughout the U.S. The report describes potential inputs to and outputs of the process and provides examples and additional details in appendices and companion reports. The recommendations are not meant to be prescriptive in nature. Rather, they represent the views of the Pilot Project team on the successes as well as opportunities for improving the Pilot Project’s method.
This report is intended to serve as a resource for staff within organizations that may be interested in, or stand to benefit from, incorporating consideration of climate change into transportation and land use planning, including metropolitan planning organizations (MPOs), regional planning organizations (RPOs), state departments of transportation (DOTs) or other state agencies, counties, and cities. Federal land management, transportation, natural resource, and emergency management staff, as well as any federal land-owning agency, may be similarly interested in understanding the value of the described process and how it can be incorporated into and used in support of local transportation, land use, and climate change mitigation and adaptation initiatives.
Final Report Interagency Transportation, Land Use, and Climate Change Pilot Project ii
Structure The report outlines the steps in the transportation, land use, and climate change scenario planning process followed by the Pilot Project, which closely match the phases outlined in the FHWA Scenario Planning Guidebook. However, it is important to note that this report differs from the FHWA Guidebook in its nature and scope. The FHWA Guidebook discusses common steps for typical scenario planning exercises, while this report focuses on the application of those steps to achieve outcomes that address climate change problems. The Pilot Project process focused on the incorporation of climate change mitigation and adaptation considerations and goals into a regional-level scenario planning exercise, whereas the FHWA Scenario Planning Guidebook discusses more general applications of scenario planning that are applicable across a variety of topic areas.
For purposes of this report, the scenario planning process was organized into the following chapters, which are described in brief below.
1. Project Definition 2. Data Requirements 3. Scenario Development 4. Scenario Assessment
The chapters provide information on the actual process followed, observations made, and the resulting recommendations for future implementation based on the experience of the Pilot Project. Observations and recommendations from the project’s approach are presented at the end of each of the first three chapters. The fourth chapter, Scenario Assessment, provides observations about how the scenarios performed. Relevant observations and recommendations for the assessment methodology are captured in Data Requirements and Scenario Development.
The conclusion of the report reviews the goals of the project, outlines recommended steps and considerations for future applications of the process, and reviews the role that various participants – federal, state, regional, and local – can play in the process.
Project Definition
Project definition consists of selection of the study area, identification of roles and responsibilities, coordination with existing plans and research, and determination of outputs and outcomes. Stakeholder coordination and communication were very important due to the involvement of many federal, state, regional, and local agencies. A review of the existing literature and efforts around related topics created a foundation of work on which the Pilot Project could build, not replicate, and use as appropriate. Finally, the involved entities worked together throughout the Pilot Project to define desired and expected outcomes and outputs, and to determine how best to incorporate them into federal, state, regional, and local agencies’ project proposals and short- and long-range plans.
Final Report Interagency Transportation, Land Use, and Climate Change Pilot Project iii
Data Requirements
Scenario planning is a data-intensive process and, accordingly, the Pilot Project depended on robust data for each of its major elements: creating the baseline of existing conditions, developing the performance indicators for evaluation, and projecting future conditions. Data on transportation infrastructure and services, land use, population, resource protection and preservation, and SLR were integral to the development of the land use and transportation scenarios and evaluation of the scenarios based on identified performance indicators.
Scenario Development
The Pilot Project developed a total of 10 transportation and land use scenarios with the assistance of a scenario planning consultant and software tool that were selected through a request for proposals. Five of these scenarios, including the final Refined scenario, were developed by stakeholders during a series of workshops and meetings. These scenarios consisted of the following:
1-5. Five preliminary scenarios developed by the scenario planning consultant for demonstrative purposes, consisting of:
1. Trend 2. Dispersed – Standard Transportation 3. Dispersed – Enhanced Transportation 4. Targeted – Standard Transportation 5. Targeted – Enhanced Transportation
6-9. Four scenarios developed by stakeholder participants at a November 2010
workshop
10. One refined scenario developed by stakeholders after the workshop
All the scenarios involved the placement of population and employment based on growth assumptions for 2030 and the identification of transit improvements.
Scenario Assessment
The 10 scenarios were assessed using a set of performance indicators that covered GHG mitigation, adaptation to SLR, transit access, and protection of natural ecosystems and other areas of significance. Performance indicators, or measures of performance, allow participants to compare the effects or consequences of different land use and transportation decisions.
Final Report Interagency Transportation, Land Use, and Climate Change Pilot Project 1
Introduction Background In 2008, the Federal Highway Administration (FHWA) assembled 13 federal agencies1 to form the Interagency Working Group on Transportation, Land Use, and Climate Change. The Working Group’s goal was to identify opportunities to align federal programs and resources to support regional communities in achieving GHG emission reductions and preparing for potential climate change impacts through transportation and land use planning decisions. The Working Group identified two focus areas where federal agencies could begin to align efforts to address climate change:
Integrated Regional Planning and Development: This focus area recognizes the continuing need to link short and long-range transportation planning and corridor-level planning studies performed by state and local governments to the planning processes of local land use (primarily housing and economic development) and environmental agencies.
Intermodal Gateway Mobility Planning: This focus area seeks to provide multi-modal transportation options to move both people and goods to, from, and through gateway communities, defined as areas traveled through to get to a destination such as a national park, national forest, national wildlife refuge, airport, beach, or port. Federal involvement supporting more comprehensive planning for gateway community mobility, in both metropolitan and rural areas, can lead to better decisions that benefit communities and can lead to reduced growth of vehicle miles traveled (VMT) and consequently GHG emission reductions.
Formation of Pilot Project In 2009, the Working Group selected Cape Cod, Massachusetts as a pilot area to facilitate and enhance integrated regional and intermodal gateway mobility planning at the state, regional, and local levels. The U.S. Department of Transportation (USDOT) Volpe National Transportation Systems Center (Volpe Center) began the resulting Interagency Transportation, Land Use, and Climate Change Pilot Project (Pilot Project) in early 2010 along with FHWA, the National Park Service (NPS), and the U.S. Fish and Wildlife Service (FWS). These agencies viewed the Pilot Project as an opportunity to address GHG reduction and transportation-based adaptation to climate change and to pilot and evaluate scenario planning as a method for doing so.
1 Department of Energy, Department of Housing and Urban Development, Environmental Protection Agency, Federal Aviation Administration, Federal Motor Carrier Safety Administration, Federal Transit Administration, National Oceanic and Atmospheric Administration, Office of the Secretary of Transportation, Army Corps of Engineers, Department of Agriculture (USDA), USDA Forest Service, Department of the Interior, and Bureau of Land Management .
Final Report Interagency Transportation, Land Use, and Climate Change Pilot Project 2
Goals The Pilot Project intended to address the following goals:
Climate Change. Incorporate climate change considerations – namely, reduction of GHG emissions and the impacts of climate change effects on the transportation system – into transportation and land use planning.
Scenario Planning. Use scenario planning as a method/tool for considering climate change in transportation and land use planning, and developing a future transportation and land use strategy.
Interagency Coordination. Share and coordinate resources and expertise between multiple federal, regional, and local stakeholders, and better integrate agencies’ planning processes.
Replicability. Establish an overall process that can be replicated elsewhere.
Climate Change Mitigation and Adaptation The nation’s transportation system contributes significantly to overall U.S. GHG emissions and, as a result, to climate change, which is causing effects, such as SLR, that will negatively impact the transportation system. Therefore, attempts within the transportation field to address climate change entail two components: mitigation and adaptation. Mitigation encompasses activities aimed at reducing GHG emissions from transportation infrastructure and activities, and adaptation refers to activities aimed at increasing the resiliency of the transportation network (or specific infrastructure assets) when confronted with expected, or actual, climate change impacts. Federal, state, regional, and local government agencies and partners who are involved in transportation, land use, emergency management, and related areas share the responsibility for mitigation and adaptation within the transportation context.
GHG Emissions Mitigation
The Environmental Protection Agency (EPA) defines a GHG as any gas that traps heat in the atmosphere. Certain GHGs, like carbon dioxide, nitrous oxide, and methane, occur naturally in the atmosphere but are also produced through the combustion of fossil fuels and other industrial processes. These additional sources of GHG emissions trap extra heat in the atmosphere, causing shifts in the planet’s climate. Transportation represents a significant source of GHG emissions, both in the U.S. and worldwide. The EPA estimates that U.S. tailpipe emissions2 represent 27 percent of the country’s total GHG
2 Tailpipe emissions are those produced directly by burning fuel to power vehicles and do not include emissions associated with constructing or maintaining transportation infrastructure, extracting or refining fuels, or producing vehicles.
Final Report Interagency Transportation, Land Use, and Climate Change Pilot Project 3
emissions and five percent of global GHG emissions.3 Reducing transportation’s contribution to overall GHG emissions and the resulting changes in climate will require mitigation strategies that reduce fossil fuel consumption and the carbon content of fuels. These include, but are not limited to, improving system and operational efficiencies, reducing growth of VMT, transitioning to lower GHG fuels, and improving vehicle technologies. A more thorough discussion of GHG emission reduction strategies for Cape Cod is presented in Section III, and a list of strategies is in Appendix F: Potential GHG Reduction Strategies.
Climate Change Adaptation
While lowering transportation GHG emissions is an important strategy for reducing the long-term effects of climate change, mitigation will likely do little in the short-term to alter climate change processes already underway. Adaptation to the anticipated effects of climate change is a climate change strategy equally important as mitigation. Adaptation consists of five primary actions: repair and maintenance, reconstruction/strengthening, relocation, abandonment, and redundancy.
Climate change stands to have effects on transportation infrastructure in a variety of ways.4 The expected effects differ by region of the U.S. based on geographical, meteorological, and other features, but common effects include rising sea levels, increasingly frequent and intense storms, higher average temperatures, greater levels of precipitation, and drought.5,6 An increasingly volatile and severe climate will necessitate transportation infrastructure that is more resilient, but the uncertainty of climate change will also demand planning practices that anticipate the range of potential changes that may occur over the lifespan of new and existing infrastructure. In certain cases, fortifying infrastructure to withstand wider temperature extremes and more severe storm activity will suffice but adaptation to climate change, particularly in low-lying coastal areas, may require difficult decisions about relocating or abandoning at-risk facilities.
3 U.S. EPA (2011). Inventory of U.S. Greenhouse Gas Emissions and Sinks: 1990 to 2009. (http://ntl.bts.gov/lib/32000/32700/32779/DOT_Climate_Change_Report_-_April_2010_-_Volume_1_and_2.pdf).
4 ICF International (2010). Regional Climate Change Effects: Useful Information for Transportation Agencies. Prepared for the Federal Highway Administration. (http://www.fhwa.dot.gov/hep/climate/climate_effects/effects03.cfm)
5 Intergovernmental Panel on Climate Change (2007). IPCC Fourth Assessment Report: Climate Change 2007 – Synthesis Report. (http://www.ipcc.ch/publications_and_data/ar4/syr/en/mains1.html#1-1)
6 U.S. Global Change Research Program (2009). Global Climate Change Impacts in the United States: A State of Knowledge Report from the U.S. Global Change Research Program. (http://downloads.globalchange.gov/usimpacts/pdfs/climate-impacts-report.pdf)
Final Report Interagency Transportation, Land Use, and Climate Change Pilot Project 4
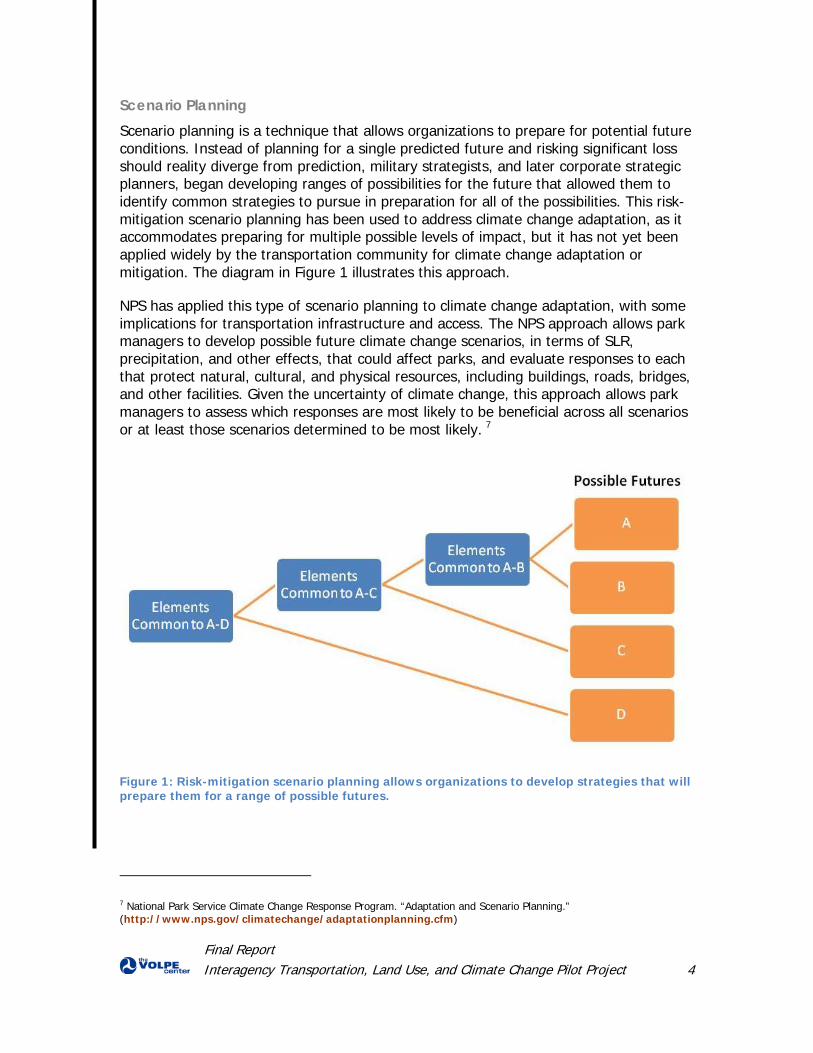
Scenario Planning Scenario planning is a technique that allows organizations to prepare for potential future conditions. Instead of planning for a single predicted future and risking significant loss should reality diverge from prediction, military strategists, and later corporate strategic planners, began developing ranges of possibilities for the future that allowed them to identify common strategies to pursue in preparation for all of the possibilities. This risk-mitigation scenario planning has been used to address climate change adaptation, as it accommodates preparing for multiple possible levels of impact, but it has not yet been applied widely by the transportation community for climate change adaptation or mitigation. The diagram in Figure 1 illustrates this approach.
NPS has applied this type of scenario planning to climate change adaptation, with some implications for transportation infrastructure and access. The NPS approach allows park managers to develop possible future climate change scenarios, in terms of SLR, precipitation, and other effects, that could affect parks, and evaluate responses to each that protect natural, cultural, and physical resources, including buildings, roads, bridges, and other facilities. Given the uncertainty of climate change, this approach allows park managers to assess which responses are most likely to be beneficial across all scenarios or at least those scenarios determined to be most likely. 7
Figure 1: Risk-mitigation scenario planning allows organizations to develop strategies that will prepare them for a range of possible futures.
7 National Park Service Climate Change Response Program. “Adaptation and Scenario Planning.” (http://www.nps.gov/climatechange/adaptationplanning.cfm)
Final Report Interagency Transportation, Land Use, and Climate Change Pilot Project 5
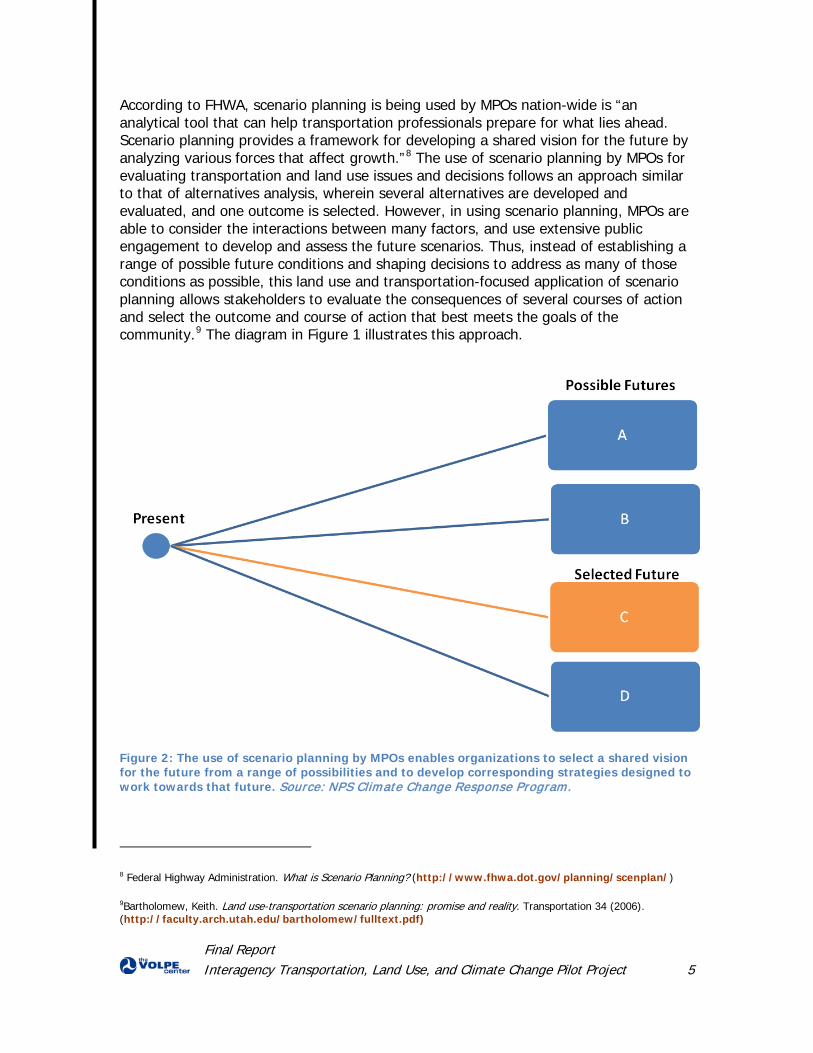
According to FHWA, scenario planning is being used by MPOs nation-wide is “an analytical tool that can help transportation professionals prepare for what lies ahead. Scenario planning provides a framework for developing a shared vision for the future by analyzing various forces that affect growth.”8 The use of scenario planning by MPOs for evaluating transportation and land use issues and decisions follows an approach similar to that of alternatives analysis, wherein several alternatives are developed and evaluated, and one outcome is selected. However, in using scenario planning, MPOs are able to consider the interactions between many factors, and use extensive public engagement to develop and assess the future scenarios. Thus, instead of establishing a range of possible future conditions and shaping decisions to address as many of those conditions as possible, this land use and transportation-focused application of scenario planning allows stakeholders to evaluate the consequences of several courses of action and select the outcome and course of action that best meets the goals of the community.9 The diagram in Figure 1 illustrates this approach.
Figure 2: The use of scenario planning by MPOs enables organizations to select a shared vision for the future from a range of possibilities and to develop corresponding strategies designed to work towards that future. Source: NPS Climate Change Response Program.
8 Federal Highway Administration. What is Scenario Planning? (http://www.fhwa.dot.gov/planning/scenplan/)
9Bartholomew, Keith. Land use-transportation scenario planning: promise and reality. Transportation 34 (2006). (http://faculty.arch.utah.edu/bartholomew/fulltext.pdf)
Final Report Interagency Transportation, Land Use, and Climate Change Pilot Project 6
The FHWA Scenario Planning Guidebook documents the application of scenario planning to transportation and land use planning. However, FHWA acknowledges that “next generation” scenario planning for transportation can also take into account a range of factors that have not traditionally been considered in the transportation system, including climate change.10
Application of Scenario Planning to the Pilot Project
As a next generation scenario planning effort, the Pilot Project was issue-focused on climate change and multiple agency involvement. Rather than developing broad transportation and land use goals or determining strategies for goals that had already been established through a planning process, the Pilot Project took as a starting point the goals of reducing GHG emissions and preparing for climate change impacts through agencies’ and other stakeholders’ transportation and land use decisions. In addition, the Pilot Project determined specific growth projections in population and employment for 2030 that were used as targets during the scenario planning process. The Pilot Project intended to use scenario planning as an educational tool to engage and inform a broad group of stakeholders around climate change issues through an integrated planning approach.
This project did not result in the development of a regional transportation plan (RTP), nor did it lead to decisions about development patterns at the neighborhood or parcel level, or prescribe zoning or development types. Instead, participants worked at a regional scale to indicate the desired locations for preservation, development, and improvements to transportation services based on GHG emissions and climate-change impact considerations. The impact of these regional determinations was then evaluated by important indicators, or measures of performance, which were selected based on the goals of the exercise, the data available, and the scenario planning tool being employed.
This process allowed for the testing of the relationships among transportation, development, GHG emissions, and climate change impacts, and raised awareness about the implications of transportation and land use decisions on climate change issues. The outcomes of the scenario planning process are anticipated to help inform future versions of the RTP as well as other state, local, and federal agency transportation and development plans for the region.
10 For more information on the FHWA scenario planning program, see the FHWA Scenario Planning Guidebook and website. (www.fhwa.dot.gov/Planning/scenplan/ )
Final Report Interagency Transportation, Land Use, and Climate Change Pilot Project 7
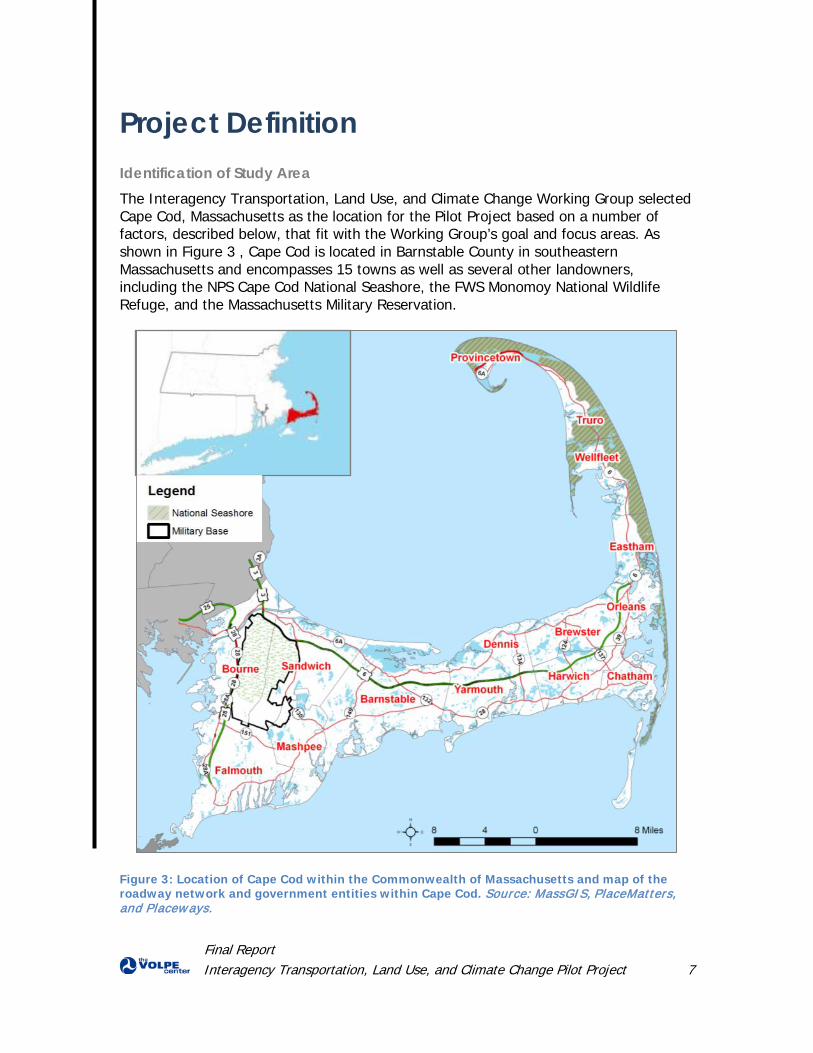
Project Definition Identification of Study Area The Interagency Transportation, Land Use, and Climate Change Working Group selected Cape Cod, Massachusetts as the location for the Pilot Project based on a number of factors, described below, that fit with the Working Group’s goal and focus areas. As shown in Figure 3 , Cape Cod is located in Barnstable County in southeastern Massachusetts and encompasses 15 towns as well as several other landowners, including the NPS Cape Cod National Seashore, the FWS Monomoy National Wildlife Refuge, and the Massachusetts Military Reservation.
Figure 3: Location of Cape Cod within the Commonwealth of Massachusetts and map of the roadway network and government entities within Cape Cod. Source: MassGIS, PlaceMatters, and Placeways.
Final Report Interagency Transportation, Land Use, and Climate Change Pilot Project 8
The Working Group selected Cape Cod for the Pilot Project due to the following factors: Gateway communities. The 15 towns serve as gateways to a variety of
recreational travel destinations and transportation hubs. The Cape Cod National Seashore experiences over four million visits annually11 while ferries servicing Nantucket and Martha’s Vineyard from points on Cape Cod carry two and half to three million passengers each year.12 Other recreational destinations on Cape Cod include the Monomoy National Wildlife Refuge and numerous beaches, resorts, campgrounds, and bike trails.
Presence of and special area of concern for several federal agencies. Many federal agencies are responsible for land and facilities on Cape Cod, including NPS, FWS, the U.S. Geological Survey, the U.S. Army Corps of Engineers, the U.S. Coast Guard, and the U.S. Air Force.
Existing partnerships. Cape Cod has a strong county government and has a history of regional initiatives and partnerships. For example, Cape Cod’s regional planning agency, the Cape Cod Commission, has a long-standing relationship with the Cape Cod National Seashore as well as the Cape Cod Regional Transit Authority and has collaborated with them on transportation planning efforts and projects. All three of these agencies are represented in the membership of the Cape Cod MPO.
Geographically-bounded transportation, land use, and economic development issues. Cape Cod is separated from mainland Massachusetts by a canal constructed in 1914.13 Two bridges, the Sagamore and the Bourne, connect vehicle traffic to Cape Cod, while rail, ferry, and air service also transport people and freight. Cape Cod and its transportation, land use, and economic development issues are, therefore, relatively self-contained. Common issues include drastic seasonal variation in population, congestion, and strain on water resources.
Coastal location and vulnerability to certain projected climate change effects, such as SLR. As a low-lying coastal peninsula with significant shoreline development and strictly limited access to the mainland, the threats of SLR and storms that are more frequent and severe carry significant potential to impact the human and natural environments of Cape Cod.
11 National Park Service Public Use Statistics Office. NPS Stats. (http://www.nature.nps.gov/stats/park.cfm)
12 Cape Cod Commission (2011). Cape Cod 2011 Regional Transportation Plan (March 2011 Draft). Prepared for the Cape Cod Metropolitan Planning Organization. (http://www.gocapecod.org/rtp/RTP2011docs/Ch2-5Water-MARCH_2011.pdf)
13 The Cape Cod Canal bisects the Towns of Bourne and Sandwich. Even though, as a result, parts of Bourne and Sandwich are located on the mainland, both are considered to be part of Cape Cod.
Final Report Interagency Transportation, Land Use, and Climate Change Pilot Project 9
Interest in sustainability. Cape Cod faces severe congestion issues due to its limited access, high percentage of population that commutes off-Cape for work, and high seasonal visitation. In response, Cape Cod partners have invested in efforts to create alternatives to personal vehicle access and traditional fuel dependency for both tourists and residents. In addition, Cape Cod National Seashore staff, working with partners, have demonstrated an interest in planning for long-term impacts of SLR on parking and other beach facilities.
Identification of Partners, Roles, Responsibilities, and Resources The primary participants in the Pilot Project consisted of the project team, Planning Group, Technical Committee, and scenario planning consultant.
Project Team
The Volpe Center served as the coordinator, facilitator, and manager of the tasks and partnerships that comprised the Pilot Project. The Volpe Center is a fee-for-service research agency under the U.S. Department of Transportation’s Research and Innovative Technology Administration. This role could be undertaken by other federal agencies or state or regional entities.
Sponsor Agencies
FHWA, NPS, and FWS contributed funding and staffing support to the Pilot Project in order to advance each agency’s climate change adaptation and mitigation interests and activities and integrate their planning processes with those of other stakeholders. Outcomes of interest included the development of a shared transportation and land use scenario that would affect agency assets in the region, and the establishment of a successful and replicable process that could be distributed within these agencies and to their partners. Representatives from the sponsor agencies participated in the Pilot Project as members of the Planning Group but also guided its intended outputs and outcomes by recommending and requesting specific deliverables.
Regional Agencies
The Pilot Project’s primary regional stakeholder agencies were the Cape Cod Regional Transit Authority, Cape Cod National Seashore, and the Cape Cod Commission, the region’s land use planning and regulatory agency, which coordinates transportation planning activities under the guidance of the MPO. These agencies were responsible for providing certain necessary data, identifying and coordinating outreach to town representatives, and refining the selected scenario. These agencies will also lead efforts to integrate and implement elements of the refined scenario on Cape Cod.
Final Report Interagency Transportation, Land Use, and Climate Change Pilot Project 10
Planning Group
The purpose of the Planning Group was to guide the development of the Pilot Project. The Planning Group comprised representatives from the sponsor agencies, regional agencies, and other federal agencies, including several from the Interagency Working Group as well as the Federal Emergency Management Agency (FEMA) and Department of Defense.
The primary functions of the Planning Group, which were outlined in a charter, were:
Provide general guidance and oversight of the pilot project. Incorporate Technical Committee input into decision-making. Guide development of interim products and results. Guide the development of and review interim products and deliverables. Provide input into the crafting of development scenarios for Cape Cod. Communicate and integrate results and findings into stakeholder plans. Provide feedback on pilot project process and areas for improvement.
The Planning Committee convened for monthly conference calls. The roster and charter for the Planning Group is included in Appendix A: Planning Group and Technical Committee Charters and Rosters.
Technical Committee
Based on Planning Group recommendations, individuals representing expertise in transportation, resource management, and coastal geology were asked to join a Technical Committee, which provided input and direction to the technical aspects of the project, including climate science and GHG reduction strategies. Although certain members of the Planning Group were also invited to join the Technical Committee, most Technical Committee members represented staff from state transportation, environment, and coastal management agencies, federal resource agencies, and scientific research institutions.
The primary functions of the Technical Committee, which were outlined in a charter, were:
Provide guidance to the Planning Group regarding all technical issues. Identify resources appropriate for literature review. Assist in data collection and provide information on ways to integrate GHG
emission mitigation measures and climate change effects and impacts into scenarios.
Provide input into the desired targets for scenarios with regard to climate change.
Provide input into the crafting of development scenarios. Communicate and integrate results and findings into stakeholder plans.
Final Report Interagency Transportation, Land Use, and Climate Change Pilot Project 11
Technical Committee members were convened on an as-needed basis. The roster and charter for the Technical Committee is included in Appendix A: Planning Group and Technical Committee Charters and Rosters.
During the Pilot Project, the Technical Committee was charged with two specific tasks:
1. The development of localized estimates for SLR and storm surge impacts.
2. The identification of transportation mitigation measures that could be applied to Cape Cod and quantification/estimation of the potential reduction in GHG emissions from the application of these measures to Cape Cod.
Section III presents a more in-depth discussion of these tasks.
Scenario Planning Consultant
To obtain the necessary expertise and software tools for use in the scenario planning process, the Planning Group developed a Request for Proposals (RFP), which the Volpe Center used to procure a scenario planning consultant. The final RFP is available in Appendix C: Request for Proposals. The RFP defined several roles for the consultant, including:
Introducing the Planning Group and Technical Committee to the scenario planning tool.
Developing a list of performance indicators for the scenario planning exercise. Developing baseline and preliminary scenarios. Preparing and facilitating a scenario planning stakeholder workshop. Finalizing and documenting the selected scenario.
After reviewing a number of proposals, the Volpe Center selected a consultant team composed of representatives from PlaceMatters, Inc., Placeways, LLC, the University of Colorado Denver Center for Sustainable Infrastructure Systems, and the Transportation Research Center. Through its selection of this consultant team, the Pilot Project elected to use the software tool CommunityViz for scenario development. The tool had technical and interactive functionality that met the objectives of the Pilot Project. CommunityViz is a decision-support extension for ArcGIS, a group of geographic information system (GIS) software products that builds upon the information organization and presentation capabilities of GIS. CommunityViz enables users of a GIS to establish alternative futures, analyze their effects, and communicate results to stakeholders. The consultant team used CommunityViz in developing the preliminary scenarios, conducting the workshop, developing the refined scenario, and conducting an evaluation of the scenarios using performance indicators that linked transportation, land use, and population density data with VMT and associated GHG emissions.
Final Report Interagency Transportation, Land Use, and Climate Change Pilot Project 12
Coordination with Existing Studies, Plans, and Processes Various federal, state, regional, and local agencies and organizations have conducted studies related specifically to planning and climate change on Cape Cod specifically over the past decade. During the preliminary phases of the Pilot Project, the project team reviewed existing plans and studies that were identified through a scan of literature and based on recommendations from the Planning Group and Technical Committee. The project team reviewed relevant studies pertaining to climate change impacts nationally, regionally, and on Cape Cod. Local available plans included a Regional Policy Plan, Regional Transportation Plan, and Hazard Mitigation Plan. The literature review directly informed the expert elicitation on sea-level rise and climate change impacts and the development of GHG reduction strategies. The results of the team’s literature review are available in Appendix B: Literature Review.
Identification of Outcomes As a pilot project, the anticipated outcomes and outputs evolved over the course of the project as new challenges and opportunities were identified. This report and its accompanying materials, including the Technical Scenario Report, contain descriptions of the process and the main outputs, including a literature review, results of an expert elicitation, GHG emission reduction strategies, and the scenario planning model and database.
The project team worked with the FHWA, NPS, and FWS to help them consider how they could best integrate the approach of the Pilot Project into planning efforts nationally and in other regions. At the local and regional level, the project team worked with the Cape Cod National Seashore and Cape Cod Commission to incorporate the Pilot Project’s specific outcomes into action plans to inform future planning efforts and project proposals.
An action plan identifies steps that can be taken to incorporate project outcomes or recommendations into existing and future plans and activities of an agency to ensure that those outcomes or recommendations are implemented. For example, the project team worked with the Cape Cod Commission to document the data, assumptions, and processes used to develop the Refined scenario and to detail opportunities to implement and build upon it at the regional and local levels. The action plan will ensure that the Refined scenario remains a viable long-term vision for the region by incorporating it into future land use, transportation, sustainability, and climate change plans. The Volpe Center also provided input for the Cape Cod National Seashore’s Climate Friendly Parks Action Plan, which was developed concurrently with the Pilot Project and drew upon the GHG emission reduction strategies identified for the Pilot Project.
Final Report Interagency Transportation, Land Use, and Climate Change Pilot Project 13
Observations and Recommendations Initiating the Project
Observation 1: The Working Group selected Cape Cod to be the focus region for the Pilot Project. Therefore, the process was proposed to the region’s regional planning agency, transit agency, and towns; those groups did not initiate the process. Although the federal role was vital in piloting the process followed on Cape Cod, federal involvement influenced the direction of the Pilot Project such that it was not solely based on regional needs and goals. For instance, local and regional stakeholders identified freshwater supply and wastewater treatment as more urgent constraints to growth than climate change adaptation and mitigation, though the latter were priorities of the project’s federal sponsor agencies.
Recommendation: Ensure that the process originates with a local or regional agency with jurisdiction and interest in land use and transportation, such as an MPO, RPO, city, or federal land management agency, such as a national park. Within those agencies, a variety of staff should be involved – transportation planners and engineers, land use planners, environmental and natural resource specialists, and GIS analysts – so as to provide a comprehensive perspective on the relevant issues. The origination of the project at the local or regional level should not preclude other federal agencies from participating, but organizations at the regional or local levels can directly assess how best to pursue a climate change-focused scenario planning effort, by engaging in a number of preparatory activities, including:
Organizing and establishing buy-in from local stakeholders. Evaluating data availability and quality (discussed in Section III). Determining the appropriate scope and outputs based on the status of
existing planning efforts.
Observation 2: Cape Cod is subject to legislation that facilitates effective regional planning. In planning, there are states with legislation that requires comprehensive plans that are consistent horizontally and vertically and there are those without such legislation. Horizontal consistency requires that components within a single comprehensive plan be consistent (e.g., the land use plan provides zoning to accommodate housing types needed to meet the affordable housing plan’s goals). Vertical consistency requires that regional and local plans, state plans, zoning regulations, and permitting be consistent. Massachusetts does not have state legislation that requires vertical consistency but there are regional exceptions, such as the towns within Barnstable County, which are required to have plans consistent with the Cape Cod Commission’s regional comprehensive plan.14 The Pilot Project benefited from
14 Cape Cod Commission Act, Section 9. (http://www.capecodcommission.org/CCCact.htm)
Final Report Interagency Transportation, Land Use, and Climate Change Pilot Project 14
working in a region that required local plans to be consistent with regional plans and transportation plans to be consistent with land use plans.
Recommendation: Understand the legislation governing planning for a region and its implications for enforcement of any regional planning decisions. Being in a “non-plan” state does not mean that this approach will be unsuccessful but it may require additional coordination and agreements among entities within the region to enforce regional decisions.
Establishing Project Goals
Observation 3: Since a transportation-focused work group initiated the Pilot Project and had pre-defined goals, other locally-important issues were not intended to be a primary focus. However, over the course of the project, stakeholders identified additional topics, such as water resources, as priority focus areas. Although water resources were considered indirectly as performance indicators in the scenario development process, they could have been used to constrain development and to better inform the process.
Recommendation: Consider how stakeholders will be involved in defining the project goals, identify issues beyond transportation and land use at the initiation of the project, and determine if or how such issues can be addressed within the scope of the scenario planning process. While it may be difficult to treat certain issues as secondary to the core goals of an effort, especially those with significant impacts on the placement of development, a determination at the beginning of the process as to how to treat these related issues will help the project maintain its focus later on. If included in the effort, such factors can be assigned a performance indicator – as in the case of the Pilot Project – and be used as an additional evaluation criterion.
Defining Roles and Responsibilities
Observation 4: One of the most important aspects of the Pilot Project was the interagency nature of the project. Partners at all levels of government, including federal, state, regional, and local agencies, were intrinsically involved throughout the course of the project. The partners played a key role in developing the final output, and will ultimately be responsible for implementing actions identified. Keeping the various partners engaged was important, as each contributed essential data, tools, and resources.
Recommendation: Develop a diverse stakeholder group that can enhance the scenario planning activities. Implementation of a scenario, particularly one based on transportation, land use, and climate change, will ultimately fall to a variety of stakeholders so their participation in guiding the overall effort and scenario development can help ensure their commitment to the final scenario. In the case of the Pilot Project, the presence of several large federal and state land holdings
Final Report Interagency Transportation, Land Use, and Climate Change Pilot Project 15
on Cape Cod necessitated the involvement of their respective management agencies. Just as a climate change-focused scenario planning effort should originate with an MPO, RPO, city, county, or federal land unit, an agency at that level is also in an ideal position to serve as the central coordinating partner. It may be appropriate for a third party to maintain responsibility for managing the day-to-day aspects of the project, but the planning agency for the focus region will be in the best position to effectively conduct outreach and coordination and ensure that the myriad of partners stay engaged throughout the process.
Coordination with Existing Planning Processes
Observation 5: Regional, local, and agency-specific policy, transportation, and hazard mitigation plans are updated on a regular cycle, typically every five years. Plans for Cape Cod that had been recently updated were able to inform the Pilot Project, but the Pilot Project’s results will not directly be incorporated into these plans until their next update.
Recommendation: Consider the update cycle of relevant plans in determining how best to integrate the scenario planning effort.
Defining Desired Outputs of the Scenario Planning Process
Observation 6: Scenario planning can lead to a range of outputs, including the development of goals, the design of one preferred scenario, the provision of insights that inform the planning process, or the development of strategies, policies, and action items in pursuit of existing goals. In the case of the Pilot Project, building awareness around pressing climate change and transportation issues and identifying potential actions for investigating these issues in greater detail were just as important outputs as the final scenario. In fact, the final scenario will serve as a tool and resource for subsequent studies by stakeholder agencies on Cape Cod.
Recommendation: Assess what the desired outputs are at the beginning of the scenario planning initiative. If conducting scenario planning specifically for climate change mitigation and adaptation, the output may not be a comprehensive plan, but rather a set of inputs, strategies, and goals to incorporate into a long range transportation plan (LRTP), comprehensive plan, or regional policy plan (RPP). Scenario planning may also provide an opportunity to test and understand the implications of new ideas to incorporate into an LRTP or RPP update.
Final Report Interagency Transportation, Land Use, and Climate Change Pilot Project 16
Data Requirements Scenario planning is a data-intensive process and, accordingly, the Pilot Project depended on robust data for each of its major elements: creating the baseline of existing conditions, developing the performance indicators for evaluation and projecting future conditions. Data were collected from state and other GIS databases, federal resources, the Cape Cod Commission, and towns. As the project progressed, some critical data sets that didn’t currently exist had to be created from scratch.
This section provides a summary of the data needed to develop performance indicators ̶ specifically, measures of mitigation and adaptation ̶ as well as baseline land use and transportation data required for the development of the scenarios. Additional details on data collection, limitations, and development can be found in the various appendices referenced and the Technical Scenario Report.
Selection of Performance Indicators Performance indicators, or measures of performance, allow participants to compare the effects or consequences of different land use and transportation decisions. Selection of the performance indicators was an important early consideration for the Pilot Project. The Pilot Project began with identifying performance indicators that matched the goals of the project and incorporating these into the RFP for the scenario planning consultant. These five key performance indicators were:
Greenhouse gas (GHG) emissions. Transport energy use. Congestion and vehicle miles traveled. Cost to implement the scenario. Preservation of natural/existing ecosystems.
Other indicators of interest expressed early in the process included impacts on habitat; energy, air pollution, water, and waste reduction targets; and sustainability, livability, physical activity, and economic development measures. Due to the Pilot Project’s focus on climate change adaptation, percentage of development vulnerable to climate change effects also became an important indicator once the expert elicitation process, described below, resulted in a data layer that could support this measure.
Although cost to implement the scenario was proposed as a potential indicator, it was ultimately not included in the analysis due to the lack of sufficient data and the inability to model specific GHG emission strategies. Additionally, because the Pilot Project focused on the process by which development and transportation investment decisions are made at the regional level, the scale was not conducive to developing cost estimates for specific capital or operational projects.
Final Report Interagency Transportation, Land Use, and Climate Change Pilot Project 17
As part of its response to the Volpe Center’s RFP, the consultant team provided the Planning Group with a list of over 60 possible indicators (see Appendix D: List of Potential Performance Indicators) for use in the project’s scenario planning model, including indicators that matched the RFP request. Based on data availability and input on importance, or priority ranking, from the Planning and Technical Committees, the initial list was edited down to the following eleven performance measures:
Vehicle miles traveled (VMT): Regional percentage change in peak VMT.
GHG emissions:
Percentage change in GHG emissions.
Impact of sea-level rise (SLR): Percentage of new population in vulnerable areas, which include all areas
within the Federal Emergency Management Administration (FEMA) Flood Insurance Rate Map risk areas as well as areas identified by the expert elicitation.
Preservation of natural/existing ecosystems: Percentage of new population in critical habitat areas. Percentage land area developed (from previously undeveloped or rural)15. Percentage of new population in undeveloped or rural lands. Percentage of new population in other high priority conservation areas16.
Impact on other areas:
Percentage of new population in historic preservation areas. Percentage of new population in water resource and wellhead protection
areas and percentage of new population in such areas with less than three dwelling units per acre.
Accessibility indicators: Percentage of new population served by transit. Percentage of new employees served by transit.
Details on the methodology for the GHG mitigation and SLR indicators are included below as they are the focus of the Pilot Project. The methodology for how the additional indicators were developed, measured, and impacted by the scenario development
15 Developed land is defined as density exceeding one dwelling unit per 10 acres; undeveloped is defined as density equal or less than one dwelling unit per 10 acres.
16 Areas include those designated for open space or conservation by the state, town, or Cape Cod Commission.
Final Report Interagency Transportation, Land Use, and Climate Change Pilot Project 18
process is included in the Technical Scenario Report. Section V discusses the performance of the resulting scenarios based on these indicators.
Sea-Level Rise and Other Climate Change Impacts The project team determined that no regional SLR impact estimates existed for Cape Cod. Several computer-based models exist to conduct regional-level estimates but lack the specificity at the local level that was desired and require investment of significant time and resources. Thus, the Pilot Project team decided to organize and facilitate a consensus-/group-based expert elicitation (EE) with local and regional coastal experts at Woods Hole, Massachusetts in July 2010. The coastal experts included staff from the following agencies:
National Park Service Massachusetts Department of Transportation (MassDOT) Woods Hole Oceanographic Institution Provincetown Center for Coastal Studies Waquoit Bay National Estuarine Research Reserve US Geological Service (USGS) US Army Corps of Engineers
The project team coordinated with the USGS to identify several GIS layers in advance for reference during the EE, including orthophotography, landform and geologic maps, elevation data, and FEMA flood areas. The EE also referenced the literature review that had been conducted (see Appendix B: Literature Review), in particular the USGS coastal vulnerability assessment of Cape Cod.
The initial goal for the EE was to develop SLR impact projections for specific areas of Cape Cod for three time horizons (20, 50, and 100 years), and, if feasible, for three scenarios (low, medium, and high SLR estimates). However, during the EE, the experts acknowledged that this level of detail, and focusing on inundation only, was not possible. The limiting factors included the dynamic conditions influencing SLR at local levels, a lack of robust data sources, and the feasibility of the requisite analysis and modeling within the scope and scale of the Pilot Project.
Due to these limitations, the EE workshop focused on identifying vulnerable areas, or areas of concern, for SLR and other climate-related impacts on Cape Cod. Experts identified specific areas that they considered vulnerable based on the following criteria:
Elevation Exposure to storm surge Erosion SLR impacts
Final Report Interagency Transportation, Land Use, and Climate Change Pilot Project 19
The EE workshop resulted in an indexed map of the vulnerable areas with a key to specific explanations of why certain areas were marked as potentially vulnerable. The map and key are provided in Appendix E: Vulnerable Area Map and Key.
Transportation Greenhouse Gas Mitigation Strategies The Technical Committee developed a preliminary list of mitigation strategies based on a literature review, in particular the report Moving Cooler: An Analysis of Transportation Strategies for Reducing Greenhouse Gas Emissions.17 That study, commissioned by a group of federal agencies and a diverse set of interest groups, assesses the potential effectiveness of transportation strategies to reduce GHG emissions through reduced travel activity or improved vehicle and system operations.
Drawing upon Moving Cooler, the Technical Committee created an initial list of strategies and then tailored specific strategies to address the regional context. Through a series of conference calls, the group revised the initial list of strategies, adding ones that might be pursued and deleting those that were deemed infeasible for Cape Cod. For example, while increasing the gas tax may be an effective mitigation strategy, regional and local agencies in Massachusetts do not have the authority to amend the gas tax rate. The group focused only on strategies that could be implemented at the local level; policies that require federal or state action were not included.
The final list of potential GHG emission reduction strategies, which can be found in Appendix F: Potential GHG Reduction Strategies, is organized into seven categories:
1. Pricing strategies. These strategies raise the costs associated with the use of some components of the transportation system relative to others.
2. Land use and smart growth strategies. These strategies create more transportation-efficient land use patterns (i.e., fewer and shorter vehicle trips).
3. Non-motorized transportation strategies. These strategies encourage greater levels of walking and bicycling as alternatives to driving.
4. Public transportation strategies. These strategies encourage greater use of, and aim to expand the availability of, public transportation.
5. Regional ride-sharing, car-sharing, and commuting strategies. These strategies expand services and provide incentives to travelers to choose transportation options other than driving alone.
6. Operational and intelligent transportation system (ITS) strategies. These strategies improve the operation of the transportation system to make better use of existing capacity.
17 Cambridge Systematics, Inc. (2009) Moving Cooler: An Analysis of Transportation Strategies for Reducing Greenhouse Gas Emissions.
Final Report Interagency Transportation, Land Use, and Climate Change Pilot Project 20
7. Vehicle efficiency and alternative fuel strategies. These strategies improve the fuel efficiency of vehicles and increase the use of alternative fuels.
The project team discussed the possibility of developing regionally specific estimates of the GHG reduction potential of the mitigation measures presented in Moving Cooler. However, the group eventually elected not to pursue this option due to limitations in the availability of necessary data, time, and resources. Instead, stakeholders discussed and voted on the most important and feasible strategies at the Pilot Project’s November 2010 workshop, described in more detail in Section IV. The results of this poll are presented in Appendix G: Priority Transportation Strategies for Cape Cod.
Baseline Data for Scenario Development The model used to develop the scenarios required baseline transportation and growth data.
Transportation Data
Transportation data required for the Pilot Project consisted of the following existing baseline data, which were used to estimate how changes in specific factors would result in decreased VMT:
Regional VMT. Mode choice or share, to calculate GHG emissions from VMT.
Typically, approaches to estimating regional VMT are done using four-step regional transportation models that consist of the following steps:
1. Trip generation – estimation of the number of trips that occur daily within the study area.
2. Trip distribution – development of assumptions about trip origins and destinations.
3. Modal choice or split – estimation of the percentage of trips made by different modes (e.g., personal vehicle, mass transit, bicycle, walking).
4. Trip assignment – assignment of the trips calculated in steps 1-3 to specific transportation routes.
Both the Cape Cod Commission and MassDOT have four-step models that cover Cape Cod and that were used to generate baseline data for the Pilot Project.
However, these regional models may not capture local effects of changes in the urban design and planning of neighborhoods that can also decrease travel demand. Consequently, traditional models may be augmented by other approaches, such as the
Final Report Interagency Transportation, Land Use, and Climate Change Pilot Project 21
5D estimation method,18 which was used for the Pilot Project. This method enables the estimation and comparison of local effects on VMT due to five factors: design, density, diversity, destination accessibility, and distance to transit. These factors can be measured in a number of ways based on available data. In the case of the Pilot Project, design was measured as street network density (road miles per square mile), density as household density (units per acre), diversity as ratio of population to jobs, destination accessibility as distance of neighborhoods to other regional destinations, and distance to transit as number of people served by transit service areas.
The 5D method consisted of the following steps:
1. Measure the factor in the first scenario.
2. Measure the factor in the second scenario.
3. Calculate the percent change.
4. Multiply by a specific variable elasticity to calculate related decreases in VMT.
Generally, elasticity is a ratio used to measure the change of one variable due to another variable. The 5D method measures the responsiveness of changes in VMT to one of the 5D variables. So, for every percent increase in any one D, there is a related decrease in VMT. The elasticity assumptions used were taken from a meta-analysis completed by Reid Ewing and Robert Cervero.19 Cape Cod-specific assumptions were not available at the time of the study, but these elasticities are easily adjustable within the scenario planning tool (CommunityViz) analysis.
For mode choice, the transportation model available included the following mode categories:
1. Passenger Vehicles
2. Light Duty Vehicles
3. Medium Trucks
4. Heavy Trucks
Bicycle, pedestrian, and transit were not included. Due to the lack of available regional mode share data, no assumptions were made for these missing modes and no change in mode share was assumed for any of the scenarios. However, VMT reductions due to people shifting from driving to biking or walking for short trips were implicitly captured
18 Ewing, R., and R. Cervero. 2010. Travel and the built environment. Journal of the American Planning Association 76(3): 265-294.
19 2010
Final Report Interagency Transportation, Land Use, and Climate Change Pilot Project 22
in the 5D analysis. Assumptions about transit mode shift can be revisited in the future. The Technical Scenario Report contains more information on this topic.
Growth Assumptions
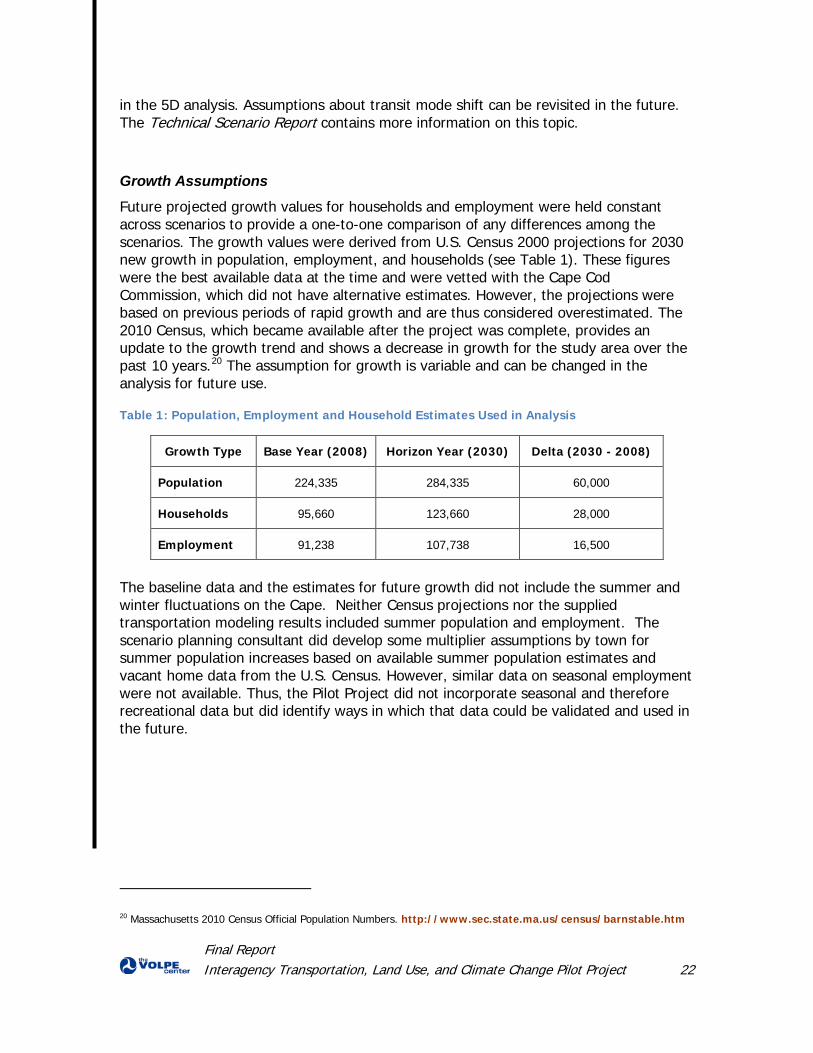
Future projected growth values for households and employment were held constant across scenarios to provide a one-to-one comparison of any differences among the scenarios. The growth values were derived from U.S. Census 2000 projections for 2030 new growth in population, employment, and households (see Table 1). These figures were the best available data at the time and were vetted with the Cape Cod Commission, which did not have alternative estimates. However, the projections were based on previous periods of rapid growth and are thus considered overestimated. The 2010 Census, which became available after the project was complete, provides an update to the growth trend and shows a decrease in growth for the study area over the past 10 years.20 The assumption for growth is variable and can be changed in the analysis for future use.
Table 1: Population, Employment and Household Estimates Used in Analysis
Growth Type Base Year (2008) Horizon Year (2030) Delta (2030 - 2008)
Population 224,335 284,335 60,000
Households 95,660 123,660 28,000
Employment 91,238 107,738 16,500
The baseline data and the estimates for future growth did not include the summer and winter fluctuations on the Cape. Neither Census projections nor the supplied transportation modeling results included summer population and employment. The scenario planning consultant did develop some multiplier assumptions by town for summer population increases based on available summer population estimates and vacant home data from the U.S. Census. However, similar data on seasonal employment were not available. Thus, the Pilot Project did not incorporate seasonal and therefore recreational data but did identify ways in which that data could be validated and used in the future.
20 Massachusetts 2010 Census Official Population Numbers. http://www.sec.state.ma.us/census/barnstable.htm
Final Report Interagency Transportation, Land Use, and Climate Change Pilot Project 23
Observations and Recommendations Assessing Data Requirements
Observation 7: Scenario planning is an inherently data-intensive process and can require data beyond what some regions already have. Introducing a climate change mitigation and adaptation focus to the Pilot Project added a layer of complexity and uncertainty to the data collection. As a pilot project, it was initially unclear what data would be necessary to complete the preliminary scenario development and indicator analysis as well as what data would be available and feasible to access or develop within the time and resource constraints of the project.
Recommendation: Develop a clear understanding of what minimum baseline data are needed and assess what data are available in advance of selecting a scenario planning consultant or holding a workshop. The assessment should consider any pending data releases or updates, such as Census or GIS. In addition, plan for an adequate amount of time to conduct the data collection (a period of four to six months is recommended). Data collection activities should involve checking with all key stakeholders to collect relevant/important data and identifying alternatives or proxies for data that is not readily available. If certain types of data are lacking and suitable proxies are unavailable, acknowledge this fact early and assess alternative strategies.
Assessing Sea-Level Rise Impacts
Observation 8: Models that anticipate the effects of SLR on coastal areas are generally not location-specific and do not take into account coastal dynamics at a highly localized scale. The Pilot Project was able to account for the specific factors affecting Cape Cod by creating a locally-defined vulnerability map through an expert elicitation, but the resulting map did not provide projections on the magnitude of the impact. The Technical Committee and coastal and climate scientists involved in the expert elicitation ultimately determined that producing specific estimates of SLR for sub-regions of Cape Cod was not feasible given currently available data and that collecting the necessary data was beyond the scope and budget of the Pilot Project.
Recommendation: Evaluate whether existing climate change impact data and models are sufficient to determine how to integrate climate change adaptation into a scenario planning exercise. Numerous models are available and are used nationally for predicting the impact of SLR by simulating the dominant processes and forecasting long-term effects. If existing tools are not sufficient, assess the amount of time and level of resources available to develop local or regional models.21 Greater levels of time and resources should increase the precision and
21 Additional tools and resources for evaluating climate change effects, including the Coastal Inundation Mapping Guidebook and Technical Considerations for Use of Geospatial Data in Sea Level Change Mapping and Assessment, are available through the NOAA Coastal Services Center Digital Coast website (http://www.csc.noaa.gov/digitalcoast/).
Final Report Interagency Transportation, Land Use, and Climate Change Pilot Project 24
accuracy of estimates, though the current state of climate science will ultimately limit both.
Climate change adaptation may also be incorporated into a scenario planning exercise using the risk-mitigation scenario planning approach described in Section II. Participants may be presented with several possible SLR and climate change effect scenarios, ranging from mild to severe, and then be asked to identify strategies that enable them to successfully adapt to each.
Developing GHG Mitigation Measures
Observation 9: Not all GHG mitigation measures will be feasible – politically, financially, or otherwise. Furthermore, local agencies in the project area may not have the authority or ability to implement certain measures. Strategies to reduce GHG emissions can focus on VMT reduction, fuel efficiency, vehicle technology, or operational efficiency. With the exceptions of VMT reduction, technology of local government fleet vehicles, development of alternative fuel stations, and some implementation of ITS, these are primarily the purview of the state and federal governments. VMT reduction is the primary mechanism through which local and regional land use and transportation investment decisions can have an impact. The impact of density, land use mix, and transit access on VMT can be modeled and assessed easily in scenario planning. Actions that aim to change behavior through pricing, incentives and other means are more difficult to model, and need additional time and resources to integrate into the scenario planning process.
Recommendation: Decide whether the scenario planning exercise will explore all potential GHG mitigation measures or only those that are determined to be realistic at a given, selected scale (e.g., the local level). Feasibility may be determined prior to a scenario planning workshop or during it. In the case of the Pilot Project, prior to the workshop, the Technical Committee eliminated measures it believed were infeasible, while discussion and voting during the workshop further narrowed the list. Involvement from state or federal partners in discussions of GHG reduction strategies may be valuable, particularly when considering strategies outside the control of a local or regional agency.
Observation 10: General estimates for the emission reduction potential of mitigation measures exist. The report Moving Cooler, for instance, presents national and some regional estimates for a variety of GHG emissions mitigation measures. However, such estimates are not transferable to the unique characteristics of Cape Cod. Development of Cape Cod-specific estimates would have required significant investment of time and resources and the availability of detailed data sets. Therefore, GHG mitigation measures other than VMT reduction were not incorporated into the scenario development process.
Recommendation: Identify feasible options for integrating GHG mitigation into the scenario planning process. If seeking specific estimates of GHG reduction potential, allow sufficient time and resources to develop these. Generally, additional research into applying GHG reduction estimates for specific measures
Final Report Interagency Transportation, Land Use, and Climate Change Pilot Project 25
at a regional or sub-regional level is needed for them to be fully integrated into a scenario planning exercise. If developing specific estimates is infeasible, a facilitated discussion to identify opportunities and barriers to implementing specific measures may suffice.
Developing Baseline Data
Observation 11: The Pilot Project originally intended to focus on a place characterized by the presence of both gateway communities and seasonal recreational travel. The peak summer population of Cape Cod is believed to be triple the year-round population. Accounting for a more precise interpretation of this trend into the Pilot Project’s refined scenario would have had a drastic impact on VMT and GHG emissions. However, seasonal fluctuations in Cape Cod’s population and travel patterns were not sufficiently captured in the scenario planning process due to lack of data and the difficulty in quantifying recreational travel demand.
Recommendation: Any tourism destination or gateway community region considering GHG mitigation should assess visitation data and determine what may be possible to model. A location that experiences as significant an increase in population during peak travel times as Cape Cod would benefit greatly from developing and evaluating a scenario that precisely and thoroughly explores the effects of seasonality on indicator performance.
Observation 12: The transportation model used for the Pilot Project did not have data on bicycle, walking, or transit mode share. The 5D analysis used was able to account for some mode shift to bicycle and walking, but proposed changes to transit service frequency did not result in any changes in assumptions about mode split within the scenario planning model.
Recommendation: Make assumptions in the scenario planning model about how increases in transit service frequency would result in mode shift. On Cape Cod, it is likely that the full impact of increased transit access was not captured in the indicator performance of the refined scenario. For regions interested in pursuing increased transit ridership as a means to reduce VMT and associated GHG emissions, capturing the full effects of this shift in a preferred scenario could build support for expanded transit service.
Observation 13: During the scenario planning workshop, participants expressed concern over the accuracy of baseline data, particularly with the amount of growth in jobs and housing that they were being asked to allocate. Participants suggested that the growth figures being used were too high, as the projections were based on previous periods of rapid growth. Additionally, in some instances, participants’ questions regarding the presentation of the information on potential areas vulnerable to SLR diverted their concentration from evaluating the tradeoffs between growth placement, climate change adaptation and mitigation, resource protection, and identifying opportunities for the future.
Final Report Interagency Transportation, Land Use, and Climate Change Pilot Project 26
Recommendation: One value of scenario planning is that it relies on relative comparisons between scenarios. Thus, even if the absolute numbers are not accurate or need to be changed, the relative results can still be used to compare different actions. Furthermore, scenario planning may raise awareness among participants about limitations and gaps in available data.
Another key strength of the scenario planning process is the ability of participants to consider the implications of their actions for a specific set of indicators. When participants in a scenario planning exercise focus too intently on the accuracy of the data – as occurred to some degree in the Pilot Project – it can compromise their decision-making process. Validating projection figures with stakeholders prior to the scenario planning should prevent this from happening and ensure that the exercise is realistic. Addressing these issues will save time, avoid confusion, and make participants more informed and effective in their actions.
Final Report Interagency Transportation, Land Use, and Climate Change Pilot Project 27
Scenario Development This section details what land use and transportation scenarios were developed and the process by which they were developed. The Pilot Project resulted in the development of 10 scenarios, consisting of the following:
1-5. Five preliminary scenarios developed by scenario planning consultant for demonstrative purposes, consisting of:
1. Trend 2. Dispersed – Standard Transportation 3. Dispersed – Enhanced Transportation 4. Targeted – Standard Transportation 5. Targeted – Enhanced Transportation
6-9. Four scenarios developed by stakeholder participants at the November 2010
workshop
10. One refined scenario developed by stakeholders after the workshop
All the scenarios involved the placement of population and employment based on the growth assumptions described in the previous section. Placement involved the use of digital “chips,” or map point features attributed and symbolized with various sizes to represent quantities of households and employment (see Figure 4). In workshop exercises and in developing the refined scenario, participants placed the chips themselves, while in the preliminary scenarios, the scenario planning consultant placed chips in a mostly automated fashion with a subsequent review by the project team. Any reference to chips in this report regards the digital representations of households and employment as shown in Figure 4. For all scenarios, placement was not permitted within the Cape Cod National Seashore boundaries, reflecting the assumption that such land will not be available for development.
In addition to population and employment placement, the workshop and refined scenario involved the placement of new transit stops and the ability to change the frequency, or headways, of the service.
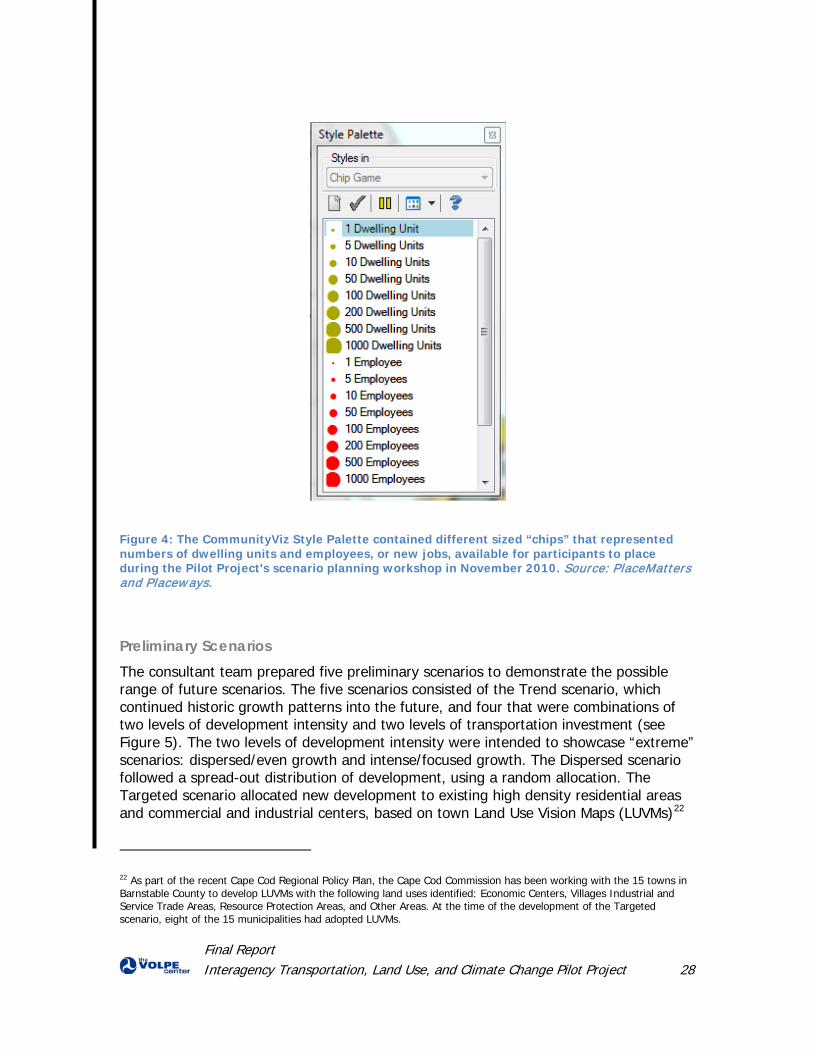
Final Report Interagency Transportation, Land Use, and Climate Change Pilot Project 28
Figure 4: The CommunityViz Style Palette contained different sized “chips” that represented numbers of dwelling units and employees, or new jobs, available for participants to place during the Pilot Project's scenario planning workshop in November 2010. Source: PlaceMatters and Placeways.
Preliminary Scenarios The consultant team prepared five preliminary scenarios to demonstrate the possible range of future scenarios. The five scenarios consisted of the Trend scenario, which continued historic growth patterns into the future, and four that were combinations of two levels of development intensity and two levels of transportation investment (see Figure 5). The two levels of development intensity were intended to showcase “extreme” scenarios: dispersed/even growth and intense/focused growth. The Dispersed scenario followed a spread-out distribution of development, using a random allocation. The Targeted scenario allocated new development to existing high density residential areas and commercial and industrial centers, based on town Land Use Vision Maps (LUVMs)22
22 As part of the recent Cape Cod Regional Policy Plan, the Cape Cod Commission has been working with the 15 towns in Barnstable County to develop LUVMs with the following land uses identified: Economic Centers, Villages Industrial and Service Trade Areas, Resource Protection Areas, and Other Areas. At the time of the development of the Targeted scenario, eight of the 15 municipalities had adopted LUVMs.
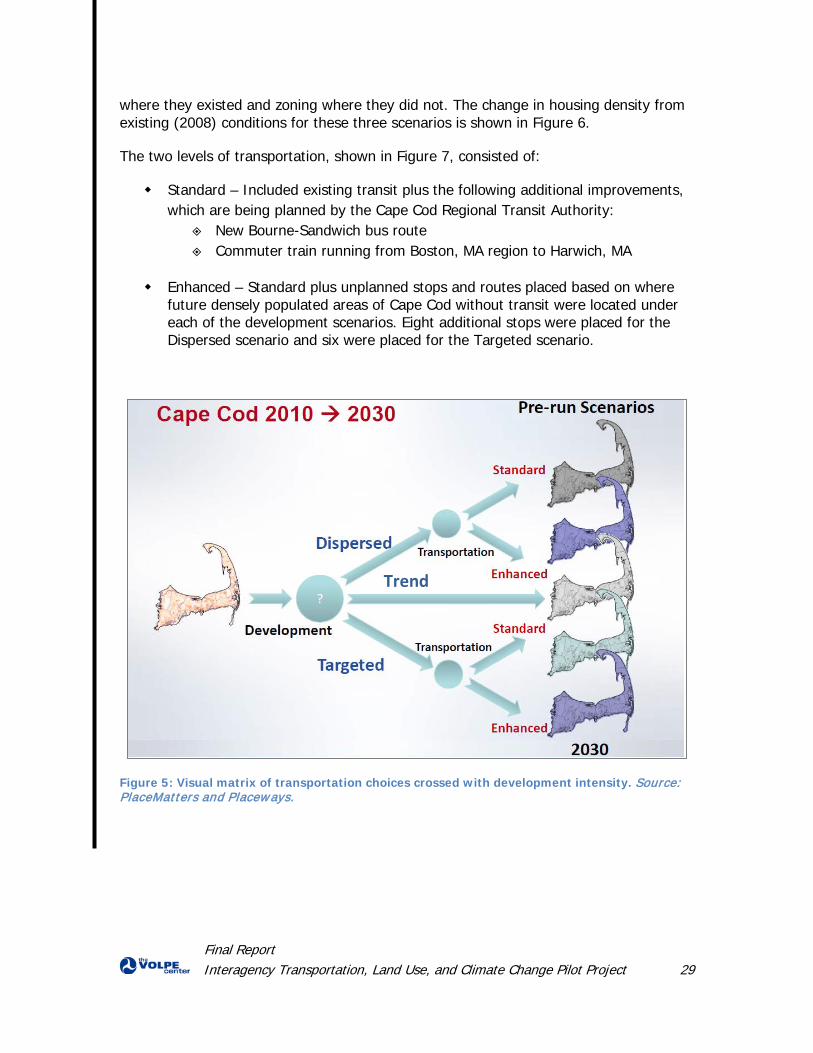
Final Report Interagency Transportation, Land Use, and Climate Change Pilot Project 29
where they existed and zoning where they did not. The change in housing density from existing (2008) conditions for these three scenarios is shown in Figure 6.
The two levels of transportation, shown in Figure 7, consisted of:
Standard – Included existing transit plus the following additional improvements, which are being planned by the Cape Cod Regional Transit Authority:
New Bourne-Sandwich bus route Commuter train running from Boston, MA region to Harwich, MA
Enhanced – Standard plus unplanned stops and routes placed based on where future densely populated areas of Cape Cod without transit were located under each of the development scenarios. Eight additional stops were placed for the Dispersed scenario and six were placed for the Targeted scenario.
Figure 5: Visual matrix of transportation choices crossed with development intensity. Source: PlaceMatters and Placeways.
Trend
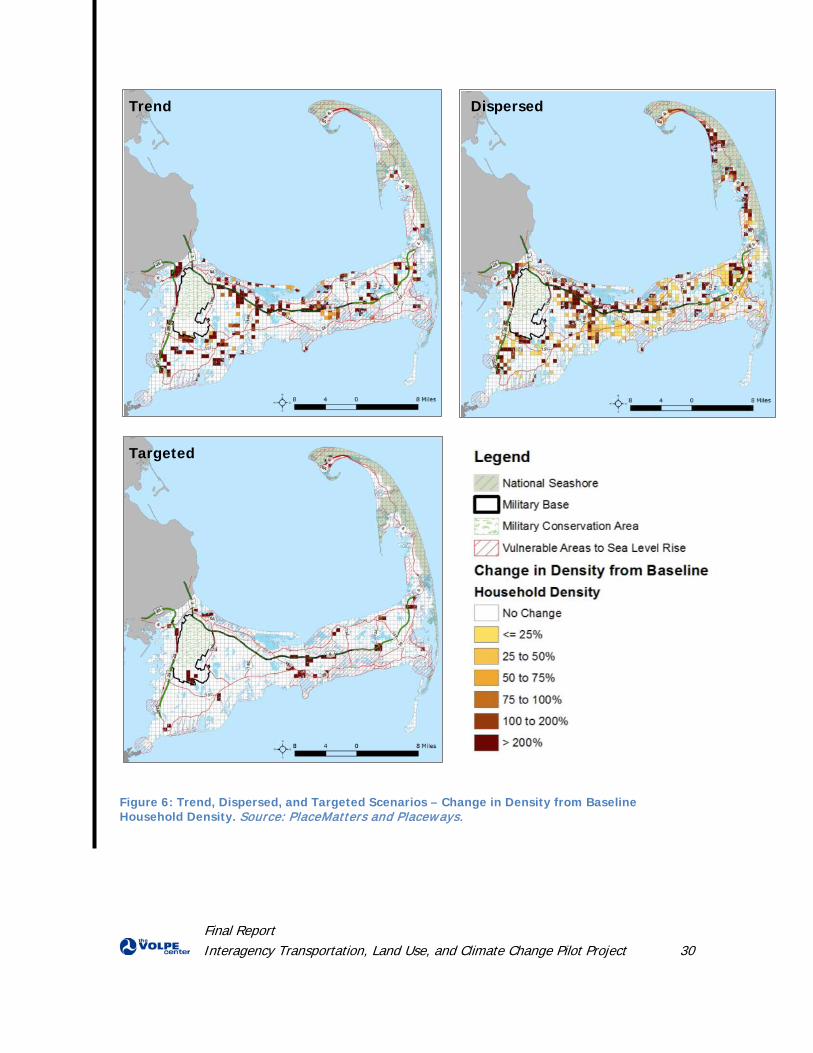
Final Report Interagency Transportation, Land Use, and Climate Change Pilot Project 30
Trend
Figure 6: Trend, Dispersed, and Targeted Scenarios – Change in Density from Baseline Household Density. Source: PlaceMatters and Placeways.
Targeted
Dispersed
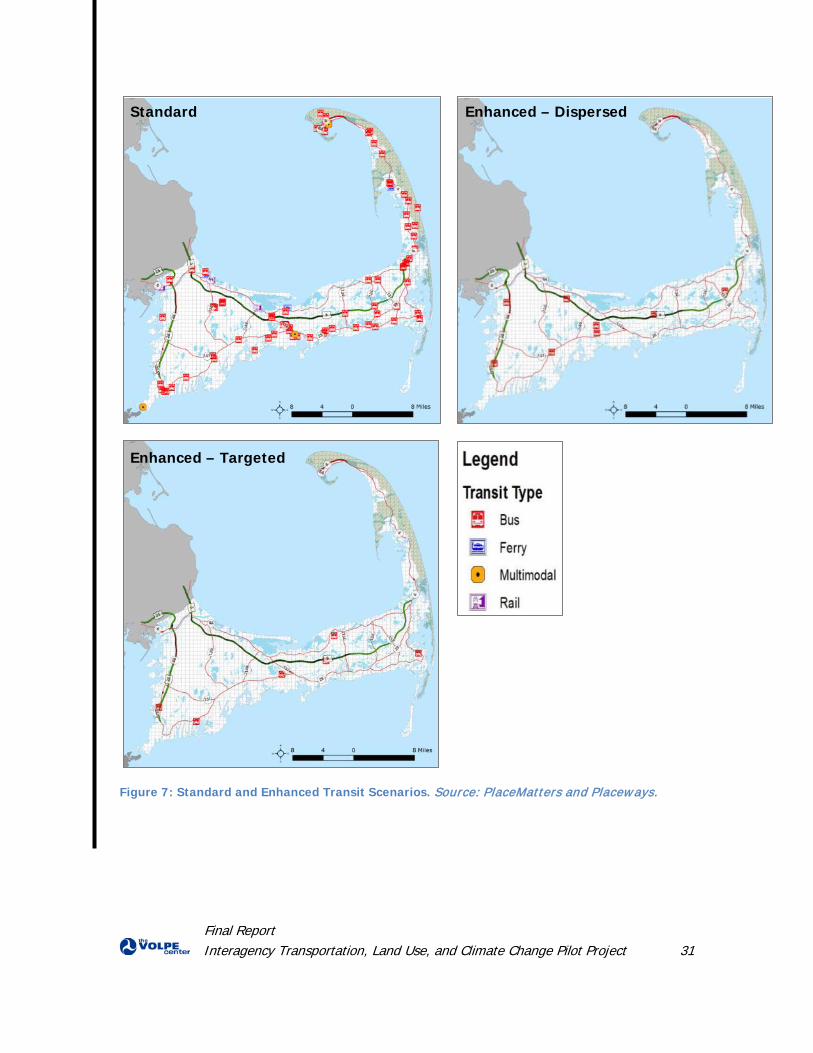
Final Report Interagency Transportation, Land Use, and Climate Change Pilot Project 31
Figure 7: Standard and Enhanced Transit Scenarios. Source: PlaceMatters and Placeways.
Standard Enhanced – Dispersed
Enhanced – Targeted
Final Report Interagency Transportation, Land Use, and Climate Change Pilot Project 32
Workshop Scenarios The one-and-a-half day workshop was held on November 15 and 16, 2010. The purposes of the workshop were to facilitate discussion on the Pilot Project’s focus among the multiple agencies, introduce the concept of scenario planning and the software tool, and develop future transportation and land use scenarios that took into account change considerations that could then be consolidated into one proposed vision.
Representation and Involvement
The primary audience for the scenario planning workshops consisted of town and regional administrative and planning staff. As these individuals will ultimately be responsible for integrating the outcomes of the scenario planning pilot into long range planning efforts, their involvement in the workshops was vital to the success of the project’s process. The project team worked closely with the Cape Cod Commission to identify administrators, assistant administrators, and planners from each of Cape Cod’s fifteen towns, and to invite them to participate in the workshops. Other local participants included staff from the MPOs on Martha’s Vineyard and Nantucket, and a representative from the Massachusetts Military Reservation, a military base that occupies a large area of land in the Upper Cape sub-region.
Members of both the Planning Group and Technical Committee were also invited to attend the workshop, though only those members whose work related directly to Cape Cod were asked to contribute to scenario development (for instance, Cape Cod National Seashore planning staff). Federal and state agency representatives from both groups were asked to attend as observers and resources in case questions arose related to federal or state support.
Final representation at the workshop was as follows:
16 Local Government Staff – Towns of Barnstable, Brewster, Chatham, Falmouth, Harwich, Mashpee, Sandwich, and Truro; Martha’s Vineyard Commission and Nantucket Planning Office.
Nine Regional Government Staff – Cape Cod Commission, Cape Cod Regional Transit Authority.
Two State Government Staff – Massachusetts National Guard, Massachusetts Office of Energy and Environmental Affairs.
16 Federal Government Staff – Environmental Protection Agency (Region 1), Federal Emergency Management Agency (Region 1), Federal Highway Administration (Headquarters, Federal Lands Highway, and MA Division Office), Federal Transit Administration (Region 1), Fish and Wildlife Service (Headquarters and Region 5), National Oceanic and Atmospheric Administration (North Atlantic Region), National Park Service (Headquarters, Northeast Region, and Cape Cod National Seashore).
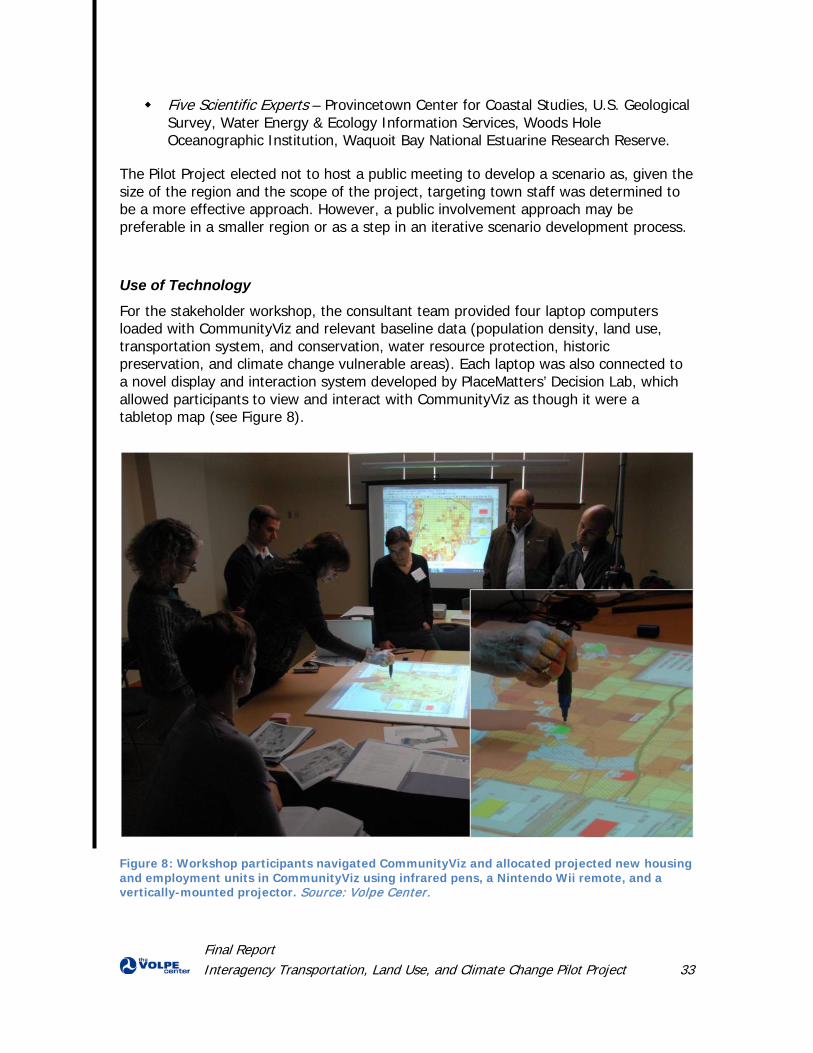
Final Report Interagency Transportation, Land Use, and Climate Change Pilot Project 33
Five Scientific Experts – Provincetown Center for Coastal Studies, U.S. Geological Survey, Water Energy & Ecology Information Services, Woods Hole Oceanographic Institution, Waquoit Bay National Estuarine Research Reserve.
The Pilot Project elected not to host a public meeting to develop a scenario as, given the size of the region and the scope of the project, targeting town staff was determined to be a more effective approach. However, a public involvement approach may be preferable in a smaller region or as a step in an iterative scenario development process.
Use of Technology
For the stakeholder workshop, the consultant team provided four laptop computers loaded with CommunityViz and relevant baseline data (population density, land use, transportation system, and conservation, water resource protection, historic preservation, and climate change vulnerable areas). Each laptop was also connected to a novel display and interaction system developed by PlaceMatters’ Decision Lab, which allowed participants to view and interact with CommunityViz as though it were a tabletop map (see Figure 8).
Figure 8: Workshop participants navigated CommunityViz and allocated projected new housing and employment units in CommunityViz using infrared pens, a Nintendo Wii remote, and a vertically-mounted projector. Source: Volpe Center.
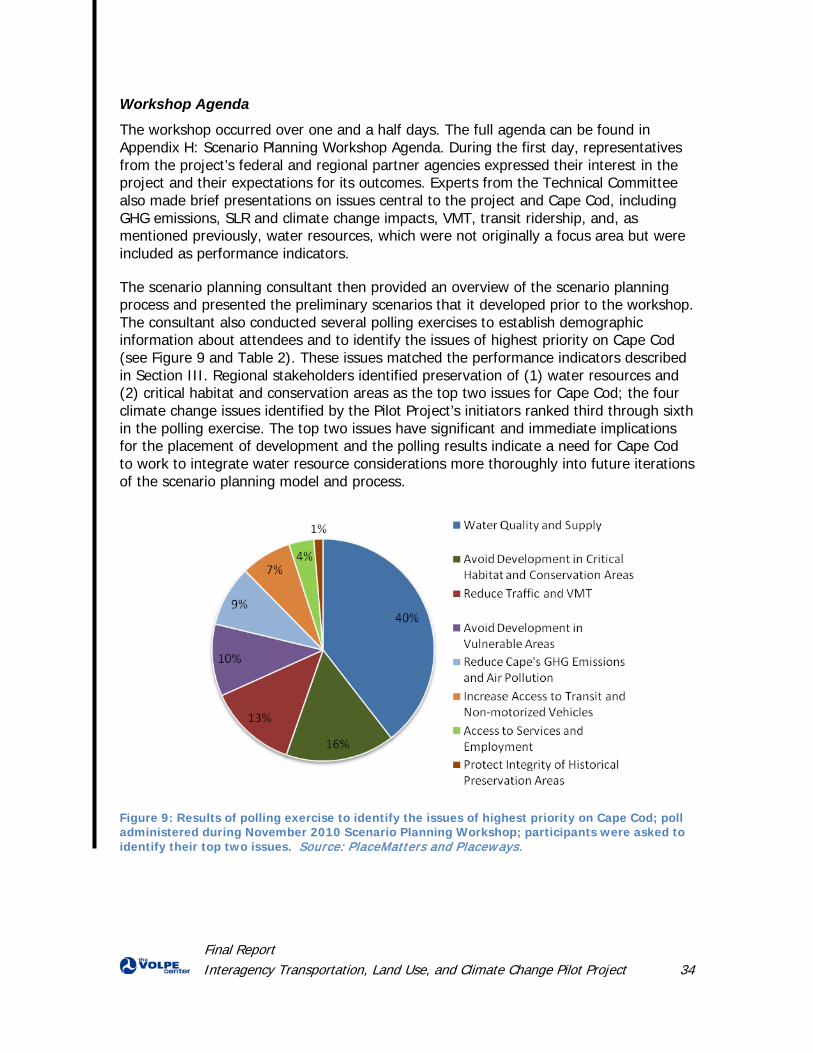
Final Report Interagency Transportation, Land Use, and Climate Change Pilot Project 34
Workshop Agenda
The workshop occurred over one and a half days. The full agenda can be found in Appendix H: Scenario Planning Workshop Agenda. During the first day, representatives from the project’s federal and regional partner agencies expressed their interest in the project and their expectations for its outcomes. Experts from the Technical Committee also made brief presentations on issues central to the project and Cape Cod, including GHG emissions, SLR and climate change impacts, VMT, transit ridership, and, as mentioned previously, water resources, which were not originally a focus area but were included as performance indicators.
The scenario planning consultant then provided an overview of the scenario planning process and presented the preliminary scenarios that it developed prior to the workshop. The consultant also conducted several polling exercises to establish demographic information about attendees and to identify the issues of highest priority on Cape Cod (see Figure 9 and Table 2). These issues matched the performance indicators described in Section III. Regional stakeholders identified preservation of (1) water resources and (2) critical habitat and conservation areas as the top two issues for Cape Cod; the four climate change issues identified by the Pilot Project’s initiators ranked third through sixth in the polling exercise. The top two issues have significant and immediate implications for the placement of development and the polling results indicate a need for Cape Cod to work to integrate water resource considerations more thoroughly into future iterations of the scenario planning model and process.
Figure 9: Results of polling exercise to identify the issues of highest priority on Cape Cod; poll administered during November 2010 Scenario Planning Workshop; participants were asked to identify their top two issues. Source: PlaceMatters and Placeways.
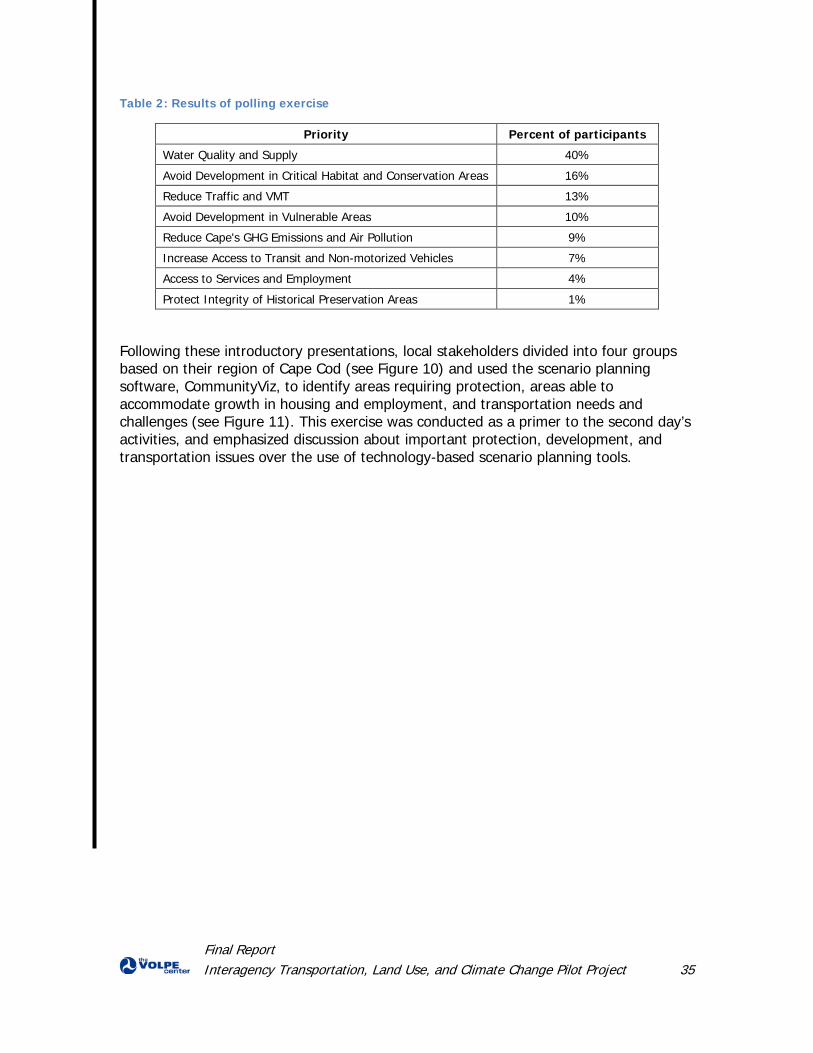
Final Report Interagency Transportation, Land Use, and Climate Change Pilot Project 35
Table 2: Results of polling exercise
Priority Percent of participants
Water Quality and Supply 40%
Avoid Development in Critical Habitat and Conservation Areas 16%
Reduce Traffic and VMT 13%
Avoid Development in Vulnerable Areas 10%
Reduce Cape's GHG Emissions and Air Pollution 9%
Increase Access to Transit and Non-motorized Vehicles 7%
Access to Services and Employment 4%
Protect Integrity of Historical Preservation Areas 1% Following these introductory presentations, local stakeholders divided into four groups based on their region of Cape Cod (see Figure 10) and used the scenario planning software, CommunityViz, to identify areas requiring protection, areas able to accommodate growth in housing and employment, and transportation needs and challenges (see Figure 11). This exercise was conducted as a primer to the second day’s activities, and emphasized discussion about important protection, development, and transportation issues over the use of technology-based scenario planning tools.
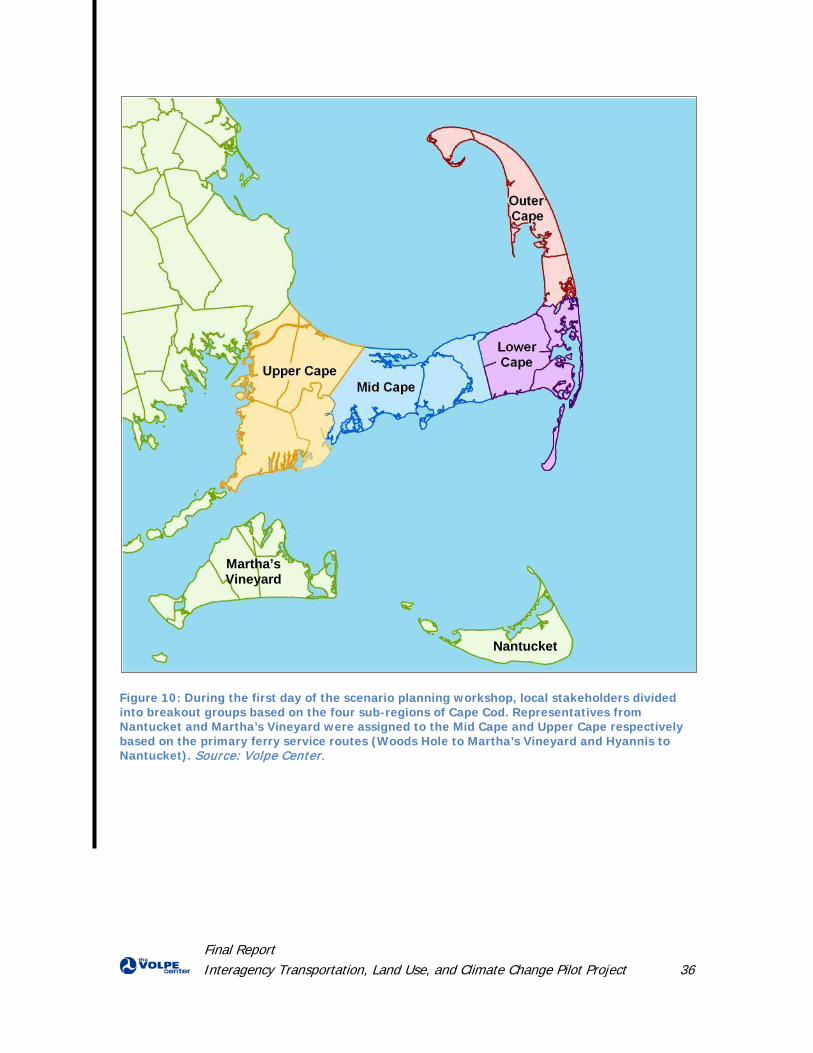
Final Report Interagency Transportation, Land Use, and Climate Change Pilot Project 36
Figure 10: During the first day of the scenario planning workshop, local stakeholders divided into breakout groups based on the four sub-regions of Cape Cod. Representatives from Nantucket and Martha’s Vineyard were assigned to the Mid Cape and Upper Cape respectively based on the primary ferry service routes (Woods Hole to Martha’s Vineyard and Hyannis to Nantucket). Source: Volpe Center.
Martha’s Vineyard
Nantucket
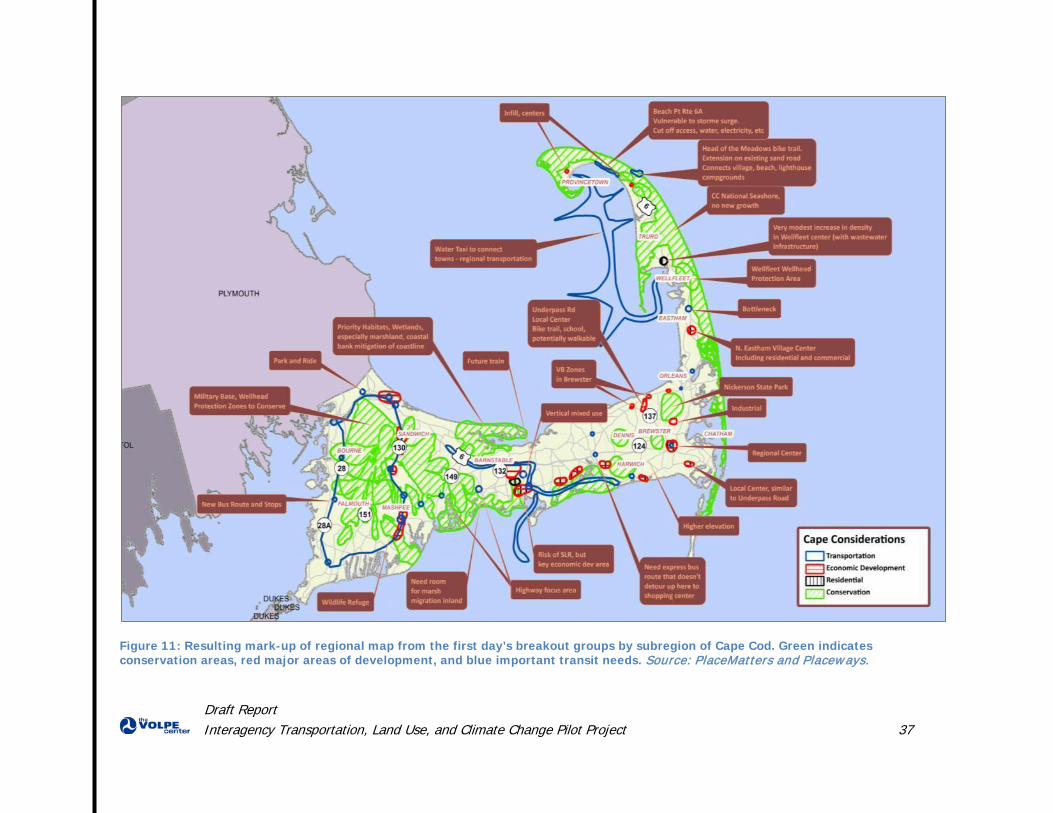
Draft Report Interagency Transportation, Land Use, and Climate Change Pilot Project 37
Figure 11: Resulting mark-up of regional map from the first day’s breakout groups by subregion of Cape Cod. Green indicates conservation areas, red major areas of development, and blue important transit needs. Source: PlaceMatters and Placeways.
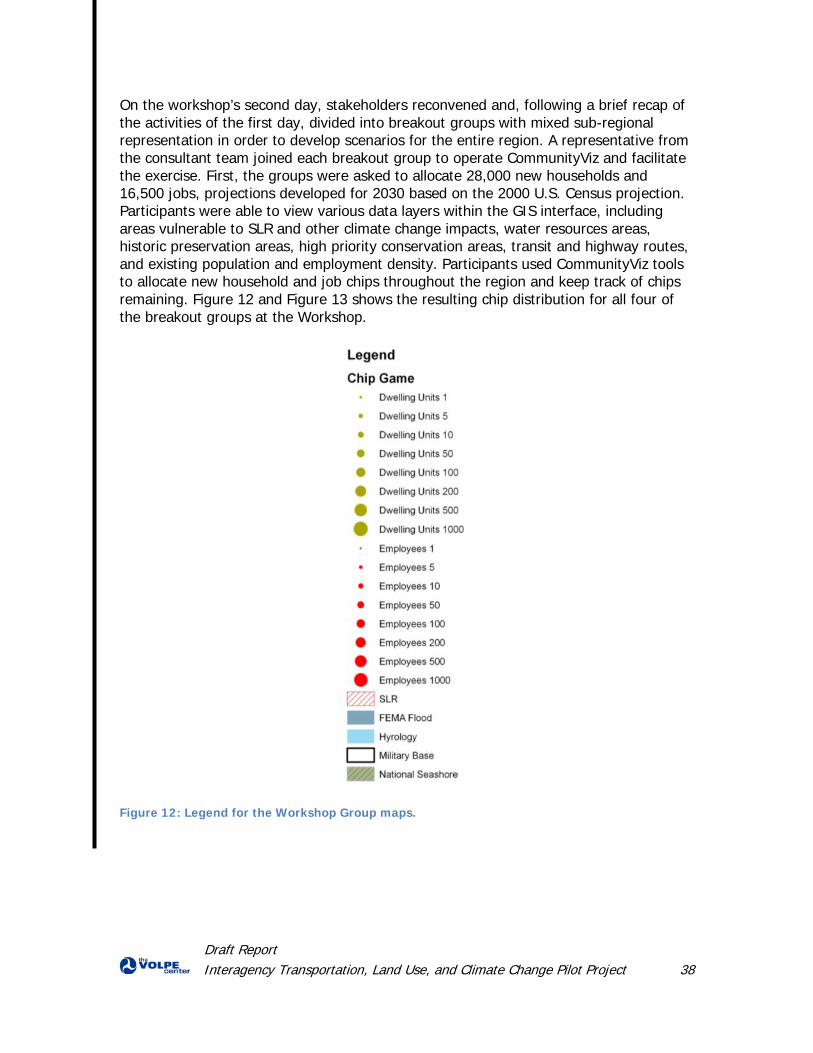
Draft Report Interagency Transportation, Land Use, and Climate Change Pilot Project 38
On the workshop’s second day, stakeholders reconvened and, following a brief recap of the activities of the first day, divided into breakout groups with mixed sub-regional representation in order to develop scenarios for the entire region. A representative from the consultant team joined each breakout group to operate CommunityViz and facilitate the exercise. First, the groups were asked to allocate 28,000 new households and 16,500 jobs, projections developed for 2030 based on the 2000 U.S. Census projection. Participants were able to view various data layers within the GIS interface, including areas vulnerable to SLR and other climate change impacts, water resources areas, historic preservation areas, high priority conservation areas, transit and highway routes, and existing population and employment density. Participants used CommunityViz tools to allocate new household and job chips throughout the region and keep track of chips remaining. Figure 12 and Figure 13 shows the resulting chip distribution for all four of the breakout groups at the Workshop.
Figure 12: Legend for the Workshop Group maps.
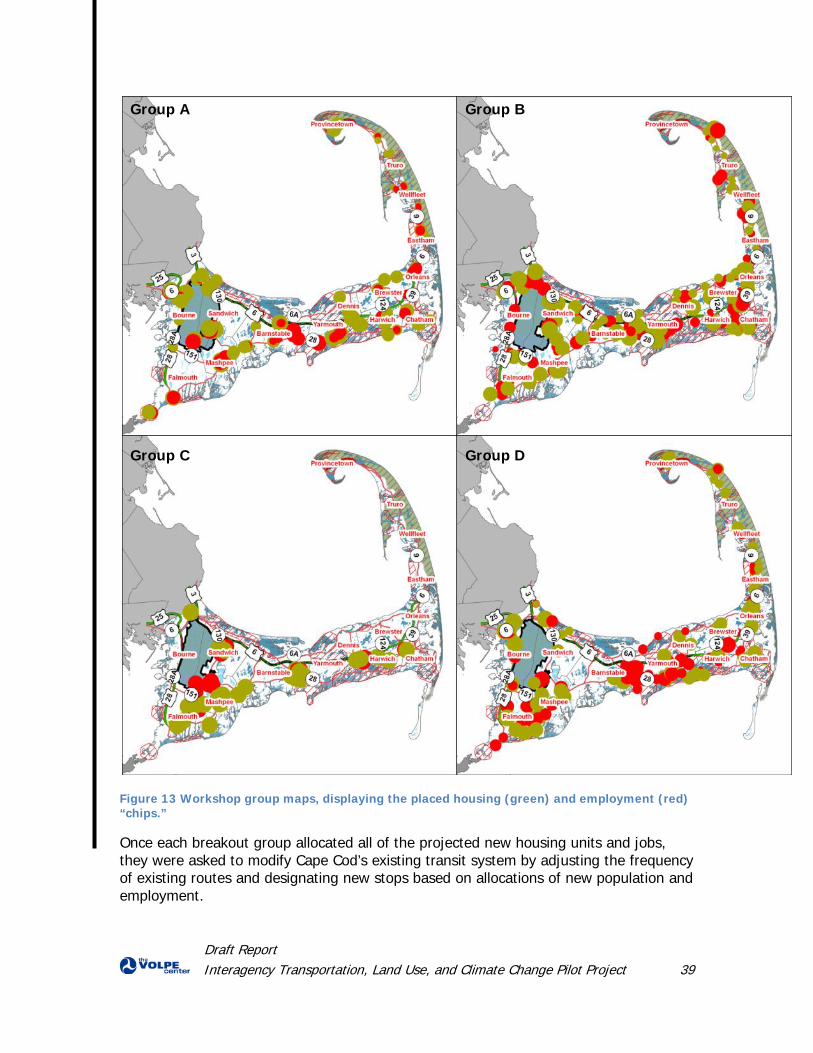
Draft Report Interagency Transportation, Land Use, and Climate Change Pilot Project 39
Figure 13 Workshop group maps, displaying the placed housing (green) and employment (red) “chips.”
Once each breakout group allocated all of the projected new housing units and jobs, they were asked to modify Cape Cod’s existing transit system by adjusting the frequency of existing routes and designating new stops based on allocations of new population and employment.
Group A Group B
Group C Group D
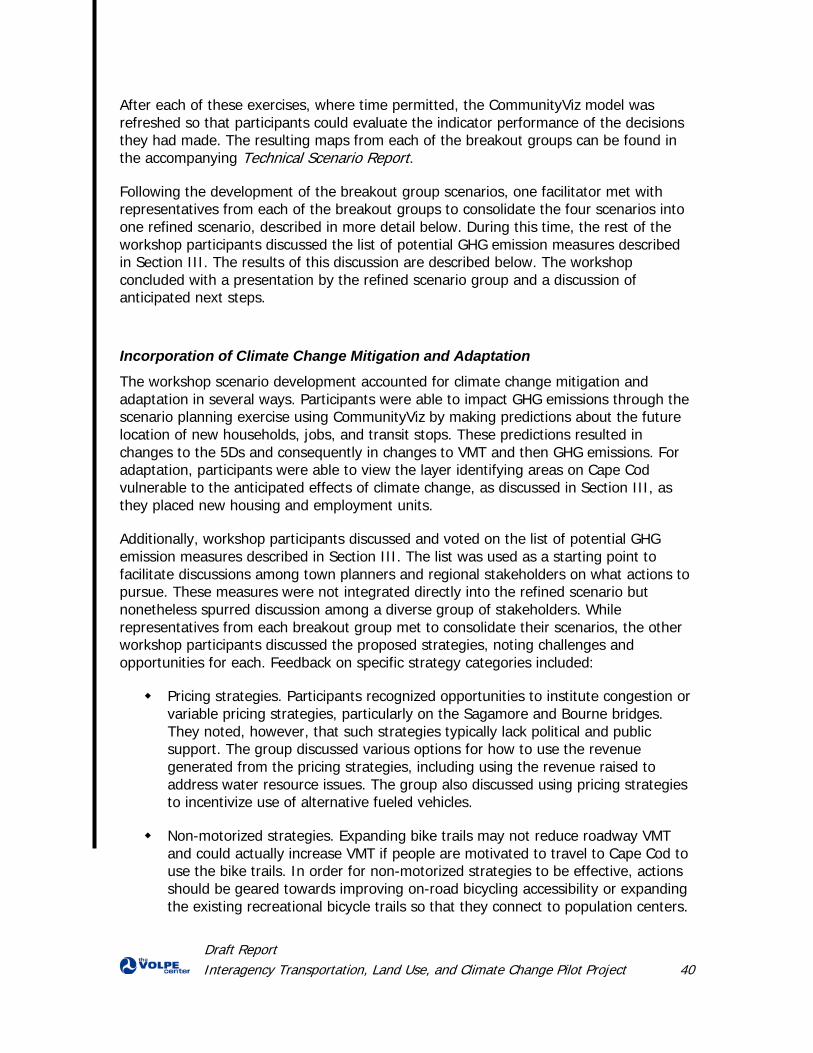
Draft Report Interagency Transportation, Land Use, and Climate Change Pilot Project 40
After each of these exercises, where time permitted, the CommunityViz model was refreshed so that participants could evaluate the indicator performance of the decisions they had made. The resulting maps from each of the breakout groups can be found in the accompanying Technical Scenario Report.
Following the development of the breakout group scenarios, one facilitator met with representatives from each of the breakout groups to consolidate the four scenarios into one refined scenario, described in more detail below. During this time, the rest of the workshop participants discussed the list of potential GHG emission measures described in Section III. The results of this discussion are described below. The workshop concluded with a presentation by the refined scenario group and a discussion of anticipated next steps.
Incorporation of Climate Change Mitigation and Adaptation
The workshop scenario development accounted for climate change mitigation and adaptation in several ways. Participants were able to impact GHG emissions through the scenario planning exercise using CommunityViz by making predictions about the future location of new households, jobs, and transit stops. These predictions resulted in changes to the 5Ds and consequently in changes to VMT and then GHG emissions. For adaptation, participants were able to view the layer identifying areas on Cape Cod vulnerable to the anticipated effects of climate change, as discussed in Section III, as they placed new housing and employment units.
Additionally, workshop participants discussed and voted on the list of potential GHG emission measures described in Section III. The list was used as a starting point to facilitate discussions among town planners and regional stakeholders on what actions to pursue. These measures were not integrated directly into the refined scenario but nonetheless spurred discussion among a diverse group of stakeholders. While representatives from each breakout group met to consolidate their scenarios, the other workshop participants discussed the proposed strategies, noting challenges and opportunities for each. Feedback on specific strategy categories included:
Pricing strategies. Participants recognized opportunities to institute congestion or variable pricing strategies, particularly on the Sagamore and Bourne bridges. They noted, however, that such strategies typically lack political and public support. The group discussed various options for how to use the revenue generated from the pricing strategies, including using the revenue raised to address water resource issues. The group also discussed using pricing strategies to incentivize use of alternative fueled vehicles.
Non-motorized strategies. Expanding bike trails may not reduce roadway VMT and could actually increase VMT if people are motivated to travel to Cape Cod to use the bike trails. In order for non-motorized strategies to be effective, actions should be geared towards improving on-road bicycling accessibility or expanding the existing recreational bicycle trails so that they connect to population centers.
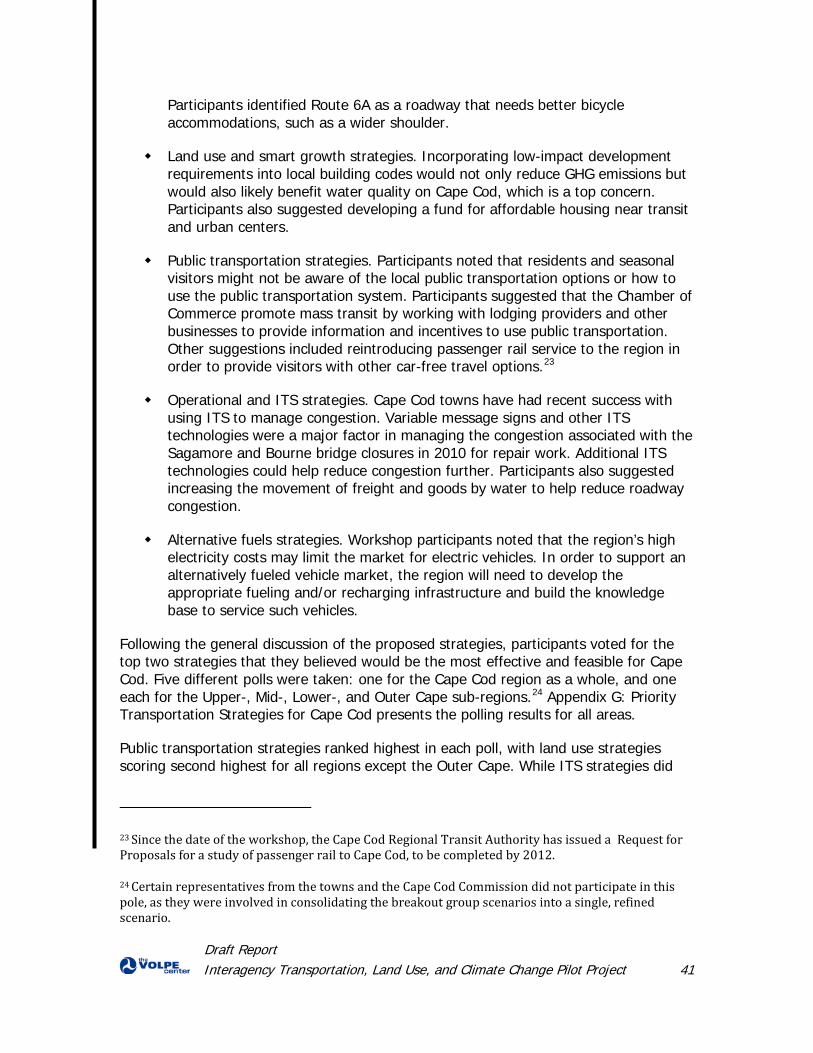
Draft Report Interagency Transportation, Land Use, and Climate Change Pilot Project 41
Participants identified Route 6A as a roadway that needs better bicycle accommodations, such as a wider shoulder.
Land use and smart growth strategies. Incorporating low-impact development requirements into local building codes would not only reduce GHG emissions but would also likely benefit water quality on Cape Cod, which is a top concern. Participants also suggested developing a fund for affordable housing near transit and urban centers.
Public transportation strategies. Participants noted that residents and seasonal visitors might not be aware of the local public transportation options or how to use the public transportation system. Participants suggested that the Chamber of Commerce promote mass transit by working with lodging providers and other businesses to provide information and incentives to use public transportation. Other suggestions included reintroducing passenger rail service to the region in order to provide visitors with other car-free travel options.23
Operational and ITS strategies. Cape Cod towns have had recent success with using ITS to manage congestion. Variable message signs and other ITS technologies were a major factor in managing the congestion associated with the Sagamore and Bourne bridge closures in 2010 for repair work. Additional ITS technologies could help reduce congestion further. Participants also suggested increasing the movement of freight and goods by water to help reduce roadway congestion.
Alternative fuels strategies. Workshop participants noted that the region’s high electricity costs may limit the market for electric vehicles. In order to support an alternatively fueled vehicle market, the region will need to develop the appropriate fueling and/or recharging infrastructure and build the knowledge base to service such vehicles.
Following the general discussion of the proposed strategies, participants voted for the top two strategies that they believed would be the most effective and feasible for Cape Cod. Five different polls were taken: one for the Cape Cod region as a whole, and one each for the Upper-, Mid-, Lower-, and Outer Cape sub-regions.24 Appendix G: Priority Transportation Strategies for Cape Cod presents the polling results for all areas.
Public transportation strategies ranked highest in each poll, with land use strategies scoring second highest for all regions except the Outer Cape. While ITS strategies did
23 Since the date of the workshop, the Cape Cod Regional Transit Authority has issued a Request for Proposals for a study of passenger rail to Cape Cod, to be completed by 2012.
24 Certain representatives from the towns and the Cape Cod Commission did not participate in this pole, as they were involved in consolidating the breakout group scenarios into a single, refined scenario.
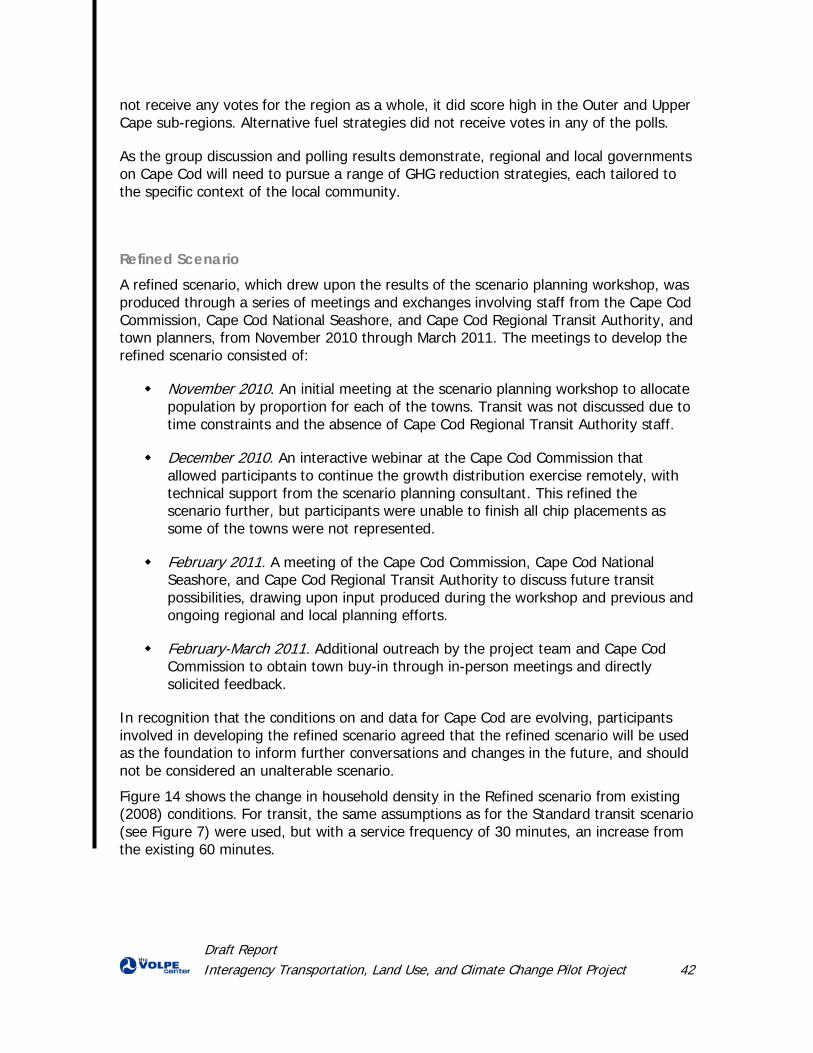
Draft Report Interagency Transportation, Land Use, and Climate Change Pilot Project 42
not receive any votes for the region as a whole, it did score high in the Outer and Upper Cape sub-regions. Alternative fuel strategies did not receive votes in any of the polls.
As the group discussion and polling results demonstrate, regional and local governments on Cape Cod will need to pursue a range of GHG reduction strategies, each tailored to the specific context of the local community.
Refined Scenario A refined scenario, which drew upon the results of the scenario planning workshop, was produced through a series of meetings and exchanges involving staff from the Cape Cod Commission, Cape Cod National Seashore, and Cape Cod Regional Transit Authority, and town planners, from November 2010 through March 2011. The meetings to develop the refined scenario consisted of:
November 2010. An initial meeting at the scenario planning workshop to allocate population by proportion for each of the towns. Transit was not discussed due to time constraints and the absence of Cape Cod Regional Transit Authority staff.
December 2010. An interactive webinar at the Cape Cod Commission that allowed participants to continue the growth distribution exercise remotely, with technical support from the scenario planning consultant. This refined the scenario further, but participants were unable to finish all chip placements as some of the towns were not represented.
February 2011. A meeting of the Cape Cod Commission, Cape Cod National Seashore, and Cape Cod Regional Transit Authority to discuss future transit possibilities, drawing upon input produced during the workshop and previous and ongoing regional and local planning efforts.
February-March 2011. Additional outreach by the project team and Cape Cod Commission to obtain town buy-in through in-person meetings and directly solicited feedback.
In recognition that the conditions on and data for Cape Cod are evolving, participants involved in developing the refined scenario agreed that the refined scenario will be used as the foundation to inform further conversations and changes in the future, and should not be considered an unalterable scenario.
Figure 14 shows the change in household density in the Refined scenario from existing (2008) conditions. For transit, the same assumptions as for the Standard transit scenario (see Figure 7) were used, but with a service frequency of 30 minutes, an increase from the existing 60 minutes.
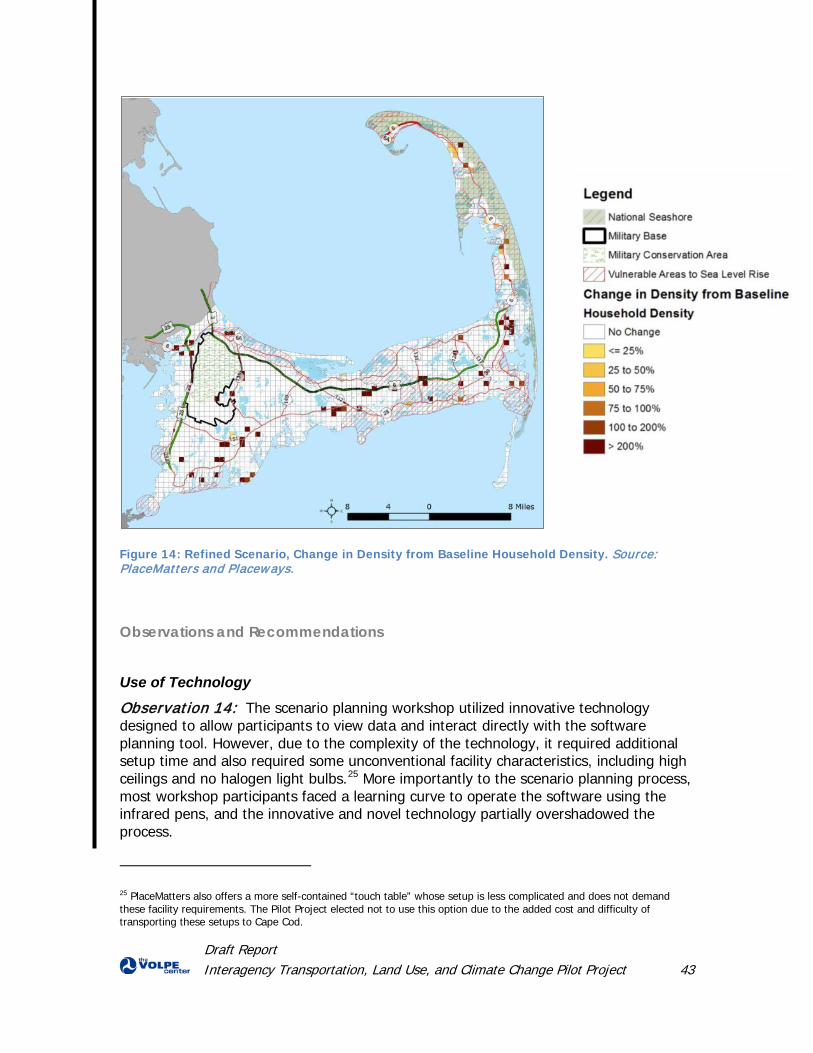
Draft Report Interagency Transportation, Land Use, and Climate Change Pilot Project 43
Figure 14: Refined Scenario, Change in Density from Baseline Household Density. Source: PlaceMatters and Placeways.
Observations and Recommendations
Use of Technology
Observation 14: The scenario planning workshop utilized innovative technology designed to allow participants to view data and interact directly with the software planning tool. However, due to the complexity of the technology, it required additional setup time and also required some unconventional facility characteristics, including high ceilings and no halogen light bulbs.25 More importantly to the scenario planning process, most workshop participants faced a learning curve to operate the software using the infrared pens, and the innovative and novel technology partially overshadowed the process.
25 PlaceMatters also offers a more self-contained “touch table” whose setup is less complicated and does not demand these facility requirements. The Pilot Project elected not to use this option due to the added cost and difficulty of transporting these setups to Cape Cod.
Draft Report Interagency Transportation, Land Use, and Climate Change Pilot Project 44
Recommendation: Evaluate whether and how to use advanced technology to allow participants to build a scenario during a workshop. As part of this decision, weigh the implications for time allocation and process against the ability to display volumes of data easily, quickly, and dynamically. Furthermore, computerized tools will likely be necessary for the analysis of any scenario and can provide benefits, but it may be useful to consider a mix of computerized and manual processes.
Regardless of the role that technology will play, introducing the technology, data, and process via webinar prior to a workshop would familiarize participants ahead of time and save time, avoid confusion, and make participants more informed and effective in their actions, as discussed in Observation 13. Other aspects of the scenario planning process are also possible to conduct via webinar, but given the rich conversations that took place during the Pilot Project’s stakeholder workshop, at least one in-person meeting is preferable.
Workshop Exercises
Designing the scenario planning workshop is a critical step in the process. It is important to consider the amount of time needed for participants to effectively complete each exercise and whether scheduling additional follow up workshops would helpful.
Observation 15: During the scenario planning exercise, the breakout groups allocated housing and jobs and proposed changes to regional transit facilities. Although the model included a number of data layers that could have informed the allocations, participants did not have time to review or reference them. In addition, each group was only able to evaluate the impact that their choices had on the various performance indicators once during the exercise due to the amount of time needed to refresh the indicators. This made it difficult for participants to understand the relationship between the placement of jobs, housing and transit facilities, and the consequences of those decisions, as captured by the performance indicators.
Recommendation: Allow enough time during the scenario development exercises for participants to take advantage of all data layers available and to refresh the model several times so that workshop participants can see the impacts of their choices on indicator performance. One of the values of the scenario planning process is in trying one strategy, seeing the results, and then revisiting the decisions and referencing relevant data in order to make better choices. Depending on the software tool being used, enabling specific target indicators to update instantaneously after each chip placement would better allow participants to easily evaluate the tradeoffs associated with specific growth allocations.
Observation 16: The architects of the breakout and final scenarios for the Pilot Project were mostly town and regional planners. Some of these participants found it difficult to freely place chips outside the context of existing zoning regulations and planning
Draft Report Interagency Transportation, Land Use, and Climate Change Pilot Project 45
proposals. As a result, much of the projected growth was allocated within existing zoning parameters.
Recommendation: Clear demarcations of areas that cannot accommodate growth, such as those with sensitive natural resources or that federal agencies own, should be made early in the process. However, it is also important to determine whether these restrictions should be considered fixed or variable. That is, consider whether participants should place growth based on current zoning restrictions or whether they should place growth under the assumption that these zoning restrictions could change during the scenario horizon. The designated time horizon, therefore, represents a large component of the consideration as to whether the intent of the process is to allocate growth in a realistic manner according to existing constraints or under the assumption that the constraints may change in the future. A 20-year time horizon may lead stakeholders to the former approach, while a 100-year time horizon to the latter. The timeline also has implications for assumptions about climate change effects, such as SLR.
Observation 17: The rules of the scenario planning exercise asked participants to place all 28,000 new housing units and 16,500 new employment units within rigid time bounds. Participants in certain breakout groups were rushed to finish on time. Participants noted that due to the sizes of the chips (with the largest chip size only allocating 1,000 units at a time) it was difficult to fully allocate all the chips in the allotted time.
Recommendation: Balance the practices of scenario planning against the need for “good planning.” Workshop participants should not be forced to allocate a strict amount of growth under time pressure; considering the tradeoffs between indicators should be a thoughtful exercise. Be sure to allow an appropriate amount of time for each exercise, and consider increasing the “size” of the chips so that participants can allocate growth efficiently.
Observation 18: The scenario development was set up so that one subgroup of workshop participants was responsible for developing a final scenario based on the scenarios developed by each of the four breakout groups. However, it was impossible for the subgroup to thoroughly consolidate the allocations of growth assigned in the breakout groups into a final scenario due to time constraints and the way the breakout groups’ information was presented. Instead, the group assigned growth to a new map using the breakout scenarios as references. As a result, the growth allocations the breakout groups made did not directly translate into the final scenario, which required additional input from stakeholders after the workshop.
Recommendation: Identify a systematic way to develop a final scenario so that it is directly representative of workshop participants’ intentions. This can be accomplished in a number of ways, but the following three are recommended based on the Pilot Project experience: (1) If developing several individual scenarios in breakout groups, identify a geospatial analysis technique that can systematically “average” the placement of growth from each group. (2) Organize
Draft Report Interagency Transportation, Land Use, and Climate Change Pilot Project 46
breakout groups by sub-region of the focus area. After assembling the sub-regions into a single map and calculating overall indicator performance, ask the entire group of stakeholders to validate the comprehensive map. 3) Instead of breakout groups, have one group composed of individuals who can represent each sub-region of the focus area and allocate growth for their sub-region. Once the map is evaluated overall, the group can discuss how best to improve the overall region’s performance by making sub-region adjustments.
Observation 19: Because estimates for the emission reduction potential of mitigation measures at the local level do not exist for Cape Cod, consideration of mitigation was limited to making changes in density, land use placement, and transit access during the scenario planning exercise and a discussion of potential GHG emissions reduction measures.
Recommendation: Incorporate climate change mitigation into the scenario planning exercise by providing information on mitigation strategies prior to the scenario development and by applying GHG emissions targets or objectives during the exercise. For instance, participants at the Cape Cod workshop could have discussed potential mitigation options prior to developing scenarios so that it could have impacted the decisions of workshop participants. In addition, participants could have been asked to place all projected new housing and employment units and achieve a target level of GHG emission reduction.
Observation 20: During the scenario development, local participants noted in passing that several existing population and employment centers located within vulnerable areas are dependent on existing state and/or federal transportation infrastructure. Time was not built into the workshop agenda to discuss the implications of this relationship, nor were the appropriate state and/or federal representatives present to discuss the availability of resources or assistance for fortification, rehabilitation, or relocation of these assets.
Recommendation: Allot time for discussion of adaptation options and involve the relevant decision makers, such as state and federal transportation, emergency management, and hazard mitigation staff, so they can provide input on the availability of resources and/or assistance.
Final Report Interagency Transportation, Land Use, and Climate Change Pilot Project 47
Assessment of Scenarios The ten scenarios were assessed using the performance indicators described in Section III26 and that were selected based on the Pilot Project’s goals described in Section I. This section summarizes the overall performance of the scenarios and provides details on the comparative results for climate change mitigation and adaptation and transit accessibility, which reflect the primary goals of the Pilot Project. Details and graphs for the indicators representing the impact of development on other areas of interest can be found in the Technical Scenario Report.
Overview of Scenario Performance Overall, the performance of the various scenarios demonstrated tradeoffs between the mitigation and adaptation indicators, especially in terms of intensifying development in existing commercial and residential areas that are vulnerable to SLR, and between indicators representing other land use interests. In comparing the scenarios, it is important to note the context in which each set – preliminary, workshop, and refined – were developed, including consideration of realistic expectations, feasibility constraints, and vetting by local entities. For the workshop, but even more so for the refined scenario, the goal was to minimize negative impacts and maximize positive impacts, as measured by each of the indicators, of development and transit placement.
The Trend and Dispersed scenarios resulted in similar results, performing worst in nearly all categories, except for percentage of new population in historic areas. Their performance reflects the fact that development is currently following a dispersed pattern and is not being focused in existing commercial and residential centers.
The Targeted scenario performed well in nearly all categories; however, it placed the highest percentage of new population in vulnerable areas. Many of Cape Cod’s existing high density residential and commercial centers, where development was placed in the Targeted scenario to increase density and promote transit-oriented developed, are located in vulnerable areas. For the same reason, the Targeted scenario also resulted in a relatively high percentage of new population in historic areas.
The Workshop scenarios varied in their results, reflecting how each breakout group had different participants and approaches to the exercise. These scenarios were developed under different conditions than the others, in that they were not constrained by coordination with pre-existing plans or by feasibility
26 Eight of the 10 scenarios were evaluated for all indicators. The two preliminary scenarios with enhanced transit were only evaluated against the VMT/GHG emissions and transit accessibility indicators, since their development distributions were identical to the corresponding standard transit scenarios.
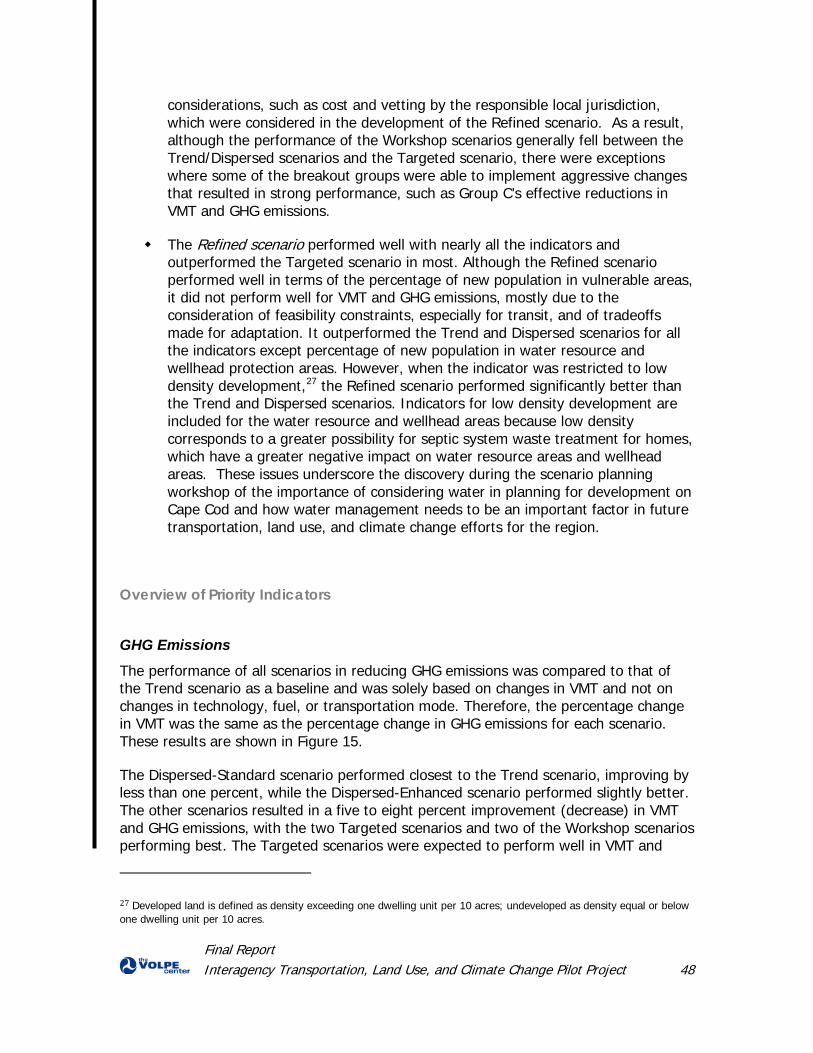
Final Report Interagency Transportation, Land Use, and Climate Change Pilot Project 48
considerations, such as cost and vetting by the responsible local jurisdiction, which were considered in the development of the Refined scenario. As a result, although the performance of the Workshop scenarios generally fell between the Trend/Dispersed scenarios and the Targeted scenario, there were exceptions where some of the breakout groups were able to implement aggressive changes that resulted in strong performance, such as Group C’s effective reductions in VMT and GHG emissions.
The Refined scenario performed well with nearly all the indicators and outperformed the Targeted scenario in most. Although the Refined scenario performed well in terms of the percentage of new population in vulnerable areas, it did not perform well for VMT and GHG emissions, mostly due to the consideration of feasibility constraints, especially for transit, and of tradeoffs made for adaptation. It outperformed the Trend and Dispersed scenarios for all the indicators except percentage of new population in water resource and wellhead protection areas. However, when the indicator was restricted to low density development,27 the Refined scenario performed significantly better than the Trend and Dispersed scenarios. Indicators for low density development are included for the water resource and wellhead areas because low density corresponds to a greater possibility for septic system waste treatment for homes, which have a greater negative impact on water resource areas and wellhead areas. These issues underscore the discovery during the scenario planning workshop of the importance of considering water in planning for development on Cape Cod and how water management needs to be an important factor in future transportation, land use, and climate change efforts for the region.
Overview of Priority Indicators
GHG Emissions
The performance of all scenarios in reducing GHG emissions was compared to that of the Trend scenario as a baseline and was solely based on changes in VMT and not on changes in technology, fuel, or transportation mode. Therefore, the percentage change in VMT was the same as the percentage change in GHG emissions for each scenario. These results are shown in Figure 15.
The Dispersed-Standard scenario performed closest to the Trend scenario, improving by less than one percent, while the Dispersed-Enhanced scenario performed slightly better. The other scenarios resulted in a five to eight percent improvement (decrease) in VMT and GHG emissions, with the two Targeted scenarios and two of the Workshop scenarios performing best. The Targeted scenarios were expected to perform well in VMT and
27 Developed land is defined as density exceeding one dwelling unit per 10 acres; undeveloped as density equal or below one dwelling unit per 10 acres.
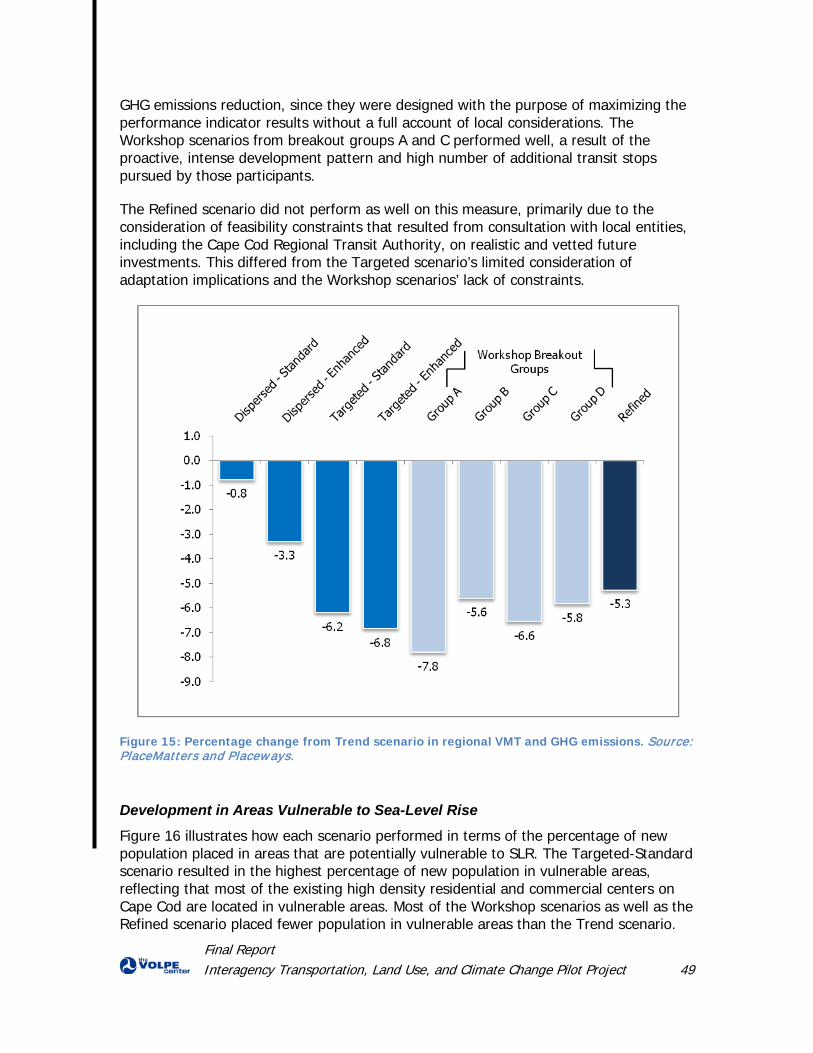
Final Report Interagency Transportation, Land Use, and Climate Change Pilot Project 49
GHG emissions reduction, since they were designed with the purpose of maximizing the performance indicator results without a full account of local considerations. The Workshop scenarios from breakout groups A and C performed well, a result of the proactive, intense development pattern and high number of additional transit stops pursued by those participants.
The Refined scenario did not perform as well on this measure, primarily due to the consideration of feasibility constraints that resulted from consultation with local entities, including the Cape Cod Regional Transit Authority, on realistic and vetted future investments. This differed from the Targeted scenario’s limited consideration of adaptation implications and the Workshop scenarios’ lack of constraints.
Figure 15: Percentage change from Trend scenario in regional VMT and GHG emissions. Source: PlaceMatters and Placeways.
Development in Areas Vulnerable to Sea-Level Rise
Figure 16 illustrates how each scenario performed in terms of the percentage of new population placed in areas that are potentially vulnerable to SLR. The Targeted-Standard scenario resulted in the highest percentage of new population in vulnerable areas, reflecting that most of the existing high density residential and commercial centers on Cape Cod are located in vulnerable areas. Most of the Workshop scenarios as well as the Refined scenario placed fewer population in vulnerable areas than the Trend scenario.
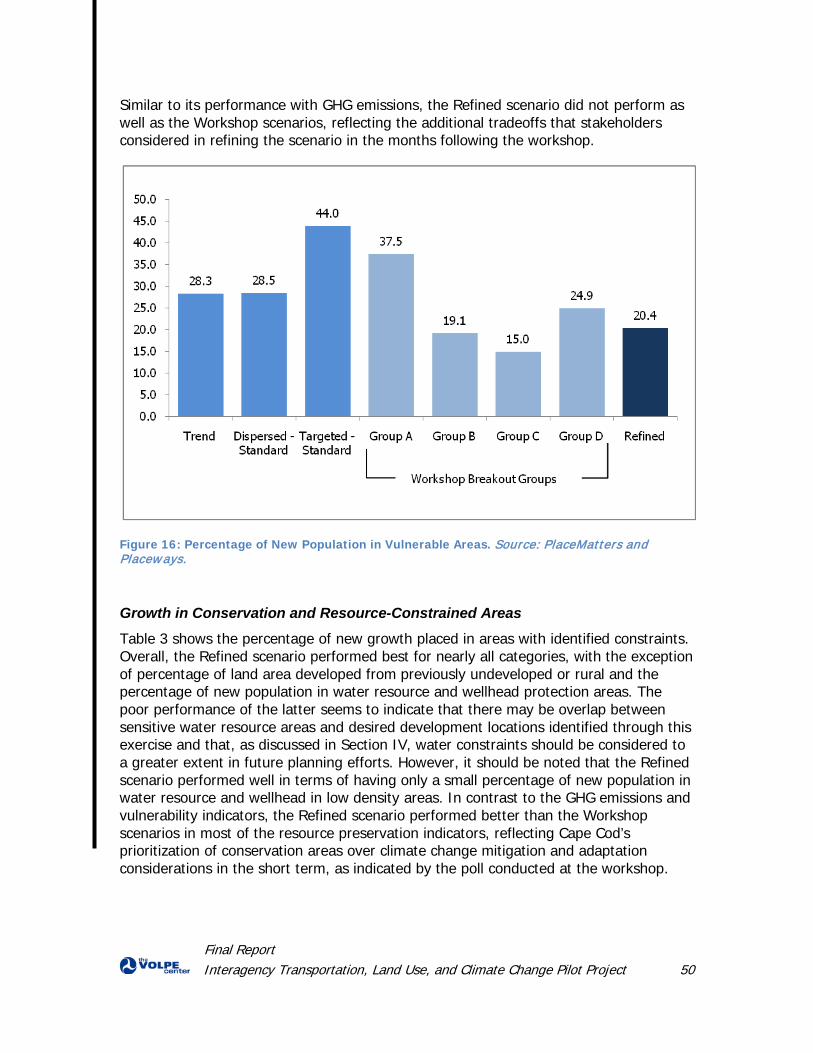
Final Report Interagency Transportation, Land Use, and Climate Change Pilot Project 50
Similar to its performance with GHG emissions, the Refined scenario did not perform as well as the Workshop scenarios, reflecting the additional tradeoffs that stakeholders considered in refining the scenario in the months following the workshop.
Figure 16: Percentage of New Population in Vulnerable Areas. Source: PlaceMatters and Placeways.
Growth in Conservation and Resource-Constrained Areas
Table 3 shows the percentage of new growth placed in areas with identified constraints. Overall, the Refined scenario performed best for nearly all categories, with the exception of percentage of land area developed from previously undeveloped or rural and the percentage of new population in water resource and wellhead protection areas. The poor performance of the latter seems to indicate that there may be overlap between sensitive water resource areas and desired development locations identified through this exercise and that, as discussed in Section IV, water constraints should be considered to a greater extent in future planning efforts. However, it should be noted that the Refined scenario performed well in terms of having only a small percentage of new population in water resource and wellhead in low density areas. In contrast to the GHG emissions and vulnerability indicators, the Refined scenario performed better than the Workshop scenarios in most of the resource preservation indicators, reflecting Cape Cod’s prioritization of conservation areas over climate change mitigation and adaptation considerations in the short term, as indicated by the poll conducted at the workshop.
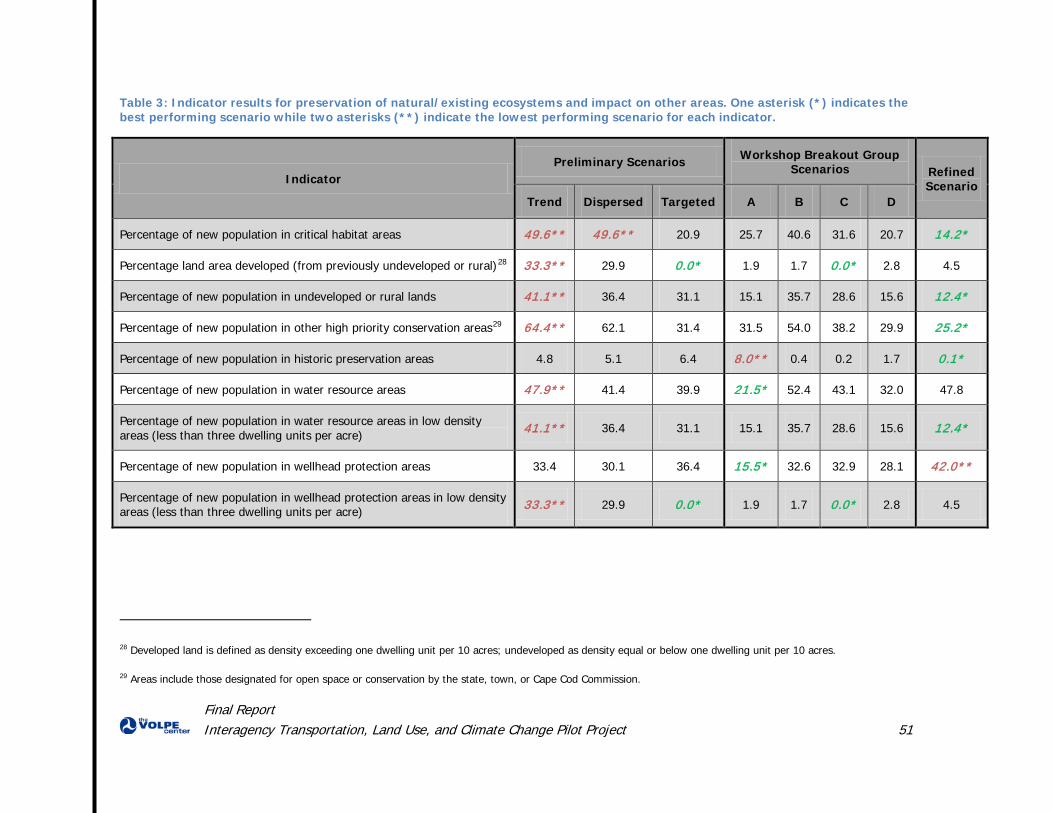
Final Report Interagency Transportation, Land Use, and Climate Change Pilot Project 51
Table 3: Indicator results for preservation of natural/existing ecosystems and impact on other areas. One asterisk (*) indicates the best performing scenario while two asterisks (**) indicate the lowest performing scenario for each indicator.
Indicator Preliminary Scenarios Workshop Breakout Group
Scenarios Refined Scenario
Trend Dispersed Targeted A B C D
Percentage of new population in critical habitat areas 49.6** 49.6** 20.9 25.7 40.6 31.6 20.7 14.2*
Percentage land area developed (from previously undeveloped or rural)28 33.3** 29.9 0.0* 1.9 1.7 0.0* 2.8 4.5
Percentage of new population in undeveloped or rural lands 41.1** 36.4 31.1 15.1 35.7 28.6 15.6 12.4*
Percentage of new population in other high priority conservation areas29 64.4** 62.1 31.4 31.5 54.0 38.2 29.9 25.2*
Percentage of new population in historic preservation areas 4.8 5.1 6.4 8.0** 0.4 0.2 1.7 0.1*
Percentage of new population in water resource areas 47.9** 41.4 39.9 21.5* 52.4 43.1 32.0 47.8
Percentage of new population in water resource areas in low density areas (less than three dwelling units per acre) 41.1** 36.4 31.1 15.1 35.7 28.6 15.6 12.4*
Percentage of new population in wellhead protection areas 33.4 30.1 36.4 15.5* 32.6 32.9 28.1 42.0**
Percentage of new population in wellhead protection areas in low density areas (less than three dwelling units per acre) 33.3** 29.9 0.0* 1.9 1.7 0.0* 2.8 4.5
28 Developed land is defined as density exceeding one dwelling unit per 10 acres; undeveloped as density equal or below one dwelling unit per 10 acres.
29 Areas include those designated for open space or conservation by the state, town, or Cape Cod Commission.
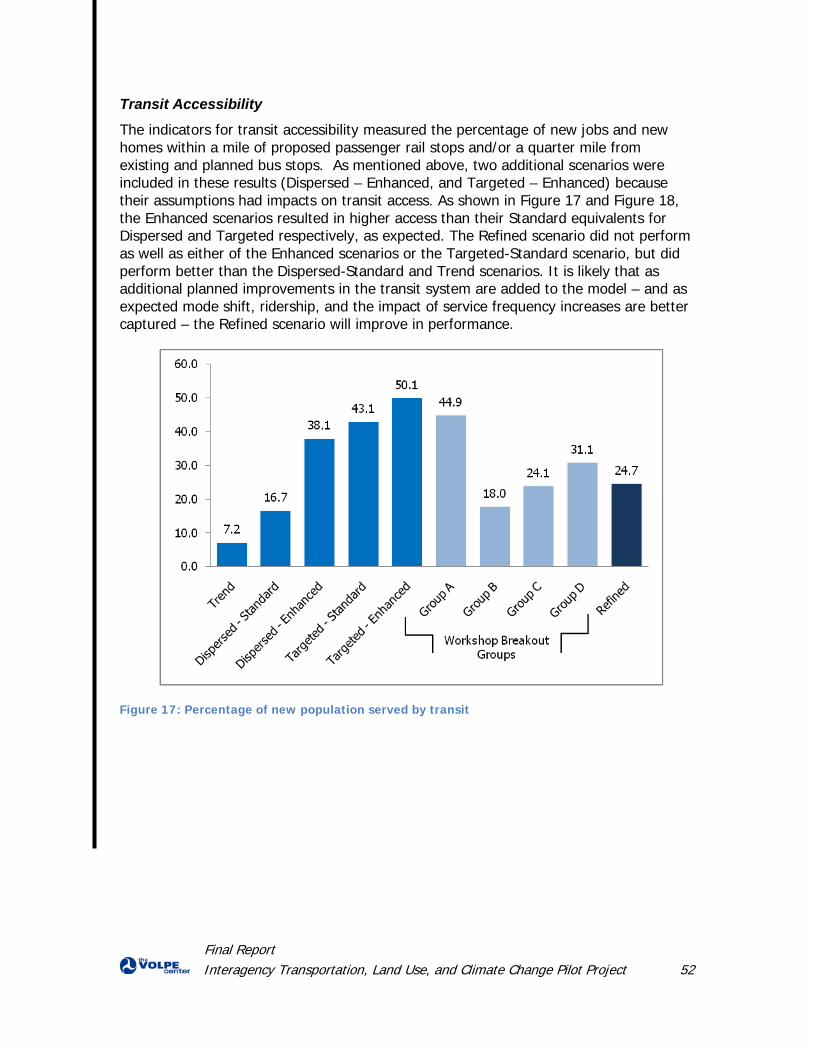
Final Report Interagency Transportation, Land Use, and Climate Change Pilot Project 52
Transit Accessibility
The indicators for transit accessibility measured the percentage of new jobs and new homes within a mile of proposed passenger rail stops and/or a quarter mile from existing and planned bus stops. As mentioned above, two additional scenarios were included in these results (Dispersed – Enhanced, and Targeted – Enhanced) because their assumptions had impacts on transit access. As shown in Figure 17 and Figure 18, the Enhanced scenarios resulted in higher access than their Standard equivalents for Dispersed and Targeted respectively, as expected. The Refined scenario did not perform as well as either of the Enhanced scenarios or the Targeted-Standard scenario, but did perform better than the Dispersed-Standard and Trend scenarios. It is likely that as additional planned improvements in the transit system are added to the model – and as expected mode shift, ridership, and the impact of service frequency increases are better captured – the Refined scenario will improve in performance.
Figure 17: Percentage of new population served by transit
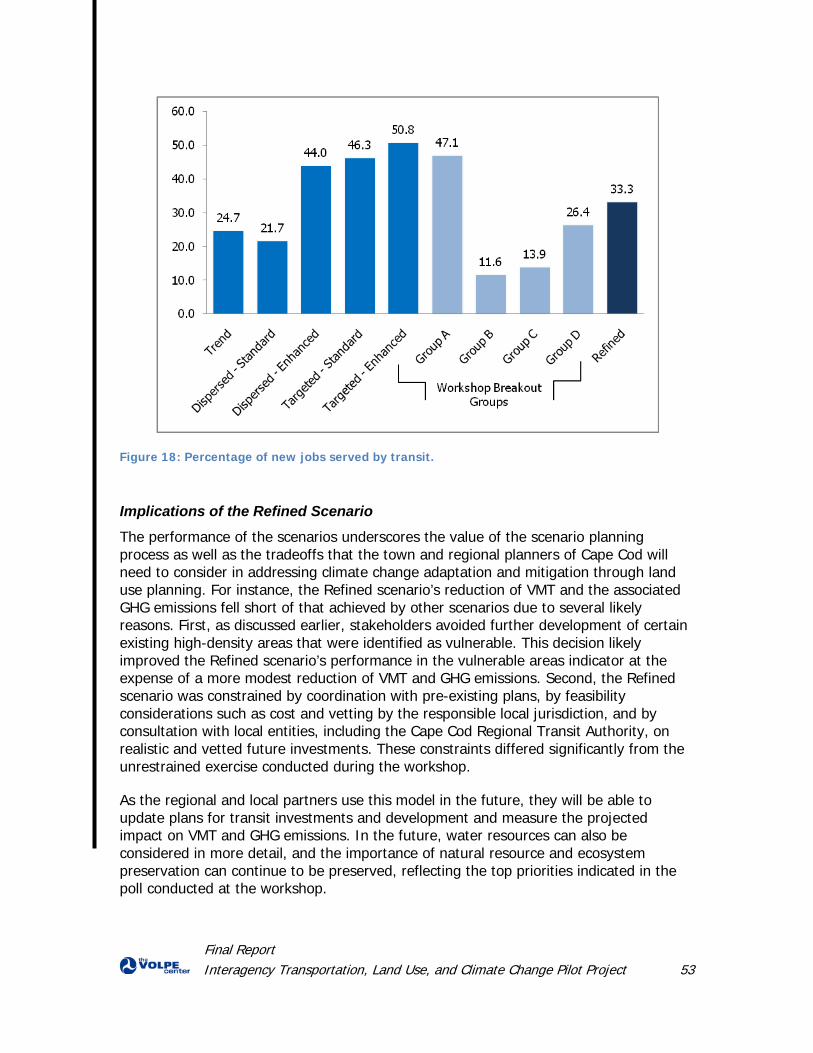
Final Report Interagency Transportation, Land Use, and Climate Change Pilot Project 53
Figure 18: Percentage of new jobs served by transit.
Implications of the Refined Scenario
The performance of the scenarios underscores the value of the scenario planning process as well as the tradeoffs that the town and regional planners of Cape Cod will need to consider in addressing climate change adaptation and mitigation through land use planning. For instance, the Refined scenario’s reduction of VMT and the associated GHG emissions fell short of that achieved by other scenarios due to several likely reasons. First, as discussed earlier, stakeholders avoided further development of certain existing high-density areas that were identified as vulnerable. This decision likely improved the Refined scenario’s performance in the vulnerable areas indicator at the expense of a more modest reduction of VMT and GHG emissions. Second, the Refined scenario was constrained by coordination with pre-existing plans, by feasibility considerations such as cost and vetting by the responsible local jurisdiction, and by consultation with local entities, including the Cape Cod Regional Transit Authority, on realistic and vetted future investments. These constraints differed significantly from the unrestrained exercise conducted during the workshop.
As the regional and local partners use this model in the future, they will be able to update plans for transit investments and development and measure the projected impact on VMT and GHG emissions. In the future, water resources can also be considered in more detail, and the importance of natural resource and ecosystem preservation can continue to be preserved, reflecting the top priorities indicated in the poll conducted at the workshop.
Final Report Interagency Transportation, Land Use, and Climate Change Pilot Project 54
Conclusion This section discusses how well the Pilot Project met the four goals described in Section I, outlines recommended steps and considerations for future applications of the process, and reviews the role that various participants – federal, state, regional, and local – can play in the process.
Goals
Climate Change Mitigation and Adaptation
Strategies to reduce GHG emissions can focus on VMT reduction, fuel efficiency, vehicle technology, or operational efficiency. VMT reduction is the main area for which local and regional land use and transportation investment decisions can have an impact. The impact of density, land use mix, and transit access on VMT can be modeled and assessed easily in scenario planning and this was accomplished with the Pilot Project. However, as shown in Figure 15, the resulting reduction in VMT was relatively small and larger reductions will require other strategies. Actions that aim to change behavior through pricing, incentives, and other means are more difficult to model, so additional time and resources would have been necessary to integrate them into the scenario planning process. Although the Pilot Project was not able to focus on GHG mitigation strategies for seasonal recreational travel due to data limitations, it was able to document those limitations and identify actions that the region could take to begin to model and account for such travel. These actions are documented in a separate action plan developed for the Cape Cod Commission, as mentioned in Section II.
In addressing adaptation, the Pilot Project found that unless participants have access to existing data or the time and resources to conduct location-specific modeling, regional assumptions about climate change impacts will be limited. In addition, the Pilot Project found that there are other constraints on and considerations for land use development in addition to SLR and climate change effects – namely protection of water resources and environmentally sensitive areas. These other considerations should inform and restrict options for land use development and even, in the case of conservation lands, be considered as a way to mitigate SLR and other climate change effects.
Although the goals of mitigation and adaptation were treated separately in terms of modeling baseline assumptions and assessing impacts of development and transportation assumptions, the Pilot Project found that they were and should be discussed together, as there can be tradeoffs. Participants in the Pilot Project found that at times, development decisions that would reduce GHG emissions through changes in density and job-housing balance would also place new population in vulnerable areas because of the location of existing residential and commercial centers.
Final Report Interagency Transportation, Land Use, and Climate Change Pilot Project 55
Scenario Planning
The Pilot Project employed a land use and transportation-focused framework for scenario planning that reflects how MPOs are using scenario planning and is described in the FHWA Scenario Planning Guidebook. Stakeholders evaluate several alternative future scenarios and then select or develop a scenario to serve as a vision. This approach was selected due its use by MPOs and its applicability to climate change mitigation, in terms of facilitating the setting of GHG emissions targets and determining land use and transportation growth patterns that would allow a community to achieve those targets. Another version of scenario planning is risk-mitigation focused and asks stakeholders to develop several possible scenarios and then identify strategies that are common to most or all of them. Risk-mitigation focused scenario planning is also appropriate for addressing climate change, particularly adaptation, given the debate surrounding the nature and extent of potential climate change effects. NPS has successfully applied this approach with several of its land management units to help them plan for projected climate change impacts.
Although the Pilot Project elected to follow the land use and transportation-focused approach to scenario planning, future applications of transportation, land use, and climate change scenario planning may benefit from both approaches. Given that the former lends itself to climate change mitigation and the latter to adaptation, the most appropriate approach may be to employ both. For example, the risk-mitigation approach can be used to develop different scenarios for a range of potential climate change effects. These scenarios can then be used as data layers to both inform the development of land use and transportation scenarios and assess these scenarios alongside indicators for VMT and GHG emissions. How to best employ one or both approaches should be determined based on the expressed goals of the project, the relative importance of adaptation and mitigation to stakeholders, and the resources and expertise available.
Scenario planning provided participants an opportunity to experiment, to explore how different information overlapped, and to discuss tradeoffs. One of the key benefits of scenario planning software is its ability to provide fairly immediate feedback on development and transportation decisions and to provide a tool by which to explore and test the implications of different decisions. To achieve this in an interactive exercise, it is important to have the right people in the room and to provide sufficient time to run updates to the performance indicators.
Interagency Coordination
Participation by multiple agencies ensures the pooling and sharing of expertise and resources. Given the role of the state in this process, it is important to include state agencies as well as federal agencies, regional land use and transportation entities including federal land management agencies, and local stakeholders. Regional or local entities should be the main initiators of the process as they are in the best position to assess the data needs, status of planning efforts, and planning priorities for the region.
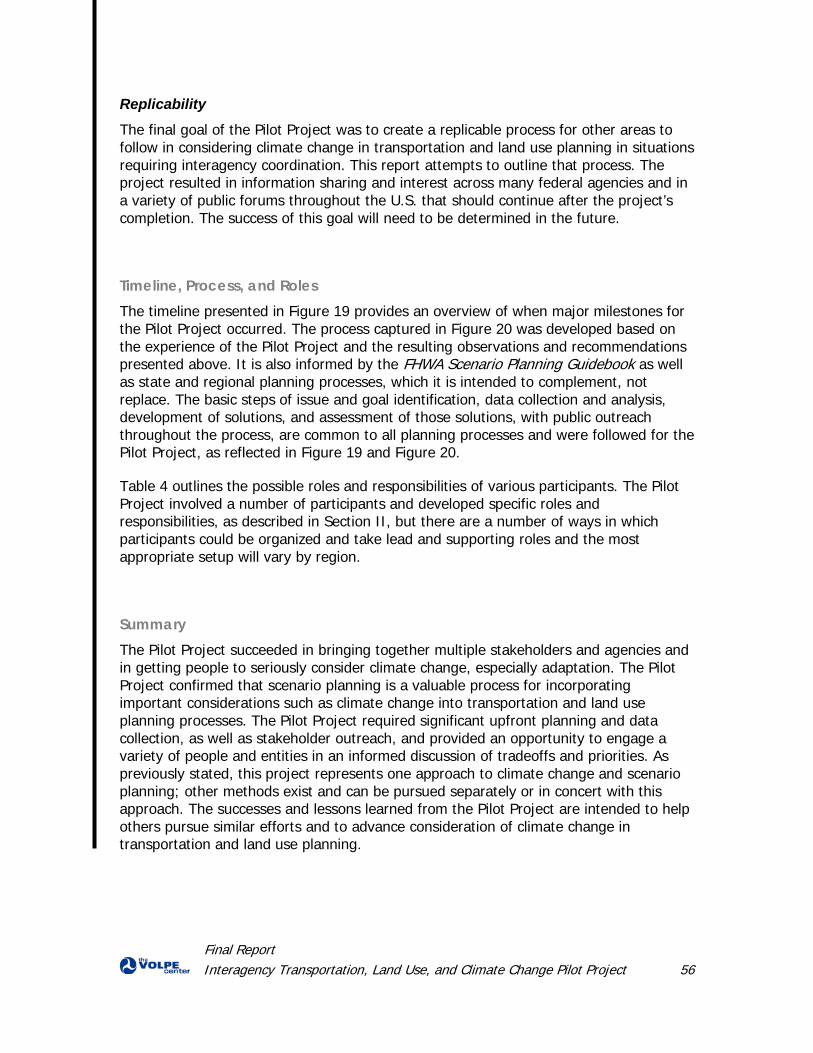
Final Report Interagency Transportation, Land Use, and Climate Change Pilot Project 56
Replicability
The final goal of the Pilot Project was to create a replicable process for other areas to follow in considering climate change in transportation and land use planning in situations requiring interagency coordination. This report attempts to outline that process. The project resulted in information sharing and interest across many federal agencies and in a variety of public forums throughout the U.S. that should continue after the project’s completion. The success of this goal will need to be determined in the future.
Timeline, Process, and Roles The timeline presented in Figure 19 provides an overview of when major milestones for the Pilot Project occurred. The process captured in Figure 20 was developed based on the experience of the Pilot Project and the resulting observations and recommendations presented above. It is also informed by the FHWA Scenario Planning Guidebook as well as state and regional planning processes, which it is intended to complement, not replace. The basic steps of issue and goal identification, data collection and analysis, development of solutions, and assessment of those solutions, with public outreach throughout the process, are common to all planning processes and were followed for the Pilot Project, as reflected in Figure 19 and Figure 20.
Table 4 outlines the possible roles and responsibilities of various participants. The Pilot Project involved a number of participants and developed specific roles and responsibilities, as described in Section II, but there are a number of ways in which participants could be organized and take lead and supporting roles and the most appropriate setup will vary by region.
Summary The Pilot Project succeeded in bringing together multiple stakeholders and agencies and in getting people to seriously consider climate change, especially adaptation. The Pilot Project confirmed that scenario planning is a valuable process for incorporating important considerations such as climate change into transportation and land use planning processes. The Pilot Project required significant upfront planning and data collection, as well as stakeholder outreach, and provided an opportunity to engage a variety of people and entities in an informed discussion of tradeoffs and priorities. As previously stated, this project represents one approach to climate change and scenario planning; other methods exist and can be pursued separately or in concert with this approach. The successes and lessons learned from the Pilot Project are intended to help others pursue similar efforts and to advance consideration of climate change in transportation and land use planning.
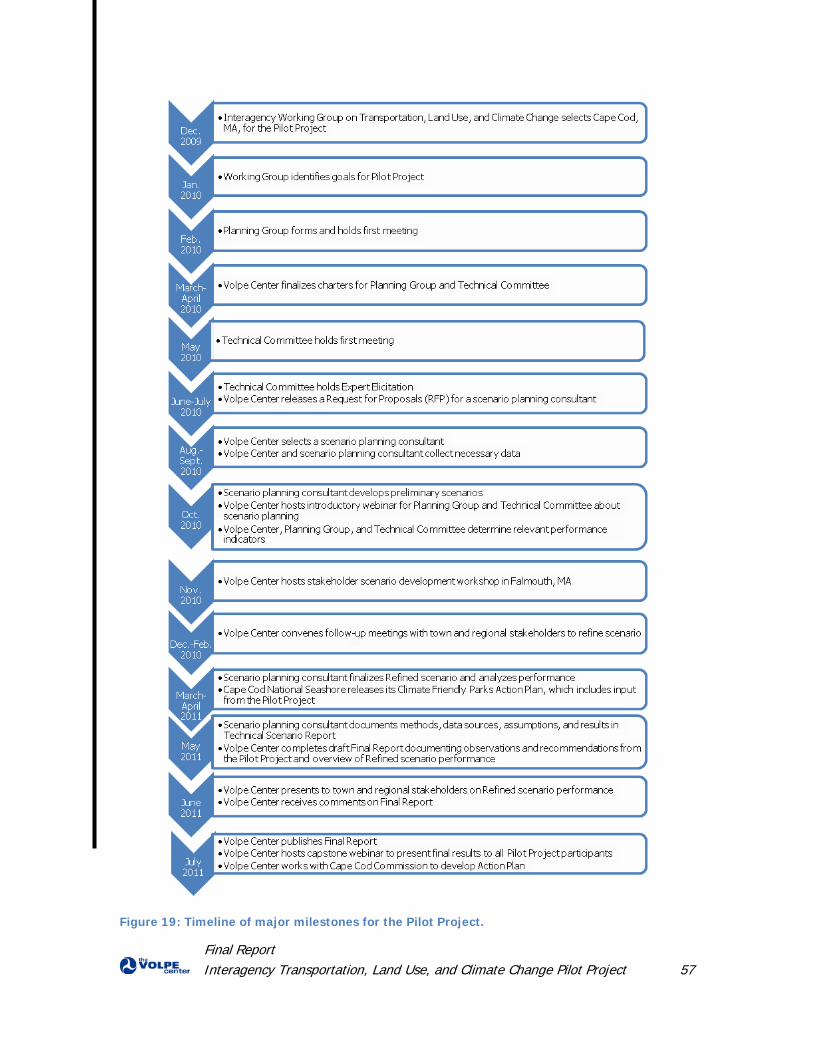
Final Report Interagency Transportation, Land Use, and Climate Change Pilot Project 57
Figure 19: Timeline of major milestones for the Pilot Project.
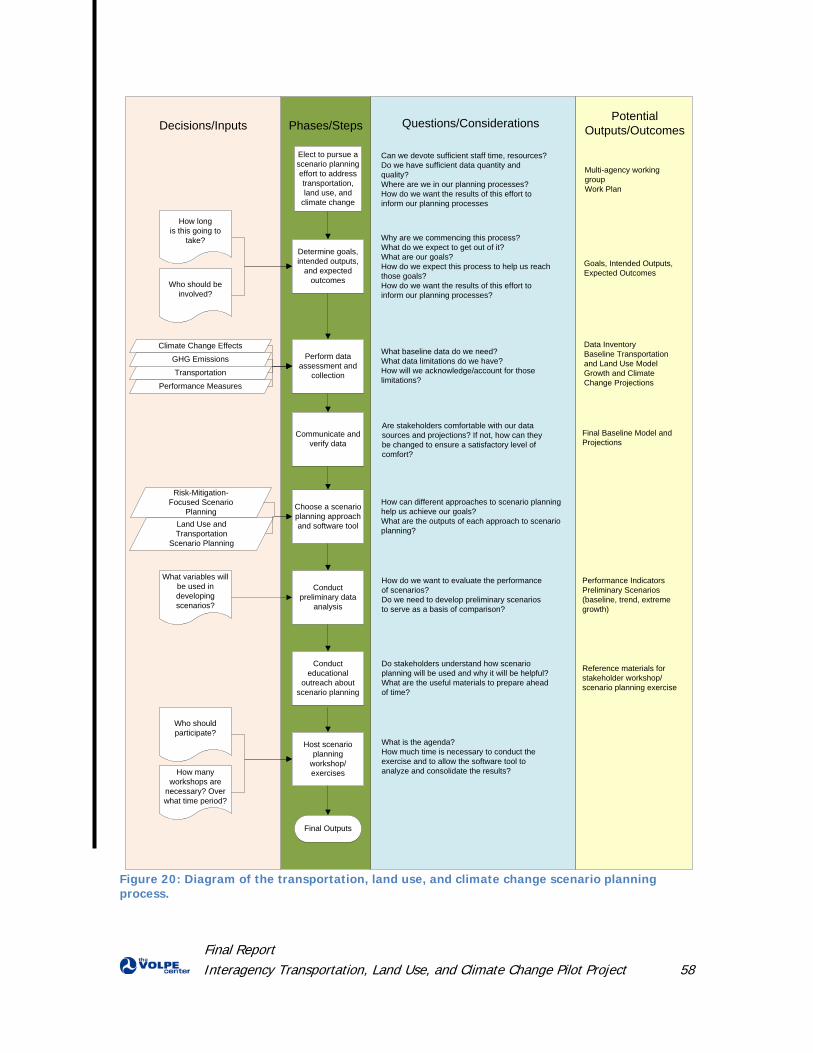
Final Report Interagency Transportation, Land Use, and Climate Change Pilot Project 58
Elect to pursue a scenario planning effort to address transportation, land use, and
climate change
Can we devote sufficient staff time, resources?Do we have sufficient data quantity and quality?Where are we in our planning processes? How do we want the results of this effort to inform our planning processes
Determine goals, intended outputs,
and expected outcomes
Why are we commencing this process?What do we expect to get out of it?What are our goals?How do we expect this process to help us reach those goals?How do we want the results of this effort to inform our planning processes?
Perform data assessment and
collection
What baseline data do we need?What data limitations do we have? How will we acknowledge/account for those limitations?
Climate Change Effects
GHG Emissions
Transportation
Performance Measures
Communicate and verify data
Are stakeholders comfortable with our data sources and projections? If not, how can they be changed to ensure a satisfactory level of comfort?
Choose a scenario planning approach and software tool
Conduct educational
outreach about scenario planning
Host scenario planning
workshop/exercises
Final Outputs
Decisions/Inputs Phases/Steps Questions/Considerations
Do stakeholders understand how scenario planning will be used and why it will be helpful?What are the useful materials to prepare ahead of time?
What is the agenda? How much time is necessary to conduct the exercise and to allow the software tool to analyze and consolidate the results?
Risk-Mitigation-Focused Scenario
PlanningLand Use and Transportation
Scenario Planning
How long is this going to
take?
Who should be involved?
Who should participate?
How many workshops are
necessary? Over what time period?
Potential Outputs/Outcomes
Multi-agency working groupWork Plan
Goals, Intended Outputs, Expected Outcomes
Data InventoryBaseline Transportation and Land Use ModelGrowth and Climate Change Projections
Final Baseline Model and Projections
Performance IndicatorsPreliminary Scenarios (baseline, trend, extreme growth)
Conduct preliminary data
analysis
How do we want to evaluate the performance of scenarios? Do we need to develop preliminary scenarios to serve as a basis of comparison?
How can different approaches to scenario planning help us achieve our goals? What are the outputs of each approach to scenario planning?
What variables will be used in developing scenarios?
Reference materials for stakeholder workshop/scenario planning exercise
Figure 20: Diagram of the transportation, land use, and climate change scenario planning process.
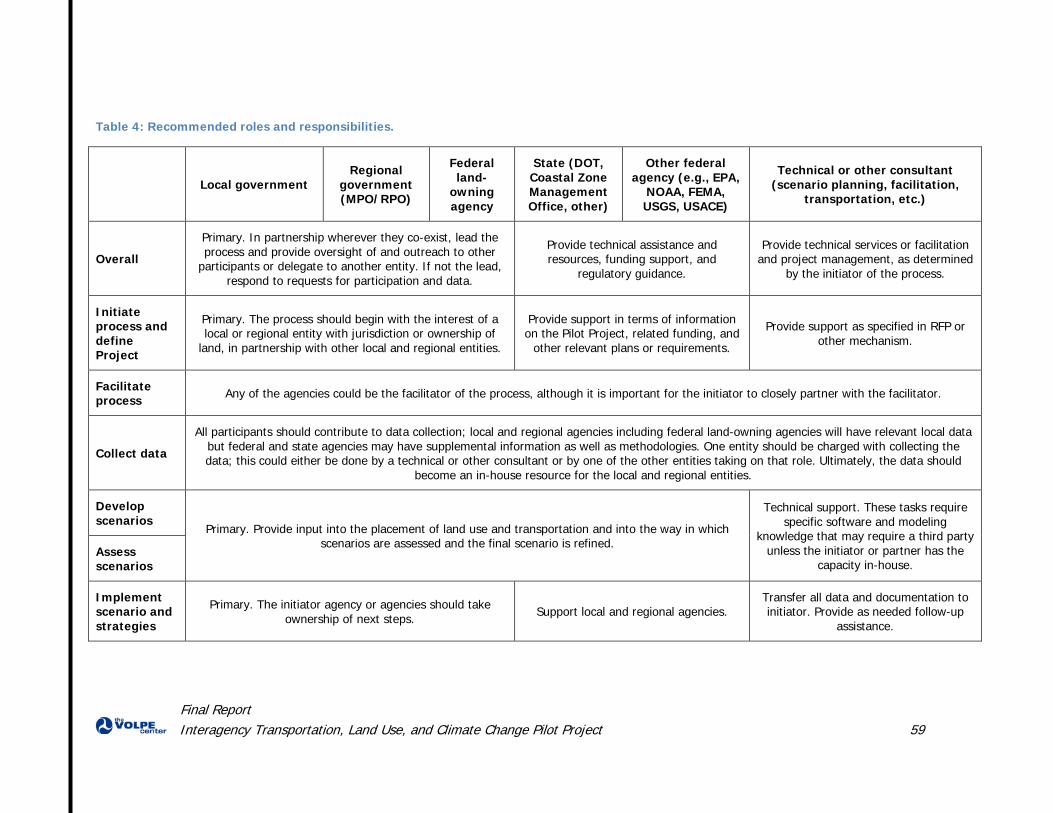
Final Report Interagency Transportation, Land Use, and Climate Change Pilot Project 59
Table 4: Recommended roles and responsibilities.
Local government Regional
government (MPO/RPO)
Federal land-
owning agency
State (DOT, Coastal Zone Management Office, other)
Other federal agency (e.g., EPA,
NOAA, FEMA, USGS, USACE)
Technical or other consultant (scenario planning, facilitation,
transportation, etc.)
Overall
Primary. In partnership wherever they co-exist, lead the process and provide oversight of and outreach to other
participants or delegate to another entity. If not the lead, respond to requests for participation and data.
Provide technical assistance and resources, funding support, and
regulatory guidance.
Provide technical services or facilitation and project management, as determined
by the initiator of the process.
Initiate process and define Project
Primary. The process should begin with the interest of a local or regional entity with jurisdiction or ownership of
land, in partnership with other local and regional entities.
Provide support in terms of information on the Pilot Project, related funding, and
other relevant plans or requirements.
Provide support as specified in RFP or other mechanism.
Facilitate process Any of the agencies could be the facilitator of the process, although it is important for the initiator to closely partner with the facilitator.
Collect data
All participants should contribute to data collection; local and regional agencies including federal land-owning agencies will have relevant local data but federal and state agencies may have supplemental information as well as methodologies. One entity should be charged with collecting the data; this could either be done by a technical or other consultant or by one of the other entities taking on that role. Ultimately, the data should
become an in-house resource for the local and regional entities.
Develop scenarios
Primary. Provide input into the placement of land use and transportation and into the way in which scenarios are assessed and the final scenario is refined.
Technical support. These tasks require specific software and modeling
knowledge that may require a third party unless the initiator or partner has the
capacity in-house. Assess scenarios
Implement scenario and strategies
Primary. The initiator agency or agencies should take ownership of next steps. Support local and regional agencies.
Transfer all data and documentation to initiator. Provide as needed follow-up
assistance.
A Framework for Considering Climate Change in Transportation and Land Use Scenario Planning: Appendices March 2012
Lessons Learned from an Interagency Pilot Project on Cape Cod
Federal Highway Administration National Park Service U.S. Fish and Wildlife Service
Appendices Interagency Transportation, Land Use, and Climate Change Pilot Project
The Interagency Transportation, Land Use, and Climate Change Pilot Project utilized a scenario planning process to develop a multi-agency transportation- and land use-focused development strategy for Cape Cod, Massachusetts, with the intention of achieving a reduction in future greenhouse gas emissions and considering the potential impacts of sea-level rise on the region. The outcomes of this scenario planning process will inform and support the region’s long-range transportation planning and other related efforts, as well as the planning efforts of local, state, and federal agencies.
Project members collaborated to document the process followed and significant observations and recommendations for future applications. This information is presented in this report. The appendices and a separate document, the Technical Scenario Report, developed by the scenario planning consultants, provide supporting documentation.
Table of Contents
Appendix A: Planning Group and Technical Committee Charters and Rosters ................. 1
Appendix B: Literature Review ........................ 6
Appendix C: Request for Proposal ................. 19
Appendix D: List of Potential Performance Indicators ................................................ 34
Appendix E: Vulnerable Area Map and Key .... 36
Appendix F: Potential GHG Reduction Strategies ................................................ 40
Appendix G: Priority Transportation Strategies for Cape Cod ........................... 46
Appendix H: Scenario Planning Workshop Agenda ................................................... 48
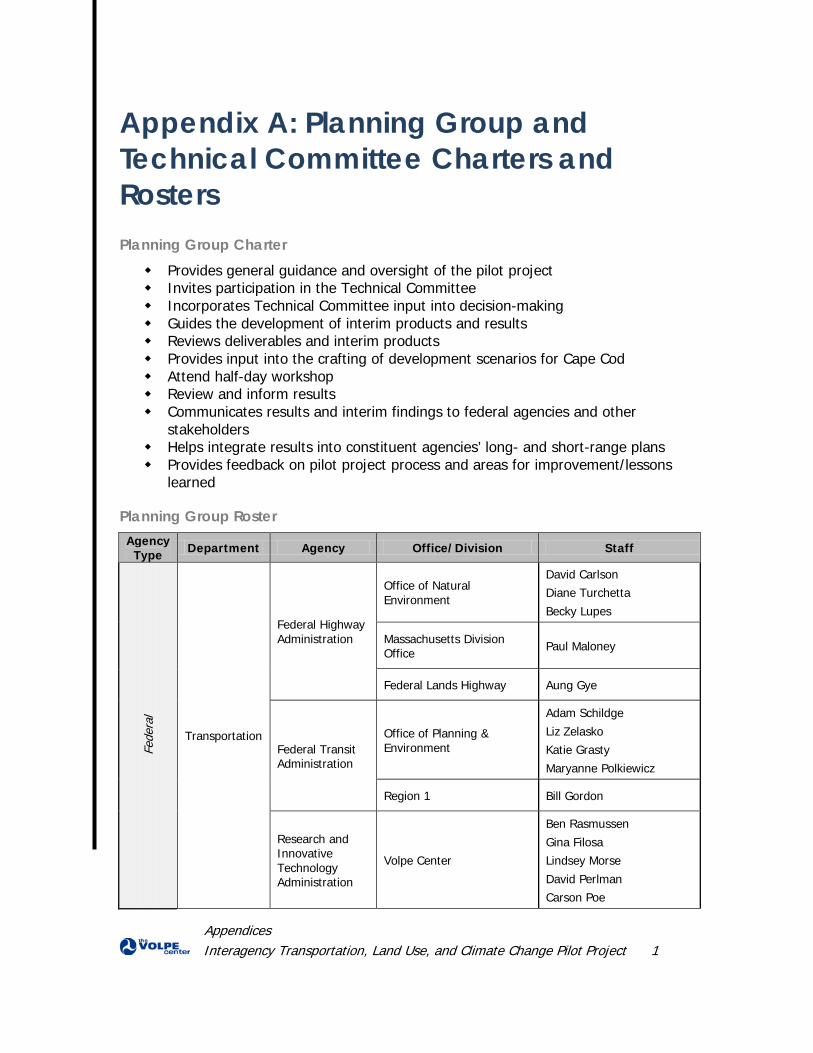
Appendices Interagency Transportation, Land Use, and Climate Change Pilot Project 1
Appendix A: Planning Group and Technical Committee Charters and Rosters Planning Group Charter Provides general guidance and oversight of the pilot project Invites participation in the Technical Committee Incorporates Technical Committee input into decision-making Guides the development of interim products and results Reviews deliverables and interim products Provides input into the crafting of development scenarios for Cape Cod Attend half-day workshop Review and inform results Communicates results and interim findings to federal agencies and other
stakeholders Helps integrate results into constituent agencies’ long- and short-range plans Provides feedback on pilot project process and areas for improvement/lessons
learned
Planning Group Roster Agency
Type Department Agency Office/Division Staff
Fede
ral
Transportation
Federal Highway Administration
Office of Natural Environment
David Carlson Diane Turchetta Becky Lupes
Massachusetts Division Office Paul Maloney
Federal Lands Highway Aung Gye
Federal Transit Administration
Office of Planning & Environment
Adam Schildge Liz Zelasko Katie Grasty Maryanne Polkiewicz
Region 1 Bill Gordon
Research and Innovative Technology Administration
Volpe Center
Ben Rasmussen Gina Filosa Lindsey Morse David Perlman Carson Poe
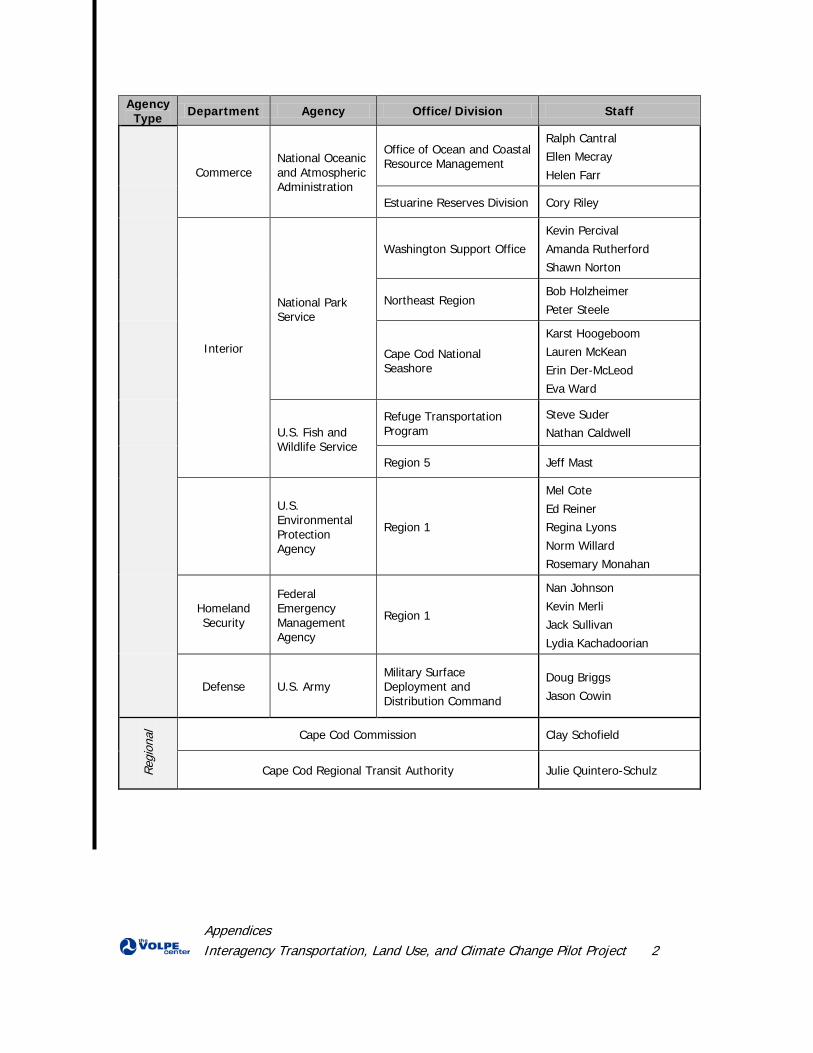
Appendices Interagency Transportation, Land Use, and Climate Change Pilot Project 2
Agency Type Department Agency Office/Division Staff
Commerce National Oceanic and Atmospheric Administration
Office of Ocean and Coastal Resource Management
Ralph Cantral Ellen Mecray Helen Farr
Estuarine Reserves Division Cory Riley
Interior
National Park Service
Washington Support Office Kevin Percival Amanda Rutherford Shawn Norton
Northeast Region Bob Holzheimer Peter Steele
Cape Cod National Seashore
Karst Hoogeboom Lauren McKean Erin Der-McLeod Eva Ward
U.S. Fish and Wildlife Service
Refuge Transportation Program
Steve Suder Nathan Caldwell
Region 5 Jeff Mast
U.S. Environmental Protection Agency
Region 1
Mel Cote Ed Reiner Regina Lyons Norm Willard Rosemary Monahan
Homeland Security
Federal Emergency Management Agency
Region 1
Nan Johnson Kevin Merli Jack Sullivan Lydia Kachadoorian
Defense U.S. Army Military Surface Deployment and Distribution Command
Doug Briggs Jason Cowin
Regi
onal
Cape Cod Commission Clay Schofield
Cape Cod Regional Transit Authority Julie Quintero-Schulz
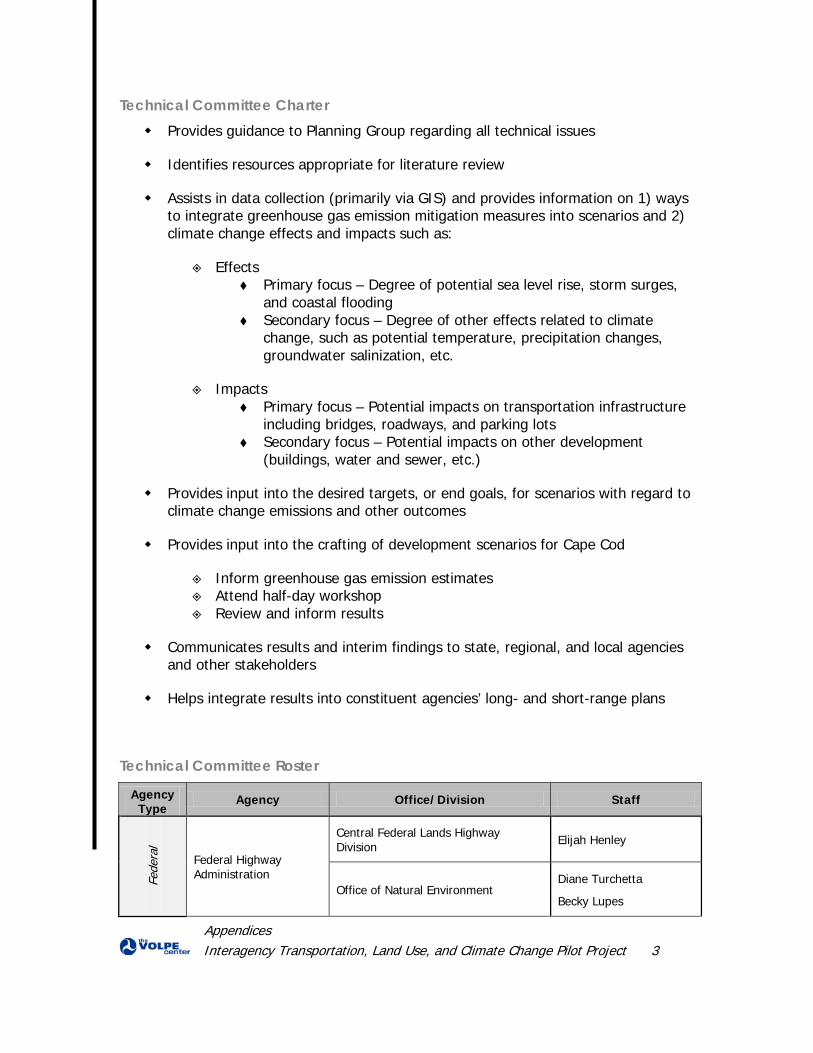
Appendices Interagency Transportation, Land Use, and Climate Change Pilot Project 3
Technical Committee Charter Provides guidance to Planning Group regarding all technical issues
Identifies resources appropriate for literature review
Assists in data collection (primarily via GIS) and provides information on 1) ways to integrate greenhouse gas emission mitigation measures into scenarios and 2) climate change effects and impacts such as:
Effects Primary focus – Degree of potential sea level rise, storm surges,
and coastal flooding Secondary focus – Degree of other effects related to climate
change, such as potential temperature, precipitation changes, groundwater salinization, etc.
Impacts Primary focus – Potential impacts on transportation infrastructure
including bridges, roadways, and parking lots Secondary focus – Potential impacts on other development
(buildings, water and sewer, etc.)
Provides input into the desired targets, or end goals, for scenarios with regard to climate change emissions and other outcomes
Provides input into the crafting of development scenarios for Cape Cod
Inform greenhouse gas emission estimates Attend half-day workshop Review and inform results
Communicates results and interim findings to state, regional, and local agencies and other stakeholders
Helps integrate results into constituent agencies’ long- and short-range plans
Technical Committee Roster
Agency Type
Agency Office/Division Staff
Fede
ral
Federal Highway Administration
Central Federal Lands Highway Division Elijah Henley
Office of Natural Environment Diane Turchetta
Becky Lupes
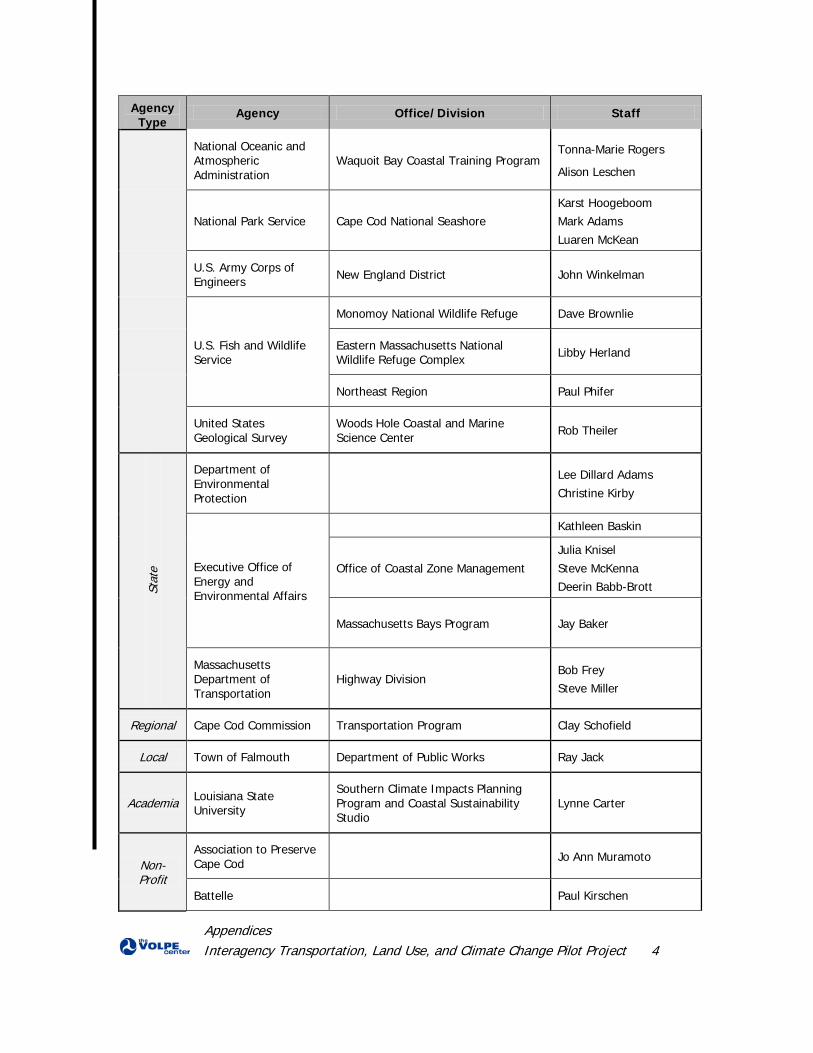
Appendices Interagency Transportation, Land Use, and Climate Change Pilot Project 4
Agency Type
Agency Office/Division Staff
National Oceanic and Atmospheric Administration
Waquoit Bay Coastal Training Program Tonna-Marie Rogers
Alison Leschen
National Park Service Cape Cod National Seashore Karst Hoogeboom Mark Adams Luaren McKean
U.S. Army Corps of Engineers New England District John Winkelman
U.S. Fish and Wildlife Service
Monomoy National Wildlife Refuge Dave Brownlie
Eastern Massachusetts National Wildlife Refuge Complex Libby Herland
Northeast Region Paul Phifer
United States Geological Survey
Woods Hole Coastal and Marine Science Center Rob Theiler
Stat
e
Department of Environmental Protection
Lee Dillard Adams Christine Kirby
Executive Office of Energy and Environmental Affairs
Kathleen Baskin
Office of Coastal Zone Management Julia Knisel Steve McKenna Deerin Babb-Brott
Massachusetts Bays Program Jay Baker
Massachusetts Department of Transportation
Highway Division Bob Frey Steve Miller
Regional Cape Cod Commission Transportation Program Clay Schofield
Local Town of Falmouth Department of Public Works Ray Jack
Academia Louisiana State University
Southern Climate Impacts Planning Program and Coastal Sustainability Studio
Lynne Carter
Non-Profit
Association to Preserve Cape Cod Jo Ann Muramoto
Battelle Paul Kirschen
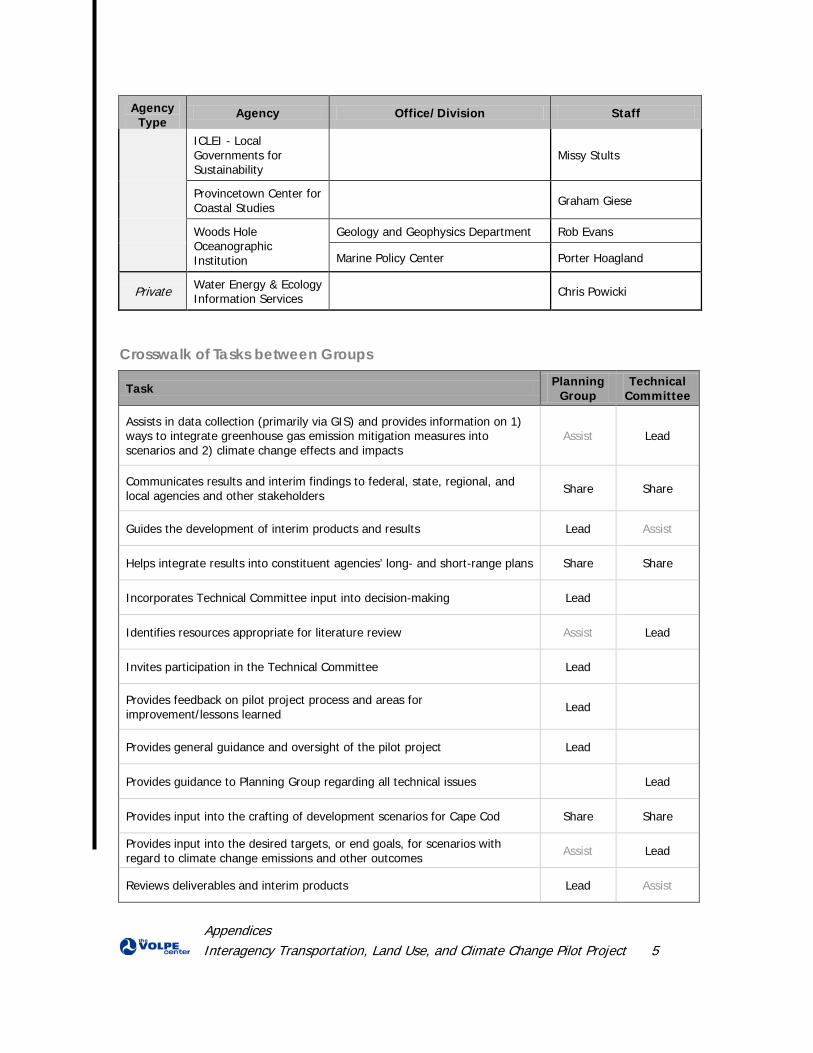
Appendices Interagency Transportation, Land Use, and Climate Change Pilot Project 5
Agency Type
Agency Office/Division Staff
ICLEI - Local Governments for Sustainability
Missy Stults
Provincetown Center for Coastal Studies Graham Giese
Woods Hole Oceanographic Institution
Geology and Geophysics Department Rob Evans
Marine Policy Center Porter Hoagland
Private Water Energy & Ecology Information Services Chris Powicki
Crosswalk of Tasks between Groups
Task Planning Group
Technical Committee
Assists in data collection (primarily via GIS) and provides information on 1) ways to integrate greenhouse gas emission mitigation measures into scenarios and 2) climate change effects and impacts
Assist Lead
Communicates results and interim findings to federal, state, regional, and local agencies and other stakeholders Share Share
Guides the development of interim products and results Lead Assist
Helps integrate results into constituent agencies’ long- and short-range plans Share Share
Incorporates Technical Committee input into decision-making Lead
Identifies resources appropriate for literature review Assist Lead
Invites participation in the Technical Committee Lead
Provides feedback on pilot project process and areas for improvement/lessons learned Lead
Provides general guidance and oversight of the pilot project Lead
Provides guidance to Planning Group regarding all technical issues Lead
Provides input into the crafting of development scenarios for Cape Cod Share Share
Provides input into the desired targets, or end goals, for scenarios with regard to climate change emissions and other outcomes Assist Lead
Reviews deliverables and interim products Lead Assist
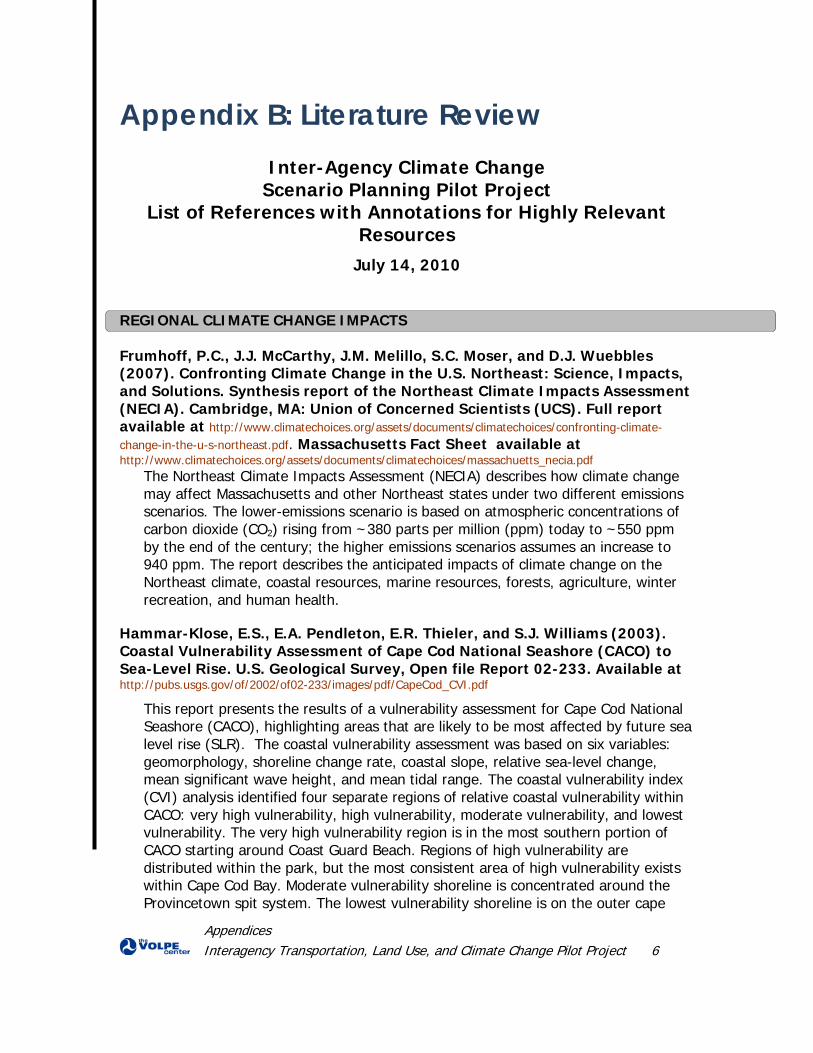
Appendices Interagency Transportation, Land Use, and Climate Change Pilot Project 6
Appendix B: Literature Review Inter-Agency Climate Change
Scenario Planning Pilot Project List of References with Annotations for Highly Relevant
Resources
July 14, 2010
REGIONAL CLIMATE CHANGE IMPACTS Frumhoff, P.C., J.J. McCarthy, J.M. Melillo, S.C. Moser, and D.J. Wuebbles (2007). Confronting Climate Change in the U.S. Northeast: Science, Impacts, and Solutions. Synthesis report of the Northeast Climate Impacts Assessment (NECIA). Cambridge, MA: Union of Concerned Scientists (UCS). Full report available at http://www.climatechoices.org/assets/documents/climatechoices/confronting-climate-change-in-the-u-s-northeast.pdf. Massachusetts Fact Sheet available at http://www.climatechoices.org/assets/documents/climatechoices/massachuetts_necia.pdf
The Northeast Climate Impacts Assessment (NECIA) describes how climate change may affect Massachusetts and other Northeast states under two different emissions scenarios. The lower-emissions scenario is based on atmospheric concentrations of carbon dioxide (CO2) rising from ~380 parts per million (ppm) today to ~550 ppm by the end of the century; the higher emissions scenarios assumes an increase to 940 ppm. The report describes the anticipated impacts of climate change on the Northeast climate, coastal resources, marine resources, forests, agriculture, winter recreation, and human health.
Hammar-Klose, E.S., E.A. Pendleton, E.R. Thieler, and S.J. Williams (2003). Coastal Vulnerability Assessment of Cape Cod National Seashore (CACO) to Sea-Level Rise. U.S. Geological Survey, Open file Report 02-233. Available at http://pubs.usgs.gov/of/2002/of02-233/images/pdf/CapeCod_CVI.pdf
This report presents the results of a vulnerability assessment for Cape Cod National Seashore (CACO), highlighting areas that are likely to be most affected by future sea level rise (SLR). The coastal vulnerability assessment was based on six variables: geomorphology, shoreline change rate, coastal slope, relative sea-level change, mean significant wave height, and mean tidal range. The coastal vulnerability index (CVI) analysis identified four separate regions of relative coastal vulnerability within CACO: very high vulnerability, high vulnerability, moderate vulnerability, and lowest vulnerability. The very high vulnerability region is in the most southern portion of CACO starting around Coast Guard Beach. Regions of high vulnerability are distributed within the park, but the most consistent area of high vulnerability exists within Cape Cod Bay. Moderate vulnerability shoreline is concentrated around the Provincetown spit system. The lowest vulnerability shoreline is on the outer cape
Appendices Interagency Transportation, Land Use, and Climate Change Pilot Project 7
from Head of the Meadow Beach south to Marconi Beach. The study determined that the most influential variables in the CVI are geomorphology and regional coastal slope. As a result, those two variables may be considered the dominant factors controlling how CACO will evolve as sea level rises.
Kirshen, P., C. Watson, E. Douglas, A. Gontz, J. Lee, and Y. Tian (2007). Coastal Flooding in the Northeastern United States due to Climate Change. Mitigation and Adaptation Strategies for Global Change 13: 437-451. Available at http://www.northeastclimateimpacts.org/pdf/miti/kirshen_et_al.pdf
This study estimates the change in recurrence intervals of storm surges in the northeastern United States due to possible SLR scenarios. At five sea level stations in the United States, from Massachusetts to New Jersey, SLR trends and tidal effects were removed from the hourly sea level time series and then a frequency analysis was performed on the positive remaining anomalies that represent storm surge heights. Then using eustatic SLR estimates for lower and higher greenhouse gas (GHG) emissions scenarios (SRES B1, and SRES A1fi, respectively) and assumed trends in local SLR, new recurrence intervals were determined for future storm surges. The historical local SLR for Woods Hole was found to be 1.0 mm/year. The study results found that, under the lower emission scenario, the recurrence interval of the present 100-year storm surge in Woods Hole will be less than 50 years by 2050, and 35 years or less by 2100. Under the higher emission scenario, the recurrence interval will be 35 years by 2050 and less than every 2 years by 2100.
Suarez, P., W. Anderson, V. Mahal, and T.R. Lakshmana (2005). Impacts of flooding and climate change on urban transportation: A system-wide performance assessment of the Boston Metro Area. Transportation Research Part D 10:231-244. Available at http://www.sciencedirect.com/science?_ob=ArticleURL&_udi=B6VH8-4G4PC3C-1&_user=10&_rdoc=1&_fmt=&_orig=search&_sort=d&view=c&_acct=C000050221&_version=1&_urlVersion=0&_userid=10&md5=61aec9a88e7a386b83167997237fc729
This paper addresses the potential impact of climate change on the performance of the surface transportation system in the Boston Metro Area, with particular focus on transportation disruption. In order to understand the magnitude of transportation disruption the study simulated the effects of flooding and climate change using Boston’s Urban Transportation Modeling System (UTMS). The model was first run under normal circumstances to provide baseline values for the volume of travel and the amount of time spent in travel. A set of flooding scenarios was then designed to identify: 1) areas that are flooded so that no trips begin or end there, and 2) network links that become impassable. Flooding scenarios were developed based on combinations of the year of the simulation, the area flooded (no flooding, 100-year, or 500-year floodplain based on Flood Insurance Rate Maps), and type of flooding (coastal, riverine, or both). Over the period 2000–2100, the results indicate that delays and trips lost increase by 80 and 82 percent respectively under the climate change scenario.
Appendices Interagency Transportation, Land Use, and Climate Change Pilot Project 8
Thieler, E.R., J. O’Connell, and C. Schupp (2001). Massachusetts Shoreline Change Project: 1800s to 1994. Available at http://www.mass.gov/czm///hazards/pdf/shorelinechangetechnicalreport.pdf. Maps and data tables available from the Massachusetts Ocean Resource Information System (MORIS) available at http://www.mass.gov/czm/mapping/index.htm
The goal of the Massachusetts Office of Coastal Zone Management (CZM) Shoreline Change Project is to develop and distribute scientific data that will help inform local land use decisions. In a previous phase of the Shoreline Change Project, CZM completed a statistical analysis from the mid-1800s to 1978 for Massachusetts ocean-facing coastline and produced 76 maps that demonstrate long-term shoreline change. In 2001, CZM updated the Shoreline Change Project maps using 1994 NOAA aerial photographs of the Massachusetts shoreline. The new maps and statistical analysis of shoreline change now cover the time period from the mid-1800s to 1994. The 76 1:10,000-scale shoreline change maps show the relative positions of four to five historic shorelines and depict the long-term change rate at 40-meter intervals along the shore.
TRANSPORTATION AND CLIMATE CHANGE (MITIGATION AND ADAPTATION)
Bryn, P., Z. Wadud, and A. Greszler (2010). Modal Primer on Greenhouse Gas and Energy Issues for the Transportation Industry: Road Transportation. Transportation Research Board, Circular Number E-C143. Available at http://onlinepubs.trb.org/onlinepubs/circulars/ec143.pdf.
Road transportation is responsible for roughly three-fourths of the GHG emissions produced by U.S. transportation systems as a result of high levels of vehicle activity enabled by largely auto-centric planning and a lack of alternative modes. Federal government agencies have several options for encouraging reductions in GHG emissions from road transportation, including promoting cleaner fuel sources and technologies that improve fuel efficiency. federal, state, and local government agencies can all support more indirect methods of reducing GHG emissions from road transportation by introducing pricing schemes and regulations to reduce fuel consumption (through fewer vehicle miles travelled and/or more efficient driving) and promoting alternative forms of transportation and coordinated land use and transportation planning.
Cambridge Systematics, Inc (2009). Moving Cooler: An Analysis of Transportation Strategies for Reducing Greenhouse Gas Emissions. Washington, D.C.: Urban Land Institute. Available at http://www.movingcooler.info/
This study assesses the potential effectiveness of almost 50 transportation strategies to reduce GHG emissions by reducing the amount of vehicle travel that occurs, by inducing people to use less fuel-intensive means of transportation, or by reducing the amount of fuel consumed during travel through transportation system improvements. Each strategy is assessed individually, and then combined into six “strategy bundles” to determine the potential cumulative effects that could be
Appendices Interagency Transportation, Land Use, and Climate Change Pilot Project 9
achieved. Each strategy is analyzed based on its effectiveness of reducing GHG emissions against a baseline, which for 2010 to 2050 is 104 percent of 2005 emissions. The analysis of the different bundles found that the strategies that contribute the most to GHG reductions are local and regional pricing and regulatory strategies that increase the costs of single occupancy vehicle travel, regulatory strategies that reduce and enforce speed limits, educational strategies to encourage eco-driving behavior that achieves better fuel efficiency, land use and smart growth strategies that reduce travel distances, and multimodal strategies that expand travel options. The analysis also shows that some combinations of strategies could create synergies that enhance the potential reductions of individual measures. In particular, land use changes combined with expanded transit services achieve stronger GHG reductions than when only one option is implemented.
ICF International (2008). Integrating Climate Change into the Transportation Planning Process. Prepared for the Federal Highway Administration. Available at http://www.fhwa.dot.gov/hep/climatechange/climatechange.pdf
With GHG emissions causing changes to the climate, transportation agencies recently began to see the need to incorporate mitigation and adaptation opportunities into their planning activities. Current discussion of climate change in transportation plans ranges from cursory to comprehensive but more often refer to mitigation rather than adaptation. Although agencies face no statutory barriers to incorporating climate change into their long range transportation plans, small agencies in particular could benefit from involvement and guidance from federal agencies on climate change issues and see accurate and regional emissions inventories as another significant need. One of the most promising strategies for reducing transportation GHG emissions through transportation planning is integrated transportation and land use planning, though it presents some limitations. Metropolitan planning organizations (MPOs) and state departments of transportation (DOTs) do not generally have enough authority to implement such a strategy independently, but can engage other agency partners to draft a climate action plan that targets reduced GHG emissions. Adaptation to climate change lags among MPOs and DOTs, largely because they lack requisite information about the nature, scale, and timeframe of anticipated climate change impacts. This trend will likely change as additional studies generate more precise estimates of climate change impacts.
Savonis, M.J., V.R. Burkett, and J.R. Potter (2008). Impacts of Climate Change and Variability on Transportation Systems and Infrastructure: Gulf Coast Study, Phase I. Synthesis and Assessment Product 4.7 of the U.S. Climate Change Science Program and the Subcommittee on Global Change Research. Available at: http://www.climatescience.gov/Library/sap/sap4-7/final-report/sap4-7-final-all.pdf
This research effort, sponsored by the U.S. Department of Transportation (USDOT), the U.S. Geological Survey (USGS), and the U.S. Climate Change Science Program (CCSP) examines the anticipated impacts of climate change on the transportation systems that stretch from Houston, TX, to Mobile, AL. The anticipated effects of climate change for this region are similar to those predicted nationally, and include
Appendices Interagency Transportation, Land Use, and Climate Change Pilot Project 10
elevating temperatures, rising sea level, and increases in storm frequency and intensity (although the direction of change for overall rainfall levels is unclear). The primary applied impacts of these effects on transportation include degradation of materials under higher temperatures, disruption of service due to flooding events, and damage to infrastructure from SLR-related inundation and storm surges. The authors suggest that, although state and local transportation engineers will have to assess and address these impacts on a facility-specific basis, broader efforts now can help minimize the impacts of climate change on transportation systems. In particular, long range transportation planning should consider a timeframe commensurate with the expected useful life of infrastructure, which is generally longer than the 20 to 30 year windows commonly used by transportation agencies. Planning efforts should also integrate climate change into meeting the existing challenges of safety, congestion, and environmental stewardship. In order to do this, transportation agencies will need to work collaboratively with the scientific community to develop higher-resolution climate change models that are accurate on regional and sub-regional levels.
Transportation Research Board (2008). Potential Impacts of Climate Change on U.S. Transportation. Transportation Research Board Special, Committee on Climate Change and U.S. Transportation, Report 290. Available at http://onlinepubs.trb.org/onlinepubs/sr/sr290.pdf
This Transportation Research Board Special Report summarizes the scientific consensus on climate change effects, their anticipated impacts on U.S. transportation systems, and recommended adaptation strategies for transportation agencies. The effects of climate change have already begun and will continue to escalate over the next several decades as a result of GHG emissions that have already been released into the atmosphere. The report estimates that the most relevant impacts of climate change for U.S transportation will be rising peak and mean temperatures (5.4°F to 9.0°F by 2099), rising sea levels (7.1 to 23.2 inches by 2099, not including uplift along the New England Coast), and increased intensity and frequency of precipitation. Although coastal transportation systems are most at risk to these impacts, transportation infrastructure in both coastal and inland areas may be susceptible to damage from more dramatic heat extremes and weather events. As a result, the authors recommend that transportation agencies inventory critical infrastructure in light of projected climate change impacts and incorporate such impacts into long-term design, maintenance, operations, and emergency plans. Members from the transportation and scientific communities should also collaborate to generate the climate data needed for transportation planning, which could be incorporated into decision support tools like scenario planning.
U.S. Department of Transportation (2010). Transportation’s Role in Reducing U.S. Greenhouse Gas Emissions: Volume 1 Synthesis Report, Report to Congress. Available at http://ntl.bts.gov/lib/32000/32700/32779/DOT_Climate_Change_Report_-_April_2010_-_Volume_1_and_2.pdf
The in-use GHG emissions from transportation (which does not include transportation lifecycle processes like fuel or vehicle production) represents 29
Appendices Interagency Transportation, Land Use, and Climate Change Pilot Project 11
percent of the U.S.’s total GHG emissions, though transportation accounts for about one half of the U.S.’s increase in GHG emissions since 1990. This report identifies several strategies for U.S. transportation to reduce its contribution to global GHG emissions that can be implemented at different levels of government. While federal and state agencies can promote the use of low-carbon fuels and more efficient vehicles, agencies at all levels to work to improve overall system efficiency and encourage cleaner forms of travel. These strategies (and their associated GHG reduction factors) include lower speed limits (two percent), pricing strategies like increased fuel taxes or pay-as-you-drive insurance (three percent), land use changes increased availability of alternate travel modes (two to five percent by 2030; three to ten percent by 2050), and education efforts to encourage more efficient driving habits (one to four percent). Transportation and planning agencies can also promote more integrated planning strategies that support compact, mixed-use development with greater modal choice in order to reduce trip distance and frequency and increase transportation efficiency. Transportation planning, in particular, provides many opportunities for the federal government to help state and local governments address their transportation system’s role in climate change.
MASSACHUSETTS STATE CLIMATE CHANGE POLICY
Eastern Research Groups, Inc (2010). Cost-Effective Greenhouse Gas Mitigation in Massachusetts: An Analysis of 2020 Potential. Available at http://www.mass.gov/dep/air/climate/erg2020.pdf.
Federal and state policies enacted and planned since 2007 put Massachusetts on the path to achieve a 19 percent reduction in emissions by 2020. This report looks at the potential for further cost-effective GHG emissions reductions beyond the state’s existing GHG reduction policies. To identify potential reductions, the study analyzed readily quantifiable measures that could be taken at low or zero cost, or at a net savings to the state, for the major emitting sectors – transportation, electricity, residential and commercial buildings, industry, and solid waste. For the transportation sector, three sources of potential emissions reductions were analyzed: 1) reducing the growth rate of vehicle miles traveled (VMT), 2) improving vehicle fuel efficiency, and 3) changes in driving behavior to improve miles per gallon. The study concluded that the total cost‐effective potential for reductions in transportation sector emissions in 2020 associated with reduced VMT growth, improved fuel efficiency, and improved driving practices is 4.6 MMtCO2e (million metric tons of CO2 equivalent) of avoided GHG emissions.
Massachusetts Department of Environmental Protection (2009). Statewide Greenhouse Gas Emissions Level: 1990 Baseline and 2020 Business as Usual Projection. Available at http://www.mass.gov/dep/air/climate/1990_2020_final.pdf
The Massachusetts Global Warming Solutions Act, signed into law in August 2008, established the Climate Protection and Green Economy Act in Massachusetts General Law. This law requires the Massachusetts Department of Environmental Protection (DEP) to determine the statewide greenhouse gas emissions level in 1990 and
Appendices Interagency Transportation, Land Use, and Climate Change Pilot Project 12
reasonably project GHG emissions for 2020 under a business as usual scenario. The state’s economy-wide GHG emissions in 1990 were 94 MMTCO2e. The sources of GHG emissions used to determine the 1990 baseline are: combustion of fossil fuels (89.8 MMTCO2e), industrial processes (0.7 MMTCO2e), agriculture (0.4 MMTCO2e), and waste management (3.6 MMTCO2e). Modeling results show that in a business as usual scenario, without any new climate related policies since 2007, emissions would remain relatively steady from the present through 2020 (i.e. 94 MMTCO2e). The DEP used the US Environmental Protection Agency’s State GHG Inventory Tool to estimate emissions for both the 1990 baseline and the 2020 projection.
CAPE COD REGIONAL PLANS
Cape Cod Commission (2010). Draft 2010 Barnstable County Cape Cod, Massachusetts Multi-Hazard Mitigation Plan. Available at http://www.capecodcommission.org/planning/RegionalMHMplan_update2010.pdf
The Barnstable County Multi-Hazard Mitigation Plan was created with the 15 local governments of Cape Cod and in consultation with the Regional Multi-Hazard Community Planning Team (MHCPT) in order to identify hazards that affect the region and strategies for mitigating those hazards. The plan includes the impacts of climate change in its definition of hazard, including SLR and increased intensity and frequency of storms and precipitation. In fact, the plan identifies flooding and shoreline change, both of which are likely to be exacerbated by the future effects of climate change, as the two most serious hazards to threaten Cape Cod. Heavy precipitation events and storm surges will increase in frequency and intensity, threatening to incapacitate transportation infrastructure, drinking water supplies, and wastewater facilities. Route 6A, a main evacuation route on Cape Cod, crosses many tidal creeks and marshes, which could isolate the communities that it serves during SLR, storm surge, or heavy precipitation-induced flooding. A potential benefit of future climate change impacts is a reduced likelihood of drought due to a projected five to eight percent increase in precipitation by 2050. This increase in precipitation will also reduce the threat of wildfires on Cape Cod. A secondary impact of increasing temperatures could benefit Cape Cod’s economy but also threaten to overwhelm its infrastructure. An increase in the number of very hot days could boost the regions summer vacation population, which would introduce additional strain on transportation and water systems. In order to meet several objectives of the plan that relate to climate change, the Regional MHCPT recommends that agencies develop and adopt regional and local climate adaptation plans.
Cape Cod Commission (2009). Cape Cod Regional Policy Plan. Available at http://www.capecodcommission.org/RPP/RPP-Effective01-16-09.pdf
The Cape Cod Regional Policy Plan (RPP) is a planning and regulatory document for Barnstable County that identifies a growth policy for Barnstable County. The RPP’s stated growth policy is to guide growth toward areas that are adequately supported by infrastructure and away from areas that must be protected for ecological, historical, or other reasons. The RPP identifies 32 goals in the areas of growth management, natural system and human/built systems. For each goal, the RPP
Appendices Interagency Transportation, Land Use, and Climate Change Pilot Project 13
recommends actions for the Commission and Cape towns to take, establishes minimum performance standards, and identifies best development practices to achieve the stated goal. The RPP also identifies key resources of regional importance, and contains GIS maps of those resources. Available maps include: regional land use vision, infrastructure and economic development, water resources, open space, significant natural resource areas, waste management facilities, wetlands and buffers, and more.
Cape Cod Commission (2007 and 2010). Regional Transportation Plan. Available at http://www.gocapecod.org/rtp/
The Cape Cod Regional Transportation Plan (RTP) contains overview information as well as projects, programs, and studies for Cape Cod’s transportation system extending from the years 2007 through 203030. Cape Cod contains 2,589.73 miles of roads, of which 65.1 percent are owned by local towns and 7.8 percent are owned by Massachusetts DOT Highway. The remaining roads are owned in small percentages by the county, other state and federal agencies, and private entities. The RTP identifies congestion as the region’s largest current and future problem, though it also sets safety and security, multimodal accessibility, system maintenance, environmental protection, community orientation, equitability, and cooperation among stakeholders as its goals. Congestion is particularly a problem during the summer, when the proportion of non-Cape Cod registered vehicles along Route 6 nearly doubles. Among the possible strategies for achieving the goals established in the RTP are transit-oriented development, congestion pricing on major routes, deployment of alternative modes of transportation, and transportation planning that emphasizes local development.
SCENARIO PLANNING
Bartholomew, K. (2005). Integrating Land Use Issues into Transportation Planning: Scenario Planning. University of Utah, prepared for Federal Highway Administration. Available at http://faculty.arch.utah.edu/bartholomew/SP_SummaryRpt_Web.pdf
Scenario planning processes have recently been employed by a number of U.S. cities, towns, and MPOs to evaluate quantitative impacts of possible development outcomes. Scenario planning evolved out of military and business applications, where it was used to evaluate relationships between external influences and assess a range of options. Traditional transportation planning, on the other hand, largely ignores the interaction between land use patterns and transportation systems. MPOs and local governments most commonly conduct scenario planning exercises, often with the intent of avoiding sprawl and its associated consequences. Given the involvement of MPOs, scenario planning efforts commonly result in a transportation or development plan or policy, though some initiatives do not result in any action.
30 Chapter 1 is a draft from the 2010 Regional Transportation Plan, whose timeframe extends from 2011 through 2035.
Appendices Interagency Transportation, Land Use, and Climate Change Pilot Project 14
Based on a review of existing literature and scenario planning studies, Bartholomew recommends developing four scenarios in order to avoid the perception that two scenarios represent good and bad, three scenarios represent a high/medium/low ranking, or the overwhelming nature of five or more scenarios. Scenario titles should also not convey a positive or negative bias; Bartholomew cites “Urban Sprawl”, “Business as Usual”, “Wise Growth”, and “Quality of Life” as names that express an agency’s preference.
Bartholomew, K., and R. Ewing (2007). Land Use-Transportation Scenario Planning in an Era of Global Climate Change. University of Utah and University of Maryland. Available at http://faculty.arch.utah.edu/bartholomew/Bartholomew_Ewing_Revision.pdf
Transportation is one of the leading and fastest-growing contributors to GHG emissions in the country, in no small part due to historical land use patterns. Urban sprawl has increased VMT while reducing the acreage of forest that can capture CO2 emissions. Compact land development can potentially curb these trends, the benefits of which can be quantified through a scenario planning process that compares a status quo development future to a range of feasible alternatives. An analysis of 23 scenario planning efforts revealed a median VMT reduction of 5.7 percent, at least in part due to a median increase in density of 13.8 percent. Despite these somewhat modest projections, ranges of +5.2 to -31.7 percent change in VMT and -14.8 to +64.3 percent change in density indicate the wide array of possible development alternatives that scenario planning can present. Despite the effectiveness of scenario planning in projecting volume changes as a result of land use changes, the scenario planning efforts surveyed for this report generally lacked accurate analyses of the CO2 emissions reductions that could be expected to accompany those changes. The authors suggest that regional scenario planning efforts should integrate all factors that have the potential to influence travel patterns.
ADDITIONAL REFERENCES
Ashton, A.D., J.P. Donnelly, and R.L. Evans. A Discussion of the Potential Impacts of Climate Change on the Shorelines of the Northeastern USA. Prepared for the Northeast Climate Impacts Assessment, Union of Concerned Scientists by the Woods Hole Oceanographic Institution. Available at http://www.northeastclimateimpacts.org/pdf/tech/ashton_et_al.pdf.
Brekke, L.D. et al. (2009). Climate Change and Water Resources
Management: A Federal Perspective. U.S. Geological Survey. Circular 1331. Available at http://pubs.usgs.gov/circ/1331/Circ1331.pdf.
Cambridge Systematics, Inc. (2009). Transportation Adaptation to Global
Climate Change. Washington, D.C.: Bipartisan Policy Center. Available at http://www.bipartisanpolicy.org/sites/default/files/Transportation%20Adaptation%20(3).pdf.
Appendices Interagency Transportation, Land Use, and Climate Change Pilot Project 15
Cape Cod Commission (2007). Cape Cod Emergency Preparedness Handbook. Available at http://www.capecodcommission.org/emergencyprephandbook/EmergencyHandbook1007a.pdf.
Cape Cod Commission (2009). Cape Cod Traffic Counting Report 2009.
Available at http://www.gocapecod.org/counts/pdf_count/TCR2009.pdf. Clarke, L.E. et al. (2007). Scenarios of Greenhouse Gas Emissions and
Atmospheric Concentration. U.S. Climate Change Science Program Synthesis and Assessment Product 2.1a. Available at http://www.climatescience.gov/Library/sap/sap2-1/finalreport/sap2-1a-final-all.pdf.
Climate Change Work Group (2008). The Role of Coastal Zone Management
Programs in Adaptation to Climate Change. Coastal States Organization. Available at http://www.coastalstates.org/uploads/PDFs/CSO%202008%20Climate%20Change%20Report.pdf.
Coastal Hazards Commission (2007). Preparing for the Storm:
Recommendations for Management of Risk from Coastal Hazards in Massachusetts. Massachusetts Office of Coastal Zone Management. Available at http://www.mass.gov/czm/chc/recommendations/chc_final_report_2007.pdf.
Coastal Services Center (2009). Hazard Exposure Information for Barnstable
County, MA. National Oceanic and Atmospheric Administration. Available at http://csc-s-maps-q.csc.noaa.gov/CountySnapshots/reports/CountySnapshot_25001.pdf.
Committee for Study on Transportation Research Programs to Address Energy
and Climate Change (2009). A Transportation Research Program for Mitigating and Adapting to Climate Change and Conserving Energy. Transportation Research Board Special Report 299. Available at http://onlinepubs.trb.org/onlinepubs/sr/sr299.pdf.
Commonwealth of Massachusetts (2010). Draft Climate Implementation Plan:
A framework for meeting the 2020 and 2050 goals of the Global Warming Solutions Act. Massachusetts Executive Office of Energy and Environmental Affairs. Available at http://www.mass.gov/dep/air/climate/draftcip.pdf.
Cox, J. et al. (2006). Social Vulnerability to Climate Change: A Neighborhood
Analysis of the Northeast U.S. Megaregion. Union of Concerned Scientists Northeast Climate Change Impact Study. Available at http://www.northeastclimateimpacts.org/pdf/tech/cox_et_al.pdf.
Dempsety, R., and A. Fisher (2005). Information Tools for Community
Adaptation to Changes in Climate or Land Use. Consortium for Atlantic Regional Assessment.
Appendices Interagency Transportation, Land Use, and Climate Change Pilot Project 16
Environment Northeast (2006). Climate Change Roadmap for New England and Eastern Canada: Chapter 2, Transportation: 132-196. Available at http://www.env-ne.org/public/resources/pdf/Roadmap_Transportation_Chapter.pdf.
Environmental Protection Agency (2010). Climate Change Indicators in the
United States. Available at http://www.epa.gov/climatechange/indicators.html. Fogarty, M. et al. (2007). Potential Climate Change Impacts on Marine
Resources of the Northeastern United States. Northeast Climate Impacts Assessment. Available at http://www.capecodcommission.org/bylaws/Coastal_Floodplain_Bylaw_Dec2009.pdf.
Frederick, K. (1997). Water Resources and Climate Change. Climate Issues
Brief No. 3. Available at http://www.rff.org/rff/documents/rff-ccib-03.pdf. Grant, M. et al. (2010). Assessing Mechanisms for Integrating Transportation-
Related Greenhouse Gas Reduction Objectives into Transportation Decision Making. NCHRP Web-Only Document 152. Available at http://onlinepubs.trb.org/onlinepubs/nchrp/nchrp_w152.pdf.
Gutierrez, B.T., J.S. Williams, and R.E. Theiler (2009). Basic Approaches for
Shoreline Change Projections. Coastal Sensitivity to Sea-Level Rise: A Focus on the Mid-Atlantic Region: 239-242. Available at http://climatescience.gov/Library/sap/sap4-1/final-report/sap4-1-final-report-Appendix2.pdf.
Haas, P. et al. (2010). Transit Oriented Development and The Potential for
VMT-related Greenhouse Gas Emissions Growth Reduction. Prepared by the Center for Neighborhood Technology for the Center for Transit Oriented Development. Available at http://www.cnt.org/repository/TOD-Potential-GHG-Emissions-Growth.FINAL.pdf.
Hayhoe, K. et al. (2006). Past and future changes in climate and hydrological
indicators in the U.S. Northeast. Available at http://www.northeastclimateimpacts.org/pdf/tech/hayhoe_et_al_climate_dynamics_2006.pdf.
Hayhoe, K., et al. (2007). Regional Climate Change Projects for the Northeast
U.S. Mitigation and Adaptation Strategies for Global Change, June 2008: 425-436. Available at http://www.northeastclimateimpacts.org/pdf/miti/hayhoe_et_al.pdf.
Kirshen, P. et al. (2004). Infrastructure Systems, Services and Climate
Change: Integrated Impacts and Response Strategies for the Boston Metropolitan Area. Tufts University, University of Maryland, Boston University, and Metropolitan Area Planning Council. Available at http://www.pewtrusts.org/uploadedFiles/wwwpewtrustsorg/Reports/Global_warming/040813Climate_Change_Boston.pdf.
Appendices Interagency Transportation, Land Use, and Climate Change Pilot Project 17
Lowe, J. A. and J. M. Gregory (2010). A sea of uncertainty: How well can we predict future sea level rise? Nature Reports Climate Change, April 2010: 42-43. Available at http://www.nature.com/climate/2010/1004/full/climate.2010.29.html.
Massachusetts Emergency Management Agency (2009). Cape Cod Emergency
Traffic Plan. Available at http://www.mass.gov/?pageID=eopsterminal&L=3&L0=Home&L1=Public+Safety+Agencies&L2=Massachusetts+Emergency+Management+Agency&sid=Eeops&b=terminalcontent&f=mema_hurricane_cape_cod_emergency_traffic_plan&csid=Eeops.
Masterson, J.P. (2004). Simulated Interaction Between Freshwater and
Saltwater and Effects of Ground-Water Pumping and Sea-Level Change, Lower Cape Cod Aquifer System, Massachusetts. U.S. Geological Survey. Scientific Investigations Report 2004-5014. Available at http://pubs.usgs.gov/sir/2004/5014/pdf/sir200405014.pdf.
Meyer, M.D. (2008). Design Standards for U.S. Transportation Infrastructure:
The Implications of Climate Change. Georgia Institute of Technology. Available at http://ntl.bts.gov/lib/32000/32100/32150/sr290Meyer.pdf.
Moomaw, W. and L. Johnston (2007). Emissions Mitigation Opportunities and
Practice in Northeastern United States. Mitigation and Adaptation Strategies for Global Change, June 2008: 615-642. Available at http://www.northeastclimateimpacts.org/pdf/miti/moomaw_and_johnston.pdf.
Nakićenović, N. et al. (2000). IPCC Special Report, Emissions Scenarios:
Summary for Policymakers. Intergovernmental Panel on Climate Change. Available at http://www.ipcc.ch/pdf/special-reports/spm/sres-en.pdf.
New England Regional Assessment (2002). U.S. Global Change Research
Program. Available at http://www.necci.sr.unh.edu/2001-NERA-Foundation-Doc.html. O’Connell, J.F. and S. Justus (2009). Model Bylaw For Effectively Managing
Coastal Floodplain Development. Woods Hole Sea Grant, University of Hawaii Sea Grant, and the Cape Cod Commission. Available at http://www.capecodcommission.org/bylaws/Coastal_Floodplain_Bylaw_Dec2009.pdf.
Rahmstorf, S. (2010). A new view on sea level rise. Nature Reports Climate
Change, April 2010: 44-45. Available at http://www.nature.com/climate/2010/1004/full/climate.2010.29.html.
Ramsey, J. et al. (2005). South Shore Coastal Hazards Characterization Atlas
Description of Variables. Prepared for Massachusetts Office of Coastal Zone Management by Applied Coastal Research and Engineering, Inc. Available at http://www.mass.gov/czm/hazards/ss_atlas/pdf/ss_atlas_variables_report.pdf.
Appendices Interagency Transportation, Land Use, and Climate Change Pilot Project 18
Suarez, P. et al. (2005). Impacts of flooding and climate change on urban transportation: A systemwide performance assessment of the Boston Metro Area. Transportation Research Part D: Transport and Environment, May 2005: 231-244. Available at http://www.sciencedirect.com/science?_ob=ArticleURL&_udi=B6VH8-4G4PC3C-1&_user=10&_rdoc=1&_fmt=&_orig=search&_sort=d&view=c&_acct=C000050221&_version=1&_urlVersion=0&_userid=10&md5=61aec9a88e7a386b83167997237fc729.
Theiler, R. et al. (2003). The Future of Falmouth’s South Shore. Report of the
Coastal Resources Working Group to the Board of Selectmen, Falmouth, MA. Available at http://www.falmouthmass.us/coastal/crwg_falmouth_report.pdf.
U.S. Climate Change Science Program (2008). Human Health and Welfare in a
Changing Climate: Summary and Findings of the U.S. Climate Change Science Program. Available at http://www.climatescience.gov/Library/sap/sap4-6/final-report/sap4-6-brochure-FAQ.pdf.
United States Global Change Research Program (2009). Regional Climate
Impacts: Northeast. 107-110. Available at http://www.globalchange.gov/images/cir/pdf/northeast.pdf.
Venner, M and Santalucia, A. (2010). Environmental Corridor Management. NCHRP 25-25/63. Available at http://onlinepubs.trb.org/onlinepubs/nchrp/docs/NCHRP25-25%2863%29_FR.pdf
Appendices Interagency Transportation, Land Use, and Climate Change Pilot Project 19
Appendix C: Request for Proposal
STATEMENT OF WORK
SCENARIO PLANNING FOR THE INTERAGENCY CLIMATE CHANGE SCENARIO PLANNING PILOT PROJECT
AUGUST 9, 2010
1. PURPOSE
The Volpe National Transportation Systems Center (Volpe Center) is a Federal fee-for-service organization within the Research and Innovative Technology Administration (RITA) of the U.S. Department of Transportation (DOT). The Volpe Center’s mission is to improve the safety, security, and efficiency of the nation’s transportation systems while minimizing its environmental impact.
Proposed by members of the Interagency Working Group on Transportation, Land Use, and Climate Change, the Interagency Climate Change Scenario Planning Pilot Project is an initiative designed to bring together multiple federal agencies and local, regional, and state stakeholders to work towards a shared and practical future transportation and land use development strategy. The strategy will consider potential transportation and land-use impacts of climate change, specifically sea level rise (SLR), while integrating measures aimed at reducing the region’s greenhouse gas (GHG) emissions. A scenario planning process will be used to develop the most desirable transportation and land use development strategy.
The Volpe Center seeks a contractor to provide a transportation- and land use-focused scenario planning software tool and technical scenario planning expertise in support of the Interagency Climate Change Scenario Planning Pilot Project. The contractor will support specific aspects of this project as outlined in the “Description of Services” section below. 2. BACKGROUND
The goals of the Interagency Climate Change Scenario Planning Pilot Project are to reduce future GHG emissions from the transportation sector and to estimate the impacts of climate change on land use and transportation infrastructure. As a result of the scenario planning process, the project’s outcome will be a transportation- and land use-focused development strategy that anticipates certain estimated climate change impacts and has the goal to reduce future GHG emissions. These results can be integrated into the region’s long-range transportation and local, state, and federal agency plans.
Federal agencies involved with the Interagency Climate Change Scenario Planning Pilot Project include the Federal Highway Administration (FHWA), the National Park Service
Appendices Interagency Transportation, Land Use, and Climate Change Pilot Project 20
(NPS), the Federal Transit Administration (FTA), the Fish and Wildlife Service (FWS), the National Oceanic and Atmospheric Administration (NOAA), the Environmental Protection Agency (EPA), the Federal Emergency Management Agency (FEMA), and the Department of Defense. Several state, regional, and local agencies are also involved with this pilot project.
Study Area
The study area for this project is defined as Cape Cod, Massachusetts. This region, which comprises Barnstable County, includes 15 towns. The Interagency Working Group selected Cape Cod as the location for this pilot project due to the presence of a number of gateway communities; its existing partnerships; presence of – and special area of concern for – several federal agencies; myriad yet geographically-bounded transportation, land use, and economic development issues; a high degree of recreational travel; coastal location; vulnerability to certain projected climate change effects, such as SLR; and its communities’ interests in sustainability. Interagency Support Planning Group
A planning group, composed of representatives from the federal agencies listed above and the Cape Cod Commission, sets the direction and oversees the progress of the pilot project. This group has a conference call at least once every three weeks. Specific roles/responsibilities of the planning group (from the charter) include:
• Provides general guidance and oversight of the pilot project • Invites participation in the Technical Committee • Incorporates Technical Committee input into decision-making • Guides the development of interim products and results • Reviews deliverables and interim products • Provides input into the crafting of development scenarios for Cape Cod
o Attend workshops o Review and inform results
• Communicates results and interim findings to federal agencies and other stakeholders
• Helps integrate results into constituent agencies’ long- and short-range plans • Provides feedback on pilot project process and areas for improvement/lessons
learned Technical Committee
A technical committee, composed of representatives from several federal, state, regional, and local agencies as well as a number of non-profit organizations, convenes conference calls on an as-needed basis. This committee provides technical input into the project,
Appendices Interagency Transportation, Land Use, and Climate Change Pilot Project 21
including geographic information systems (GIS) data and SLR and storm surge estimates. Specific roles/responsibilities of the technical committee (from the charter) include:
• Provides guidance to Planning Group regarding all technical issues • Identifies resources appropriate for literature review • Assists in data collection (primarily via GIS) and provides information on 1) ways
to integrate GHG emission mitigation measures into scenarios and 2) climate change effects and impacts
• Provides input into the desired targets, or end goals, for scenarios with regard to climate change emissions and other outcomes
• Provides input into the crafting of development scenarios for Cape Cod o Inform greenhouse gas emission estimates o Attend workshops o Review and inform results
• Communicates results and interim findings to state, regional, and local agencies and other stakeholders
• Helps integrate results into constituent agencies’ long- and short-range plans The Volpe Center
The Volpe Center provides staff for this project and performs the work described in the Interagency Climate Change Scenario Planning Pilot Project Scope of Work. Work and Accomplishments to Date/Government Furnished Information
The following documents will be provided as government furnished information at the time of award as context and additional background materials for the project. Interagency Scope of Work and Timeline
The Interagency Climate Change Scenario Planning Pilot Project Scope of Work describes all components of the work to be conducted as part of the Interagency Climate Change Scenario Planning Pilot Project. This Interagency Scope of Work was finalized in May 2010; the project has evolved and specified the component parts in more detail. The components of the Interagency Scope of Work include:
1. Coordinating stakeholders and documenting the project 2. Conducting a document and analysis review 3. Developing/identifying a GIS-based database 4. Developing scenarios 5. Evaluating the scenarios 6. Creating an implementation plan
Planning Group Charter, Roster, and Meeting Summaries
The planning group charter describes the roles and responsibilities of the planning group and how it interfaces with the technical committee. The roster lists contact information for the over 20 representatives from the eight federal agencies involved in the project.
Appendices Interagency Transportation, Land Use, and Climate Change Pilot Project 22
There are brief summaries for each of the tri-weekly teleconferences that have been held since the middle of February 2010. Technical Committee Charter, Roster, and Meeting Summaries
The technical committee charter describes the roles and responsibilities of the technical committee and how it interfaces with the planning group. The roster lists contact information for the over 30 representatives from the 12 state, regional, and local agencies and non-profit organizations involved in the project. There are brief summaries for each of the teleconferences that have been held as needed since the middle of May 2010. Literature/Data Review
The annotated literature/data review summarizes studies, reports, and data sources that are available to project participants; where available, links to these resources are provided. The purpose of this review is to ensure that the project builds on existing resources and does not duplicate work that has already been conducted. Estimated SLR Map
The planning group and technical committee determined that SLR impact estimates for the region should not be based on a simple inundation assumption for SLR because different parts of Cape Cod will be impacted by SLR in different ways. Accordingly, members of the technical committee and other coastal scientists participated in an expert elicitation to develop a GIS-based SLR vulnerability map of the region. The map was developed based on an expert assessment of likely coastal changes, using recent orthophotography, landform and geologic maps, and elevation data. GIS Data and Transportation Model Outputs
The Volpe Center will provide the contractor with available GIS land use data and transportation model outputs for the region. Transportation Measures and Priorities for GHG Mitigation
Members of the planning group and technical committee explored and identified relevant transportation measures and priorities specific to Cape Cod and to Massachusetts that will result in GHG emission reductions from the transportation sector. The group also identified likely national technology measures and priorities that will likely trickle down to the Cape. A list of these measures and priorities will be made available to participants in the scenario planning workshops.
Measures and priorities considered include but are not limited to different mixes of: • Conventional internal combustion engine technology, gas-electric hybrids, and
flexible fuel vehicles; • Low-carbon fuels, clean diesels, and clean diesels running on various biodiesel
blends;
Appendices Interagency Transportation, Land Use, and Climate Change Pilot Project 23
• Plug-in hybrids and all-electric vehicles running on various electricity supply mixes (ISO-New England electricity mix, renewable generation, etc.);
• Roadway hardware changes (lighting, highly retroreflective material, etc.); • Solar panels and wind generation in highway rights of way; • Operational improvements; and • Pricing strategies.
The penetration of these measures will be determined by scenario planning workshop participants. Implementation opportunities include but are not limited to constructing charging stations, plug-in hybrid or all-electric rental/share fleets centered at transport terminals, and biofuel-centered fueling stations and fleets.
Reducing vehicle miles traveled is another measure available to reduce GHG emissions. Opportunities to reduce vehicle miles traveled include but are not limited to increased transit, the re-institution of passenger rail, increased ferry service, and the construction of bike paths and lanes. While the group identified relevant options, the penetration of these measures will be determined by scenario planning workshop participants. 3. DESCRIPTION OF SERVICES Task 1: Provide Overview and Performance Indicators for Scenario Planning Process Task 1.1 Distribute a list of the universe of potential scenario performance indicators that the scenario planning software tool is able to evaluate to the planning group and technical committee. The scenario planning software tool shall have the ability to reflect/account for at least five key indicators: GHG emissions, transport energy use, congestion and vehicle miles traveled, cost to implement the scenario, and the preservation of natural/existing ecosystems.
Deliverable: • Listing, in Microsoft Word, of the universe of potential performance
indicators, including GHG emissions, transport energy use, congestion, cost to implement the scenario, and the preservation of natural/existing ecosystems, submitted to the Volpe Center Contracting Officer’s Technical Representative (COTR)/Project Lead for distribution to the planning group and technical committee
Task 1.2 Present an overview of the scenario planning software tool and the scenario planning methodology to be performed to members of the planning group and technical committee. This presentation shall be in Microsoft PowerPoint format, be presented as a webconference, and occur during the teleconference about performance indicators (as described in Task 1.3). The Microsoft PowerPoint slides shall be provided to the Volpe Center COTR at least two days before the webconference for distribution to members of the planning group and technical committee. The Volpe Center will provide access to a webconference platform.
Appendices Interagency Transportation, Land Use, and Climate Change Pilot Project 24
Deliverables: • Microsoft PowerPoint presentation of the scenario planning software tool
submitted to the Volpe Center COTR • Microsoft PowerPoint slides presented via webconference to members of the
planning group and technical committee Task 1.3 Participate in a teleconference with members of the planning group and technical committee as they select and prioritize performance indicators. The contractor will respond to questions and take notes on the agreed upon prioritization of performance indicators.
Deliverables: • Teleconference participation • Prioritized listing, in Microsoft Word, of performance indicators submitted to
the Volpe Center COTR for distribution to the planning group and technical committee
Task 2: Develop Baseline and Preliminary Scenarios Task 2.1 Determine and establish a baseline of existing land use, demographics, and existing transportation infrastructure and services on Cape Cod. The baseline shall be developed in GIS and reflect summer conditions on Cape Cod when tourism is at its peak. At a minimum, the baseline shall contain information on current vehicle trips by mode, vehicle miles traveled, zoning, and GHG emissions.
Deliverables: • Baseline GIS data layers containing information on zoning and transportation
infrastructure submitted to the Volpe Center COTR • Draft output report in Microsoft Word summarizing baseline regional data for
key performance indicators, including vehicle trips by mode, vehicle miles traveled, and GHG emissions submitted to the Volpe Center COTR 3 business days before due date; the Volpe Center COTR will provide comments/suggested revisions 2 business days before due date
• Final output report in Microsoft Word Task 2.2 Develop a status quo/trends-continued scenario using the scenario planning software tool. This scenario shall reflect current Cape Cod trends in transportation and land use being projected out 20 years. The contractor shall complete the development of this scenario, evaluate and describe this scenario in terms of the prioritized performance indicators, and provide the Volpe Center with a report that summarizes all assumptions and any issues at least one week prior to Workshop I.
Deliverables: • Status quo/trends continued scenario created using contractor’s scenario
planning software tool; resulting map(s) in ArcGIS submitted to Volpe Center COTR
Appendices Interagency Transportation, Land Use, and Climate Change Pilot Project 25
• Draft output report in Microsoft Word describing the status quo/trends continued scenario in terms of the key performance indicators, maps, and all assumptions and issues involved in developing this scenario submitted to the Volpe Center COTR 3 business days before due date; the Volpe Center COTR will provide comments/suggested revisions 2 business days before due date
• Final output report in Microsoft Word Task 2.3 Develop a current plans extended 20 years scenario using the scenario planning software tool. This scenario shall reflect the Cape Cod Commission’s Regional Land Use Vision Map (http://www.capecodcommission.org/RPP/capevision_rpp09_final.pdf) and transportation and land use policies described in the Commission’s Regional Policy Plan (http://www.capecodcommission.org/RPP/). The contractor shall complete the development of this scenario, evaluate and describe this scenario in terms of the prioritized performance indicators, and provide the Volpe Center with a report that summarizes all assumptions and any issues at least one week prior to Workshop I.
Deliverables: • Current plans extended continued scenario created using contractor’s scenario
planning software tool; resulting map(s) in ArcGIS submitted to Volpe Center COTR
• Draft output report in Microsoft Word describing the current plans extended scenario in terms of the key performance indicators, maps, and all assumptions and issues involved in developing this scenario submitted to the Volpe Center COTR 3 business days before due date; the Volpe Center COTR will provide comments/suggested revisions 2 business days before due date
• Final output report in Microsoft Word Task 2.4 Develop two “extreme” scenarios: dispersed/even development and intense/focused development. Both of these scenarios should be developed using the scenario planning software tool and extend 20 years. The purpose of developing these scenarios is to show workshop participants how these extreme scenarios compare with respect to the prioritized performance indicators and the status quo and plans extended scenarios. The contractor shall complete the development of these scenarios, evaluate and describe these scenarios in terms of the prioritized performance indicators, and provide the Volpe Center with a report that summarizes all assumptions and any issues at least one week prior to Workshop I.
Deliverables: • Two extreme development scenarios created using contractor’s scenario
planning software tool; resulting map(s) in ArcGIS submitted to Volpe Center COTR
• Draft output report in Microsoft Word describing the extreme scenarios in terms of the key performance indicators, maps, and all assumptions and issues involved in developing these scenarios submitted to the Volpe Center COTR 3 business days before due date; the Volpe Center COTR will provide comments/suggested revisions 2 business days before due date
Appendices Interagency Transportation, Land Use, and Climate Change Pilot Project 26
• Final output report in Microsoft Word Task 2.5 Integrate the technical committee’s GIS-based SLR vulnerability map into the scenario planning software tool.
Deliverable: • Integrated SLR vulnerability map into the contractor’s scenario planning
software tool; resulting map(s) in ArcGIS submitted to Volpe Center COTR Task 3: Prepare for Scenario Planning Workshops Task 3.1 Provide assistance in designing two consecutive scenario planning workshops – Workshop I (half day) and Workshop II (full day) – on Cape Cod. While the Volpe Center will lead the development of the agendas, the contractor shall work with the Volpe Center to design the agendas for these workshops. Members of the planning group and technical committee will also provide input on the agendas.
Deliverable: • Participation in formulating the agendas via teleconferences with the Volpe
Center project team Task 3.2 Travel to Cape Cod to participate in the scenario planning workshops. The contractor shall plan on a two- or three-night trip to Cape Cod to participate in Workshop I and Workshop II and include the travel cost in the budget. The workshops will be held in a conference room setting.
Deliverable: • Travel to and participation in two consecutive scenario planning workshops
Task 4: Participate in Scenario Planning Workshop I The contractor shall present information at the first scenario planning workshop, which will be a half-day in duration. All planning group and technical committee members will be invited to attend the workshop, but local stakeholders (i.e., representatives from the 15 towns, the county, the MPO, the National Seashore, the transit agency, etc.) will be the primary audience. An estimated 40 to 60 people will physically be in attendance. The Volpe Center will ensure speakerphone and webconference access are available for participants in remote locations and that a projector is available for the contractor to plug-in a laptop when presenting information to the attendees. The Volpe Center will facilitate the workshop. The contractor shall perform the following key tasks for this workshop. Task 4.1 The contractor shall present a brief overview of how the scenario planning software tool works and what land use and transportation typologies (zoning, levels of vehicle miles traveled, etc.) will be used.
Appendices Interagency Transportation, Land Use, and Climate Change Pilot Project 27
Deliverable: • Overview presentation using Microsoft PowerPoint and/or their scenario
planning software tool and verbal description of land use and transportation typologies presented to workshop attendees
Task 4.2 The contractor shall present the status quo/trends continued scenario, the current plans extended scenario, and the extreme scenarios as examples of how the scenario planning software tool works. The contractor shall describe how and why the scenarios compare and contrast vis-à-vis the prioritized indicators selected by the planning group and technical committee. The SLR vulnerability map/layer shall be layered on top of these scenarios in real-time in front of the participants so they can see how SLR will impact the scenarios.
Deliverable: • Presentation of four scenarios using Microsoft PowerPoint and/or their
scenario planning software tool and how and why they compare and contrast with the SLR vulnerability map layered on top presented to workshop attendees
Task 5: Participate in Scenario Planning Workshop II The contractor shall present information and develop scenarios at the second scenario planning workshop, which will be a full day in duration. The second workshop will be held on the day following the first workshop.
Similar to the first workshop, all planning group and technical committee members will be invited to attend the workshop, but local stakeholders (i.e., representatives from the 15 towns, the county, the MPO, the National Seashore, etc.) will be the primary audience. An estimated 40 to 60 people will physically be in attendance. The Volpe Center will ensure speakerphone and webconference access are available for participants in remote locations and that a projector is available for the contractor to plug-in a laptop when presenting information to the attendees. The Volpe Center will facilitate the workshop, but working with the Volpe Center, the contractor shall perform the following key tasks.
The goal of this workshop is to develop a preferred transportation and land use scenario. This scenario will generally identify preferred areas for growth and preservation and will incorporate transportation services and measures that will reduce GHG emissions compared to the status quo scenario. Task 5.1 The Volpe Center will divide the participants into four small/break-out groups.
1. Each group will develop its own scenario on how Cape Cod’s transportation and land use may change and develop over the next 20 years. The SLR vulnerability map/layer and the list of transportation measures to reduce GHG emissions will be provided to each group so they can account for SLR and the reduction of GHG emissions in the development of their scenario.
Appendices Interagency Transportation, Land Use, and Climate Change Pilot Project 28
2. Each group shall be equipped with a contractor-provided laptop loaded with the scenario planning software tool and hardcopy, poster-sized maps to develop their own scenarios in real-time. Four laptops will be necessary.
3. The contractor shall guide and assist in the development of scenarios being crafted by each of the small/break-out groups.
4. Contractor staff shall be stationed at and operate each laptop/tool or shall train Volpe Center staff to operate each laptop/tool in advance of the workshop in a half-day training session held over the phone and via a webinar. The Volpe Center will provide access to a webconference platform for this training if necessary.
Deliverable: • Provision of a laptop loaded with the scenario planning software tool and
technical assistance to the members of each of the four small/break-out groups; resulting maps in ArcGIS submitted to Volpe Center COTR
Task 5.2 Each small/break-out group will nominate a representative and present its scenario and its assumptions/thought process to the larger group. Facilitated by the Volpe Center and assisted by the contractor, the group will work collaboratively to reconcile any differences between the scenarios. In real time, the contractor shall score the new scenario vis-à-vis the performance indicators selected in Task 1.3.
Deliverable: • Provision of technical assistance and real-time use of the scenario planning
software tool to develop a preferred scenario; resulting map(s) in ArcGIS submitted to Volpe Center COTR
After the workshop, the Volpe Center will work with the state, the towns, Cape Cod Commission, NPS, the FWS, and other agencies to create an implementation strategy/plan at a more detailed/local level how the preferred scenario will be implemented within their jurisdictions. Task 6: Finalize the Preferred Scenario and Report Task 6.1 Deliver the finalized preferred scenario to the Volpe Center. The finalized preferred scenario shall be delivered in an ESRI ArcGIS geodtabase that includes FGDC-compliant metadata for all geodatabase elements so that it can be integrated into ArcGIS-based programs currently in use on Cape Cod and within the state. All of the data generated in the scenario planning process shall be delivered in Excel spreadsheets. Files shall be delivered by email unless they are too large, in which case they shall be sent via CD ROM. The files shall be received within two weeks of the completion of the workshop.
Deliverables: • Preferred scenario as a ArcGIS layer submitted to the Volpe Center COTR • Excel spreadsheets with all data submitted to the Volpe Center COTR
Appendices Interagency Transportation, Land Use, and Climate Change Pilot Project 29
Task 6.2 Create a final report. The final report shall compare all nine scenarios vis-à-vis the performance indicators and maps and the final report shall describe all assumptions and limitations inherent in the scenario planning process. The contractor shall submit a draft of the report to the Volpe Center within three weeks following the workshop. The contractor shall then revise the draft report in line with the Volpe Center’s comments within two weeks of receiving said comments. The versions of the report shall be transmitted via email.
Deliverables: • Draft and final report in Microsoft Word submitted to the Volpe Center COTR
Task 7: Progress Reporting
Task 7.1 The contractor shall provide bi-weekly progress reports to the Volpe Center. The progress reports shall include descriptions of work tasks completed during that time period, up-to-date budget status, and identification of any issues that may affect project schedule or project deliverables.
Deliverables: • Bi-weekly progress reports in Microsoft Word format submitted to the Volpe
Center COTR Task 7.2 The contractor shall attend and participate in planning group and technical committee teleconferences. The planning group teleconferences occur every three Thursdays from 11:00 AM to 12:30 PM Eastern. Technical committee teleconferences occur on an ad hoc basis but no more than one per month. The contractor shall answer any questions asked of the contractor during these teleconferences.
Deliverables: • Attendance and participation in planning group and technical committee
teleconferences 4. PERIOD OF PERFORMANCE
The period of performance is five months after the award of the purchase order. 5. TRAVEL
All travel performed under this Purchase order must be approved by the Contracting Officer's Technical Representative (COTR) and shall be performed in accordance with Federal Travel Regulations (FTR). The actual costs for lodging, meals, and incidental expenses will be considered reasonable and allowable if they do not exceed the maximum per diem rates in effect at the time of travel as set forth in the FTR for Barnstable County, MA. In accordance with FAR Subpart 31.205-46, a written justification must be provided to the COTR for amounts higher than the FTR maximum amounts. Travel will be
Appendices Interagency Transportation, Land Use, and Climate Change Pilot Project 30
reimbursed at actual costs (with a copy of the receipts for expenses) in the following categories:
1.) Airline Tickets (commercial rates) 2.) Hotel Expenses (government rates unless pre-approved by the COTR) 3.) All Other Modes of Transportation (taxi receipts are not required if less than
$50.00)
Food and other miscellaneous expenses will be reimbursed at the prevailing FTR reimbursement rates.
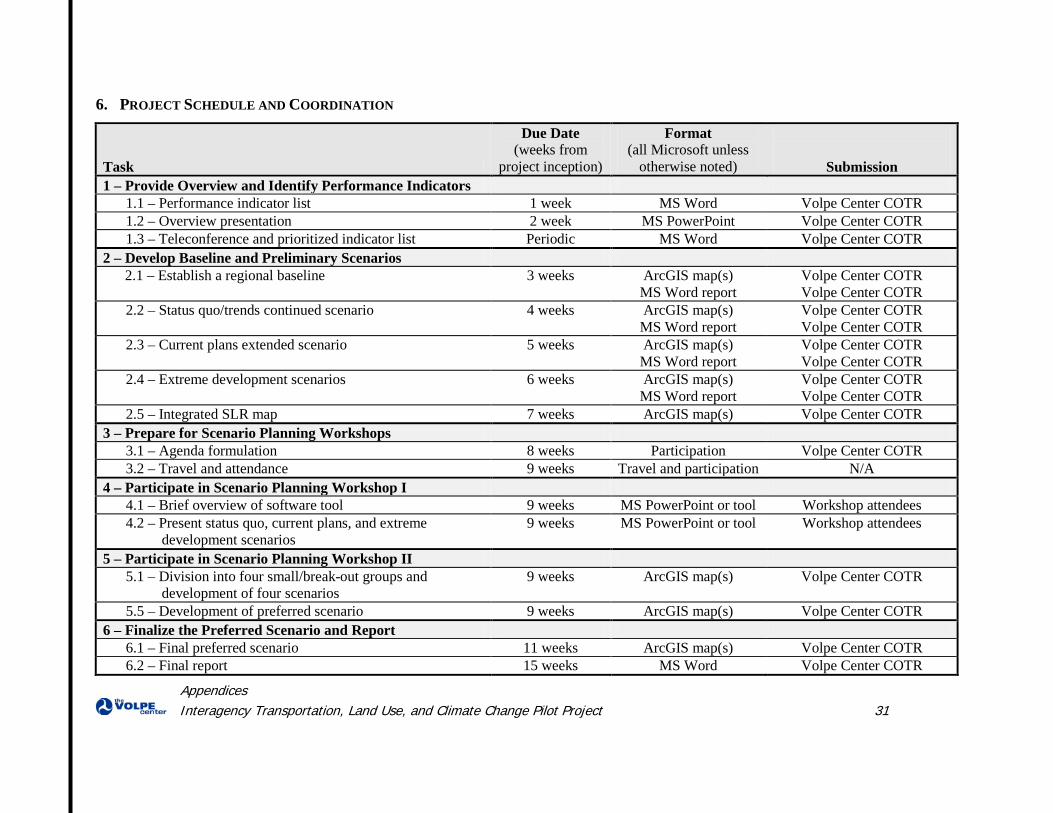
Appendices Interagency Transportation, Land Use, and Climate Change Pilot Project 31
6. PROJECT SCHEDULE AND COORDINATION
Task
Due Date (weeks from
project inception)
Format (all Microsoft unless
otherwise noted)
Submission 1 – Provide Overview and Identify Performance Indicators
1.1 – Performance indicator list 1 week MS Word Volpe Center COTR 1.2 – Overview presentation 2 week MS PowerPoint Volpe Center COTR 1.3 – Teleconference and prioritized indicator list Periodic MS Word Volpe Center COTR
2 – Develop Baseline and Preliminary Scenarios 2.1 – Establish a regional baseline
3 weeks
ArcGIS map(s) MS Word report
Volpe Center COTR Volpe Center COTR
2.2 – Status quo/trends continued scenario
4 weeks ArcGIS map(s) MS Word report
Volpe Center COTR Volpe Center COTR
2.3 – Current plans extended scenario
5 weeks ArcGIS map(s) MS Word report
Volpe Center COTR Volpe Center COTR
2.4 – Extreme development scenarios
6 weeks ArcGIS map(s) MS Word report
Volpe Center COTR Volpe Center COTR
2.5 – Integrated SLR map 7 weeks ArcGIS map(s) Volpe Center COTR 3 – Prepare for Scenario Planning Workshops
3.1 – Agenda formulation 8 weeks Participation Volpe Center COTR 3.2 – Travel and attendance 9 weeks Travel and participation N/A
4 – Participate in Scenario Planning Workshop I 4.1 – Brief overview of software tool 9 weeks MS PowerPoint or tool Workshop attendees 4.2 – Present status quo, current plans, and extreme
development scenarios 9 weeks MS PowerPoint or tool Workshop attendees
5 – Participate in Scenario Planning Workshop II 5.1 – Division into four small/break-out groups and
development of four scenarios 9 weeks ArcGIS map(s) Volpe Center COTR
5.5 – Development of preferred scenario 9 weeks ArcGIS map(s) Volpe Center COTR 6 – Finalize the Preferred Scenario and Report
6.1 – Final preferred scenario 11 weeks ArcGIS map(s) Volpe Center COTR 6.2 – Final report 15 weeks MS Word Volpe Center COTR
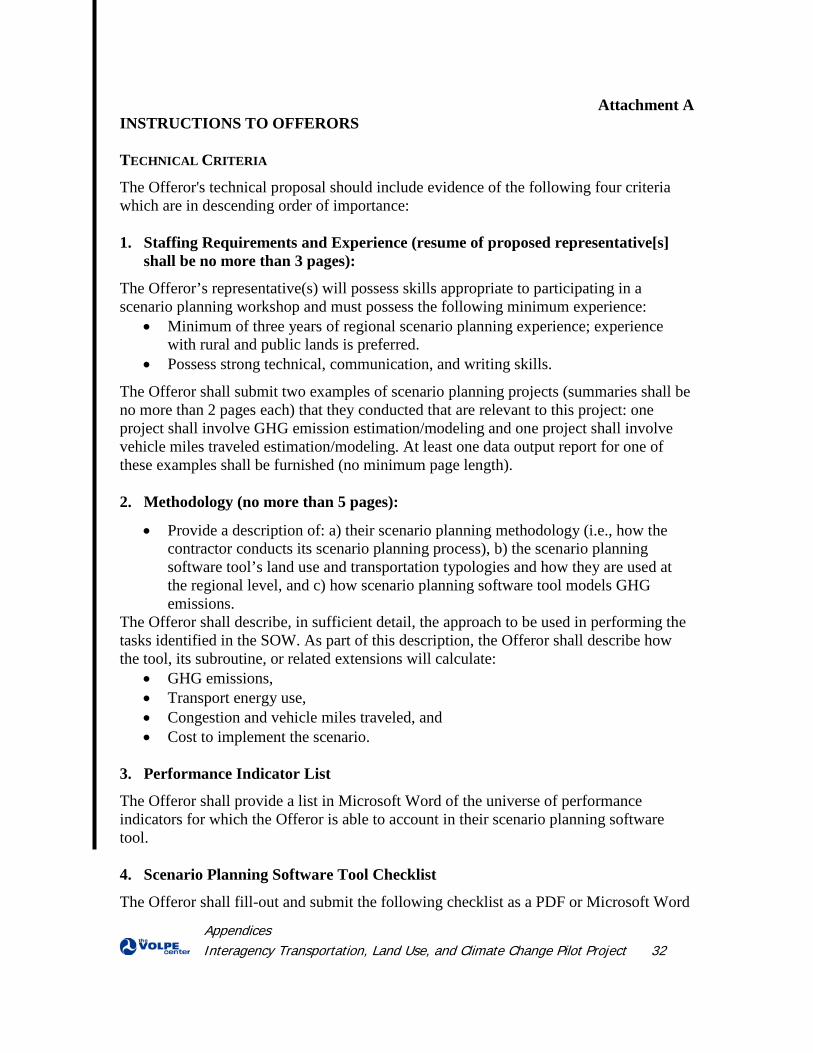
Appendices Interagency Transportation, Land Use, and Climate Change Pilot Project 32
Attachment A INSTRUCTIONS TO OFFERORS TECHNICAL CRITERIA
The Offeror's technical proposal should include evidence of the following four criteria which are in descending order of importance: 1. Staffing Requirements and Experience (resume of proposed representative[s]
shall be no more than 3 pages):
The Offeror’s representative(s) will possess skills appropriate to participating in a scenario planning workshop and must possess the following minimum experience:
• Minimum of three years of regional scenario planning experience; experience with rural and public lands is preferred.
• Possess strong technical, communication, and writing skills.
The Offeror shall submit two examples of scenario planning projects (summaries shall be no more than 2 pages each) that they conducted that are relevant to this project: one project shall involve GHG emission estimation/modeling and one project shall involve vehicle miles traveled estimation/modeling. At least one data output report for one of these examples shall be furnished (no minimum page length). 2. Methodology (no more than 5 pages):
• Provide a description of: a) their scenario planning methodology (i.e., how the contractor conducts its scenario planning process), b) the scenario planning software tool’s land use and transportation typologies and how they are used at the regional level, and c) how scenario planning software tool models GHG emissions.
The Offeror shall describe, in sufficient detail, the approach to be used in performing the tasks identified in the SOW. As part of this description, the Offeror shall describe how the tool, its subroutine, or related extensions will calculate:
• GHG emissions, • Transport energy use, • Congestion and vehicle miles traveled, and • Cost to implement the scenario.
3. Performance Indicator List
The Offeror shall provide a list in Microsoft Word of the universe of performance indicators for which the Offeror is able to account in their scenario planning software tool. 4. Scenario Planning Software Tool Checklist
The Offeror shall fill-out and submit the following checklist as a PDF or Microsoft Word
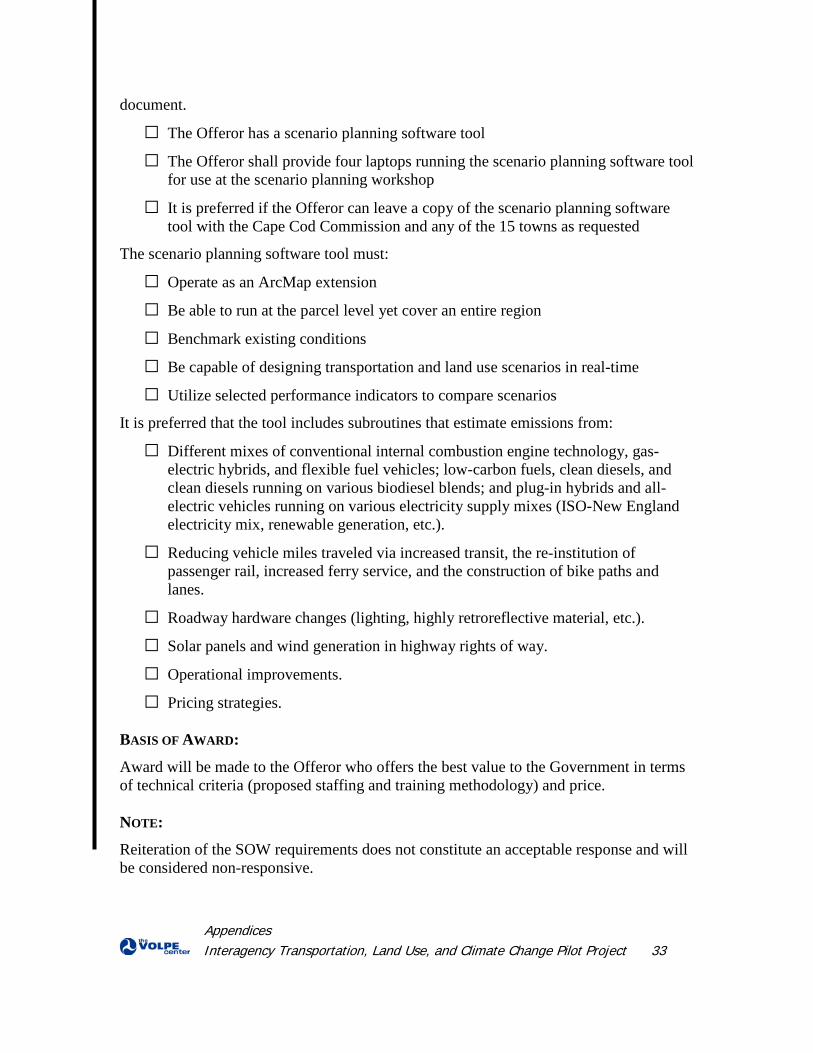
Appendices Interagency Transportation, Land Use, and Climate Change Pilot Project 33
document.
□ The Offeror has a scenario planning software tool
□ The Offeror shall provide four laptops running the scenario planning software tool for use at the scenario planning workshop
□ It is preferred if the Offeror can leave a copy of the scenario planning software tool with the Cape Cod Commission and any of the 15 towns as requested
The scenario planning software tool must:
□ Operate as an ArcMap extension
□ Be able to run at the parcel level yet cover an entire region
□ Benchmark existing conditions
□ Be capable of designing transportation and land use scenarios in real-time
□ Utilize selected performance indicators to compare scenarios
It is preferred that the tool includes subroutines that estimate emissions from:
□ Different mixes of conventional internal combustion engine technology, gas-electric hybrids, and flexible fuel vehicles; low-carbon fuels, clean diesels, and clean diesels running on various biodiesel blends; and plug-in hybrids and all-electric vehicles running on various electricity supply mixes (ISO-New England electricity mix, renewable generation, etc.).
□ Reducing vehicle miles traveled via increased transit, the re-institution of passenger rail, increased ferry service, and the construction of bike paths and lanes.
□ Roadway hardware changes (lighting, highly retroreflective material, etc.).
□ Solar panels and wind generation in highway rights of way.
□ Operational improvements.
□ Pricing strategies. BASIS OF AWARD:
Award will be made to the Offeror who offers the best value to the Government in terms of technical criteria (proposed staffing and training methodology) and price. NOTE:
Reiteration of the SOW requirements does not constitute an acceptable response and will be considered non-responsive.
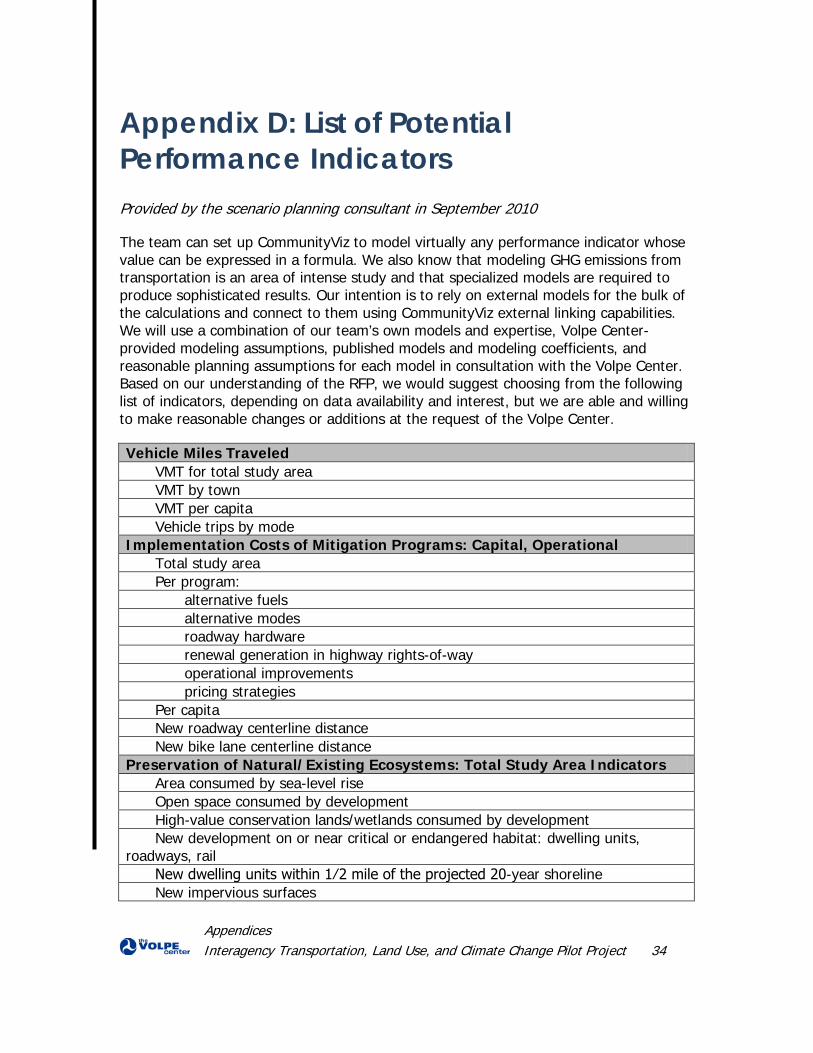
Appendices Interagency Transportation, Land Use, and Climate Change Pilot Project 34
Appendix D: List of Potential Performance Indicators Provided by the scenario planning consultant in September 2010
The team can set up CommunityViz to model virtually any performance indicator whose value can be expressed in a formula. We also know that modeling GHG emissions from transportation is an area of intense study and that specialized models are required to produce sophisticated results. Our intention is to rely on external models for the bulk of the calculations and connect to them using CommunityViz external linking capabilities. We will use a combination of our team’s own models and expertise, Volpe Center-provided modeling assumptions, published models and modeling coefficients, and reasonable planning assumptions for each model in consultation with the Volpe Center. Based on our understanding of the RFP, we would suggest choosing from the following list of indicators, depending on data availability and interest, but we are able and willing to make reasonable changes or additions at the request of the Volpe Center.
Vehicle Miles Traveled VMT for total study area VMT by town VMT per capita Vehicle trips by mode
Implementation Costs of Mitigation Programs: Capital, Operational Total study area Per program:
alternative fuels alternative modes roadway hardware renewal generation in highway rights-of-way operational improvements pricing strategies
Per capita New roadway centerline distance New bike lane centerline distance
Preservation of Natural/Existing Ecosystems: Total Study Area Indicators Area consumed by sea-level rise Open space consumed by development High-value conservation lands/wetlands consumed by development New development on or near critical or endangered habitat: dwelling units,
roadways, rail New dwelling units within 1⁄2 mile of the projected 20-year shoreline New impervious surfaces
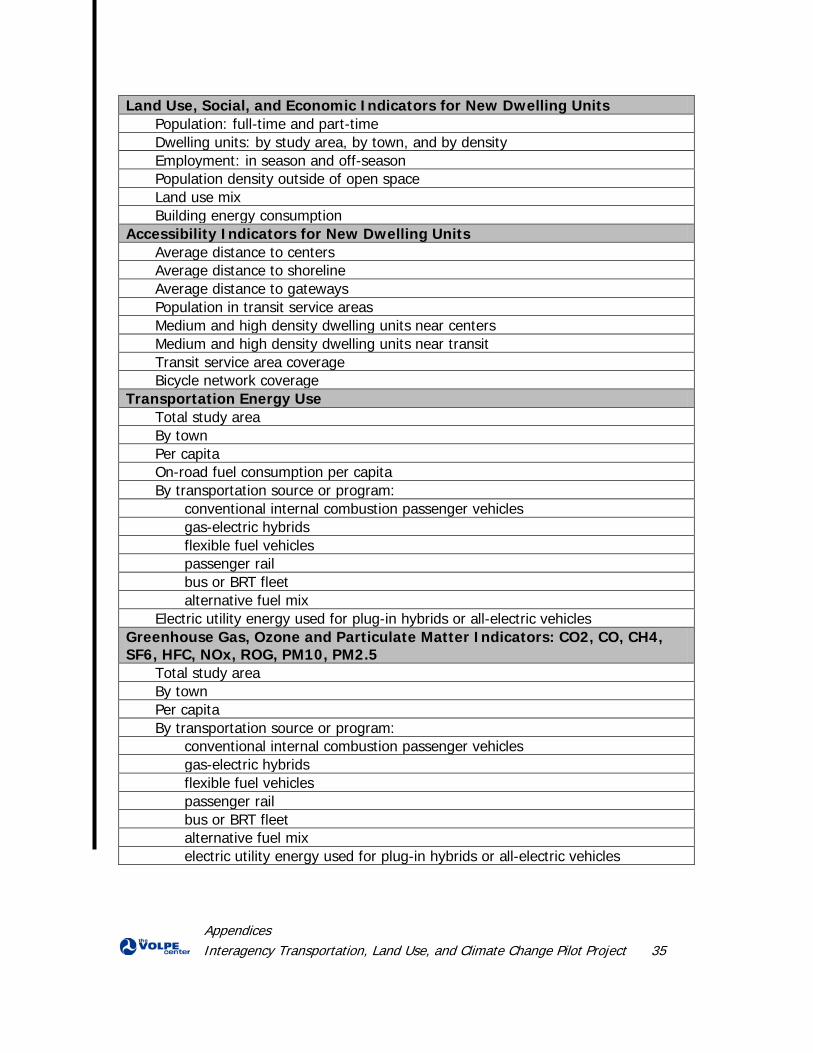
Appendices Interagency Transportation, Land Use, and Climate Change Pilot Project 35
Land Use, Social, and Economic Indicators for New Dwelling Units Population: full-time and part-time Dwelling units: by study area, by town, and by density Employment: in season and off-season Population density outside of open space Land use mix Building energy consumption
Accessibility Indicators for New Dwelling Units Average distance to centers Average distance to shoreline Average distance to gateways Population in transit service areas Medium and high density dwelling units near centers Medium and high density dwelling units near transit Transit service area coverage Bicycle network coverage
Transportation Energy Use Total study area By town Per capita On-road fuel consumption per capita By transportation source or program:
conventional internal combustion passenger vehicles gas-electric hybrids flexible fuel vehicles passenger rail bus or BRT fleet alternative fuel mix
Electric utility energy used for plug-in hybrids or all-electric vehicles Greenhouse Gas, Ozone and Particulate Matter Indicators: CO2, CO, CH4, SF6, HFC, NOx, ROG, PM10, PM2.5
Total study area By town Per capita By transportation source or program:
conventional internal combustion passenger vehicles gas-electric hybrids flexible fuel vehicles passenger rail bus or BRT fleet alternative fuel mix electric utility energy used for plug-in hybrids or all-electric vehicles
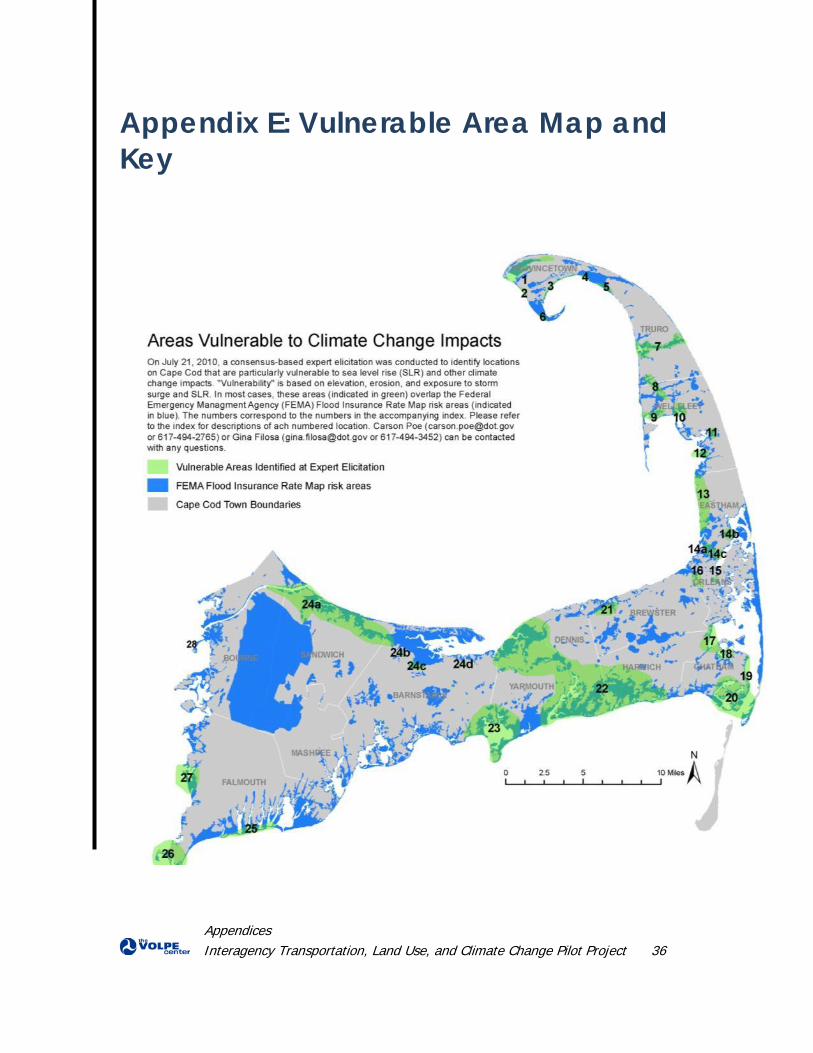
Appendices Interagency Transportation, Land Use, and Climate Change Pilot Project 36
Appendix E: Vulnerable Area Map and Key
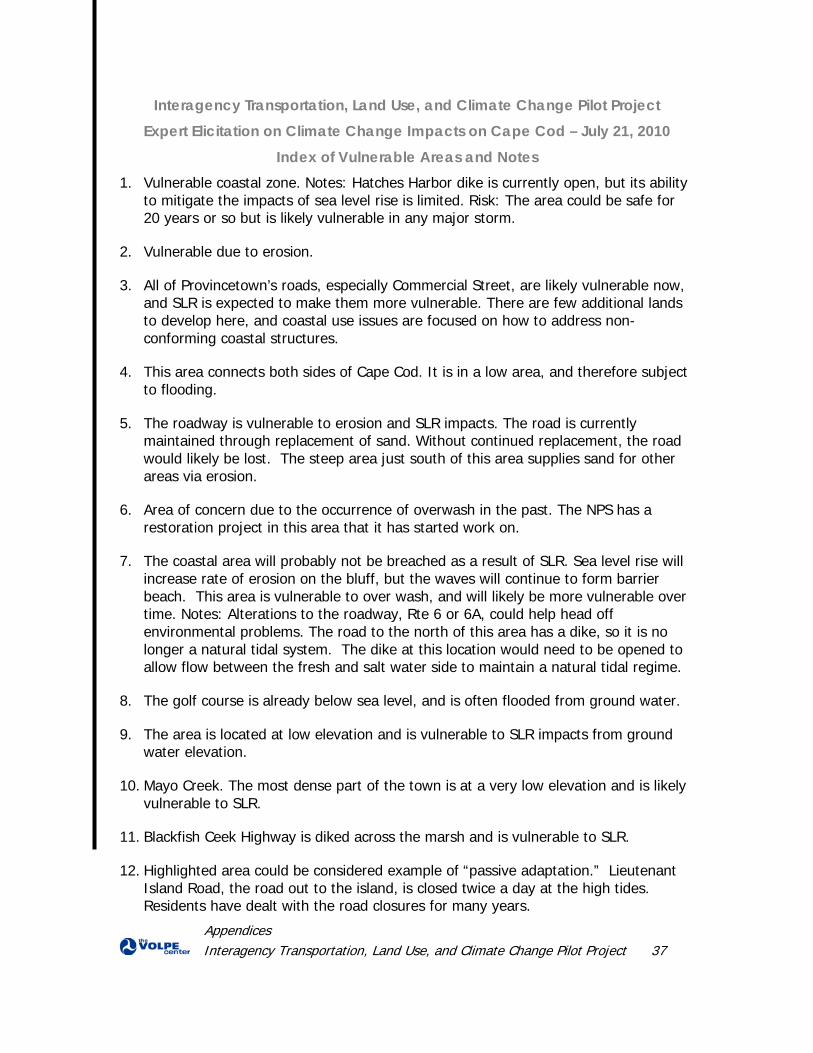
Appendices Interagency Transportation, Land Use, and Climate Change Pilot Project 37
Interagency Transportation, Land Use, and Climate Change Pilot Project Expert Elicitation on Climate Change Impacts on Cape Cod – July 21, 2010
Index of Vulnerable Areas and Notes 1. Vulnerable coastal zone. Notes: Hatches Harbor dike is currently open, but its ability
to mitigate the impacts of sea level rise is limited. Risk: The area could be safe for 20 years or so but is likely vulnerable in any major storm.
2. Vulnerable due to erosion.
3. All of Provincetown’s roads, especially Commercial Street, are likely vulnerable now, and SLR is expected to make them more vulnerable. There are few additional lands to develop here, and coastal use issues are focused on how to address non-conforming coastal structures.
4. This area connects both sides of Cape Cod. It is in a low area, and therefore subject to flooding.
5. The roadway is vulnerable to erosion and SLR impacts. The road is currently maintained through replacement of sand. Without continued replacement, the road would likely be lost. The steep area just south of this area supplies sand for other areas via erosion.
6. Area of concern due to the occurrence of overwash in the past. The NPS has a restoration project in this area that it has started work on.
7. The coastal area will probably not be breached as a result of SLR. Sea level rise will increase rate of erosion on the bluff, but the waves will continue to form barrier beach. This area is vulnerable to over wash, and will likely be more vulnerable over time. Notes: Alterations to the roadway, Rte 6 or 6A, could help head off environmental problems. The road to the north of this area has a dike, so it is no longer a natural tidal system. The dike at this location would need to be opened to allow flow between the fresh and salt water side to maintain a natural tidal regime.
8. The golf course is already below sea level, and is often flooded from ground water.
9. The area is located at low elevation and is vulnerable to SLR impacts from ground water elevation.
10. Mayo Creek. The most dense part of the town is at a very low elevation and is likely vulnerable to SLR.
11. Blackfish Ceek Highway is diked across the marsh and is vulnerable to SLR.
12. Highlighted area could be considered example of “passive adaptation.” Lieutenant Island Road, the road out to the island, is closed twice a day at the high tides. Residents have dealt with the road closures for many years.
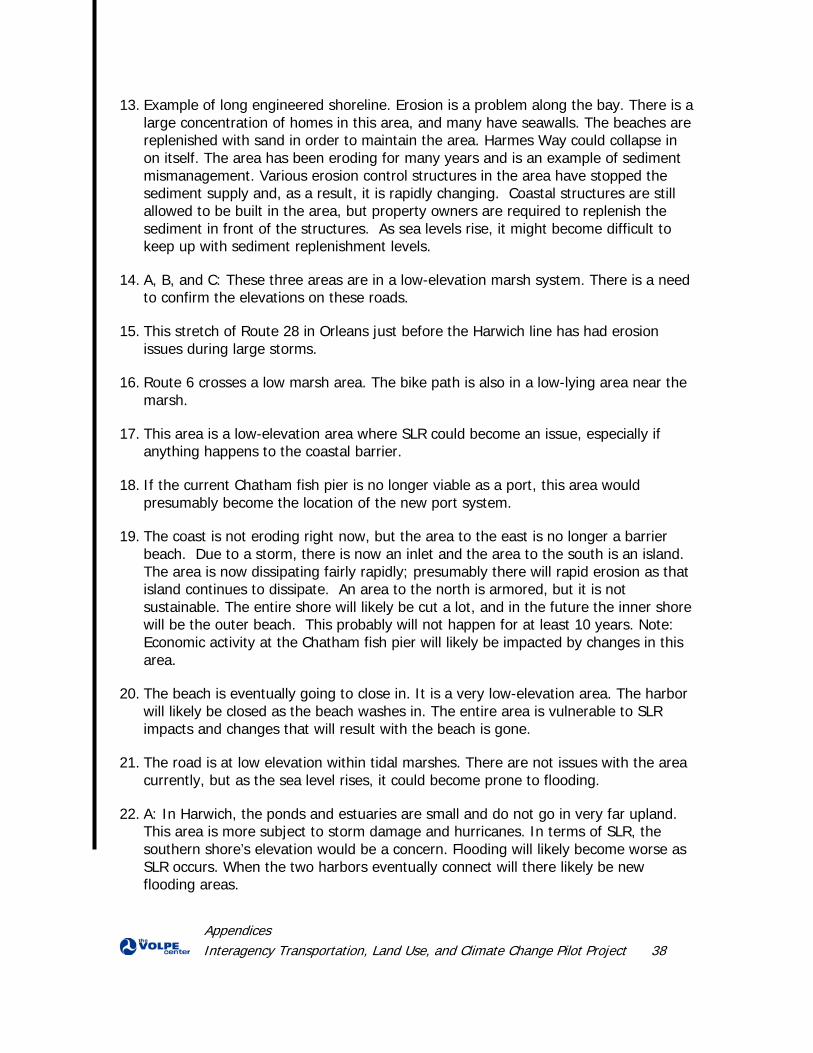
Appendices Interagency Transportation, Land Use, and Climate Change Pilot Project 38
13. Example of long engineered shoreline. Erosion is a problem along the bay. There is a large concentration of homes in this area, and many have seawalls. The beaches are replenished with sand in order to maintain the area. Harmes Way could collapse in on itself. The area has been eroding for many years and is an example of sediment mismanagement. Various erosion control structures in the area have stopped the sediment supply and, as a result, it is rapidly changing. Coastal structures are still allowed to be built in the area, but property owners are required to replenish the sediment in front of the structures. As sea levels rise, it might become difficult to keep up with sediment replenishment levels.
14. A, B, and C: These three areas are in a low-elevation marsh system. There is a need to confirm the elevations on these roads.
15. This stretch of Route 28 in Orleans just before the Harwich line has had erosion issues during large storms.
16. Route 6 crosses a low marsh area. The bike path is also in a low-lying area near the marsh.
17. This area is a low-elevation area where SLR could become an issue, especially if anything happens to the coastal barrier.
18. If the current Chatham fish pier is no longer viable as a port, this area would presumably become the location of the new port system.
19. The coast is not eroding right now, but the area to the east is no longer a barrier beach. Due to a storm, there is now an inlet and the area to the south is an island. The area is now dissipating fairly rapidly; presumably there will rapid erosion as that island continues to dissipate. An area to the north is armored, but it is not sustainable. The entire shore will likely be cut a lot, and in the future the inner shore will be the outer beach. This probably will not happen for at least 10 years. Note: Economic activity at the Chatham fish pier will likely be impacted by changes in this area.
20. The beach is eventually going to close in. It is a very low-elevation area. The harbor will likely be closed as the beach washes in. The entire area is vulnerable to SLR impacts and changes that will result with the beach is gone.
21. The road is at low elevation within tidal marshes. There are not issues with the area currently, but as the sea level rises, it could become prone to flooding.
22. A: In Harwich, the ponds and estuaries are small and do not go in very far upland. This area is more subject to storm damage and hurricanes. In terms of SLR, the southern shore’s elevation would be a concern. Flooding will likely become worse as SLR occurs. When the two harbors eventually connect will there likely be new flooding areas.
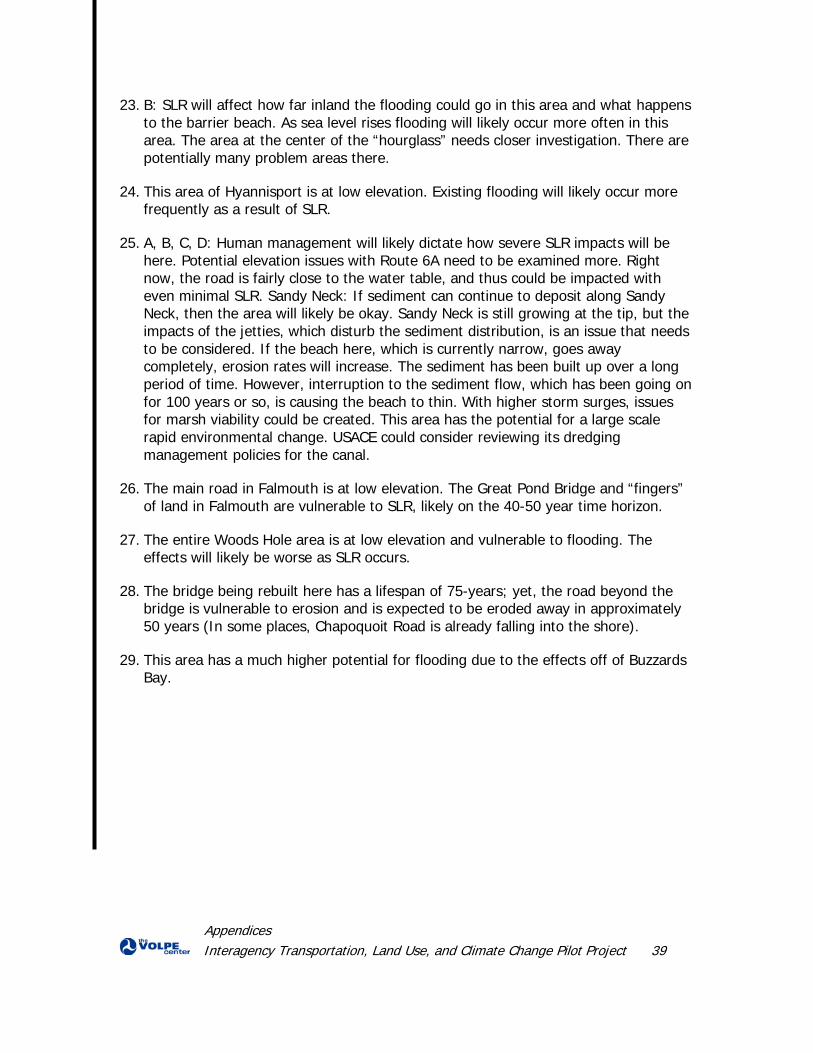
Appendices Interagency Transportation, Land Use, and Climate Change Pilot Project 39
23. B: SLR will affect how far inland the flooding could go in this area and what happens to the barrier beach. As sea level rises flooding will likely occur more often in this area. The area at the center of the “hourglass” needs closer investigation. There are potentially many problem areas there.
24. This area of Hyannisport is at low elevation. Existing flooding will likely occur more frequently as a result of SLR.
25. A, B, C, D: Human management will likely dictate how severe SLR impacts will be here. Potential elevation issues with Route 6A need to be examined more. Right now, the road is fairly close to the water table, and thus could be impacted with even minimal SLR. Sandy Neck: If sediment can continue to deposit along Sandy Neck, then the area will likely be okay. Sandy Neck is still growing at the tip, but the impacts of the jetties, which disturb the sediment distribution, is an issue that needs to be considered. If the beach here, which is currently narrow, goes away completely, erosion rates will increase. The sediment has been built up over a long period of time. However, interruption to the sediment flow, which has been going on for 100 years or so, is causing the beach to thin. With higher storm surges, issues for marsh viability could be created. This area has the potential for a large scale rapid environmental change. USACE could consider reviewing its dredging management policies for the canal.
26. The main road in Falmouth is at low elevation. The Great Pond Bridge and “fingers” of land in Falmouth are vulnerable to SLR, likely on the 40-50 year time horizon.
27. The entire Woods Hole area is at low elevation and vulnerable to flooding. The effects will likely be worse as SLR occurs.
28. The bridge being rebuilt here has a lifespan of 75-years; yet, the road beyond the bridge is vulnerable to erosion and is expected to be eroded away in approximately 50 years (In some places, Chapoquoit Road is already falling into the shore).
29. This area has a much higher potential for flooding due to the effects off of Buzzards Bay.
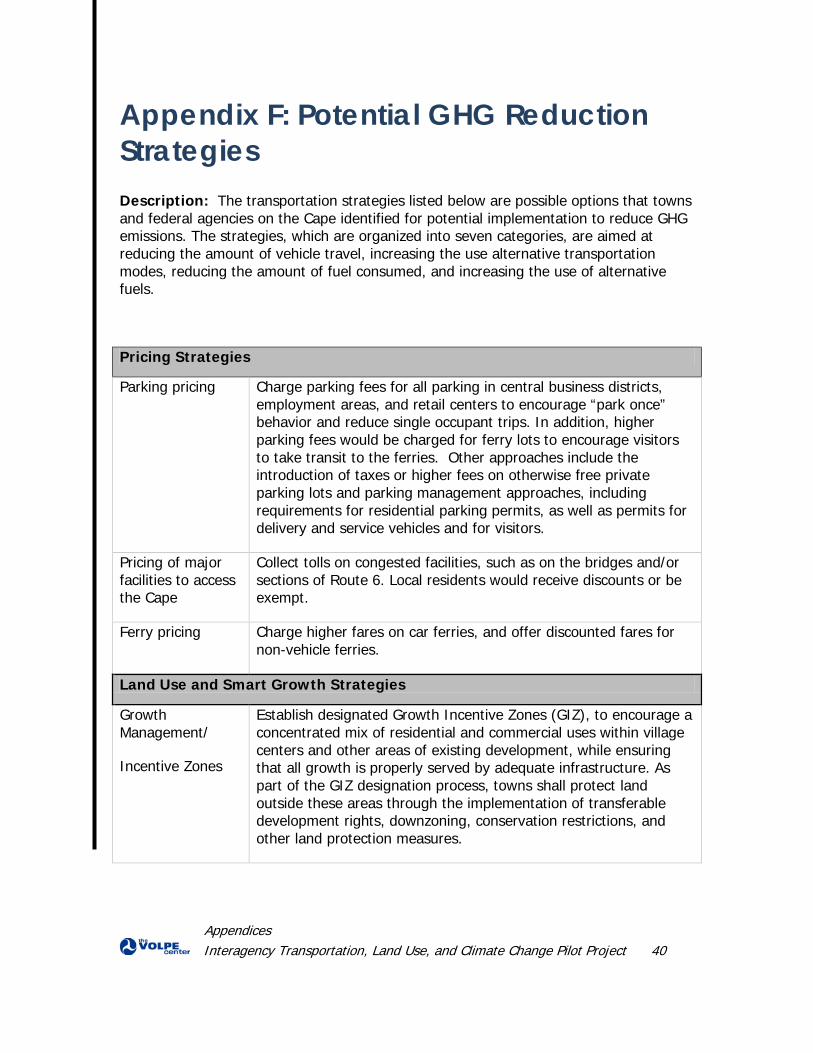
Appendices Interagency Transportation, Land Use, and Climate Change Pilot Project 40
Appendix F: Potential GHG Reduction Strategies
Description: The transportation strategies listed below are possible options that towns and federal agencies on the Cape identified for potential implementation to reduce GHG emissions. The strategies, which are organized into seven categories, are aimed at reducing the amount of vehicle travel, increasing the use alternative transportation modes, reducing the amount of fuel consumed, and increasing the use of alternative fuels.
Pricing Strategies
Parking pricing Charge parking fees for all parking in central business districts, employment areas, and retail centers to encourage “park once” behavior and reduce single occupant trips. In addition, higher parking fees would be charged for ferry lots to encourage visitors to take transit to the ferries. Other approaches include the introduction of taxes or higher fees on otherwise free private parking lots and parking management approaches, including requirements for residential parking permits, as well as permits for delivery and service vehicles and for visitors.
Pricing of major facilities to access the Cape
Collect tolls on congested facilities, such as on the bridges and/or sections of Route 6. Local residents would receive discounts or be exempt.
Ferry pricing Charge higher fares on car ferries, and offer discounted fares for non-vehicle ferries.
Land Use and Smart Growth Strategies
Growth Management/
Incentive Zones
Establish designated Growth Incentive Zones (GIZ), to encourage a concentrated mix of residential and commercial uses within village centers and other areas of existing development, while ensuring that all growth is properly served by adequate infrastructure. As part of the GIZ designation process, towns shall protect land outside these areas through the implementation of transferable development rights, downzoning, conservation restrictions, and other land protection measures.
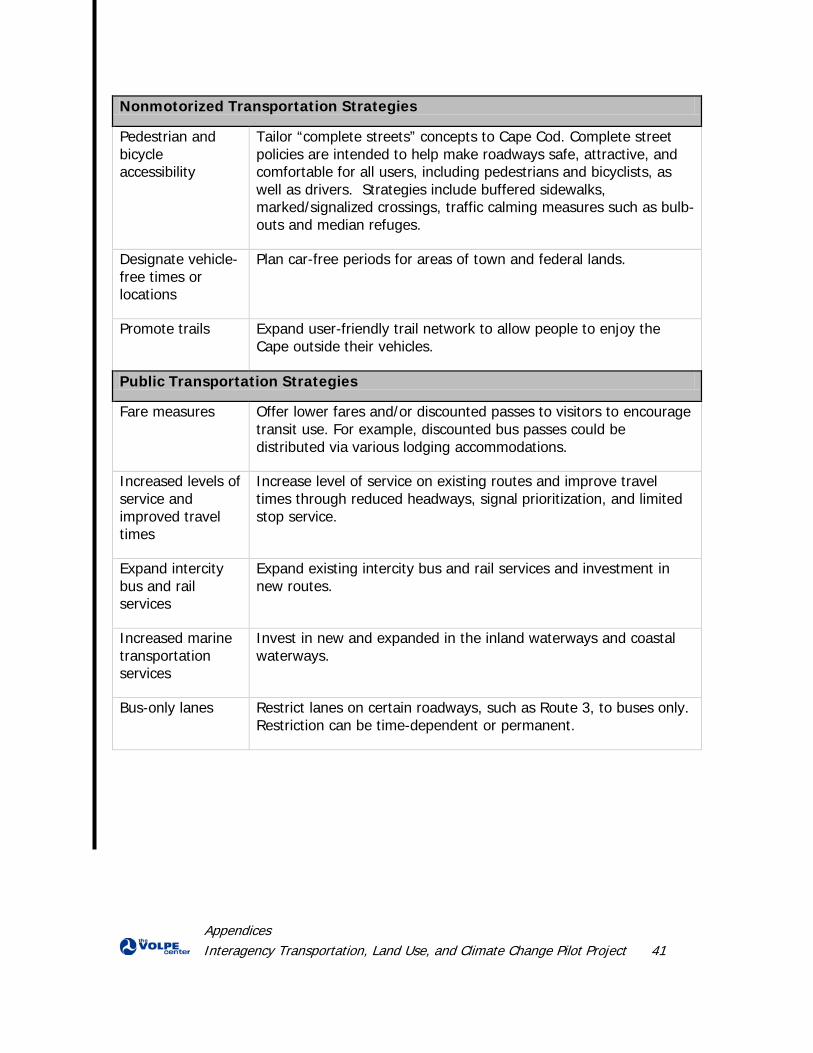
Appendices Interagency Transportation, Land Use, and Climate Change Pilot Project 41
Nonmotorized Transportation Strategies
Pedestrian and bicycle accessibility
Tailor “complete streets” concepts to Cape Cod. Complete street policies are intended to help make roadways safe, attractive, and comfortable for all users, including pedestrians and bicyclists, as well as drivers. Strategies include buffered sidewalks, marked/signalized crossings, traffic calming measures such as bulb-outs and median refuges.
Designate vehicle-free times or locations
Plan car-free periods for areas of town and federal lands.
Promote trails Expand user-friendly trail network to allow people to enjoy the Cape outside their vehicles.
Public Transportation Strategies
Fare measures Offer lower fares and/or discounted passes to visitors to encourage transit use. For example, discounted bus passes could be distributed via various lodging accommodations.
Increased levels of service and improved travel times
Increase level of service on existing routes and improve travel times through reduced headways, signal prioritization, and limited stop service.
Expand intercity bus and rail services
Expand existing intercity bus and rail services and investment in new routes.
Increased marine transportation services
Invest in new and expanded in the inland waterways and coastal waterways.
Bus-only lanes Restrict lanes on certain roadways, such as Route 3, to buses only. Restriction can be time-dependent or permanent.
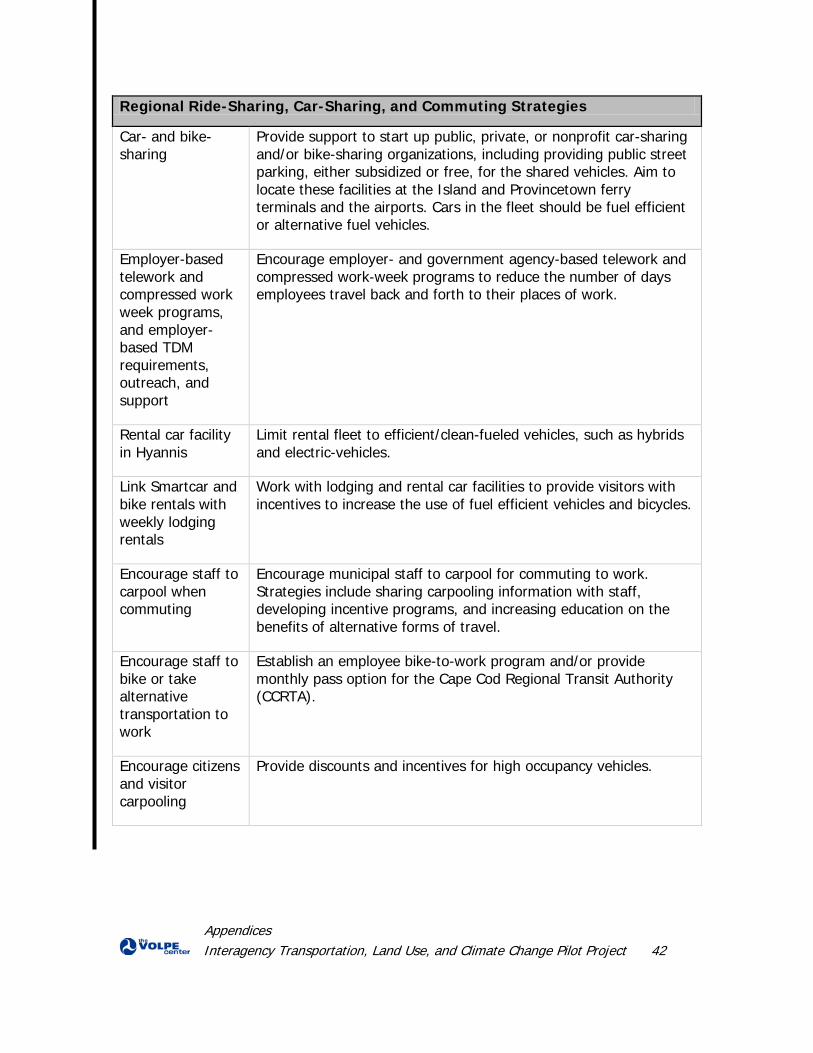
Appendices Interagency Transportation, Land Use, and Climate Change Pilot Project 42
Regional Ride-Sharing, Car-Sharing, and Commuting Strategies
Car- and bike-sharing
Provide support to start up public, private, or nonprofit car-sharing and/or bike-sharing organizations, including providing public street parking, either subsidized or free, for the shared vehicles. Aim to locate these facilities at the Island and Provincetown ferry terminals and the airports. Cars in the fleet should be fuel efficient or alternative fuel vehicles.
Employer-based telework and compressed work week programs, and employer-based TDM requirements, outreach, and support
Encourage employer- and government agency-based telework and compressed work-week programs to reduce the number of days employees travel back and forth to their places of work.
Rental car facility in Hyannis
Limit rental fleet to efficient/clean-fueled vehicles, such as hybrids and electric-vehicles.
Link Smartcar and bike rentals with weekly lodging rentals
Work with lodging and rental car facilities to provide visitors with incentives to increase the use of fuel efficient vehicles and bicycles.
Encourage staff to carpool when commuting
Encourage municipal staff to carpool for commuting to work. Strategies include sharing carpooling information with staff, developing incentive programs, and increasing education on the benefits of alternative forms of travel.
Encourage staff to bike or take alternative transportation to work
Establish an employee bike-to-work program and/or provide monthly pass option for the Cape Cod Regional Transit Authority (CCRTA).
Encourage citizens and visitor carpooling
Provide discounts and incentives for high occupancy vehicles.
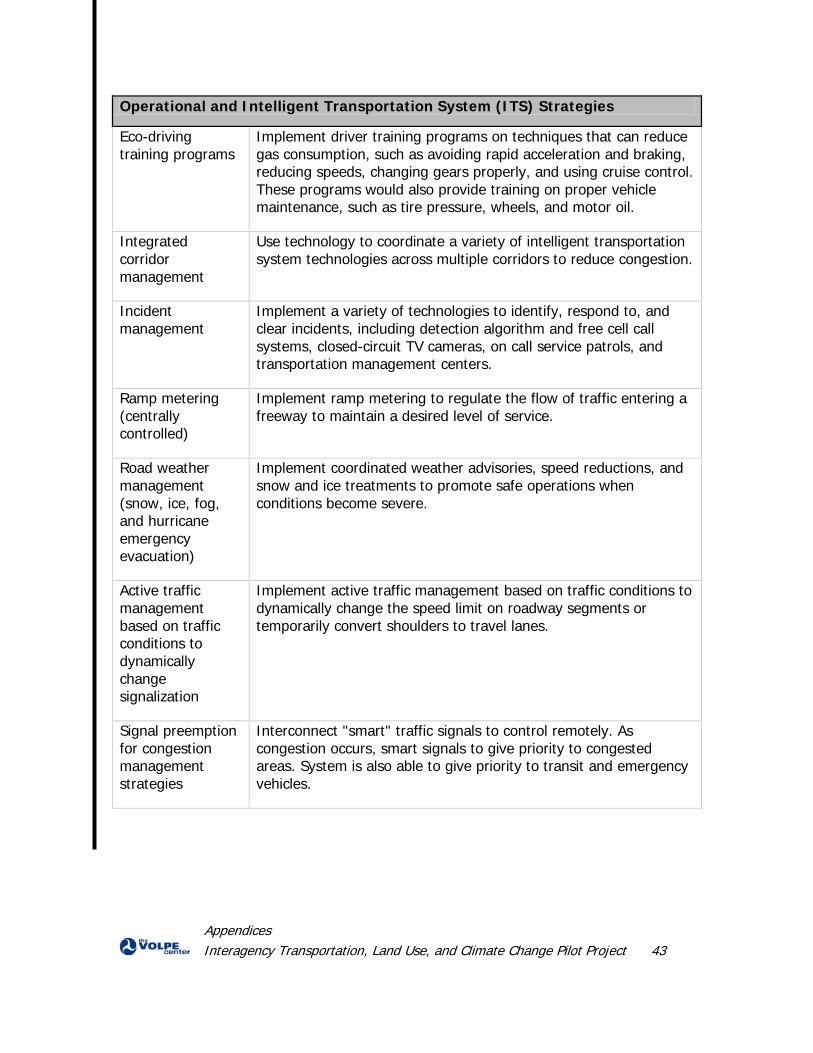
Appendices Interagency Transportation, Land Use, and Climate Change Pilot Project 43
Operational and Intelligent Transportation System (ITS) Strategies
Eco-driving training programs
Implement driver training programs on techniques that can reduce gas consumption, such as avoiding rapid acceleration and braking, reducing speeds, changing gears properly, and using cruise control. These programs would also provide training on proper vehicle maintenance, such as tire pressure, wheels, and motor oil.
Integrated corridor management
Use technology to coordinate a variety of intelligent transportation system technologies across multiple corridors to reduce congestion.
Incident management
Implement a variety of technologies to identify, respond to, and clear incidents, including detection algorithm and free cell call systems, closed-circuit TV cameras, on call service patrols, and transportation management centers.
Ramp metering (centrally controlled)
Implement ramp metering to regulate the flow of traffic entering a freeway to maintain a desired level of service.
Road weather management (snow, ice, fog, and hurricane emergency evacuation)
Implement coordinated weather advisories, speed reductions, and snow and ice treatments to promote safe operations when conditions become severe.
Active traffic management based on traffic conditions to dynamically change signalization
Implement active traffic management based on traffic conditions to dynamically change the speed limit on roadway segments or temporarily convert shoulders to travel lanes.
Signal preemption for congestion management strategies
Interconnect "smart" traffic signals to control remotely. As congestion occurs, smart signals to give priority to congested areas. System is also able to give priority to transit and emergency vehicles.
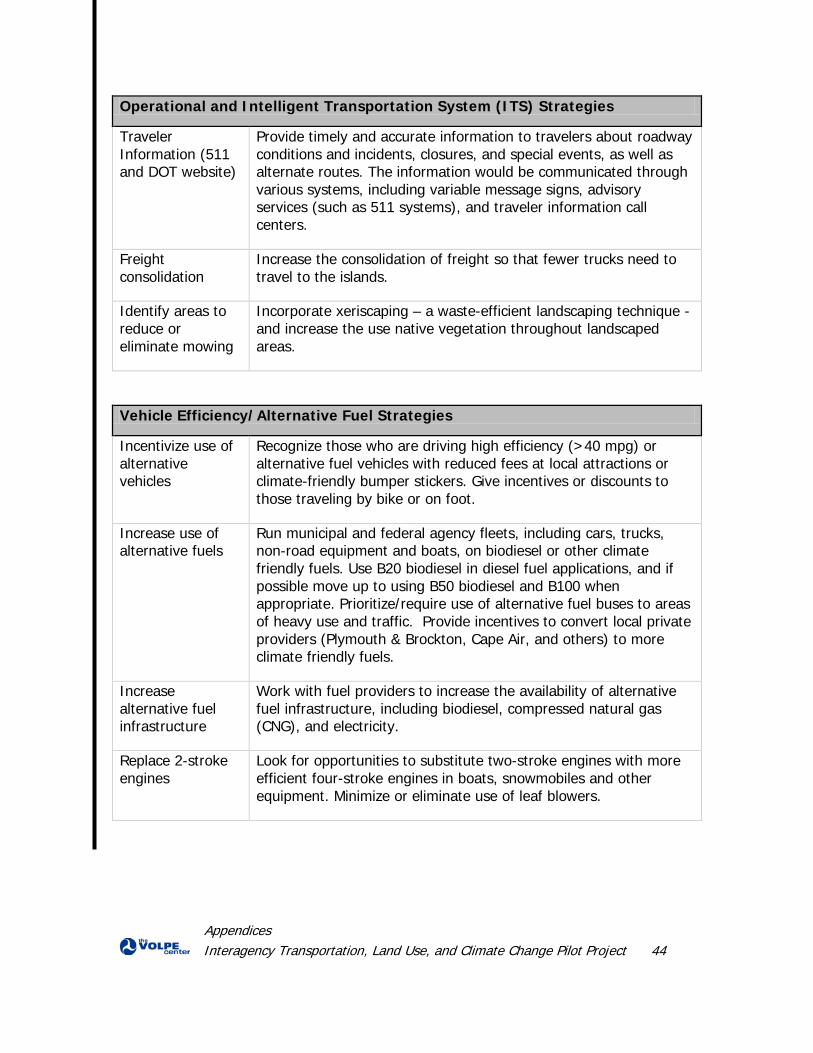
Appendices Interagency Transportation, Land Use, and Climate Change Pilot Project 44
Operational and Intelligent Transportation System (ITS) Strategies
Traveler Information (511 and DOT website)
Provide timely and accurate information to travelers about roadway conditions and incidents, closures, and special events, as well as alternate routes. The information would be communicated through various systems, including variable message signs, advisory services (such as 511 systems), and traveler information call centers.
Freight consolidation
Increase the consolidation of freight so that fewer trucks need to travel to the islands.
Identify areas to reduce or eliminate mowing
Incorporate xeriscaping – a waste-efficient landscaping technique - and increase the use native vegetation throughout landscaped areas.
Vehicle Efficiency/Alternative Fuel Strategies
Incentivize use of alternative vehicles
Recognize those who are driving high efficiency (>40 mpg) or alternative fuel vehicles with reduced fees at local attractions or climate-friendly bumper stickers. Give incentives or discounts to those traveling by bike or on foot.
Increase use of alternative fuels
Run municipal and federal agency fleets, including cars, trucks, non-road equipment and boats, on biodiesel or other climate friendly fuels. Use B20 biodiesel in diesel fuel applications, and if possible move up to using B50 biodiesel and B100 when appropriate. Prioritize/require use of alternative fuel buses to areas of heavy use and traffic. Provide incentives to convert local private providers (Plymouth & Brockton, Cape Air, and others) to more climate friendly fuels.
Increase alternative fuel infrastructure
Work with fuel providers to increase the availability of alternative fuel infrastructure, including biodiesel, compressed natural gas (CNG), and electricity.
Replace 2-stroke engines
Look for opportunities to substitute two-stroke engines with more efficient four-stroke engines in boats, snowmobiles and other equipment. Minimize or eliminate use of leaf blowers.
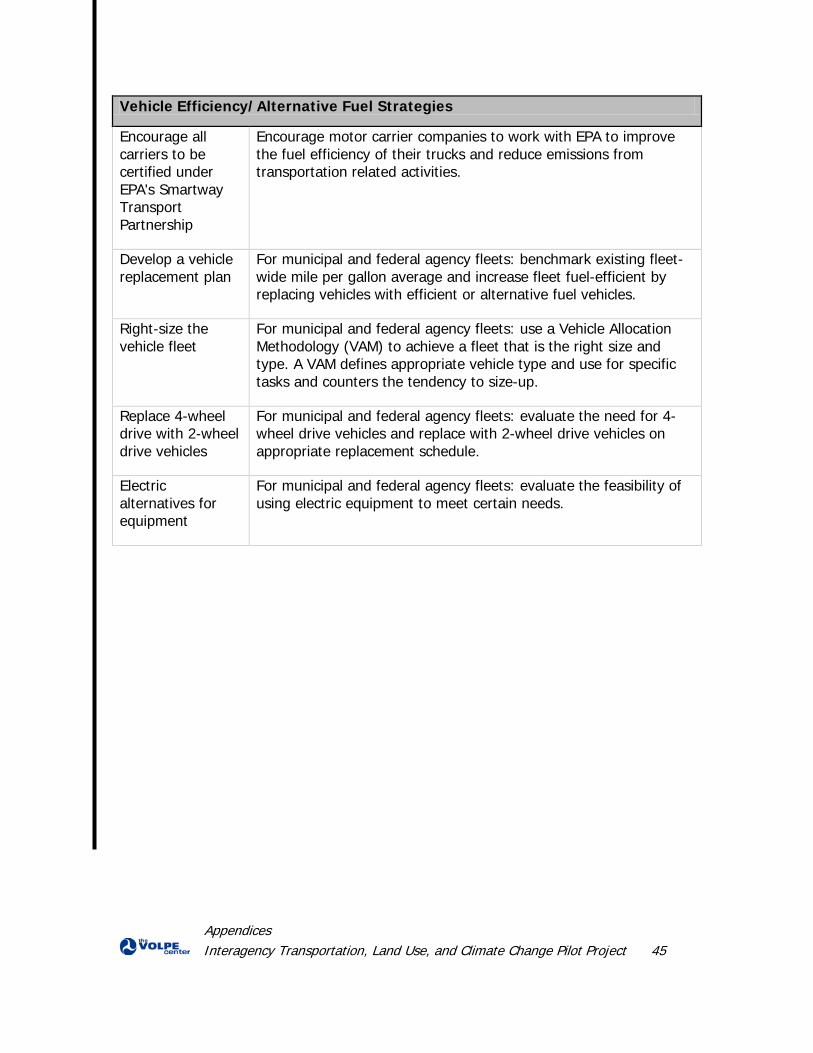
Appendices Interagency Transportation, Land Use, and Climate Change Pilot Project 45
Vehicle Efficiency/Alternative Fuel Strategies
Encourage all carriers to be certified under EPA's Smartway Transport Partnership
Encourage motor carrier companies to work with EPA to improve the fuel efficiency of their trucks and reduce emissions from transportation related activities.
Develop a vehicle replacement plan
For municipal and federal agency fleets: benchmark existing fleet-wide mile per gallon average and increase fleet fuel-efficient by replacing vehicles with efficient or alternative fuel vehicles.
Right-size the vehicle fleet
For municipal and federal agency fleets: use a Vehicle Allocation Methodology (VAM) to achieve a fleet that is the right size and type. A VAM defines appropriate vehicle type and use for specific tasks and counters the tendency to size-up.
Replace 4-wheel drive with 2-wheel drive vehicles
For municipal and federal agency fleets: evaluate the need for 4-wheel drive vehicles and replace with 2-wheel drive vehicles on appropriate replacement schedule.
Electric alternatives for equipment
For municipal and federal agency fleets: evaluate the feasibility of using electric equipment to meet certain needs.
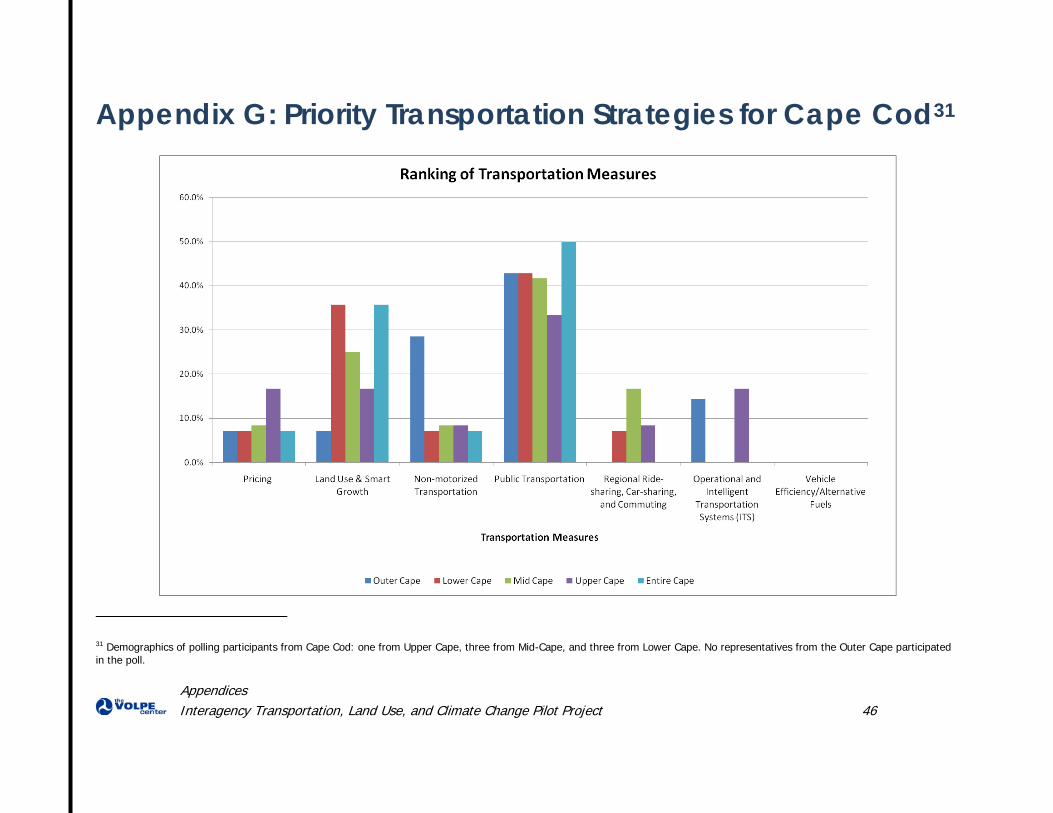
Appendices Interagency Transportation, Land Use, and Climate Change Pilot Project 46
Appendix G: Priority Transportation Strategies for Cape Cod31
31 Demographics of polling participants from Cape Cod: one from Upper Cape, three from Mid-Cape, and three from Lower Cape. No representatives from the Outer Cape participated in the poll.
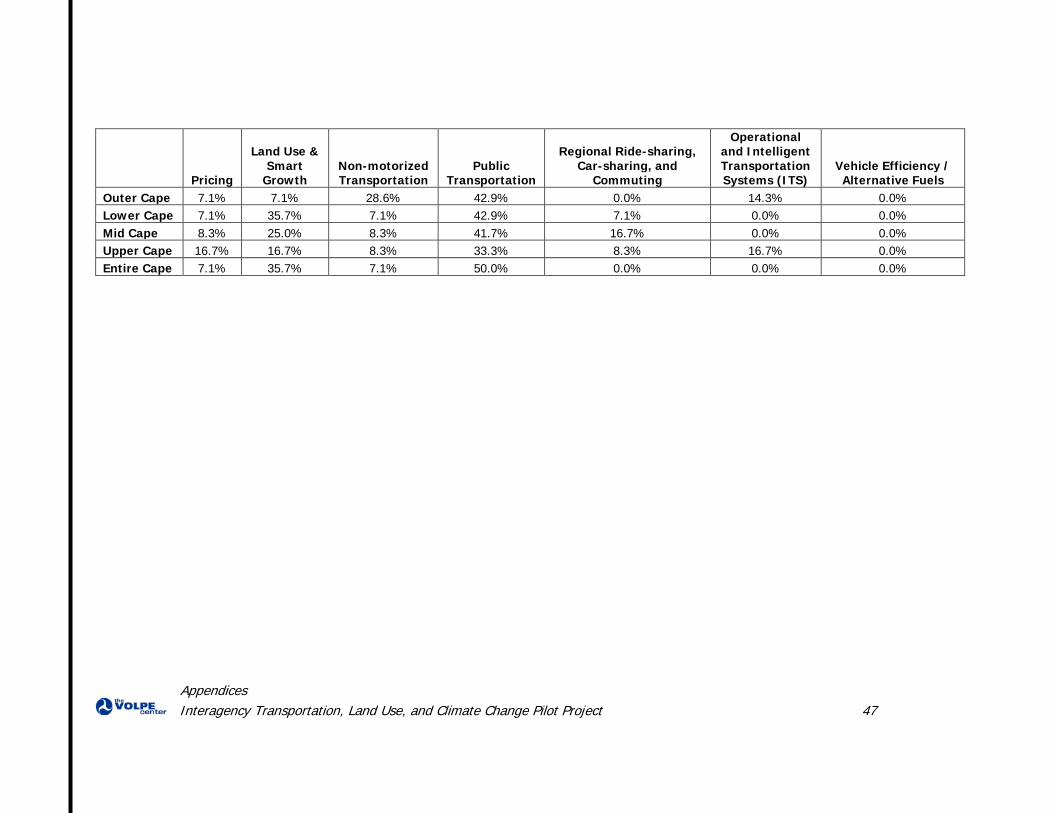
Appendices Interagency Transportation, Land Use, and Climate Change Pilot Project 47
Pricing
Land Use & Smart
Growth Non-motorized Transportation
Public Transportation
Regional Ride-sharing, Car-sharing, and
Commuting
Operational and Intelligent Transportation Systems (ITS)
Vehicle Efficiency / Alternative Fuels
Outer Cape 7.1% 7.1% 28.6% 42.9% 0.0% 14.3% 0.0% Lower Cape 7.1% 35.7% 7.1% 42.9% 7.1% 0.0% 0.0% Mid Cape 8.3% 25.0% 8.3% 41.7% 16.7% 0.0% 0.0% Upper Cape 16.7% 16.7% 8.3% 33.3% 8.3% 16.7% 0.0% Entire Cape 7.1% 35.7% 7.1% 50.0% 0.0% 0.0% 0.0%
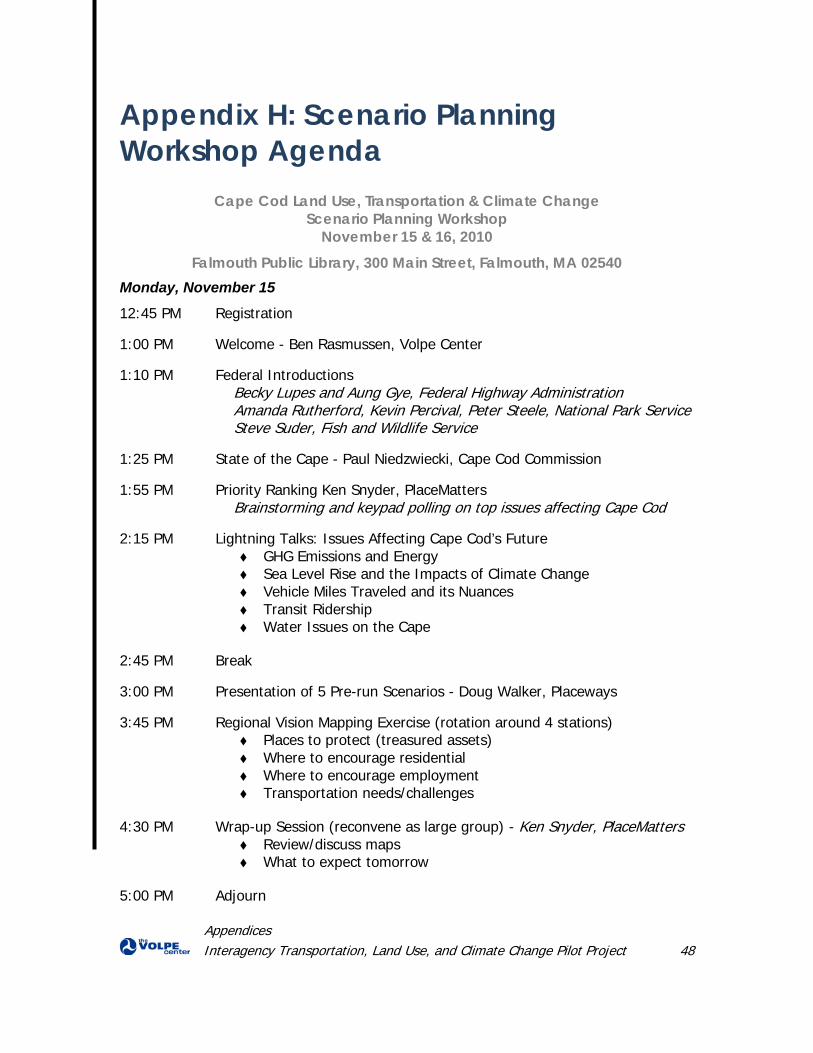
Appendices Interagency Transportation, Land Use, and Climate Change Pilot Project 48
Appendix H: Scenario Planning Workshop Agenda
Cape Cod Land Use, Transportation & Climate Change Scenario Planning Workshop
November 15 & 16, 2010 Falmouth Public Library, 300 Main Street, Falmouth, MA 02540
Monday, November 15
12:45 PM Registration
1:00 PM Welcome - Ben Rasmussen, Volpe Center
1:10 PM Federal Introductions Becky Lupes and Aung Gye, Federal Highway Administration Amanda Rutherford, Kevin Percival, Peter Steele, National Park Service Steve Suder, Fish and Wildlife Service
1:25 PM State of the Cape - Paul Niedzwiecki, Cape Cod Commission
1:55 PM Priority Ranking Ken Snyder, PlaceMatters Brainstorming and keypad polling on top issues affecting Cape Cod
2:15 PM Lightning Talks: Issues Affecting Cape Cod’s Future GHG Emissions and Energy Sea Level Rise and the Impacts of Climate Change Vehicle Miles Traveled and its Nuances Transit Ridership Water Issues on the Cape
2:45 PM Break
3:00 PM Presentation of 5 Pre-run Scenarios - Doug Walker, Placeways
3:45 PM Regional Vision Mapping Exercise (rotation around 4 stations) Places to protect (treasured assets) Where to encourage residential Where to encourage employment Transportation needs/challenges
4:30 PM Wrap-up Session (reconvene as large group) - Ken Snyder, PlaceMatters Review/discuss maps What to expect tomorrow
5:00 PM Adjourn
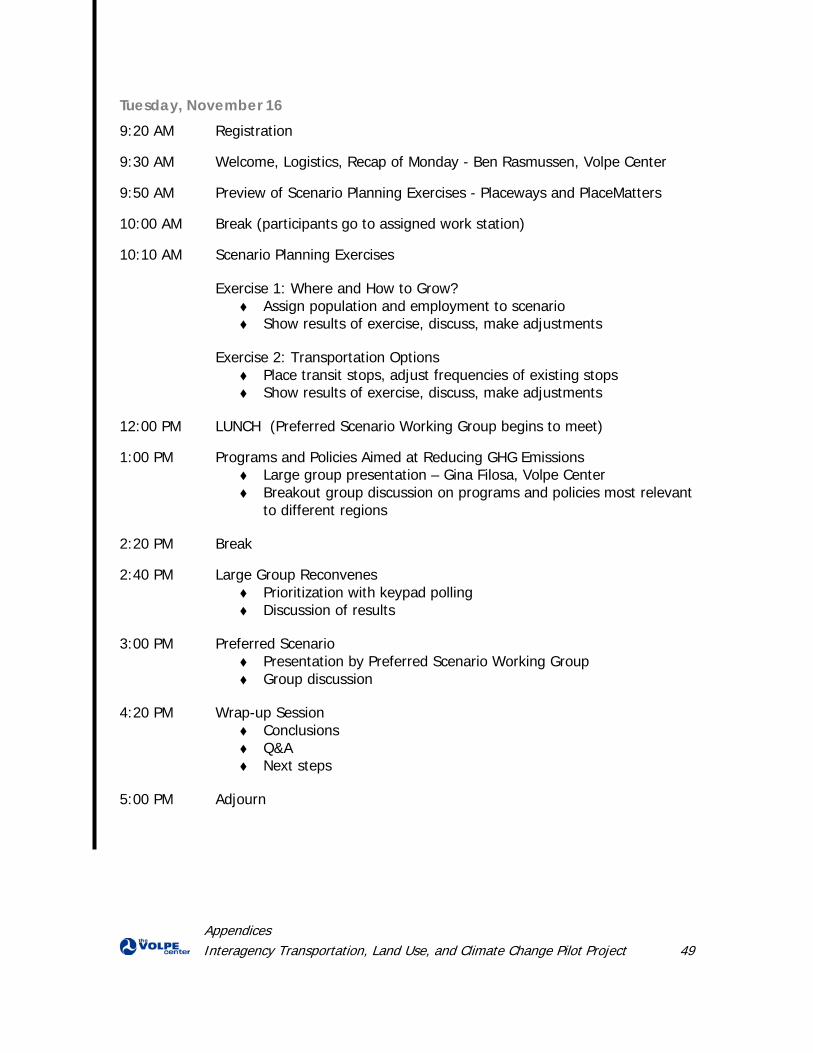
Appendices Interagency Transportation, Land Use, and Climate Change Pilot Project 49
Tuesday, November 16 9:20 AM Registration
9:30 AM Welcome, Logistics, Recap of Monday - Ben Rasmussen, Volpe Center
9:50 AM Preview of Scenario Planning Exercises - Placeways and PlaceMatters
10:00 AM Break (participants go to assigned work station)
10:10 AM Scenario Planning Exercises
Exercise 1: Where and How to Grow? Assign population and employment to scenario Show results of exercise, discuss, make adjustments
Exercise 2: Transportation Options Place transit stops, adjust frequencies of existing stops Show results of exercise, discuss, make adjustments
12:00 PM LUNCH (Preferred Scenario Working Group begins to meet)
1:00 PM Programs and Policies Aimed at Reducing GHG Emissions Large group presentation – Gina Filosa, Volpe Center Breakout group discussion on programs and policies most relevant
to different regions
2:20 PM Break
2:40 PM Large Group Reconvenes Prioritization with keypad polling Discussion of results
3:00 PM Preferred Scenario Presentation by Preferred Scenario Working Group Group discussion
4:20 PM Wrap-up Session Conclusions Q&A Next steps
5:00 PM Adjourn