Embed Size (px)
Citation preview
SEC Number PW-55 File Number
________________________________________________
PLDT INC. (FORMERLY PHILIPPINE LONG
DISTANCE TELEPHONE COMPANY) ________________________________________________
(Company’s Full Name)
Ramon Cojuangco Building Makati Avenue, Makati City
_________________________________________________ (Company’s Address)
(632) 816-8556 ______________________________________
(Telephone Number)
Not Applicable ______________________________________
(Fiscal Year Ending) (month & day)
SEC Form 17-Q ______________________________________
Form Type
Not Applicable ______________________________________
Amendment Designation (if applicable)
June 30, 2016 ______________________________________
Period Ended Date
Not Applicable __________________________________________________
(Secondary License Type and File Number)


SECURITIES AND EXCHANGE COMMISSION
SEC FORM 17-Q
QUARTERLY REPORT PURSUANT TO SECTION 17 OF THE SECURITIES REGULATION CODE (“SRC”) AND
SRC 17 (2) (b) THEREUNDER
1. For the quarterly period ended June 30, 2016 2. SEC Identification Number PW-55 3. BIR Tax Identification No. 000-488-793 4. PLDT Inc. (Formerly Philippine Long Distance Telephone Company) Exact name of registrant as specified in its charter 5. Republic of the Philippines Province, country or other jurisdiction of incorporation or organization 6. Industry Classification Code: (SEC Use Only) 7. Ramon Cojuangco Building, Makati Avenue, Makati City 0721 Address of registrant’s principal office Postal Code 8. (632) 816-8556 Registrant’s telephone number, including area code 9. Not Applicable Former name, former address, and former fiscal year, if changed since last report
10. Securities registered pursuant to Sections 8 of the SRC Title of Each Class Number of Shares of Common Stock Outstanding Common Capital Stock, Php5 par value 216,055,775 shares as at June 30, 2016
11. Are any or all of these securities listed on the Philippine Stock Exchange? Yes [ X ] No [ ]
12. Check whether the registrant
(a) has filed all reports required to be filed by Section 17 of the SRC during the preceding ten months (or for such shorter period that the registrant was required to file such reports):
Yes [ X ] No [ ] (b) has been subject to such filing requirements for the past 90 days.
Yes [ X ] No [ ]
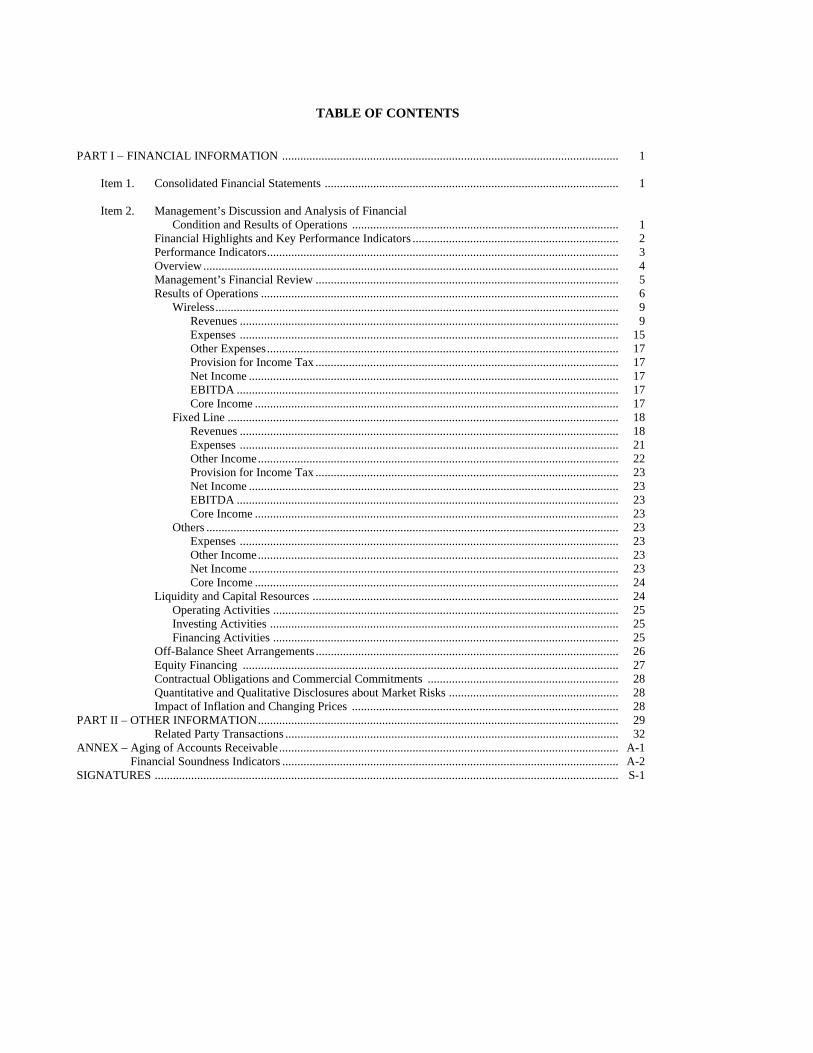
TABLE OF CONTENTS PART I FINANCIAL INFORMATION ............................................................................................................... 1
Item 1. Consolidated Financial Statements ................................................................................................. 1
Item 2. Management’s Discussion and Analysis of Financial Condition and Results of Operations ........................................................................................ 1 Financial Highlights and Key Performance Indicators .................................................................... 2 Performance Indicators .................................................................................................................... 3 Overview ......................................................................................................................................... 4
Management’s Financial Review .................................................................................................... 5 Results of Operations ...................................................................................................................... 6 Wireless ..................................................................................................................................... 9 Revenues ............................................................................................................................. 9 Expenses ............................................................................................................................. 15 Other Expenses .................................................................................................................... 17
Provision for Income Tax .................................................................................................... 17 Net Income .......................................................................................................................... 17
EBITDA .............................................................................................................................. 17 Core Income ........................................................................................................................ 17
Fixed Line ................................................................................................................................. 18 Revenues ............................................................................................................................. 18 Expenses ............................................................................................................................. 21 Other Income ....................................................................................................................... 22
Provision for Income Tax .................................................................................................... 23 Net Income .......................................................................................................................... 23
EBITDA .............................................................................................................................. 23 Core Income ........................................................................................................................ 23
Others ........................................................................................................................................ 23 Expenses ............................................................................................................................. 23 Other Income ....................................................................................................................... 23
Net Income .......................................................................................................................... 23 Core Income ........................................................................................................................ 24
Liquidity and Capital Resources ..................................................................................................... 24 Operating Activities .................................................................................................................. 25 Investing Activities ................................................................................................................... 25 Financing Activities .................................................................................................................. 25
Off-Balance Sheet Arrangements .................................................................................................... 26 Equity Financing ............................................................................................................................ 27 Contractual Obligations and Commercial Commitments ............................................................... 28
Quantitative and Qualitative Disclosures about Market Risks ........................................................ 28 Impact of Inflation and Changing Prices ........................................................................................ 28 PART II – OTHER INFORMATION ....................................................................................................................... 29
Related Party Transactions .............................................................................................................. 32 ANNEX – Aging of Accounts Receivable ................................................................................................................ A-1
Financial Soundness Indicators ............................................................................................................... A-2 SIGNATURES ......................................................................................................................................................... S-1
2Q 2016 Fo rm 17 -Q P age 1 o f 32
PART I – FINANCIAL INFORMATION Item 1. Consolidated Financial Statements Our consolidated financial statements as at June 30, 2016 (unaudited) and December 31, 2015 (audited) and for the six months ended June 30, 2016 and 2015 (unaudited) and related notes (pages F-1 to F-146) are filed as part of this report on Form 17-Q. Item 2. Management’s Discussion and Analysis of Financial Condition and Results of Operations In the following discussion and analysis of our financial condition and results of operations, unless the context indicates or otherwise requires, references to “we,” “us,” “our” or “PLDT Group” mean the PLDT Inc. and its consolidated subsidiaries, and references to “PLDT” mean the PLDT Inc., not including its consolidated subsidiaries (please see Note 2 – Summary of Significant Accounting Policies to the accompanying unaudited consolidated financial statements for the list of these subsidiaries, including a description of their respective principal business activities and PLDT’s direct and/or indirect equity interest). The following discussion and analysis of our financial condition and results of operations should be read in conjunction with the accompanying unaudited consolidated financial statements and the related notes. Our unaudited consolidated financial statements, and the financial information discussed below, have been prepared in accordance with Philippine Financial Reporting Standards, or PFRS, which is virtually converged with International Financial Reporting Standards as issued by the International Accounting Standards Board. PFRS differs in certain significant respects from generally accepted accounting principles, or GAAP, in the U.S. The financial information appearing in this report and in the accompanying unaudited consolidated financial statements is stated in Philippine pesos. All references to “Philippine pesos,” “Php” or “pesos” are to the lawful currency of the Philippines; all references to “U.S. dollars,” “US$” or “dollars” are to the lawful currency of the United States; all references to “Japanese yen,” “JP¥” or “yen” are to the lawful currency of Japan and all references to “Euro” or “€” are to the lawful currency of the European Union. Unless otherwise indicated, translations of Philippine peso amounts into U.S. dollars in this report and in the accompanying unaudited consolidated financial statements were made based on the exchange rate of Php47.01 to US$1.00, the exchange rate as at June 30, 2016 quoted through the Philippine Dealing System. Some information in this report may contain forward-looking statements within the meaning of Section 27A of the U.S. Securities Act of 1933, as amended, and Section 21E of the U.S. Securities Exchange Act of 1934, as amended. We have based these forward-looking statements on our current beliefs, expectations and intentions as to facts, actions and events that will or may occur in the future. Such statements generally are identified by forward-looking words such as “believe,” “plan,” “anticipate,” “continue,” “estimate,” “expect,” “may,” “will” or other similar words. A forward-looking statement may include a statement of the assumptions or bases underlying the forward-looking statement. We have chosen these assumptions or bases in good faith, and we believe that they are reasonable in all material respects. However, we caution you that forward-looking statements and assumed facts or bases almost always vary from actual results, and the differences between the results implied by the forward-looking statements and assumed facts or bases and actual results can be material, depending on the circumstances. When considering forward-looking statements, you should keep in mind the description of risks and cautionary statements in this report. You should also keep in mind that any forward-looking statement made by us in this report or elsewhere speaks only as at the date on which we made it. New risks and uncertainties come up from time to time, and it is impossible for us to predict these events or how they may affect us. We have no duty to, and do not intend to, update or revise the forward-looking statements in this report after the date hereof. In light of these risks and uncertainties, actual results may differ materially from any forward-looking statement made in this report or elsewhere might not occur.
2Q 2016 Fo rm 17 -Q Page 2 o f 32
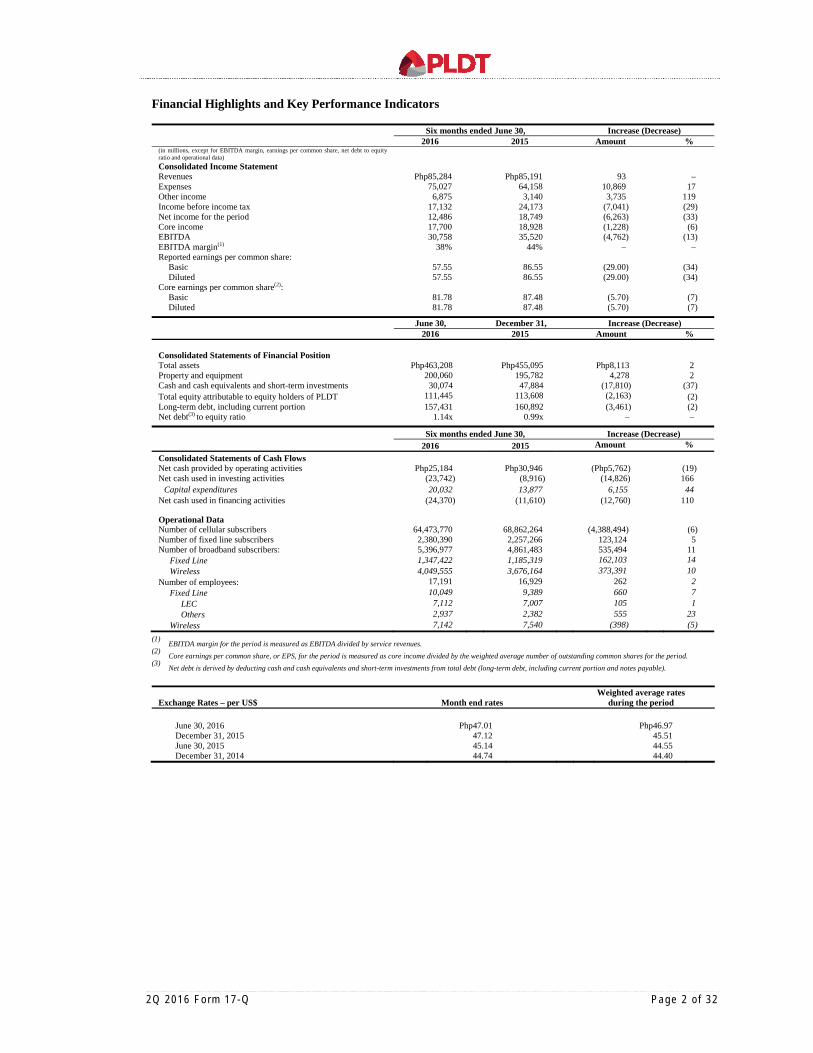
Financial Highlights and Key Performance Indicators
Six months ended June 30, Increase (Decrease) 2016 2015 Amount %
(in millions, except for EBITDA margin, earnings per common share, net debt to equity ratio and operational data)
Consolidated Income Statement Revenues Php85,284 Php85,191 93 – Expenses 75,027 64,158 10,869 17 Other income 6,875 3,140 3,735 119 Income before income tax 17,132 24,173 (7,041) (29) Net income for the period 12,486 18,749 (6,263) (33) Core income 17,700 18,928 (1,228) (6) EBITDA 30,758 35,520 (4,762) (13) EBITDA margin(1) 38% 44% – – Reported earnings per common share:
Basic 57.55 86.55 (29.00) (34) Diluted 57.55 86.55 (29.00) (34)
Core earnings per common share(2): Basic 81.78 87.48 (5.70) (7) Diluted 81.78 87.48 (5.70) (7)
June 30, December 31, Increase (Decrease) 2016 2015 Amount %
Consolidated Statements of Financial Position Total assets Php463,208 Php455,095 Php8,113 2 Property and equipment 200,060 195,782 4,278 2 Cash and cash equivalents and short-term investments 30,074 47,884 (17,810) (37) Total equity attributable to equity holders of PLDT 111,445 113,608 (2,163) (2) Long-term debt, including current portion 157,431 160,892 (3,461) (2) Net debt(3) to equity ratio 1.14x 0.99x – – Six months ended June 30, Increase (Decrease) 2016 2015 Amount %
Consolidated Statements of Cash Flows Net cash provided by operating activities Php25,184 Php30,946 (Php5,762) (19) Net cash used in investing activities (23,742) (8,916) (14,826) 166
Capital expenditures 20,032 13,877 6,155 44 Net cash used in financing activities (24,370) (11,610) (12,760) 110
Operational Data Number of cellular subscribers 64,473,770 68,862,264 (4,388,494) (6) Number of fixed line subscribers 2,380,390 2,257,266 123,124 5 Number of broadband subscribers: 5,396,977 4,861,483 535,494 11
Fixed Line 1,347,422 1,185,319 162,103 14 Wireless 4,049,555 3,676,164 373,391 10
Number of employees: 17,191 16,929 262 2 Fixed Line 10,049 9,389 660 7
LEC 7,112 7,007 105 1 Others 2,937 2,382 555 23
Wireless 7,142 7,540 (398) (5) (1) EBITDA margin for the period is measured as EBITDA divided by service revenues. (2) Core earnings per common share, or EPS, for the period is measured as core income divided by the weighted average number of outstanding common shares for the period. (3) Net debt is derived by deducting cash and cash equivalents and short-term investments from total debt (long-term debt, including current portion and notes payable).
Exchange Rates – per US$ Month end rates Weighted average rates
during the period
June 30, 2016 Php47.01 Php46.97 December 31, 2015 47.12 45.51 June 30, 2015 45.14 44.55 December 31, 2014 44.74 44.40
2Q 2016 Fo rm 17 -Q Page 3 o f 32
Performance Indicators
We use a number of non-GAAP performance indicators to monitor financial performance. These are summarized below and discussed later in this report.
EBITDA
EBITDA for the period is measured as net income excluding depreciation and amortization, amortization of intangible assets, asset impairment on noncurrent assets, financing costs, interest income, equity share in net earnings (losses) of associates and joint ventures, foreign exchange gains (losses) – net, gains (losses) on derivative financial instruments – net, provision for (benefit from) income tax and other income – net. EBITDA is monitored by the management for each business unit separately for purposes of making decisions about resource allocation and performance assessment. EBITDA is presented also as a supplemental disclosure because our management believes that it is widely used by investors in their analysis of the performance of PLDT and to assist them in their comparison of PLDT’s performance with that of other companies in the technology, media and telecommunications sector. We also present EBITDA because it is used by some investors as a way to measure a company’s ability to incur and service debt, make capital expenditures and meet working capital requirements. Companies in the technology, media and telecommunications sector have historically reported EBITDA as a supplement to financial measures in accordance with PFRS. EBITDA should not be considered as an alternative to net income as an indicator of our performance, as an alternative to cash flows from operating activities, as a measure of liquidity or as an alternative to any other measure determined in accordance with PFRS. Unlike net income, EBITDA does not include depreciation and amortization, and financing costs and, therefore, does not reflect current or future capital expenditures or the cost of capital. We compensate for these limitations by using EBITDA as only one of several comparative tools, together with PFRS-based measurements, to assist in the evaluation of operating performance. Such PFRS-based measurements include income before income tax, net income, cash flows from operations and cash flow data. We have significant uses of cash flows, including capital expenditures, interest payments, debt principal repayments, taxes and other non-recurring charges, which are not reflected in EBITDA. Our calculation of EBITDA may be different from the calculation methods used by other companies and, therefore, comparability may be limited.
Core Income
Core income for the period is measured as net income attributable to equity holders of PLDT (net income less net income attributable to noncontrolling interests), excluding foreign exchange gains (losses) – net, gains (losses) on derivative financial instruments – net (excluding hedge costs), asset impairment on noncurrent assets, other non-recurring gains (losses), net of tax effect of aforementioned adjustments, as applicable, and similar adjustments to equity share in net earnings (losses) of associates and joint ventures. The core income results are monitored by the management for each business unit separately for purposes of making decisions about resource allocation and performance assessment. Also, core income is used by the management as a basis of determining the level of dividend payouts to shareholders and basis of granting incentives to employees. Core income should not be considered as an alternative to income before income tax or net income determined in accordance with PFRS as an indicator of our performance. Unlike income before income tax, core income does not include foreign exchange gains and losses, gains and losses on derivative financial instruments, asset impairments and other non-recurring gains and losses. We compensate for these limitations by using core income as only one of several comparative tools, together with PFRS-based measurements, to assist in the evaluation of operating performance. Such PFRS-based measurements include income before income tax and net income. Our calculation of core income may be different from the calculation methods used by other companies and, therefore, comparability may be limited.
2Q 2016 Fo rm 17 -Q Page 4 o f 32
Overview
We are the largest and most diversified telecommunications company in the Philippines which delivers data and multi-media services in the Philippines. We have organized our business into business units based on our products and services and have three reportable operating segments which serve as the bases for management’s decision to allocate resources and evaluate operating performance:
Wireless wireless telecommunications services provided by Smart Communications, Inc., or
Smart, and Digital Mobile Philippines, Inc., or DMPI, which owns the Sun Cellular business and is a wholly-owned subsidiary of Digital Telecommunications Philippines, Inc., or Digitel, our cellular service providers; Voyager Innovations, Inc., or Voyager, and certain subsidiaries, our mobile applications and digital platforms developers and mobile financial services provider; Smart Broadband, Inc., or SBI, and subsidiary and Primeworld Digital Systems, Inc., or PDSI, our wireless broadband service providers; ACeS Philippines Cellular Satellite Corporation, or ACeS Philippines, our satellite information and messaging services provider; WiFun, Inc., our WiFi-enabler; and certain subsidiaries of PLDT Global Corporation, or PLDT Global, our mobile virtual network operations, or MVNO, provider;
Fixed Line fixed line telecommunications services primarily provided by PLDT. We also
provide fixed line services through PLDT’s subsidiaries, namely, PLDT Clark Telecom, Inc., PLDT Subic Telecom, Inc., PLDT-Philcom, Inc. or Philcom, and its subsidiaries, or Philcom Group, PLDT-Maratel, Inc., SBI, PDSI, Bonifacio Communications Corporation, PLDT Global and certain subsidiaries and Digitel, all of which together account for approximately 3% of our consolidated fixed line subscribers; data center, cloud, big data, managed ICT services and resellership provided by ePLDT, Inc., or ePLDT, IP Converge Data Services, Inc., or IPCDSI, and subsidiary, or IPCDSI Group, ABM Global Solutions, Inc., or AGS, and its subsidiaries, or AGS Group, Curo Teknika, Inc. and ePDS, Inc., or ePDS; business infrastructure and solutions, intelligent data processing and implementation services and data analytics insight generation provided by Talas Data Intelligence, Inc., or Talas; distribution of Filipino channels and content by Pilipinas Global Network Limited and its subsidiaries; and
Others PLDT Communications and Energy Ventures, Inc., or PCEV, PLDT Global
Investment Holdings, Inc., Mabuhay Investments Corporation, PLDT Global Investments Corporation, PLDT Digital Investments Pte. Ltd., or PLDT Digital, and its subsidiary, our investment companies.
As at June 30, 2016, our chief operating decision maker, or our Management Committee, views our business activities in three business units: Wireless, Fixed Line and Others. On June 13, 2016, we unveiled the new PLDT and Smart logos which are shaped like a triangle, embody what we value most: our Customers, our People, and our Innovation. The logos represent our current thrust to decisively shift our business to data-driven services, in line with our digital pivot which aims to transform our networks into the most data-capable infrastructure, and reflective of our desire to bring relevant innovations to empower our customers who are increasingly embracing digital services into their daily lives. These symbolize the start of a new journey: #ANewDay to create a better tomorrow for the Filipino consumers. With practical innovations that focus on our consumers’ needs, coupled with human-centered service, we aspire to empower Filipinos to enjoy a digital-centered life without barriers.
2Q 2016 Fo rm 17 -Q Page 5 o f 32
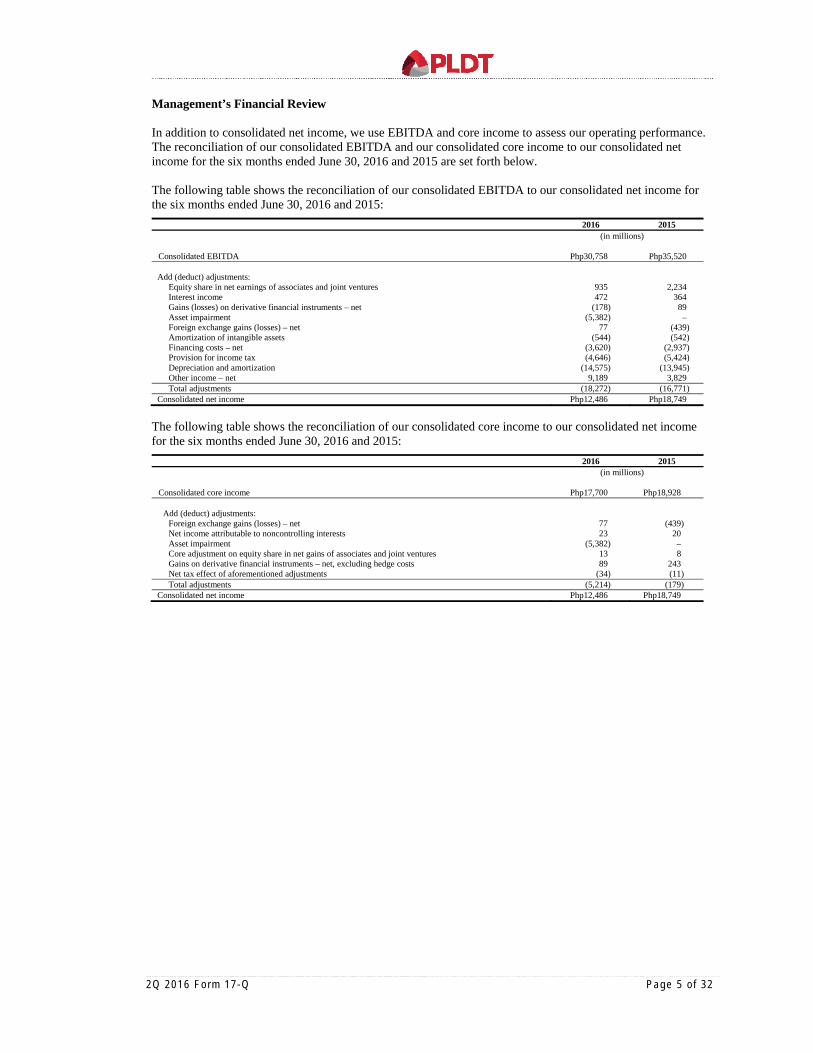
Management’s Financial Review In addition to consolidated net income, we use EBITDA and core income to assess our operating performance. The reconciliation of our consolidated EBITDA and our consolidated core income to our consolidated net income for the six months ended June 30, 2016 and 2015 are set forth below.
The following table shows the reconciliation of our consolidated EBITDA to our consolidated net income for the six months ended June 30, 2016 and 2015:
2016 2015
(in millions)
Consolidated EBITDA Php30,758 Php35,520 Add (deduct) adjustments:
Equity share in net earnings of associates and joint ventures 935 2,234 Interest income 472 364 Gains (losses) on derivative financial instruments – net (178) 89 Asset impairment (5,382) – Foreign exchange gains (losses) – net 77 (439) Amortization of intangible assets (544) (542) Financing costs – net (3,620) (2,937) Provision for income tax (4,646) (5,424) Depreciation and amortization (14,575) (13,945) Other income – net 9,189 3,829 Total adjustments (18,272) (16,771)
Consolidated net income Php12,486 Php18,749
The following table shows the reconciliation of our consolidated core income to our consolidated net income for the six months ended June 30, 2016 and 2015:
2016 2015
(in millions)
Consolidated core income Php17,700 Php18,928 Add (deduct) adjustments:
Foreign exchange gains (losses) – net 77 (439) Net income attributable to noncontrolling interests 23 20 Asset impairment (5,382) – Core adjustment on equity share in net gains of associates and joint ventures 13 8 Gains on derivative financial instruments – net, excluding hedge costs 89 243 Net tax effect of aforementioned adjustments (34) (11) Total adjustments (5,214) (179)
Consolidated net income Php12,486 Php18,749
2Q 2016 Fo rm 17 -Q Page 6 o f 32
Results of Operations
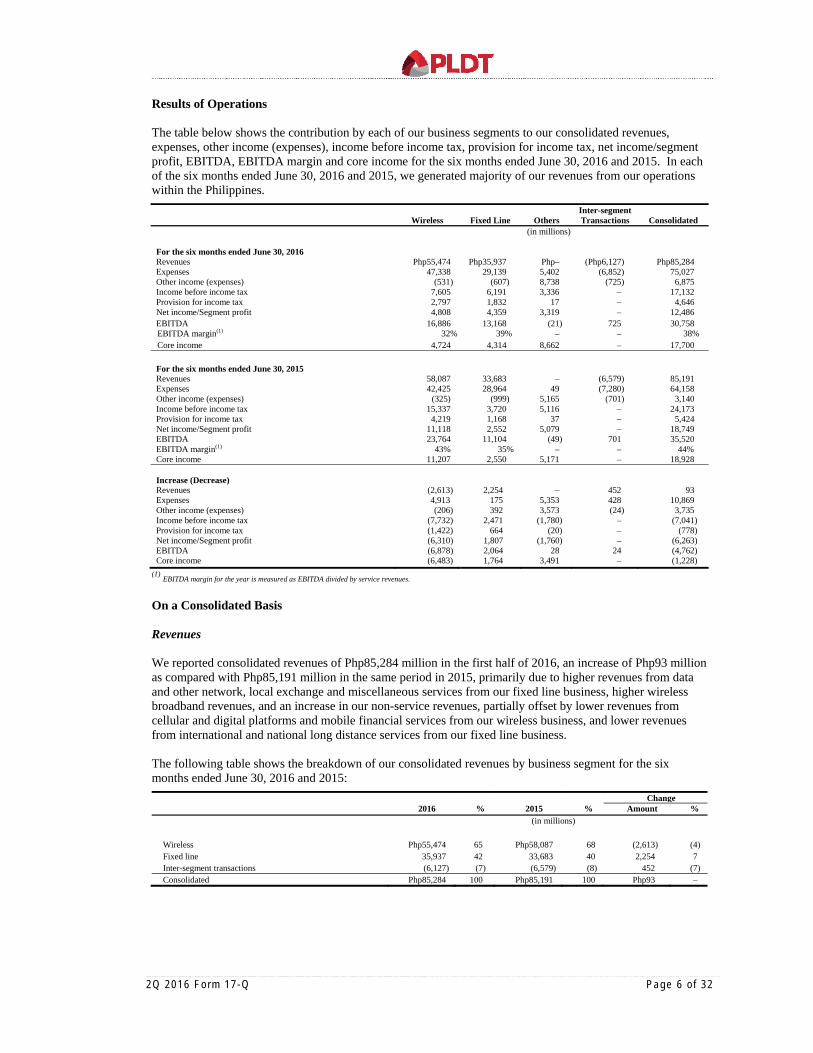
The table below shows the contribution by each of our business segments to our consolidated revenues, expenses, other income (expenses), income before income tax, provision for income tax, net income/segment profit, EBITDA, EBITDA margin and core income for the six months ended June 30, 2016 and 2015. In each of the six months ended June 30, 2016 and 2015, we generated majority of our revenues from our operations within the Philippines.
Wireless Fixed Line Others Inter-segment Transactions Consolidated
(in millions) For the six months ended June 30, 2016 Revenues Php55,474 Php35,937 Php– (Php6,127) Php85,284 Expenses 47,338 29,139 5,402 (6,852) 75,027 Other income (expenses) (531) (607) 8,738 (725) 6,875 Income before income tax 7,605 6,191 3,336 – 17,132 Provision for income tax 2,797 1,832 17 – 4,646 Net income/Segment profit 4,808 4,359 3,319 – 12,486 EBITDA 16,886 13,168 (21) 725 30,758 EBITDA margin(1) 32% 39% – – 38% Core income 4,724 4,314 8,662 – 17,700
For the six months ended June 30, 2015 Revenues 58,087 33,683 – (6,579) 85,191 Expenses 42,425 28,964 49 (7,280) 64,158 Other income (expenses) (325) (999) 5,165 (701) 3,140 Income before income tax 15,337 3,720 5,116 – 24,173 Provision for income tax 4,219 1,168 37 – 5,424 Net income/Segment profit 11,118 2,552 5,079 – 18,749 EBITDA 23,764 11,104 (49) 701 35,520 EBITDA margin(1) 43% 35% – – 44% Core income 11,207 2,550 5,171 – 18,928
Increase (Decrease) Revenues (2,613) 2,254 – 452 93 Expenses 4,913 175 5,353 428 10,869 Other income (expenses) (206) 392 3,573 (24) 3,735 Income before income tax (7,732) 2,471 (1,780) – (7,041) Provision for income tax (1,422) 664 (20) – (778) Net income/Segment profit (6,310) 1,807 (1,760) – (6,263) EBITDA (6,878) 2,064 28 24 (4,762) Core income (6,483) 1,764 3,491 – (1,228)
(1) EBITDA margin for the year is measured as EBITDA divided by service revenues.
On a Consolidated Basis
Revenues
We reported consolidated revenues of Php85,284 million in the first half of 2016, an increase of Php93 million as compared with Php85,191 million in the same period in 2015, primarily due to higher revenues from data and other network, local exchange and miscellaneous services from our fixed line business, higher wireless broadband revenues, and an increase in our non-service revenues, partially offset by lower revenues from cellular and digital platforms and mobile financial services from our wireless business, and lower revenues from international and national long distance services from our fixed line business.
The following table shows the breakdown of our consolidated revenues by business segment for the six months ended June 30, 2016 and 2015:
Change
2016 % 2015 % Amount % (in millions)
Wireless Php55,474 65 Php58,087 68 (2,613) (4) Fixed line 35,937 42 33,683 40 2,254 7 Inter-segment transactions (6,127) (7) (6,579) (8) 452 (7) Consolidated Php85,284 100 Php85,191 100 Php93 –
2Q 2016 Fo rm 17 -Q Page 7 o f 32
Expenses
Consolidated expenses increased by Php10,869 million, or 17%, to Php75,027 million in the first half of 2016 from Php64,158 million in the same period in 2015, as a result of higher expenses related to asset impairment, cost of sales, depreciation and amortization, and operating expenses related to professional and other contracted services, rent, repairs and maintenance, and other operating expenses, partially offset by lower expenses related to compensation and employee benefits, selling and promotions, and taxes and licenses, as well as lower interconnection costs.
The following table shows the breakdown of our consolidated expenses by business segment for the six months ended June 30, 2016 and 2015:
Change
2016 % 2015 % Amount % (in millions)
Wireless Php47,338 63 Php42,425 66 Php4,913 12 Fixed line 29,139 39 28,964 45 175 1 Others 5,402 7 49 – 5,353 10,924 Inter-segment transactions (6,852) (9) (7,280) (11) 428 (6) Consolidated Php75,027 100 Php64,158 100 Php10,869 17
Other Income
Consolidated other income amounted to Php6,875 million in the first half of 2016, an increase of Php3,735 million from Php3,140 million in the same period in 2015, primarily due to the combined effects of the following: (i) an increase in other income by Php5,360 million due to the higher gain on sale of Beacon shares by PCEV in 2016 as compared to the gain on sale of Meralco shares by Beacon in 2015, higher gain on sale of property and higher income from consultancy services; (ii) net foreign exchange gains of Php77 million for the six months ended June 30, 2016 as against net foreign exchange losses of Php439 million in the same period in 2015 on account of revaluation of net foreign currency-denominated assets and liabilities due to the appreciation of the Philippine peso relative to the U.S. dollar to Php 47.01 as at June 30, 2016 from Php 47.12 as at December 31, 2015 as against the depreciation of the Philippine peso relative to the U.S. dollar to Php45.14 as at June 30, 2015 from Php 44.74 as at December 31, 2014; (iii) higher interest income by Php108 million due to increase in principal amount of dollar temporary cash investments, partly offset by lower weighted average peso interest rates and a decrease in peso temporary cash investments; (iv) a decrease in equity share in net earnings of associates by Php1,299 million due to lower share in net earnings of Beacon Electronic Asset Holdings, Inc., or Beacon, share in net losses of Automated Fare Collection System, Inc., or AFCSI, Cignal TV, Inc., or Cignal TV, and Vega Telecom, Inc., or VTI, and Ecommerce Pay Holding S.à.r.l., or mePay Global, for the six months ended June 30, 2016, partly offset by share in net earnings of Hastings Holdings, Inc., or Hastings, Asia Outsourcing Beta Limited, or Beta, and Digitel Crossing, Inc., or DCI; (v) losses on derivative financial instruments of Php178 million in the first half of 2016 as against gains on derivative financial instruments of Php89 million in the same period in 2015 on account of mark-to-market loss on long-term currency swaps and forward purchase contracts due to narrower dollar and peso interest rate differentials and appreciation of the Philippine peso relative to the U.S. dollar in the first six months of 2016; and (vi) higher net financing costs by Php683 million due to a higher outstanding loan balance, higher weighted average interest rate and higher financing charges, partly offset by higher capitalized interest and the appreciation of the Philippine peso relative to the U.S. dollar in the first six months of 2016.
The following table shows the breakdown of our consolidated other income (expenses) by business segment for the six months ended June 30, 2016 and 2015:
Change 2016 2015 Amount %
(in millions) Wireless (Php531) (Php325) (Php206) 63 Fixed line (607) (999) 392 (39) Others 8,738 5,165 3,573 69 Inter-segment transactions (725) (701) (24) 3 Consolidated Php6,875 Php3,140 Php3,735 119

2Q 2016 Fo rm 17 -Q Page 8 o f 32
Net Income
Consolidated net income decreased by Php6,263 million, or 33%, to Php12,486 million in the first half of 2016, from Php18,749 million in the same period in 2015. The decrease was mainly due to the combined effects of the following: (i) an increase in consolidated expenses by Php10,869 million; (ii) an increase in consolidated other income – net by Php3,735 million; (iii) a decrease in consolidated provision for income tax by Php778 million; and (iv) an increase in consolidated revenues by Php93 million. Our consolidated basic and diluted EPS decreased to Php57.55 in the first half of 2016 from consolidated basic and diluted EPS of Php86.55 in the same period in 2015. Our weighted average number of outstanding common shares was approximately 216.06 million in each of the six months ended June 30, 2016 and 2015.
The following table shows the breakdown of our consolidated net income by business segment for the six months ended June 30, 2016 and 2015:
Change
2016 % 2015 % Amount % (in millions)
Wireless Php4,808 39 Php11,118 59 (Php6,310) (57) Fixed line 4,359 35 2,552 14 1,807 71 Others 3,319 26 5,079 27 (1,760) (35) Consolidated Php12,486 100 Php18,749 100 (Php6,263) (33)
EBITDA Our consolidated EBITDA amounted to Php30,758 million in the first half of 2016, a decrease of Php4,762 million, or 13%, as compared with Php35,520 million in the same period in 2015, primarily due to higher cost of sales, provisions for doubtful accounts and inventory obsolescence, as well as higher consolidated operating expenses consisting of professional and other contracted services, rent, and repairs and maintenance, partially offset by lower compensation and employee benefits, selling and promotions, taxes and licenses, and interconnection costs. The following table shows the breakdown of our consolidated EBITDA by business segment for the six months ended June 30, 2016 and 2015:
Change
2016 % 2015 % Amount % (in millions)
Wireless Php16,886 55 Php23,764 67 (Php6,878) (29) Fixed line 13,168 43 11,104 31 2,064 19 Others (21) – (49) – 28 (57) Inter-segment transactions 725 2 701 2 24 3 Consolidated Php30,758 100 Php35,520 100 (Php4,762) (13)
Core Income Our consolidated core income amounted to Php17,700 million in the first half of 2016, a decrease of Php1,228 million, or 6%, as compared with Php18,928 million in the same period in 2015 primarily due to higher consolidated operating expenses, partially offset by higher other income, lower provision for income tax and higher consolidated revenues. Our consolidated basic and diluted core EPS, decreased to Php81.78 in the first half of 2016 from Php87.48 in the same period in 2015.
The following table shows the breakdown of our consolidated core income by business segment for the six months ended June 30, 2016 and 2015:
Change
2016 % 2015 % Amount %
(in millions)
Wireless Php4,724 27 Php11,207 59 (Php6,483) (58) Fixed line 4,314 24 2,550 14 1,764 69 Others 8,662 49 5,171 27 3,491 68 Consolidated Php17,700 100 Php18,928 100 (Php1,228) (6)
2Q 2016 Fo rm 17 -Q Page 9 o f 32
On a Business Segment Basis Wireless Revenues We generated revenues of Php55,474 million from our wireless business in the first half of 2016, a decrease of Php2,613 million, or 4%, from Php58,087 million in the same period in 2015. The following table summarizes our total revenues from our wireless business for the six months ended June 30, 2016 and 2015 by service segment:
Increase (Decrease) 2016 % 2015 % Amount %
(in millions) Service Revenues:
Cellular Php46,359 84 Php49,356 85 (Php2,997) (6) Wireless broadband and others
Wireless broadband 5,842 10 5,205 9 637 12 Others 346 1 522 1 (176) (34)
Digital platforms and mobile financial services 194 – 510 1 (316) (62) 52,741 95 55,593 96 (2,852) (5)
Non-Service Revenues: Sale of cellular handsets, cellular subscriber identification module,
or SIM,-packs and broadband data modems 2,733 5 2,494 4 239 10 Total Wireless Revenues Php55,474 100 Php58,087 100 (Php2,613) (4)
Service Revenues Our wireless service revenues in the first half of 2016 decreased by Php2,852 million, or 5%, to Php52,741 million as compared with Php55,593 million in the same period in 2015, mainly as a result of lower revenues from voice and text messaging services, partially offset by higher revenues from mobile internet and broadband services. As a percentage of our total wireless revenues, service revenues accounted for 95% and 96% in the first half of 2016 and 2015, respectively. Cellular Service Our cellular service revenues in the first half of 2016 amounted to Php46,359 million, a decrease of Php2,997 million, or 6%, from Php49,356 million in the same period in 2015. Cellular service revenues accounted for 88% and 89% of our wireless service revenues in the first half of 2016 and 2015, respectively. We have focused on segmenting the market by offering sector-specific, value-driven packages for our subscribers. Our cellular services include text and voice, as well as a variety of data and multi-media services that cater to the growing use of smartphones by our subscribers. We offer a variety of packages that include load buckets which provide a fixed number of messages, calls of preset duration and data allowance with prescribed validity. Smart and Sun Cellular also provide buckets which offer voice, text and hybrid bundles available to all networks, as well as packages with unlimited on-net voice, text, volume-based data, and combinations thereof, denominations of which depend on the duration and nature of the packages. In order to fulfill its goal of providing its subscribers with the best digital experience, Smart committed to improving its overall customer data experience. On April 12, 2016, Smart officially launched its network roadmap geared towards improving quality, coverage and internet speeds. The network improvement integrates and synergizes Smart and Sun Cellular networks to improve coverage and quality for subscribers of both brands. Smart was also the first to introduce LTE-Advanced in Boracay on April 13, 2016 which achieved breakthrough LTE speeds of up to 250 Mbps. The program also boosted 3G data service behind an enhanced 3G/HSPA/HSPA+ coverage and capacity. In conjunction with this drive, we introduced on July 1, 2016, Giga Surf 50 with 1GB of open access data allowance plus 300 MB for access to iflix, Spinnr, YouTube, Vimeo, DailyMotion, Dubsmash and Skype Qik for Php50 valid for 3 days. This promo is open to Smart Postpaid, Smart Prepaid, Smart Bro Postpaid and Smart Bro Prepaid subscribers and can also be shared through Smart’s PasaData.
2Q 2016 Fo rm 17 -Q Page 10 o f 32
The following table shows the breakdown of our cellular service revenues for the six months ended June 30, 2016 and 2015:
Increase (Decrease)
2016 2015 Amount % (in millions)
Cellular service revenues Php46,359 Php49,356 (Php2,997) (6)
By service type 45,312 48,335 (3,023) (6)
Prepaid 32,897 36,738 (3,841) (10) Postpaid 12,415 11,597 818 7
By component 45,312 48,335 (3,023) (6)
Data 25,404 24,696 708 3 Voice 19,908 23,639 (3,731) (16)
Others(1) 1,047 1,021 26 3
(1) Refers to other non-subscriber-related revenues consisting primarily of inbound international roaming fees, share in revenues from Smart Money, PLDT’s WeRoam and PLDT
Landline Plus, or PLP, services, a small number of leased line contracts, and revenues from and other Smart subsidiaries. The following table shows other key measures of our cellular business as at and for the six months ended June 30, 2016 and 2015:
Increase (Decrease)
2016 2015 Amount % Cellular subscriber base 64,473,770 68,862,264 (4,388,494) (6)
Prepaid 61,479,780 65,843,593 (4,363,813) (7) Smart 21,500,966 24,188,189 (2,687,223) (11) TNT 30,863,446 27,902,164 2,961,282 11 Sun Cellular 9,115,368 13,753,240 (4,637,872) (34)
Postpaid 2,993,990 3,018,671 (24,681) (1) Sun Cellular 1,678,893 1,879,135 (200,242) (11) Smart 1,315,097 1,139,536 175,561 15
Systemwide traffic volumes (in million minutes) Calls 32,990 25,995 6,995 27
Domestic 31,978 24,664 7,314 30 Inbound 451 512 (61) (12) Outbound 31,527 24,152 7,375 31
International 1,012 1,331 (319) (24) Inbound 873 1,141 (268) (23) Outbound 139 190 (51) (27)
Text/Data count (in million hits) 161,273 196,930 (35,657) (18)
Text messages 160,253 195,958 (35,705) (18) Domestic 159,909 195,515 (35,606) (18)
Bucket-Priced/Unlimited 142,591 177,833 (35,242) (20) Standard 17,318 17,682 (364) (2)
International 344 443 (99) (22) Value-Added Services 1,020 972 48 5
Prepaid Revenues
Revenues generated from our prepaid cellular services amounted to Php32,897 million in the first half of 2016, a decrease of Php3,841 million, or 10%, as compared with Php36,738 million in the same period in 2015. Prepaid cellular service revenues accounted for 73% and 76% of cellular voice and data revenues in the first half of 2016 and 2015, respectively. The decrease in revenues from our prepaid cellular services was primarily driven by lower prepaid cellular subscriber base resulting to lower voice and text messaging revenues, partially offset by an increase in mobile internet revenues. Smart Prepaid continues to push its “smartphone-for-all” strategy. On June 17, 2016, Smart Prepaid introduced Starmobile Play Click at Php1,288, which comes with a free 100MB mobile data per month for 12 months and Php30 per month load reward for 12 months if subscriber reaches a minimum top-up of Php100 per month. To avail, a subscriber needs to purchase Starmobile Play Click together with a Php100 Smart Prepaid load card.
2Q 2016 Fo rm 17 -Q Page 11 o f 32
Smart’s value brand, TNT, launched its new logo, brand ambassadors and theme song “It’s a Tropa Thing” on June 8, 2016. TNT continues to offer the Alden & Maine load or AM15 that allows Katropas to keep up with their favorite couple, Alden and Maine, and all updates online. With Php15 per day, a TNT subscriber can enjoy one day of unlimited texts to all networks, 60 minutes of calls to TNT, Smart and Sun, and 100MB of mobile data that can be used to access any of their favorite apps like Facebook, Viber, Twitter, Clash of Clans and Dubsmash. This offer provides more services to its subscribers than just the usual texting and calling.
Postpaid Revenues
Revenues generated from postpaid cellular service amounted to Php12,415 million in the first half of 2016, an increase of Php818 million, or 7%, as compared with Php11,597 million in the same period in 2015, and accounted for 27% and 24% of cellular voice and data revenues in the first half of 2016 and 2015, respectively. The increase in our postpaid cellular service revenues was primarily driven by the continuous growth of our Smart postpaid subscriber base. We continue to offer a wide array of choices for postpaid subscription plans. Smart All-in Plans, which are offered at Plan 500 up to Plan 2500, enable subscribers to avail of call, text and data services, mix and match services or create their own plan using various flexibundles, all charged within the subscriber’s monthly service fee. Top picks for flexibundles are Tri-net Plus 399, Unli Call and Text 599 and Big Bytes 99 while the newest bundles include App On, Giga Surf and Shared Data bundles. Smart Postpaid also offers the Smart Surf Plus Plans with bigger data allowance, call and text credits, and a free VAS subscription of choice. Starting at Plan 399 with 100MB of data, up to Plan 1999 with 9GB, plus free calls and texts bundles. The latest iPhones are also available through iPhone Plans from Plan 799 to Plan 2499, inclusive of All Month Surf browsing which allows subscribers to do regular online activities such as web searches, social media posts, email and chat messaging, and a monthly data volume allowance which can be used for heavier internet activities like music or video streaming, downloading/uploading, peer-to-peer file-sharing, VoIP calls and the likes.
Data Services
Cellular revenues from our data services, which include all text messaging-related services, as well as VAS, mobile internet and other data revenues, increased by Php708 million, or 3%, to Php25,404 million in the first half of 2016 from Php24,696 million in the same period in 2015 primarily due to higher mobile internet revenues, partially offset by lower text messaging revenues. Cellular data services accounted for 55% and 50% of our cellular service revenues in the first half of 2016 and 2015, respectively. The following table shows the breakdown of our cellular data service revenues for the six months ended June 30, 2016 and 2015:
Increase (Decrease) 2016 2015 Amount % (in millions)
Text messaging Domestic Php15,734 Php17,313 (Php1,579) (9)
Bucket-Priced/Unlimited 10,984 11,657 (673) (6) Standard 4,750 5,656 (906) (16)
International 985 1,364 (379) (28) 16,719 18,677 (1,958) (10) Mobile internet(1) 8,068 5,216 2,852 55 Value-added services(2) 617 803 (186) (23) Total Php25,404 Php24,696 Php708 3
(1) Includes revenues from web-based services, net of allocated discounts and content provider costs. (2) Includes revenues from Smart Pasa Load , Sun Cellular Give-a-load and Dial*SOS, net of allocated discounts; Music (Spinnr and Deezer, music subscription mainly ring back
tunes and music downloads, net of allocated discounts and content provider costs); Gaming (games subscriptions, downloads, and purchases, net of allocated discounts and content provider costs); Videos (video subscriptions, downloads and video and movie streaming via iflix and Fox, net of allocated discounts and content provider costs); Infotainment (subscriptions and downloads of broadcast materials that are intended both to entertain and to inform, as well as info-on-demand, net of allocated discounts and content provider costs); financial services ( revenues from Smart Money Clicks via Smart Menu and mobile banking); Communicate, (revenues from group chat, text and voice messaging services net of allocated discounts and content provider costs); and Other VAS ( includes revenues from application program interface (API) downloads, info-on-demand and voice text services, net of allocated discounts and content provider costs).
2Q 2016 Fo rm 17 -Q Page 12 o f 32
Text messaging-related services contributed revenues of Php16,719 million in the first half of 2016, a decrease of Php1,958 million, or 10%, as compared with Php18,677 million in the same period in 2015, and accounted for 66% and 76% of our total cellular data service revenues in the first half of 2016 and 2015, respectively. The decrease in revenues from text messaging-related services resulted mainly from lower outbound standard and bucket-priced/unlimited text, as well as lower international text messaging revenues. Text messaging revenues from various bucket-priced/unlimited text offers totaled Php10,984 million in the first half of 2016, a decrease of Php673 million, or 6%, as compared with Php11,657 million in the same period in 2015. Bucket-priced/unlimited text messages decreased by 35,242 million, or 20%, to 142,591 million in the first half of 2016 from 177,833 million in the same period in 2015. Mobile internet service revenues increased by Php2,852 million, or 55%, to Php8,068 million in the first half of 2016 from Php5,216 million in the same period in 2015 as a result of higher traffic for mobile internet browsing mainly due to prevalent use of mobile apps, social networking sites and other over-the-top, or OTT, services. Data offerings such as Smart Big Bytes Barkada, Shared Data, Giga Surf and App on Flexibundles were also introduced during the year to boost data usage.
Voice Services
Cellular revenues from our voice services, which include all voice traffic and voice VAS, such as voicemail and outbound international roaming, decreased by Php3,731 million, or 16%, to Php19,908 million in the first half of 2016 from Php23,639 million in the same period in 2015 primarily due to lower domestic and international voice revenues caused by the preference for alternative calling options and other OTT services such as Viber, Facebook Messenger, etc. Cellular voice services accounted for 43% and 48% of our cellular service revenues in the first half of 2016 and 2015, respectively.
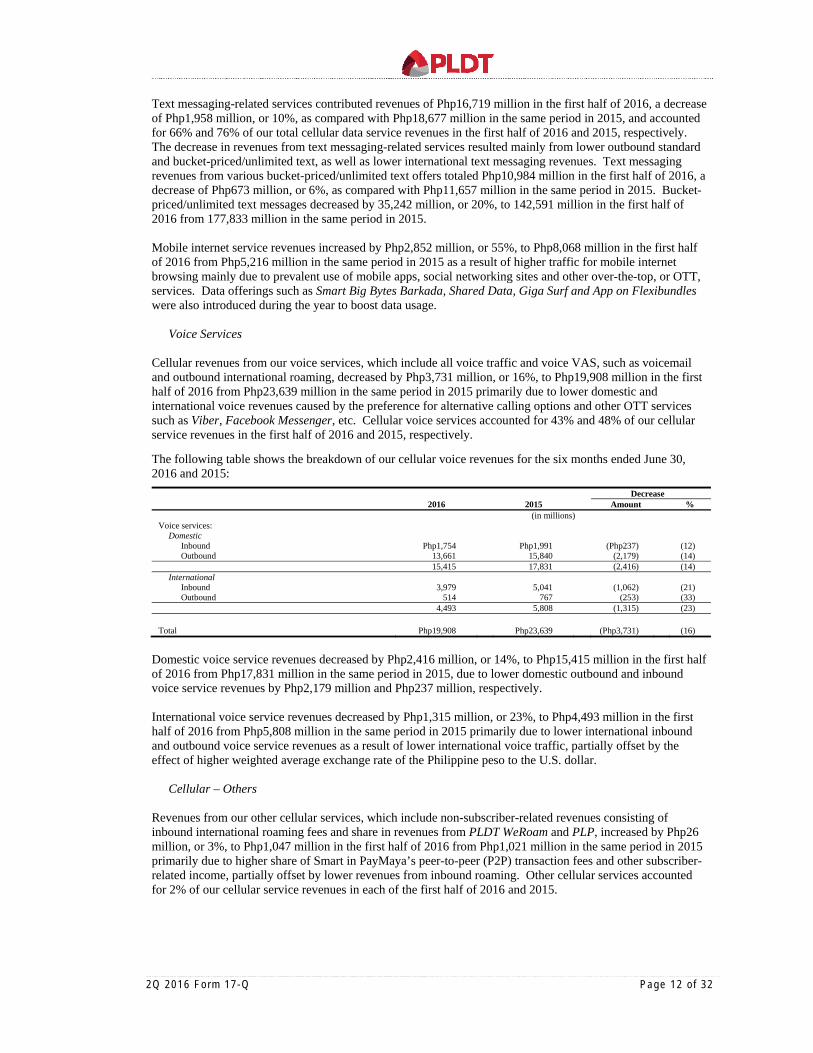
The following table shows the breakdown of our cellular voice revenues for the six months ended June 30, 2016 and 2015:
Decrease 2016 2015 Amount % (in millions)
Voice services: Domestic
Inbound Php1,754 Php1,991 (Php237) (12) Outbound 13,661 15,840 (2,179) (14)
15,415 17,831 (2,416) (14) International
Inbound 3,979 5,041 (1,062) (21) Outbound 514 767 (253) (33)
4,493 5,808 (1,315) (23) Total Php19,908 Php23,639 (Php3,731) (16)
Domestic voice service revenues decreased by Php2,416 million, or 14%, to Php15,415 million in the first half of 2016 from Php17,831 million in the same period in 2015, due to lower domestic outbound and inbound voice service revenues by Php2,179 million and Php237 million, respectively. International voice service revenues decreased by Php1,315 million, or 23%, to Php4,493 million in the first half of 2016 from Php5,808 million in the same period in 2015 primarily due to lower international inbound and outbound voice service revenues as a result of lower international voice traffic, partially offset by the effect of higher weighted average exchange rate of the Philippine peso to the U.S. dollar.
Cellular – Others Revenues from our other cellular services, which include non-subscriber-related revenues consisting of inbound international roaming fees and share in revenues from PLDT WeRoam and PLP, increased by Php26 million, or 3%, to Php1,047 million in the first half of 2016 from Php1,021 million in the same period in 2015 primarily due to higher share of Smart in PayMaya’s peer-to-peer (P2P) transaction fees and other subscriber-related income, partially offset by lower revenues from inbound roaming. Other cellular services accounted for 2% of our cellular service revenues in each of the first half of 2016 and 2015.
2Q 2016 Fo rm 17 -Q Page 13 o f 32
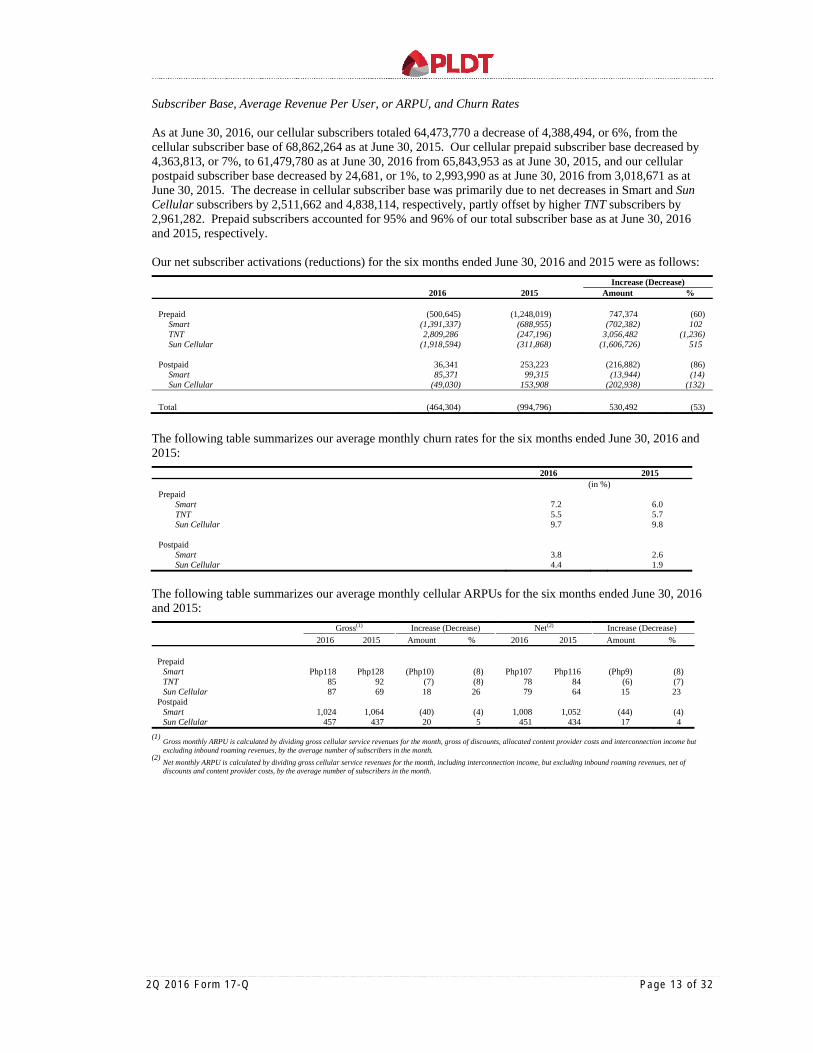
Subscriber Base, Average Revenue Per User, or ARPU, and Churn Rates As at June 30, 2016, our cellular subscribers totaled 64,473,770 a decrease of 4,388,494, or 6%, from the cellular subscriber base of 68,862,264 as at June 30, 2015. Our cellular prepaid subscriber base decreased by 4,363,813, or 7%, to 61,479,780 as at June 30, 2016 from 65,843,953 as at June 30, 2015, and our cellular postpaid subscriber base decreased by 24,681, or 1%, to 2,993,990 as at June 30, 2016 from 3,018,671 as at June 30, 2015. The decrease in cellular subscriber base was primarily due to net decreases in Smart and Sun Cellular subscribers by 2,511,662 and 4,838,114, respectively, partly offset by higher TNT subscribers by 2,961,282. Prepaid subscribers accounted for 95% and 96% of our total subscriber base as at June 30, 2016 and 2015, respectively. Our net subscriber activations (reductions) for the six months ended June 30, 2016 and 2015 were as follows:
Increase (Decrease) 2016 2015 Amount %
Prepaid (500,645) (1,248,019) 747,374 (60)
Smart (1,391,337) (688,955) (702,382) 102 TNT 2,809,286 (247,196) 3,056,482 (1,236) Sun Cellular (1,918,594) (311,868) (1,606,726) 515
Postpaid 36,341 253,223 (216,882) (86)
Smart 85,371 99,315 (13,944) (14) Sun Cellular (49,030) 153,908 (202,938) (132)
Total (464,304) (994,796) 530,492 (53)
The following table summarizes our average monthly churn rates for the six months ended June 30, 2016 and 2015:
2016 2015 (in %)
Prepaid Smart 7.2 6.0 TNT 5.5 5.7 Sun Cellular 9.7 9.8
Postpaid
Smart 3.8 2.6 Sun Cellular 4.4 1.9
The following table summarizes our average monthly cellular ARPUs for the six months ended June 30, 2016 and 2015:
Gross(1) Increase (Decrease) Net(2) Increase (Decrease)
2016 2015 Amount % 2016 2015 Amount %
Prepaid Smart Php118 Php128 (Php10) (8) Php107 Php116 (Php9) (8) TNT 85 92 (7) (8) 78 84 (6) (7) Sun Cellular 87 69 18 26 79 64 15 23
Postpaid Smart 1,024 1,064 (40) (4) 1,008 1,052 (44) (4) Sun Cellular 457 437 20 5 451 434 17 4
(1) Gross monthly ARPU is calculated by dividing gross cellular service revenues for the month, gross of discounts, allocated content provider costs and interconnection income but
excluding inbound roaming revenues, by the average number of subscribers in the month. (2) Net monthly ARPU is calculated by dividing gross cellular service revenues for the month, including interconnection income, but excluding inbound roaming revenues, net of
discounts and content provider costs, by the average number of subscribers in the month.
2Q 2016 Fo rm 17 -Q Page 14 o f 32
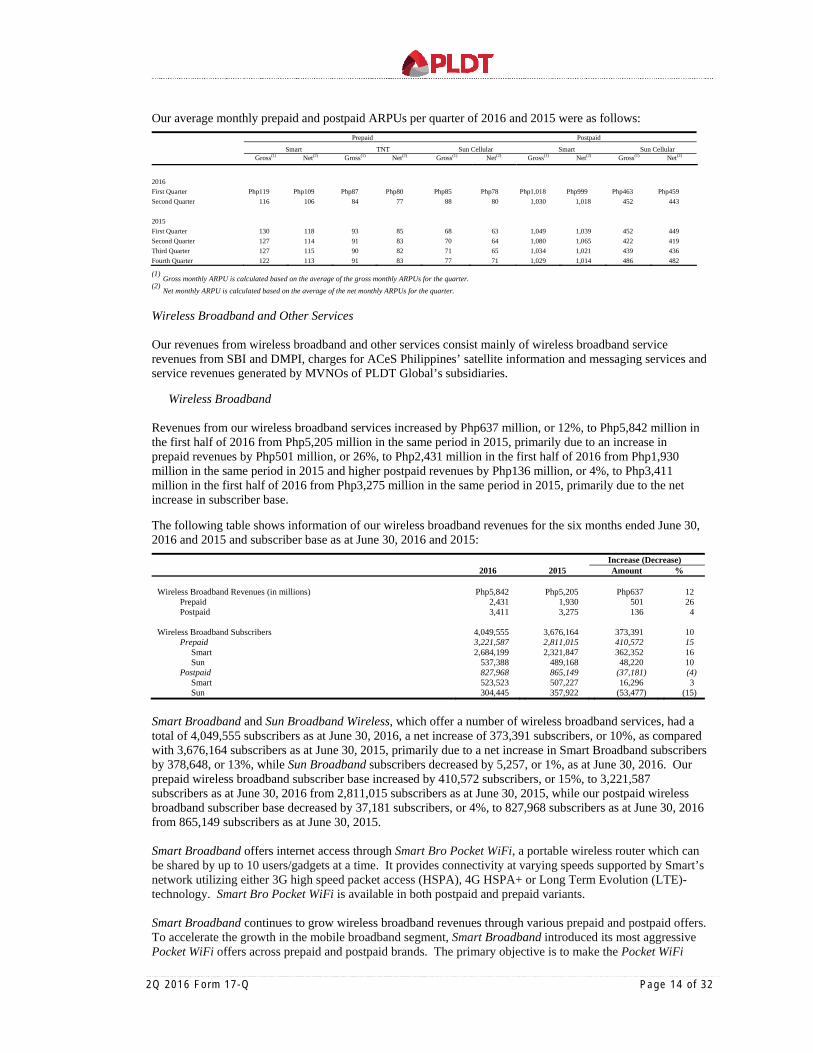
Our average monthly prepaid and postpaid ARPUs per quarter of 2016 and 2015 were as follows:
Prepaid Postpaid
Smart TNT Sun Cellular Smart Sun Cellular Gross(1) Net(2) Gross(1) Net(2) Gross(1) Net(2) Gross(1) Net(2) Gross(1) Net(2)
2016
First Quarter Php119 Php109 Php87 Php80 Php85 Php78 Php1,018 Php999 Php463 Php459
Second Quarter 116 106 84 77 88 80 1,030 1,018 452 443
2015
First Quarter 130 118 93 85 68 63 1,049 1,039 452 449
Second Quarter 127 114 91 83 70 64 1,080 1,065 422 419
Third Quarter 127 115 90 82 71 65 1,034 1,021 439 436
Fourth Quarter 122 113 91 83 77 71 1,029 1,014 486 482
(1) Gross monthly ARPU is calculated based on the average of the gross monthly ARPUs for the quarter. (2) Net monthly ARPU is calculated based on the average of the net monthly ARPUs for the quarter.
Wireless Broadband and Other Services
Our revenues from wireless broadband and other services consist mainly of wireless broadband service revenues from SBI and DMPI, charges for ACeS Philippines’ satellite information and messaging services and service revenues generated by MVNOs of PLDT Global’s subsidiaries.
Wireless Broadband
Revenues from our wireless broadband services increased by Php637 million, or 12%, to Php5,842 million in the first half of 2016 from Php5,205 million in the same period in 2015, primarily due to an increase in prepaid revenues by Php501 million, or 26%, to Php2,431 million in the first half of 2016 from Php1,930 million in the same period in 2015 and higher postpaid revenues by Php136 million, or 4%, to Php3,411 million in the first half of 2016 from Php3,275 million in the same period in 2015, primarily due to the net increase in subscriber base.
The following table shows information of our wireless broadband revenues for the six months ended June 30, 2016 and 2015 and subscriber base as at June 30, 2016 and 2015:
Increase (Decrease) 2016 2015 Amount %
Wireless Broadband Revenues (in millions) Php5,842 Php5,205 Php637 12
Prepaid 2,431 1,930 501 26 Postpaid 3,411 3,275 136 4
Wireless Broadband Subscribers 4,049,555 3,676,164 373,391 10
Prepaid 3,221,587 2,811,015 410,572 15 Smart 2,684,199 2,321,847 362,352 16 Sun 537,388 489,168 48,220 10
Postpaid 827,968 865,149 (37,181) (4) Smart 523,523 507,227 16,296 3 Sun 304,445 357,922 (53,477) (15)
Smart Broadband and Sun Broadband Wireless, which offer a number of wireless broadband services, had a total of 4,049,555 subscribers as at June 30, 2016, a net increase of 373,391 subscribers, or 10%, as compared with 3,676,164 subscribers as at June 30, 2015, primarily due to a net increase in Smart Broadband subscribers by 378,648, or 13%, while Sun Broadband subscribers decreased by 5,257, or 1%, as at June 30, 2016. Our prepaid wireless broadband subscriber base increased by 410,572 subscribers, or 15%, to 3,221,587 subscribers as at June 30, 2016 from 2,811,015 subscribers as at June 30, 2015, while our postpaid wireless broadband subscriber base decreased by 37,181 subscribers, or 4%, to 827,968 subscribers as at June 30, 2016 from 865,149 subscribers as at June 30, 2015. Smart Broadband offers internet access through Smart Bro Pocket WiFi, a portable wireless router which can be shared by up to 10 users/gadgets at a time. It provides connectivity at varying speeds supported by Smart’s network utilizing either 3G high speed packet access (HSPA), 4G HSPA+ or Long Term Evolution (LTE)-technology. Smart Bro Pocket WiFi is available in both postpaid and prepaid variants. Smart Broadband continues to grow wireless broadband revenues through various prepaid and postpaid offers. To accelerate the growth in the mobile broadband segment, Smart Broadband introduced its most aggressive Pocket WiFi offers across prepaid and postpaid brands. The primary objective is to make the Pocket WiFi
2Q 2016 Fo rm 17 -Q Page 15 o f 32
more accessible to subscribers in order for them to enjoy fast, reliable and shareable internet connection across multiple devices.
Smart Broadband also offers PLDT HOMEBro, a fixed wireless broadband service being offered under PLDT’s HOME brand. PLDT HOMEBro is powered by Smart’s wireless broadband base stations which allow subscribers to connect to the internet using indoor or outdoor customer premises equipment through various wireless technologies. ULTERA, our fixed wireless broadband offering designed for the home, utilizes the TD-LTE technology. DMPI’s Sun Broadband Wireless is an affordable high-speed wireless broadband service utilizing advanced 3.5G HSPA and LTE technology offering various plans and packages to internet users. Sun Broadband continues to grow the value broadband segment with its Non-Stop Surf Plans and Loads.
Others Revenues from our other services decreased by Php176 million, or 34%, to Php346 million in the first half of 2016 from Php522 million in the same period in 2015, primarily due to a decrease in the number of ACeS Philippines’ subscribers, lower revenue contribution from MVNOs of PLDT Global, partially offset by the impact of higher weighted average exchange rate of Php46.97 for the six months ended June 30, 2016 from Php44.55 for the six months ended June 30, 2015 on our U.S. dollar and U.S. dollar-linked other service revenues.
Digital Platforms and Mobile Financial Services Revenues from digital platforms and mobile financial services, as reported by Voyager, decreased by Php316 million, or 62%, to Php194 million in the first half of 2016 from Php510 million in the same period in 2015 resulting from the deconsolidation of ePay, holding company of PayMaya, in February 2016. Had we continued to consolidate PayMaya, revenues would have been Php613 million in the first half of 2016, an increase of 20%, from Php510 million in the same period in 2015.
Non-Service Revenues
Our wireless non-service revenues consist of sales of cellular handsets, cellular SIM-packs and broadband data modems, tablets and accessories. Our wireless non-service revenues increased by Php239 million, or 10%, to Php2,733 million in the first half of 2016 from Php2,494 million in the same period in 2015, primarily due to higher revenues from cellular prepaid attributed to Smart Prepaid Android Phone Kit Php888 and Php1,288.
Expenses
Expenses associated with our wireless business amounted to Php47,338 million in the first half of 2016, an increase of Php4,913 million, or 12%, from Php42,425 million in the same period in 2015. A significant portion of the increase was attributable to higher expenses related to cost of sales, asset impairment on doubtful accounts and inventories, depreciation and amortization, taxes and licenses, professional and other contracted services, and insurance and security services, partially offset by lower selling and promotions, rent, repairs and maintenance, interconnection costs, compensation and employee benefits, communications, training and travel, and other operating expenses. As a percentage of our total wireless revenues, expenses associated with our wireless business accounted for 85% and 73% in the first half of 2016 and 2015, respectively.
2Q 2016 Fo rm 17 -Q Page 16 o f 32
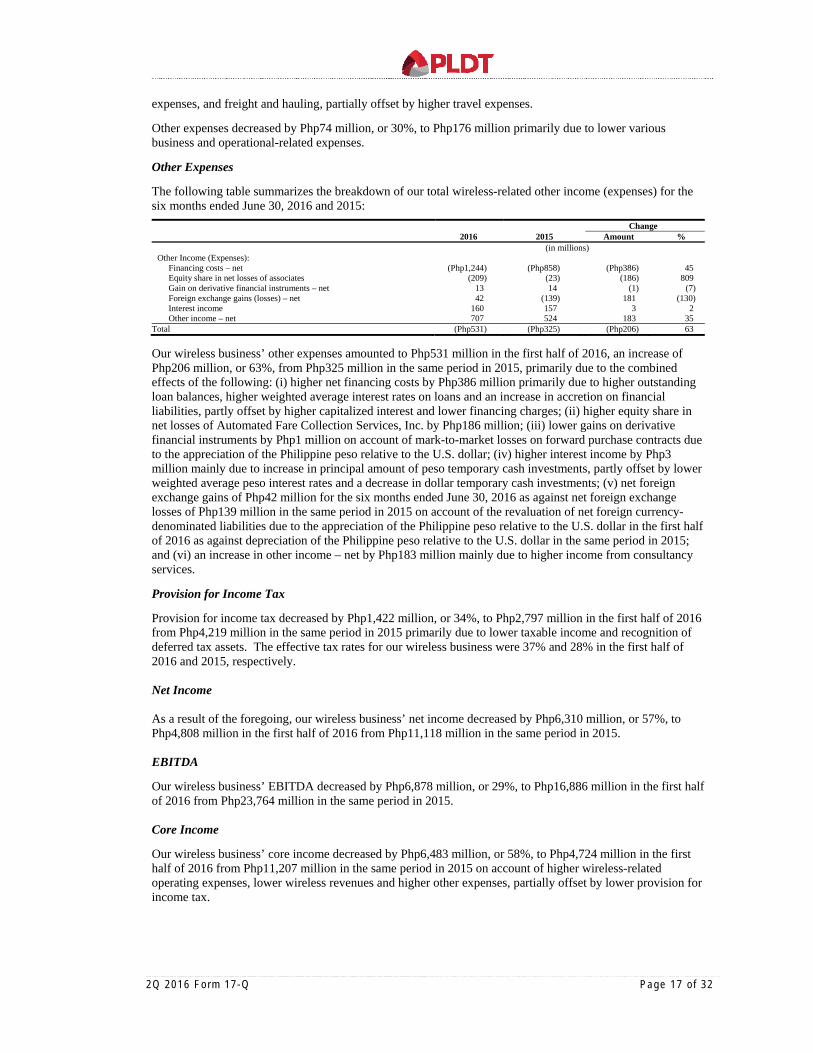
The following table summarizes the breakdown of our total wireless-related expenses for the six months ended June 30, 2016 and 2015 and the percentage of each expense item in relation to the total:
Increase (Decrease) 2016 % 2015 % Amount %
(in millions)
Cost of sales Php9,215 19 Php6,487 15 Php2,728 42 Depreciation and amortization 8,206 17 7,560 18 646 9 Rent 4,756 10 5,351 13 (595) (11) Asset impairment 4,282 9 1,120 3 3,162 282 Repairs and maintenance 4,186 9 4,385 10 (199) (5) Interconnection costs 4,052 9 4,249 10 (197) (5) Compensation and employee benefits 3,523 8 3,585 8 (62) (2) Selling and promotions 3,064 7 4,017 10 (953) (24) Professional and other contracted services 2,779 6 2,590 6 189 7 Taxes and licenses 1,490 3 1,218 3 272 22 Insurance and security services 618 1 600 1 18 3 Amortization of intangible assets 544 1 542 1 2 – Communication, training and travel 447 1 471 1 (24) (5) Other expenses 176 – 250 1 (74) (30)
Total Php47,338 100 Php42,425 100 Php4,913 12 Cost of sales increased by Php2,728 million, or 42%, to Php9,215 million primarily due to an increase in issuance of modems and handsets to broadband and cellular postpaid subscribers, and cost of handsets issued for Smart Prepaid Android Phone Kit Php888 and Php1,288.
Depreciation and amortization charges increased by Php646 million, or 9%, to Php8,206 million primarily due to a higher depreciable asset base. Rent expenses decreased by Php595 million, or 11%, to Php4,756 million primarily due to lower domestic fiber optic network rental charges. Asset impairment increased by Php3,162 million to Php4,282 million primarily due to higher provision for doubtful accounts and inventory obsolescence. Repairs and maintenance expenses decreased by Php199 million, or 5%, to Php4,186 million mainly due to lower site and office electricity costs, lower maintenance costs on domestic cable and wire facilities, customer premises and telecoms equipment, partially offset by higher maintenance costs on site facilities and IT software. Interconnection costs decreased by Php197 million, or 5%, to Php4,052 million primarily due to lower interconnection cost on international voice and text services, partially offset by an increase in interconnection charges on domestic voice and text services. Compensation and employee benefits decreased by Php62 million, or 2%, to Php3,523 million primarily due to lower salaries and employee benefits, and provision for pension benefits, partly offset by higher MRP costs. Employee headcount decreased to 7,142 as at June 30, 2016 as compared with 7,540 as at June 30, 2015. Selling and promotion expenses decreased by Php953 million, or 24%, to Php3,064 million primarily due to lower costs of events, advertising and public relations expenses, partially offset by higher commission expenses. Professional and other contracted service fees increased by Php189 million, or 7%, to Php2,779 million primarily due to an increase in outsource costs, legal fees and facility usage costs, partly offset by lower call center and payment facility fees. Taxes and licenses increased by Php272 million, or 22%, to Php1,490 million due to higher NTC license fees, real property taxes and other business-related taxes in the first half of 2016. Insurance and security services increased by Php18 million, or 3%, to Php618 million primarily due to higher office security expenses, partially offset by lower group health insurance premiums. Amortization of intangible assets increased by Php2 million to Php544 million primarily due to higher license fees. Communication, training and travel expenses decreased by Php24 million, or 5%, to Php447 million primarily due to lower fuel costs for vehicles as a result of lower average fuel cost per liter, lower communication
2Q 2016 Fo rm 17 -Q Page 17 o f 32
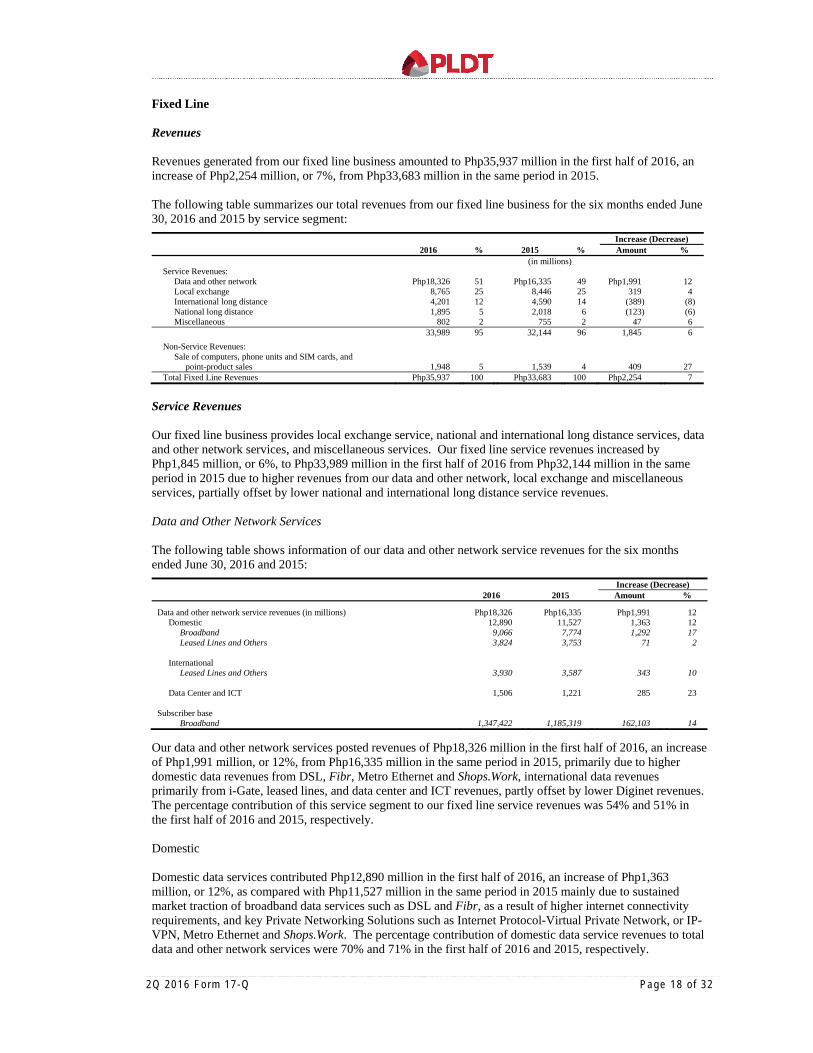
expenses, and freight and hauling, partially offset by higher travel expenses. Other expenses decreased by Php74 million, or 30%, to Php176 million primarily due to lower various business and operational-related expenses. Other Expenses The following table summarizes the breakdown of our total wireless-related other income (expenses) for the six months ended June 30, 2016 and 2015:
Change 2016 2015 Amount %
Other Income (Expenses): (in millions)
Financing costs – net (Php1,244) (Php858) (Php386) 45 Equity share in net losses of associates (209) (23) (186) 809 Gain on derivative financial instruments – net 13 14 (1) (7) Foreign exchange gains (losses) – net 42 (139) 181 (130) Interest income 160 157 3 2 Other income – net 707 524 183 35
Total (Php531) (Php325) (Php206) 63
Our wireless business’ other expenses amounted to Php531 million in the first half of 2016, an increase of Php206 million, or 63%, from Php325 million in the same period in 2015, primarily due to the combined effects of the following: (i) higher net financing costs by Php386 million primarily due to higher outstanding loan balances, higher weighted average interest rates on loans and an increase in accretion on financial liabilities, partly offset by higher capitalized interest and lower financing charges; (ii) higher equity share in net losses of Automated Fare Collection Services, Inc. by Php186 million; (iii) lower gains on derivative financial instruments by Php1 million on account of mark-to-market losses on forward purchase contracts due to the appreciation of the Philippine peso relative to the U.S. dollar; (iv) higher interest income by Php3 million mainly due to increase in principal amount of peso temporary cash investments, partly offset by lower weighted average peso interest rates and a decrease in dollar temporary cash investments; (v) net foreign exchange gains of Php42 million for the six months ended June 30, 2016 as against net foreign exchange losses of Php139 million in the same period in 2015 on account of the revaluation of net foreign currency-denominated liabilities due to the appreciation of the Philippine peso relative to the U.S. dollar in the first half of 2016 as against depreciation of the Philippine peso relative to the U.S. dollar in the same period in 2015; and (vi) an increase in other income – net by Php183 million mainly due to higher income from consultancy services. Provision for Income Tax Provision for income tax decreased by Php1,422 million, or 34%, to Php2,797 million in the first half of 2016 from Php4,219 million in the same period in 2015 primarily due to lower taxable income and recognition of deferred tax assets. The effective tax rates for our wireless business were 37% and 28% in the first half of 2016 and 2015, respectively. Net Income As a result of the foregoing, our wireless business’ net income decreased by Php6,310 million, or 57%, to Php4,808 million in the first half of 2016 from Php11,118 million in the same period in 2015. EBITDA Our wireless business’ EBITDA decreased by Php6,878 million, or 29%, to Php16,886 million in the first half of 2016 from Php23,764 million in the same period in 2015. Core Income Our wireless business’ core income decreased by Php6,483 million, or 58%, to Php4,724 million in the first half of 2016 from Php11,207 million in the same period in 2015 on account of higher wireless-related operating expenses, lower wireless revenues and higher other expenses, partially offset by lower provision for income tax.
2Q 2016 Fo rm 17 -Q Page 18 o f 32
Fixed Line Revenues Revenues generated from our fixed line business amounted to Php35,937 million in the first half of 2016, an increase of Php2,254 million, or 7%, from Php33,683 million in the same period in 2015. The following table summarizes our total revenues from our fixed line business for the six months ended June 30, 2016 and 2015 by service segment:
Increase (Decrease) 2016 % 2015 % Amount % (in millions)
Service Revenues: Data and other network Php18,326 51 Php16,335 49 Php1,991 12 Local exchange 8,765 25 8,446 25 319 4 International long distance 4,201 12 4,590 14 (389) (8) National long distance 1,895 5 2,018 6 (123) (6) Miscellaneous 802 2 755 2 47 6
33,989 95 32,144 96 1,845 6
Non-Service Revenues: Sale of computers, phone units and SIM cards, and
point-product sales 1,948 5 1,539 4 409 27 Total Fixed Line Revenues Php35,937 100 Php33,683 100 Php2,254 7
Service Revenues Our fixed line business provides local exchange service, national and international long distance services, data and other network services, and miscellaneous services. Our fixed line service revenues increased by Php1,845 million, or 6%, to Php33,989 million in the first half of 2016 from Php32,144 million in the same period in 2015 due to higher revenues from our data and other network, local exchange and miscellaneous services, partially offset by lower national and international long distance service revenues. Data and Other Network Services
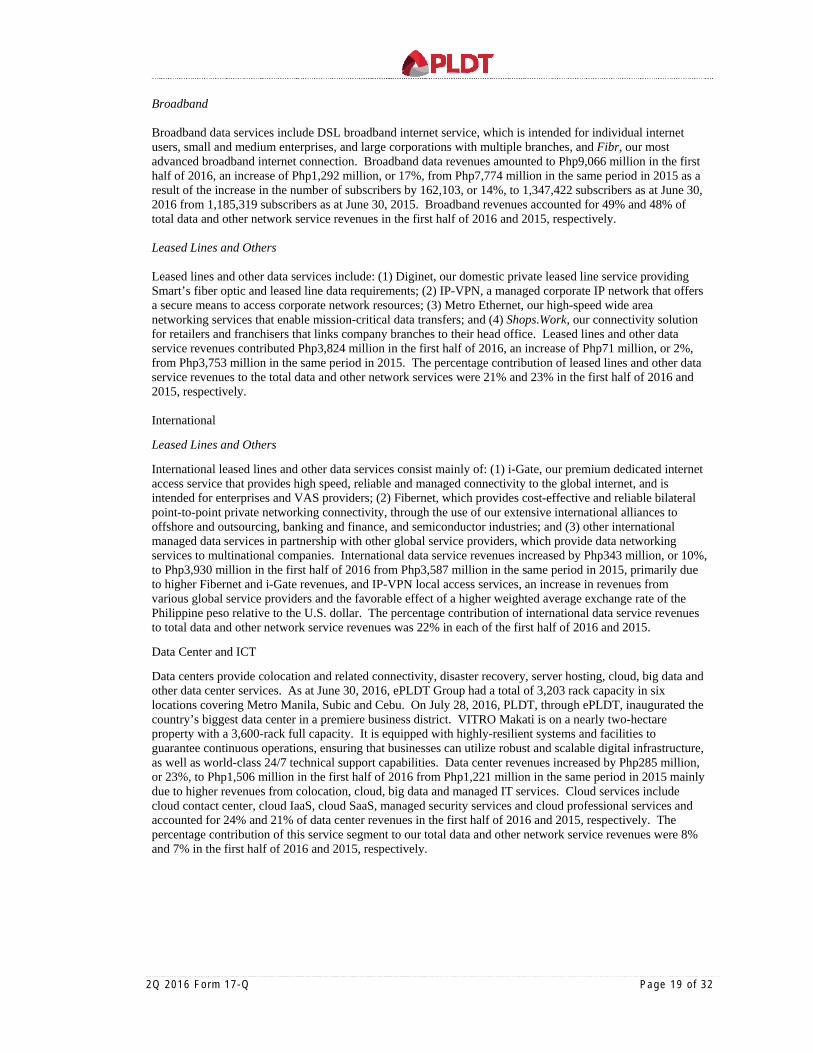
The following table shows information of our data and other network service revenues for the six months ended June 30, 2016 and 2015:
Increase (Decrease) 2016 2015 Amount %
Data and other network service revenues (in millions) Php18,326 Php16,335 Php1,991 12 Domestic 12,890 11,527 1,363 12
Broadband 9,066 7,774 1,292 17 Leased Lines and Others 3,824 3,753 71 2
International
Leased Lines and Others 3,930 3,587 343 10 Data Center and ICT 1,506 1,221 285 23
Subscriber base
Broadband 1,347,422 1,185,319 162,103 14
Our data and other network services posted revenues of Php18,326 million in the first half of 2016, an increase of Php1,991 million, or 12%, from Php16,335 million in the same period in 2015, primarily due to higher domestic data revenues from DSL, Fibr, Metro Ethernet and Shops.Work, international data revenues primarily from i-Gate, leased lines, and data center and ICT revenues, partly offset by lower Diginet revenues. The percentage contribution of this service segment to our fixed line service revenues was 54% and 51% in the first half of 2016 and 2015, respectively. Domestic Domestic data services contributed Php12,890 million in the first half of 2016, an increase of Php1,363 million, or 12%, as compared with Php11,527 million in the same period in 2015 mainly due to sustained market traction of broadband data services such as DSL and Fibr, as a result of higher internet connectivity requirements, and key Private Networking Solutions such as Internet Protocol-Virtual Private Network, or IP-VPN, Metro Ethernet and Shops.Work. The percentage contribution of domestic data service revenues to total data and other network services were 70% and 71% in the first half of 2016 and 2015, respectively.
2Q 2016 Fo rm 17 -Q Page 19 o f 32
Broadband Broadband data services include DSL broadband internet service, which is intended for individual internet users, small and medium enterprises, and large corporations with multiple branches, and Fibr, our most advanced broadband internet connection. Broadband data revenues amounted to Php9,066 million in the first half of 2016, an increase of Php1,292 million, or 17%, from Php7,774 million in the same period in 2015 as a result of the increase in the number of subscribers by 162,103, or 14%, to 1,347,422 subscribers as at June 30, 2016 from 1,185,319 subscribers as at June 30, 2015. Broadband revenues accounted for 49% and 48% of total data and other network service revenues in the first half of 2016 and 2015, respectively. Leased Lines and Others Leased lines and other data services include: (1) Diginet, our domestic private leased line service providing Smart’s fiber optic and leased line data requirements; (2) IP-VPN, a managed corporate IP network that offers a secure means to access corporate network resources; (3) Metro Ethernet, our high-speed wide area networking services that enable mission-critical data transfers; and (4) Shops.Work, our connectivity solution for retailers and franchisers that links company branches to their head office. Leased lines and other data service revenues contributed Php3,824 million in the first half of 2016, an increase of Php71 million, or 2%, from Php3,753 million in the same period in 2015. The percentage contribution of leased lines and other data service revenues to the total data and other network services were 21% and 23% in the first half of 2016 and 2015, respectively. International Leased Lines and Others International leased lines and other data services consist mainly of: (1) i-Gate, our premium dedicated internet access service that provides high speed, reliable and managed connectivity to the global internet, and is intended for enterprises and VAS providers; (2) Fibernet, which provides cost-effective and reliable bilateral point-to-point private networking connectivity, through the use of our extensive international alliances to offshore and outsourcing, banking and finance, and semiconductor industries; and (3) other international managed data services in partnership with other global service providers, which provide data networking services to multinational companies. International data service revenues increased by Php343 million, or 10%, to Php3,930 million in the first half of 2016 from Php3,587 million in the same period in 2015, primarily due to higher Fibernet and i-Gate revenues, and IP-VPN local access services, an increase in revenues from various global service providers and the favorable effect of a higher weighted average exchange rate of the Philippine peso relative to the U.S. dollar. The percentage contribution of international data service revenues to total data and other network service revenues was 22% in each of the first half of 2016 and 2015. Data Center and ICT Data centers provide colocation and related connectivity, disaster recovery, server hosting, cloud, big data and other data center services. As at June 30, 2016, ePLDT Group had a total of 3,203 rack capacity in six locations covering Metro Manila, Subic and Cebu. On July 28, 2016, PLDT, through ePLDT, inaugurated the country’s biggest data center in a premiere business district. VITRO Makati is on a nearly two-hectare property with a 3,600-rack full capacity. It is equipped with highly-resilient systems and facilities to guarantee continuous operations, ensuring that businesses can utilize robust and scalable digital infrastructure, as well as world-class 24/7 technical support capabilities. Data center revenues increased by Php285 million, or 23%, to Php1,506 million in the first half of 2016 from Php1,221 million in the same period in 2015 mainly due to higher revenues from colocation, cloud, big data and managed IT services. Cloud services include cloud contact center, cloud IaaS, cloud SaaS, managed security services and cloud professional services and accounted for 24% and 21% of data center revenues in the first half of 2016 and 2015, respectively. The percentage contribution of this service segment to our total data and other network service revenues were 8% and 7% in the first half of 2016 and 2015, respectively.
2Q 2016 Fo rm 17 -Q Page 20 o f 32
Local Exchange Service The following table summarizes the key measures of our local exchange service business as at and for the six months ended June 30, 2016 and 2015:
Increase (Decrease) 2016 2015 Amount %
Total local exchange service revenues (in millions) Php8,765 Php8,446 Php319 4 Number of fixed line subscribers 2,380,390 2,257,266 123,124 5
Postpaid 2,344,984 2,214,494 130,490 6 Prepaid 35,406 42,772 (7,366) (17)
Number of fixed line employees 7,112 7,007 105 1 Number of fixed line subscribers per employee 335 322 13 4
Revenues from our local exchange service increased by Php319 million, or 4%, to Php8,765 million in the first half of 2016 from Php8,446 million in the same period in 2015, primarily due to higher weighted average of postpaid billed lines. The percentage contribution of local exchange revenues to our total fixed line service revenues was 26% in each of the six months ended June 30, 2016 and 2015. International Long Distance Service The following table shows our international long distance service revenues and call volumes for the six months ended June 30, 2016 and 2015:
Decrease 2016 2015 Amount %
Total international long distance service revenues (in millions) Php4,201 Php4,590 (Php389) (8)
Inbound 3,706 4,060 (354) (9) Outbound 495 530 (35) (7)
International call volumes (in million minutes, except call ratio) 702 815 (113) (14)
Inbound 601 691 (90) (13) Outbound 101 124 (23) (19) Inbound-outbound call ratio 6.0:1 5.6:1 – –
Our total international long distance service revenues decreased by Php389 million, or 8%, to Php4,201 million in the first half of 2016 from Php4,590 million in the same period in 2015, primarily due to lower call volumes for both inbound and outbound traffic as a result of popularity of OTT service providers (e.g. Facebook, Skype, Viber, WhatsApp, etc.) over traditional long distance services, partially offset by the favorable effect of a higher weighted average exchange rate of the Philippine peso to the U.S. dollar to Php46.97 for the period ended June 30, 2016 from Php44.55 for the period ended June 30, 2015 and the net increase in average billing rates in dollar terms. The percentage contribution of international long distance service revenues to our total fixed line service revenues accounted for 12% and 14% in the first half of 2016 and 2015, respectively. Correspondingly, our total international long distance service revenues, net of interconnection costs, decreased by Php170 million, or 10%, to Php1,556 million in the first half of 2016 from Php1,726 million in the same period in 2015. National Long Distance Service The following table shows our national long distance service revenues and call volumes for the six months ended June 30, 2016 and 2015:
Decrease 2016 2015 Amount %
Total national long distance service revenues (in millions) Php1,895 Php2,018 (Php123) (6) National long distance call volumes (in million minutes) 377 387 (10) (3)
Our national long distance service revenues decreased by Php123 million, or 6%, to Php1,895 million in the first half of 2016 from Php2,018 million in the same period in 2015, primarily due to a decrease in call volumes. The percentage contribution of national long distance revenues to our fixed line service revenues was 6% in each of the first half of 2016 and 2015. Our national long distance service revenues, net of interconnection costs, decreased by Php62 million, or 4%, to Php1,506 million in the first half of 2016 from Php1,568 million in the same period in 2015.
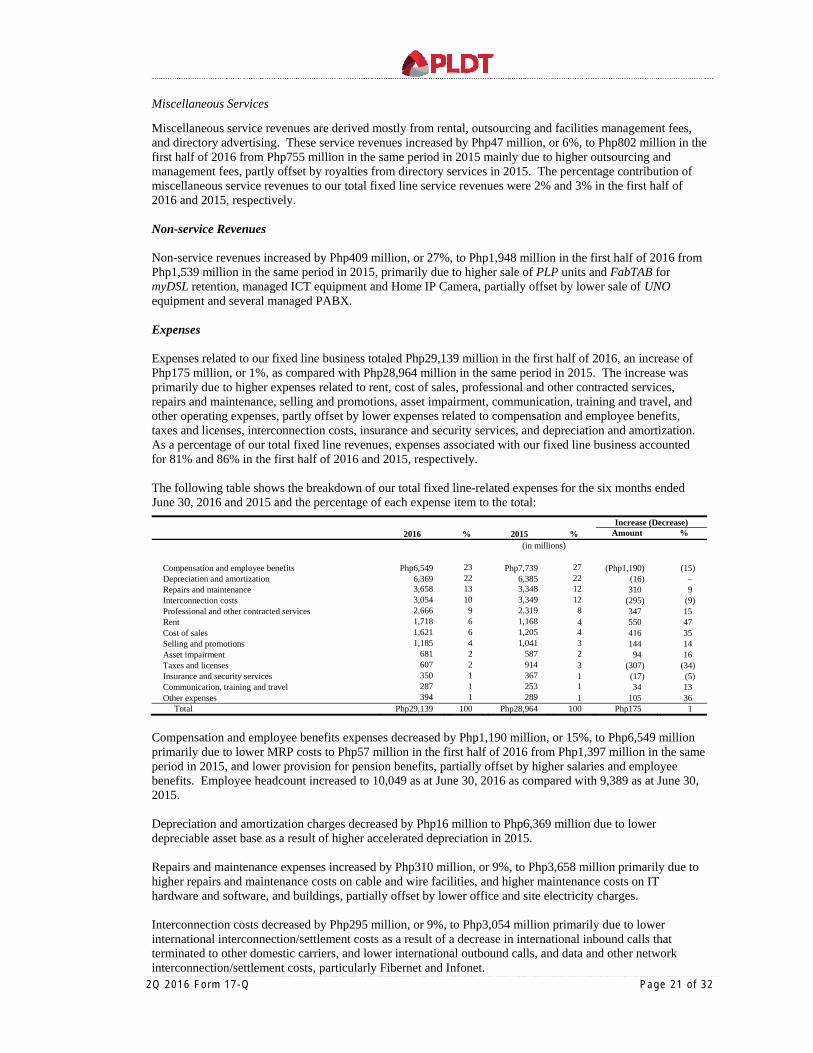
2Q 2016 Fo rm 17 -Q Page 21 o f 32
Miscellaneous Services Miscellaneous service revenues are derived mostly from rental, outsourcing and facilities management fees, and directory advertising. These service revenues increased by Php47 million, or 6%, to Php802 million in the first half of 2016 from Php755 million in the same period in 2015 mainly due to higher outsourcing and management fees, partly offset by royalties from directory services in 2015. The percentage contribution of miscellaneous service revenues to our total fixed line service revenues were 2% and 3% in the first half of 2016 and 2015, respectively. Non-service Revenues Non-service revenues increased by Php409 million, or 27%, to Php1,948 million in the first half of 2016 from Php1,539 million in the same period in 2015, primarily due to higher sale of PLP units and FabTAB for myDSL retention, managed ICT equipment and Home IP Camera, partially offset by lower sale of UNO equipment and several managed PABX. Expenses Expenses related to our fixed line business totaled Php29,139 million in the first half of 2016, an increase of Php175 million, or 1%, as compared with Php28,964 million in the same period in 2015. The increase was primarily due to higher expenses related to rent, cost of sales, professional and other contracted services, repairs and maintenance, selling and promotions, asset impairment, communication, training and travel, and other operating expenses, partly offset by lower expenses related to compensation and employee benefits, taxes and licenses, interconnection costs, insurance and security services, and depreciation and amortization. As a percentage of our total fixed line revenues, expenses associated with our fixed line business accounted for 81% and 86% in the first half of 2016 and 2015, respectively.
The following table shows the breakdown of our total fixed line-related expenses for the six months ended June 30, 2016 and 2015 and the percentage of each expense item to the total:
Increase (Decrease) 2016 % 2015 % Amount %
(in millions)
Compensation and employee benefits Php6,549 23 Php7,739 27 (Php1,190) (15) Depreciation and amortization 6,369 22 6,385 22 (16) – Repairs and maintenance 3,658 13 3,348 12 310 9 Interconnection costs 3,054 10 3,349 12 (295) (9) Professional and other contracted services 2,666 9 2,319 8 347 15 Rent 1,718 6 1,168 4 550 47 Cost of sales 1,621 6 1,205 4 416 35 Selling and promotions 1,185 4 1,041 3 144 14 Asset impairment 681 2 587 2 94 16 Taxes and licenses 607 2 914 3 (307) (34) Insurance and security services 350 1 367 1 (17) (5) Communication, training and travel 287 1 253 1 34 13 Other expenses 394 1 289 1 105 36
Total Php29,139 100 Php28,964 100 Php175 1
Compensation and employee benefits expenses decreased by Php1,190 million, or 15%, to Php6,549 million primarily due to lower MRP costs to Php57 million in the first half of 2016 from Php1,397 million in the same period in 2015, and lower provision for pension benefits, partially offset by higher salaries and employee benefits. Employee headcount increased to 10,049 as at June 30, 2016 as compared with 9,389 as at June 30, 2015. Depreciation and amortization charges decreased by Php16 million to Php6,369 million due to lower depreciable asset base as a result of higher accelerated depreciation in 2015. Repairs and maintenance expenses increased by Php310 million, or 9%, to Php3,658 million primarily due to higher repairs and maintenance costs on cable and wire facilities, and higher maintenance costs on IT hardware and software, and buildings, partially offset by lower office and site electricity charges. Interconnection costs decreased by Php295 million, or 9%, to Php3,054 million primarily due to lower international interconnection/settlement costs as a result of a decrease in international inbound calls that terminated to other domestic carriers, and lower international outbound calls, and data and other network interconnection/settlement costs, particularly Fibernet and Infonet.
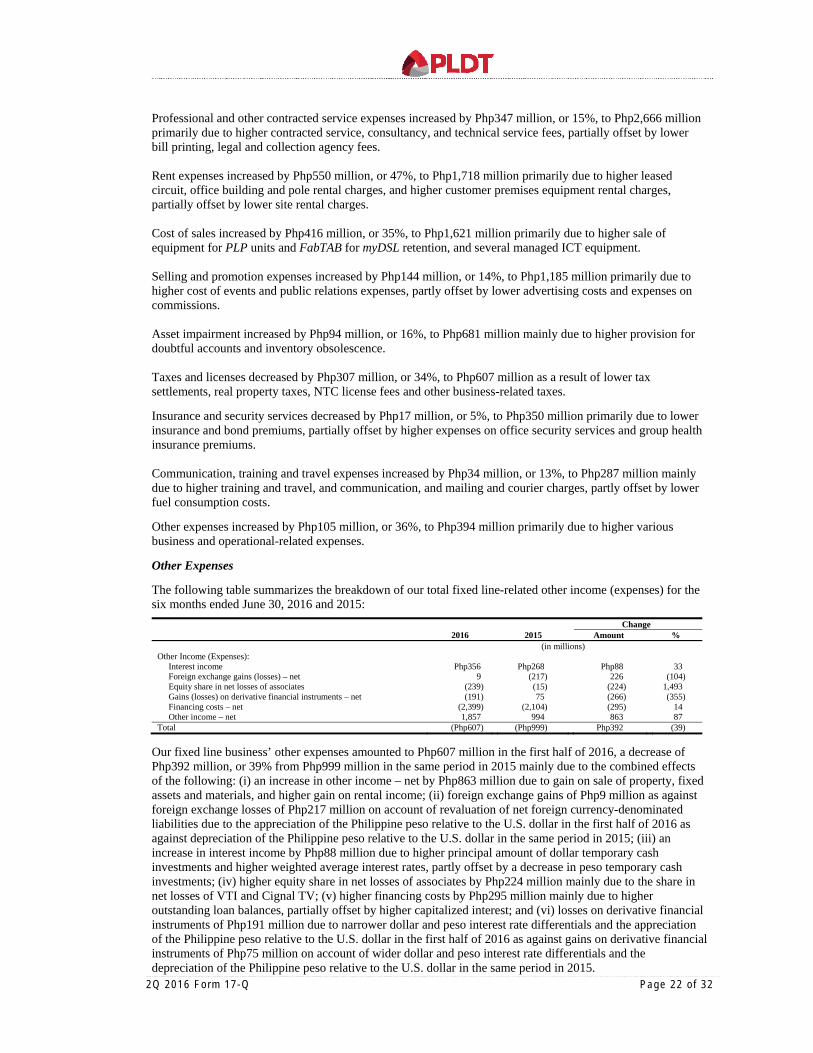
2Q 2016 Fo rm 17 -Q Page 22 o f 32
Professional and other contracted service expenses increased by Php347 million, or 15%, to Php2,666 million primarily due to higher contracted service, consultancy, and technical service fees, partially offset by lower bill printing, legal and collection agency fees. Rent expenses increased by Php550 million, or 47%, to Php1,718 million primarily due to higher leased circuit, office building and pole rental charges, and higher customer premises equipment rental charges, partially offset by lower site rental charges. Cost of sales increased by Php416 million, or 35%, to Php1,621 million primarily due to higher sale of equipment for PLP units and FabTAB for myDSL retention, and several managed ICT equipment. Selling and promotion expenses increased by Php144 million, or 14%, to Php1,185 million primarily due to higher cost of events and public relations expenses, partly offset by lower advertising costs and expenses on commissions. Asset impairment increased by Php94 million, or 16%, to Php681 million mainly due to higher provision for doubtful accounts and inventory obsolescence. Taxes and licenses decreased by Php307 million, or 34%, to Php607 million as a result of lower tax settlements, real property taxes, NTC license fees and other business-related taxes. Insurance and security services decreased by Php17 million, or 5%, to Php350 million primarily due to lower insurance and bond premiums, partially offset by higher expenses on office security services and group health insurance premiums. Communication, training and travel expenses increased by Php34 million, or 13%, to Php287 million mainly due to higher training and travel, and communication, and mailing and courier charges, partly offset by lower fuel consumption costs. Other expenses increased by Php105 million, or 36%, to Php394 million primarily due to higher various business and operational-related expenses. Other Expenses The following table summarizes the breakdown of our total fixed line-related other income (expenses) for the six months ended June 30, 2016 and 2015:
Change 2016 2015 Amount %
Other Income (Expenses): (in millions)
Interest income Php356 Php268 Php88 33 Foreign exchange gains (losses) – net 9 (217) 226 (104) Equity share in net losses of associates (239) (15) (224) 1,493 Gains (losses) on derivative financial instruments – net (191) 75 (266) (355) Financing costs – net (2,399) (2,104) (295) 14 Other income – net 1,857 994 863 87
Total (Php607) (Php999) Php392 (39) Our fixed line business’ other expenses amounted to Php607 million in the first half of 2016, a decrease of Php392 million, or 39% from Php999 million in the same period in 2015 mainly due to the combined effects of the following: (i) an increase in other income – net by Php863 million due to gain on sale of property, fixed assets and materials, and higher gain on rental income; (ii) foreign exchange gains of Php9 million as against foreign exchange losses of Php217 million on account of revaluation of net foreign currency-denominated liabilities due to the appreciation of the Philippine peso relative to the U.S. dollar in the first half of 2016 as against depreciation of the Philippine peso relative to the U.S. dollar in the same period in 2015; (iii) an increase in interest income by Php88 million due to higher principal amount of dollar temporary cash investments and higher weighted average interest rates, partly offset by a decrease in peso temporary cash investments; (iv) higher equity share in net losses of associates by Php224 million mainly due to the share in net losses of VTI and Cignal TV; (v) higher financing costs by Php295 million mainly due to higher outstanding loan balances, partially offset by higher capitalized interest; and (vi) losses on derivative financial instruments of Php191 million due to narrower dollar and peso interest rate differentials and the appreciation of the Philippine peso relative to the U.S. dollar in the first half of 2016 as against gains on derivative financial instruments of Php75 million on account of wider dollar and peso interest rate differentials and the depreciation of the Philippine peso relative to the U.S. dollar in the same period in 2015.
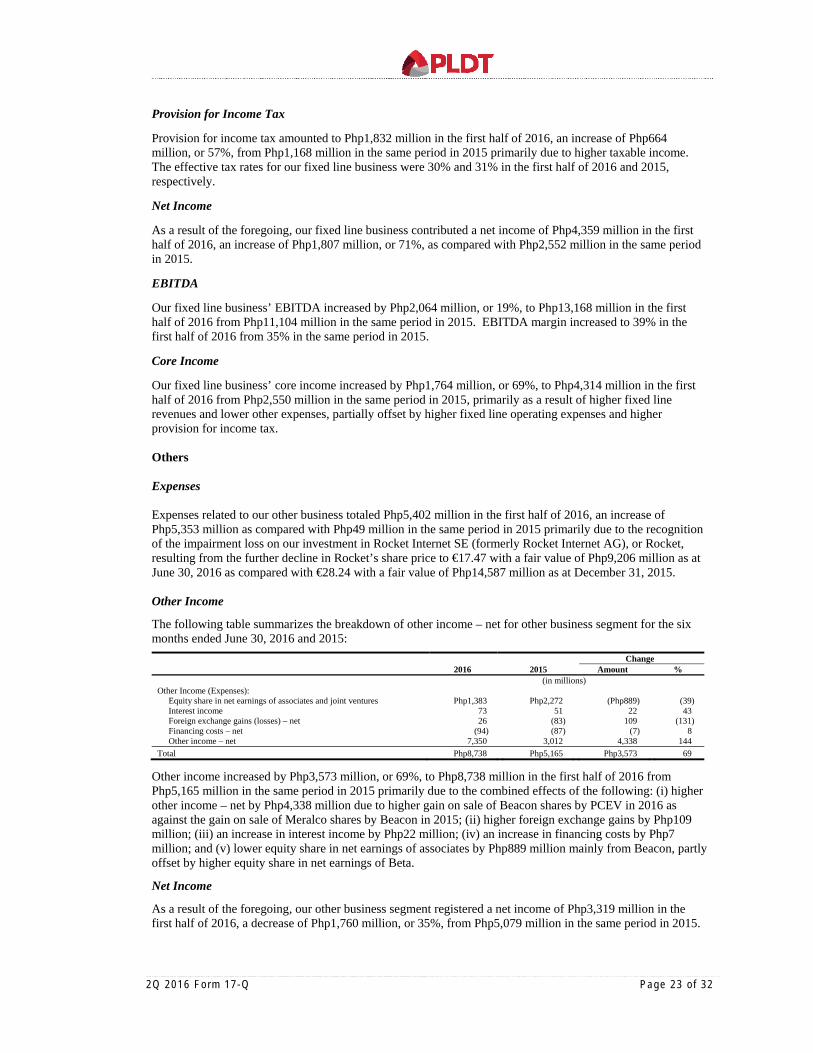
2Q 2016 Fo rm 17 -Q Page 23 o f 32
Provision for Income Tax Provision for income tax amounted to Php1,832 million in the first half of 2016, an increase of Php664 million, or 57%, from Php1,168 million in the same period in 2015 primarily due to higher taxable income. The effective tax rates for our fixed line business were 30% and 31% in the first half of 2016 and 2015, respectively.
Net Income
As a result of the foregoing, our fixed line business contributed a net income of Php4,359 million in the first half of 2016, an increase of Php1,807 million, or 71%, as compared with Php2,552 million in the same period in 2015. EBITDA Our fixed line business’ EBITDA increased by Php2,064 million, or 19%, to Php13,168 million in the first half of 2016 from Php11,104 million in the same period in 2015. EBITDA margin increased to 39% in the first half of 2016 from 35% in the same period in 2015. Core Income Our fixed line business’ core income increased by Php1,764 million, or 69%, to Php4,314 million in the first half of 2016 from Php2,550 million in the same period in 2015, primarily as a result of higher fixed line revenues and lower other expenses, partially offset by higher fixed line operating expenses and higher provision for income tax. Others Expenses Expenses related to our other business totaled Php5,402 million in the first half of 2016, an increase of Php5,353 million as compared with Php49 million in the same period in 2015 primarily due to the recognition of the impairment loss on our investment in Rocket Internet SE (formerly Rocket Internet AG), or Rocket, resulting from the further decline in Rocket’s share price to €17.47 with a fair value of Php9,206 million as at June 30, 2016 as compared with €28.24 with a fair value of Php14,587 million as at December 31, 2015. Other Income
The following table summarizes the breakdown of other income – net for other business segment for the six months ended June 30, 2016 and 2015:
Change 2016 2015 Amount %
Other Income (Expenses): (in millions)
Equity share in net earnings of associates and joint ventures Php1,383 Php2,272 (Php889) (39) Interest income 73 51 22 43 Foreign exchange gains (losses) – net 26 (83) 109 (131) Financing costs – net (94) (87) (7) 8 Other income – net 7,350 3,012 4,338 144
Total Php8,738 Php5,165 Php3,573 69
Other income increased by Php3,573 million, or 69%, to Php8,738 million in the first half of 2016 from Php5,165 million in the same period in 2015 primarily due to the combined effects of the following: (i) higher other income – net by Php4,338 million due to higher gain on sale of Beacon shares by PCEV in 2016 as against the gain on sale of Meralco shares by Beacon in 2015; (ii) higher foreign exchange gains by Php109 million; (iii) an increase in interest income by Php22 million; (iv) an increase in financing costs by Php7 million; and (v) lower equity share in net earnings of associates by Php889 million mainly from Beacon, partly offset by higher equity share in net earnings of Beta.
Net Income
As a result of the foregoing, our other business segment registered a net income of Php3,319 million in the first half of 2016, a decrease of Php1,760 million, or 35%, from Php5,079 million in the same period in 2015.
2Q 2016 Fo rm 17 -Q Page 24 o f 32
Core Income Our other business segment’s core income amounted to Php8,662 million in the first half of 2016, an increase of Php3,491 million, or 68%, as compared with Php5,171 million in the same period in 2015 mainly as a result of higher other income, partially offset by higher operating expenses. Liquidity and Capital Resources
The following table shows our consolidated cash flows for the six months ended June 30, 2016 and 2015, as well as our consolidated capitalization and other consolidated selected financial data as at June 30, 2016 and December 31, 2015:
For the six months ended June 30, 2016 2015 (in millions)
Cash Flows Net cash flows provided by operating activities Php25,184 Php30,946 Net cash flows used in investing activities (23,742) (8,916)
Capital expenditures 20,032 13,877 Net cash flows used in financing activities (24,370) (11,610) Net increase (decrease) in cash and cash equivalents (23,069) 10,546
June 30, December 31, 2016 2015
(in millions) Capitalization
Long-term portion of interest-bearing financial liabilities – net of current portion: Long-term debt Php128,165 Php143,982
Current portion of interest-bearing financial liabilities: Long-term debt maturing within one year 29,266 16,910 Obligations under finance lease maturing within one year – 1
29,266 16,911 Total interest-bearing financial liabilities 157,431 160,893
Total equity attributable to equity holders of PLDT 111,445 113,608 Php268,876 Php274,501
Other Selected Financial Data
Total assets Php463,208 Php455,095 Property and equipment 200,060 195,782 Cash and cash equivalents 23,386 46,455 Short-term investments 6,688 1,429
Our consolidated cash and cash equivalents and short-term investments totaled Php30,074 million as at June 30, 2016. Principal sources of consolidated cash and cash equivalents in the first half of 2016 were cash flows from operating activities amounting to Php25,184 million, proceeds from disposal of investment in associates and joint ventures amounting to Php17,000 million, proceeds from availment of long-term debt of Php7,628 million, proceeds from disposal of property and equipment of Php1,319 million and interest received of Php499 million. These funds were used principally for: (1) capital expenditures, including capitalized interest, of Php20,032 million; (2) higher payment for purchase of investment in joint ventures and associates by Php16,951 million;(3) cash dividend payments of Php12,342 million; (4) debt principal and interest payments of Php10,948 million and Php3,385 million, respectively; (5) net reductions to capital expenditures under long-term financing of Php4,868 million; and (6) net payment for purchase of short-term investments of Php5,204 million. Our consolidated cash and cash equivalents and short-term investments totaled Php38,753 million as at June 30, 2015. Principal sources of consolidated cash and cash equivalents in the first half of 2015 were cash flows from operating activities amounting to Php30,946 million, proceeds from availment of long-term debt of Php21,048 million, dividends received of Php5,544 million, interest received of Php445 million and net proceeds from redemption of investments in debt securities of Php360 million. These funds were used principally for: (1) dividend payments of Php18,793 million; (2) capital outlays, including capitalized interest, of Php13,877 million; (3) debt principal and interest payments of Php7,946 million and Php2,627 million, respectively; (4) net payment of capital expenditures under long-term financing of Php2,777 million; (5) payment for purchase of short-term investments of Php997 million; (6) settlement of derivative financial instruments of Php265 million; and (7) payment for purchase of investment in joint ventures and associates of Php160 million.
2Q 2016 Fo rm 17 -Q Page 25 o f 32
Operating Activities Our consolidated net cash flows provided by operating activities decreased by Php5,762 million, or 19%, to Php25,184 million in the first half of 2016 from Php30,946 million in the same period in 2015, primarily due to lower collection efficiency, lower operating income and higher prepayments, partially offset by lower level of settlement of accounts payable and other liabilities, lower pension contribution and lower corporate taxes paid. Cash flows provided by operating activities of our wireless business decreased by Php9,510 million, or 43%, to Php12,522 million in the first half of 2016 from Php22,032 million in the same period in 2015 primarily due to lower collection efficiency, lower operating income, higher level of settlement of other liabilities and higher prepayments, partially offset by lower level of settlement of accounts payable and lower pension contribution. Cash flows provided by operating activities of our fixed line business increased by Php4,041 million, or 44%, to Php13,202 million in the first half of 2016 from Php9,161 million in the same period in 2015, primarily due to higher operating income, lower level of settlement of accounts payable and other liabilities, and lower pension contribution, partly offset by lower level of collection of accounts receivable. Cash flows used in operating activities of our other business amounted to Php115 million in the first half of 2016 from Php72 million in the same period in 2015. Investing Activities Consolidated net cash flows used in investing activities amounted to Php23,742 million in the first half of 2016, an increase of Php14,826 million from Php8,916 million in the same period in 2015, primarily due to the combined effects of the following: (1) higher payment for purchase of investment in joint ventures and associates by Php16,951 million specifically for the purchase of San Miguel Corporation, or SMC’s, telecommunications business and deposit for future stock subscription of Beacon preferred shares; (2) higher capital expenditures by Php6,155 million; (3) dividends received of Php5,544 million in 2015; (4) net payment for purchase of short-term investments by Php4,207 million; (5) proceeds from disposal of PCEV’s investment in Beacon by Php17,000 million; and (6) higher proceeds from disposal of property and equipment by Php1,189 million. Our consolidated capital expenditures, including capitalized interest, in the first half of 2016 totaled Php20,032 million, an increase of Php6,155 million as compared with Php13,877 million in the same period in 2015, primarily due to Smart Group’s higher capital spending. Smart Group’s capital spending, increased by Php5,797 million, or 53%, to Php16,729 million in the first half of 2016 from Php10,932 million in the same period in 2015, primarily focused on expanding 3G, 4G and LTE coverage and reach, as well as capacity and service enhancements. PLDT’s capital spending decreased by Php105 million, or 4%, to Php2,336 million in the first half of 2016 from Php2,441 million in the same period in 2015. The capex spending was used to finance the continuous facility roll-out and expansion of our domestic fiber optic network, cable fortification and resiliency in various locations and acquisition of new platforms to complement introduction of new products and services, as well as the expansion of our data center business. The balance represented other subsidiaries’ capital spending. As part of our growth strategy, we may continue to make acquisitions and investments in companies or businesses whenever we deem such acquisitions and investments will contribute to our growth. Financing Activities On a consolidated basis, cash flows used in financing activities amounted to Php24,370 million in the first half of 2016, an increase of Php12,760 million, or 110%, from Php11,610 million in the same period in 2015, resulting largely from the combined effects of the following: (1) lower proceeds from availment of long-term debt by Php13,420 million; (2) higher payments of long-term debt by Php3,002 million; (3) higher interest payments by Php758 million; (4) higher settlement of derivative financial instruments of Php92 million; (5) higher settlement to capital expenditures under long-term financing by Php2,091 million; and (6) lower cash dividends paid by Php6,451 million.
2Q 2016 Fo rm 17 -Q Page 26 o f 32
Debt Financing Proceeds from availment of long-term debt for the year ended June 30, 2016 amounted to Php7,628 million, mainly from PLDT’s and Smart’s drawings related to the financing of our capital expenditure requirements and refinancing maturing loan obligations. Payments of principal and interest on our total debt amounted to Php10,948 million and Php3,385 million, respectively, for the year ended June 30, 2016. Our consolidated long-term debt decreased by Php3,461 million, or 2%, to Php157,431 million as at June 30, 2016 from Php160,892 million as at December 31, 2015 primarily due to debt amortizations, prepayments and the appreciation of the Philippine peso relative to the U.S. dollar to Php47.01 as at June 30, 2016, partly offset by drawings from our long-term facilities. As at June 30, 2016, the long-term debt levels of Smart increased by 3% to Php63,565 million, while PLDT’s long-term debt level decreased by 1% to Php92,789 million and DMPI’s decreased by 78% to Php1,077 million, as compared with December 31, 2015. On March 22, 2016, PLDT signed a US$25 million term loan facility agreement with NTT Finance Corporation, to finance capital expenditures and/or refinance existing loan obligations, the proceeds of which were utilized for network expansion and improvement programs. The amount of US$25 million was fully drawn on March 30, 2016 and remained outstanding as at June 30, 2016. On July 1, 2016, PLDT signed a Php6,000 million term loan facility with Metropolitan Bank and Trust Company, or Metrobank, to partially finance capital expenditures and/or refinance its existing loan obligations, the proceeds of which will be utilized for its service improvements and expansion programs. On July 1, 2016, PLDT signed a Php3,000 million term loan facility with Metrobank to partially finance capital expenditures and/or refinance its existing loan obligations, the proceeds of which will be utilized for its service improvements and expansion programs. On July 14, 2016, PLDT signed a Php8,000 million term loan facility with Security Bank Corporation to partially finance capital expenditures and/or refinance its existing loan obligations, the proceeds of which will be utilized for its service improvements and expansion programs. Approximately Php88,193 million principal amount of our consolidated outstanding long-term debt as at June 30, 2016 is scheduled to mature over the period from 2016 to 2020. Of this amount, Php51,361 million is attributable to PLDT, Php35,755 million to Smart and Php1,077 million to DMPI. For a complete discussion of our long-term debt, see Note 21 – Interest-bearing Financial Liabilities – Long-term Debt to the accompanying unaudited consolidated financial statements. Debt Covenants Our consolidated debt instruments contain restrictive covenants, including covenants that require us to comply with specified financial ratios and other financial tests, calculated in conformity with PFRS, at relevant measurement dates, principally at the end of each quarterly period. We have complied with all of our maintenance financial ratios as required under our loan covenants and other debt instruments. Furthermore, certain of DMPI’s debt instruments contain provisions wherein DMPI may be declared in default in case of a change in control in DMPI. As at June 30, 2016 and 2015, we are in compliance with all of our debt covenants. See Note 21 – Interest-bearing Financial Liabilities – Debt Covenants to the accompanying unaudited consolidated financial statements for a detailed discussion of our debt covenants. Financing Requirements We believe that our available cash, including cash flow from operations, will provide sufficient liquidity to fund our projected operating and debt service requirements for the next 12 months. Off-Balance Sheet Arrangements There are no off-balance sheet arrangements that have or are reasonably likely to have any current or future effect on our financial position, results of operations, cash flows, changes in stockholders’ equity, liquidity, capital expenditures or capital resources that are material to investors.
2Q 2016 Fo rm 17 -Q Page 27 o f 32
Equity Financing On August 5, 2014, the PLDT Board of Directors approved the amendment of our dividend policy, increasing the dividend payout rate to 75% from 70% of our core earnings per share as regular dividends. In declaring dividends, we take into consideration the interest of our shareholders, as well as our working capital, capital expenditures and debt servicing requirements. The retention of earnings may be necessary to meet the funding requirements of our business expansion and development programs. However, in the event that no investment opportunities arise, we may consider the option of returning additional cash to our shareholders in the form of special dividends of up to the balance of our core earnings or to undertake share buybacks. We were able to pay out approximately 100% of our core earnings for seven consecutive years from 2007 to 2013, approximately 90% of our core earnings for 2014 and 75% of our core earnings for 2015. However, in view of our current elevated capital expenditures to build-out a robust, superior network to support the continued growth of data traffic, plans to invest in new adjacent businesses that will complement the current business and provide future sources of profits and dividends, and management of our cash and gearing levels, the PLDT Board of Directors approved on August 2, 2016, the amendment of our dividend policy, reducing the regular dividend payout to 60% of Core Income. As part of the dividend policy, in the event no investment opportunities arise, we may consider the option of returning additional cash to our shareholders in the form of special dividends or share buybacks. The accumulated equity in the net earnings of our subsidiaries, which form part of our retained earnings, are not available for distribution unless realized in the form of dividends from such subsidiaries. Our subsidiaries pay dividends subject to the requirements of applicable laws and regulations and availability of unrestricted retained earnings, without any restriction imposed by the terms of contractual agreements. Notwithstanding the foregoing, the subsidiaries of PLDT may, at any time, declare and pay such dividends depending upon the results of operations and future projects and plans, the respective subsidiary’s earnings, cash flow, financial condition, capital investment requirements and other factors. Consolidated cash dividend payments in the first half of 2016 amounted to Php12,342 million as compared with Php18,793 million paid to shareholders in the same period in 2015. The following table shows the dividends declared to shareholders from the earnings for the six months ended June 30, 2016 and 2015:
Date Amount
Earnings Approved Record Payable Per share Total Declared (in millions, except per share amount)
2016
Common Stock
Regular Dividend August 2, 2016 August 16, 2016 September 1, 2016 49 Php10,587
Preferred
Series IV Cumulative Non- convertible Redeemable Preferred Stock(1) January 26, 2016 February 24, 2016 March 15, 2016 – 12
May 3, 2016 May 24, 2016 June 15, 2016 – 12
Voting Preferred Stock February 29, 2016 March 30, 2016 April 15, 2016 – 3
June 14, 2016 June 30, 2016 July 15, 2016 – 3
Charged to Retained Earnings 10,617
2015
Common Stock
Regular Dividend August 4, 2015 August 27, 2015 September 25, 2015 65 14,044
Preferred Series IV Cumulative Non-
convertible Redeemable Preferred Stock(1) January 27, 2015 February 26, 2015 March 15, 2015 – 12
May 5, 2015 May 26, 2015 June 15, 2015 – 12
Voting Preferred Stock March 3, 2015 March 19, 2015 April 15, 2015 – 2
June 9, 2015 June 26, 2015 July 15, 2015 – 3
Charged to Retained Earnings Php14,073 (1) Dividends were declared based on total amount paid up.
See Note 20 – Equity to the accompanying unaudited consolidated financial statements for further details.
2Q 2016 Fo rm 17 -Q Page 28 o f 32
Contractual Obligations and Commercial Commitments Contractual Obligations For a discussion of our consolidated contractual undiscounted obligations as at June 30, 2016 and 2015, see Note 28 – Financial Assets and Liabilities – Liquidity Risks to the accompanying unaudited consolidated financial statements. Commercial Commitments Our outstanding consolidated commercial commitments, in the form of letters of credit, amounted to Php52 million and Php46 million as at June 30, 2016 and December 31, 2015, respectively. These commitments will expire within one year. Quantitative and Qualitative Disclosures about Market Risks Our operations are exposed to various risks, including liquidity risk, foreign currency exchange risk, interest rate risk, credit risk and capital management risk. The importance of managing these risks has significantly increased in light of considerable change and continuing volatility in both the Philippine and international financial markets. With a view to managing these risks, we have incorporated financial risk management functions in our organization, particularly in our treasury operations, equity issuances and sale of certain assets. For further discussions of these risks, see Note 28 – Financial Assets and Liabilities to the accompanying unaudited consolidated financial statements. The following table sets forth the estimated consolidated fair values of our financial assets and liabilities recognized as at June 30, 2016 and March 31, 2016 other than those whose carrying amounts are reasonable approximations of fair values: Fair Values June 30, March 31, 2016 2016 (Unaudited) (in millions) Noncurrent Financial Assets Investments in debt securities and other long-term investments – net of current portion Php972 Php942 Advances and other noncurrent assets – net of current portion 7,797 2,598 Total noncurrent financial assets 8,769 3,540 Noncurrent Financial Liabilities Interest-bearing financial liabilities 132,250 130,974 Customers’ deposits 1,936 2,423 Deferred credits and other noncurrent liabilities 14,757 17,203 Total noncurrent financial liabilities Php148,943 Php150,600
The following table sets forth the amount of gains (losses) recognized for the financial assets and liabilities for the six months ended June 30, 2016 and the three months ended March 31, 2016: June 30, March 31, 2016 2016 (Unaudited)
(in millions) Profit and Loss
Interest income Php472 Php255 Losses on derivative financial instruments – net (178) (497) Accretion on financial liabilities (127) (75) Interest on loans and other related items (3,672) (1,823)
Other Comprehensive Income Net fair value losses on cash flow hedges – net of tax (328) (259) Net gains (losses) on available-for-sale financial investments – net of tax 5 (1)
Impact of Inflation and Changing Prices Inflation can be a significant factor in the Philippine economy, and we are continually seeking ways to minimize its impact. The average inflation rate in the Philippines for the six months ended June 30, 2016 and 2015 were 1.3% and 2%, respectively. Moving forward, we currently expect inflation to remain low.
2Q 2016 Fo rm 17 -Q Page 29 o f 32
PART II – OTHER INFORMATION Sale of Customer Relationship Management business by Asia Outsoursing Gamma Limited, or AOGL On July 22, 2016, AOGL entered into a Sale and Purchase Agreement, or SPA, with Relia Inc., one of the largest BPO companies in Japan, relating to the acquisition of AOGL’s Customer Relationship Management business under the legal entity SPi CRM, Inc. and Infocom Technologies, Inc., wholly-owned subsidiaries of AOGL, for an enterprise value of US$181 million. Payment shall be on completion date, subject to certain conditions, as defined in the SPA. AOGL is a wholly-owned subsidiary of Beta which is, in turn, owned 73.29% by CVC Capital Partners, one of the world’s leading private equity and investment advisory firms, and 18.32% by PLDT through its indirect subsidiary, PLDT Global Investments Corporation, or PGIC. Acquisition of San Miguel Corporation’s telecommunications business On May 30, 2016, the PLDT Board approved the Company’s acquisition of 50% equity interest, including outstanding advances, in the telecommunications business of SMC with Globe Telecom Inc., or Globe, acquiring the remaining 50% interest. On the same date, PLDT and Globe executed: (i) a SPA with SMC to acquire the entire outstanding capital, including outstanding advances, in VTI (and the other subsidiaries of VTI), which holds SMC’s telecommunications assets through its subsidiaries; and (ii) separate SPAs with the owners of two other entities, Bow Arken Holdings Company, or Bow Arken (parent company of New Century Telecoms, Inc.) and Brightshare Holdings, Inc., or Brightshare (parent company of eTelco, Inc.), which separately hold additional spectrum frequencies through their respective subsidiaries. Total consideration for the acquisition is Php70 billion consisting of the purchase price for the equity interest and advances amounting to Php52.8 billion and the assumption of the estimated liabilities of Php17.2 billion of the acquired companies and their respective subsidiaries. The cash portion of the consideration amounting to Php52.8 billion will be paid in three tranches: 50% was paid upon signing of the SPAs on May 30, 2016, 25% is payable on December 1, 2016 and the final 25% is payable on May 30, 2017, subject to the fulfillment of certain conditions. The second and final payments are secured by irrevocable standby letters of credit. PLDT and Globe caused the relevant subsidiaries of the acquired companies to relinquish certain radio frequencies in the 700MHz, 850MHz, 2500MHz and 3500MHz bands and return these radio frequencies to the government through the National Telecommunications Commission, or NTC. PLDT, Globe and Bell Telecommunications Philippines, Inc., or Belltel, a subsidiary of VTI, also requested for NTC’s approval of their co-use certain frequency bands assigned to Belltel. Both the relinquishment/return of certain frequencies and separate co-use arrangements between Smart and Belltel and Globe and Belltel each covering specific frequencies assigned to Belltel have been approved by the NTC, which has regulatory and supervisory powers over the parties to the transactions and with mandate to ensure a healthy competitive environment in the telecommunications industry. Notice of Transaction filed with the Philippine Competition Commission, or the Commission On May 30, 2016, each of PLDT, Globe and SMC submitted notices of each transaction (respectively, the VTI Notice, the Bow Arken Notice and the Brightshare Notice and collectively, the Notices) to the Commission pursuant to the Philippine Competition Act, or PCA, and Circular No. 16-001 and Circular No. 16-002 issued by the Commission, or the Circulars. As stated in the Circulars, upon receipt by the Commission of the requisite notices, each of the transactions shall be deemed approved in accordance with the Circulars. Subsequently, on June 7, 2016, PLDT and the other parties to the transactions received separate letters dated June 6 and 7, 2016 from the Commission which essentially stated, that: (a) with respect to VTI transaction, the VTI Notice is deficient and defective in form and substance, therefore, the VTI transaction is not “deemed approved” by the Commission, and that the missing key terms of the transaction are critical since the Commission considers certain agreements as prohibited and illegal; and (b) with respect to the Bow Arken and Brightshare transactions, the compulsory notification under the Circulars does not apply and that even assuming the Circulars apply, the Bow Arken Notice and the Brightshare Notice are deficient and defective in form and substance. On June 10, 2016, PLDT submitted its response to the Commission’s letter articulating its position that the VTI Notice is adequate, complete and sufficient and compliant with the requirement under the Circulars, and does not contain false material information; as such, the VTI transaction enjoys the benefit of Section 23 of the PCA. Therefore, the VTI transaction is deemed approved and cannot be subject to retroactive review by the
2Q 2016 Fo rm 17 -Q Page 30 o f 32
Commission. Moreover, the parties have taken all necessary steps, including the relinquishment/return of certain frequencies and co-use of the remaining frequencies by Smart and Belltel and Globe and Belltel as discussed above, to ensure that the VTI transaction will not substantially prevent, restrict or lessen competition to violate the PCA. Nevertheless, in the spirit of cooperation and for transparency, the parties voluntarily submitted to the Commission, among others, copies of the SPAs for the Commission’s information and reference. In a letter dated June 17, 2016, the Commission required the parties to further submit additional documents relevant to the co-use arrangement and the frequencies subject thereto, as well as other definitive agreements relating to the VTI transactions. It also disregarded the deemed approved status of the VTI transaction in violation of the Circulars which the Commission itself issued, and insisted that it will conduct a full review, if not investigation of the transaction under the different operative provisions of the PCA. Legal Recourse to the Court of Appeals, or the CA On July 12, 2016, PLDT filed before the CA a Petition for Certiorari and Prohibition (With Urgent Application for the Issuance of a Temporary Restraining Order and/or Writ of Preliminary Injunction) against the Commission. The Petition seeks to enjoin the Commission from proceeding with the review of the acquisition by PLDT and Globe of the telecommunications business of SMC and performing any act which challenges or assails the “deemed approved” status of the transaction. On July 19, 2016, the 12th Division of the CA issued a Resolution directing the Office of the Solicitor General, or the OSG, to file its Comment within a non-extensible period of 10 days from notice and show cause why the Petition should not be granted. PLDT may file a Reply within five days from receipt of the OSG’s Comment. Thereafter, unless the CA decides to conduct a hearing and/or require the submission of memoranda by the parties, the case shall be submitted for decision. Sale of PCEV’s Beacon Shares to Metro Pacific Investment Corporation, or MPIC On May 30, 2016, as approved by the Board, PCEV entered into a Share Purchase Agreement with MPIC to sell its 646 million shares of common stock and 458 million shares of preferred stock of Beacon, representing approximately 25% equity interest in Beacon, to MPIC for a total consideration of Php26,200 million. MPIC settled a portion of the consideration amounting to Php17,000 million immediately upon signing of the agreement and the balance of Php9,200 million will be paid in annual installments until June 2020. Consequently, PCEV realized a portion of the deferred gain amounting to Php4,962 million. After the sale, PCEV’s equity ownership in Beacon was reduced from 50% to 25% while MPIC’s interest increased to 75%. MPIC agreed that for as long as: (i) PCEV owns at least 20% of the outstanding capital stock of Beacon; or (ii) the purchase price has not been fully paid by MPIC, PCEV shall retain the right to vote 50% of the outstanding capital stock of Beacon. PCEV’s effective interest in Meralco, through Beacon, was reduced to 8.74%, while MPIC’s effective interest in Meralco, through its direct ownership in Meralco shares and through Beacon, increased to 41.22%. There is no change in the aggregate joint interest of MPIC and Beacon in Meralco which remains at 49.96%. Beacon effectively owns 394 million Meralco common shares representing approximately 34.96% effective ownership in Meralco with a carrying value of Php87,325 million and market value of Php122,158 million based on quoted price of Php310 per share as at June 30, 2016 and carrying value of Php87,831 million and market value of Php126,099 million based on quoted price of Php320 per share as at December 31, 2015. PCEV’s Additional Investment in Beacon Class “B” Preferred Shares On May 30, 2016, the Board of Directors of Beacon approved the increase in authorized capital stock of Beacon from Php5,000 million to Php6,000 million divided into 3,000 million common shares with a par value of Php1.00 per share, 2,000 million Class “A” preferred shares with a par value of Php1.00 per share and 1,000 million new Class “B” preferred shares with a par value of Php1.00 per share. The SEC is yet to approve the increase in Beacon’s authorized capital and issuance of new class of preferred shares. Class “B” preferred shares of Beacon are non-voting, not convertible to common shares or any shares of any class of Beacon and have no pre-emptive rights to subscribe to any share or convertible debt, securities or warrants issued or sold by Beacon. The Class “B” preferred shares are entitled to liquidation preference and yearly cumulative dividends at the rate of 6% of the issue value subject to: (a) availability of unrestricted
2Q 2016 Fo rm 17 -Q Page 31 o f 32
retained earnings; and (b) dividend payment will not violate any dividend restrictions imposed by Beacon’s bank creditors. PCEV subscribed to 277 million Beacon Class “B” preferred shares for a total cash consideration of Php3,500 million. MPIC likewise subscribed to 277 million Beacon Class “B” preferred shares for a total cash consideration of Php3,500 million. The amount raised from the subscription was used to fund the subscription to shares of common stock of Global Business Power Corporation, or Global Power, through Beacon Powergen Holdings, Inc., or Beacon Powergen, a wholly-owned subsidiary of Beacon. Beacon’s Acquisition of 56% of Global Business Power Corporation On May 27, 2016, Beacon, through a wholly owned subsidiary Beacon Powergen, entered into a Share Purchase Agreement with GT Capital Holdings, Inc., to acquire an aggregate 56% of the issued share capital of Global Power for a total consideration of Php22,058 million. Beacon Powergen settled Php11,029 million upon closing, and the balance of the purchase price will be paid via a vendor financing facility, which will be replaced with long term bank debt within 90 days from closing. Global Power is the leading power supplier in Visayas with 852 MW of coal and diesel powered generating capacity at present, including 150 MW to commence operations later this year, and 670MW for further expansion. After the acquisition, PCEV’s effective interest in Global Power, through Beacon, is 14%, while MPIC’s effective interest in Global Power, through Beacon, is 42%. Amendments to the Articles of Incorporation of PLDT On April 12, 2016 and June 14, 2016, the Board of Directors and stockholders, respectively, approved the following actions: (1) change in the name of the Company from Philippine Long Distance Telephone Company to PLDT Inc.; (2) expansion of the purpose clause to expressly provide for such other purposes and powers incidental to or in furtherance of the primary purpose, including the power to do or engage in such activities required, necessary or expedient in the pursuit of lawful businesses or for the protection or benefit of the Company; and (3) corresponding amendments to the First Article and Second Article of the Articles of Incorporation of the Company. On July 29, 2016, the Amended Articles of Incorporation of the Company containing the aforementioned amendments has been approved by the Philippine SEC. Joint Venture Agreement between PLDT Capital and Hopscotch On April 15, 2016, PLDT Capital Pte. Ltd., or PLDT Capital, and Gohopscotch, Inc., or Hopscotch, a Delaware corporation, entered into a Joint Venture Agreement, or JVA, to market and exclusively distribute Hopscotch’s mobile solutions in Southeast Asia. The Hopscotch mobile-platform technology allows for the rapid development of custom mobile applications for sports teams, live events, and brands to not only create a memorable and monetizable fan experience but also increase mobile advertising revenue. As a vehicle to execute the JVA, PLDT Capital incorporated Gohopscotch Southeast Asia Pte. Ltd., a Singapore company, on March 1, 2016. eInnovations’ Investment in ECommerce Pay Holding S.à r.l., or ECommerce Pay (formerly MePay Global) On January 6, 2015, PLDT, through eInnovations Holdings Pte. Ltd, or eInnovations, entered into a JVA with Rocket, pursuant to which the two parties agreed to form ECommerce Pay, of which each partner holds a 50% equity interest. ECommerce Pay is a global joint venture company for payment services with a focus on emerging markets. On July 30, 2015, eInnovations became a 50% shareholder of ECommerce Pay and invested on August 11, 2015 €1.2 million into ECommerce Pay.
2Q 2016 Fo rm 17 -Q Page 32 o f 32
On February 3, 2016, eInnovations further contributed its subsidiary ePay Investments Pte. Ltd., or ePay, including the intellectual property, platforms and business operations of its mobile-first platform, PayMaya, as had been agreed in the JVA. Rocket contributed, among other things, its equity in Paymill Holding GmbH and Payleven Holding GmbH, which operated via its subsidiaries, payment platforms for high growth, small-and-medium sized e-commerce businesses.
Consequently, in February 2016, the ownership of ePay and its subsidiaries, or ePay Group, was transferred from eInnovations to ECommerce Pay and PLDT ceased to recognize ePay Group as its subsidiary. Rocket and PLDT via eInnovations agreed to end the joint venture with control and all rights in ePay to be returned to eInnovations via a retransfer of the shares in ePay. In return, eInnovations agreed to give up its 50% ownership in and all claims in connection with Ecommerce Pay. On July 29, 2016, eInnovations exited ECommerce Pay and complete control of ePay, including the intellectual property, platforms and business operations of its mobile-first platform, PayMaya, was returned to eInnovations. PLDT and Rocket have decided to unwind the joint venture to better focus on their respective areas of operation and current priorities. Both continue to explore areas of possible future collaboration. PLDT Online’s Investment in iFlix Limited, or iFlix On April 23, 2015, PLDT Online Investments Pte. Ltd., or PLDT Online, subscribed to a convertible note of iFlix, an internet TV service provider in Southeast Asia, for US$15 million, or Php686 million. The convertible note was issued and paid on August 11, 2015. iFlix will use the funds to continue to roll out the iFlix subscription video-on-demand services across the Southeast Asian region, acquire rights to new content, and produce original programming to market to potential customers. This investment is in line with our strategy to develop new revenue streams and to complement our present business by participating in the digital world beyond providing access and connectivity. On March 10, 2016, the US$15 million convertible notes held by PLDT Online were converted into 20.7 million ordinary shares of iFlix after Southeast Asia’s leading internet TV service provider completed a new round of funding led by Sky Plc, Europe’s leading entertainment company and the Indonesian company, Emtek Group, through its subsidiary, PT Surya Citra Media Tbk, or SCMA. PLDT Online’s shares account for the 7.5% of the total equity stock of iFlix which had a post money valuation of US$450 million following the investments of Sky Plc and SCMA. Related Party Transactions For a detailed discussion of the related party transactions, see Note 25 – Related Party Transactions to the accompanying unaudited consolidated financial statements.
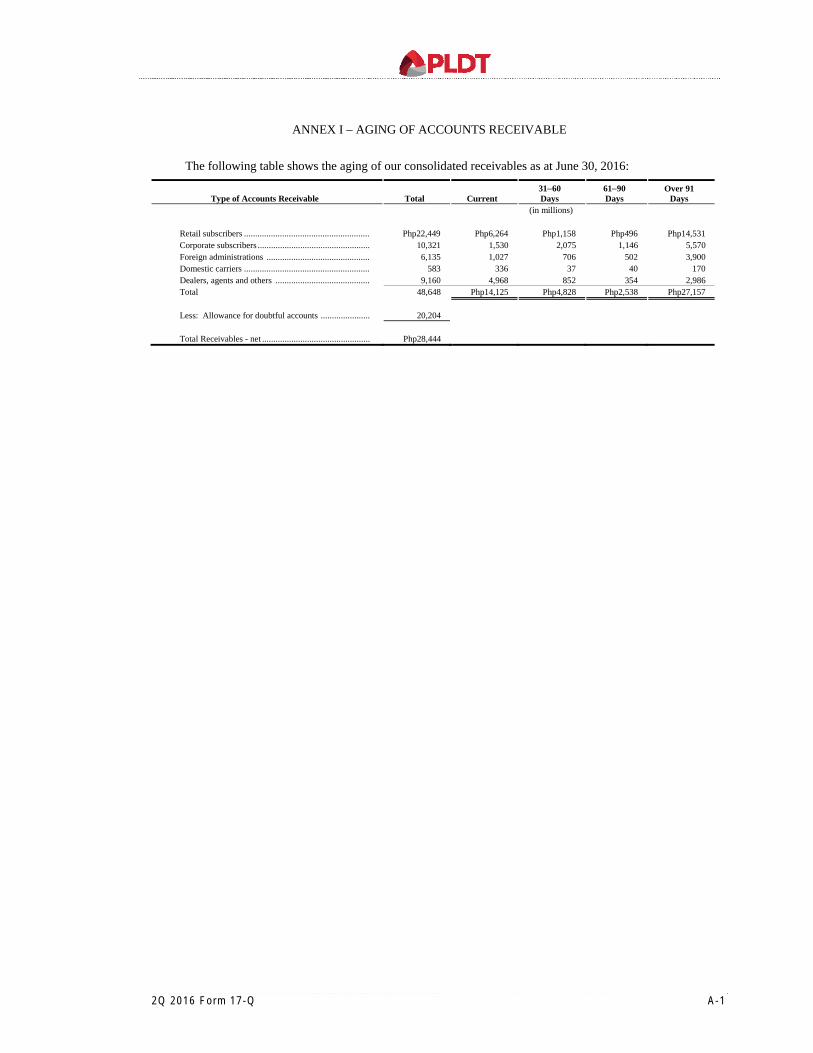
2Q 2016 Fo rm 17 -Q A -1
ANNEX I – AGING OF ACCOUNTS RECEIVABLE
The following table shows the aging of our consolidated receivables as at June 30, 2016:
Type of Accounts Receivable Total Current 3160 Days
6190 Days
Over 91 Days
(in millions)
Retail subscribers ........................................................ Php22,449 Php6,264 Php1,158 Php496 Php14,531 Corporate subscribers .................................................. 10,321 1,530 2,075 1,146 5,570 Foreign administrations .............................................. 6,135 1,027 706 502 3,900 Domestic carriers ........................................................ 583 336 37 40 170 Dealers, agents and others .......................................... 9,160 4,968 852 354 2,986 Total 48,648 Php14,125 Php4,828 Php2,538 Php27,157
Less: Allowance for doubtful accounts ...................... 20,204
Total Receivables - net ................................................ Php28,444
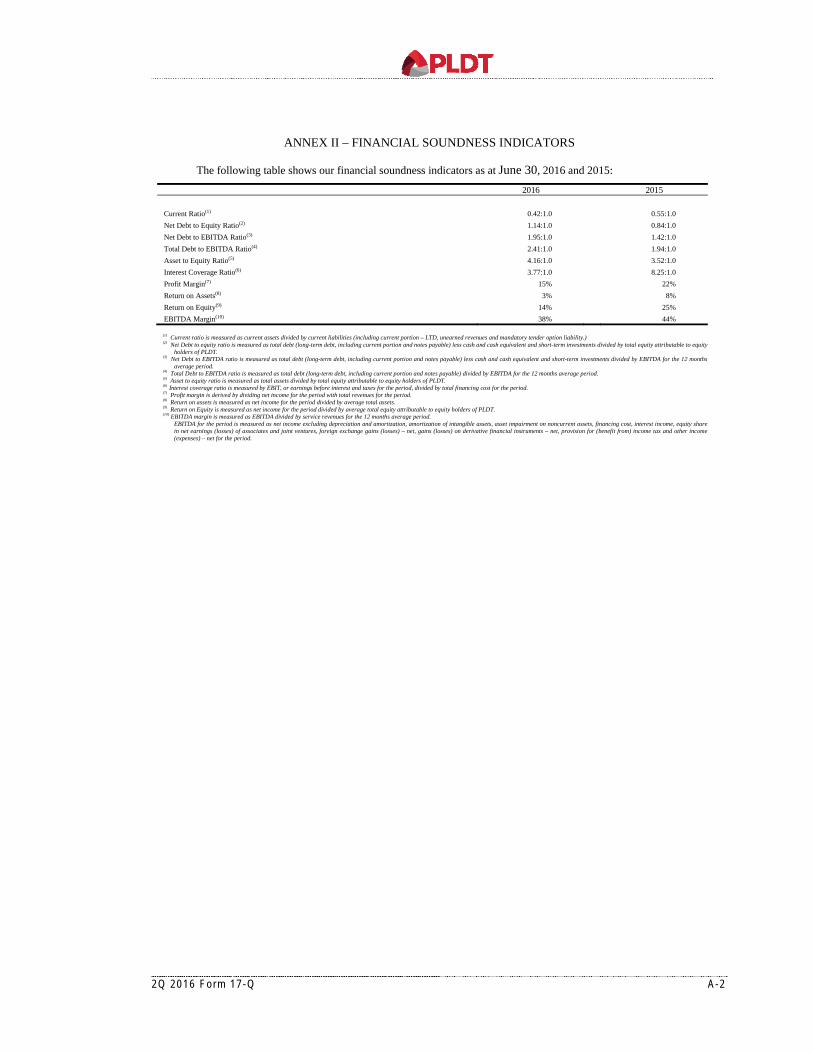
2Q 2016 Fo rm 17 -Q A -2
ANNEX II – FINANCIAL SOUNDNESS INDICATORS
The following table shows our financial soundness indicators as at June 30, 2016 and 2015:
2016 2015 Current Ratio(1) 0.42:1.0 0.55:1.0
Net Debt to Equity Ratio(2) 1.14:1.0 0.84:1.0
Net Debt to EBITDA Ratio(3) 1.95:1.0 1.42:1.0
Total Debt to EBITDA Ratio(4) 2.41:1.0 1.94:1.0
Asset to Equity Ratio(5) 4.16:1.0 3.52:1.0
Interest Coverage Ratio(6) 3.77:1.0 8.25:1.0
Profit Margin(7) 15% 22%
Return on Assets(8) 3% 8%
Return on Equity(9) 14% 25%
EBITDA Margin(10) 38% 44%
(1) Current ratio is measured as current assets divided by current liabilities (including current portion – LTD, unearned revenues and mandatory tender option liability.) (2) Net Debt to equity ratio is measured as total debt (long-term debt, including current portion and notes payable) less cash and cash equivalent and short-term investments divided by total equity attributable to equity
holders of PLDT. (3) Net Debt to EBITDA ratio is measured as total debt (long-term debt, including current portion and notes payable) less cash and cash equivalent and short-term investments divided by EBITDA for the 12 months
average period. (4) Total Debt to EBITDA ratio is measured as total debt (long-term debt, including current portion and notes payable) divided by EBITDA for the 12 months average period. (5) Asset to equity ratio is measured as total assets divided by total equity attributable to equity holders of PLDT. (6) Interest coverage ratio is measured by EBIT, or earnings before interest and taxes for the period, divided by total financing cost for the period. (7) Profit margin is derived by dividing net income for the period with total revenues for the period. (8) Return on assets is measured as net income for the period divided by average total assets. (9) Return on Equity is measured as net income for the period divided by average total equity attributable to equity holders of PLDT. (10) EBITDA margin is measured as EBITDA divided by service revenues for the 12 months average period.
EBITDA for the period is measured as net income excluding depreciation and amortization, amortization of intangible assets, asset impairment on noncurrent assets, financing cost, interest income, equity share in net earnings (losses) of associates and joint ventures, foreign exchange gains (losses) – net, gains (losses) on derivative financial instruments – net, provision for (benefit from) income tax and other income (expenses) – net for the period.
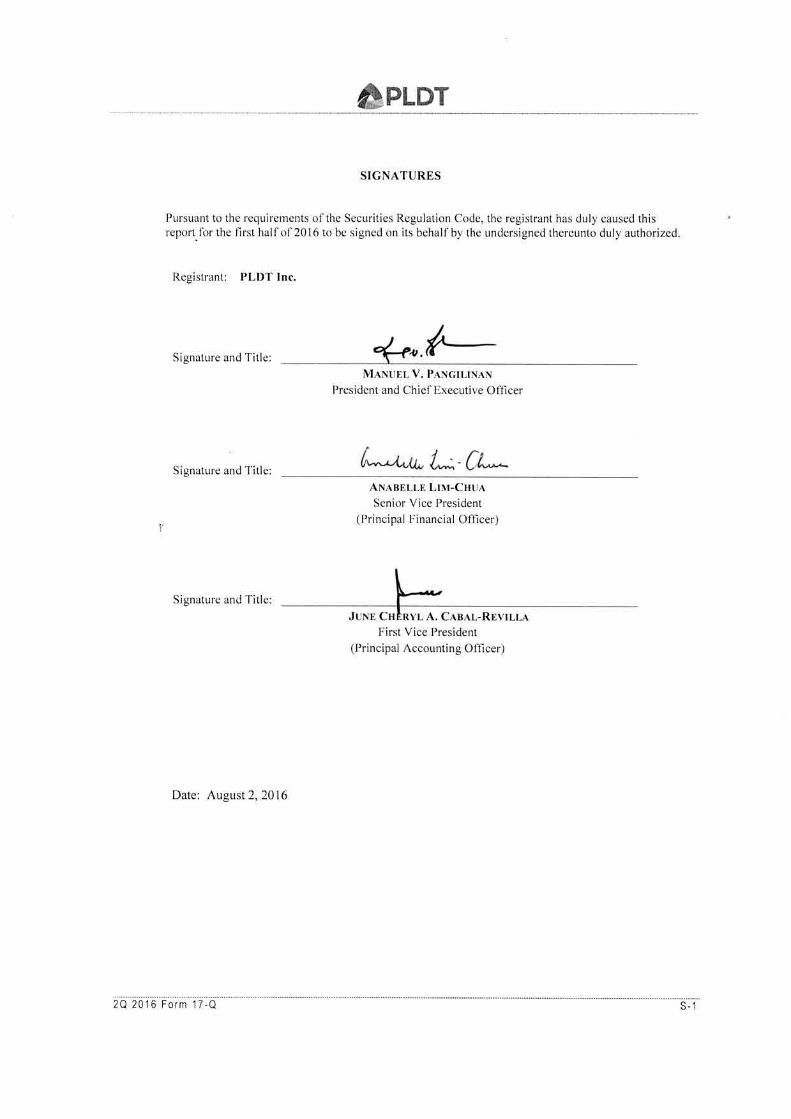
F-1
PLDT INC. AND SUBSIDIARIES
CONSOLIDATED FINANCIAL STATEMENTS
AS AT JUNE 30, 2016 (UNAUDITED) AND DECEMBER 31, 2015 (AUDITED)
AND FOR THE SIX MONTHS ENDED JUNE 30, 2016 AND 2015 (UNAUDITED)
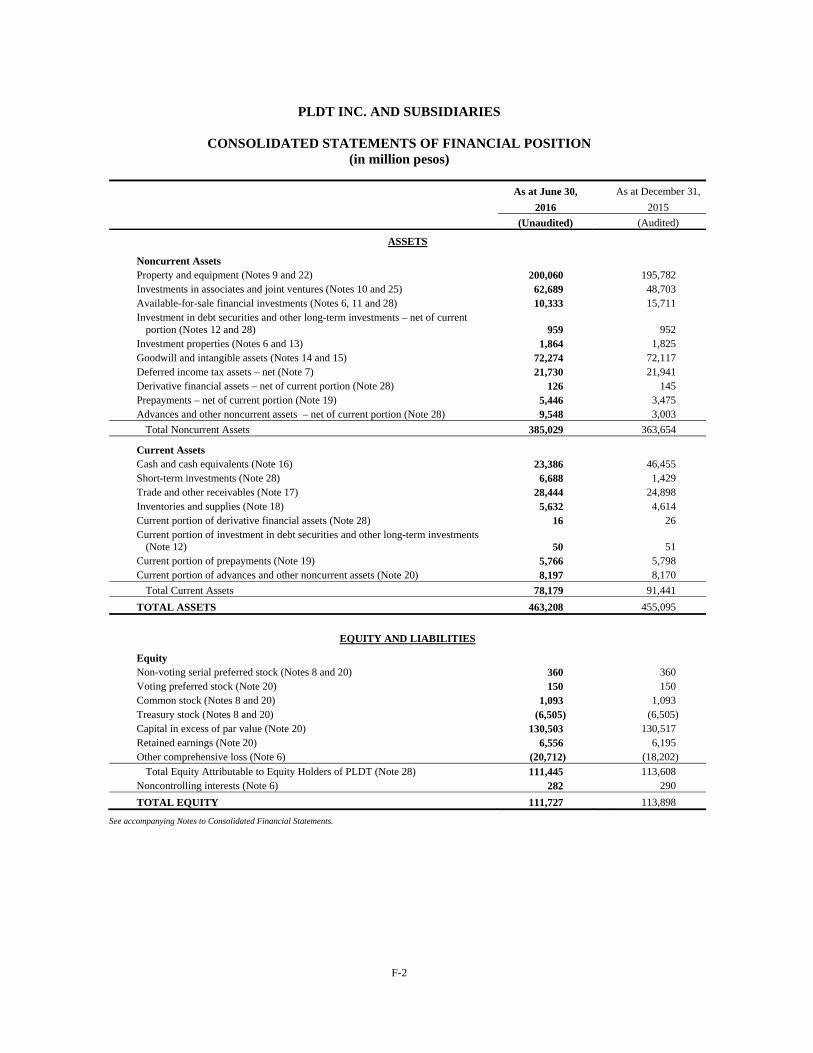
F-2
PLDT INC. AND SUBSIDIARIES
CONSOLIDATED STATEMENTS OF FINANCIAL POSITION (in million pesos)
As at June 30, As at December 31,
2016 2015
(Unaudited) (Audited)
ASSETS
Noncurrent Assets Property and equipment (Notes 9 and 22) 200,060 195,782 Investments in associates and joint ventures (Notes 10 and 25) 62,689 48,703 Available-for-sale financial investments (Notes 6, 11 and 28) 10,333 15,711 Investment in debt securities and other long-term investments – net of current
portion (Notes 12 and 28) 959 952 Investment properties (Notes 6 and 13) 1,864 1,825 Goodwill and intangible assets (Notes 14 and 15) 72,274 72,117 Deferred income tax assets – net (Note 7) 21,730 21,941 Derivative financial assets – net of current portion (Note 28) 126 145 Prepayments – net of current portion (Note 19) 5,446 3,475 Advances and other noncurrent assets – net of current portion (Note 28) 9,548 3,003
Total Noncurrent Assets 385,029 363,654
Current Assets Cash and cash equivalents (Note 16) 23,386 46,455 Short-term investments (Note 28) 6,688 1,429 Trade and other receivables (Note 17) 28,444 24,898 Inventories and supplies (Note 18) 5,632 4,614 Current portion of derivative financial assets (Note 28) 16 26 Current portion of investment in debt securities and other long-term investments
(Note 12) 50 51 Current portion of prepayments (Note 19) 5,766 5,798 Current portion of advances and other noncurrent assets (Note 20) 8,197 8,170
Total Current Assets 78,179 91,441
TOTAL ASSETS 463,208 455,095
EQUITY AND LIABILITIES
Equity Non-voting serial preferred stock (Notes 8 and 20) 360 360 Voting preferred stock (Note 20) 150 150 Common stock (Notes 8 and 20) 1,093 1,093 Treasury stock (Notes 8 and 20) (6,505) (6,505) Capital in excess of par value (Note 20) 130,503 130,517 Retained earnings (Note 20) 6,556 6,195 Other comprehensive loss (Note 6) (20,712) (18,202)
Total Equity Attributable to Equity Holders of PLDT (Note 28) 111,445 113,608 Noncontrolling interests (Note 6) 282 290
TOTAL EQUITY 111,727 113,898
See accompanying Notes to Consolidated Financial Statements.
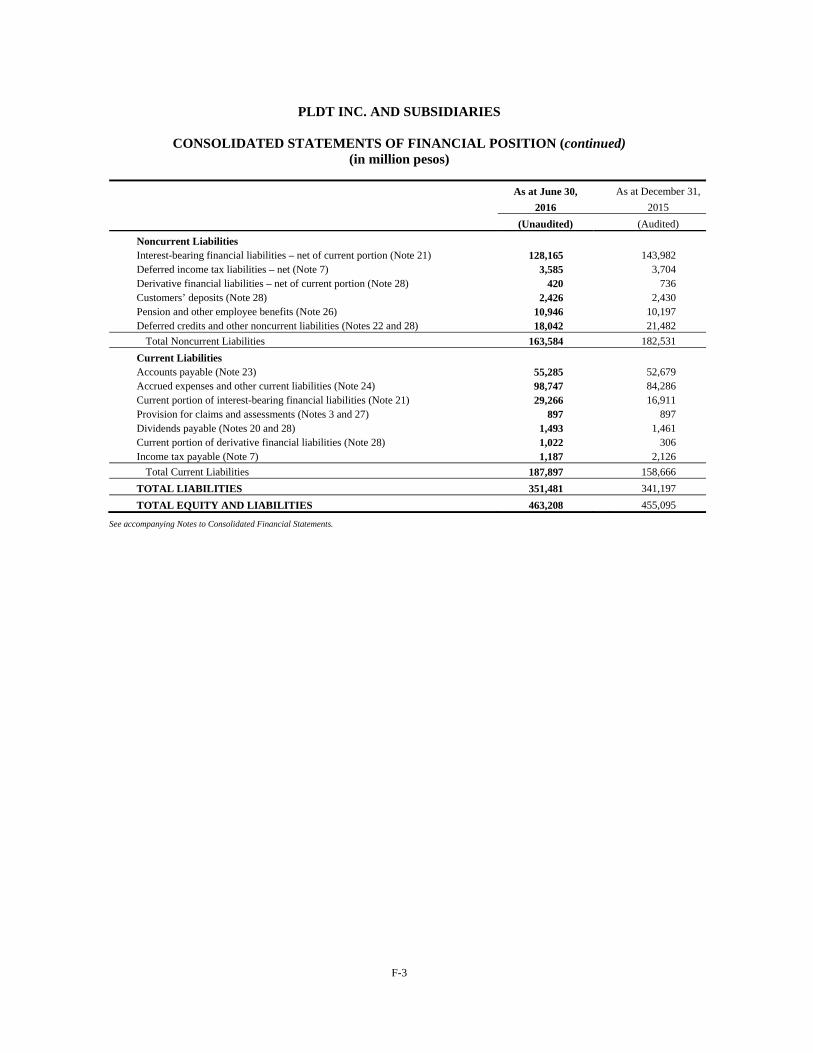
F-3
PLDT INC. AND SUBSIDIARIES
CONSOLIDATED STATEMENTS OF FINANCIAL POSITION (continued) (in million pesos)
As at June 30, As at December 31,
2016 2015
(Unaudited) (Audited)
Noncurrent Liabilities Interest-bearing financial liabilities – net of current portion (Note 21) 128,165 143,982 Deferred income tax liabilities – net (Note 7) 3,585 3,704 Derivative financial liabilities – net of current portion (Note 28) 420 736 Customers’ deposits (Note 28) 2,426 2,430 Pension and other employee benefits (Note 26) 10,946 10,197 Deferred credits and other noncurrent liabilities (Notes 22 and 28) 18,042 21,482
Total Noncurrent Liabilities 163,584 182,531
Current Liabilities Accounts payable (Note 23) 55,285 52,679 Accrued expenses and other current liabilities (Note 24) 98,747 84,286 Current portion of interest-bearing financial liabilities (Note 21) 29,266 16,911 Provision for claims and assessments (Notes 3 and 27) 897 897 Dividends payable (Notes 20 and 28) 1,493 1,461 Current portion of derivative financial liabilities (Note 28) 1,022 306 Income tax payable (Note 7) 1,187 2,126
Total Current Liabilities 187,897 158,666
TOTAL LIABILITIES 351,481 341,197
TOTAL EQUITY AND LIABILITIES 463,208 455,095
See accompanying Notes to Consolidated Financial Statements.
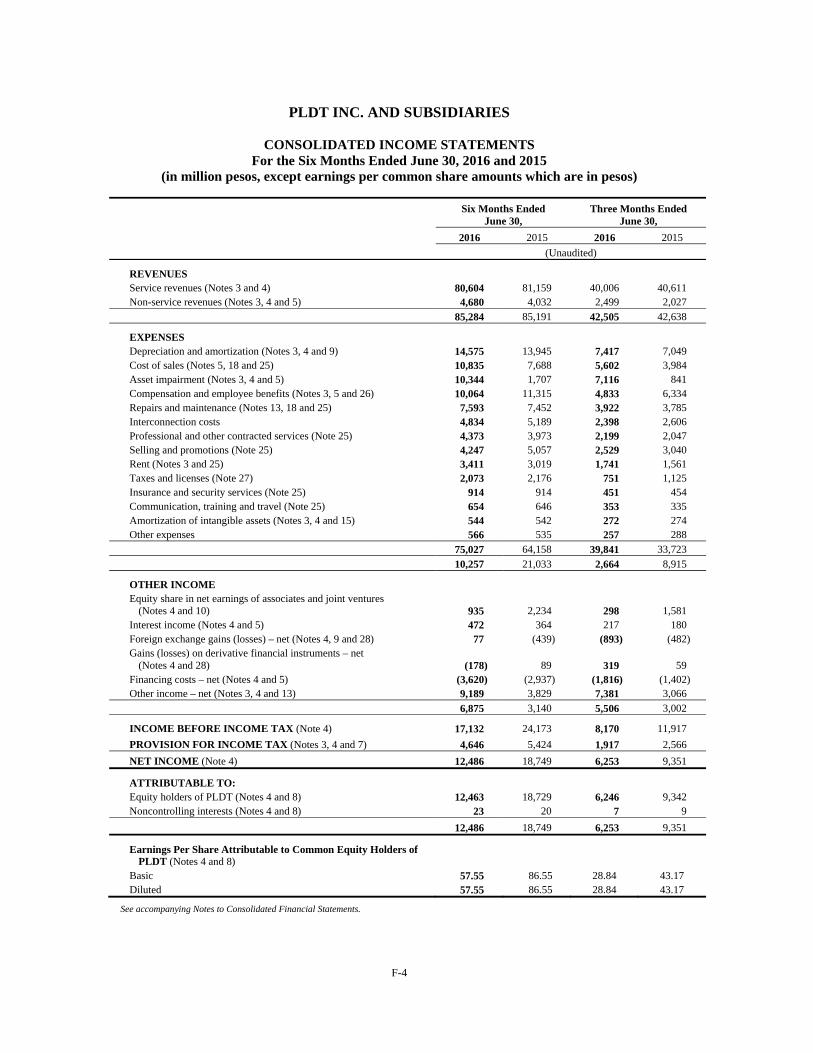
F-4
PLDT INC. AND SUBSIDIARIES
CONSOLIDATED INCOME STATEMENTS For the Six Months Ended June 30, 2016 and 2015
(in million pesos, except earnings per common share amounts which are in pesos)
Six Months Ended
June 30, Three Months Ended
June 30,
2016 2015 2016 2015
(Unaudited)
REVENUES Service revenues (Notes 3 and 4) 80,604 81,159 40,006 40,611 Non-service revenues (Notes 3, 4 and 5) 4,680 4,032 2,499 2,027 85,284 85,191 42,505 42,638
EXPENSES Depreciation and amortization (Notes 3, 4 and 9) 14,575 13,945 7,417 7,049 Cost of sales (Notes 5, 18 and 25) 10,835 7,688 5,602 3,984 Asset impairment (Notes 3, 4 and 5) 10,344 1,707 7,116 841 Compensation and employee benefits (Notes 3, 5 and 26) 10,064 11,315 4,833 6,334 Repairs and maintenance (Notes 13, 18 and 25) 7,593 7,452 3,922 3,785 Interconnection costs 4,834 5,189 2,398 2,606 Professional and other contracted services (Note 25) 4,373 3,973 2,199 2,047 Selling and promotions (Note 25) 4,247 5,057 2,529 3,040 Rent (Notes 3 and 25) 3,411 3,019 1,741 1,561 Taxes and licenses (Note 27) 2,073 2,176 751 1,125 Insurance and security services (Note 25) 914 914 451 454 Communication, training and travel (Note 25) 654 646 353 335 Amortization of intangible assets (Notes 3, 4 and 15) 544 542 272 274 Other expenses 566 535 257 288
75,027 64,158 39,841 33,723
10,257 21,033 2,664 8,915
OTHER INCOME Equity share in net earnings of associates and joint ventures
(Notes 4 and 10) 935 2,234 298
1,581 Interest income (Notes 4 and 5) 472 364 217 180 Foreign exchange gains (losses) – net (Notes 4, 9 and 28) 77 (439) (893) (482) Gains (losses) on derivative financial instruments – net
(Notes 4 and 28) (178) 89 319 59 Financing costs – net (Notes 4 and 5) (3,620) (2,937) (1,816) (1,402) Other income – net (Notes 3, 4 and 13) 9,189 3,829 7,381 3,066
6,875 3,140 5,506 3,002
INCOME BEFORE INCOME TAX (Note 4) 17,132 24,173 8,170 11,917
PROVISION FOR INCOME TAX (Notes 3, 4 and 7) 4,646 5,424 1,917 2,566
NET INCOME (Note 4) 12,486 18,749 6,253 9,351
ATTRIBUTABLE TO: Equity holders of PLDT (Notes 4 and 8) 12,463 18,729 6,246 9,342 Noncontrolling interests (Notes 4 and 8) 23 20 7 9
12,486 18,749 6,253 9,351
Earnings Per Share Attributable to Common Equity Holders of PLDT (Notes 4 and 8)
Basic 57.55 86.55 28.84 43.17 Diluted 57.55 86.55 28.84 43.17
See accompanying Notes to Consolidated Financial Statements.
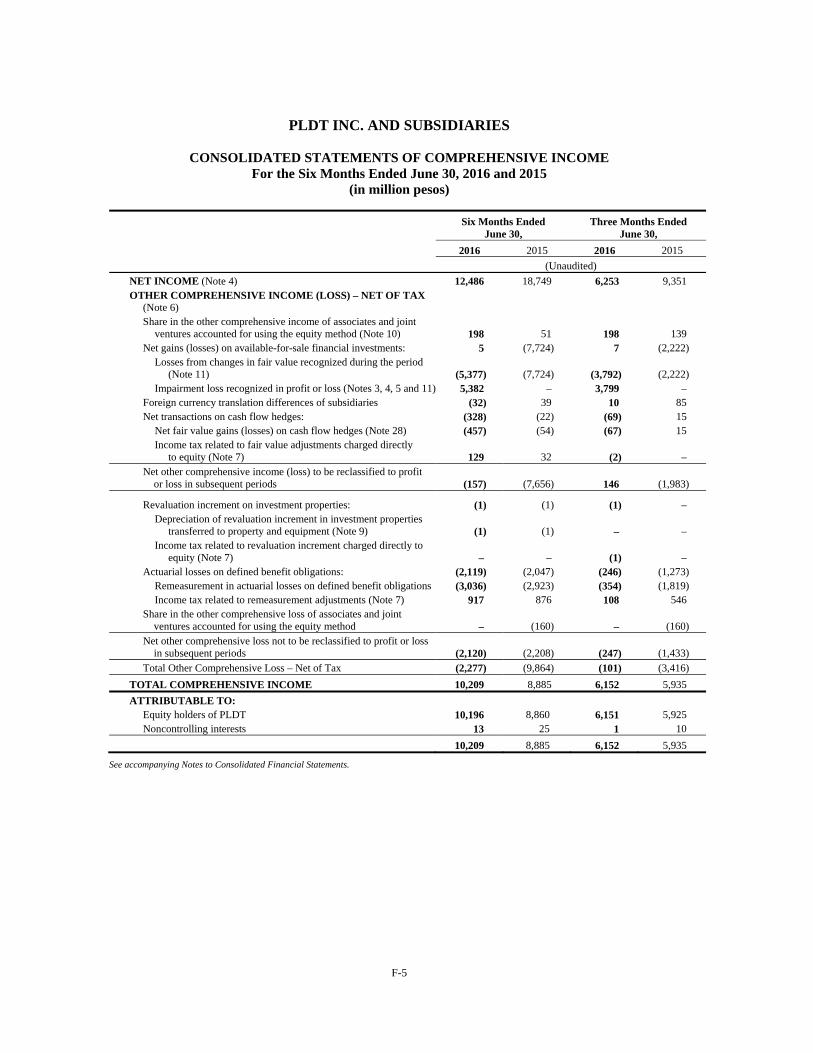
F-5
PLDT INC. AND SUBSIDIARIES
CONSOLIDATED STATEMENTS OF COMPREHENSIVE INCOME For the Six Months Ended June 30, 2016 and 2015
(in million pesos)
Six Months Ended
June 30,Three Months Ended
June 30,
2016 2015 2016 2015
(Unaudited)
NET INCOME (Note 4) 12,486 18,749 6,253 9,351 OTHER COMPREHENSIVE INCOME (LOSS) – NET OF TAX
(Note 6)
Share in the other comprehensive income of associates and joint ventures accounted for using the equity method (Note 10) 198 51 198 139
Net gains (losses) on available-for-sale financial investments: 5 (7,724) 7 (2,222) Losses from changes in fair value recognized during the period
(Note 11) (5,377) (7,724) (3,792) (2,222) Impairment loss recognized in profit or loss (Notes 3, 4, 5 and 11) 5,382 – 3,799 –
Foreign currency translation differences of subsidiaries (32) 39 10 85 Net transactions on cash flow hedges: (328) (22) (69) 15
Net fair value gains (losses) on cash flow hedges (Note 28) (457) (54) (67) 15 Income tax related to fair value adjustments charged directly
to equity (Note 7) 129 32 (2) – Net other comprehensive income (loss) to be reclassified to profit
or loss in subsequent periods (157) (7,656) 146 (1,983)
Revaluation increment on investment properties: (1) (1) (1) – Depreciation of revaluation increment in investment properties
transferred to property and equipment (Note 9) (1) (1) – – Income tax related to revaluation increment charged directly to
equity (Note 7) – – (1) – Actuarial losses on defined benefit obligations: (2,119) (2,047) (246) (1,273)
Remeasurement in actuarial losses on defined benefit obligations (3,036) (2,923) (354) (1,819) Income tax related to remeasurement adjustments (Note 7) 917 876 108 546
Share in the other comprehensive loss of associates and joint ventures accounted for using the equity method – (160) – (160)
Net other comprehensive loss not to be reclassified to profit or loss in subsequent periods (2,120) (2,208) (247) (1,433)
Total Other Comprehensive Loss – Net of Tax (2,277) (9,864) (101) (3,416)
TOTAL COMPREHENSIVE INCOME 10,209 8,885 6,152 5,935
ATTRIBUTABLE TO: Equity holders of PLDT 10,196 8,860 6,151 5,925 Noncontrolling interests 13 25 1 10
10,209 8,885 6,152 5,935
See accompanying Notes to Consolidated Financial Statements.
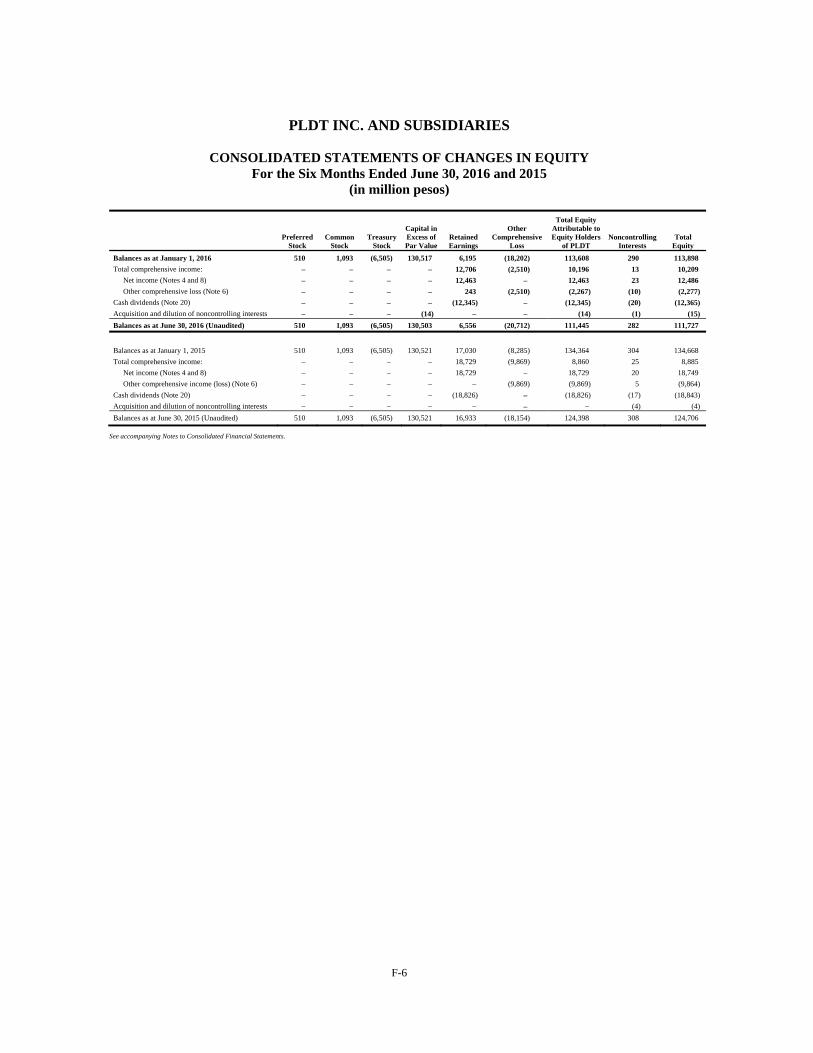
F-6
PLDT INC. AND SUBSIDIARIES
CONSOLIDATED STATEMENTS OF CHANGES IN EQUITY For the Six Months Ended June 30, 2016 and 2015
(in million pesos)
Preferred
Stock Common
Stock Treasury
Stock
Capital in Excess of Par Value
Retained Earnings
Other Comprehensive
Loss
Total Equity Attributable to Equity Holders
of PLDT Noncontrolling
Interests Total
Equity
Balances as at January 1, 2016 510 1,093 (6,505) 130,517 6,195 (18,202) 113,608 290 113,898
Total comprehensive income: – – – – 12,706 (2,510) 10,196 13 10,209
Net income (Notes 4 and 8) – – – – 12,463 – 12,463 23 12,486
Other comprehensive loss (Note 6) – – – – 243 (2,510) (2,267) (10) (2,277)
Cash dividends (Note 20) – – – – (12,345) – (12,345) (20) (12,365)
Acquisition and dilution of noncontrolling interests – – – (14) – – (14) (1) (15)
Balances as at June 30, 2016 (Unaudited) 510 1,093 (6,505) 130,503 6,556 (20,712) 111,445 282 111,727
Balances as at January 1, 2015 510 1,093 (6,505) 130,521 17,030 (8,285) 134,364 304 134,668
Total comprehensive income: – – – – 18,729 (9,869) 8,860 25 8,885
Net income (Notes 4 and 8) – – – – 18,729 – 18,729 20 18,749
Other comprehensive income (loss) (Note 6) – – – – – (9,869) (9,869) 5 (9,864)
Cash dividends (Note 20) – – – – (18,826) – (18,826) (17) (18,843)
Acquisition and dilution of noncontrolling interests – – – – – – – (4) (4)
Balances as at June 30, 2015 (Unaudited) 510 1,093 (6,505) 130,521 16,933 (18,154) 124,398 308 124,706
See accompanying Notes to Consolidated Financial Statements.
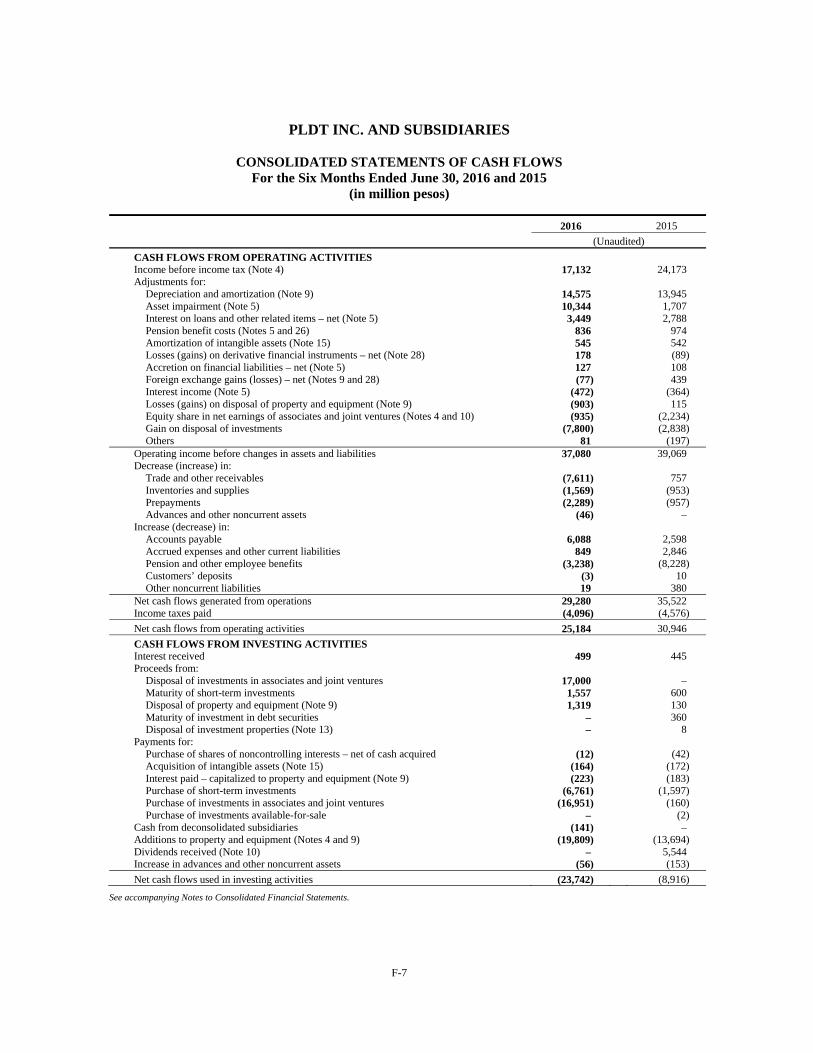
F-7
PLDT INC. AND SUBSIDIARIES
CONSOLIDATED STATEMENTS OF CASH FLOWS
For the Six Months Ended June 30, 2016 and 2015 (in million pesos)
2016 2015
(Unaudited)
CASH FLOWS FROM OPERATING ACTIVITIES Income before income tax (Note 4) 17,132 24,173 Adjustments for:
Depreciation and amortization (Note 9) 14,575 13,945 Asset impairment (Note 5) 10,344 1,707 Interest on loans and other related items – net (Note 5) 3,449 2,788 Pension benefit costs (Notes 5 and 26) 836 974 Amortization of intangible assets (Note 15) 545 542 Losses (gains) on derivative financial instruments – net (Note 28) 178 (89) Accretion on financial liabilities – net (Note 5) 127 108 Foreign exchange gains (losses) – net (Notes 9 and 28) (77) 439 Interest income (Note 5) (472) (364) Losses (gains) on disposal of property and equipment (Note 9) (903) 115 Equity share in net earnings of associates and joint ventures (Notes 4 and 10) (935) (2,234) Gain on disposal of investments (7,800) (2,838) Others 81 (197)
Operating income before changes in assets and liabilities 37,080 39,069 Decrease (increase) in:
Trade and other receivables (7,611) 757 Inventories and supplies (1,569) (953) Prepayments (2,289) (957) Advances and other noncurrent assets (46) –
Increase (decrease) in: Accounts payable 6,088 2,598 Accrued expenses and other current liabilities 849 2,846 Pension and other employee benefits (3,238) (8,228) Customers’ deposits (3) 10 Other noncurrent liabilities 19 380
Net cash flows generated from operations 29,280 35,522 Income taxes paid (4,096) (4,576)
Net cash flows from operating activities 25,184 30,946
CASH FLOWS FROM INVESTING ACTIVITIES Interest received 499 445 Proceeds from:
Disposal of investments in associates and joint ventures 17,000 – Maturity of short-term investments 1,557 600 Disposal of property and equipment (Note 9) 1,319 130 Maturity of investment in debt securities – 360 Disposal of investment properties (Note 13) – 8
Payments for: Purchase of shares of noncontrolling interests – net of cash acquired (12) (42) Acquisition of intangible assets (Note 15) (164) (172) Interest paid – capitalized to property and equipment (Note 9) (223) (183) Purchase of short-term investments (6,761) (1,597) Purchase of investments in associates and joint ventures (16,951) (160) Purchase of investments available-for-sale – (2)
Cash from deconsolidated subsidiaries (141) – Additions to property and equipment (Notes 4 and 9) (19,809) (13,694) Dividends received (Note 10) – 5,544 Increase in advances and other noncurrent assets (56) (153)
Net cash flows used in investing activities (23,742) (8,916)
See accompanying Notes to Consolidated Financial Statements.
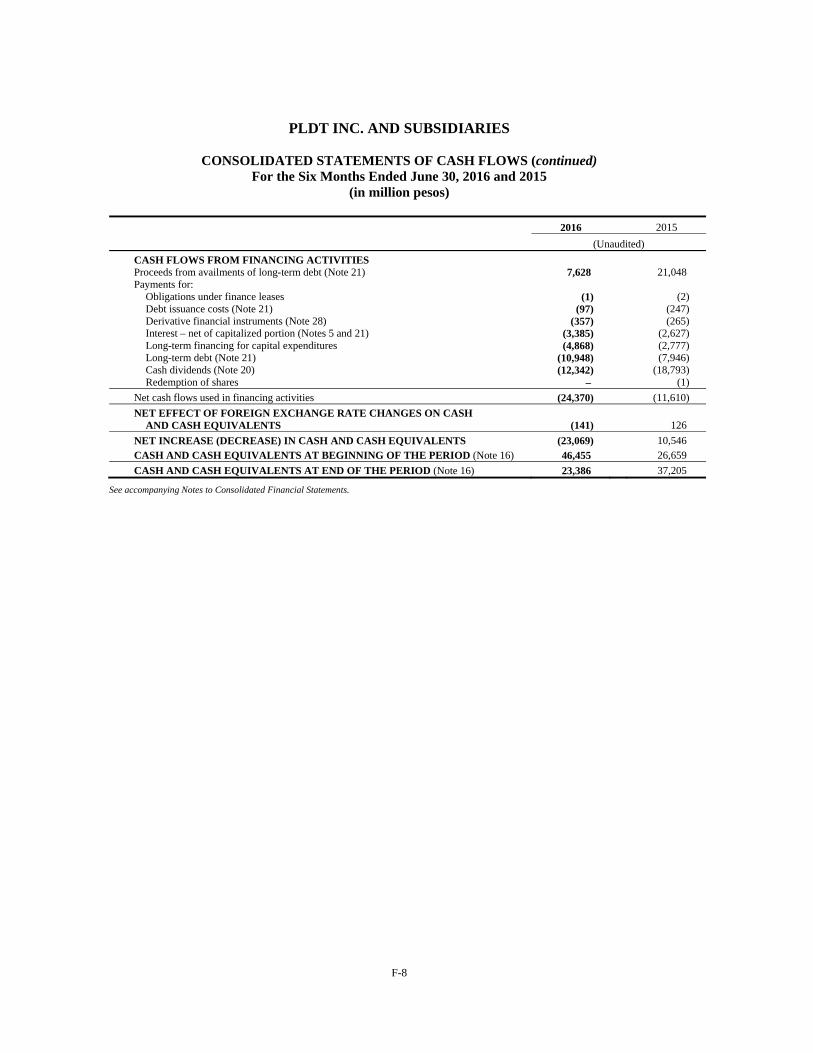
F-8
PLDT INC. AND SUBSIDIARIES
CONSOLIDATED STATEMENTS OF CASH FLOWS (continued)
For the Six Months Ended June 30, 2016 and 2015 (in million pesos)
2016 2015
(Unaudited)
CASH FLOWS FROM FINANCING ACTIVITIES Proceeds from availments of long-term debt (Note 21) 7,628 21,048 Payments for:
Obligations under finance leases (1) (2) Debt issuance costs (Note 21) (97) (247) Derivative financial instruments (Note 28) (357) (265) Interest – net of capitalized portion (Notes 5 and 21) (3,385) (2,627) Long-term financing for capital expenditures (4,868) (2,777) Long-term debt (Note 21) (10,948) (7,946) Cash dividends (Note 20) (12,342) (18,793) Redemption of shares – (1)
Net cash flows used in financing activities (24,370) (11,610)
NET EFFECT OF FOREIGN EXCHANGE RATE CHANGES ON CASH AND CASH EQUIVALENTS (141) 126
NET INCREASE (DECREASE) IN CASH AND CASH EQUIVALENTS (23,069) 10,546
CASH AND CASH EQUIVALENTS AT BEGINNING OF THE PERIOD (Note 16) 46,455 26,659
CASH AND CASH EQUIVALENTS AT END OF THE PERIOD (Note 16) 23,386 37,205
See accompanying Notes to Consolidated Financial Statements.
F-9
PLDT INC. AND SUBSIDIARIES NOTES TO CONSOLIDATED FINANCIAL STATEMENTS
1. Corporate Information
The PLDT, Inc. (formerly Philippine Long Distance Telephone Company, or PLDT, or the Parent Company) was incorporated under the old Corporation Law of the Philippines (Act 1459, as amended) on November 28, 1928, following the merger of four telephone companies under common U.S. ownership. Under its amended Articles of Incorporation, PLDT’s corporate term is currently limited through 2028. In 1967, effective control of PLDT was sold by the General Telephone and Electronics Corporation, then a major shareholder since PLDT’s incorporation, to a group of Filipino businessmen. In 1981, in furtherance of the then existing policy of the Philippine government to integrate the Philippine telecommunications industry, PLDT purchased substantially all of the assets and liabilities of the Republic Telephone Company, which at that time was the second largest telephone company in the Philippines. In 1998, certain subsidiaries of First Pacific Company Limited, or First Pacific, and its Philippine affiliates (collectively the First Pacific Group and its Philippine affiliates), acquired a significant interest in PLDT. On March 24, 2000, NTT Communications Corporation, or NTT Communications, through its wholly-owned subsidiary NTT Communications Capital (UK) Ltd., became PLDT’s strategic partner with approximately 15% economic and voting interest in the issued and outstanding common stock of PLDT at that time. Simultaneous with NTT Communications’ investment in PLDT, the latter acquired 100% of Smart Communications, Inc., or Smart. On March 14, 2006, NTT DOCOMO, Inc., or NTT DOCOMO, acquired from NTT Communications approximately 7% of PLDT’s then outstanding common shares held by NTT Communications with NTT Communications retaining ownership of approximately 7% of PLDT’s common shares. Since March 14, 2006, NTT DOCOMO has made additional purchases of shares of PLDT, and together with NTT Communications beneficially owned approximately 20% of PLDT’s outstanding common stock as at June 30, 2016. NTT Communications and NTT DOCOMO are subsidiaries of NTT Holding Company. On February 28, 2007, Metro Pacific Asset Holdings, Inc., a Philippine affiliate of First Pacific, completed the acquisition of an approximately 46% interest in Philippine Telecommunications Investment Corporation, or PTIC, a shareholder of PLDT. This investment in PTIC represented an attributable interest of approximately 6% of the then outstanding common shares of PLDT and thereby raised First Pacific Group’s and its Philippine affiliates’ beneficial ownership to approximately 28% of PLDT’s outstanding common stock as at that date. Since then, First Pacific Group’s beneficial ownership interest in PLDT decreased by approximately 2%, mainly due to the holders of Exchangeable Notes, which were issued in 2005 by a subsidiary of First Pacific and exchangeable into PLDT shares owned by First Pacific Group, who fully exchanged their notes. First Pacific Group and its Philippine affiliates had beneficial ownership of approximately 26% in PLDT’s outstanding common stock as at June 30, 2016. On October 26, 2011, PLDT completed the acquisition of a controlling interest in Digital Telecommunications Phils., Inc., or Digitel, from JG Summit Holdings, Inc., or JGSHI, and its affiliates, or JG Summit Group. As payment for the assets acquired from JGSHI, PLDT issued approximately 27.7 million common shares. In November 2011, JGSHI sold 5.81 million and 4.56 million PLDT shares to a Philippine affiliate of First Pacific and NTT DOCOMO, respectively, pursuant to separate option agreements that JGSHI had entered into with a Philippine affiliate of First Pacific and NTT DOCOMO, respectively. As at June 30, 2016, the JG Summit Group beneficially owned approximately 8% of PLDT’s outstanding common shares.
On October 16, 2012, BTF Holdings, Inc., or BTFHI, a wholly-owned company of the Board of Trustees for the Account of the Beneficial Trust Fund, or PLDT Beneficial Trust Fund, created pursuant to PLDT’s Benefit Plan, subscribed to 150 million newly issued shares of Voting Preferred Stock of PLDT, or Voting Preferred Shares, at a subscription price of Php1.00 per share for a total subscription price of Php150 million pursuant to a subscription agreement between BTFHI and PLDT dated October 15, 2012. As a result of the issuance of Voting Preferred Shares, the voting power of the NTT Group (NTT DOCOMO and NTT Communications), First Pacific Group and its Philippine affiliates, and JG Summit Group was reduced to 12%, 15% and 5%, respectively, as at June 30, 2016. See Note 20 – Equity – Voting Preferred Stock and Note 27 – Provisions and Contingencies – In the Matter of the Wilson Gamboa Case and Jose M. Roy III Petition.

F-10
The common shares of PLDT are listed and traded on the Philippine Stock Exchange, Inc., or PSE. On October 19, 1994, an American Depositary Receipt, or ADR, facility was established, pursuant to which Citibank N.A., as the depositary, issued American Depositary Shares, or ADSs, with each ADS representing one PLDT common share with a par value of Php5.00 per share. Effective February 10, 2003, PLDT appointed JP Morgan Chase Bank as successor depositary for PLDT’s ADR facility. The ADSs are listed on the New York Stock Exchange, or NYSE, in the United States and are traded on the NYSE under the symbol “PHI”. There were approximately 39.6 million ADSs outstanding as at June 30, 2016.
PLDT and our Philippine-based fixed line and wireless subsidiaries operate under the jurisdiction of the Philippine National Telecommunications Commission, or NTC, which jurisdiction extends, among other things, to approving major services offered and certain rates charged to customers. We are the leading telecommunications service provider in the Philippines. Through our three business segments (Wireless, Fixed Line and Others), we offer the largest and most diversified range of telecommunications services which offers data and multi-media services across the Philippines’ most extensive fiber optic backbone, wireless and fixed line networks. Our principal activities are discussed in Note 4 – Operating Segment Information. Our registered office address is Ramon Cojuangco Building, Makati Avenue, Makati City, Philippines. Amendments to the Articles of Incorporation of PLDT On April 12, 2016 and June 14, 2016, the Board of Directors and stockholders, respectively, approved the following actions: (1) change in the name of the Company from Philippine Long Distance Telephone Company to PLDT Inc.; (2) expansion of the purpose clause to expressly provide for such other purposes and powers incidental to or in furtherance of the primary purpose, including the power to do or engage in such activities required, necessary or expedient in the pursuit of lawful businesses or for the protection or benefit of the Company; and (3) corresponding amendments to the First Article and Second Article of the Articles of Incorporation of the Company. On July 29, 2016, the Amended Articles of Incorporation of the Company containing the aforementioned amendments has been approved by the Philippine SEC.
2. Summary of Significant Accounting Policies
Basis of Preparation Our consolidated financial statements have been prepared in accordance with Philippine Financial Reporting Standards, or PFRSs, as issued by the Philippine Financial Reporting Standards Council, or FRSC. Our consolidated financial statements have been prepared under the historical cost basis, except for derivative financial instruments, available-for-sale financial investments, certain short-term investments and investment properties that are measured at fair values. Our consolidated financial statements include adjustments consisting only of normal recurring adjustments, necessary to present fairly the results of operations for the interim periods. The results of operations for the six months ended June 30, 2016 are not necessarily indicative of the results of operations that may be expected for the full year. Our consolidated financial statements are presented in Philippine peso, PLDT’s functional and presentation currency, and all values are rounded to the nearest million, except when otherwise indicated.
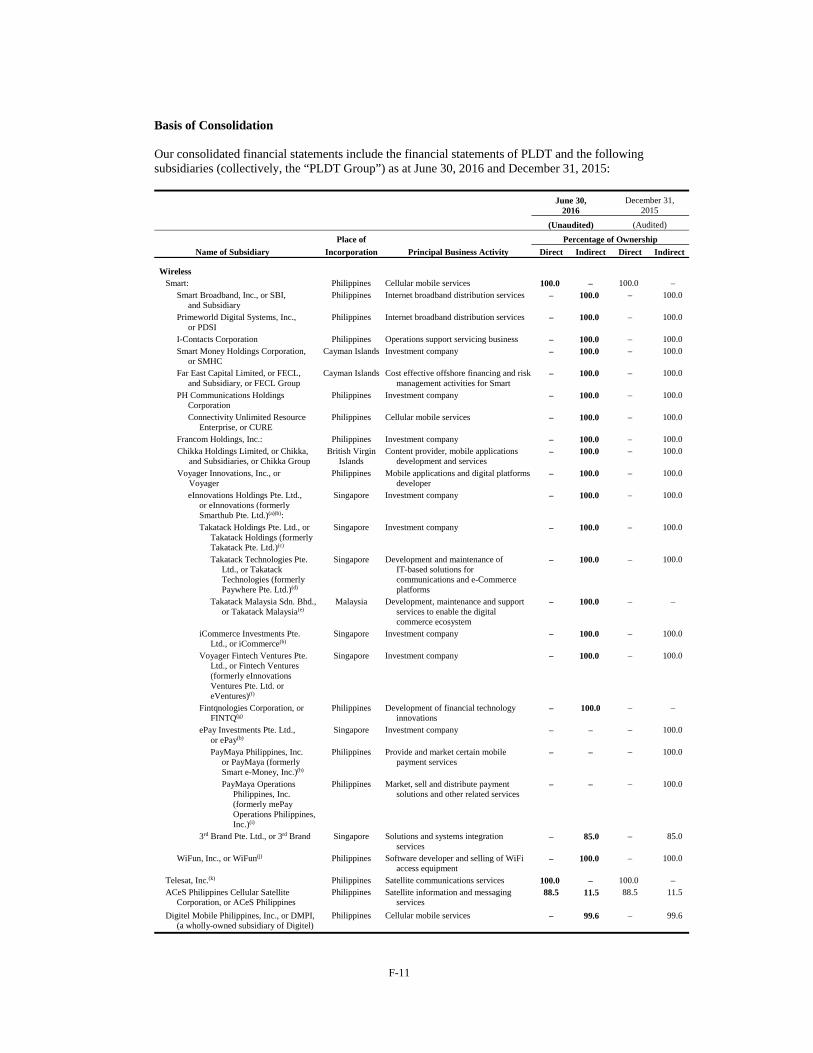
F-11
Basis of Consolidation Our consolidated financial statements include the financial statements of PLDT and the following subsidiaries (collectively, the “PLDT Group”) as at June 30, 2016 and December 31, 2015:
June 30,
2016 December 31,
2015
(Unaudited) (Audited)
Place of Percentage of Ownership
Name of Subsidiary Incorporation Principal Business Activity Direct Indirect Direct Indirect
Wireless Smart: Philippines Cellular mobile services 100.0 – 100.0 –
Smart Broadband, Inc., or SBI, and Subsidiary
Philippines Internet broadband distribution services – 100.0 – 100.0
Primeworld Digital Systems, Inc., or PDSI
Philippines Internet broadband distribution services – 100.0 – 100.0
I-Contacts Corporation Philippines Operations support servicing business – 100.0 – 100.0 Smart Money Holdings Corporation,
or SMHC Cayman Islands Investment company – 100.0 – 100.0
Far East Capital Limited, or FECL, and Subsidiary, or FECL Group
Cayman Islands Cost effective offshore financing and risk management activities for Smart
– 100.0 – 100.0
PH Communications Holdings Corporation
Philippines Investment company – 100.0 – 100.0
Connectivity Unlimited Resource Enterprise, or CURE
Philippines Cellular mobile services – 100.0 – 100.0
Francom Holdings, Inc.: Philippines Investment company – 100.0 – 100.0 Chikka Holdings Limited, or Chikka,
and Subsidiaries, or Chikka Group British Virgin
Islands Content provider, mobile applications
development and services – 100.0 – 100.0
Voyager Innovations, Inc., or Voyager
Philippines Mobile applications and digital platforms developer
– 100.0 – 100.0
eInnovations Holdings Pte. Ltd., or eInnovations (formerly Smarthub Pte. Ltd.)(a)(b):
Singapore Investment company – 100.0 – 100.0
Takatack Holdings Pte. Ltd., or Takatack Holdings (formerly Takatack Pte. Ltd.)(c)
Singapore Investment company – 100.0 – 100.0
Takatack Technologies Pte. Ltd., or Takatack Technologies (formerly Paywhere Pte. Ltd.)(d)
Singapore Development and maintenance of IT-based solutions for communications and e-Commerce platforms
– 100.0 – 100.0
Takatack Malaysia Sdn. Bhd., or Takatack Malaysia(e)
Malaysia Development, maintenance and support services to enable the digital commerce ecosystem
– 100.0 – –
iCommerce Investments Pte. Ltd., or iCommerce(b)
Singapore Investment company – 100.0 – 100.0
Voyager Fintech Ventures Pte. Ltd., or Fintech Ventures (formerly eInnovations Ventures Pte. Ltd. or eVentures)(f)
Singapore Investment company – 100.0 – 100.0
Fintqnologies Corporation, or FINTQ(g)
Philippines Development of financial technology innovations
– 100.0 – –
ePay Investments Pte. Ltd., or ePay(b)
Singapore Investment company – – – 100.0
PayMaya Philippines, Inc. or PayMaya (formerly Smart e-Money, Inc.)(h)
Philippines Provide and market certain mobile payment services
– – – 100.0
PayMaya Operations Philippines, Inc. (formerly mePay Operations Philippines, Inc.)(i)
Philippines Market, sell and distribute payment solutions and other related services
– – – 100.0
3rd Brand Pte. Ltd., or 3rd Brand Singapore Solutions and systems integration services
– 85.0 – 85.0
WiFun, Inc., or WiFun(j) Philippines Software developer and selling of WiFi access equipment
– 100.0 – 100.0
Telesat, Inc.(k) Philippines Satellite communications services 100.0 – 100.0 – ACeS Philippines Cellular Satellite
Corporation, or ACeS Philippines Philippines Satellite information and messaging
services 88.5 11.5 88.5 11.5
Digitel Mobile Philippines, Inc., or DMPI, (a wholly-owned subsidiary of Digitel)
Philippines Cellular mobile services – 99.6 – 99.6
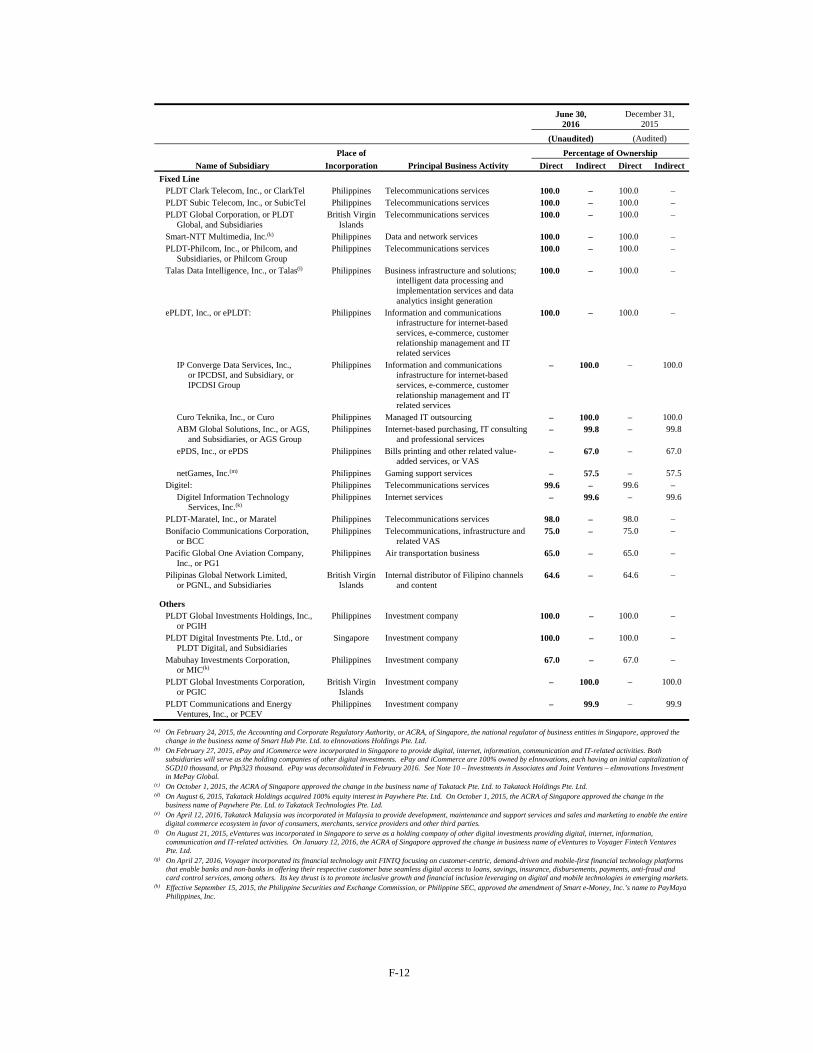
F-12
June 30,
2016 December 31,
2015
(Unaudited) (Audited)
Place of Percentage of Ownership
Name of Subsidiary Incorporation Principal Business Activity Direct Indirect Direct Indirect
Fixed Line PLDT Clark Telecom, Inc., or ClarkTel Philippines Telecommunications services 100.0 – 100.0 – PLDT Subic Telecom, Inc., or SubicTel Philippines Telecommunications services 100.0 – 100.0 – PLDT Global Corporation, or PLDT
Global, and Subsidiaries British Virgin
Islands Telecommunications services 100.0 – 100.0 –
Smart-NTT Multimedia, Inc.(k) Philippines Data and network services 100.0 – 100.0 – PLDT-Philcom, Inc., or Philcom, and
Subsidiaries, or Philcom Group Philippines Telecommunications services 100.0 – 100.0 –
Talas Data Intelligence, Inc., or Talas(l) Philippines Business infrastructure and solutions; intelligent data processing and implementation services and data analytics insight generation
100.0 – 100.0 –
ePLDT, Inc., or ePLDT: Philippines Information and communications infrastructure for internet-based services, e-commerce, customer relationship management and IT related services
100.0 – 100.0 –
IP Converge Data Services, Inc., or IPCDSI, and Subsidiary, or IPCDSI Group
Philippines Information and communications infrastructure for internet-based services, e-commerce, customer relationship management and IT related services
– 100.0 – 100.0
Curo Teknika, Inc., or Curo Philippines Managed IT outsourcing – 100.0 – 100.0 ABM Global Solutions, Inc., or AGS,
and Subsidiaries, or AGS Group Philippines Internet-based purchasing, IT consulting
and professional services – 99.8 – 99.8
ePDS, Inc., or ePDS Philippines Bills printing and other related value-added services, or VAS
– 67.0 – 67.0
netGames, Inc.(m) Philippines Gaming support services – 57.5 – 57.5 Digitel: Philippines Telecommunications services 99.6 – 99.6 –
Digitel Information Technology Services, Inc.(k)
Philippines Internet services – 99.6 – 99.6
PLDT-Maratel, Inc., or Maratel Philippines Telecommunications services 98.0 – 98.0 – Bonifacio Communications Corporation,
or BCC Philippines Telecommunications, infrastructure and
related VAS 75.0 – 75.0 –
Pacific Global One Aviation Company, Inc., or PG1
Philippines Air transportation business 65.0 – 65.0 –
Pilipinas Global Network Limited, or PGNL, and Subsidiaries
British Virgin Islands
Internal distributor of Filipino channels and content
64.6 – 64.6 –
Others PLDT Global Investments Holdings, Inc.,
or PGIH Philippines Investment company 100.0 – 100.0 –
PLDT Digital Investments Pte. Ltd., or PLDT Digital, and Subsidiaries
Singapore Investment company 100.0 – 100.0 –
Mabuhay Investments Corporation, or MIC(k)
Philippines Investment company 67.0 – 67.0 –
PLDT Global Investments Corporation, or PGIC
British Virgin Islands
Investment company – 100.0 – 100.0
PLDT Communications and Energy Ventures, Inc., or PCEV
Philippines Investment company – 99.9 – 99.9
(a) On February 24, 2015, the Accounting and Corporate Regulatory Authority, or ACRA, of Singapore, the national regulator of business entities in Singapore, approved the
change in the business name of Smart Hub Pte. Ltd. to eInnovations Holdings Pte. Ltd. (b) On February 27, 2015, ePay and iCommerce were incorporated in Singapore to provide digital, internet, information, communication and IT-related activities. Both
subsidiaries will serve as the holding companies of other digital investments. ePay and iCommerce are 100% owned by eInnovations, each having an initial capitalization of SGD10 thousand, or Php323 thousand. ePay was deconsolidated in February 2016. See Note 10 – Investments in Associates and Joint Ventures – eInnovations Investment in MePay Global.
(c) On October 1, 2015, the ACRA of Singapore approved the change in the business name of Takatack Pte. Ltd. to Takatack Holdings Pte. Ltd. (d) On August 6, 2015, Takatack Holdings acquired 100% equity interest in Paywhere Pte. Ltd. On October 1, 2015, the ACRA of Singapore approved the change in the
business name of Paywhere Pte. Ltd. to Takatack Technologies Pte. Ltd. (e) On April 12, 2016, Takatack Malaysia was incorporated in Malaysia to provide development, maintenance and support services and sales and marketing to enable the entire
digital commerce ecosystem in favor of consumers, merchants, service providers and other third parties. (f) On August 21, 2015, eVentures was incorporated in Singapore to serve as a holding company of other digital investments providing digital, internet, information,
communication and IT-related activities. On January 12, 2016, the ACRA of Singapore approved the change in business name of eVentures to Voyager Fintech Ventures Pte. Ltd.
(g) On April 27, 2016, Voyager incorporated its financial technology unit FINTQ focusing on customer-centric, demand-driven and mobile-first financial technology platforms that enable banks and non-banks in offering their respective customer base seamless digital access to loans, savings, insurance, disbursements, payments, anti-fraud and card control services, among others. Its key thrust is to promote inclusive growth and financial inclusion leveraging on digital and mobile technologies in emerging markets.
(h) Effective September 15, 2015, the Philippine Securities and Exchange Commission, or Philippine SEC, approved the amendment of Smart e-Money, Inc.’s name to PayMaya Philippines, Inc.
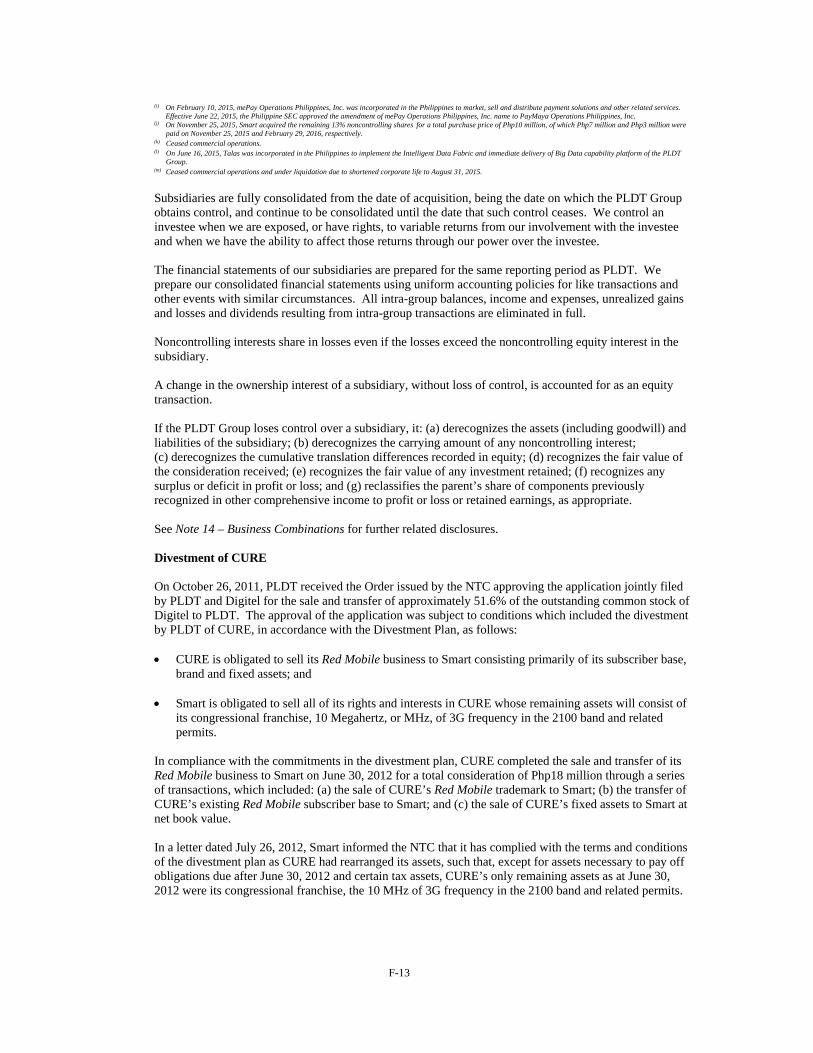
F-13
(i) On February 10, 2015, mePay Operations Philippines, Inc. was incorporated in the Philippines to market, sell and distribute payment solutions and other related services. Effective June 22, 2015, the Philippine SEC approved the amendment of mePay Operations Philippines, Inc. name to PayMaya Operations Philippines, Inc.
(j) On November 25, 2015, Smart acquired the remaining 13% noncontrolling shares for a total purchase price of Php10 million, of which Php7 million and Php3 million were paid on November 25, 2015 and February 29, 2016, respectively.
(k) Ceased commercial operations. (l) On June 16, 2015, Talas was incorporated in the Philippines to implement the Intelligent Data Fabric and immediate delivery of Big Data capability platform of the PLDT
Group. (m) Ceased commercial operations and under liquidation due to shortened corporate life to August 31, 2015.
Subsidiaries are fully consolidated from the date of acquisition, being the date on which the PLDT Group obtains control, and continue to be consolidated until the date that such control ceases. We control an investee when we are exposed, or have rights, to variable returns from our involvement with the investee and when we have the ability to affect those returns through our power over the investee. The financial statements of our subsidiaries are prepared for the same reporting period as PLDT. We prepare our consolidated financial statements using uniform accounting policies for like transactions and other events with similar circumstances. All intra-group balances, income and expenses, unrealized gains and losses and dividends resulting from intra-group transactions are eliminated in full.
Noncontrolling interests share in losses even if the losses exceed the noncontrolling equity interest in the subsidiary.
A change in the ownership interest of a subsidiary, without loss of control, is accounted for as an equity transaction.
If the PLDT Group loses control over a subsidiary, it: (a) derecognizes the assets (including goodwill) and liabilities of the subsidiary; (b) derecognizes the carrying amount of any noncontrolling interest; (c) derecognizes the cumulative translation differences recorded in equity; (d) recognizes the fair value of the consideration received; (e) recognizes the fair value of any investment retained; (f) recognizes any surplus or deficit in profit or loss; and (g) reclassifies the parent’s share of components previously recognized in other comprehensive income to profit or loss or retained earnings, as appropriate. See Note 14 – Business Combinations for further related disclosures. Divestment of CURE On October 26, 2011, PLDT received the Order issued by the NTC approving the application jointly filed by PLDT and Digitel for the sale and transfer of approximately 51.6% of the outstanding common stock of Digitel to PLDT. The approval of the application was subject to conditions which included the divestment by PLDT of CURE, in accordance with the Divestment Plan, as follows: CURE is obligated to sell its Red Mobile business to Smart consisting primarily of its subscriber base,
brand and fixed assets; and
Smart is obligated to sell all of its rights and interests in CURE whose remaining assets will consist of its congressional franchise, 10 Megahertz, or MHz, of 3G frequency in the 2100 band and related permits.
In compliance with the commitments in the divestment plan, CURE completed the sale and transfer of its Red Mobile business to Smart on June 30, 2012 for a total consideration of Php18 million through a series of transactions, which included: (a) the sale of CURE’s Red Mobile trademark to Smart; (b) the transfer of CURE’s existing Red Mobile subscriber base to Smart; and (c) the sale of CURE’s fixed assets to Smart at net book value. In a letter dated July 26, 2012, Smart informed the NTC that it has complied with the terms and conditions of the divestment plan as CURE had rearranged its assets, such that, except for assets necessary to pay off obligations due after June 30, 2012 and certain tax assets, CURE’s only remaining assets as at June 30, 2012 were its congressional franchise, the 10 MHz of 3G frequency in the 2100 band and related permits.
F-14
In a letter dated September 10, 2012, Smart informed the NTC that the minimum Cost Recovery Amount, or CRA, to enable the PLDT Group to recover its investment in CURE includes, among others, the total cost of equity investments in CURE, advances from Smart for operating requirements, advances from stockholders and associated funding costs. Smart also informed the NTC that the divestment will be undertaken through an auction sale of CURE’s shares of stock to the winning bidder and submitted CURE’s audited financial statements as at June 30, 2012 to the NTC. In a letter dated January 21, 2013, the NTC referred the computation of the CRA to the Commissioners of the NTC. Smart sent a reply agreeing to the proposal and is awaiting advice from the NTC on the bidding and auction of the 3G license of CURE. As at August 2, 2016, CURE is still waiting for advice from the NTC on how to proceed with the planned divestment. Due to the planned divestment, franchise and licenses related to CURE qualify as noncurrent assets held-for-sale. However, these were not presented separately in our consolidated statements of financial position as the carrying amounts are not material. PCEV’s Common Stock On June 24, 2014, PCEV’s Board of Directors approved a program involving the repurchase or buyback program of its common shares, which are owned by its remaining minority stockholders and offered for sale at a price of not more than Php100,000 per share. In 2014, the number of holders of PCEV common stock decreased to 97 and because the number of shareholders decreased below 100, PCEV filed a petition to the Philippine SEC for the suspension of duty to file reports under Section 17 of the Philippine SEC Regulation Code on December 22, 2014. After the buyback program which ended on June 30, 2015, the number of holders of PCEV common stock decreased to 96. On December 22, 2015, a year after submission of the petition, PCEV re-filed the notification of suspension of duty to file reports, advising the commission that PCEV will cease filing any reports required under Section 17 of the Philippine SEC Regulation Code beginning January 1, 2016. Consolidation of Various Digital Businesses of Smart under Voyager On December 18, 2014, the Board of Directors of Smart approved the consolidation of various digital businesses under Voyager. To facilitate the consolidation of these entities, the following were executed: (a) On February 25, 2015, Smart made an additional capital cash infusion to Voyager amounting to Php250 million and converted Php400 million Smart advances to Voyager into additional paid-in capital; (b) On March 4, 2015, Smart sold all of its shares in eInnovations to Voyager for SGD7.6 million, or Php243 million; (c) On March 17, 2015, Smart granted an interest-bearing loan to eInnovations amounting to US$13.5 million, or Php600 million; and (d) On March 26, 2015, Smart sold all of its shares in PayMaya to ePay for Php603 million. On August 3, 2015, the Board of Directors of Smart approved the additional equity infusion by Smart to Voyager of Php1,716 million via subscription to additional shares. Of this amount, Smart has invested additional capital of Php1,332 million as at December 31, 2015. The additional equity infusion is intended for Voyager’s various investments, as well as capital expenditures and working capital requirements. The total investment of Smart in Voyager amounted to Php2,372 million as at June 30, 2016. The transactions above have no impact on our consolidated financial statements.
F-15
Incorporation of Talas
On June 9, 2015, the PLDT Board of Directors approved the incorporation of Talas, a wholly-owned subsidiary of PLDT. Total subscription in Talas amounted to Php250 million, of which Php62.5 million was paid on May 28, 2015, for purposes of incorporation, and the balance of Php187.5 million was paid on May 13, 2016. Talas is tasked with unifying the digital data assets of the PLDT Group which involves the implementation of the Intelligent Data Fabric, exploration of revenue opportunities and the delivery of the big data capability platform. Incorporation of PLDT Capital Pte. Ltd., or PLDT Capital PLDT Capital was incorporated as a wholly-owned subsidiary of PLDT Online Investments Pte. Ltd., or PLDT Online, on August 12, 2015. As an investment arm, PLDT Capital is envisioned to be an important pillar in supporting the PLDT Group’s digital pivot through collaboration with world-class pioneering companies in Silicon Valley, USA and around the world. In 2015, PLDT Capital made the following investments:
Investment in Phunware, Inc., or Phunware; Investment in AppCard, Inc., or AppCard; and Investment in Matrixx Software, Inc., or Matrixx
See Note 10 – Investments in Associates and Joint Ventures and Note 11 – Available-for-Sale Financial Investments. Joint Venture Agreement between PLDT Capital and Gohopscotch, Inc., or Hopscotch On April 15, 2016, PLDT Capital and Hopscotch, a Delaware corporation, entered into a joint venture agreement, or JVA, to market and exclusively distribute Hopscotch’s mobile solutions in Southeast Asia. The Hopscotch mobile-platform technology allows for the rapid development of custom mobile applications for sports teams, live events, and brands to not only create a memorable and monetizable fan experience but also increase mobile advertising revenue. As a vehicle to execute the JVA, PLDT Capital incorporated Gohopscotch Southeast Asia Pte. Ltd., a Singapore Company, on March 1, 2016. New and Amended Standards and Interpretations The Group applied for the first time certain amendments, which are effective for annual periods beginning on or after January 1, 2016. The adoption of these amendments to the standards as at January 1, 2016 did not have any significant impact on our consolidated financial statements. PFRS 10, Consolidated Financial Statements, and Philippine Accounting Standards, or PAS, 28,
Investments in Associates and Joint Ventures - Investment Entities: Applying the Consolidation Exception (Amendments)
PAS 27, Separate Financial Statements - Equity Method in Separate Financial Statements (Amendments)
PFRS 11, Joint Arrangements - Accounting for Acquisitions of Interests (Amendments) PAS 1, Presentation of Financial Statements - Disclosure Initiative (Amendments) PFRS 14, Regulatory Deferral Accounts PAS 16, Property, Plant and Equipment, and PAS 41, Agriculture - Bearer Plants PAS 16, Property, Plant and Equipment, and PAS 38, Intangible Assets - Clarification of Acceptable
Methods of Depreciation and Amortization (Amendments)
F-16
Annual Improvements to PFRS (2012-2014 Cycle) PFRS 5, Noncurrent Assets Held-for-Sale and Discontinued Operations - Changes in Methods of
Disposal PFRS 7, Financial Instruments: Disclosures - Servicing Contracts PFRS 7, Applicability of the Amendments to PFRS 7 to Condensed Interim Financial Statements PAS 19, Employee Benefits - Regional Market Issue regarding Discount Rate PAS 34, Interim Financial Reporting – Disclosure of Information ‘Elsewhere in the Interim
Financial Report’ Summary of Significant Accounting Policies The following is the summary of significant accounting policies we applied in preparing our consolidated financial statements: Business Combinations and Goodwill Business combinations are accounted for using the acquisition method. The cost of an acquisition is measured as the aggregate of the consideration transferred, measured at acquisition date fair value, and the amount of any noncontrolling interest in the acquiree. For each business combination, we elect whether to measure the components of the noncontrolling interest in the acquiree either at fair value or at the proportionate share of the acquiree’s identifiable net assets. Acquisition-related costs are expensed as incurred. When we acquire a business, we assess the financial assets and liabilities assumed for appropriate classification and designation in accordance with the contractual terms, economic circumstances and pertinent conditions as at the acquisition date. This includes the separation of embedded derivatives in host contracts by the acquiree. If the business combination is achieved in stages, the previously held equity interest is remeasured at its acquisition date fair value and any resulting gain or loss is recognized in profit or loss. The fair value of previously held equity interest is then included in the amount of total consideration transferred. Any contingent consideration to be transferred by the acquirer will be recognized at fair value at the acquisition date. Contingent consideration classified as an asset or liability is measured at fair value with changes in fair value recognized in profit or loss. Contingent consideration that is classified as equity is not remeasured and subsequent settlement is accounted for within equity. Goodwill is initially measured at cost, being the excess of the aggregate of the consideration transferred and the amount recognized for noncontrolling interests and any previous interest held, over the net identifiable assets acquired and liabilities assumed. If the fair value of the net assets acquired is in excess of the aggregate consideration transferred, we reassess whether we correctly identified all of the assets acquired and all of the liabilities assumed and review the procedures used to measure the amounts to be recognized at the acquisition date. If the reassessment still results in an excess of the fair value of net assets acquired over the aggregate consideration transferred, then the gain on a bargain purchase is recognized in profit or loss. If the initial accounting for a business combination is incomplete by the end of the reporting period in which the combination occurs, we report in our consolidated financial statements provisional amounts for the items for which the accounting is incomplete. During the measurement period, which is no longer than one year from the acquisition date, the provisional amounts recognized at acquisition date are retrospectively adjusted to reflect new information obtained about facts and circumstances that existed as of the acquisition date and, if known, would have affected the measurement of the amounts recognized as of that date. During the measurement period, we also recognize additional assets or liabilities if new information is obtained about facts and circumstances that existed as of the acquisition date and, if known, would have resulted in the recognition of those assets and liabilities as of that date.
F-17
After initial recognition, goodwill is measured at cost less any accumulated impairment losses. For the purpose of impairment testing, goodwill acquired in a business combination is, from the acquisition date, allocated to each of our cash-generating units, or CGUs, that are expected to benefit from the combination, irrespective of whether other assets or liabilities of the acquiree are assigned to those units. Where goodwill acquired in a business combination has yet to be allocated to identifiable CGUs because the initial accounting is incomplete, such provisional goodwill is not tested for impairment unless indicators of impairment exist and we can reliably allocate the carrying amount of goodwill to a CGU or group of CGUs that are expected to benefit from the synergies of the business combination. Where goodwill has been allocated to a CGU and part of the operation within that unit is disposed of, the goodwill associated with the operation disposed of is included in the carrying amount of the operation when determining the gain or loss on disposal of the operation. Goodwill disposed of in this circumstance is measured based on the relative values of the disposed operation and the portion of the CGU retained. Investments in Associates An associate is an entity in which we have significant influence. Significant influence is the power to participate in the financial and operating policy decisions of the investee, but has no control nor joint control over those policies. The existence of significant influence is presumed to exist when we hold 20% or more, but less than 50% of the voting power of another entity. Significant influence is also exemplified when we have one or more of the following: (a) a representation on the board of directors or the equivalent governing body of the investee; (b) participation in policy-making processes, including participation in decisions about dividends or other distributions; (c) material transactions with the investee; (d) interchange of managerial personnel with the investee; or (e) provision of essential technical information. Investments in associates are accounted for using the equity method of accounting and are initially recognized at cost. The cost of the investments includes transaction costs. The details of our investments in associates are disclosed in Note 10 – Investments in Associates and Joint Ventures – Investments in Associates. Under the equity method, an investment in an associate is carried at cost plus post acquisition changes in our share of net assets of the associate. Goodwill relating to an associate is included in the carrying amount of the investment and is not amortized nor individually tested for impairment. Our consolidated income statement reflects our share in the financial performance of our associates. Where there has been a change recognized directly in the equity of the associate, we recognize our share in such change and disclose this, when applicable, in our consolidated statement of comprehensive income and consolidated statement of changes in equity. Unrealized gains and losses resulting from our transactions with and among our associates are eliminated to the extent of our interests in those associates. Our share in the profits or losses of our associates is shown on the face of our consolidated income statement. This is the profit or loss attributable to equity holders of the associate and therefore is profit or loss after tax and net of noncontrolling interest in the subsidiaries of the associate. When our share of losses exceeds our interest in an associate, the carrying amount of the investment, including any long-term interests that form part thereof, is reduced to zero, and the recognition of further losses is discontinued except to the extent that we have an obligation or have made payments on behalf of the investee. Our reporting dates and that of our associates are identical and our associates’ accounting policies conform to those used by us for like transactions and events in similar circumstances. When necessary, adjustments are made to bring such accounting policies in line with our policies.
F-18
After application of the equity method, we determine whether it is necessary to recognize an additional impairment loss on our investments in associates. We determine at the end of each reporting period whether there is any objective evidence that our investment in associate is impaired. If this is the case, we calculate the amount of impairment as the difference between the recoverable amount of our investment in the associate and its carrying value and recognize the amount in our consolidated income statement. Upon loss of significant influence over the associate, we measure and recognize any retained investment at its fair value. Any difference between the carrying amounts of our investment in the associate upon loss of significant influence and the fair value of the remaining investment and proceeds from disposal is recognized in profit or loss. Joint Arrangements Joint arrangements are arrangements with respect to which we have joint control, established by contracts requiring unanimous consent from the parties sharing control for decisions about the activities that significantly affect the arrangements’ returns. They are classified and accounted for as follows: Joint operation – when we have rights to the assets, and obligations for the liabilities, relating to an
arrangement, we account for each of our assets, liabilities and transactions, including our share of those held or incurred jointly, in relation to the joint operation.
Joint venture – when we have rights only to the net assets of the arrangements, we account for our
interest using the equity method, the same as our accounting for investments in associates. The financial statements of the joint venture are prepared for the same reporting period as our consolidated financial statements. Where necessary, adjustments are made to bring the accounting policies of the joint venture in line with our policies. The details of our investments in joint ventures are disclosed in Note 10 – Investments in Associates and Joint Ventures – Investments in Joint Ventures. Adjustments are made in our consolidated financial statements to eliminate our share of unrealized gains and losses on transactions between us and our joint venture. Our investment in joint venture is carried at equity method until the date on which we cease to have joint control over the joint venture. Upon loss of joint control over the joint venture, we measure and recognize our retained investment at fair value. Any difference between the carrying amount of the former joint venture upon loss of joint control and the fair value of the remaining investment and proceeds from disposal is recognized in profit or loss. When the remaining investment constitutes significant influence, it is accounted for as an investment in an associate. Current Versus Noncurrent Classifications We present assets and liabilities in the statement of financial position based on current or noncurrent classification. An asset is current when it is: Expected to be realized or intended to be sold or consumed in the normal operating cycle; Held primarily for the purpose of trading; Expected to be realized within twelve months after the reporting period; or Cash or cash equivalent unless restricted from being exchanged or used to settle a liability for at least
twelve months after the reporting period. All other assets are classified as noncurrent.
F-19
A liability is current when: It is expected to be settled in the normal operating cycle; It is held primarily for the purpose of trading; It is due to be settled within twelve months after the reporting period; or There is no unconditional right to defer the settlement of the liability for at least twelve months after
the period. We classify all other liabilities as noncurrent. Deferred income tax assets and liabilities are classified as noncurrent assets and liabilities, respectively. Foreign Currency Transactions and Translations Our consolidated financial statements are presented in Philippine peso, which is also the Parent Company’s functional currency. The Philippine peso is the currency of the primary economic environment in which we operate. This is also the currency that mainly influences the revenue from and cost of rendering products and services. Each entity in our Group determines its own functional currency and items included in the financial statements of each entity are measured using that functional currency. The functional and presentation currency of the entities under PLDT Group (except for SMHC, FECL Group, PLDT Global and certain of its subsidiaries, DCPL, PGNL and certain of its subsidiaries, Chikka and certain of its subsidiaries, PGIC, eInnovations, Takatack Holdings, Takatack Technologies, iCommerce, Fintech Ventures, ePay, 3rd Brand, Chikka Pte. Ltd., or CPL, ABM Global Solutions Pte. Ltd., or AGSPL, Chikka Communications Consulting (Beijing) Co. Ltd., or CCCBL, ABMGS Sdn. Bhd., or AGS Malaysia, and PT Advance Business Microsystems Global Solutions, or AGS Indonesia) is the Philippine peso. Transactions in foreign currencies are initially recorded by entities under our Group at the respective functional currency rates prevailing at the date of the transaction. Monetary assets and liabilities denominated in foreign currencies are retranslated at the functional currency closing rate of exchange prevailing at the end of the reporting period. All differences arising on settlement or translation of monetary items are recognized in our consolidated income statement except for foreign exchange differences that qualify as capitalizable borrowing costs for qualifying assets. Non-monetary items that are measured in terms of historical cost in a foreign currency are translated using the exchange rates as at the dates of the initial transactions. Non-monetary items measured at fair value in a foreign currency are translated using the exchange rates at the date when the fair value was determined. The gain or loss arising on transaction of non-monetary items measured at fair value is treated in line with the recognition of this gain or loss on the change in fair value of the item (i.e., translation differences on items whose fair value gain or loss is recognized in other comprehensive income or profit or loss are also recognized in other comprehensive income or profit or loss, respectively). The functional currency of SMHC, FECL Group, PLDT Global and certain of its subsidiaries, DCPL, PGNL and certain of its subsidiaries, Chikka and certain of its subsidiaries and PGIC is the U.S. dollar; the functional currency of eInnovations, Takatack Holdings, Takatack Technologies, iCommerce, Fintech Ventures, ePay, 3rd Brand, CPL and AGSPL, is the Singapore dollar; the functional currency of CCCBL is the Chinese renminbi; the functional currency of AGS Malaysia is the Malaysian ringgit; and the functional currency of AGS Indonesia is the Indonesian rupiah. As at the reporting date, the assets and liabilities of these subsidiaries are translated into Philippine peso at the rate of exchange prevailing at the end of the reporting period, and income and expenses of these subsidiaries are translated monthly using the weighted average exchange rate for the month. The exchange differences arising on translation are recognized as a separate component of other comprehensive income as cumulative translation adjustments. On disposal of these subsidiaries, the amount of deferred cumulative translation adjustments recognized in other comprehensive income relating to subsidiaries is recognized in our consolidated income statement.
F-20
When there is a change in an entity’s functional currency, the entity applies the translation procedures applicable to the new functional currency prospectively from the date of the change. The entity translates all assets and liabilities into the new functional currency using the exchange rate at the date of the change. The resulting translated amounts for non-monetary items are treated as the new historical cost. Exchange differences arising from the translation of a foreign operation previously recognized in other comprehensive income are not reclassified from equity to profit or loss until the disposal of the operation. Foreign exchange gains or losses of the Parent Company and our Philippine-based subsidiaries are treated as taxable income or deductible expenses in the period such exchange gains or losses are realized. Any goodwill arising on the acquisition of a foreign operation and any fair value adjustments to the carrying amounts of assets and liabilities arising on the acquisition are treated as assets and liabilities of the foreign operation and translated at the closing rate. Financial Instruments – Initial recognition and subsequent measurement
Financial Assets
Initial recognition and measurement
Financial assets within the scope of PAS 39 are classified as financial assets at fair value through profit or loss, or FVPL, loans and receivables, held-to-maturity, or HTM, investments, available-for-sale financial investments, or as derivatives designated as hedging instruments in an effective hedge, as appropriate. We determine the classification of financial assets at initial recognition and, where allowed and appropriate, re-evaluate the designation of such assets at each financial year-end. Financial assets are recognized initially at fair value plus transaction costs that are attributable to the acquisition of the financial asset, except in the case of financial assets recorded at FVPL. Purchases or sales of financial assets that require delivery of assets within a time frame established by regulation or convention in the market place (regular way purchases or sales) are recognized on the trade date, i.e., the date that we commit to purchase or sell the asset.
Subsequent measurement
The subsequent measurement of financial assets depends on the classification as described below:
Financial assets at FVPL Financial assets at FVPL include financial assets held-for-trading and financial assets designated upon initial recognition at FVPL. Financial assets are classified as held-for-trading if they are acquired for the purpose of selling or repurchasing in the near term. Derivative assets, including separated embedded derivatives, are also classified as held-for-trading unless they are designated as effective hedging instruments as defined by PAS 39. Financial assets at FVPL are carried in our consolidated statement of financial position at fair value with net changes in fair value recognized in our consolidated income statement under “Gains (losses) on derivative financial instruments – net” for derivative instruments (negative net changes in fair value) and “Other income – net” for non-derivative financial assets (positive net changes in fair value). Interest earned and dividends received from financial assets at FVPL are recognized in our consolidated income statement under “Interest income” and “Other income – net”, respectively. Financial assets may be designated at initial recognition as at FVPL if any of the following criteria are met: (i) the designation eliminates or significantly reduces the inconsistent treatment that would otherwise arise from measuring the assets or recognizing gains or losses on them on different bases; (ii) the assets are part of a group of financial assets which are managed and their performance are evaluated on a fair value basis, in accordance with a documented risk management strategy and information about the company is provided internally on that basis to the entity’s key management personnel; or (iii) the financial assets contain an embedded derivative, unless the embedded derivative does not significantly modify the cash flows or it is clear, with little or no analysis, that it would not be separately recorded.
F-21
An embedded derivative is separated from the host contract and accounted for as a derivative if all of the following conditions are met: (a) the economic characteristics and risks of the embedded derivatives are not closely related to the economic characteristics and risks of the host contract; (b) a separate instrument with the same terms as the embedded derivative would meet the definition of a derivative; and (c) the hybrid or combined instrument is not recognized at FVPL. These embedded derivatives are measured at fair value with gains or losses arising from changes in fair value recognized in our consolidated income statement. Reassessment only occurs if there is a change in the terms of the contract that significantly modifies the cash flows that would otherwise be required. Our financial assets at FVPL include certain short-term investments as at June 30, 2016 and December 31, 2015. See Note 28 – Financial Assets and Liabilities.
Loans and receivables
Loans and receivables are non-derivative financial assets with fixed or determinable payments which are not quoted in an active market. After initial measurement, such financial assets are carried at amortized cost using the effective interest rate, or EIR, method less impairment. This method uses an EIR that exactly discounts the estimated future cash payments or receipts over the expected life of the financial instrument or a shorter period, where appropriate, to the net carrying amount of the financial asset. Gains and losses are recognized in our consolidated income statement when the loans and receivables are derecognized or impaired, as well as through the amortization process. Interest earned is recorded in “Interest income” in our consolidated income statement. Assets in this category are included in the current assets except for those with maturities greater than 12 months after the end of the reporting period, which are classified as noncurrent assets. Our loans and receivables include portions of investment in debt securities and other long-term investments, cash and cash equivalents, certain short-term investments, trade and other receivables and portions of advances and other noncurrent assets as at June 30, 2016 and December 31, 2015. See Note 12 – Investment in Debt Securities and Other Long-term Investments, Note 16 – Cash and Cash Equivalents, Note 17 – Trade and Other Receivables and Note 28 – Financial Assets and Liabilities.
HTM investments Non-derivative financial assets with fixed or determinable payments and fixed maturities are classified as HTM when we have the positive intention and ability to hold it to maturity. After initial measurement, HTM investments are measured at amortized cost using the EIR method. Gains or losses are recognized in our consolidated income statement when the investments are derecognized or impaired, as well as through the amortization process. Interest earned is recorded in “Interest income” in our consolidated income statement. Assets in this category are included in current assets except for those with maturities greater than 12 months after the end of the reporting period, which are classified as noncurrent assets. Our HTM investments include portions of investment in debt securities and other long-term investments as at June 30, 2016 and December 31, 2015. See Note 12 – Investment in Debt Securities and Other Long-term Investments and Note 28 – Financial Assets and Liabilities.
Available-for-sale financial investments Available-for-sale financial investments include equity investments and debt securities. Equity investments classified as available-for-sale are those that are neither classified as held-for-trading nor designated at FVPL. Debt securities in this category are those that are intended to be held for an indefinite period of time and that may be sold in response to liquidity requirements or in response to changes in the market conditions.
F-22
After initial measurement, available-for-sale financial investments are subsequently measured at fair value with unrealized gains or losses recognized in other comprehensive income in the “Net gains on available-for-sale financial investments – net of tax” account until the investment is derecognized, at which time the cumulative gain or loss recorded in other comprehensive income is recognized in our consolidated income statement; or the investment is determined to be impaired, at which time the cumulative loss recorded in other comprehensive income is recognized in our consolidated income statement. Available-for-sale investments in equity instruments that do not have a quoted price in an active market and whose fair value cannot be reliably measured shall be measured at cost. Interest earned on holding available-for-sale financial investments are included under “Interest income” using the EIR method in our consolidated income statement. Dividends earned on holding available-for-sale equity investments are recognized in our consolidated income statement under “Other income – net” when the right to receive payment has been established. These financial assets are included under noncurrent assets unless we intend to dispose of the investment within 12 months from the end of the reporting period. We evaluate whether the ability and intention to sell our available-for-sale financial investments in the near term is still appropriate. When, in rare circumstances, we are unable to trade these financial investments due to inactive markets and management’s intention to do so significantly changes in the foreseeable future, we may elect to reclassify these financial investments. Reclassification to loans and receivables is permitted when the financial investments meet the definition of loans and receivables and we have the intent and ability to hold these assets for the foreseeable future or until maturity. Reclassification to the held-to-maturity category is permitted only when the entity has the ability and intention to hold the financial investment to maturity accordingly. For a financial investment reclassified from the available-for-sale category, the fair value carrying amount at the date of reclassification becomes its new amortized cost and any previous gain or loss on the asset that has been recognized in other comprehensive income is amortized to profit or loss over the remaining life of the investment using the EIR method. Any difference between the new amortized cost and the maturity amount is also amortized over the remaining life of the asset using the EIR method. If the asset is subsequently determined to be impaired, then the amount recorded in other comprehensive income is reclassified to the consolidated income statement. Our available-for-sale financial investments include listed and unlisted equity securities as at June 30, 2016 and December 31, 2015. See Note 28 – Financial Assets and Liabilities.
Financial Liabilities
Initial recognition and measurement Financial liabilities within the scope of PAS 39 are classified as financial liabilities at FVPL, other financial liabilities or as derivatives designated as hedging instruments in an effective hedge, as appropriate. We determine the classification of our financial liabilities at initial recognition. Financial liabilities are recognized initially at fair value and, in the case of loans and borrowings, net of directly attributable transaction costs.
F-23
Subsequent measurement
The subsequent measurement of financial liabilities depends on their classification as described below:
Financial liabilities at FVPL Financial liabilities at FVPL include financial liabilities held-for-trading and financial liabilities designated upon initial recognition as at FVPL. Financial liabilities are classified as held-for-trading if they are acquired for the purpose of selling in the near term. Derivative liabilities, including separated embedded derivatives are also classified as at FVPL unless they are designated as effective hedging instruments as defined by PAS 39. Financial liabilities at FVPL are carried in our consolidated statement of financial position at fair value with gains or losses on liabilities held-for-trading recognized in our consolidated income statement under “Gains (losses) on derivative financial instruments – net” for derivative instruments and “Other income – net” for non-derivative financial liabilities. Financial liabilities may be designated at initial recognition as at FVPL if any of the following criteria are met: (i) the designation eliminates or significantly reduces the inconsistent treatment that would otherwise arise from measuring the liabilities or recognizing gains or losses on them on different bases; (ii) the liabilities are part of a group of financial liabilities which are managed and their performance are evaluated on a fair value basis, in accordance with a documented risk management strategy and information about the company is provided internally on that basis to the entity’s key management personnel; or (iii) the financial liabilities contain an embedded derivative, unless the embedded derivative does not significantly modify the cash flows or it is clear, with little or no analysis, that it would not be separately recorded. Our financial liabilities at FVPL include long-term principal only-currency swaps and interest rate swaps as at June 30, 2016 and December 31, 2015. See Note 28 – Financial Assets and Liabilities.
Other financial liabilities After initial recognition, other financial liabilities are subsequently measured at amortized cost using the EIR method. Gains and losses are recognized in our consolidated income statement when the liabilities are derecognized as well as through the EIR amortization process. Amortized cost is calculated by taking into account any discount or premium on acquisition and fees or costs that are an integral part of the EIR. The EIR amortization is included under “Financing costs – net” in our consolidated income statement. Our other financial liabilities include accounts payable, accrued expenses and other current liabilities (except for statutory payables), interest-bearing financial liabilities, customers’ deposits, dividends payable, and accrual for long-term capital expenditures included under “Deferred credits and other noncurrent liabilities” account as at June 30, 2016 and December 31, 2015. See Note 21 – Interest-bearing Financial Liabilities, Note 22 – Deferred Credits and Other Noncurrent Liabilities, Note 23 – Accounts Payable, and Note 24 – Accrued Expenses and Other Current Liabilities.
Offsetting of financial instruments Financial assets and financial liabilities are offset and the net amount is reported in our consolidated statement of financial position if, and only if, there is a currently enforceable legal right to offset the recognized amounts and there is an intention to settle on a net basis, or to realize the assets and settle the liabilities simultaneously.
Amortized cost of financial instruments Amortized cost is computed using the EIR method less any allowance for impairment and principal repayment or reduction. The calculation takes into account any premium or discount on acquisition and includes transaction costs and fees that are an integral part of the EIR.
F-24
“Day 1” difference
Where the transaction price in a non-active market is different from the fair value of other observable current market transactions in the same instrument or based on a valuation technique which variables include only data from observable market, we recognize the difference between the transaction price and fair value (a “Day 1” difference) in our consolidated income statement unless it qualifies for recognition as some other type of asset or liability. In cases where data used are not observable, the difference between the transaction price and model value is only recognized in our consolidated income statement when the inputs become observable or when the instrument is derecognized. For each transaction, we determine the appropriate method of recognizing the “Day 1” difference amount.
Impairment of Financial Assets
We assess at the end of each reporting period whether there is any objective evidence that a financial asset or a group of financial assets is impaired. A financial asset or a group of financial assets is deemed to be impaired if, and only if, there is objective evidence of impairment as a result of one or more events that have occurred after the initial recognition of the asset (an incurred “loss event”) and that loss event has an impact on the estimated future cash flows of the financial asset or the group of financial assets that can be reliably estimated. Evidence of impairment may include indications that the debtor or a group of debtors is experiencing significant financial difficulty, default or delinquency in interest or principal payments, the probability that the debtor will enter bankruptcy or other financial reorganization and where observable data indicate that there is a measurable decrease in the estimated future cash flows, such as changes in arrears or economic conditions that correlate with defaults.
Impairment of Trade and Other Receivables
Individual impairment
Retail subscribers
We recognize impairment losses for the whole amount of receivables from permanently disconnected wireless and fixed line subscribers. Permanent disconnections are made after a series of collection steps following nonpayment by postpaid subscribers. Such permanent disconnection usually occurs within a predetermined period from the last statement date. We also recognize impairment losses for accounts with extended credit arrangements or promissory notes. Regardless of the age of the account, additional impairment losses are also made for accounts specifically identified to be doubtful of collection when there is information on financial incapacity after considering the other contractual obligations between us and the subscriber.
Corporate subscribers Receivables from corporate subscribers are provided with impairment losses when they are specifically identified as impaired. Full allowance is generally provided for the whole amount of receivables from corporate accounts based on aging of individual account balances. In making this assessment, we take into account normal payment cycle, counterparty’s payment history and industry-observed settlement periods.
Foreign administrations and domestic carriers For receivables from foreign administration and domestic carriers, impairment losses are recognized when they are specifically identified as impaired regardless of the age of balances. Full allowance is generally provided after quarterly review of the status of settlement with the carriers. In making this assessment, we take into account normal payment cycle, counterparty carrier’s payment history and industry-observed settlement periods.
F-25
Dealers, agents and others Similar to carrier accounts, we recognize impairment losses for the full amount of receivables from dealers, agents and other parties based on our specific assessment of individual balances based on age and payment habits, as applicable.
Collective impairment
Postpaid wireless and fixed line subscribers We estimate impairment losses for temporarily disconnected accounts for both wireless and fixed line subscribers based on the historical trend of temporarily disconnected accounts which eventually become permanently disconnected. Temporary disconnection is initiated after a series of collection activities is implemented, including the sending of a collection letter, call-out reminders and collection messages via text messaging. Temporary disconnection generally happens 90 days after the due date of the unpaid balance. If the account is not settled within 60 days from temporary disconnection, the account is permanently disconnected. We recognize impairment losses on our postpaid wireless and fixed line subscribers through net flow-rate methodology which is derived from account-level monitoring of subscriber accounts between different age brackets, from current to 120 days past due. The criterion adopted for making the allowance for doubtful accounts takes into consideration the calculation of the actual percentage of losses incurred on each range of accounts receivable.
Other subscribers Receivables that have been assessed individually and found not to be impaired are then assessed collectively based on similar credit risk characteristics to determine whether provision should be made due to incurred loss events for which there is objective evidence but whose effects are not yet evident in the individual impairment assessment. Retail subscribers are provided with collective impairment based on a certain percentage derived from historical data/statistics. See Note 3 – Management’s Use of Accounting Judgments, Estimates and Assumptions – Estimating Allowance for Doubtful Accounts – Impairment of non-financial assets, Note 17 – Trade and Other Receivables and Note 28 – Financial Assets and Liabilities – Impairment Assessments for further disclosures relating to impairment of financial assets.
Financial assets carried at amortized cost For financial assets carried at amortized cost, we first assess whether objective evidence of impairment exists individually for financial assets that are individually significant, or collectively for financial assets that are not individually significant. If we determine that no objective evidence of impairment exists for an individually assessed financial asset, whether significant or not, we include the asset in a group of financial assets with similar credit risk characteristics and collectively assess them for impairment. Assets that are individually assessed for impairment and for which an impairment loss is, or continues to be, recognized are not included in a collective assessment of impairment. If there is objective evidence that an impairment loss has been incurred, the amount of the loss is measured as the difference between the asset’s carrying amount and the present value of estimated future cash flows (excluding future expected credit losses that have not yet been incurred). The present value of the estimated future cash flows is discounted at the financial asset’s original EIR. If a financial asset has a variable interest rate, the discount rate for measuring any impairment loss is the current EIR.
F-26
The carrying amount of the asset is reduced through the use of an allowance account and the amount of the loss is recognized under “Asset impairment” in our consolidated income statement. Interest income continues to be accrued on the reduced carrying amount based on the original EIR of the asset. The financial asset together with the associated allowance are written-off when there is no realistic prospect of future recovery and all collateral has been realized or has been transferred to us. If, in a subsequent year, the amount of the estimated impairment loss increases or decreases because of an event occurring after the impairment was recognized, the previously recognized impairment loss is increased or reduced by adjusting the allowance account. Any subsequent reversal of an impairment loss is recognized in our consolidated income statement, to the extent that the carrying value of the asset does not exceed its original amortized cost at the reversal date. If a write-off is later recovered, the recovery is recognized in profit or loss.
Available-for-sale financial investments
For available-for-sale financial investments, we assess at each reporting date whether there is objective evidence that an investment or a group of investments is impaired. In the case of equity investments classified as available-for-sale financial investments, objective evidence would include a significant or prolonged decline in the fair value of the investment below its cost. The determination of what is “significant” or “prolonged” requires judgment. We treat “significant” generally as decline of 20% or more below the original cost of investment, and “prolonged” as greater than 12 months assessed against the period in which the fair value has been below its original cost. When a decline in the fair value of an available-for-sale financial investment has been recognized in other comprehensive income and there is objective evidence that the asset is impaired, the cumulative loss that had been recognized in other comprehensive income is reclassified to profit or loss as a reclassification adjustment even though the financial asset has not been derecognized. The amount of the cumulative loss that is reclassified from other comprehensive income to profit or loss is the difference between the acquisition cost (net of any principal repayment and amortization) and the current fair value, less any impairment loss on that financial asset previously recognized in profit or loss. If available-for-sale equity security is impaired, any further decline in the fair value at subsequent reporting date is recognized as impairment. Therefore, at each reporting period, for an equity security that was determined to be impaired, additional impairments are recognized for the difference between fair value and the original cost, less any previously recognized impairment. Impairment losses on equity investments are not reversed in profit or loss. Subsequent increases in the fair value after impairment are recognized in other comprehensive income. In the case of debt instruments classified as available-for-sale financial investments, impairment is assessed based on the same criteria as financial assets carried at amortized cost. However, the amount recorded for impairment is the cumulative loss measured as the difference between the amortized cost and the current fair value, less any impairment loss on that investment previously recognized in our consolidated income statement. Future interest income continues to be accrued based on the reduced carrying amount of the asset, using the rate of interest used to discount future cash flows for the purpose of measuring impairment loss. Such accrual is recorded as part of “Interest income” in our consolidated income statement. If, in a subsequent year, the fair value of a debt instrument increases and the increase can be objectively related to an event occurring after the impairment loss was recognized in our consolidated income statement, the impairment loss is reversed in profit or loss. Derecognition of Financial Assets and Liabilities
Financial assets
A financial asset (or where applicable as part of a financial asset or part of a group of similar financial assets) is primarily derecognized when: (1) the right to receive cash flows from the asset has expired; or (2) we have transferred the right to receive cash flows from the asset or have assumed an obligation to pay the received cash flows in full without material delay to a third party under a “pass-through” arrangement; and either: (a) we have transferred substantially all the risks and rewards of the asset; or (b) we have neither transferred nor retained substantially all the risks and rewards of the asset, but have transferred control of the asset.
F-27
When we have transferred the right to receive cash flows from an asset or have entered into a “pass-through” arrangement, and have neither transferred nor retained substantially all the risks and rewards of the asset nor transferred control of the asset, a new asset is recognized to the extent of our continuing involvement in the asset. Continuing involvement that takes the form of a guarantee over the transferred asset is measured at the lower of the original carrying amount of the asset and the maximum amount of consideration that we could be required to repay. When continuing involvement takes the form of a written and/or purchased option (including a cash-settled option or similar provision) on the transferred asset, the extent of our continuing involvement is the amount of the transferred asset that we may repurchase, except that in the case of a written put option (including a cash-settled option or similar provision) on an asset measured at fair value, the extent of our continuing involvement is limited to the lower of the fair value of the transferred asset and the option exercise price.
Financial liabilities A financial liability is derecognized when the obligation under the liability is discharged or cancelled or has expired. When an existing financial liability is replaced by another from the same lender on substantially different terms, or the terms of an existing liability are substantially modified, such an exchange or modification is treated as a derecognition of the original liability and the recognition of a new liability, and the difference in the carrying amount of a financial liability extinguished or transferred to another party and the consideration paid, including any non-cash assets transferred or liabilities assumed, is recognized in profit or loss. The financial liability is also derecognized when equity instruments are issued to extinguish all or part of the financial liability. The equity instruments issued are recognized at fair value if it can be reliably measured, otherwise, it is recognized at the fair value of the financial liability extinguished. Any difference between the fair value of the equity instruments issued and the carrying value of the financial liability extinguished is recognized in profit or loss. Derivative Financial Instruments and Hedge Accounting
Initial recognition and subsequent measurement We use derivative financial instruments, such as long-term currency swaps, foreign currency options, forward currency contracts and interest rate swaps to hedge our risks associated with foreign currency fluctuations and interest rate. Such derivative financial instruments are initially recognized at fair value on the date on which a derivative contract is entered into and are subsequently remeasured at fair value. Derivatives are carried as financial assets when the fair value is positive and as financial liabilities when the fair value is negative. The fair value of forward currency contracts is calculated by reference to current forward exchange rates for contracts with similar maturity profiles. The fair value of long-term currency swaps, foreign currency options, forward currency contracts and interest rate swap contracts is determined using applicable valuation techniques. See Note 28 – Financial Assets and Liabilities. Any gains or losses arising from changes in fair value on derivatives during the period that do not qualify for hedge accounting are taken directly to the “Gains (losses) on derivative financial instruments – net” in our consolidated income statement. For the purpose of hedge accounting, hedges are classified as: (1) fair value hedges when hedging the exposure to changes in the fair value of a recognized financial asset or liability or an unrecognized firm commitment (except for foreign currency risk); or (2) cash flow hedges when hedging exposure to variability in cash flows that is either attributable to a particular risk associated with a recognized financial asset or liability, a highly probable forecast transaction or the foreign currency risk in an unrecognized firm commitment; or (3) hedges of a net investment in a foreign operation.
F-28
At the inception of a hedge relationship, we formally designate and document the hedge relationship to which we wish to apply hedge accounting and the risk management objective and strategy for undertaking the hedge. The documentation includes identification of the hedging instrument, the hedged item or transaction, the nature of the risk being hedged and how we will assess the hedging instrument’s effectiveness in offsetting the exposure to changes in the hedged item’s fair value or cash flows attributable to the hedged risk. Such hedges are expected to be highly effective in achieving offsetting changes in fair value or cash flows and are assessed on an on-going basis to determine that they actually have been highly effective throughout the financial reporting periods for which they are designated. In a situation when that hedged item is a forecast transaction, we assess whether the transaction is highly probable and presents an exposure to variations in cash flows that could ultimately affect our consolidated income statement. Hedges which meet the strict criteria for hedge accounting are accounted for as follows:
Fair value hedges The change in the fair value of a hedging derivative is recognized in our consolidated income statement. The change in the fair value of the hedged item attributable to the risk being hedged is recorded as part of the carrying value of the hedged item and is also recognized in our consolidated income statement. The fair value for financial instruments traded in active markets at the end of the reporting period is based on their quoted market price or dealer price quotations (bid price for long positions and ask price for short positions), without any deduction for transaction costs. When current bid and asking prices are not available, the price of the most recent transaction provides evidence of the current fair value as long as there has not been a significant change in economic circumstances since the time of the transaction. For all other financial instruments not listed in an active market, the fair value is determined by using appropriate valuation techniques. Valuation techniques include net present value techniques, comparison to similar instruments for which market observable prices exist, option pricing models and other relevant valuation models. When an unrecognized firm commitment is designated as a hedged item, the subsequent cumulative change in the fair value of the firm commitment attributable to the hedged risk is recognized as a financial asset or liability with a corresponding gain or loss recognized in our consolidated income statement. The changes in the fair value of the hedging instrument are also recognized in our consolidated income statement.
Cash flow hedges The effective portion of the gain or loss on the hedging instrument is recognized in other comprehensive income, while any ineffective portion is recognized immediately in our consolidated income statement. See Note 28 – Financial Assets and Liabilities for more details. Amounts taken to other comprehensive income are transferred to our consolidated income statement when the hedged transaction affects our consolidated income statement, such as when the hedged financial income or financial expense is recognized or when a forecast sale occurs. Where the hedged item is the cost of a non-financial asset or non-financial liability, the amounts taken to other comprehensive income are transferred to the initial carrying amount of the non-financial asset or liability. If the forecast transaction or firm commitment is no longer expected to occur, amounts previously recognized in other comprehensive income are transferred to our consolidated income statement. If the hedging instrument expires or is sold, terminated or exercised without replacement or rollover, or if its designation as a hedge is revoked, amounts previously recognized in other comprehensive income remain in other comprehensive income until the forecast transaction or firm commitment occurs. We use an interest rate swap agreement to hedge our interest rate exposure on certain outstanding loan balances. See Note 28 – Financial Assets and Liabilities.
F-29
Hedges of a net investment in a foreign operation Hedges of a net investment in a foreign operation, including a hedge of a monetary item that is accounted for as part of the net investment, are accounted for in a way similar to cash flow hedges. Gains or losses on the hedging instrument relating to the effective portion of the hedge are recognized in other comprehensive income while any gains or losses relating to the ineffective portion are recognized in our consolidated income statement. On disposal of the foreign operation, the cumulative value of any such gains or losses recognized in other comprehensive income is transferred to our consolidated income statement. We use a loan as a hedge of its exposure to foreign exchange risk on its investment in foreign subsidiaries. See Note 28 – Financial Assets and Liabilities for more details.
Current versus noncurrent classification Derivative instruments that are not designated as effective hedging instruments are classified as current or noncurrent or separated into a current and noncurrent portion based on an assessment of the facts and circumstances (i.e., the underlying contracted cash flows). Where we expect to hold a derivative as an economic hedge (and does not apply hedge accounting) for a period beyond 12 months after the reporting date, the derivative is classified as noncurrent (or separated into current and noncurrent portions) consistent with the classification of the underlying item. Embedded derivatives that are not closely related to the host contract are classified consistent with the cash flows of the host contract. Derivative instruments that are designated as effective hedging instruments are classified consistently with the classification of the underlying hedged item. The derivative instrument is separated into a current portion and a noncurrent portion only if a reliable allocation can be made. We recognize transfers into and transfers out of fair value hierarchy levels as at the date of the event or change in circumstances that caused the transfer. Property and Equipment Property and equipment, except for land, is stated at cost less accumulated depreciation and amortization and any accumulated impairment losses. The initial cost of property and equipment comprises its purchase price, including import duties and non-refundable purchase taxes and any directly attributable costs of bringing the property and equipment to its working condition and location for its intended use. Such cost includes the cost of replacing component parts of the property and equipment when the cost is incurred, if the recognition criteria are met. When significant parts of property and equipment are required to be replaced at intervals, we recognize such parts as individual assets with specific useful lives and depreciate them accordingly. Likewise, when a major inspection is performed, its cost is recognized in the carrying amount of the property and equipment as a replacement if the recognition criteria are satisfied. All other repairs and maintenance costs are recognized as expense as incurred. The present value of the expected cost for the decommissioning of the asset after use is included in the cost of the asset if the recognition criteria for a provision are met. Land is stated at cost less any impairment in value. Depreciation and amortization commence once the property and equipment are available for their intended use and are calculated on a straight-line basis over the estimated useful lives of the assets. The estimated useful lives used in depreciating our property and equipment are disclosed in Note 9 – Property and Equipment. The residual values, estimated useful lives, and methods of depreciation and amortization are reviewed at least at each financial year-end and adjusted prospectively, if appropriate.

F-30
An item of property and equipment and any significant part initially recognized are derecognized upon disposal or when no future economic benefits are expected from its use or disposal. Any gain or loss arising on derecognition of the asset (calculated as the difference between the net disposal proceeds and the carrying amount of the asset) is included in profit or loss when the asset is derecognized. Property under construction is stated at cost less any impairment in value. This includes cost of construction, plant and equipment, capitalizable borrowing costs and other direct costs associated to construction. Property under construction is not depreciated until such time that the relevant assets are completed and available for its intended use. Construction-in-progress is transferred to the related property and equipment when the construction or installation and related activities necessary to prepare the property and equipment for their intended use have been completed, and the property and equipment are ready for operational use. Borrowing Costs Borrowing costs are capitalized if they are directly attributable to the acquisition, construction or production of a qualifying asset. Qualifying assets are assets that necessarily take a substantial period of time to get ready for their intended use or sale. All other borrowing costs are expensed as incurred. Borrowing costs consist of interest and other costs that an entity incurs in connection with the borrowing of funds. Asset Retirement Obligations We are legally required under various lease agreements to dismantle the installation in leased sites and restore such sites to their original condition at the end of the lease contract term. We recognize the liability measured at the present value of the estimated costs of these obligations and capitalize such costs as part of the balance of the related item of property and equipment. The amount of asset retirement obligations are accreted and such accretion is recognized as interest expense. See Note 9 – Property and Equipment and Note 22 – Deferred Credits and Other Noncurrent Liabilities. Investment Properties Investment properties are initially measured at cost, including transaction costs. Subsequent to initial recognition, investment properties are stated at fair value, which reflects market conditions at the reporting date. Gains or losses arising from changes in the fair values of investment properties are included in our consolidated income statement in the period in which they arise, including the corresponding tax effect. Fair values are determined based on an amount evaluation performed by a Philippine SEC accredited external independent valuer applying a valuation model recommended by the International Valuation Standards Committee. Investment properties are derecognized when they are disposed of or when they are permanently withdrawn from use and no future economic benefit is expected from their disposal. Any gain or loss on the retirement or disposal of an investment property is recognized in our consolidated income statement in the year of retirement or disposal. Transfers are made to or from investment property only when there is a change in use. For a transfer from investment property to owner-occupied property, the deemed cost for subsequent accounting is the fair value at the date of change in use. If owner-occupied property becomes an investment property, we account for such property in accordance with the policy stated under property and equipment up to the date of change in use. The difference between the carrying amount of the owner-occupied property and its fair value at the date of change is accounted for as revaluation increment recognized in other comprehensive income. On subsequent disposal of the investment property, the revaluation increment recognized in other comprehensive income is transferred to retained earnings. No assets held under operating lease have been classified as investment properties.
F-31
Intangible Assets Intangible assets acquired separately are measured at cost on initial recognition. The cost of intangible assets acquired from business combinations is initially recognized at fair value on the date of acquisition. Following initial recognition, intangible assets are carried at cost less any accumulated amortization and accumulated impairment losses. The useful lives of intangible assets are assessed at the individual asset level as either finite or indefinite. Intangible assets with finite lives are amortized over the useful economic life using the straight-line method and assessed for impairment whenever there is an indication that the intangible assets may be impaired. At the minimum, the amortization period and the amortization method for an intangible asset with a finite useful life are reviewed at each financial year-end. Changes in the expected useful life or the expected pattern of consumption of future economic benefits embodied in the asset are accounted for by changing the amortization period or method, as appropriate, and treated as changes in accounting estimates. The amortization expense on intangible assets with finite lives is recognized in our consolidated income statement. Intangible assets with indefinite useful lives are not amortized, but are tested for impairment annually either individually or at the CGU level. The useful life of an intangible asset with an indefinite life is reviewed annually to determine whether the indefinite life assessment continues to be supportable. If not, the change in the useful life assessment from indefinite to finite is made on a prospective basis. The estimated useful lives used in amortizing our intangible assets are disclosed in Note 15 – Goodwill and Intangible Assets. Gains or losses arising from derecognition of an intangible asset are measured as the difference between the net disposal proceeds and the carrying amount of the asset, and are recognized in our consolidated income statement when the asset is derecognized. Internally generated intangibles are not capitalized and the related expenditures are charged against operations in the period in which the expenditures are incurred. Inventories and Supplies Inventories and supplies, which include cellular and landline phone units, materials, spare parts, terminal units and accessories, are valued at the lower of cost and net realizable value. Costs incurred in bringing inventories and supplies to its present location and condition are accounted for using the weighted average cost method. Net realizable value is determined by either estimating the selling price in the ordinary course of business, less the estimated cost to sell or determining the prevailing replacement costs. Impairment of Non-Financial Assets We assess at each reporting period whether there is an indication that an asset may be impaired. If any indication exists, or when the annual impairment testing for an asset is required, we make an estimate of the asset’s recoverable amount. An asset’s recoverable amount is the higher of an asset’s or CGU’s fair value less costs of disposal and its value in use. The recoverable amount is determined for an individual asset, unless the asset does not generate cash inflows that are largely independent from those of other assets or groups of assets. When the carrying amount of an asset or CGU exceeds its recoverable amount, the asset is considered impaired and is written down to its recoverable amount. In assessing the value in use, the estimated future cash flows are discounted to their present value using a pre-tax discount rate that reflects current market assessments of the time value of money and the risks specific to the asset. In determining the fair value less costs of disposal, recent market transactions are taken into account. If no such transactions can be identified, an appropriate valuation model is used. Impairment losses are recognized in our consolidated income statement.
F-32
For assets, excluding goodwill, an assessment is made at each reporting date to determine whether there is an indication that previously recognized impairment losses no longer exist or have decreased. If such indication exists, we make an estimate of the recoverable amount. A previously recognized impairment loss is reversed only if there has been a change in the assumptions used to determine the asset’s recoverable amount since the last impairment loss was recognized. If this is the case, the carrying amount of the asset is increased to its recoverable amount. The increased amount cannot exceed the carrying amount that would have been determined, net of depreciation and amortization, had no impairment loss been recognized for the asset in prior years. Such reversal is recognized in our consolidated income statement. After such reversal, the depreciation and amortization charges are adjusted in future years to allocate the asset’s revised carrying amount, less any residual value, on a systematic basis over its remaining economic useful life. The following assets have specific characteristics for impairment testing:
Property and equipment and intangible assets with definite useful lives
For property and equipment, we also assess for impairment on the basis of impairment indicators such as evidence of internal obsolescence or physical damage. See Note 3 – Management’s Use of Accounting Judgments, Estimates and Assumptions – Impairment of non-financial assets, Note 9 – Property and Equipment and Note 15 – Goodwill and Intangible Assets for further disclosures relating to impairment of non-financial assets.
Investments in associates and joint ventures
We determine at the end of each reporting period whether there is any objective evidence that our investments in associates and joint ventures are impaired. If this is the case, the amount of impairment is calculated as the difference between the recoverable amount of the investments in associates and joint ventures, and its carrying amount. The amount of impairment loss is recognized in our consolidated income statement. See Note 10 – Investments in Associates and Joint Ventures for further disclosures relating to impairment of non-financial assets.
Goodwill
Goodwill is tested for impairment annually as at December 31, and when circumstances indicate that the carrying value may be impaired. Impairment is determined for goodwill by assessing the recoverable amount of each CGU, or group of CGUs, to which the goodwill relates. When the recoverable amount of the CGU, or group of CGUs, is less than the carrying amount of the CGU, or group of CGUs, to which goodwill has been allocated, an impairment loss is recognized. Impairment losses relating to goodwill cannot be reversed in future periods.
Intangible assets with indefinite useful lives
Intangible assets with indefinite useful lives are not amortized but are tested for impairment annually either individually or at the CGU level, as appropriate. We calculate the amount of impairment as being the difference between the recoverable amount of the intangible asset or the CGU, and its carrying amount and recognize the amount of impairment in our consolidated income statement. Impairment losses relating to intangible assets can be reversed in future periods. See Note 3 – Management’s Use of Accounting Judgments, Estimates and Assumptions – Impairment of non-financial assets and Note 15 – Goodwill and Intangible Assets – Impairment Testing of Goodwill and Intangible Assets with Indefinite Life for further disclosures relating to impairment of non-financial assets.
Investment in Debt Securities Investment in debt securities are government securities which are carried at amortized cost using the EIR method. Interest earned from these securities is recognized under “Interest income” in our consolidated income statement.
F-33
Cash and Cash Equivalents Cash includes cash on hand and in banks. Cash equivalents, which include temporary cash investments, are short-term, highly liquid investments that are readily convertible to known amounts of cash with original maturities of three months or less from the date of acquisition, and for which there is an insignificant risk of change in value. Short-term Investments Short-term investments are money market placements, which are highly liquid with maturities of more than three months but less than one year from the date of acquisition.
Fair value measurement We measure financial instruments such as derivatives, available-for-sale financial investments, certain short-term investments and non-financial assets such as investment properties, at fair value at each reporting date. Also, fair values of financial instruments measured at amortized cost are disclosed in Note 28 – Financial Assets and Liabilities. Fair value is the estimated price that would be received to sell an asset or paid to transfer a liability in an orderly transaction between market participants at the measurement date. The fair value measurement is based on the presumption that the transaction to sell the asset or transfer the liability takes place either: (i) in the principal market for the asset or liability, or (ii) in the absence of a principal market, in the most advantageous market for the asset or liability. The principal or the most advantageous market must be accessible by us. The fair value of an asset or a liability is measured using the assumptions that market participants would use when pricing the asset or liability, assuming that market participants act in their economic best interest. A fair value measurement of a non-financial asset takes into account a market participant's ability to generate economic benefits by using the asset in its highest and best use or by selling it to another market participant that would use the asset in its highest and best use. We use valuation techniques that are appropriate in the circumstances and for which sufficient data are available to measure fair value, maximizing the use of relevant observable inputs and minimizing the use of unobservable inputs. All assets and liabilities for which fair value is measured or disclosed in the financial statements are categorized within the fair value hierarchy, described as follows, based on the lowest level input that is significant to the fair value measurement as a whole: (i) Level 1 - Quoted (unadjusted) market prices in active markets for identical assets or liabilities; (ii) Level 2 - Valuation techniques for which the lowest level input that is significant to the fair value measurement is directly or indirectly observable; and (iii) Level 3 - Valuation techniques for which the lowest level input that is significant to the fair value measurement is unobservable. For assets and liabilities that are recognized in the financial statements on a recurring basis, we determine whether transfers have occurred between levels in the hierarchy by re-assessing categorization (based on the lowest level input that is significant to the fair value measurement as a whole) at the end of each reporting period. We determine the policies and procedures for both recurring fair value measurement, such as investment properties and unquoted available-for-sale financial assets, and for non-recurring measurement, such as assets held for distribution in discontinued operation.
F-34
External valuers are involved for valuation of significant assets, such as certain short-term investments and investment properties. Involvement of external valuers is decided upon annually. Selection criteria include market knowledge, reputation, independence and whether professional standards are maintained. At each reporting date, we analyze the movements in the values of assets and liabilities which are required to be re-measured or re-assessed as per our accounting policies. For this analysis, we verify the major inputs applied in the latest valuation by agreeing the information in the valuation computation to contracts and other relevant documents. We, in conjunction with our external valuers, also compare the changes in the fair value of each asset and liability with relevant external sources to determine whether the change is reasonable. This includes a discussion of the major assumptions used in the valuations. For the purpose of fair value disclosures, we have determined classes of assets and liabilities on the basis of the nature, characteristics and risks of the asset or liability and the level of the fair value hierarchy as explained above. Revenue Recognition Revenue is recognized to the extent that it is probable that the economic benefits will flow to us and the revenue can be reliably measured, regardless of when the payment is received. Revenue is measured at the fair value of the consideration received or receivable, taking into account contractually defined terms of payment and excluding value-added tax, or VAT, or overseas communication tax, or OCT, where applicable. When deciding the most appropriate basis for presenting revenue and cost of revenue, we assess our revenue arrangements against specific criteria to determine if we are acting as principal or agent. We consider both the legal form and the substance of our agreement, to determine each party’s respective roles in the agreement. We are acting as a principal when we have the significant risks and rewards associated with the rendering of telecommunication services. When our role in a transaction is that of principal, revenue is presented on a gross basis, otherwise, revenue is presented on a net basis.
Service revenues
Our revenues are principally derived from providing the following telecommunications services: cellular voice and data services in the wireless business; and local exchange, international and national long distance, data and other network, and information and communications services in the fixed line business. When determining the amount of revenue to be recognized in any period, the overriding principle followed is to match the revenue with the cost of the provision of service. Services may be rendered separately or bundled with goods or other services. The specific recognition criteria are as follows:
Subscribers
We provide telephone, cellular and data communication services under prepaid and postpaid payment arrangements as follows: Postpaid service arrangements include fixed monthly charges (including excess of consumable fixed monthly service fees) generated from postpaid cellular voice, short messaging services, or SMS, and data services through the postpaid plans of Smart and Sun Cellular, from cellular and local exchange services primarily through wireless, landline and related services, and from data and other network services primarily through broadband and leased line services, which we recognize on a straight-line basis over the customer’s subscription period. Services provided to postpaid subscribers are billed throughout the month according to the billing cycles of subscribers. Services availed by subscribers in addition to these fixed fee arrangements are charged separately and recognized as the additional service is provided or as availed by the subscribers. Our prepaid services include over-the-air reloading channels and prepaid cards provided by Smart Prepaid, TNT (formerly Talk ‘N Text) and Sun Cellular Prepaid. Proceeds from over-the-air reloading channels and prepaid cards are initially recognized as unearned revenue and realized upon actual usage of the airtime value (i.e., the pre-loaded airtime value of subscriber identification module, or SIM, cards and subsequent top-ups) for voice, SMS, multimedia messaging services, or MMS, content downloading (inclusive of browsing), infotext services and prepaid unlimited and bucket-priced SMS and call subscriptions, net of free SMS allocation and bonus credits (load package purchased, i.e., free additional SMS or minute calls or Peso credits), or upon expiration of the usage period, whichever comes earlier. Interconnection fees and charges arising from the actual usage of airtime value or subscriptions are
F-35
recorded as incurred. Revenue from international and national long distance calls carried via our network is generally based on rates which vary with distance and type of service (direct dial or operator-assisted, paid or collect, etc.). Revenue from both wireless and fixed line long distance calls is recognized as the service is provided.
Non-recurring upfront fees such as activation fees charged to subscribers for connection to our network are deferred and are recognized as revenue throughout the estimated average length of customer relationship. The related incremental costs are similarly deferred and recognized over the same period in our consolidated income statement.
Connecting carriers
Interconnection revenues for call termination, call transit and network usages are recognized in the period in which the traffic occurs. Revenues related to local, long distance, network-to-network, roaming and international call connection services are recognized when the call is placed or connection is provided and the equivalent amounts charged to us by other carriers are recorded under interconnection costs in our consolidated income statement. Inbound revenue and outbound charges are based on agreed transit and termination rates with other foreign and local carriers.
Value-Added Services, or VAS
Revenues from VAS include MMS, downloading and streamlining of contents, applications and other digital services and infotext services. The amount of revenue recognized is net of payout to content provider’s share in revenue. Revenue is recognized upon service availment.
Incentives
We operate customer loyalty programmes in our wireless business which allows customers to accumulate points when they purchase services or prepaid credits from us. The points can then be redeemed for free services and discounts, subject to a minimum number of points being obtained. Consideration received is allocated between the services and prepaid credits sold and the points issued, with the consideration allocated to the points equal to their value. The fair value of the points issued is deferred and recognized as revenue when the points are redeemed.
Product-based incentives provided to retailers and customers as part of a transaction are accounted for as multiple element arrangements and recognized when earned.
Multiple-deliverable arrangements
In revenue arrangements, which involve bundled sales of mobile devices, SIM cards/packs and accessories (non-service deliverable) and telecommunication services (service deliverable), the total arrangement consideration is allocated to each component based on their relative fair value to reflect the substance of the transaction. Revenues from sale of non-service component are recognized when the goods are delivered while revenues from telecommunication services component are recognized when the services are provided to subscribers. When fair value is not directly observable, the total consideration is allocated using an appropriate allocation method.
Other services
Revenue from server hosting, co-location services and customer support services are recognized as the service is performed.
Non-service revenues
Revenues from handset and equipment sales are recognized when the significant risks and rewards of ownership of the goods have passed to the buyer, usually on delivery of the goods. The related cost or net realizable value of handsets or equipment, sold to customers is presented as “Cost of sales” in our consolidated income statement.
F-36
Interest income
Interest income is recognized as it accrues on a time proportion basis taking into account the principal amount outstanding and the EIR.
Dividend income
Revenue is recognized when our right to receive the payment is established.
Expenses
Expenses are recognized as incurred.
Provisions We recognize a provision when we have a present obligation, legal or constructive, as a result of a past event, and when it is probable that an outflow of resources embodying economic benefits will be required to settle the obligation and a reliable estimate can be made of the amount of the obligation. When we expect some or all of a provision to be reimbursed, the reimbursement is recognized as a separate asset, but only when the reimbursement is virtually certain to be received if the entity settles the obligation. The expense relating to any provision is presented in our consolidated income statement, net of any reimbursements. If the effect of the time value of money is material, provisions are discounted using a current pre-tax rate that reflects, where appropriate, the risks specific to the liability. Where discounting is used, the increase in the provision due to the passage of time is recognized as interest expense. Retirement Benefits
Defined benefit pension plans
PLDT has separate and distinct retirement plans for itself and majority of its Philippine-based operating subsidiaries, administered by the respective Funds’ Trustees, covering permanent employees. Retirement costs are separately determined using the projected unit credit method. This method reflects services rendered by employees to the date of valuation and incorporates assumptions concerning employees’ projected salaries. Retirement costs consist of the following: Service cost; Net interest on the net defined benefit asset or obligation; and Remeasurements of net defined benefit asset or obligation Service cost (which includes current service costs, past service costs and gains or losses on curtailments and non-routine settlements) is recognized as part of “Compensation and employee benefits” account in our consolidated income statement. These amounts are calculated periodically by an independent qualified actuary. Net interest on the net defined benefit asset or obligation is the change during the period in the net defined benefit asset or obligation that arises from the passage of time which is determined by applying the discount rate based on the government bonds to the net defined benefit asset or obligation. Net deferred benefit asset is recognized as part of advances and other noncurrent assets and net defined benefit obligation is recognized as part of pension and other employee benefits in our consolidated statement of financial position. Remeasurements, comprising actuarial gains and losses, return on plan assets and any change in the effect of the asset ceiling (excluding net interest on defined benefit obligation) are recognized immediately in other comprehensive income in the period in which they occur. Remeasurements are not classified to profit or loss in subsequent periods.

F-37
The net defined benefit asset or obligation comprises the present value of the defined benefit obligation (using a discount rate based on government bonds, as explained in Note 3 – Management’s Use of Accounting Judgments, Estimates and Assumptions – Estimating pension benefit costs and other employee benefits), net of the fair value of plan assets out of which the obligations are to be settled directly. Plan assets are assets held by a long-term employee benefit fund or qualifying insurance policies and are not available to our creditors nor can they be paid directly to us. Fair value is based on market price information and in the case of quoted securities, the published bid price and in the case of unquoted securities, the discounted cash flow using the income approach. The value of any defined benefit asset recognized is restricted to the asset ceiling which is the present value of any economic benefits available in the form of refunds from the plan or reductions in the future contributions to the plan. See Note 26 – Employee Benefits – Defined Benefit Pension Plans for more details.
Defined contribution plans
Smart and certain of its subsidiaries maintain a defined contribution plan that covers all regular full-time employees under which it pays fixed contributions based on the employees’ monthly salaries. Smart and certain of its subsidiaries, however, are covered under Republic Act 7641, or R.A. 7641, otherwise known as “The Philippine Retirement Law”, which provides for qualified employees to receive a defined benefit minimum guarantee. The defined benefit minimum guarantee is equivalent to a certain percentage of the monthly salary payable to an employee at normal retirement age with the required credited years of service based on the provisions of R.A. 7641. Accordingly, Smart and certain of its subsidiaries account for their retirement obligation under the higher of the defined benefit obligation related to the minimum guarantee and the obligation arising from the defined contribution plan. For the defined benefit minimum guarantee plan, the liability is determined based on the present value of the excess of the projected defined benefit obligation over the projected defined contribution obligation at the end of the reporting period. The defined benefit obligation is calculated annually by a qualified independent actuary using the projected unit credit method. Smart and certain of its subsidiaries determines the net interest expense (income) on the net defined benefit liability (asset) for the period by applying the discount rate used to measure the defined benefit obligation at the beginning of the annual period to the then net defined benefit liability (asset), taking into account any changes in the net defined benefit liability (asset) during the period as a result of contributions and benefit payments. Net interest expense (income) and other expenses (income) related to the defined benefit plan are recognized in our profit or loss. The defined contribution liability, on the other hand, is measured at the fair value of the defined contribution assets upon which the defined contribution benefits depend, with an adjustment for margin on asset returns, if any, where this is reflected in the defined contribution benefits. Remeasurements of the net defined benefit liability, which comprise actuarial gains and losses, the return on plan assets (excluding interest) and the effect of the asset ceiling (if any, excluding interest), are recognized immediately in our other comprehensive income. When the benefits of the plan are changed or when the plan is curtailed, the resulting change in benefit that relates to past service or the gain or loss on curtailment is recognized immediately in our profit or loss. Gains or losses on the settlement of the defined benefit plan are recognized when the settlement occurs. See Note 26 – Employee Benefits – Defined Contribution Plans for more details. Other Long-term Employee Benefits Our liability arising from the 2012 to 2014 Long-term Incentive Plan, or the 2012 to 2014 LTIP, is determined using the projected unit credit method. Employee benefit costs include current service cost, net interest on the net defined benefit obligation, and remeasurements of the net defined benefit obligation. Past service costs and actuarial gains and losses are recognized immediately in our profit or loss.
F-38
The long-term employee benefit liability comprises the present value of the defined benefit obligation (using a discount rate based on government bonds) at the end of the reporting period. Leases The determination of whether an arrangement is, or contains, a lease is based on the substance of the arrangement at inception date. The arrangement is assessed for whether the fulfillment of the arrangement is dependent on the use of a specific asset or assets and the arrangement conveys a right to use the asset or assets, even if that right is not explicitly specified in an arrangement. A reassessment is made after the inception of the lease only if one of the following applies: (a) there is a change in contractual terms, other than a renewal or extension of the agreement; (b) a renewal option is exercised or extension granted, unless the term of the renewal or extension was initially included in the lease term; (c) there is a change in the determination of whether the fulfillment is dependent on a specified asset; or (d) there is a substantial change to the asset. Where a reassessment is made, lease accounting shall commence or cease from the date when the change in circumstances gave rise to the reassessment for scenarios (a), (c) or (d) and the date of renewal or extension period for scenario (b).
As a Lessor. Leases where we retain substantially all the risks and benefits of ownership of the asset are classified as operating leases. Any initial direct costs incurred in negotiating an operating lease are added to the carrying amount of the leased asset and recognized over the lease term on the same bases as rental income. Rental income is recognized in our consolidated income statement on a straight-line basis over the lease term.
All other leases are classified as finance leases. At the inception of the finance lease, the asset subject to lease agreement is derecognized and lease receivable is recognized. Interest income is accrued over the lease term using the EIR and lease amortization is accounted for as reduction of lease receivable.
As a Lessee. Leases where the lessor retains substantially all the risks and benefits of ownership of the assets are classified as operating leases. Operating lease payments are recognized as expense in our consolidated income statement on a straight-line basis over the lease term.
All other leases are classified as finance leases. A finance lease gives rise to the recognition of a leased asset and finance lease liability. Capitalized leased assets are depreciated over the shorter of the estimated useful life of the asset or the lease term, if there is no reasonable certainty that we will obtain ownership of the leased asset at the end of the lease term. Interest expense is recognized over the lease term using the EIR.
Income Taxes
Current income tax
Current income tax assets and liabilities for the current and prior years are measured at the amount expected to be recovered from or paid to the taxation authorities. The tax rates and tax laws used to compute the amount are those that are enacted or substantively enacted as at the end of the reporting period where we operate and generate taxable income.
Deferred income tax
Deferred income tax is provided using the balance sheet liability method on all temporary differences between the tax bases of assets and liabilities and their carrying amounts for financial reporting purposes at the end of the reporting period.
F-39
Deferred income tax liabilities are recognized for all taxable temporary differences except: (1) when the deferred income tax liability arises from the initial recognition of goodwill or of an asset or liability in a transaction that is not a business combination and, at the time of the transaction, affects neither the accounting profit nor taxable profit or loss; and (2) with respect to taxable temporary differences associated with investments in subsidiaries, associates and interest in joint ventures, when the timing of the reversal of the temporary differences can be controlled and it is probable that the temporary differences will not reverse in the foreseeable future.
Deferred income tax assets are recognized for all deductible temporary differences, the carryforward benefits of unused tax credits from excess minimum corporate income tax, or MCIT, over regular corporate income tax, or RCIT, and unused net operating loss carry over, or NOLCO. Deferred income tax assets are recognized to the extent that it is probable that taxable profit will be available against which the deductible temporary differences and carryforward benefits of unused tax credits and unused tax losses can be utilized, except: (1) when the deferred income tax asset relating to the deductible temporary difference arises from the initial recognition of an asset or liability in a transaction that is not a business combination and, at the time of the transaction, affects neither the accounting profit nor taxable profit or loss; and (2) with respect to deductible temporary differences associated with investments in subsidiaries, associates and interests in joint ventures, deferred income tax assets are recognized only to the extent that it is probable that the temporary differences will reverse in the foreseeable future and taxable profit will be available against which the temporary differences can be utilized.
The carrying amount of deferred income tax assets is reviewed at the end of each reporting period and reduced to the extent that it is no longer probable that sufficient taxable profit will be available to allow all or part of the deferred income tax assets to be utilized. Unrecognized deferred income tax assets are reassessed at the end of each reporting period and are recognized to the extent that it has become probable that future taxable profit will allow the deferred income tax assets to be recovered.
Deferred income tax assets and liabilities are measured at the tax rates that are expected to apply in the year when the asset is realized or the liability is settled, based on tax rates (and tax laws) that have been enacted or substantively enacted as at the end of the reporting period.
Deferred income tax relating to items recognized in “Other comprehensive income” account is included in our statement of comprehensive income and not in our consolidated income statement.
Deferred income tax assets and liabilities are offset, if a legally enforceable right exists to offset current income tax assets against current income tax liabilities and the deferred income taxes relate to the same taxable entity and the same taxation authority.
Tax benefits acquired as part of a business combination, but not satisfying the criteria for separate recognition at that date, would be recognized subsequently if new information about facts and circumstances changed. The adjustment would either be treated as a reduction to goodwill (as long as it does not exceed goodwill) if it is incurred during the measurement period or in our profit or loss.
VAT
Revenues, expenses and assets are recognized net of the amount of VAT except: (1) where the VAT incurred on a purchase of assets or services is not recoverable from the tax authority, in which case, the VAT is recognized as part of the cost of acquisition of the asset or as part of the expense item as applicable; and (2) where receivables and payables are stated with the amount of VAT included.
Contingencies
Contingent liabilities are not recognized in our consolidated financial statements. They are disclosed in the notes to our consolidated financial statements unless the possibility of an outflow of resources embodying economic benefits is remote. Contingent assets are not recognized in our consolidated financial statements but are disclosed in the notes to our consolidated financial statements when an inflow of economic benefits is probable.
F-40
Events After the End of the Reporting Period
Post year-end events up to the date of approval of the Board of Directors that provide additional information about our financial position at the end of the reporting period (adjusting events) are reflected in our consolidated financial statements. Post year-end events that are not adjusting events are disclosed in the notes to our consolidated financial statements when material.
Equity
Preferred and common stocks are measured at par value for all shares issued. Incremental costs incurred directly attributable to the issuance of new shares are shown in equity as a deduction from proceeds, net of tax. Proceeds and/or fair value of considerations received in excess of par value are recognized as capital in excess of par value in our consolidated statements of changes in equity.
Treasury stocks are our own equity instruments which are reacquired and recognized at cost and presented as reduction in equity. No gain or loss is recognized in our consolidated income statement on the purchase, sale, reissuance or cancellation of our own equity instruments. Any difference between the carrying amount and the consideration upon reissuance or cancellation of shares is recognized as capital in excess of par value in our consolidated statements of changes in equity and statements of financial position.
Change in the ownership interest of a subsidiary, without loss of control, is accounted for as an equity transaction and any impact is presented as part of capital in excess of par value in our consolidated statements of changes in equity. Retained earnings represent our net accumulated earnings less cumulative dividends declared. Other comprehensive income comprises of income and expense, including reclassification adjustments that are not recognized in our profit or loss as required or permitted by PFRSs. Standards Issued But Not Yet Effective The standards and interpretations that are issued, but not yet effective, up to the date of issuance of the financial statements are listed below. We will adopt these standards and amendments to existing standards which are relevant to us when these become effective. Except for PFRS 9, Financial Instruments, IFRS 15, Revenue from Contracts with Customers, and IFRS 16, Leases, as discussed further below, we do not expect the adoption of these standards and amendments to PFRS to have a significant impact on our consolidated financial statements. No definite adoption date prescribed by the SEC and FRSC Philippine Interpretation IFRIC 15, Agreements for the Construction of Real Estate PFRS 9, Financial Instruments
In July 2014, the IASB issued the final version of PFRS 9, Financial Instruments. The new standard (renamed as PFRS 9) reflects all phases of the financial instruments project and replaces PAS 39, Financial Instruments: Recognition and Measurement, and all previous versions of PFRS 9. The standard introduces new requirements for classification and measurement, impairment, and hedge accounting. PFRS 9 is effective for annual periods beginning on or after January 1, 2018, with early application permitted. Retrospective application is required, but providing comparative information is not compulsory. For hedge accounting, the requirements are generally applied prospectively, with some limited exceptions. The adoption of PFRS 9 will have an effect on the classification and measurement of our financial assets, but will have no impact on the classification and measurement of our financial liabilities. The adoption will also have an effect on our application of hedge accounting and on the amount of its credit losses. We are currently assessing the impact of adopting this standard.
F-41
IFRS 15, Revenue from Contracts with Customers
IFRS 15 was issued in May 2014 by the IASB and establishes a new five-step model that will apply to revenue arising from contracts with customers. Under IFRS 15, revenue is recognized at an amount that reflects the consideration to which an entity expects to be entitled in exchange for transferring goods or services to a customer. The principles in IFRS 15 provide a more structured approach to measuring and recognizing revenue.
The new revenue standard is applicable to all entities and will supersede all current revenue recognition requirements under PFRS. Either a full or modified retrospective application is required for annual periods beginning on or after January 1, 2018. Early adoption is permitted. We are currently assessing the impact of adopting this standard.
IFRS 16, Leases On January 13, 2016, the IASB issued its new standard, IFRS 16, which replaces PAS 17, Leases, the current leases standard, and the related Interpretations.
Under the new standard, lessees will no longer classify their leases as either operating or finance leases in accordance with PAS 17. Rather, lessees will apply the single-asset model. Under this model, lessees will recognize the assets and related liabilities for most leases on their balance sheets, and subsequently, will depreciate the lease assets and recognize interest on the lease liabilities in their profit or loss. Leases with a term of 12 months or less or for which the underlying asset is of low value are exempted from these requirements.
The accounting by lessors is substantially unchanged as the new standard carries forward the principles of lessor accounting under PAS 17. Lessors, however, will be required to disclose more information in their financial statements, particularly regarding risk exposure to residual value.
The new standard is effective for annual periods beginning on or after January 1, 2019. Entities may early adopt IFRS 16 but only if they have also adopted IFRS 15. When adopting IFRS 16, an entity is permitted to use either a full retrospective or a modified retrospective approach, with options to use certain transition reliefs. We are currently assessing the impact of adopting this standard.
3. Management’s Use of Accounting Judgments, Estimates and Assumptions
The preparation of our consolidated financial statements in conformity with PFRS requires us to make judgments, estimates and assumptions that affect the reported amounts of our revenues, expenses, assets and liabilities and disclosure of contingent liabilities at the end of each reporting period. The uncertainties inherent in these assumptions and estimates could result in outcomes that could require a material adjustment to the carrying amount of the assets or liabilities affected in the future years.
Judgments
In the process of applying the PLDT Group’s accounting policies, management has made the following judgments, apart from those including estimations and assumptions, which have the most significant effect on the amounts recognized in our consolidated financial statements.
Determination of functional currency
The functional currencies of the entities under the PLDT Group are the currency of the primary economic environment in which each entity operates. It is the currency that mainly influences the revenue from and cost of rendering products and services.
F-42
The presentation currency of the PLDT Group is the Philippine peso. Based on the economic substance of the underlying circumstances relevant to the PLDT Group, the functional currency of all entities under PLDT Group is the Philippine peso, except for (a) SMHC, FECL Group, PLDT Global and certain of its subsidiaries, DCPL, PGNL and certain of its subsidiaries, Chikka and certain of its subsidiaries and PGIC, which use the U.S. dollar; (b) eInnovations, Takatack Holdings, Takatack Technologies, iCommerce, Fintech Ventures, ePay, 3rd Brand, CPL and AGSPL, which use the Singapore dollar; (c) CCCBL, which uses the Chinese renminbi; (d) AGS Malaysia, which uses the Malaysian ringgit; and (e) AGS Indonesia, which uses the Indonesian rupiah.
Leases
As a lessee, we have various lease agreements in respect of certain equipment and properties. We evaluate whether significant risks and rewards of ownership of the leased properties are transferred to us (finance lease) or retained by the lessor (operating lease) based on PAS 17, Leases. Total lease expense amounted to Php3,411 million and Php3,019 million for the six months ended June 30, 2016 and 2015, respectively. Total finance lease obligations amounted to Php1 million each as at June 30, 2016 and December 31, 2015. See Note 2 – Summary of Significant Accounting Policies, Note 21 – Interest-bearing Financial Liabilities – Obligations under Finance Leases and Note 28 – Financial Assets and Liabilities – Liquidity Risk.
Accounting for investments in MediaQuest Holdings, Inc., or MediaQuest, through Philippine Depositary Receipts, or PDRs
ePLDT made various investments in PDRs issued by MediaQuest in relation to its direct interest in Satventures, Inc., or Satventures, and Hastings Holdings, Inc., or Hastings, and indirect interest in Cignal TV, Inc., or Cignal TV.
Based on our judgment, at the PLDT Group level, ePLDT’s investments in PDRs gives ePLDT a significant influence over Satventures, Hastings and Cignal TV as evidenced by inter-change of managerial personnel, provision of essential technical information and material transactions among PLDT, Smart, Satventures, Hastings and Cignal TV, thus accounted for as investments in associates using the equity method. The carrying value of our investments in PDRs issued by MediaQuest amounted to Php12,633 million and Php12,749 million as at June 30, 2016 and December 31, 2015, respectively. See related discussion on Note 10 – Investment in Associates and Joint Ventures – Investments in Associates – Investment in MediaQuest PDRs.
Accounting for investments in Phunware and AppCard In 2015, PLDT Capital subscribed to preferred shares of Phunware and AppCard, see Note 10 Investment in Associates and Joint Ventures. The investment in Phunware allows PLDT Capital to designate one director in the five-seat board (20% interest) of Phunware for as long as PLDT Capital beneficially owns at least a certain percentage of Phunware’s preferred shares. Likewise, PLDT Capital was assigned one board seat out of the five board members of AppCard for so long as PLDT Capital, together with its affiliates, continues to own at least a certain percentage of AppCard’s capital stock. Based on our judgment, at the PLDT Group Level, PLDT Capital’s investments in preferred shares give PLDT a significant influence over Phunware and AppCard as evidenced by the board seats assigned to us. This gives us the authority to participate in the financial and operating policy decisions of Phunware and AppCard but neither control nor joint control of those policies. Hence, the investments are accounted for as investment in associates.
Impairment of available-for-sale equity investments
For available-for-sale financial investments, we assess at each reporting date whether there is objective evidence that an investment or a group of investments is impaired.
F-43
In the case of equity investments classified as available-for-sale financial investments, objective evidence would include a significant or prolonged decline in the fair value of the investment below its cost. The determination of what is “significant” or “prolonged” requires judgment. We treat “significant” generally as decline of 20% or more below the original cost of investment, and “prolonged” as greater than 12 months assessed against the period in which the fair value has been below its original cost. Based on our judgment, the decline in fair value of our investment in Rocket Internet SE, or Rocket, as at December 31, 2015 is considered significant as the cumulative net losses from changes in fair value amounting to Php5,124 million represents 26% decline in value below cost. As a result, we recognized in profit or loss impairment of the investment in Rocket amounting to Php5,124 million for the year ended December 31, 2015. For the six months ended June 30, 2016, we recognized additional impairment loss of Php5,381 million as the fair value of Rocket further declined to Php9,206 million as at June 30, 2016 from Php14,587 million as at December 31, 2015. See related discussion on Note 5 – Income and Expenses and Note 11 – Available-for-Sale Financial Investments. Estimates and Assumptions The key estimates and assumptions concerning the future and other key sources of estimation uncertainty at the end of the reporting period that have a significant risk of causing a material adjustment to the carrying amounts of assets and liabilities recognized in our consolidated financial statements within the next financial year are discussed below. We based our estimates and assumptions on parameters available when the consolidated financial statements were prepared. Existing circumstances and assumptions about future developments, however, may change due to market changes or circumstances arising beyond our control. Such changes are reflected in the assumptions when they occur.
Impairment of non-financial assets PFRS requires that an impairment review be performed when certain impairment indicators are present. In the case of goodwill and intangible assets with indefinite useful life, at a minimum, such assets are subject to an impairment test annually and whenever there is an indication that such assets may be impaired. This requires an estimation of the value in use of the CGUs to which these assets are allocated. The value in use calculation requires us to make an estimate of the expected future cash flows from the CGU and to choose a suitable discount rate in order to calculate the present value of those cash flows. See Note 15 – Goodwill and Intangible Assets – Impairment Testing of Goodwill and Intangible Assets with Indefinite Useful Life for the key assumptions used to determine the value in use of the relevant CGUs. Determining the recoverable amount of property and equipment, investments in associates, joint ventures and deposits, intangible assets, prepayments and other noncurrent assets, requires us to make estimates and assumptions in the determination of future cash flows expected to be generated from the continued use and ultimate disposition of such assets. Future events could cause us to conclude that property and equipment, investments in associates and joint ventures, intangible assets and other noncurrent assets associated with an acquired business are impaired. Any resulting impairment loss could have a material adverse impact on our financial position and financial performance. The preparation of estimated future cash flows involves significant estimations and assumptions. While we believe that our assumptions are appropriate and reasonable, significant changes in our assumptions may materially affect our assessment of recoverable values and may lead to future impairment charges under PFRS. There was no asset impairment recognized on noncurrent assets for the six months ended June 30, 2016 and 2015. See Note 4 – Operating Segment Information, Note 5 – Income and Expenses – Asset Impairment and Note 9 – Property and Equipment – Impairment of Certain Wireless Network Equipment and Facilities. The carrying values of our property and equipment, investments in associates, joint ventures and deposits, goodwill and intangible assets, and prepayments are separately disclosed in Notes 9, 10, 15 and 19, respectively.
F-44
Estimating useful lives of property and equipment We estimate the useful lives of each item of our property and equipment based on the periods over which our assets are expected to be available for use. Our estimate of the useful lives of our property and equipment is based on our collective assessment of industry practice, internal technical evaluation and experience with similar assets. The estimated useful lives of our property and equipment are reviewed every year-end and are updated if expectations differ from previous estimates due to physical wear and tear, technical or commercial obsolescence and legal or other limitations on the use of our assets. It is possible, however, that future results of operations could be materially affected by changes in our estimates brought about by changes in the factors mentioned above. The amounts and timing of recorded expenses for any period would be affected by changes in these factors and circumstances. A reduction in the estimated useful lives of our property and equipment would increase our recorded depreciation and amortization and decrease our property and equipment. The total depreciation and amortization of property and equipment amounted to Php14,575 million and Php13,945 million for the six months ended June 30, 2016 and 2015, respectively. Total carrying values of property and equipment, net of accumulated depreciation and amortization, amounted to Php200,060 million and Php195,782 million as at June 30, 2016 and December 31, 2015, respectively. See Note 2 – Summary of Significant Accounting Policies, Note 4 – Operating Segment Information and Note 9 – Property and Equipment.
Estimating useful lives of intangible assets with finite lives Intangible assets with finite lives are amortized over their expected useful lives using the straight-line method of amortization. At a minimum, the amortization period and the amortization method for an intangible asset with a finite useful life are reviewed at least at each financial year-end. Changes in the expected useful life or the expected pattern of consumption of future economic benefits embodied in the asset are accounted for by changing the amortization period or method, as appropriate, and treated as changes in accounting estimates. The amortization expense on intangible assets with finite lives is recognized in our consolidated income statement. The total amortization of intangible assets with finite lives amounted to Php544 million and Php542 million for the six months ended June 30, 2016 and 2015, respectively. Total carrying values of intangible assets with finite lives amounted to Php5,376 million and Php5,219 million as at June 30, 2016 and December 31, 2015, respectively. See Note 2 – Summary of Significant Accounting Policies, Note 4 – Operating Segment Information and Note 15 – Goodwill and Intangible Assets.
Business combinations Our consolidated financial statements and financial performance reflect acquired businesses after the completion of the respective acquisition. We account for the acquired businesses using the acquisition method, which requires extensive use of accounting judgments and estimates to allocate the purchase price to the fair market values of the acquiree’s identifiable assets and liabilities and contingent liabilities, if any, at the acquisition date. Any excess in the purchase price over the estimated fair market values of the net assets acquired is recorded as goodwill in our consolidated statement of financial position. Thus, the numerous judgments made in estimating the fair market value to be assigned to the acquiree’s assets and liabilities can materially affect our financial performance and position. See Note 14 – Business Combinations.
F-45
Recognition of deferred income tax assets We review the carrying amounts of deferred income tax assets at the end of each reporting period and reduce these to the extent that these are no longer probable that sufficient taxable income will be available to allow all or part of the deferred income tax assets to be utilized. Our assessment on the recognition of deferred income tax assets on deductible temporary differences is based on the level and timing of forecasted taxable income of the subsequent reporting periods. This forecast is based on our past results and future expectations on revenues and expenses as well as future tax planning strategies. However, there is no assurance that we will generate sufficient taxable income to allow all or part of our deferred income tax assets to be utilized. We also review the level of projected gross margin for the use of Optional Standard Deduction, or OSD method, and assess the future tax consequences for the recognition of deferred income tax assets. For taxable year 2015, Smart shifted to itemized deduction method in computing its taxable income due to decline in gross margin and based on the most recent approved forecast, Smart expects itemized deduction method to be more favorable moving forward. Unrecognized deferred tax assets and liabilities, which were previously valued using the OSD method, are now fully recognized. Based on the above assessment, our consolidated unrecognized deferred income tax assets amounted to Php10,388 million and Php10,759 million as at June 30, 2016 and December 31, 2015, respectively. Total consolidated provision for deferred income tax amounted to Php1,089 million and Php698 million for the six months ended June 30, 2016 and 2015, respectively. Total consolidated net deferred income tax assets amounted to Php21,730 million and Php21,941 million as at June 30, 2016 and December 31, 2015, respectively. See Note 2 – Summary of Significant Accounting Policies, Note 4 – Operating Segment Information and Note 7 – Income Taxes.
Estimating allowance for doubtful accounts
If we assessed that there was objective evidence that an impairment loss was incurred in our trade and other receivables, we estimate the allowance for doubtful accounts related to our trade and other receivables that are specifically identified as doubtful of collection. The amount of allowance is evaluated by management on the basis of factors that affect the collectability of the accounts. In these cases, we use judgment based on all available facts and circumstances, including, but not limited to, the length of our relationship with the customer and the customer’s credit status based on third party credit reports and known market factors, to record specific reserves for customers against amounts due in order to reduce our receivables to amounts that we expect to collect. These specific reserves are re-evaluated and adjusted as additional information received affects the amounts estimated. In addition to specific allowance against individually significant receivables, we also assess a collective impairment allowance against credit exposures of our customer which were grouped based on common credit characteristics, which, although not specifically identified as requiring a specific allowance, have a greater risk of default than when the receivables were originally granted to customers. This collective allowance is based on historical loss experience using various factors, such as historical performance of the customers within the collective group, deterioration in the markets in which the customers operate, and identified structural weaknesses or deterioration in the cash flows of customers. Total provision for doubtful accounts for trade and other receivables recognized in our consolidated income statements amounted to Php4,334 million and Php1,544 million for the six months ended June 30, 2016 and 2015, respectively. Trade and other receivables, net of allowance for doubtful accounts, amounted to Php28,444 million and Php24,898 million as at June 30, 2016 and December 31, 2015, respectively. See Note 4 – Operating Segment Information, Note 5 – Income and Expenses – Asset Impairment, Note 17 – Trade and Other Receivables and Note 28 – Financial Assets and Liabilities.
F-46
Estimating pension benefit costs and other employee benefits The cost of defined benefit and present value of the pension obligation are determined using the projected unit credit method. An actuarial valuation includes making various assumptions which consists, among other things, discount rates, rates of compensation increases and mortality rates. See Note 26 – Employee Benefits. Due to complexity of valuation, the underlying assumptions and its long-term nature, a defined benefit obligation is highly sensitive to changes in assumptions. While we believe that our assumptions are reasonable and appropriate, significant differences in our actual experience or significant changes in our assumptions may materially affect our cost for pension and other retirement obligations. All assumptions are reviewed every year-end. Net consolidated pension benefit costs amounted to Php836 million and Php974 million for the six months ended June 30, 2016 and 2015, respectively. The prepaid benefit costs amounted to Php390 million and Php306 million as at June 30, 2016 and December 31, 2015, respectively. The accrued benefit costs amounted to Php10,946 million and Php10,197 million as at June 30, 2016 and December 31, 2015, respectively. See Note 5 – Income and Expenses – Compensation and Employee Benefits, Note 19 – Prepayments and Note 26 – Employee Benefits – Defined Benefit Pension Plans.
Provision for asset retirement obligations Provision for asset retirement obligations are recognized in the period in which these are incurred if a reasonable estimate can be made. This requires an estimation of the cost to restore/dismantle on a per square meter basis, depending on the location, and is based on the best estimate of the expenditure required to settle the obligation at the future restoration/dismantlement date, discounted using a pre-tax rate that reflects the current market assessment of the time value of money and, where appropriate, the risk specific to the liability. Total provision for asset retirement obligations amounted to Php1,460 million and Php1,437 million as at June 30, 2016 and December 31, 2015, respectively. See Note 22 – Deferred Credits and Other Noncurrent Liabilities.
Provision for legal contingencies and tax assessments We are currently involved in various legal proceedings and tax assessments. Our estimates of the probable costs for the resolution of these claims have been developed in consultation with our counsel handling the defense in these matters and are based upon our analysis of potential results. We currently do not believe these proceedings could materially reduce our revenues and profitability. It is possible, however, that future financial position and performance could be materially affected by changes in our estimates or effectiveness of our strategies relating to these proceedings and assessments. See Note 27 – Provisions and Contingencies. Based on management’s assessment, appropriate provisions were made; however, management has decided not to disclose further details of these provisions as they may prejudice our position in certain legal proceedings.
Revenue recognition Our revenue recognition policies require us to make use of estimates and assumptions that may affect the reported amounts of our revenues and receivables. Our agreements with domestic and foreign carriers for inbound and outbound traffic subject to settlements require traffic reconciliations before actual settlement is done, which may not be the actual volume of traffic as measured by us. Initial recognition of revenues is based on our observed traffic adjusted by our normal experience adjustments, which historically are not material to our consolidated financial statements. Differences between the amounts initially recognized and the actual settlements are taken up in the accounts upon reconciliation.
F-47
Revenues earned from multiple element arrangements offered by our fixed line and wireless businesses are split into separately identifiable components based on their relative fair value in order to reflect the substance of the transaction. Where fair value is not directly observable, the total consideration is allocated using an appropriate allocation method. We account for mobile contracts in accordance with PAS 18, Revenue Recognition, and have concluded that the handset and the mobile services may be accounted for as separate identifiable components. The handset (with activation) is delivered first, followed by the mobile service (which is provided over the contract/lock-in period, generally one or two years). Because some amount of the arrangement consideration that may be allocated to the handset generally is contingent on providing the mobile service, the amount that is allocated to the handset is limited to the cash received (i.e., the amount paid for the handset) at the time of the handset delivery. Under certain arrangements with our knowledge processing solutions services, if there is uncertainty regarding the outcome of the transaction for which service was rendered, revenue is recognized only to the extent of expenses incurred for rendering the service and only to such amount as determined to be recoverable. We recognize our revenues from installation and activation related fees and the corresponding costs over the expected average periods of customer relationship for fixed line and cellular services. We estimate the expected average period of customer relationship based on our most recent churn rate analysis.
Determination of fair values of financial assets and financial liabilities Where the fair value of financial assets and financial liabilities recorded in our consolidated statement of financial position cannot be derived from active markets, they are determined using valuation techniques including the discounted cash flows model. The inputs to these models are taken from observable markets where possible, but where this is not feasible, a degree of judgment is required in establishing fair values. The judgments include considerations of inputs such as liquidity risk, credit risk and volatility. Changes in assumptions about these factors could affect the reported fair value of financial instruments. Other than those whose carrying amounts are reasonable approximations of fair values, total fair values of noncurrent financial assets and noncurrent financial liabilities as at June 30, 2016 amounted to Php8,769 million and Php148,943 million, respectively, while the total fair values of noncurrent financial assets and noncurrent financial liabilities as at December 31, 2015 amounted to Php3,277 million and Php165,572 million, respectively. See Note 28 – Financial Assets and Liabilities.
4. Operating Segment Information
Operating segments are components of the PLDT Group that engage in business activities from which they may earn revenues and incur expenses (including revenues and expenses relating to transactions with other components of PLDT Group). The operating results of these operating segments are regularly reviewed by the Management Committee to make decisions about how resources are to be allocated to each of the segments and to assess their performances, and for which discrete financial information is available. For management purposes, we are organized into business units based on our products and services and based on the reorganization as discussed below. We have three reportable operating segments, as follows: Wireless – wireless telecommunications services provided by Smart and DMPI, which owns the Sun
Cellular business and is a wholly-owned subsidiary of Digitel, our cellular service providers; Voyager and certain subsidiaries, our mobile applications and digital platforms developer and mobile financial services provider; SBI and PDSI, our wireless broadband service providers; Chikka Group, our wireless content operators; ACeS Philippines, our satellite information and messaging services provider; WiFun, our WiFi-enabler and certain subsidiaries of PLDT Global, our mobile virtual network operations provider;
F-48
Fixed Line – fixed line telecommunications services primarily provided by PLDT. We also provide fixed line services through PLDT’s subsidiaries, namely, ClarkTel, SubicTel, Philcom Group, Maratel, SBI, BCC, PLDT Global and certain subsidiaries and Digitel, all of which together account for approximately 3% of our consolidated fixed line subscribers; data center, cloud, big data, managed information and communications technology services and resellership provided by ePLDT, IPCDSI Group, AGS Group, Curo and ePDS; business infrastructure and solutions, intelligent data processing and implementation services and data analytics insight generation provided by Talas; distribution of Filipino channels and content provided by PGNL and its subsidiaries; and
Others – PCEV, PGIH, PLDT Digital and its subsidiaries, MIC and PGIC, our investment companies. See Note 2 – Summary of Significant Accounting Policies and Note 14 – Business Combinations, for further discussion. The Management Committee monitors the operating results of each business unit separately for purposes of making decisions about resource allocation and performance assessment. Segment performance is evaluated based on net income (loss) for the period; earnings before interest, taxes and depreciation and amortization, or EBITDA; EBITDA margin; and core income. Net income (loss) for the period is measured consistent with net income (loss) in our consolidated financial statements.
EBITDA for the period is measured as net income excluding depreciation and amortization, amortization of intangible assets, asset impairment on noncurrent assets, financing costs, interest income, equity share in net earnings (losses) of associates and joint ventures, foreign exchange gains (losses) – net, gains (losses) on derivative financial instruments – net, provision for (benefit from) income tax and other income – net.
EBITDA margin for the period is measured as EBITDA divided by service revenues.
Core income for the period is measured as net income attributable to equity holders of PLDT (net income less net income attributable to noncontrolling interests), excluding foreign exchange gains (losses) – net, gains (losses) on derivative financial instruments – net (excluding hedge costs), asset impairment on noncurrent assets, other non-recurring gains (losses), net of tax effect of aforementioned adjustments, as applicable, and similar adjustments to equity share in net earnings (losses) of associates and joint ventures.
Segment revenues, segment expenses and segment results include transfers between business segments. These transfers are eliminated in full upon consolidation.
Core earnings per common share, or core EPS, for the period is measured as core income divided by the weighted average number of outstanding common shares. See Note 8 – Earnings Per Common Share for the weighted average number of common shares.
EBITDA, EBITDA margin, core income and core EPS are non-PFRS measures.
The amounts of segment assets and liabilities and segment profit or loss are based on measurement principles that are similar to those used in measuring the assets and liabilities and profit or loss in our consolidated financial statements, which is in accordance with PFRS.
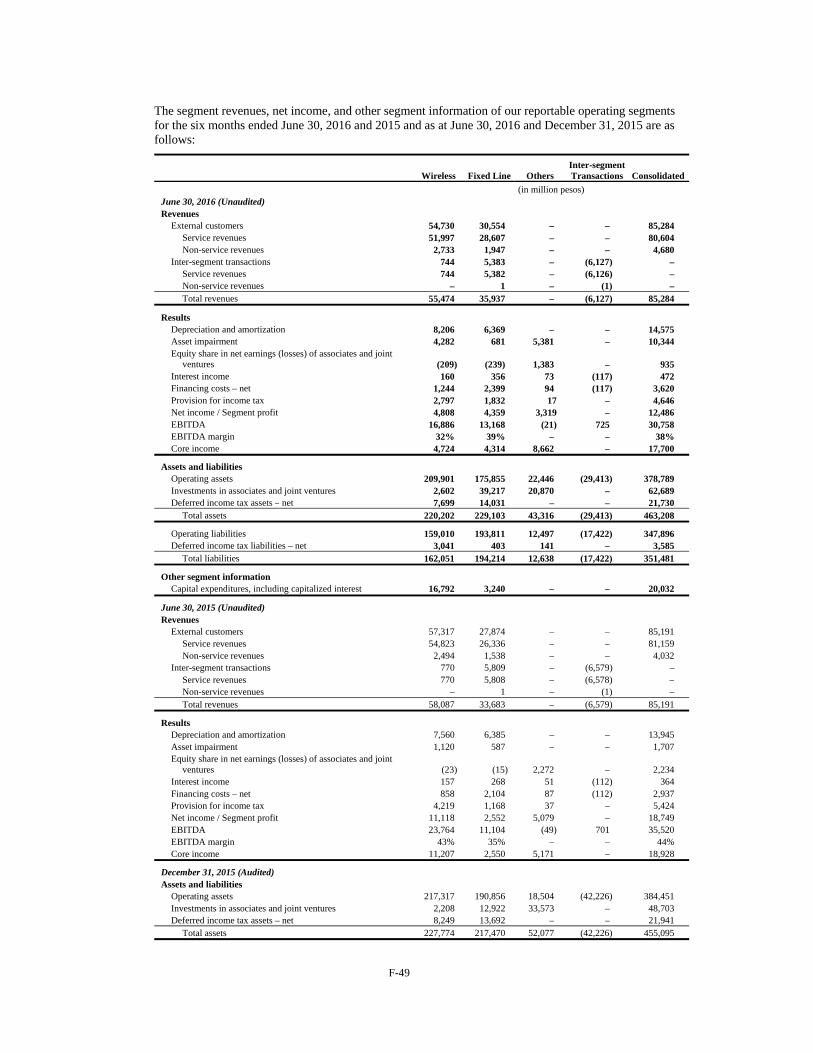
F-49
The segment revenues, net income, and other segment information of our reportable operating segments for the six months ended June 30, 2016 and 2015 and as at June 30, 2016 and December 31, 2015 are as follows:
Wireless Fixed Line OthersInter-segment Transactions Consolidated
(in million pesos) June 30, 2016 (Unaudited) Revenues
External customers 54,730 30,554 – – 85,284 Service revenues 51,997 28,607 – – 80,604Non-service revenues 2,733 1,947 – – 4,680
Inter-segment transactions 744 5,383 – (6,127) –Service revenues 744 5,382 – (6,126) – Non-service revenues – 1 – (1) – Total revenues 55,474 35,937 – (6,127) 85,284
Results Depreciation and amortization 8,206 6,369 – – 14,575Asset impairment 4,282 681 5,381 – 10,344 Equity share in net earnings (losses) of associates and joint
ventures (209) (239) 1,383 – 935 Interest income 160 356 73 (117) 472Financing costs – net 1,244 2,399 94 (117) 3,620 Provision for income tax 2,797 1,832 17 – 4,646Net income / Segment profit 4,808 4,359 3,319 – 12,486 EBITDA 16,886 13,168 (21) 725 30,758EBITDA margin 32% 39% – – 38% Core income 4,724 4,314 8,662 – 17,700
Assets and liabilities Operating assets 209,901 175,855 22,446 (29,413) 378,789 Investments in associates and joint ventures 2,602 39,217 20,870 – 62,689 Deferred income tax assets – net 7,699 14,031 – – 21,730
Total assets 220,202 229,103 43,316 (29,413) 463,208
Operating liabilities 159,010 193,811 12,497 (17,422) 347,896Deferred income tax liabilities – net 3,041 403 141 – 3,585
Total liabilities 162,051 194,214 12,638 (17,422) 351,481
Other segment information Capital expenditures, including capitalized interest 16,792 3,240 – – 20,032
June 30, 2015 (Unaudited) Revenues
External customers 57,317 27,874 – – 85,191 Service revenues 54,823 26,336 – – 81,159Non-service revenues 2,494 1,538 – – 4,032
Inter-segment transactions 770 5,809 – (6,579) – Service revenues 770 5,808 – (6,578) –Non-service revenues – 1 – (1) – Total revenues 58,087 33,683 – (6,579) 85,191
Results Depreciation and amortization 7,560 6,385 – – 13,945 Asset impairment 1,120 587 – – 1,707Equity share in net earnings (losses) of associates and joint
ventures (23) (15) 2,272 – 2,234Interest income 157 268 51 (112) 364 Financing costs – net 858 2,104 87 (112) 2,937Provision for income tax 4,219 1,168 37 – 5,424 Net income / Segment profit 11,118 2,552 5,079 – 18,749 EBITDA 23,764 11,104 (49) 701 35,520 EBITDA margin 43% 35% – – 44% Core income 11,207 2,550 5,171 – 18,928
December 31, 2015 (Audited)
Assets and liabilities
Operating assets 217,317 190,856 18,504 (42,226) 384,451 Investments in associates and joint ventures 2,208 12,922 33,573 – 48,703Deferred income tax assets – net 8,249 13,692 – – 21,941
Total assets 227,774 217,470 52,077 (42,226) 455,095
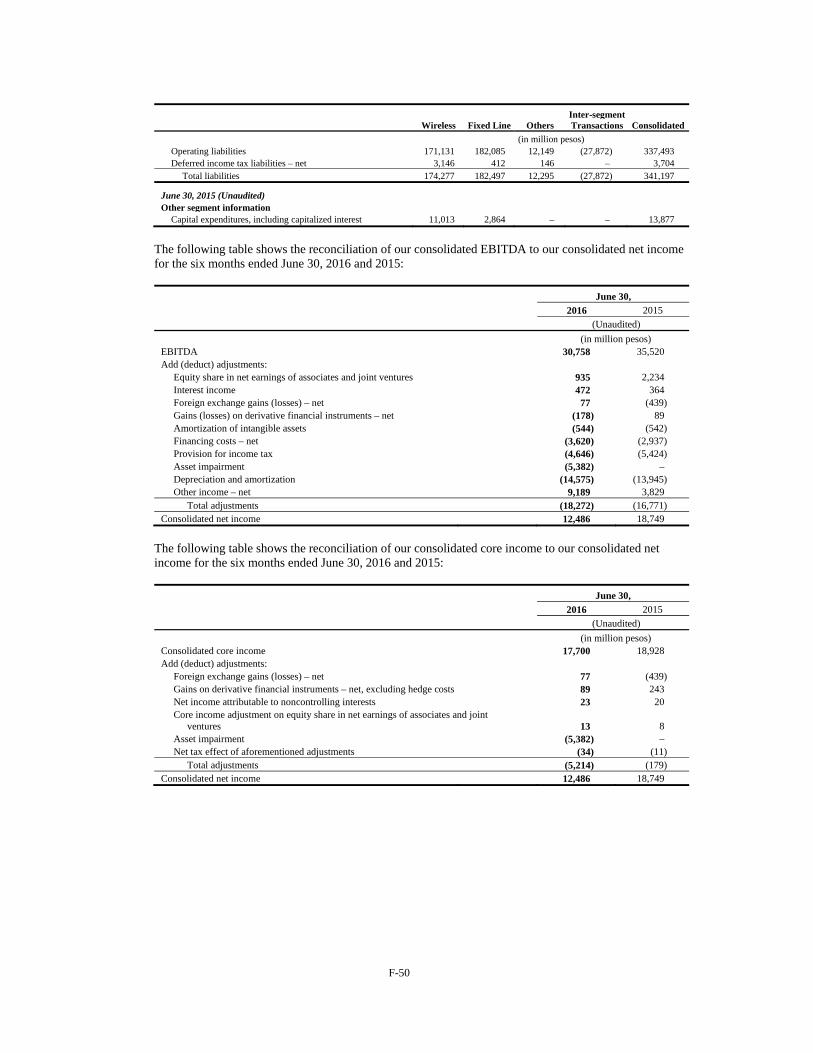
F-50
Wireless Fixed Line OthersInter-segment Transactions Consolidated
(in million pesos) Operating liabilities 171,131 182,085 12,149 (27,872) 337,493Deferred income tax liabilities – net 3,146 412 146 – 3,704
Total liabilities 174,277 182,497 12,295 (27,872) 341,197
June 30, 2015 (Unaudited) Other segment information
Capital expenditures, including capitalized interest 11,013 2,864 – – 13,877
The following table shows the reconciliation of our consolidated EBITDA to our consolidated net income for the six months ended June 30, 2016 and 2015:
June 30,
2016 2015
(Unaudited)
(in million pesos) EBITDA 30,758 35,520 Add (deduct) adjustments:
Equity share in net earnings of associates and joint ventures 935 2,234 Interest income 472 364 Foreign exchange gains (losses) – net 77 (439) Gains (losses) on derivative financial instruments – net (178) 89 Amortization of intangible assets (544) (542) Financing costs – net (3,620) (2,937) Provision for income tax (4,646) (5,424) Asset impairment (5,382) – Depreciation and amortization (14,575) (13,945) Other income – net 9,189 3,829
Total adjustments (18,272) (16,771) Consolidated net income 12,486 18,749
The following table shows the reconciliation of our consolidated core income to our consolidated net income for the six months ended June 30, 2016 and 2015:
June 30,
2016 2015
(Unaudited)
(in million pesos) Consolidated core income 17,700 18,928 Add (deduct) adjustments:
Foreign exchange gains (losses) – net 77 (439) Gains on derivative financial instruments – net, excluding hedge costs 89 243 Net income attributable to noncontrolling interests 23 20 Core income adjustment on equity share in net earnings of associates and joint
ventures 13 8 Asset impairment (5,382) – Net tax effect of aforementioned adjustments (34) (11)
Total adjustments (5,214) (179) Consolidated net income 12,486 18,749
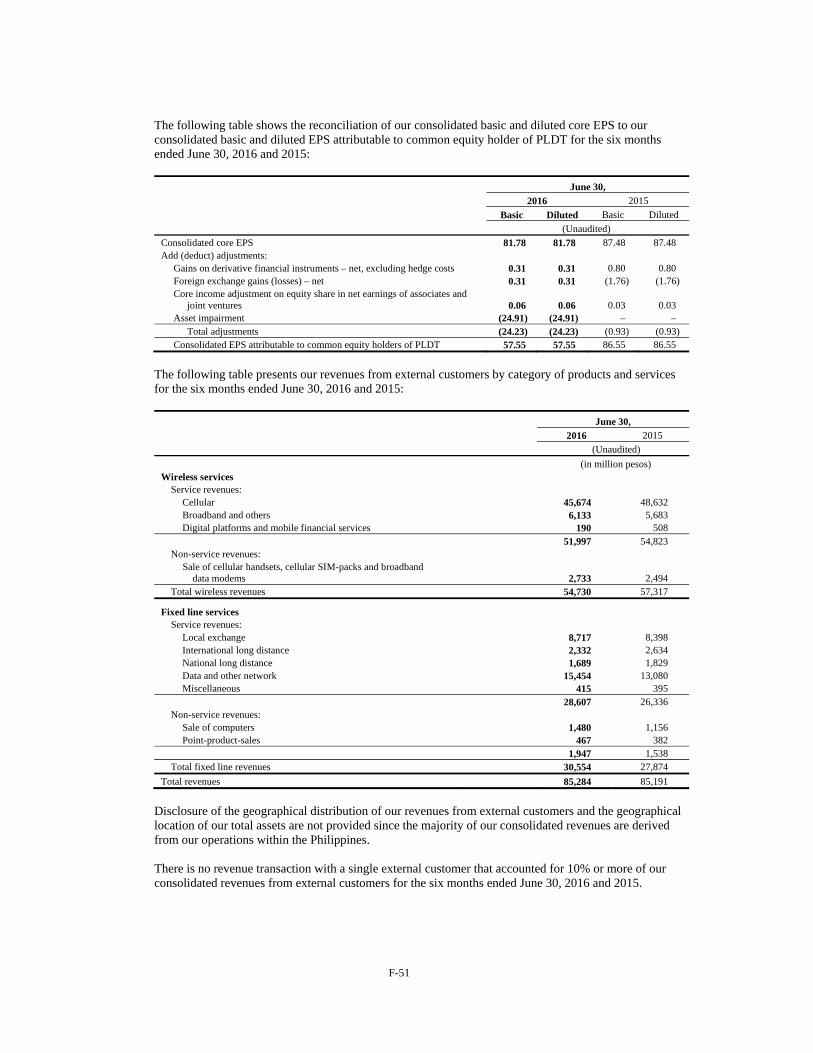
F-51
The following table shows the reconciliation of our consolidated basic and diluted core EPS to our consolidated basic and diluted EPS attributable to common equity holder of PLDT for the six months ended June 30, 2016 and 2015:
June 30,
2016 2015
Basic Diluted Basic Diluted
(Unaudited)
Consolidated core EPS 81.78 81.78 87.48 87.48 Add (deduct) adjustments:
Gains on derivative financial instruments – net, excluding hedge costs 0.31 0.31 0.80 0.80 Foreign exchange gains (losses) – net 0.31 0.31 (1.76) (1.76) Core income adjustment on equity share in net earnings of associates and
joint ventures 0.06 0.06 0.03 0.03 Asset impairment (24.91) (24.91) – –
Total adjustments (24.23) (24.23) (0.93) (0.93) Consolidated EPS attributable to common equity holders of PLDT 57.55 57.55 86.55 86.55
The following table presents our revenues from external customers by category of products and services for the six months ended June 30, 2016 and 2015:
June 30, 2016 2015
(Unaudited)
(in million pesos) Wireless services
Service revenues: Cellular 45,674 48,632 Broadband and others 6,133 5,683 Digital platforms and mobile financial services 190 508
51,997 54,823 Non-service revenues:
Sale of cellular handsets, cellular SIM-packs and broadband data modems 2,733 2,494
Total wireless revenues 54,730 57,317
Fixed line services Service revenues:
Local exchange 8,717 8,398 International long distance 2,332 2,634 National long distance 1,689 1,829 Data and other network 15,454 13,080 Miscellaneous 415 395 28,607 26,336
Non-service revenues: Sale of computers 1,480 1,156 Point-product-sales 467 382
1,947 1,538 Total fixed line revenues 30,554 27,874
Total revenues 85,284 85,191
Disclosure of the geographical distribution of our revenues from external customers and the geographical location of our total assets are not provided since the majority of our consolidated revenues are derived from our operations within the Philippines. There is no revenue transaction with a single external customer that accounted for 10% or more of our consolidated revenues from external customers for the six months ended June 30, 2016 and 2015.
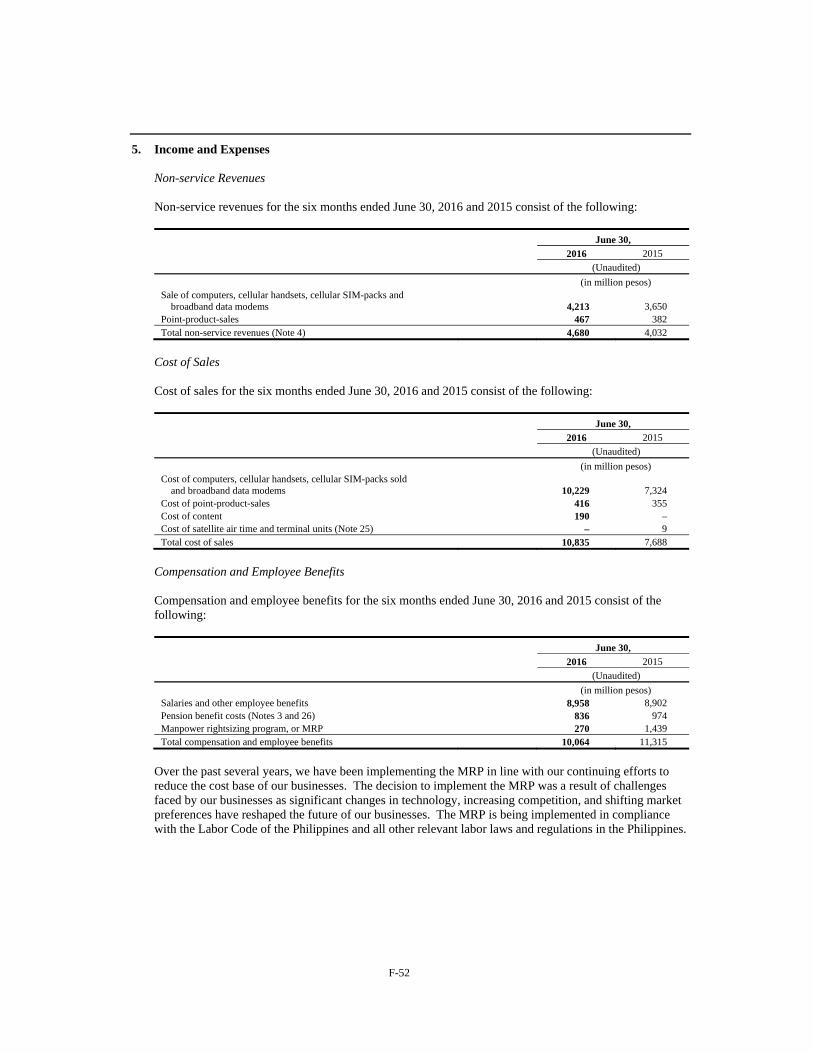
F-52
5. Income and Expenses
Non-service Revenues Non-service revenues for the six months ended June 30, 2016 and 2015 consist of the following:
June 30,
2016 2015
(Unaudited)
(in million pesos) Sale of computers, cellular handsets, cellular SIM-packs and
broadband data modems 4,213 3,650 Point-product-sales 467 382 Total non-service revenues (Note 4) 4,680 4,032
Cost of Sales Cost of sales for the six months ended June 30, 2016 and 2015 consist of the following:
June 30,
2016 2015
(Unaudited)
(in million pesos) Cost of computers, cellular handsets, cellular SIM-packs sold
and broadband data modems 10,229 7,324 Cost of point-product-sales 416 355 Cost of content 190 – Cost of satellite air time and terminal units (Note 25) – 9 Total cost of sales 10,835 7,688
Compensation and Employee Benefits Compensation and employee benefits for the six months ended June 30, 2016 and 2015 consist of the following:
June 30,
2016 2015
(Unaudited)
(in million pesos) Salaries and other employee benefits 8,958 8,902 Pension benefit costs (Notes 3 and 26) 836 974 Manpower rightsizing program, or MRP 270 1,439 Total compensation and employee benefits 10,064 11,315
Over the past several years, we have been implementing the MRP in line with our continuing efforts to reduce the cost base of our businesses. The decision to implement the MRP was a result of challenges faced by our businesses as significant changes in technology, increasing competition, and shifting market preferences have reshaped the future of our businesses. The MRP is being implemented in compliance with the Labor Code of the Philippines and all other relevant labor laws and regulations in the Philippines.
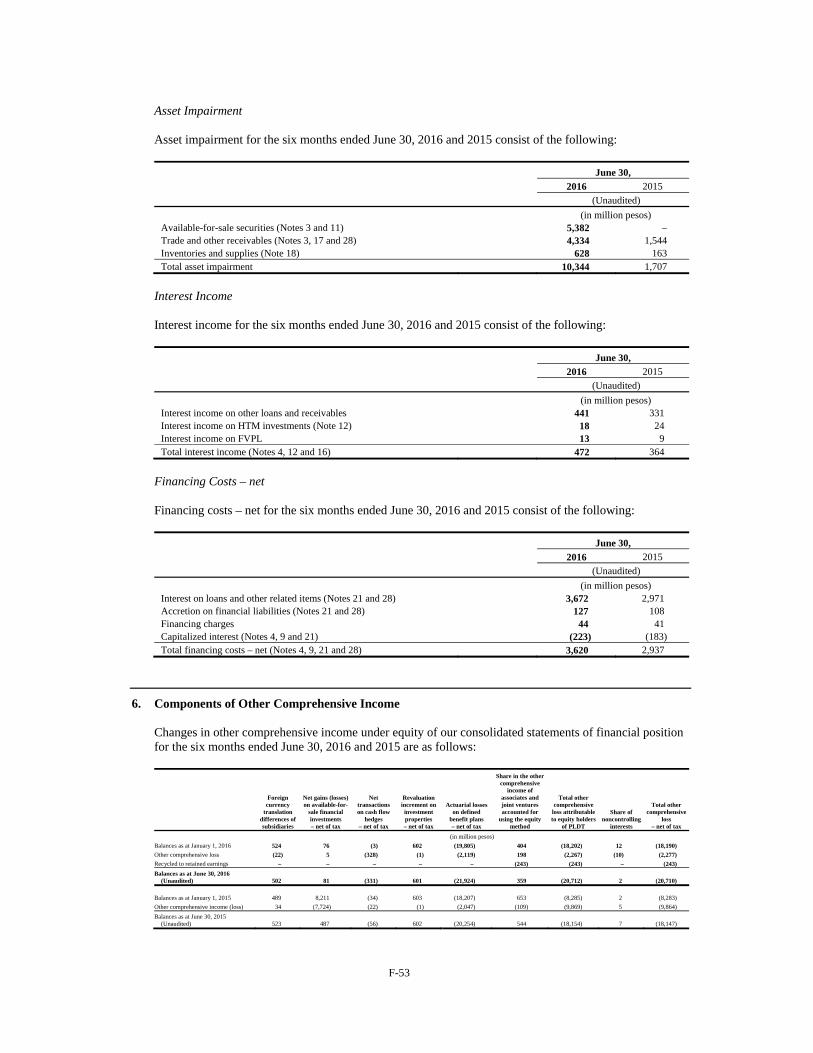
F-53
Asset Impairment Asset impairment for the six months ended June 30, 2016 and 2015 consist of the following:
June 30,
2016 2015
(Unaudited)
(in million pesos) Available-for-sale securities (Notes 3 and 11) 5,382 – Trade and other receivables (Notes 3, 17 and 28) 4,334 1,544 Inventories and supplies (Note 18) 628 163 Total asset impairment 10,344 1,707
Interest Income Interest income for the six months ended June 30, 2016 and 2015 consist of the following:
June 30,
2016 2015
(Unaudited)
(in million pesos) Interest income on other loans and receivables 441 331 Interest income on HTM investments (Note 12) 18 24 Interest income on FVPL 13 9 Total interest income (Notes 4, 12 and 16) 472 364
Financing Costs – net Financing costs – net for the six months ended June 30, 2016 and 2015 consist of the following:
June 30,
2016 2015
(Unaudited)
(in million pesos) Interest on loans and other related items (Notes 21 and 28) 3,672 2,971 Accretion on financial liabilities (Notes 21 and 28) 127 108 Financing charges 44 41 Capitalized interest (Notes 4, 9 and 21) (223) (183) Total financing costs – net (Notes 4, 9, 21 and 28) 3,620 2,937
6. Components of Other Comprehensive Income
Changes in other comprehensive income under equity of our consolidated statements of financial position for the six months ended June 30, 2016 and 2015 are as follows:
Foreign currency
translation differences of subsidiaries
Net gains (losses) on available-for-
sale financial investments – net of tax
Net transactions on cash flow
hedges – net of tax
Revaluation increment on investment properties – net of tax
Actuarial losses on defined
benefit plans – net of tax
Share in the other comprehensive
income of associates and joint ventures accounted for
using the equity method
Total other comprehensive
loss attributable to equity holders
of PLDT
Share of noncontrolling
interests
Total other comprehensive
loss – net of tax
(in million pesos)
Balances as at January 1, 2016 524 76 (3) 602 (19,805) 404 (18,202) 12 (18,190)
Other comprehensive loss (22) 5 (328) (1) (2,119) 198 (2,267) (10) (2,277)
Recycled to retained earnings – – – – – (243) (243) – (243)
Balances as at June 30, 2016 (Unaudited) 502 81 (331) 601 (21,924) 359 (20,712) 2 (20,710)
Balances as at January 1, 2015 489 8,211 (34) 603 (18,207) 653 (8,285) 2 (8,283)
Other comprehensive income (loss) 34 (7,724) (22) (1) (2,047) (109) (9,869) 5 (9,864)
Balances as at June 30, 2015 (Unaudited) 523 487 (56) 602 (20,254) 544 (18,154) 7 (18,147)
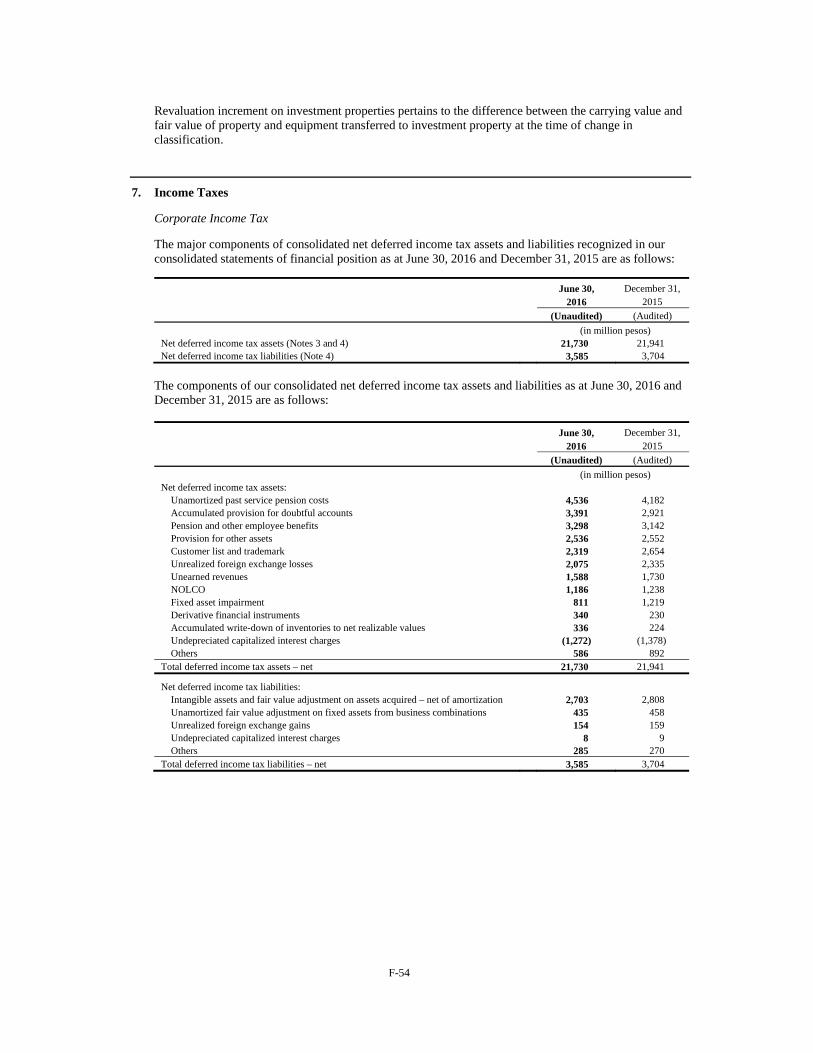
F-54
Revaluation increment on investment properties pertains to the difference between the carrying value and fair value of property and equipment transferred to investment property at the time of change in classification.
7. Income Taxes
Corporate Income Tax
The major components of consolidated net deferred income tax assets and liabilities recognized in our consolidated statements of financial position as at June 30, 2016 and December 31, 2015 are as follows:
June 30, December 31, 2016 2015
(Unaudited) (Audited)
(in million pesos) Net deferred income tax assets (Notes 3 and 4) 21,730 21,941 Net deferred income tax liabilities (Note 4) 3,585 3,704
The components of our consolidated net deferred income tax assets and liabilities as at June 30, 2016 and December 31, 2015 are as follows:
June 30, December 31, 2016 2015
(Unaudited) (Audited)
(in million pesos) Net deferred income tax assets:
Unamortized past service pension costs 4,536 4,182 Accumulated provision for doubtful accounts 3,391 2,921 Pension and other employee benefits 3,298 3,142 Provision for other assets 2,536 2,552 Customer list and trademark 2,319 2,654 Unrealized foreign exchange losses 2,075 2,335 Unearned revenues 1,588 1,730 NOLCO 1,186 1,238 Fixed asset impairment 811 1,219 Derivative financial instruments 340 230 Accumulated write-down of inventories to net realizable values 336 224 Undepreciated capitalized interest charges (1,272) (1,378) Others 586 892
Total deferred income tax assets – net 21,730 21,941
Net deferred income tax liabilities: Intangible assets and fair value adjustment on assets acquired – net of amortization 2,703 2,808 Unamortized fair value adjustment on fixed assets from business combinations 435 458 Unrealized foreign exchange gains 154 159 Undepreciated capitalized interest charges 8 9 Others 285 270
Total deferred income tax liabilities – net 3,585 3,704
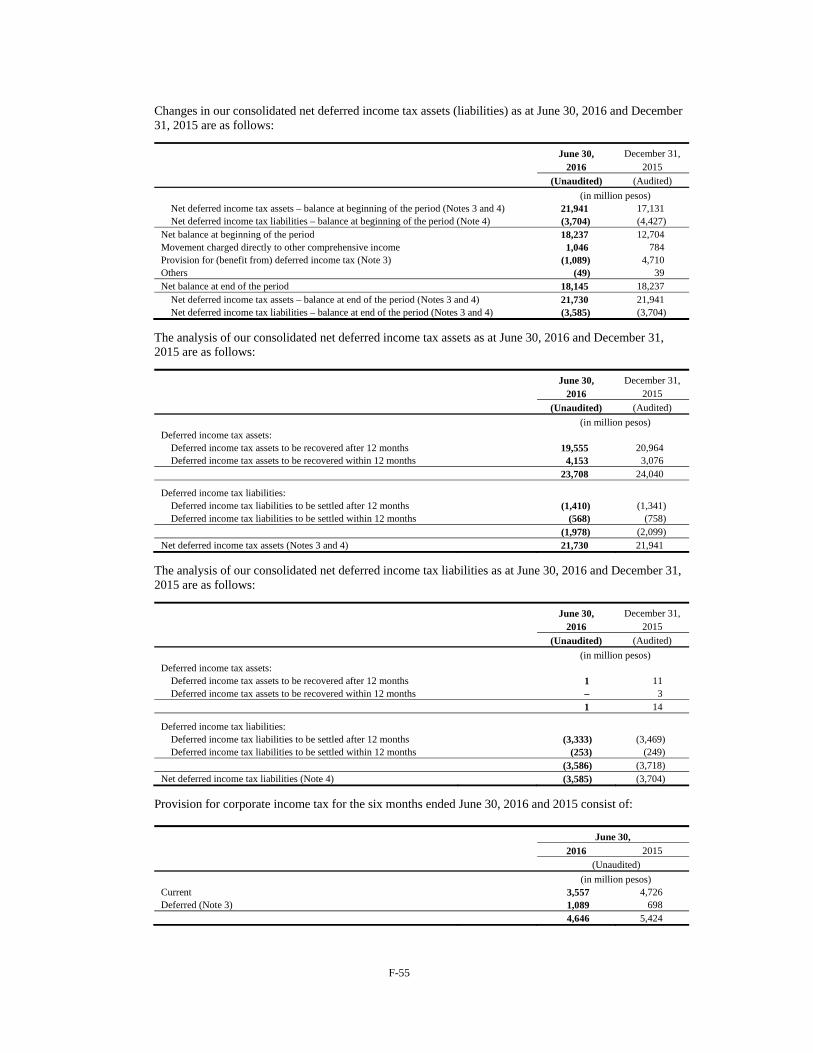
F-55
Changes in our consolidated net deferred income tax assets (liabilities) as at June 30, 2016 and December 31, 2015 are as follows:
June 30, December 31, 2016 2015
(Unaudited) (Audited)
(in million pesos) Net deferred income tax assets – balance at beginning of the period (Notes 3 and 4) 21,941 17,131 Net deferred income tax liabilities – balance at beginning of the period (Note 4) (3,704) (4,427)
Net balance at beginning of the period 18,237 12,704 Movement charged directly to other comprehensive income 1,046 784 Provision for (benefit from) deferred income tax (Note 3) (1,089) 4,710 Others (49) 39 Net balance at end of the period 18,145 18,237
Net deferred income tax assets – balance at end of the period (Notes 3 and 4) 21,730 21,941 Net deferred income tax liabilities – balance at end of the period (Notes 3 and 4) (3,585) (3,704)
The analysis of our consolidated net deferred income tax assets as at June 30, 2016 and December 31, 2015 are as follows:
June 30, December 31, 2016 2015
(Unaudited) (Audited)
(in million pesos) Deferred income tax assets:
Deferred income tax assets to be recovered after 12 months 19,555 20,964 Deferred income tax assets to be recovered within 12 months 4,153 3,076
23,708 24,040
Deferred income tax liabilities: Deferred income tax liabilities to be settled after 12 months (1,410) (1,341) Deferred income tax liabilities to be settled within 12 months (568) (758)
(1,978) (2,099) Net deferred income tax assets (Notes 3 and 4) 21,730 21,941
The analysis of our consolidated net deferred income tax liabilities as at June 30, 2016 and December 31, 2015 are as follows:
June 30, December 31, 2016 2015
(Unaudited) (Audited)
(in million pesos) Deferred income tax assets:
Deferred income tax assets to be recovered after 12 months 1 11 Deferred income tax assets to be recovered within 12 months – 3 1 14
Deferred income tax liabilities: Deferred income tax liabilities to be settled after 12 months (3,333) (3,469) Deferred income tax liabilities to be settled within 12 months (253) (249)
(3,586) (3,718) Net deferred income tax liabilities (Note 4) (3,585) (3,704)
Provision for corporate income tax for the six months ended June 30, 2016 and 2015 consist of:
June 30,
2016 2015
(Unaudited)
(in million pesos) Current 3,557 4,726 Deferred (Note 3) 1,089 698
4,646 5,424
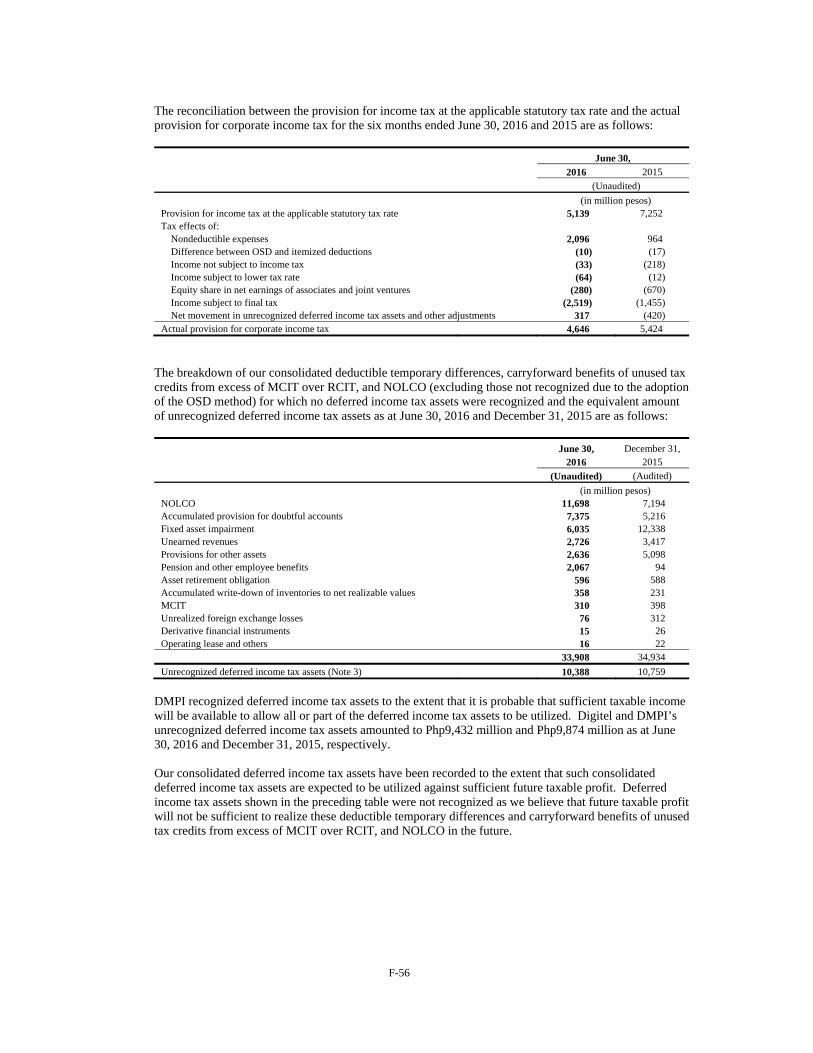
F-56
The reconciliation between the provision for income tax at the applicable statutory tax rate and the actual provision for corporate income tax for the six months ended June 30, 2016 and 2015 are as follows:
June 30,
2016 2015
(Unaudited)
(in million pesos) Provision for income tax at the applicable statutory tax rate 5,139 7,252 Tax effects of:
Nondeductible expenses 2,096 964 Difference between OSD and itemized deductions (10) (17) Income not subject to income tax (33) (218) Income subject to lower tax rate (64) (12) Equity share in net earnings of associates and joint ventures (280) (670) Income subject to final tax (2,519) (1,455) Net movement in unrecognized deferred income tax assets and other adjustments 317 (420)
Actual provision for corporate income tax 4,646 5,424
The breakdown of our consolidated deductible temporary differences, carryforward benefits of unused tax credits from excess of MCIT over RCIT, and NOLCO (excluding those not recognized due to the adoption of the OSD method) for which no deferred income tax assets were recognized and the equivalent amount of unrecognized deferred income tax assets as at June 30, 2016 and December 31, 2015 are as follows:
June 30, December 31, 2016 2015
(Unaudited) (Audited)
(in million pesos) NOLCO 11,698 7,194 Accumulated provision for doubtful accounts 7,375 5,216 Fixed asset impairment 6,035 12,338 Unearned revenues 2,726 3,417 Provisions for other assets 2,636 5,098 Pension and other employee benefits 2,067 94 Asset retirement obligation 596 588 Accumulated write-down of inventories to net realizable values 358 231 MCIT 310 398 Unrealized foreign exchange losses 76 312 Derivative financial instruments 15 26 Operating lease and others 16 22
33,908 34,934
Unrecognized deferred income tax assets (Note 3) 10,388 10,759
DMPI recognized deferred income tax assets to the extent that it is probable that sufficient taxable income will be available to allow all or part of the deferred income tax assets to be utilized. Digitel and DMPI’s unrecognized deferred income tax assets amounted to Php9,432 million and Php9,874 million as at June 30, 2016 and December 31, 2015, respectively. Our consolidated deferred income tax assets have been recorded to the extent that such consolidated deferred income tax assets are expected to be utilized against sufficient future taxable profit. Deferred income tax assets shown in the preceding table were not recognized as we believe that future taxable profit will not be sufficient to realize these deductible temporary differences and carryforward benefits of unused tax credits from excess of MCIT over RCIT, and NOLCO in the future.
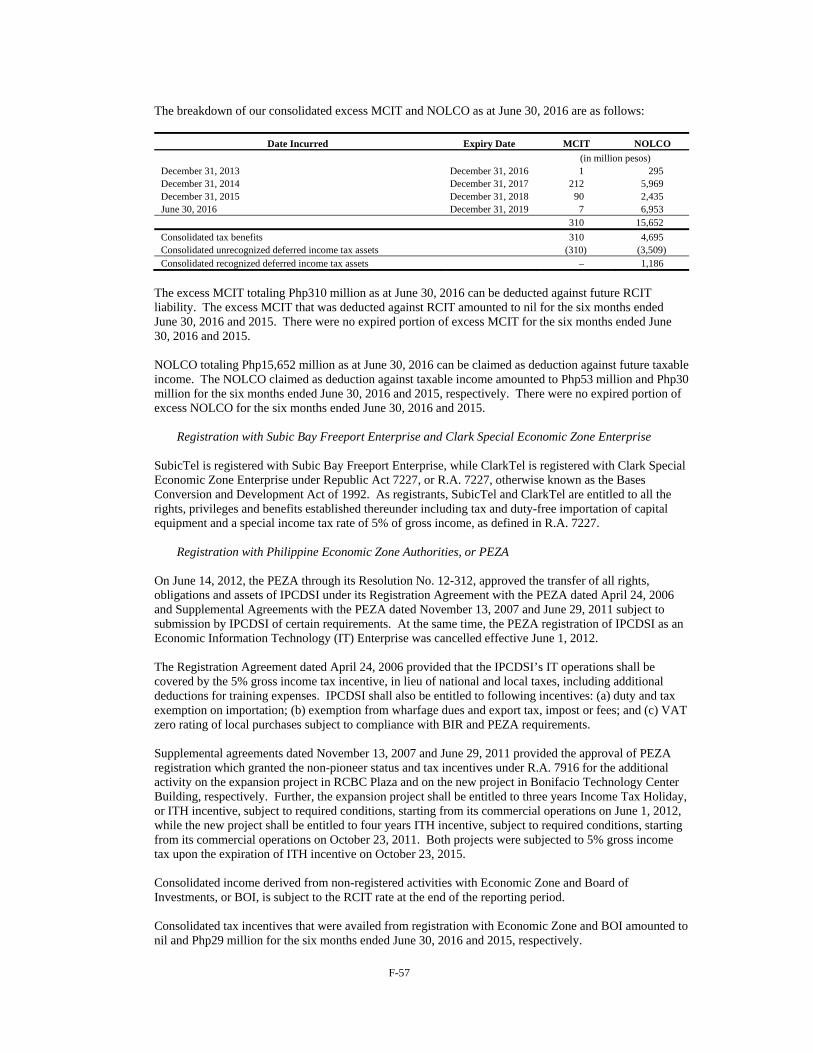
F-57
The breakdown of our consolidated excess MCIT and NOLCO as at June 30, 2016 are as follows:
Date Incurred Expiry Date MCIT NOLCO
(in million pesos) December 31, 2013 December 31, 2016 1 295 December 31, 2014 December 31, 2017 212 5,969 December 31, 2015 December 31, 2018 90 2,435 June 30, 2016 December 31, 2019 7 6,953
310 15,652
Consolidated tax benefits 310 4,695 Consolidated unrecognized deferred income tax assets (310) (3,509) Consolidated recognized deferred income tax assets – 1,186
The excess MCIT totaling Php310 million as at June 30, 2016 can be deducted against future RCIT liability. The excess MCIT that was deducted against RCIT amounted to nil for the six months ended June 30, 2016 and 2015. There were no expired portion of excess MCIT for the six months ended June 30, 2016 and 2015.
NOLCO totaling Php15,652 million as at June 30, 2016 can be claimed as deduction against future taxable income. The NOLCO claimed as deduction against taxable income amounted to Php53 million and Php30 million for the six months ended June 30, 2016 and 2015, respectively. There were no expired portion of excess NOLCO for the six months ended June 30, 2016 and 2015.
Registration with Subic Bay Freeport Enterprise and Clark Special Economic Zone Enterprise
SubicTel is registered with Subic Bay Freeport Enterprise, while ClarkTel is registered with Clark Special Economic Zone Enterprise under Republic Act 7227, or R.A. 7227, otherwise known as the Bases Conversion and Development Act of 1992. As registrants, SubicTel and ClarkTel are entitled to all the rights, privileges and benefits established thereunder including tax and duty-free importation of capital equipment and a special income tax rate of 5% of gross income, as defined in R.A. 7227.
Registration with Philippine Economic Zone Authorities, or PEZA
On June 14, 2012, the PEZA through its Resolution No. 12-312, approved the transfer of all rights, obligations and assets of IPCDSI under its Registration Agreement with the PEZA dated April 24, 2006 and Supplemental Agreements with the PEZA dated November 13, 2007 and June 29, 2011 subject to submission by IPCDSI of certain requirements. At the same time, the PEZA registration of IPCDSI as an Economic Information Technology (IT) Enterprise was cancelled effective June 1, 2012. The Registration Agreement dated April 24, 2006 provided that the IPCDSI’s IT operations shall be covered by the 5% gross income tax incentive, in lieu of national and local taxes, including additional deductions for training expenses. IPCDSI shall also be entitled to following incentives: (a) duty and tax exemption on importation; (b) exemption from wharfage dues and export tax, impost or fees; and (c) VAT zero rating of local purchases subject to compliance with BIR and PEZA requirements. Supplemental agreements dated November 13, 2007 and June 29, 2011 provided the approval of PEZA registration which granted the non-pioneer status and tax incentives under R.A. 7916 for the additional activity on the expansion project in RCBC Plaza and on the new project in Bonifacio Technology Center Building, respectively. Further, the expansion project shall be entitled to three years Income Tax Holiday, or ITH incentive, subject to required conditions, starting from its commercial operations on June 1, 2012, while the new project shall be entitled to four years ITH incentive, subject to required conditions, starting from its commercial operations on October 23, 2011. Both projects were subjected to 5% gross income tax upon the expiration of ITH incentive on October 23, 2015. Consolidated income derived from non-registered activities with Economic Zone and Board of Investments, or BOI, is subject to the RCIT rate at the end of the reporting period.
Consolidated tax incentives that were availed from registration with Economic Zone and BOI amounted to nil and Php29 million for the six months ended June 30, 2016 and 2015, respectively.
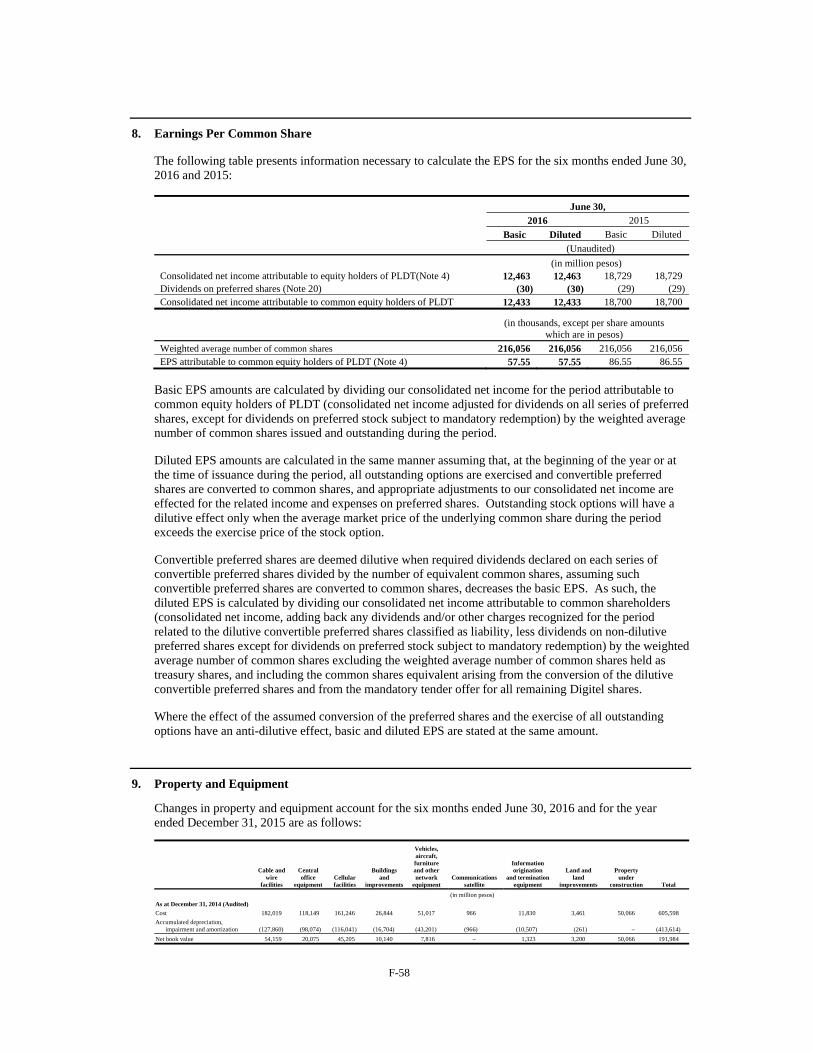
F-58
8. Earnings Per Common Share
The following table presents information necessary to calculate the EPS for the six months ended June 30, 2016 and 2015:
June 30,
2016 2015
Basic Diluted Basic Diluted
(Unaudited)
(in million pesos) Consolidated net income attributable to equity holders of PLDT(Note 4) 12,463 12,463 18,729 18,729 Dividends on preferred shares (Note 20) (30) (30) (29) (29)Consolidated net income attributable to common equity holders of PLDT 12,433 12,433 18,700 18,700
(in thousands, except per share amounts which are in pesos)
Weighted average number of common shares 216,056 216,056 216,056 216,056 EPS attributable to common equity holders of PLDT (Note 4) 57.55 57.55 86.55 86.55
Basic EPS amounts are calculated by dividing our consolidated net income for the period attributable to common equity holders of PLDT (consolidated net income adjusted for dividends on all series of preferred shares, except for dividends on preferred stock subject to mandatory redemption) by the weighted average number of common shares issued and outstanding during the period.
Diluted EPS amounts are calculated in the same manner assuming that, at the beginning of the year or at the time of issuance during the period, all outstanding options are exercised and convertible preferred shares are converted to common shares, and appropriate adjustments to our consolidated net income are effected for the related income and expenses on preferred shares. Outstanding stock options will have a dilutive effect only when the average market price of the underlying common share during the period exceeds the exercise price of the stock option.
Convertible preferred shares are deemed dilutive when required dividends declared on each series of convertible preferred shares divided by the number of equivalent common shares, assuming such convertible preferred shares are converted to common shares, decreases the basic EPS. As such, the diluted EPS is calculated by dividing our consolidated net income attributable to common shareholders (consolidated net income, adding back any dividends and/or other charges recognized for the period related to the dilutive convertible preferred shares classified as liability, less dividends on non-dilutive preferred shares except for dividends on preferred stock subject to mandatory redemption) by the weighted average number of common shares excluding the weighted average number of common shares held as treasury shares, and including the common shares equivalent arising from the conversion of the dilutive convertible preferred shares and from the mandatory tender offer for all remaining Digitel shares.
Where the effect of the assumed conversion of the preferred shares and the exercise of all outstanding options have an anti-dilutive effect, basic and diluted EPS are stated at the same amount.
9. Property and Equipment
Changes in property and equipment account for the six months ended June 30, 2016 and for the year ended December 31, 2015 are as follows:
Cable and wire
facilities
Central office
equipment Cellular facilities
Buildings and
improvements
Vehicles, aircraft, furniture and other network
equipment Communications
satellite
Information origination
and termination equipment
Land and land
improvements
Property under
construction Total
(in million pesos)
As at December 31, 2014 (Audited)
Cost 182,019 118,149 161,246 26,844 51,017 966 11,830 3,461 50,066 605,598
Accumulated depreciation, impairment and amortization (127,860) (98,074) (116,041) (16,704) (43,201) (966) (10,507) (261) – (413,614)
Net book value 54,159 20,075 45,205 10,140 7,816 – 1,323 3,200 50,066 191,984
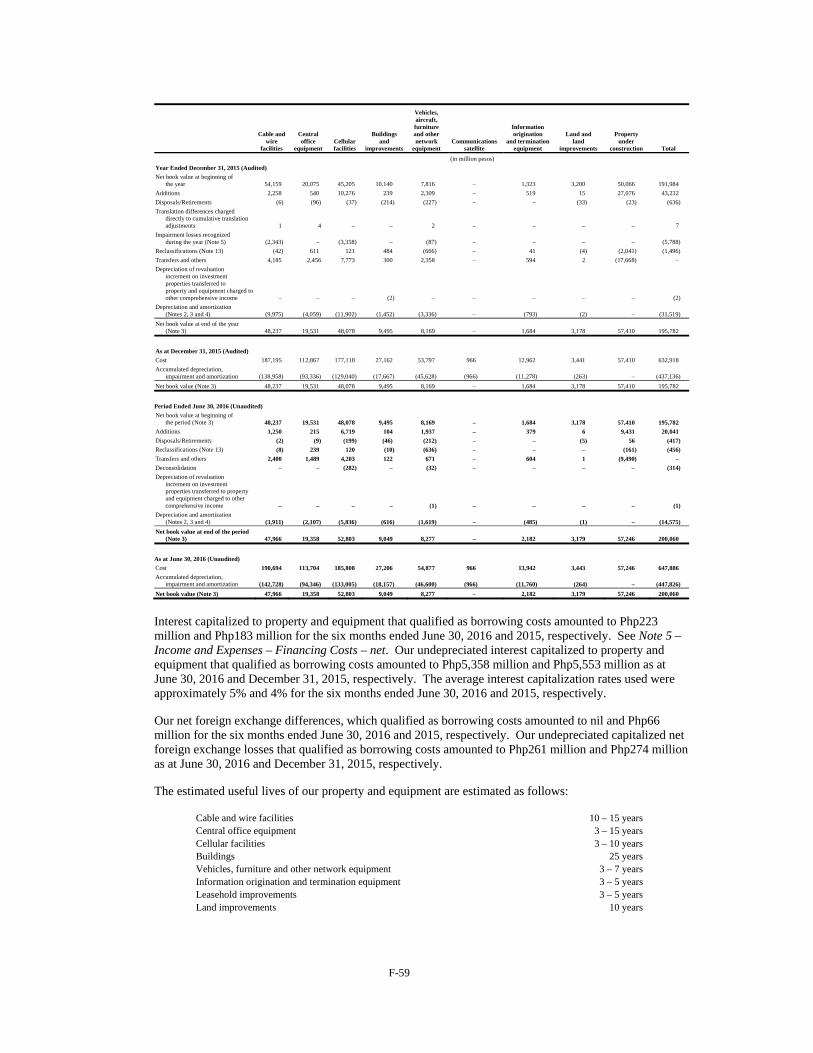
F-59
Cable and wire
facilities
Central office
equipment Cellular facilities
Buildings and
improvements
Vehicles, aircraft, furniture and other network
equipment Communications
satellite
Information origination
and termination equipment
Land and land
improvements
Property under
construction Total
(in million pesos)
Year Ended December 31, 2015 (Audited)
Net book value at beginning of the year 54,159 20,075 45,205 10,140 7,816 – 1,323 3,200 50,066 191,984
Additions 2,258 540 10,276 239 2,309 – 519 15 27,076 43,232
Disposals/Retirements (6) (96) (37) (214) (227) – – (33) (23) (636)
Translation differences charged directly to cumulative translation adjustments 1 4 – – 2 – – – – 7
Impairment losses recognized during the year (Note 5) (2,343) – (3,358) – (87) – – – – (5,788)
Reclassifications (Note 13) (42) 611 121 484 (666) – 41 (4) (2,041) (1,496)
Transfers and others 4,185 2,456 7,773 300 2,358 – 594 2 (17,668) –
Depreciation of revaluation increment on investment properties transferred to property and equipment charged to other comprehensive income – – – (2) – – – – – (2)
Depreciation and amortization (Notes 2, 3 and 4) (9,975) (4,059) (11,902) (1,452) (3,336) – (793) (2) – (31,519)
Net book value at end of the year (Note 3) 48,237 19,531 48,078 9,495 8,169 – 1,684 3,178 57,410
195,782
As at December 31, 2015 (Audited)
Cost 187,195 112,867 177,118 27,162 53,797 966 12,962 3,441 57,410 632,918
Accumulated depreciation, impairment and amortization (138,958) (93,336) (129,040) (17,667) (45,628) (966) (11,278) (263) – (437,136)
Net book value (Note 3) 48,237 19,531 48,078 9,495 8,169 – 1,684 3,178 57,410 195,782
Period Ended June 30, 2016 (Unaudited)
Net book value at beginning of the period (Note 3) 48,237 19,531 48,078 9,495 8,169 – 1,684 3,178 57,410 195,782
Additions 1,250 215 6,719 104 1,937 – 379 6 9,431 20,041
Disposals/Retirements (2) (9) (199) (46) (212) – – (5) 56 (417)
Reclassifications (Note 13) (8) 239 120 (10) (636) – – – (161) (456)
Transfers and others 2,400 1,489 4,203 122 671 – 604 1 (9,490) –
Deconsolidation – – (282) – (32) – – – – (314)
Depreciation of revaluation increment on investment properties transferred to property and equipment charged to other comprehensive income – – – – (1) – – – – (1)
Depreciation and amortization (Notes 2, 3 and 4) (3,911) (2,107) (5,836) (616) (1,619) – (485) (1) – (14,575)
Net book value at end of the period (Note 3) 47,966 19,358 52,803 9,049 8,277 – 2,182 3,179 57,246 200,060
As at June 30, 2016 (Unaudited)
Cost 190,694 113,704 185,808 27,206 54,877 966 13,942 3,443 57,246 647,886
Accumulated depreciation, impairment and amortization (142,728) (94,346) (133,005) (18,157) (46,600) (966) (11,760) (264) – (447,826)
Net book value (Note 3) 47,966 19,358 52,803 9,049 8,277 – 2,182 3,179 57,246 200,060
Interest capitalized to property and equipment that qualified as borrowing costs amounted to Php223 million and Php183 million for the six months ended June 30, 2016 and 2015, respectively. See Note 5 – Income and Expenses – Financing Costs – net. Our undepreciated interest capitalized to property and equipment that qualified as borrowing costs amounted to Php5,358 million and Php5,553 million as at June 30, 2016 and December 31, 2015, respectively. The average interest capitalization rates used were approximately 5% and 4% for the six months ended June 30, 2016 and 2015, respectively. Our net foreign exchange differences, which qualified as borrowing costs amounted to nil and Php66 million for the six months ended June 30, 2016 and 2015, respectively. Our undepreciated capitalized net foreign exchange losses that qualified as borrowing costs amounted to Php261 million and Php274 million as at June 30, 2016 and December 31, 2015, respectively. The estimated useful lives of our property and equipment are estimated as follows:
Cable and wire facilities 10 – 15 years Central office equipment 3 – 15 years Cellular facilities 3 – 10 years Buildings 25 years Vehicles, furniture and other network equipment 3 – 7 years Information origination and termination equipment 3 – 5 years Leasehold improvements 3 – 5 years Land improvements 10 years
F-60
Property and equipment include the net carrying value of capitalized vehicles, aircraft, furniture and other network equipment under financing leases, which amounted to Php1 million and Php3 million as at June 30, 2016 and December 31, 2015, respectively. See Note 21 – Interest-bearing Financial Liabilities – Obligations under Finance Leases. Impairment of Certain Network Equipment and Facilities In December 2015, DMPI recognized an impairment loss of Php5,789 million pertaining to network assets affected by the convergence program of Smart and DMPI. Network assets impaired in 2015 consist mainly of core and transport equipment in Metro Manila and Cebu, which were not included in the initial program as management’s original strategy was to minimize the risk of service disruption for Sun subscribers in critical and high traffic areas. We decided to change the strategy for network convergence, that is, to fully integrate the networks of Smart and DMPI, as management believes that the converged network will be resilient enough to address any risk of service disruption in the critical and high traffic areas. Moreover, the converged network will allow optimization of network resources that will result in improved customer experience for both Sun and Smart subscribers. See Note 3 – Management’s Use of Accounting Judgments, Estimates and Assumptions – Impairment of non-financial assets.
10. Investments in Associates and Joint Ventures
As at June 30, 2016 and December 31, 2015, this account consists of:
June 30, December 31, 2016 2015
(Unaudited) (Audited)
(in million pesos) Carrying value of investments in associates:
MediaQuest PDRs (Notes 3 and 26) 12,633 12,749 Asia Outsourcing Beta Limited, or Beta 705 654 AF Payments, Inc., or AFPI, (formerly Automated Fare Collection System, Inc.)(*) 470 533 Phunware (Note 3) 384 384 Appcard (Note 3) 234 231 Digitel Crossing, Inc., or DCI 200 173 ACeS International Limited, or AIL – – Asia Netcom Philippines Corp., or ANPC – –
14,626 14,724 Carrying value of investments in joint ventures:
Vega Telecom, Inc., or VTI 26,383 – Beacon Electric Asset Holdings, Inc., or Beacon 16,048 32,304 Philippines Internet Holding S.à.r.l., or PHIH 1,591 1,595 ECommerce Pay Holding S.à.r.l. (formerly mePay Global) 541 80
44,563 33,979 Deposit for future stock subscription:
Beacon preferred shares 3,500 – Total carrying value of investments in associates and joint ventures (Note 4) 62,689 48,703
(*) On February 26, 2015, AFPI through its Board of Directors and stockholders amended its corporate name to AF Payments, Inc.
F-61
Changes in the cost of investments for the six months ended June 30, 2016 and for the year ended December 31, 2015 are as follows:
June 30, December 31, 2016 2015
(Unaudited) (Audited)
(in million pesos) Balance at beginning of the period 41,150 37,724 Additions during the period 30,639 3,413 Disposals (11,612) 13 Balance at end of the period 60,177 41,150
Changes in the accumulated impairment losses for the six months ended June 30, 2016 and for the year ended December 31, 2015 are as follows:
June 30, December 31, 2016 2015
(Unaudited) (Audited)
(in million pesos) Balance at beginning of the period 1,888 1,884 Translation and other adjustments – 4 Balance at end of the period 1,888 1,888
Changes in the accumulated equity share in net earnings of associates and joint ventures for the six months ended June 30, 2016 and for the year ended December 31, 2015 are as follows:
June 30, December 31, 2016 2015
(Unaudited) (Audited)
(in million pesos) Balance at beginning of the period 9,441 6,206 Realized portion of deferred gain on the transfer of Beacon and Manila Electric Company,
or Meralco, shares 4,962 2,838 Equity share in net earnings (losses) of associates and joint ventures (Note 4): 935 3,241
Beacon 1,332 3,205 Beta 51 79 DCI 27 114 PHIH (4) – AFPI (63) (81) MediaQuest PDRs (116) (76) mePay Global (142) – VTI (150) –
Share in the other comprehensive loss of associates and joint ventures accounted for using the equity method (45) (249)
Dividends (1,215) (2,544) Disposals (9,678) – Translation and other adjustments – (51) Balance at end of the period 4,400 9,441
Investments in Associates
Investment in MediaQuest PDRs
In 2012, ePLDT made deposits totaling Php6 billion to MediaQuest, an entity wholly-owned by the PLDT Beneficial Trust Fund for the issuance of PDRs by MediaQuest in relation to its indirect interest in Cignal TV. Cignal TV is a wholly-owned subsidiary of Satventures, which is a wholly-owned subsidiary of MediaQuest. The Cignal TV PDRs confer an economic interest in common shares of Cignal TV indirectly owned by MediaQuest, and when issued, will provide ePLDT with a 40% economic interest in Cignal TV. Cignal TV operates a direct-to-home, or DTH, Pay-TV business under the brand name “Cignal TV”, which is the largest DTH Pay-TV operator in the Philippines.
F-62
In June 2013, ePLDT’s Board of Directors approved additional investments in PDRs of MediaQuest:
a Php3.6 billion investment by ePLDT in PDRs to be issued by MediaQuest in relation to its
interest in Satventures. The Satventures PDRs confer an economic interest in common shares of Satventures owned by MediaQuest and provide ePLDT with a 40% economic interest in Satventures; and
a Php1.95 billion investment by ePLDT in PDRs to be issued by MediaQuest in relation to its
interest in Hastings. The Hastings PDRs confer an economic interest in common shares of Hastings owned by MediaQuest. Hastings is a wholly-owned subsidiary of MediaQuest and holds all the print-related investments of MediaQuest, including equity interests in the three leading newspapers: The Philippine Star, Philippine Daily Inquirer, and Business World. See Note 26 – Employee Benefits – Unlisted Equity Investments – Investment in MediaQuest.
The Php6 billion Cignal TV PDRs and Php3.6 billion Satventures PDRs were issued on September 27, 2013. These PDRs provided ePLDT an aggregate of 64% economic interest in Cignal TV.
On February 19, 2014, ePLDT’s Board of Directors approved an additional investment of up to Php500 million in Hastings PDRs to be issued by MediaQuest. On March 11, 2014, MediaQuest received from ePLDT an amount aggregating to Php300 million representing deposits for future PDRs subscription. As at December 31, 2014, total deposit for PDRs subscription amounted to Php2,250 million.
On May 21, 2015, ePLDT’s Board of Directors approved an additional Php800 million investment in Hastings PDRs and settlement of the Php200 million balance of the Php500 million Hastings PDR investment in 2014. Subsequently, on May 30, 2015, the Board of Trustees of the Beneficial Trust Fund and the Board of Directors of MediaQuest approved the issuance of Php3,250 million Hastings PDRs. This provided ePLDT with 70% economic interest in Hastings. See Note 26 – Employee Benefits – Investment in MediaQuest.
The carrying value of investment in MediaQuest PDRs amounted to Php12,633 million and Php12,749 million as at June 30, 2016 and December 31, 2015, respectively. See Note 3 – Management’s Use of Accounting Judgments, Estimates and Assumptions – Accounting for investments in MediaQuest through PDRs.
The PLDT Group’s financial investment in PDRs of MediaQuest is part of the PLDT Group’s overall strategy of broadening its distribution platforms and increasing the PLDT Group’s ability to deliver multi-media content to its customers across the PLDT Group’s broadband and mobile networks.
Investment of PGIC in Beta
On February 5, 2013, PLDT entered into a Subscription and Shareholders’ Agreement with Asia Outsourcing Alpha Limited, or Alpha, and Beta, wherein PLDT, through its indirect subsidiary PGIC, acquired from Alpha approximately 20% equity interest in Beta for a total cost of approximately US$40 million, which consists of preferred shares of US$39.8 million and ordinary shares of US$0.2 million. On various dates in 2013 and 2014, PGIC transferred a total of 85 ordinary shares and 31,426 preferred shares to certain employees of Beta for a total consideration of US$53 thousand. The equity interest of PGIC in Beta remained at 20% after the transfer with economic interest of 18.32%.
Alpha and Beta are both exempted limited liability companies incorporated under the laws of Cayman Islands and are both controlled by CVC Capital Partners. Beta has been designated to be the holding company of the SPi Technologies, Inc. and Subsidiaries. On October 1, 2014, Asia Outsourcing Gamma Limited, or AOGL,’s healthcare business, which provides revenue cycle management, health information management and software solutions for independent and provider-owned physician practices, was sold to Conifer Health Solutions, America’s leading provider of technology-enabled healthcare performance improvement services, for a total value of US$235 million. AOGL is a wholly-owned subsidiary of Beta. As a result of the sale, PGIC received a cash distribution of US$42 million from Beta.
F-63
On July 22, 2016, AOGL entered into Sale and Purchase Agreement, or SPA, with Relia, Inc., one of the largest BPO companies in Japan, relating to the acquisition of AOGL’s Customer Relationship Management, or CRM, business under the legal entity SPi CRM, Inc. and Infocom Technologies, Inc., wholly-owned subsidiaries of AOGL, for an initial enterprise value of US$181 million. Payment shall be on completion date, subject to certain conditions, as defined in the SPA. The carrying value of investment in common shares amounted to Php705 million and Php654 million as at June 30, 2016 and December 31, 2015, respectively. The carrying value of PGIC’s investment in Beta’s preferred shares amounting to Php275 million and Php265 million were presented as part of investment in debt securities and other long-term investments in our consolidated statements of financial position as at June 30, 2016 and December 31, 2015, respectively. See related discussion on Note 12 – Investment in Debt Securities and Other Long-term Investments. PGIC is a wholly-owned subsidiary of PLDT Global, which was incorporated under the laws of British Virgin Islands.
Investment of Smart in AFPI In 2013, Smart, along with other conglomerates Metro Pacific Investments Corporation, or MPIC, and Ayala Corporation, or Ayala, embarked on a venture to bid for the Automated Fare Collection System, or AFCS, project of the Department of Transportation and Communications, or DOTC, and Light Rail Transit Authority. The project aims to upgrade the Light Rail Transit 1 and 2, and Metro Rail Transit ticketing systems by substantially speeding up payments, reducing queuing time and facilitating efficient passenger transfer to other rail lines. The AFCS Consortium led by MPIC and Ayala, composed of AC Infrastructure Holdings Corporation, BPI Card Finance Corporation, and Globe Telecoms, Inc., or Globe, for the Ayala Group, and MPIC, Meralco Financial Services Corporation, and Smart for the MPIC Group, bid for the AFCS Project and on January 30, 2014, received a Notice of Award from the DOTC declaring it as the winning bidder. On February 10, 2014, AFPI, the joint venture company, was incorporated in the Philippines and registered with the Philippine SEC. As part of the agreement, Smart subscribed for 503 million shares equivalent to a 20% equity interest in AFPI at a subscription price of Php1.00 per share. On June 30, 2014, MPIC and Ayala Group signed a ten-year concession agreement with the DOTC to build and implement the AFCS project. On January 20, 2015, the Board of Directors of AFPI approved an additional cash call on unpaid subscription of Php800 million to fund its expenditures, which was paid on March 30, 2015 by the shareholders in proportion to their share subscriptions. Smart contributed an additional Php160 million for its 20% share in AFPI. On November 17, 2015, the Board of Directors of AFPI approved the increase in authorized capital stock from Php2,550 million divided into 2,550 million shares with par value of Php1.00 per share to Php5,000 million divided into 5,000 million shares with par value of Php1.00 per share. AFPI subsequently issued a total of 612.5 million shares with par value of Php1.00 per share to all of its existing shareholders in proportion to their current shareholdings. Smart subscribed to an additional capital of Php122.5 million representing its proportionate share in the capital increase. On the same date, the Board of Directors likewise approved an additional cash call on unpaid subscription of Php650 million for AFPI’s planned expenditure. Smart contributed an additional Php130 million representing its 20% share. The carrying value of Smart’s investment in AFPI amounted to Php470 million, including subscription payable of Php36 million as at June 30, 2016 and Php533 million, including subscription payable of Php166 million as at December 31, 2015. Smart has significant influence over AFPI given its 20% voting interest and its Board representation.
F-64
Investment of PLDT Capital in Phunware On September 3, 2015, PLDT Capital subscribed to an 8% US$5 million Convertible Promissory Note, or Note, issued by Phunware, a Delaware corporation. Phunware is an expansive mobile delivery platform that creates, markets, and monetizes mobile application experiences across multiple screens. By pioneering the multiscreen as a service platform, Phunware enables companies to engage seamlessly with their customers through mobile devices, from indoor and outdoor location-based marketing and advertising to content management, notifications and analytics, indoor mapping, navigation and wayfinding. The US$5 million Note was issued and paid on September 4, 2015. On December 18, 2015, PLDT Capital subscribed to Series F Preferred Shares of Phunware for a total consideration of US$3 million. On the same date, the Note and its related interest were converted to additional Phunware Series F Preferred Shares. On September 3, 2015, PLDT Capital also entered into a Memorandum of Understanding with Phunware to establish a joint venture that will exclusively market and distribute Phunware’s targeted mobile and multiscreen solutions in the Philippines and the rest of Southeast Asia. Consequently, on November 11, 2015, PLDT Capital incorporated Phunware Southeast Asia Pte. Ltd., through which the joint venture will conduct its operations in the region.
Investment of PLDT Capital in AppCard On October 9, 2015, PLDT Capital entered into a Convertible Preferred Stock Purchase Agreement with AppCard for US$5 million. AppCard, a Delaware Corporation, is engaged in the business of developing, marketing, selling and servicing digital loyalty program platforms. The US$5 million Convertible Series B Preferred Stock was paid on October 9, 2015.
Investment of Digitel in DCI and ANPC
Digitel has 60% and 40% interest in Asia Netcom Philippines Corporation, or ANPC, and Digitel Crossing, Inc., or DCI, respectively. DCI is involved in the business of cable system linking the Philippines, United States and other neighboring countries in Asia. ANPC is an investment holding company owning 20% of DCI. In December 2000, Digitel, Pacnet Network (Philippines), Inc., or PNPI, (formerly Asia Global Crossing Ltd.) and BT Group O/B Broadband Infrastructure Group Ltd., or BIG, entered into a JVA under which the parties agreed to form DCI with each party owning 40%, 40% and 20%, respectively. DCI was incorporated to develop, provide and market backhaul network services, among others. On April 19, 2001, after BIG withdrew from the proposed joint venture, Digitel and PNPI formed ANPC to replace BIG. Digitel contributed US$2 million, or Php69 million, for a 60% equity interest in ANPC while PNPI owned the remaining 40% equity interest. Digitel provided full impairment loss on its investment in DCI and ANPC in prior years on the basis that DCI and ANPC have incurred significant recurring losses in the past. In 2011, Digitel recorded a reversal of impairment loss amounting to Php92 million following improvement in the associates’ operations. Digitel has no control over ANPC. Though Digitel owns more than half of the voting interest in ANPC because of certain governance matters, management has assessed that Digitel only has significant influence and not control. Digitel’s investment in DCI does not qualify as investment in joint venture as there is no provision for joint control in the JVA among Digitel, PNPI and ANPC.
F-65
Following PLDT’s acquisition of a controlling stake in Digitel, PNPI, on November 4, 2011, sent a notice to exercise its Call Right under Section 6.3 of the JVA, which provides for a Call Right exercisable by PNPI following the occurrence of a Digitel change in control. As at August 2, 2016, Digitel management is ready to conclude the transfer of its investment in DCI, subject to PNPI’s ability to meet certain regulatory and valuation requirements.
Investment of ACeS Philippines in AIL
As at June 30, 2016, ACeS Philippines held 36.99% equity interest in AIL, a company incorporated under the laws of Bermuda. AIL owns the Garuda I Satellite and the related system control equipment in Batam, Indonesia. In December 2014, AIL suffered a failure of the propulsion system on board the Garuda I Satellite, thus, AIL decided to decommission the operation of Garuda I Satellite in January 2015. AIL has incurred significant operating losses, negative operating cash flows, and significant levels of debt. The financial condition of AIL was partly due to the National Service Providers’, or NSPs, inability to generate the amount of revenues originally expected as the growth in subscriber numbers has been significantly lower than budgeted. These factors raised substantial doubt about AIL’s ability to continue as a going concern. On this basis, we recognized a full impairment provision of Php1,896 million in respect of our investment in AIL in 2003. Unrecognized share in net losses and translation adjustment of AIL amounted to Php22 million and Php34 million for the six months ended June 30, 2016 and 2015, respectively. Share in net cumulative losses amounting to Php2,077 million and Php2,075 million as at June 30, 2016 and December 31, 2015, respectively, were not recognized as we do not have any legal or constructive obligation to pay for such losses and have not made any payments on behalf of AIL. See Note 25 – Related Party Transactions – Air Time Purchase Agreement between PLDT and AIL Related Agreements and Note 28 – Financial Assets and Liabilities – Liquidity Risk – Unconditional Purchase Obligations for further details as to the contractual relationships with respect to AIL. Summarized Financial Information of Associates The following tables present our share in the summarized financial information of our investments in associates in conformity with PFRS for equity investees in which we have significant influence as at June 30, 2016 and December 31, 2015 and for the six months ended June 30, 2016 and 2015:
June 30, December 31, 2016 2015
(Unaudited) (Audited)
(in million pesos) Statements of Financial Position: Noncurrent assets 7,880 8,520 Current assets 3,739 4,493 Equity 2,273 2,119 Noncurrent liabilities 3,097 4,186 Current liabilities 6,249 6,708
June 30, 2016 2015
(Unaudited)
(in million pesos) Income Statements: Revenues 3,673 2,846 Expenses 3,703 2,703 Other loss – net (68) (156) Net income (loss) (98) 13 Other comprehensive income – – Total comprehensive income (loss) (98) 13
F-66
We have no outstanding contingent liabilities or capital commitments with our associates as at June 30, 2016 and December 31, 2015. Investments in Joint Ventures
Investment in Beacon On March 1, 2010, PCEV, MPIC and Beacon, entered into an Omnibus Agreement, or OA. Beacon was incorporated in the Philippines and organized with the sole purpose of holding the respective shareholdings in Meralco of PCEV and MPIC. PCEV and MPIC are Philippine affiliates of First Pacific and both held equity interest in Meralco. Under the OA, PCEV and MPIC have agreed to set out their mutual agreement in respect of, among other matters, the capitalization, organization, conduct of business and the extent of their participation in the management of the affairs of Beacon. Beacon, PCEV and MPIC have also agreed on certain corporate governance matters, including Board composition, election of officers, shareholders’ action, representation to the Meralco Board, nomination of the Meralco Board Committees, and nomination of Meralco officers. Beacon is merely a special purpose vehicle created for the main purpose of holding and investing in Meralco using the same Meralco shares as collateral for funding such additional investment. The OA entered into by Beacon, PCEV and MPIC effectively delegates the decision making power of Beacon over the Meralco shares to PCEV and MPIC and that Beacon does not exercise any discretion over the vote to be taken in respect of the Meralco shares but is obligated to vote on the Meralco shares strictly in accordance with the instructions of PCEV and MPIC. Significant influence over the relevant financing and operating activities of Meralco is exercised at the respective Boards of PCEV and MPIC. PCEV accounts for its investment in Beacon as investment in joint venture since the OA establishes joint control over Beacon.
Beacon’s Capitalization Beacon’s authorized capital stock of Php5,000 million consists of 3,000 million common shares with a par value of Php1.00 per share and 2,000 million preferred shares with a par value of Php1.00 per share. The preferred shares of Beacon are non-voting, not convertible to common shares or any shares of any class of Beacon and have no pre-emptive rights to subscribe to any share or convertible debt securities or warrants issued or sold by Beacon. The preferred shareholder is entitled to liquidation preference and yearly cumulative dividends at the rate of 7% of the issue value subject to: (a) availability of unrestricted retained earnings; and (b) dividend payment restrictions imposed by Beacon’s bank creditors. On March 30, 2010, MPIC subscribed to 1,157 million common shares of Beacon and approximately 801 million preferred shares of Beacon in consideration of: (1) the transfer of 164 million Meralco shares at a price of Php150.00 per share, or an aggregate amount of Php24,540 million; and (2) Php6,600 million in cash, as further discussed in “Transfer of Meralco Shares to Beacon” section below for further information.
PCEV likewise subscribed to 1,157 million common shares of Beacon on March 30, 2010 in consideration of the transfer of 154 million Meralco common shares at a price of Php150.00 per share, or an aggregate amount of Php23,130 million.
Transfer of Meralco Shares to Beacon Alongside the subscription to the Beacon shares pursuant to the OA, Beacon purchased 154 million and 164 million Meralco common shares, or the Transferred Shares, from PCEV and MPIC, respectively, for a consideration of Php150.00 per share or a total of Php23,130 million for the PCEV Meralco shares and Php24,540 million for the MPIC Meralco shares. PCEV transferred the 154 million Meralco common shares to Beacon on May 12, 2010.
F-67
On October 25, 2011, PCEV transferred to Beacon its remaining investment in 69 million of Meralco’s common shares for a total cash consideration of Php15,136 million. PCEV also subscribed to 1,199 million Beacon preferred shares at the same time. The transfers of the Meralco shares was implemented through a special block sale/cross sale in the PSE. PCEV recognized a deferred gain of Php8,047 million and Php8,145 million on May 12, 2010 and October 25, 2011, respectively, for the difference between the transfer price of the Meralco shares to Beacon and the carrying amount in PCEV’s books of the Meralco shares transferred since the transfer was between entities with common shareholders. The deferred gain, presented as a reduction in PCEV’s investment in Beacon common shares, will only be realized upon the disposal of the Meralco shares to a third party.
PCEV’s Additional Investment in Beacon Common Shares On January 20, 2012, PCEV subscribed to 135 million Beacon common shares for a total cash consideration of Php2,700 million. On the same date, MPIC also subscribed to 135 million Beacon common shares for a total cash consideration of Php2,700 million.
Sale of Beacon Preferred Shares to MPIC On June 6, 2012, PCEV agreed to sell approximately 282 million of its Beacon preferred shares to MPIC for total cash consideration of Php3,563 million, which sale was completed on June 29, 2012. Beacon preferred shares were sold to an entity not included in PLDT Group, PCEV realized a portion of the deferred gain amounting to Php2,012 million, which was recorded when the underlying Meralco shares were transferred to Beacon.
Sale of Beacon’s Meralco Shares to MPIC Beacon has entered into Share Purchase Agreements with MPIC with the following details:
Date Number of Shares Sold
% of Meralco Shareholdings Sold Price Per Share Total Price
Deferred Gain Realized(1)
(in millions) (in millions) (in millions) June 24, 2014 56.35 5% Php235.00 Php13,243 Php1,418 April 14, 2015 112.71 10% 235.00 26,487 2,838
(1) Since Beacon sold the shares to an entity not included in the PLDT Group, PCEV realized portion of the deferred gain which was recognized when
the Meralco shares were transferred to Beacon.
On June 24, 2014, MPIC settled portion of the consideration amounting to Php3,000 million and the balance was paid on February 27, 2015 amounting to Php10,243 million. As part of the April 14, 2015 sale, MPIC settled a portion of the consideration amounting to Php1,000 million on April 14, 2015 and Php17,000 million on June 29, 2015, both of which were used by Beacon to partially settle its outstanding loans. MPIC paid Beacon the balance of Php8,487 million on July 29, 2016. PCEV’s effective interest in Meralco, through Beacon, was reduced to 17.48%, while MPIC’s effective interest in Meralco, through its direct ownership of Meralco shares and through Beacon, increased to 32.48% as at December 31, 2015. There is no change in the aggregate joint interest of MPIC and Beacon in Meralco which remained at 49.96% as at December 31, 2015. The carrying value of PCEV’s investment in Beacon, net of deferred gain of Php9,924 million, was Php32,304 million as at December 31, 2015.

F-68
Sale of PCEV’s Beacon Shares to MPIC
On May 30, 2016, as approved by the Board, PCEV entered into a Share Purchase Agreement with MPIC to sell its 646 million shares of common stock and 458 million shares of preferred stock of Beacon, representing approximately 25% equity interest in Beacon to MPIC for a total consideration of Php26,200 million. MPIC settled a portion of the consideration amounting to Php17,000 million immediately upon signing of the agreement and the balance of Php9,200 million will be paid in annual installments until June 2020. Consequently, PCEV realized a portion of the deferred gain amounting to Php4,962 million. After the sale, PCEV’s equity ownership in Beacon was reduced from 50% to 25%, while MPIC’s interest increased to 75%. MPIC agreed that for as long as: (i) PCEV owns at least 20% of the outstanding capital stock of Beacon; or (ii) the purchase price has not been fully paid by MPIC, PCEV shall retain the right to vote 50% of the outstanding capital stock of Beacon. PCEV’s effective interest in Meralco, through Beacon, was reduced to 8.74%, while MPIC’s effective interest in Meralco, through its direct ownership in Meralco shares and through Beacon, increased to 41.22%. There is no change in the aggregate joint interest of MPIC and Beacon in Meralco which remains at 49.96%. Beacon effectively owns 394 million Meralco common shares representing approximately 34.96% effective ownership in Meralco with a carrying value of Php87,325 million and market value of Php122,158 million based on quoted price of Php310 per share as at June 30, 2016 and carrying value of Php87,831 million and market value of Php126,099 million based on quoted price of Php320 per share as at December 31, 2015.
PCEV’s Additional Investment in Beacon Class “B” Preferred Shares On May 30, 2016, the Board of Directors of Beacon approved the increase in authorized capital stock of Beacon from Php5,000 million to Php6,000 million divided into 3,000 million common shares with a par value of Php1.00 per share, 2,000 million Class “A” preferred shares with a par value of Php1.00 per share and 1,000 million new Class “B” preferred shares with a par value of Php1.00 per share. The Philippine SEC is yet to approve the increase in Beacon’s authorized capital and issuance of new class of preferred shares. Class “B” preferred shares of Beacon are non-voting, not convertible to common shares or any shares of Beacon of any class and have no pre-emptive rights to subscribe to any share or convertible debt, securities or warrants issued or sold by Beacon. The Class “B” preferred shares are entitled to liquidation preference and yearly cumulative dividends at the rate of 6% of the issue value subject to: (a) availability of unrestricted retained earnings; and (b) dividend payment will not violate any dividend restrictions imposed by Beacon’s bank creditors. PCEV subscribed to 277 million Beacon Class “B” preferred shares for a total cash consideration of Php3,500 million. MPIC likewise subscribed to 277 million Beacon Class “B” preferred shares for a total cash consideration of Php3,500 million. The amount raised from the subscription was used to fund the subscription to shares of common stock of Global Business Power Corporation, or Global Power, through Beacon Powergen Holdings, Inc., or Beacon Powergen, a wholly-owned subsidiary of Beacon.
Beacon’s Acquisition of Global Power On May 27, 2016, Beacon, through a wholly-owned subsidiary, Beacon Powergen, entered into a Special Purchase Agreement with GT Capital Holdings, Inc., to acquire an aggregate 56% of the issued share capital of Global Power for a total consideration of Php22,058 million. Beacon Powergen settled Php11,029 million upon closing, and the balance of the purchase price will be paid via a vendor financing facility, which will be replaced with long-term bank debt within 90 days from closing.
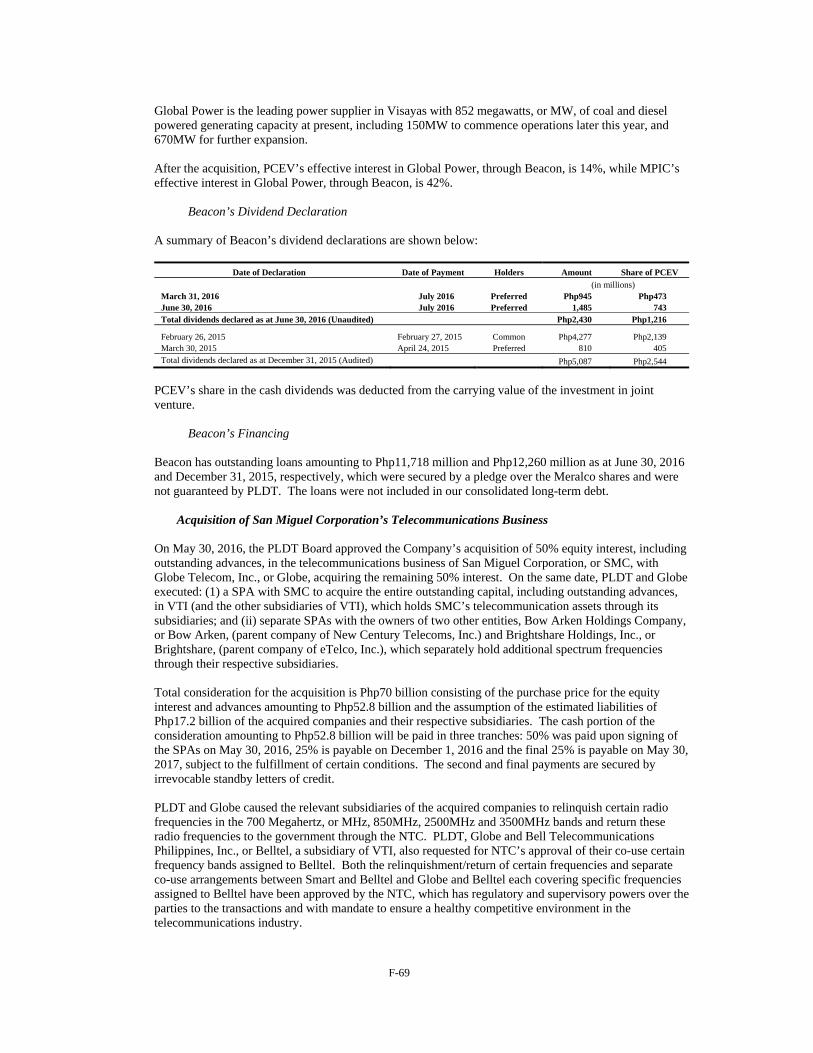
F-69
Global Power is the leading power supplier in Visayas with 852 megawatts, or MW, of coal and diesel powered generating capacity at present, including 150MW to commence operations later this year, and 670MW for further expansion. After the acquisition, PCEV’s effective interest in Global Power, through Beacon, is 14%, while MPIC’s effective interest in Global Power, through Beacon, is 42%.
Beacon’s Dividend Declaration A summary of Beacon’s dividend declarations are shown below:
Date of Declaration Date of Payment Holders Amount Share of PCEV
(in millions) March 31, 2016 July 2016 Preferred Php945 Php473 June 30, 2016 July 2016 Preferred 1,485 743 Total dividends declared as at June 30, 2016 (Unaudited) Php2,430 Php1,216
February 26, 2015 February 27, 2015 Common Php4,277 Php2,139 March 30, 2015 April 24, 2015 Preferred 810 405 Total dividends declared as at December 31, 2015 (Audited) Php5,087 Php2,544
PCEV’s share in the cash dividends was deducted from the carrying value of the investment in joint venture.
Beacon’s Financing Beacon has outstanding loans amounting to Php11,718 million and Php12,260 million as at June 30, 2016 and December 31, 2015, respectively, which were secured by a pledge over the Meralco shares and were not guaranteed by PLDT. The loans were not included in our consolidated long-term debt.
Acquisition of San Miguel Corporation’s Telecommunications Business On May 30, 2016, the PLDT Board approved the Company’s acquisition of 50% equity interest, including outstanding advances, in the telecommunications business of San Miguel Corporation, or SMC, with Globe Telecom, Inc., or Globe, acquiring the remaining 50% interest. On the same date, PLDT and Globe executed: (1) a SPA with SMC to acquire the entire outstanding capital, including outstanding advances, in VTI (and the other subsidiaries of VTI), which holds SMC’s telecommunication assets through its subsidiaries; and (ii) separate SPAs with the owners of two other entities, Bow Arken Holdings Company, or Bow Arken, (parent company of New Century Telecoms, Inc.) and Brightshare Holdings, Inc., or Brightshare, (parent company of eTelco, Inc.), which separately hold additional spectrum frequencies through their respective subsidiaries. Total consideration for the acquisition is Php70 billion consisting of the purchase price for the equity interest and advances amounting to Php52.8 billion and the assumption of the estimated liabilities of Php17.2 billion of the acquired companies and their respective subsidiaries. The cash portion of the consideration amounting to Php52.8 billion will be paid in three tranches: 50% was paid upon signing of the SPAs on May 30, 2016, 25% is payable on December 1, 2016 and the final 25% is payable on May 30, 2017, subject to the fulfillment of certain conditions. The second and final payments are secured by irrevocable standby letters of credit. PLDT and Globe caused the relevant subsidiaries of the acquired companies to relinquish certain radio frequencies in the 700 Megahertz, or MHz, 850MHz, 2500MHz and 3500MHz bands and return these radio frequencies to the government through the NTC. PLDT, Globe and Bell Telecommunications Philippines, Inc., or Belltel, a subsidiary of VTI, also requested for NTC’s approval of their co-use certain frequency bands assigned to Belltel. Both the relinquishment/return of certain frequencies and separate co-use arrangements between Smart and Belltel and Globe and Belltel each covering specific frequencies assigned to Belltel have been approved by the NTC, which has regulatory and supervisory powers over the parties to the transactions and with mandate to ensure a healthy competitive environment in the telecommunications industry.
F-70
Notice of Transaction filed with the Philippine Competition Commission, or the Commission On May 30, 2016, each of PLDT, Globe and SMC submitted notices of each transaction (respectively, the VTI Notice, the Bow Arken Notice and the Brightshare Notice and collectively, the Notices) to the Commission pursuant to the Philippine Competition Act, or PCA, and Circular No. 16-001 and Circular No. 16-002 issued by the Commission, or the Circulars. As stated in the Circulars, upon receipt by the Commission of the requisite notices, each of the transactions shall be deemed approved in accordance with the Circulars. Subsequently, on June 7, 2016, PLDT and the other parties to the transactions received separate letters dated June 6 and 7, 2016 from the Commission which essentially stated, that: (a) with respect to VTI transaction, the VTI Notice is deficient and defective in form and substance, therefore, the VTI transaction is not “deemed approved” by the Commission, and that the missing key terms of the transaction are critical since the Commission considers certain agreements as prohibited and illegal; and (b) with respect to the Bow Arken and Brightshare transactions, the compulsory notification under the Circulars does not apply and that even assuming the Circulars apply, the Bow Arken Notice and the Brightshare Notice are deficient and defective in form and substance. On June 10, 2016, PLDT submitted its response to the Commission’s letter articulating its position that the VTI Notice is adequate, complete and sufficient and compliant with the requirement under the Circulars, and does not contain false material information; as such, the VTI transaction enjoys the benefit of Section 23 of the PCA. Therefore, the VTI transaction is deemed approved and cannot be subject to retroactive review by the Commission. Moreover, the parties have taken all necessary steps, including the relinquishment/return of certain frequencies and co-use of the remaining frequencies by Smart and Belltel and Globe and Belltel as discussed above, to ensure that the VTI transaction will not substantially prevent, restrict or lessen competition or violate the PCA. Nevertheless, on the spirit of cooperation and for transparency, the parties voluntarily submitted to the Commission, among others, copies of the SPAs for the Commission’s information and reference. In a letter dated June 17, 2016, the Commission required the parties to further submit additional documents relevant to the co-use arrangement and the frequencies subject thereto, as well as other definitive agreements relating to the VTI transactions. It also disregarded the deemed approved status of the VTI transaction in violation of the Circulars which the Commission itself issued, and insisted that it will conduct a full review, if not investigation of the transaction under the different operative provisions of the PCA.
Legal Recourse to the Court of Appeals, or the CA On July 12, 2016, PLDT filed before the CA a Petition for Certiorari and Prohibition (With Urgent Application for the Issuance of a Temporary Restraining Order and/or Writ of Preliminary Injunction) against the Commission. The Petition seeks to enjoin the Commission from proceeding with the review of the acquisition by PLDT and Globe of the telecommunications business of SMC and performing any act which challenges or assails the “deemed approved” status of the transaction. On July 19, 2016, the 12th Division of the CA issued a Resolution directing the Office of the Solicitor General, or the OSG, to file its Comment with a non-extensible period of 10 days from notice and show cause why the Petition should not be granted. PLDT may file a Reply within five days from receipt of the OSG’s Comment. Thereafter, unless the CA decides to conduct a hearing and/or require the submission of memoranda by the parties, the case shall be submitted for decision.
iCommerce’s Investment in PHIH On January 20, 2015, PLDT and Rocket entered into a JVA to further strengthen their existing partnership and to foster the development of internet-based businesses in the Philippines. PLDT, through iCommerce, a subsidiary of Voyager’s eInnovations, and Asia Internet Holding S.à r.l., which is 50%-owned by Rocket, are shareholders in PHIH. PHIH focuses on creating and developing online businesses in the Philippines, leveraging local market and business model insights, facilitating commercial, strategic and investment partnerships, enabling local recruiting and sourcing, and accelerating the rollout of online startups.
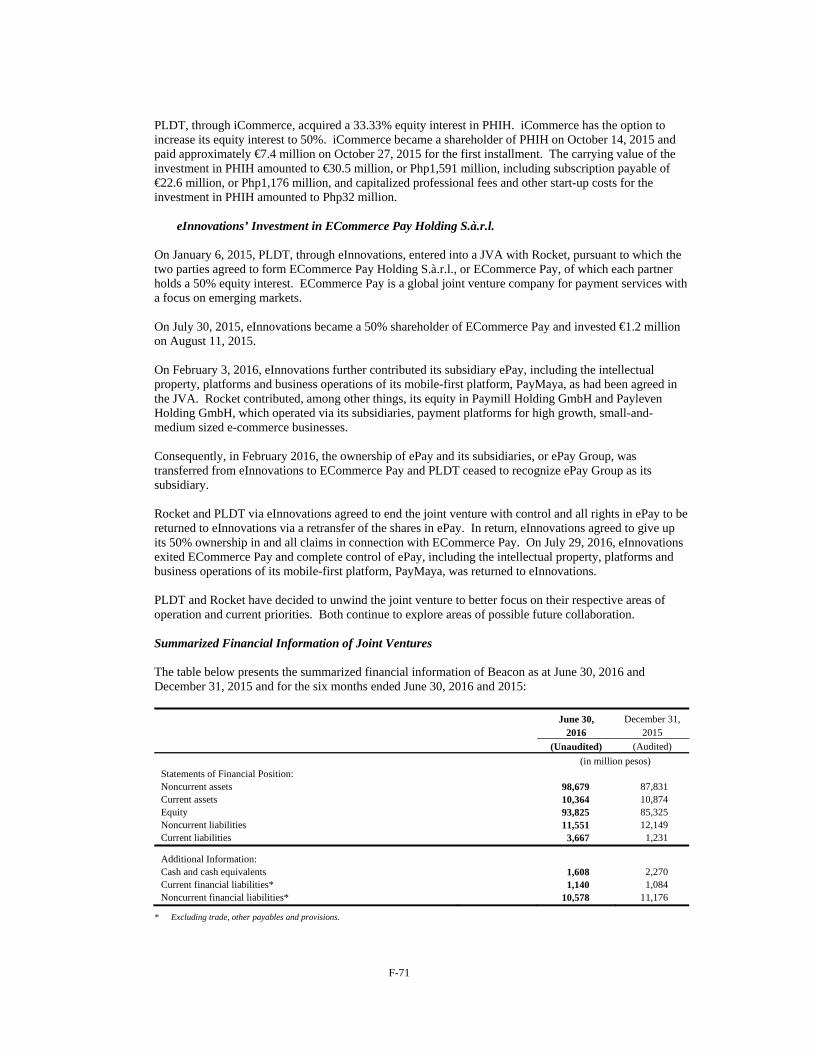
F-71
PLDT, through iCommerce, acquired a 33.33% equity interest in PHIH. iCommerce has the option to increase its equity interest to 50%. iCommerce became a shareholder of PHIH on October 14, 2015 and paid approximately €7.4 million on October 27, 2015 for the first installment. The carrying value of the investment in PHIH amounted to €30.5 million, or Php1,591 million, including subscription payable of €22.6 million, or Php1,176 million, and capitalized professional fees and other start-up costs for the investment in PHIH amounted to Php32 million.
eInnovations’ Investment in ECommerce Pay Holding S.à.r.l.
On January 6, 2015, PLDT, through eInnovations, entered into a JVA with Rocket, pursuant to which the two parties agreed to form ECommerce Pay Holding S.à.r.l., or ECommerce Pay, of which each partner holds a 50% equity interest. ECommerce Pay is a global joint venture company for payment services with a focus on emerging markets. On July 30, 2015, eInnovations became a 50% shareholder of ECommerce Pay and invested €1.2 million on August 11, 2015. On February 3, 2016, eInnovations further contributed its subsidiary ePay, including the intellectual property, platforms and business operations of its mobile-first platform, PayMaya, as had been agreed in the JVA. Rocket contributed, among other things, its equity in Paymill Holding GmbH and Payleven Holding GmbH, which operated via its subsidiaries, payment platforms for high growth, small-and-medium sized e-commerce businesses. Consequently, in February 2016, the ownership of ePay and its subsidiaries, or ePay Group, was transferred from eInnovations to ECommerce Pay and PLDT ceased to recognize ePay Group as its subsidiary. Rocket and PLDT via eInnovations agreed to end the joint venture with control and all rights in ePay to be returned to eInnovations via a retransfer of the shares in ePay. In return, eInnovations agreed to give up its 50% ownership in and all claims in connection with ECommerce Pay. On July 29, 2016, eInnovations exited ECommerce Pay and complete control of ePay, including the intellectual property, platforms and business operations of its mobile-first platform, PayMaya, was returned to eInnovations. PLDT and Rocket have decided to unwind the joint venture to better focus on their respective areas of operation and current priorities. Both continue to explore areas of possible future collaboration. Summarized Financial Information of Joint Ventures The table below presents the summarized financial information of Beacon as at June 30, 2016 and December 31, 2015 and for the six months ended June 30, 2016 and 2015:
June 30, December 31, 2016 2015
(Unaudited) (Audited)
(in million pesos) Statements of Financial Position: Noncurrent assets 98,679 87,831 Current assets 10,364 10,874 Equity 93,825 85,325 Noncurrent liabilities 11,551 12,149 Current liabilities 3,667 1,231
Additional Information: Cash and cash equivalents 1,608 2,270 Current financial liabilities* 1,140 1,084 Noncurrent financial liabilities* 10,578 11,176
* Excluding trade, other payables and provisions.
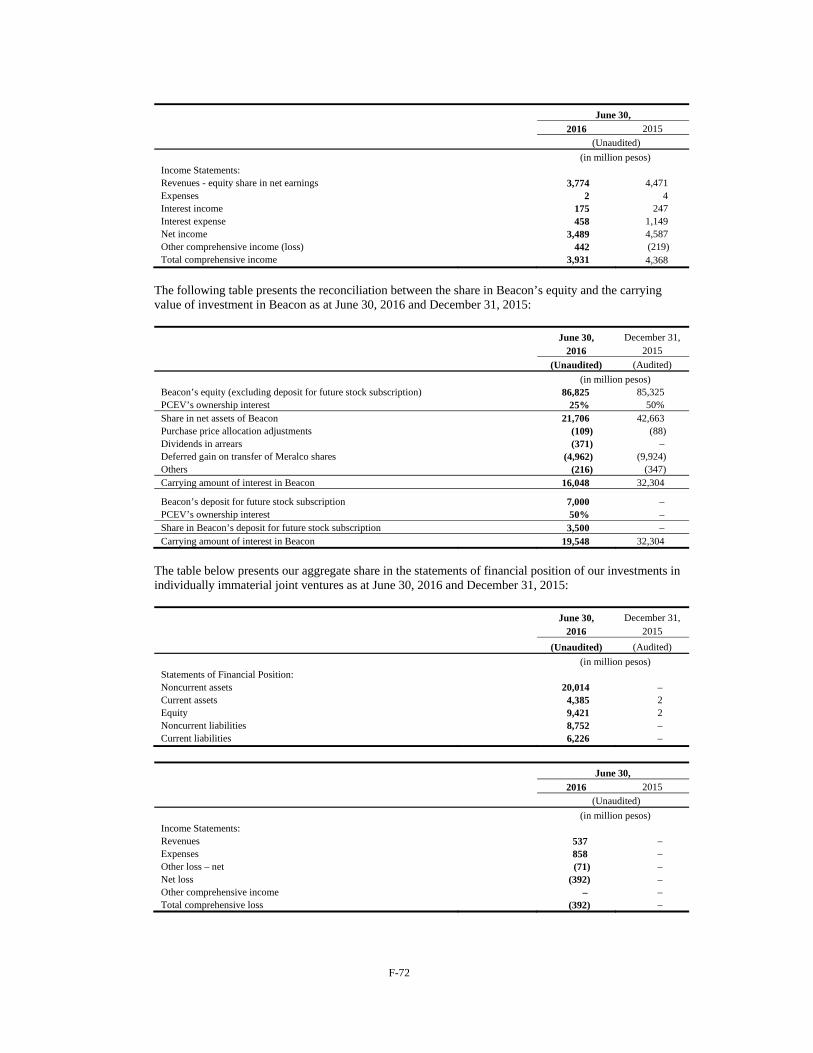
F-72
June 30,
2016 2015
(Unaudited)
(in million pesos) Income Statements: Revenues - equity share in net earnings 3,774 4,471 Expenses 2 4 Interest income 175 247 Interest expense 458 1,149 Net income 3,489 4,587 Other comprehensive income (loss) 442 (219) Total comprehensive income 3,931 4,368
The following table presents the reconciliation between the share in Beacon’s equity and the carrying value of investment in Beacon as at June 30, 2016 and December 31, 2015:
June 30, December 31, 2016 2015
(Unaudited) (Audited)
(in million pesos) Beacon’s equity (excluding deposit for future stock subscription) 86,825 85,325 PCEV’s ownership interest 25% 50% Share in net assets of Beacon 21,706 42,663 Purchase price allocation adjustments (109) (88) Dividends in arrears (371) – Deferred gain on transfer of Meralco shares (4,962) (9,924) Others (216) (347) Carrying amount of interest in Beacon 16,048 32,304
Beacon’s deposit for future stock subscription 7,000 – PCEV’s ownership interest 50% – Share in Beacon’s deposit for future stock subscription 3,500 – Carrying amount of interest in Beacon 19,548 32,304
The table below presents our aggregate share in the statements of financial position of our investments in individually immaterial joint ventures as at June 30, 2016 and December 31, 2015:
June 30, December 31, 2016 2015
(Unaudited) (Audited)
(in million pesos) Statements of Financial Position: Noncurrent assets 20,014 – Current assets 4,385 2 Equity 9,421 2 Noncurrent liabilities 8,752 – Current liabilities 6,226 –
June 30, 2016 2015
(Unaudited)
(in million pesos) Income Statements: Revenues 537 – Expenses 858 – Other loss – net (71) – Net loss (392) – Other comprehensive income – – Total comprehensive loss (392) –
F-73
Our aggregate share in the revenues, expenses, other expenses – net, net loss, other comprehensive income, and total comprehensive loss of our investments in individually immaterial joint ventures for the six months ended June 30, 2016 and 2015 are considered immaterial in relation to our consolidated financial statements.
We have no outstanding contingent liabilities or capital commitments with our joint ventures as at June 30, 2016 and December 31, 2015.
11. Available-for-Sale Financial Investments
Investment of PLDT Online in iFlix Limited, or iFlix On April 23, 2015, PLDT Online subscribed to a convertible note of iFlix, an internet TV service provider in Southeast Asia, for US$15 million, or Php686 million. The convertible note was issued and paid on August 11, 2015. iFlix will use the funds to continue roll out of the iFlix subscription video-on-demand services across the Southeast Asian region, acquire rights to new content, and produce original programming to market to potential customers. This investment is in line with our strategy to develop new revenue streams and to complement our present business by participating in the digital world beyond providing access and connectivity. On March 10, 2016, the US$15 million convertible notes held by PLDT Online were converted into 20.7 million ordinary shares of iFlix after Southeast Asia’s leading internet TV service provider completed a new round of funding led by Sky Plc, Europe’s leading entertainment company and the Indonesian company, Emtek Group, through its subsidiary, PT Surya Citra Media Tbk, or SCMA. PLDT Online’s shares account for the 7.5% of the total equity stock of iFlix which had a post money valuation of US$450 million following the investments of Sky Plc and SCMA.
Investment of PLDT Capital in Matrixx On December 18, 2015, PLDT Capital entered into a Stock and Warrant Purchase Agreement with Matrixx, a Delaware corporation. Matrixx provides the IT foundation to move to an all-digital service environment with a new real-time technology platform designed to handle the surge in interactions without forcing the compromises of conventional technology. Under the terms of the agreement, PLDT Capital subscribed to convertible Series B Preferred Stock of Matrixx for a total consideration of US$5 million, or Php237 million, and is entitled to purchase additional Series B Preferred Stock upon occurrence of certain conditions on or before March 15, 2016. PLDT Capital did not exercise its right to purchase additional Series B Preferred Stock of Matrixx.
Investment of PLDT Online in Rocket On August 7, 2014, PLDT and Rocket entered into a global strategic partnership to drive the development of online and mobile payment solutions in emerging markets. Rocket provides a platform for the rapid creation and scaling of consumer internet businesses outside the U.S. and China. Rocket’s prominent brands include the leading Southeast Asian e-Commerce businesses Zalora and Lazada, as well as fast growing brands with strong positions in their markets such as Dafiti, Linio, Jumia, Namshi, Lamoda, Jabong, Westwing, Home24 and HelloFresh in Latin America, Africa, Middle East, Russia, India and Europe. Financial technology and payments comprise Rocket’s third sector where it anticipates numerous and significant growth opportunities. Pursuant to the terms of the investment agreement, PLDT invested €333 million, or Php19,577 million, in cash, for new shares equivalent to a 10% stake in Rocket as at August 2014. These new shares are of the same class and bear the same rights as the Rocket shares held by the investors as at the date of the agreement namely, Investment AB Kinnevik and Access Industries, in addition to Global Founders GmbH (formerly European Founders Fund GmbH). PLDT made the €333 million investment in two payments (September 8 and September 15, 2014), which it funded from available cash and new debt.

F-74
Concurrently with the investment, PLDT and Rocket agreed pursuant to a JVA to jointly develop mobile and online payments in emerging markets. The partnership is expected to leverage PLDT’s experience and intellectual property in mobile payments and remittance platforms, together with Rocket’s global technology platform, to provide products and services for the “unbanked, uncarded and unconnected” population in emerging markets.
On August 21, 2014, PLDT assigned all its rights, title and interests as well as all of its obligations related to its investment in Rocket, to PLDT Online, an indirectly wholly-owned subsidiary of PLDT.
On October 1, 2014, Rocket announced the pricing of its initial public offering, or IPO, at €42.50 per share. On October 2, 2014, Rocket listed its shares on Entry Standard of the Frankfurt Stock Exchange under the ticker symbol “RKET.” Our ownership stake in Rocket after the IPO was reduced to 6.6%. In February 2015, due to additional issuances of shares by Rocket, our ownership percentage in Rocket was further reduced to 6.1%. Total costs directly attributable to the acquisition of Rocket shares and recognized as part of the cost of investment amounted to Php134 million.
Further details on investment in Rocket are as follows:
June 30, December 31, 2016 2015
(Unaudited) (Audited) Total market value as at beginning of the period (in million pesos) 14,587 27,855 Closing price per share at period-end (in Euros) 17.47 28.24 Total market value as at period-end (in million Euros) 176 285 Total market value as at end of the period (in million pesos) (Note 3) 9,206 14,587
Recognized in other comprehensive income (in million pesos) – (8,144) Recognized in profit or loss (in million pesos) (5,381) (5,124)
Net losses from changes in fair value recognized during the period (in million pesos) (5,381) (13,268)
Our cumulative net losses from changes in fair value of Rocket amounted to Php10,505 million and Php5,124 million as at June 30, 2016 and December 31, 2015, respectively.
Based on our judgment, the decline in fair value of our investment in Rocket as at December 31, 2015 is considered significant as the cumulative net losses from changes in fair value amounting to Php5,124 million represents 26% decline in value below cost. As a result, we recognized in profit or loss impairment of the investment in Rocket amounting to Php5,124 million for the year ended December 31, 2015. For the six months ended June 30, 2016, we recognized additional impairment loss of Php5,381 million as the fair value of Rocket further decline to Php9,206 million as at June 30, 2016 from Php14,587 million as at December 31, 2015. See Note 3 – Management’s Use of Accounting Judgments, Estimates and Assumptions – Impairment of available-for-sale equity investments.
As at August 1, 2016, closing price of Rocket is €18.22 per share resulting to total market value of PLDT’s stake in Rocket of €184 million, or Php9,641 million.
12. Investment in Debt Securities and Other Long-term Investments
As at June 30, 2016 and December 31, 2015, this account consists of:
June 30, December 31, 2016 2015
(Unaudited) (Audited)
(in million pesos) Security Bank Corporation, or Security Bank, Time Deposits 329 330 Beta’s preferred shares (Note 10) 275 265 PSALM Bonds 204 207 GT Capital Bond 150 150 National Power Corporation, or NAPOCOR, Bond 51 51
1,009 1,003 Less current portion (Note 28) 50 51 Noncurrent portion (Note 28) 959 952
F-75
Security Bank Time Deposits
In October 2012, PLDT and Smart invested US$2.5 million each in a five-year time deposit with Security Bank maturing on October 11, 2017 at a gross coupon rate of 4.00%. These long-term fixed rate time deposits pay interest on a monthly basis or an estimate of 30 days. The deposits may be terminated prior to maturity at the applicable pretermination rates. Interest income, net of withholding tax, recognized on this investment amounted to US$94 thousand, or Php4.4 million, and US$93 thousand, or Php4.2 million, for the six months ended June 30, 2016 and 2015, respectively. The carrying value of this investment amounted to Php235 million and Php236 million as at June 30, 2016 and December 31, 2015, respectively. In May 2013, PLDT invested US$2.0 million in a five-year time deposit with Security Bank maturing on May 31, 2018 at a gross coupon rate of 3.5%. These long-term fixed rate time deposits pay interest on a monthly basis or an estimate of 30 days. The deposits may be terminated prior to maturity at the applicable pretermination rates. Interest income, net of withholding tax, recognized on this investment amounted to US$33 thousand, or Php1.5 million, and US$32.6 thousand, or Php1.5 million for the six months ended June 30, 2016 and 2015, respectively. The carrying value of this investment amounted to Php94 million each as at June 30, 2016 and December 31, 2015.
Investment in Beta’s Preferred Shares See Note 10 – Investments in Associates and Joint Ventures – Investment of PGIC in Beta for the detailed discussion of our investment.
PSALM Bonds In April 2013, Smart purchased, at a premium, PSALM Bonds with face value of Php200 million maturing on April 22, 2017 with yield-to-maturity at 4.25% gross. The bond has a gross coupon rate of 7.75% payable on a quarterly basis, and was recognized as held-to-maturity investment. Premium is amortized using the EIR method. Interest income, net of withholding tax, recognized on this investment amounted to Php3.6 million for each of the six months ended June 30, 2016 and 2015. The carrying value of this investment amounted to Php204 million and Php207 million as at June 30, 2016 and December 31, 2015, respectively. In August 2013, Smart purchased, at a premium, PSALM Bonds with face value of Php100 million with yield-to-maturity at 3.25% gross. The bond has a gross coupon rate of 6.88% payable on a quarterly basis, and was recognized as held-to-maturity investment. Premium is amortized using the EIR method. Interest income, net of withholding tax, recognized on this investment amounted to Php827 thousand for the six months ended June 30, 2015. This investment matured on April 22, 2015. In January 2014, Smart purchased, at a premium, additional PSALM Bonds with face value of Php60 million with yield-to-maturity at 3.00% gross. The bond has a gross coupon rate of 6.88% payable on a quarterly basis, and was recognized as held-to-maturity investment. Premium is amortized using the EIR method. Interest income, net of withholding tax, recognized on this investment amounted to Php289 thousand for the six months ended June 30, 2015. This investment matured on April 22, 2015.
GT Capital Bond
In February 2013, Smart purchased at par a seven-year GT Capital Bond with face value of Php150 million maturing on February 27, 2020. The bond has a gross coupon rate of 4.84% payable on a quarterly basis, and was recognized as held-to-maturity investment. Interest income, net of withholding tax, recognized on this investment amounted to Php2.9 million for each of the six months ended June 30, 2016 and 2015. The carrying value of this investment amounted to Php150 million each as at June 30, 2016 and December 31, 2015.
F-76
NAPOCOR Bond
In March 2014, Smart purchased, at a premium, a NAPOCOR Bond with face value of Php50 million maturing on December 19, 2016 with yield-to-maturity at 4.22% gross. The bond has a gross coupon rate of 7.34% payable on a semi-annual basis, and was recognized as held-to-maturity investment. This investment is a tax-exempt bond. Premium is amortized using the EIR method. Interest income recognized on this investment amounted to Php890 thousand and Php487 thousand for the six months ended June 30, 2016 and 2015, respectively. The carrying value of this investment amounted to Php51 million each as at June 30, 2016 and December 31, 2015.
Home Development Mutual Fund, or HDMF Bonds
In June 2014, Smart purchased, at a premium, HDMF Bonds with face value of Php100 million with yield-to-maturity at 2.75% gross. The bond has a gross coupon rate of 6.25% payable on a semi-annual basis, and was recognized as held-to-maturity investment. This investment is a tax-exempt bond. Premium is amortized using the EIR method. Interest income recognized on this investment amounted to Php468 thousand for the six months ended June 30, 2015. This investment matured on March 12, 2015.
Philippine Retail Treasury Bond, or Philippine RTB
In January 2014, Smart purchased, at a premium, a Philippine RTB with face value of Php32 million with yield-to-maturity at 2.38% gross. The bond has a gross coupon rate of 5.88% payable on a quarterly basis, and was recognized as held-to-maturity investment. Premium is amortized using the EIR method. Interest income, net of withholding tax, recognized on this investment amounted to Php243 thousand for the six months ended June 30, 2015. This investment matured on August 19, 2015.
13. Investment Properties
Changes in investment properties account for the six months ended June 30, 2015 and for the year ended December 31, 2015 are as follows:
Land Land
Improvements Building Total
(in million pesos) June 30, 2016 (Unaudited) Balance at beginning and end of the period (Note 4) 1,496 9 320 1,825 Transfers from property and equipment 39 – – 39 Balance at end of the year (Note 4) 1,535 9 320 1,864
December 31, 2015 (Audited) Balance at beginning of the year 1,479 10 327 1,816 Net gains (losses) from fair value adjustments
charged to profit or loss 18 (1) (7) 10 Disposals (6) – – (6) Transfers from property and equipment 5 – – 5 Balance at end of the year (Note 4) 1,496 9 320 1,825
Investment properties, which consist of land, land improvements and building, are stated at fair values, which have been determined based on appraisal performed by an independent firm of appraisers, an industry specialist in valuing these types of investment properties. None of our investment properties are being leased to third parties that earn rental income.
The valuation for land was based on a market approach valuation technique using price per square meter ranging from Php13 to Php140 thousand. The valuation for building and land improvements were based on a cost approach valuation technique using current material and labor costs for improvements based on external and independent reviewers.
We have determined that the highest and best use of some of the idle or vacant land properties at the measurement date would be to convert the properties for residential or commercial development. The properties are not being used for strategic reasons.
F-77
We have no restrictions on the realizability of our investment properties and no contractual obligations to either purchase, construct or develop investment properties or for repairs, maintenance and enhancements.
Repairs and maintenance expenses related to investment properties that do not generate rental income amounted to Php12 million and Php11 million for the six months ended June 30, 2016 and 2015, respectively.
The above investment properties were categorized under Level 3 of the fair value hierarchy. There were no transfers in and out of Level 3 of the fair value hierarchy.
Significant increases (decreases) in price per square meter for land, current material and labor costs of improvements would result in a significantly higher (lower) fair value measurement.
14. Business Combinations
2015 Acquisition
Takatack Holdings’ Acquisition of Takatack Technologies
On August 6, 2015, Voyager, through Takatack Holdings acquired a 100% equity interest in Takatack Technologies for a total cash consideration of US$5 million, or Php233 million, of which US$3 million, or Php148 million, was paid in August 2015 and US$2 million, or Php86 million, is payable in 11 quarterly installments, subject to satisfaction of certain conditions. The acquisition is consistent with the PLDT Group’s focus to build Voyager into a digital economy platforms-enabler, allowing it to build its digital commerce business in the Philippines and other emerging markets. Takatack Technologies is a Singapore-based company behind the online store, TackThis!, a cloud-based e-commerce platform operating on software as a service model that enables companies to easily set-up and showcase their businesses on various online platforms. The purchase price consideration has been allocated to the identifiable assets and liabilities on the basis of provisional values at the date of acquisition. The corresponding carrying amounts immediately before the acquisition are as follows:
Previous Carrying Values
Fair Values Recognized on Acquisition
In S.G. Dollar In Php(1) In S.G. Dollar In Php(1) (in millions) Assets: Property and equipment (Note 9) – 0.1 – 0.1 Cash and cash equivalents 0.1 2.7 0.1 2.7 Trade receivables 0.1 5.1 0.1 5.1 Prepayments and other current assets – 0.4 – 0.4 0.2 8.3 0.2 8.3 Liabilities: Accounts payable and other liabilities 0.1 4.6 0.1 4.6 Total identifiable net assets acquired 0.1 3.7 0.1 3.7 Goodwill from the acquisition (Note 15) 6.9 229.5 Purchase consideration transferred 7.0 233.2
Cash paid 4.4 147.6 Accounts payable – others 2.6 85.6 7.0 233.2 Cash flow from investing activity: Cash paid 4.4 147.5 Cash acquired (0.1) (2.7) 4.3 144.8 (1) Converted to Philippine Peso using the exchange rate at the time of purchase of Php33.23 to SGD1.00.
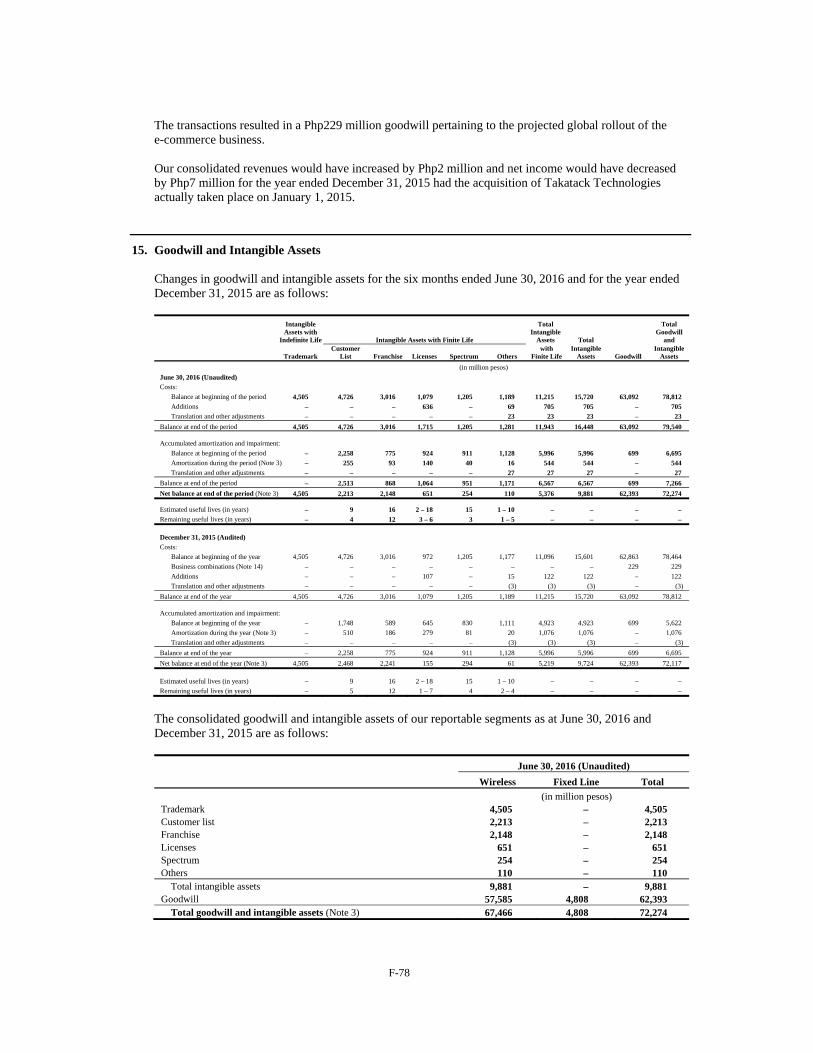
F-78
The transactions resulted in a Php229 million goodwill pertaining to the projected global rollout of the e-commerce business. Our consolidated revenues would have increased by Php2 million and net income would have decreased by Php7 million for the year ended December 31, 2015 had the acquisition of Takatack Technologies actually taken place on January 1, 2015.
15. Goodwill and Intangible Assets
Changes in goodwill and intangible assets for the six months ended June 30, 2016 and for the year ended December 31, 2015 are as follows:
Intangible Assets with
Indefinite Life
Intangible Assets with Finite Life
Total Intangible
Assets Total
Total Goodwill
and
Trademark Customer
List Franchise Licenses Spectrum Others with
Finite Life Intangible
Assets Goodwill Intangible
Assets
(in million pesos)
June 30, 2016 (Unaudited)
Costs:
Balance at beginning of the period 4,505 4,726 3,016 1,079 1,205 1,189 11,215 15,720 63,092 78,812
Additions – – – 636 – 69 705 705 – 705
Translation and other adjustments – – – – – 23 23 23 – 23
Balance at end of the period 4,505 4,726 3,016 1,715 1,205 1,281 11,943 16,448 63,092 79,540
Accumulated amortization and impairment:
Balance at beginning of the period – 2,258 775 924 911 1,128 5,996 5,996 699 6,695
Amortization during the period (Note 3) – 255 93 140 40 16 544 544 – 544
Translation and other adjustments – – – – – 27 27 27 – 27
Balance at end of the period – 2,513 868 1,064 951 1,171 6,567 6,567 699 7,266
Net balance at end of the period (Note 3) 4,505 2,213 2,148 651 254 110 5,376 9,881 62,393 72,274
Estimated useful lives (in years) – 9 16 2 – 18 15 1 – 10 – – – –
Remaining useful lives (in years) – 4 12 3 – 6 3 1 – 5 – – – –
December 31, 2015 (Audited)
Costs:
Balance at beginning of the year 4,505 4,726 3,016 972 1,205 1,177 11,096 15,601 62,863 78,464
Business combinations (Note 14) – – – – – – – – 229 229
Additions – – – 107 – 15 122 122 – 122
Translation and other adjustments – – – – – (3) (3) (3) – (3)
Balance at end of the year 4,505 4,726 3,016 1,079 1,205 1,189 11,215 15,720 63,092 78,812
Accumulated amortization and impairment:
Balance at beginning of the year – 1,748 589 645 830 1,111 4,923 4,923 699 5,622
Amortization during the year (Note 3) – 510 186 279 81 20 1,076 1,076 – 1,076
Translation and other adjustments – – – – – (3) (3) (3) – (3)
Balance at end of the year – 2,258 775 924 911 1,128 5,996 5,996 699 6,695
Net balance at end of the year (Note 3) 4,505 2,468 2,241 155 294 61 5,219 9,724 62,393 72,117
Estimated useful lives (in years) – 9 16 2 – 18 15 1 – 10 – – – –
Remaining useful lives (in years) – 5 12 1 – 7 4 2 – 4 – – – –
The consolidated goodwill and intangible assets of our reportable segments as at June 30, 2016 and December 31, 2015 are as follows:
June 30, 2016 (Unaudited)
Wireless Fixed Line Total
(in million pesos) Trademark 4,505 – 4,505 Customer list 2,213 – 2,213 Franchise 2,148 – 2,148 Licenses 651 – 651 Spectrum 254 – 254 Others 110 – 110
Total intangible assets 9,881 – 9,881 Goodwill 57,585 4,808 62,393
Total goodwill and intangible assets (Note 3) 67,466 4,808 72,274
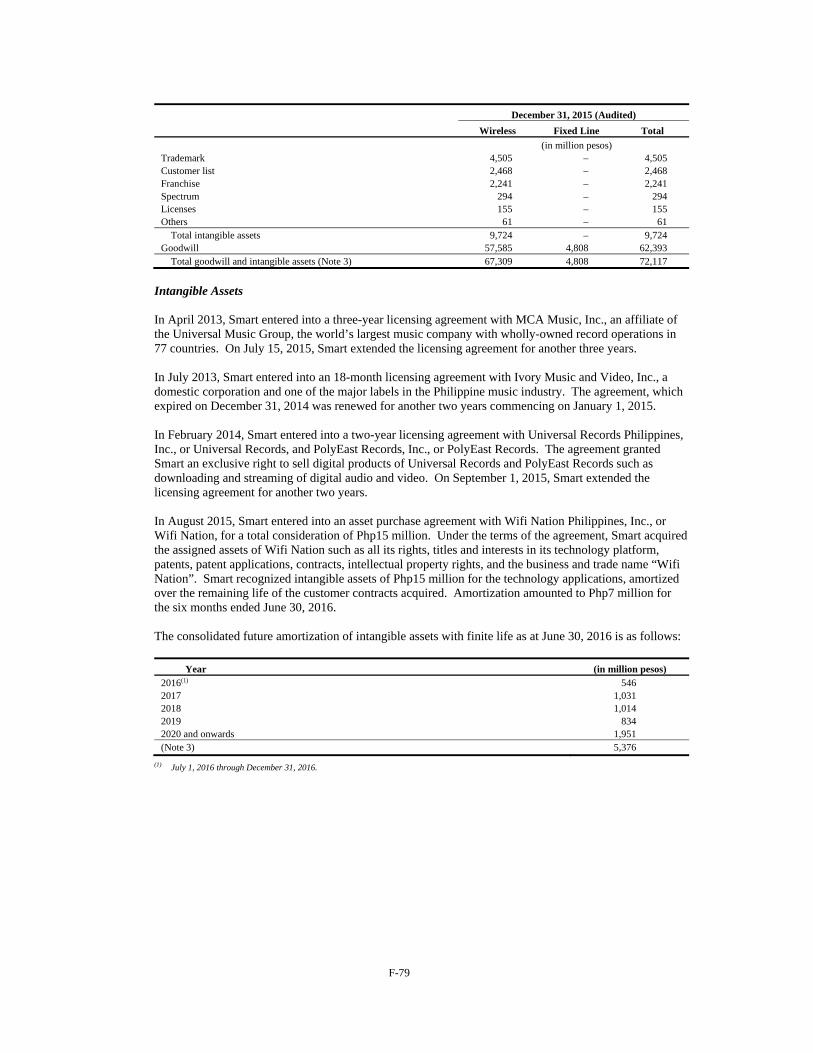
F-79
December 31, 2015 (Audited)
Wireless Fixed Line Total
(in million pesos) Trademark 4,505 – 4,505 Customer list 2,468 – 2,468 Franchise 2,241 – 2,241 Spectrum 294 – 294 Licenses 155 – 155 Others 61 – 61
Total intangible assets 9,724 – 9,724 Goodwill 57,585 4,808 62,393
Total goodwill and intangible assets (Note 3) 67,309 4,808 72,117
Intangible Assets In April 2013, Smart entered into a three-year licensing agreement with MCA Music, Inc., an affiliate of the Universal Music Group, the world’s largest music company with wholly-owned record operations in 77 countries. On July 15, 2015, Smart extended the licensing agreement for another three years. In July 2013, Smart entered into an 18-month licensing agreement with Ivory Music and Video, Inc., a domestic corporation and one of the major labels in the Philippine music industry. The agreement, which expired on December 31, 2014 was renewed for another two years commencing on January 1, 2015. In February 2014, Smart entered into a two-year licensing agreement with Universal Records Philippines, Inc., or Universal Records, and PolyEast Records, Inc., or PolyEast Records. The agreement granted Smart an exclusive right to sell digital products of Universal Records and PolyEast Records such as downloading and streaming of digital audio and video. On September 1, 2015, Smart extended the licensing agreement for another two years. In August 2015, Smart entered into an asset purchase agreement with Wifi Nation Philippines, Inc., or Wifi Nation, for a total consideration of Php15 million. Under the terms of the agreement, Smart acquired the assigned assets of Wifi Nation such as all its rights, titles and interests in its technology platform, patents, patent applications, contracts, intellectual property rights, and the business and trade name “Wifi Nation”. Smart recognized intangible assets of Php15 million for the technology applications, amortized over the remaining life of the customer contracts acquired. Amortization amounted to Php7 million for the six months ended June 30, 2016. The consolidated future amortization of intangible assets with finite life as at June 30, 2016 is as follows:
Year (in million pesos) 2016(1) 546 2017 1,031 2018 1,014 2019 834 2020 and onwards 1,951 (Note 3) 5,376
(1) July 1, 2016 through December 31, 2016.
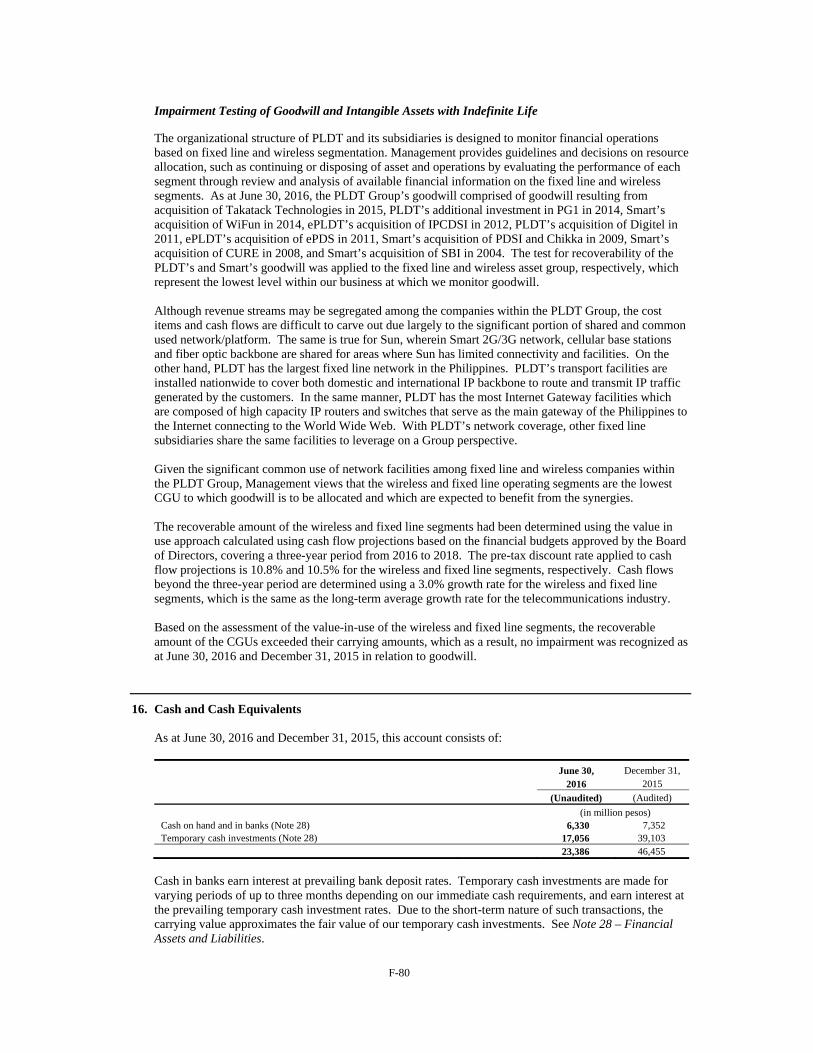
F-80
Impairment Testing of Goodwill and Intangible Assets with Indefinite Life The organizational structure of PLDT and its subsidiaries is designed to monitor financial operations based on fixed line and wireless segmentation. Management provides guidelines and decisions on resource allocation, such as continuing or disposing of asset and operations by evaluating the performance of each segment through review and analysis of available financial information on the fixed line and wireless segments. As at June 30, 2016, the PLDT Group’s goodwill comprised of goodwill resulting from acquisition of Takatack Technologies in 2015, PLDT’s additional investment in PG1 in 2014, Smart’s acquisition of WiFun in 2014, ePLDT’s acquisition of IPCDSI in 2012, PLDT’s acquisition of Digitel in 2011, ePLDT’s acquisition of ePDS in 2011, Smart’s acquisition of PDSI and Chikka in 2009, Smart’s acquisition of CURE in 2008, and Smart’s acquisition of SBI in 2004. The test for recoverability of the PLDT’s and Smart’s goodwill was applied to the fixed line and wireless asset group, respectively, which represent the lowest level within our business at which we monitor goodwill. Although revenue streams may be segregated among the companies within the PLDT Group, the cost items and cash flows are difficult to carve out due largely to the significant portion of shared and common used network/platform. The same is true for Sun, wherein Smart 2G/3G network, cellular base stations and fiber optic backbone are shared for areas where Sun has limited connectivity and facilities. On the other hand, PLDT has the largest fixed line network in the Philippines. PLDT’s transport facilities are installed nationwide to cover both domestic and international IP backbone to route and transmit IP traffic generated by the customers. In the same manner, PLDT has the most Internet Gateway facilities which are composed of high capacity IP routers and switches that serve as the main gateway of the Philippines to the Internet connecting to the World Wide Web. With PLDT’s network coverage, other fixed line subsidiaries share the same facilities to leverage on a Group perspective. Given the significant common use of network facilities among fixed line and wireless companies within the PLDT Group, Management views that the wireless and fixed line operating segments are the lowest CGU to which goodwill is to be allocated and which are expected to benefit from the synergies. The recoverable amount of the wireless and fixed line segments had been determined using the value in use approach calculated using cash flow projections based on the financial budgets approved by the Board of Directors, covering a three-year period from 2016 to 2018. The pre-tax discount rate applied to cash flow projections is 10.8% and 10.5% for the wireless and fixed line segments, respectively. Cash flows beyond the three-year period are determined using a 3.0% growth rate for the wireless and fixed line segments, which is the same as the long-term average growth rate for the telecommunications industry. Based on the assessment of the value-in-use of the wireless and fixed line segments, the recoverable amount of the CGUs exceeded their carrying amounts, which as a result, no impairment was recognized as at June 30, 2016 and December 31, 2015 in relation to goodwill.
16. Cash and Cash Equivalents
As at June 30, 2016 and December 31, 2015, this account consists of:
June 30, December 31, 2016 2015
(Unaudited) (Audited)
(in million pesos) Cash on hand and in banks (Note 28) 6,330 7,352 Temporary cash investments (Note 28) 17,056 39,103
23,386 46,455
Cash in banks earn interest at prevailing bank deposit rates. Temporary cash investments are made for varying periods of up to three months depending on our immediate cash requirements, and earn interest at the prevailing temporary cash investment rates. Due to the short-term nature of such transactions, the carrying value approximates the fair value of our temporary cash investments. See Note 28 – Financial Assets and Liabilities.
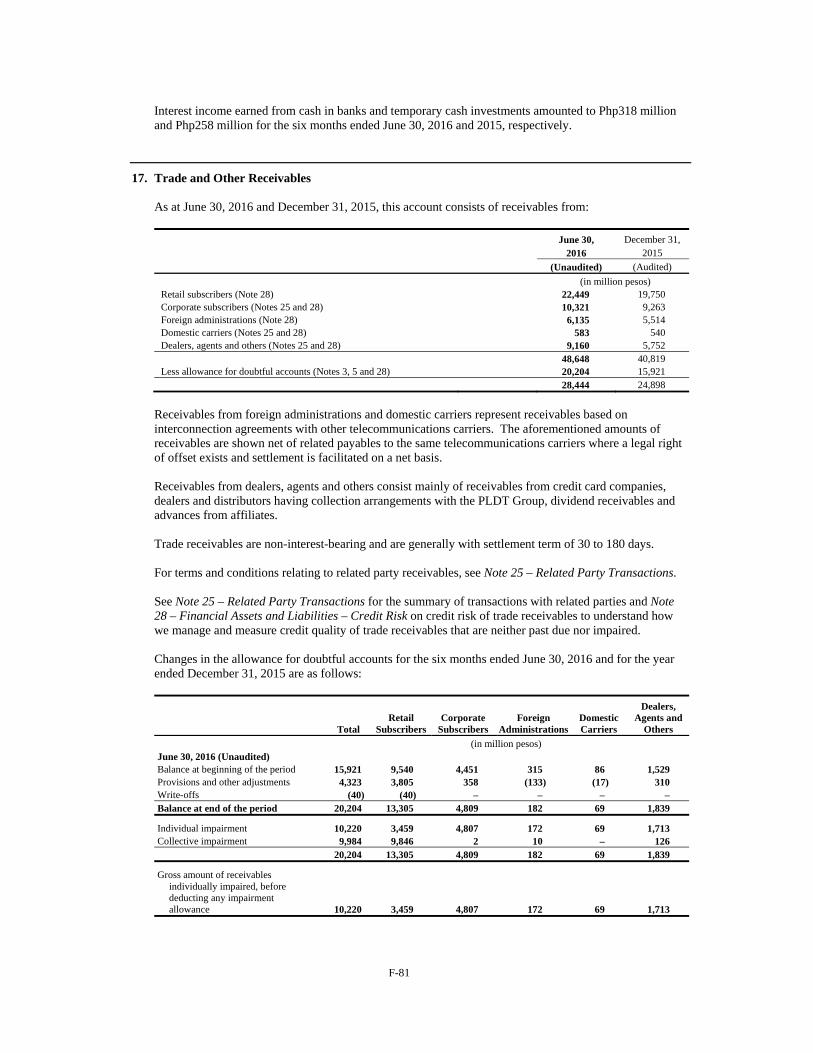
F-81
Interest income earned from cash in banks and temporary cash investments amounted to Php318 million and Php258 million for the six months ended June 30, 2016 and 2015, respectively.
17. Trade and Other Receivables
As at June 30, 2016 and December 31, 2015, this account consists of receivables from:
June 30, December 31, 2016 2015
(Unaudited) (Audited)
(in million pesos) Retail subscribers (Note 28) 22,449 19,750 Corporate subscribers (Notes 25 and 28) 10,321 9,263 Foreign administrations (Note 28) 6,135 5,514 Domestic carriers (Notes 25 and 28) 583 540 Dealers, agents and others (Notes 25 and 28) 9,160 5,752
48,648 40,819 Less allowance for doubtful accounts (Notes 3, 5 and 28) 20,204 15,921
28,444 24,898
Receivables from foreign administrations and domestic carriers represent receivables based on interconnection agreements with other telecommunications carriers. The aforementioned amounts of receivables are shown net of related payables to the same telecommunications carriers where a legal right of offset exists and settlement is facilitated on a net basis.
Receivables from dealers, agents and others consist mainly of receivables from credit card companies, dealers and distributors having collection arrangements with the PLDT Group, dividend receivables and advances from affiliates.
Trade receivables are non-interest-bearing and are generally with settlement term of 30 to 180 days.
For terms and conditions relating to related party receivables, see Note 25 – Related Party Transactions.
See Note 25 – Related Party Transactions for the summary of transactions with related parties and Note 28 – Financial Assets and Liabilities – Credit Risk on credit risk of trade receivables to understand how we manage and measure credit quality of trade receivables that are neither past due nor impaired.
Changes in the allowance for doubtful accounts for the six months ended June 30, 2016 and for the year ended December 31, 2015 are as follows:
Total Retail
Subscribers Corporate
Subscribers Foreign
AdministrationsDomestic Carriers
Dealers, Agents and
Others
(in million pesos) June 30, 2016 (Unaudited) Balance at beginning of the period 15,921 9,540 4,451 315 86 1,529 Provisions and other adjustments 4,323 3,805 358 (133) (17) 310 Write-offs (40) (40) – – – – Balance at end of the period 20,204 13,305 4,809 182 69 1,839
Individual impairment 10,220 3,459 4,807 172 69 1,713 Collective impairment 9,984 9,846 2 10 – 126
20,204 13,305 4,809 182 69 1,839
Gross amount of receivables individually impaired, before deducting any impairment allowance 10,220 3,459 4,807 172 69 1,713
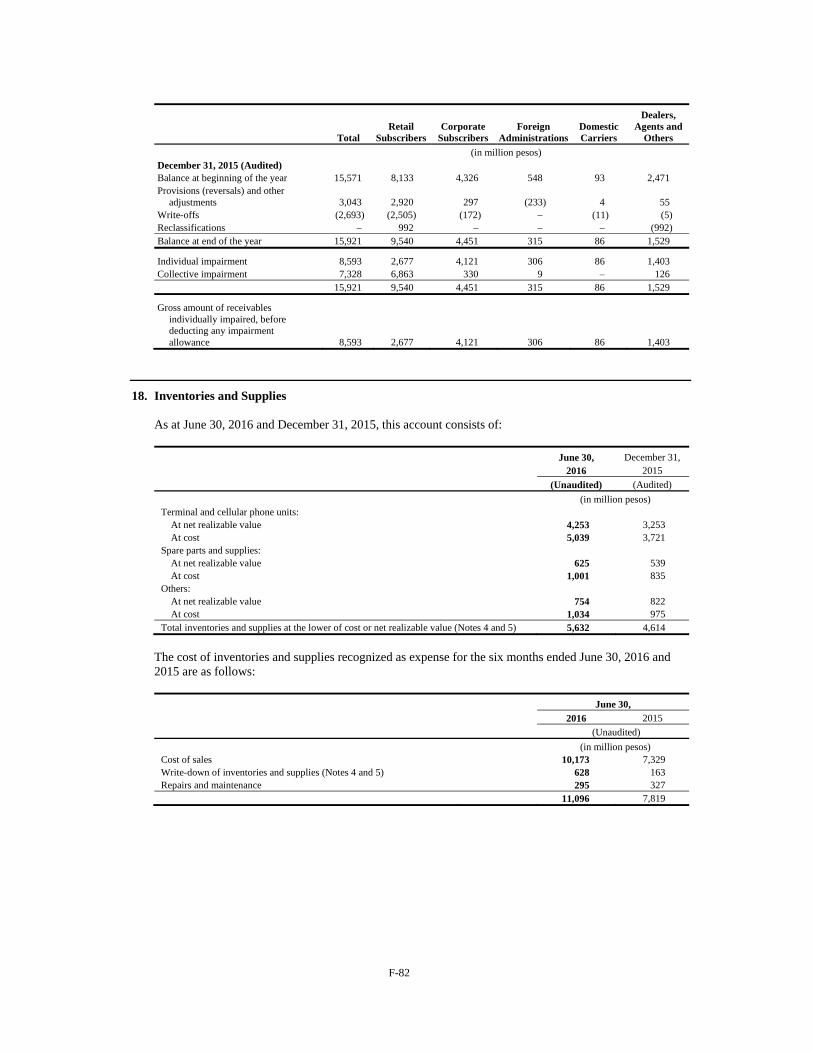
F-82
Total Retail
Subscribers Corporate
Subscribers Foreign
AdministrationsDomestic Carriers
Dealers, Agents and
Others
(in million pesos) December 31, 2015 (Audited) Balance at beginning of the year 15,571 8,133 4,326 548 93 2,471 Provisions (reversals) and other
adjustments 3,043 2,920 297 (233) 4 55 Write-offs (2,693) (2,505) (172) – (11) (5) Reclassifications – 992 – – – (992) Balance at end of the year 15,921 9,540 4,451 315 86 1,529
Individual impairment 8,593 2,677 4,121 306 86 1,403 Collective impairment 7,328 6,863 330 9 – 126
15,921 9,540 4,451 315 86 1,529
Gross amount of receivables individually impaired, before deducting any impairment allowance 8,593 2,677 4,121 306 86 1,403
18. Inventories and Supplies
As at June 30, 2016 and December 31, 2015, this account consists of:
June 30, December 31, 2016 2015
(Unaudited) (Audited)
(in million pesos) Terminal and cellular phone units:
At net realizable value 4,253 3,253 At cost 5,039 3,721
Spare parts and supplies: At net realizable value 625 539 At cost 1,001 835
Others: At net realizable value 754 822 At cost 1,034 975
Total inventories and supplies at the lower of cost or net realizable value (Notes 4 and 5) 5,632 4,614
The cost of inventories and supplies recognized as expense for the six months ended June 30, 2016 and 2015 are as follows:
June 30,
2016 2015
(Unaudited)
(in million pesos) Cost of sales 10,173 7,329 Write-down of inventories and supplies (Notes 4 and 5) 628 163 Repairs and maintenance 295 327
11,096 7,819
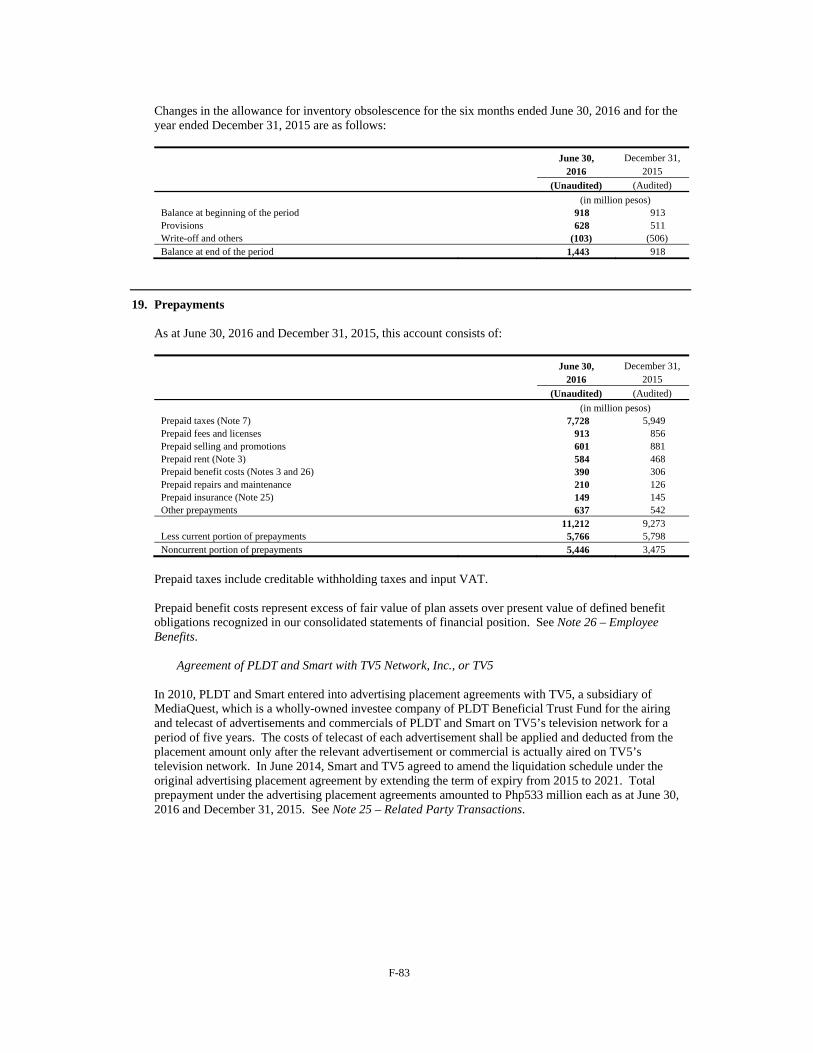
F-83
Changes in the allowance for inventory obsolescence for the six months ended June 30, 2016 and for the year ended December 31, 2015 are as follows:
June 30, December 31, 2016 2015
(Unaudited) (Audited)
(in million pesos) Balance at beginning of the period 918 913 Provisions 628 511 Write-off and others (103) (506) Balance at end of the period 1,443 918
19. Prepayments
As at June 30, 2016 and December 31, 2015, this account consists of:
June 30, December 31, 2016 2015
(Unaudited) (Audited)
(in million pesos) Prepaid taxes (Note 7) 7,728 5,949 Prepaid fees and licenses 913 856 Prepaid selling and promotions 601 881 Prepaid rent (Note 3) 584 468 Prepaid benefit costs (Notes 3 and 26) 390 306 Prepaid repairs and maintenance 210 126 Prepaid insurance (Note 25) 149 145 Other prepayments 637 542
11,212 9,273 Less current portion of prepayments 5,766 5,798 Noncurrent portion of prepayments 5,446 3,475
Prepaid taxes include creditable withholding taxes and input VAT.
Prepaid benefit costs represent excess of fair value of plan assets over present value of defined benefit obligations recognized in our consolidated statements of financial position. See Note 26 – Employee Benefits.
Agreement of PLDT and Smart with TV5 Network, Inc., or TV5
In 2010, PLDT and Smart entered into advertising placement agreements with TV5, a subsidiary of MediaQuest, which is a wholly-owned investee company of PLDT Beneficial Trust Fund for the airing and telecast of advertisements and commercials of PLDT and Smart on TV5’s television network for a period of five years. The costs of telecast of each advertisement shall be applied and deducted from the placement amount only after the relevant advertisement or commercial is actually aired on TV5’s television network. In June 2014, Smart and TV5 agreed to amend the liquidation schedule under the original advertising placement agreement by extending the term of expiry from 2015 to 2021. Total prepayment under the advertising placement agreements amounted to Php533 million each as at June 30, 2016 and December 31, 2015. See Note 25 – Related Party Transactions.
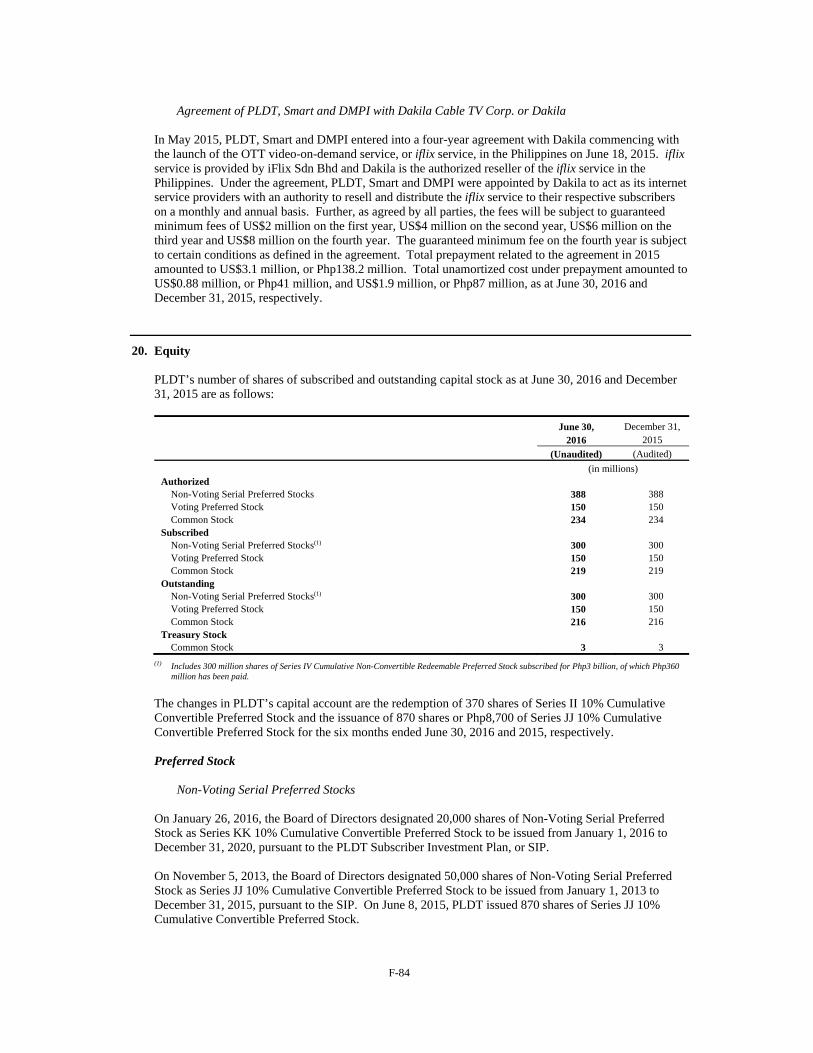
F-84
Agreement of PLDT, Smart and DMPI with Dakila Cable TV Corp. or Dakila In May 2015, PLDT, Smart and DMPI entered into a four-year agreement with Dakila commencing with the launch of the OTT video-on-demand service, or iflix service, in the Philippines on June 18, 2015. iflix service is provided by iFlix Sdn Bhd and Dakila is the authorized reseller of the iflix service in the Philippines. Under the agreement, PLDT, Smart and DMPI were appointed by Dakila to act as its internet service providers with an authority to resell and distribute the iflix service to their respective subscribers on a monthly and annual basis. Further, as agreed by all parties, the fees will be subject to guaranteed minimum fees of US$2 million on the first year, US$4 million on the second year, US$6 million on the third year and US$8 million on the fourth year. The guaranteed minimum fee on the fourth year is subject to certain conditions as defined in the agreement. Total prepayment related to the agreement in 2015 amounted to US$3.1 million, or Php138.2 million. Total unamortized cost under prepayment amounted to US$0.88 million, or Php41 million, and US$1.9 million, or Php87 million, as at June 30, 2016 and December 31, 2015, respectively.
20. Equity
PLDT’s number of shares of subscribed and outstanding capital stock as at June 30, 2016 and December 31, 2015 are as follows:
June 30, December 31, 2016 2015
(Unaudited) (Audited)
(in millions) Authorized
Non-Voting Serial Preferred Stocks 388 388 Voting Preferred Stock 150 150 Common Stock 234 234
Subscribed Non-Voting Serial Preferred Stocks(1) 300 300 Voting Preferred Stock 150 150 Common Stock 219 219
Outstanding Non-Voting Serial Preferred Stocks(1) 300 300 Voting Preferred Stock 150 150 Common Stock 216 216
Treasury Stock Common Stock 3 3
(1) Includes 300 million shares of Series IV Cumulative Non-Convertible Redeemable Preferred Stock subscribed for Php3 billion, of which Php360
million has been paid.
The changes in PLDT’s capital account are the redemption of 370 shares of Series II 10% Cumulative Convertible Preferred Stock and the issuance of 870 shares or Php8,700 of Series JJ 10% Cumulative Convertible Preferred Stock for the six months ended June 30, 2016 and 2015, respectively.
Preferred Stock
Non-Voting Serial Preferred Stocks
On January 26, 2016, the Board of Directors designated 20,000 shares of Non-Voting Serial Preferred Stock as Series KK 10% Cumulative Convertible Preferred Stock to be issued from January 1, 2016 to December 31, 2020, pursuant to the PLDT Subscriber Investment Plan, or SIP. On November 5, 2013, the Board of Directors designated 50,000 shares of Non-Voting Serial Preferred Stock as Series JJ 10% Cumulative Convertible Preferred Stock to be issued from January 1, 2013 to December 31, 2015, pursuant to the SIP. On June 8, 2015, PLDT issued 870 shares of Series JJ 10% Cumulative Convertible Preferred Stock.
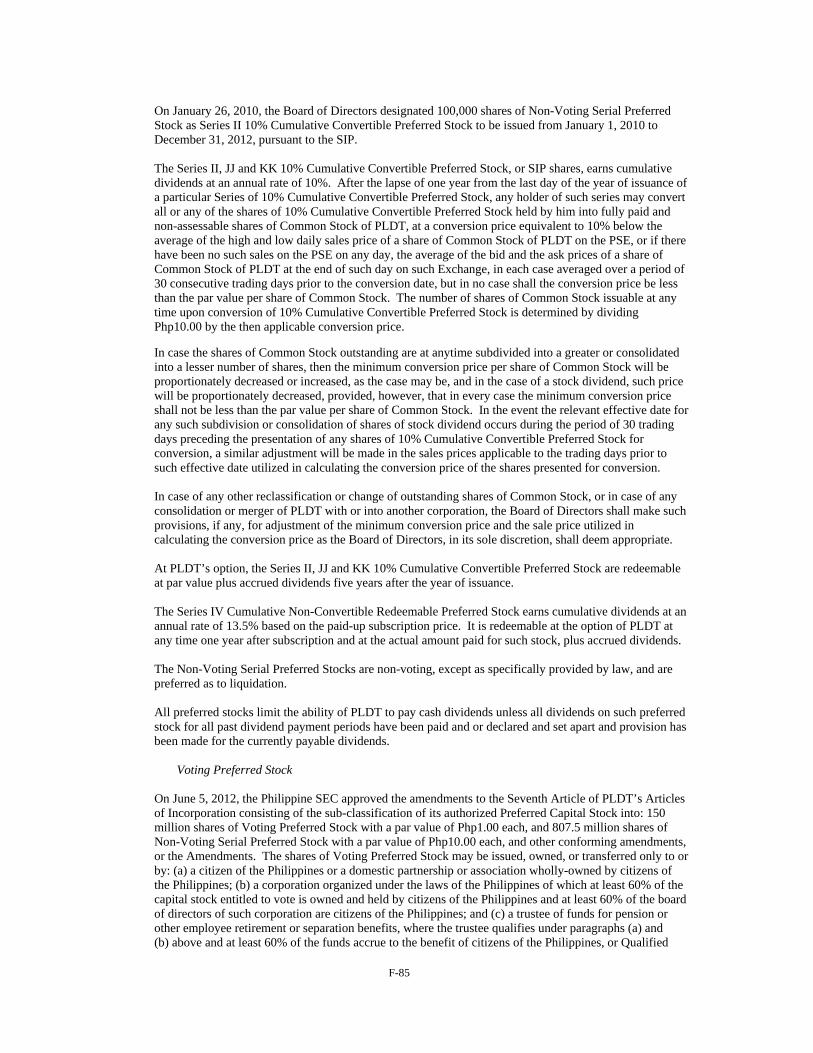
F-85
On January 26, 2010, the Board of Directors designated 100,000 shares of Non-Voting Serial Preferred Stock as Series II 10% Cumulative Convertible Preferred Stock to be issued from January 1, 2010 to December 31, 2012, pursuant to the SIP.
The Series II, JJ and KK 10% Cumulative Convertible Preferred Stock, or SIP shares, earns cumulative dividends at an annual rate of 10%. After the lapse of one year from the last day of the year of issuance of a particular Series of 10% Cumulative Convertible Preferred Stock, any holder of such series may convert all or any of the shares of 10% Cumulative Convertible Preferred Stock held by him into fully paid and non-assessable shares of Common Stock of PLDT, at a conversion price equivalent to 10% below the average of the high and low daily sales price of a share of Common Stock of PLDT on the PSE, or if there have been no such sales on the PSE on any day, the average of the bid and the ask prices of a share of Common Stock of PLDT at the end of such day on such Exchange, in each case averaged over a period of 30 consecutive trading days prior to the conversion date, but in no case shall the conversion price be less than the par value per share of Common Stock. The number of shares of Common Stock issuable at any time upon conversion of 10% Cumulative Convertible Preferred Stock is determined by dividing Php10.00 by the then applicable conversion price.
In case the shares of Common Stock outstanding are at anytime subdivided into a greater or consolidated into a lesser number of shares, then the minimum conversion price per share of Common Stock will be proportionately decreased or increased, as the case may be, and in the case of a stock dividend, such price will be proportionately decreased, provided, however, that in every case the minimum conversion price shall not be less than the par value per share of Common Stock. In the event the relevant effective date for any such subdivision or consolidation of shares of stock dividend occurs during the period of 30 trading days preceding the presentation of any shares of 10% Cumulative Convertible Preferred Stock for conversion, a similar adjustment will be made in the sales prices applicable to the trading days prior to such effective date utilized in calculating the conversion price of the shares presented for conversion.
In case of any other reclassification or change of outstanding shares of Common Stock, or in case of any consolidation or merger of PLDT with or into another corporation, the Board of Directors shall make such provisions, if any, for adjustment of the minimum conversion price and the sale price utilized in calculating the conversion price as the Board of Directors, in its sole discretion, shall deem appropriate.
At PLDT’s option, the Series II, JJ and KK 10% Cumulative Convertible Preferred Stock are redeemable at par value plus accrued dividends five years after the year of issuance.
The Series IV Cumulative Non-Convertible Redeemable Preferred Stock earns cumulative dividends at an annual rate of 13.5% based on the paid-up subscription price. It is redeemable at the option of PLDT at any time one year after subscription and at the actual amount paid for such stock, plus accrued dividends.
The Non-Voting Serial Preferred Stocks are non-voting, except as specifically provided by law, and are preferred as to liquidation.
All preferred stocks limit the ability of PLDT to pay cash dividends unless all dividends on such preferred stock for all past dividend payment periods have been paid and or declared and set apart and provision has been made for the currently payable dividends.
Voting Preferred Stock
On June 5, 2012, the Philippine SEC approved the amendments to the Seventh Article of PLDT’s Articles of Incorporation consisting of the sub-classification of its authorized Preferred Capital Stock into: 150 million shares of Voting Preferred Stock with a par value of Php1.00 each, and 807.5 million shares of Non-Voting Serial Preferred Stock with a par value of Php10.00 each, and other conforming amendments, or the Amendments. The shares of Voting Preferred Stock may be issued, owned, or transferred only to or by: (a) a citizen of the Philippines or a domestic partnership or association wholly-owned by citizens of the Philippines; (b) a corporation organized under the laws of the Philippines of which at least 60% of the capital stock entitled to vote is owned and held by citizens of the Philippines and at least 60% of the board of directors of such corporation are citizens of the Philippines; and (c) a trustee of funds for pension or other employee retirement or separation benefits, where the trustee qualifies under paragraphs (a) and (b) above and at least 60% of the funds accrue to the benefit of citizens of the Philippines, or Qualified
F-86
Owners. The holders of Voting Preferred Stock will have voting rights at any meeting of the stockholders of PLDT for the election of directors and for all other purposes, with one vote in respect of each share of Voting Preferred Stock. The Amendments were approved by the Board of Directors and stockholders of PLDT on July 5, 2011 and March 22, 2012, respectively.
On October 12, 2012, the Board of Directors, pursuant to the authority granted to it in the Seventh Article of PLDT’s Articles of Incorporation, determined the following specific rights, terms and features of the Voting Preferred Stock: (a) entitled to receive cash dividends at the rate of 6.5% per annum, payable before any dividends are paid to the holders of Common Stock; (b) in the event of dissolution or liquidation or winding up of PLDT, holders will be entitled to be paid in full, or pro-rata insofar as the assets of PLDT will permit, the par value of such shares of Voting Preferred Stock and any accrued or unpaid dividends thereon before any distribution shall be made to the holders of shares of Common Stock; (c) redeemable at the option of PLDT; (d) not convertible to Common Stock or to any shares of stock of PLDT of any class; (e) voting rights at any meeting of the stockholders of PLDT for the election of directors and all other matters to be voted upon by the stockholders in any such meetings, with one vote in respect of each Voting Preferred Share; and (f) holders will have no pre-emptive right to subscribe for or purchase any shares of stock of any class, securities or warrants issued, sold or disposed by PLDT.
On October 16, 2012, BTFHI subscribed to 150 million newly issued shares of Voting Preferred Stock of PLDT, at a subscription price of Php1.00 per share for a total subscription price of Php150 million pursuant to a subscription agreement between BTFHI and PLDT dated October 15, 2012. As a result of the issuance of Voting Preferred Shares, the voting power of the NTT Group (NTT DOCOMO and NTT Communications), First Pacific Group and its Philippine affiliates, and JG Summit Group was reduced to 12%, 15% and 5%, respectively, as at June 30, 2016. See Note 1 – Corporate Information and Note 27 – Provisions and Contingencies – In the Matter of the Wilson Gamboa Case and Jose M. Roy III Petition.
Redemption of Preferred Stock
On September 23, 2011, the Board of Directors approved the redemption, or the Redemption, of all outstanding shares of PLDT’s Series A to FF 10% Cumulative Convertible Preferred Stock, or the Series A to FF Shares, from holders of record as of October 10, 2011, and all such shares were redeemed and retired effective on January 19, 2012. In accordance with the terms and conditions of the Series A to FF Shares, the holders of Series A to FF Shares as at January 19, 2012 are entitled to payment of the redemption price in an amount equal to the par value of such shares, plus accrued and unpaid dividends thereon up to January 19, 2012, or the Redemption Price of Series A to FF Shares. PLDT has set aside Php4,029 million (the amount required to fund the redemption price for the Series A to FF Shares) in addition to Php4,143 million for unclaimed dividends on Series A to FF Shares, or a total amount of Php8,172 million, to fund the redemption of the Series A to FF Shares, or the Redemption Trust Fund, in a trust account, or the Trust Account, in the name of Rizal Commercial Banking Corporation, or RCBC, as Trustee. Pursuant to the terms of the Trust Account, the Trustee will continue to hold the Redemption Trust Fund or any balance thereof, in trust, for the benefit of Holders of Series A to FF Shares, for a period of ten years from January 19, 2012 until January 19, 2022. After the said date, any and all remaining balance in the Trust Account shall be returned to PLDT and revert to its general funds. Any interests on the Redemption Trust Fund shall accrue for the benefit of, and be paid from time to time, to PLDT. On May 8, 2012, the Board of Directors approved the redemption of all outstanding shares of PLDT’s Series GG 10% Cumulative Convertible Preferred Stock, or the Series GG Shares, from the holders of record as of May 22, 2012, and all shall shares were redeemed and retired effective August 30, 2012. In accordance with the terms and conditions of the Series GG Shares, the holders of the Series GG Shares as at May 22, 2012 are entitled to the payment of the redemption price in an amount equal to the par value of such shares, plus accrued and unpaid dividends thereon up to August 30, 2012, or the Redemption Price of Series GG Shares.
F-87
PLDT has set aside Php236 thousand (the amount required to fund the redemption price for the Series GG Shares) in addition to Php74 thousand for unclaimed dividends on Series GG Shares, or a total amount of Php310 thousand, to fund the redemption price for the Series GG Shares, or the Redemption Trust Fund for Series GG Shares, which forms an integral part of the Redemption Trust Fund previously set aside in the trust account with RCBC, as Trustee, for the purpose of funding the payment of the Redemption Price of Series A to FF Shares. Pursuant to the terms of the Trust Account, the Trustee will continue to hold the Redemption Trust Fund for Series GG Shares or any balance thereof, in trust, for the benefit of holders of Series GG Shares, for a period of ten years from August 30, 2012, or until August 30, 2022. After the said date, any and all remaining balance in the Redemption Trust Fund for Series GG Shares shall be returned to PLDT and revert to its general funds. Any interests on the Redemption Trust Fund for Series GG Shares shall accrue for the benefit of, and be paid from time to time, to PLDT. On January 29, 2013, the Board of Directors approved the redemption of all outstanding shares of PLDT’s Series HH 10% Cumulative Convertible Preferred Stock which were issued in 2007, or Series HH Shares issued in 2007, from the holders of record as of February 14, 2013 and all such shares were redeemed and retired effective May 16, 2013. In accordance with the terms and conditions of Series HH Shares issued in 2007, the holders of Series HH Shares issued in 2007 as at February 14, 2013 are entitled to the payment of the redemption price in an amount equal to the par value of such shares, plus accrued and unpaid dividends thereon up to May 16, 2013, or the Redemption Price of Series HH Shares issued in 2007. PLDT has set aside Php24 thousand (the amount required to fund the redemption price for the Series HH Shares issued in 2007) in addition to Php6 thousand for unclaimed dividends on Series HH Shares issued in 2007, or a total amount of Php30 thousand, to fund the redemption price of Series HH Shares issued in 2007, or the Redemption Trust Fund for Series HH Shares issued in 2007, which forms an integral part of the Redemption Trust Funds previously set aside in the trust account with RCBC, as Trustee, for the purpose of funding the payment of the Redemption Price of Series A to GG Shares. Pursuant to the terms of the Trust Account, the Trustee will continue to hold the Redemption Trust Fund for Series HH Shares issued in 2007 or any balance thereof, in trust, for the benefit of holders of Series HH Shares issued in 2007, for a period of ten years from May 16, 2013, or until May 16, 2023. After the said date, any and all remaining balance in the Redemption Trust Fund for Series HH Shares issued in 2007 shall be returned to PLDT and revert to its general funds. Any interests on the Redemption Trust Fund for Series HH Shares issued in 2007 shall accrue for the benefit of, and be paid from time to time, to PLDT.
On January 28, 2014, the Board of Directors approved the redemption of all outstanding shares of PLDT’s Series HH 10% Cumulative Convertible Preferred Stock which were issued in 2008, or the Series HH Shares issued in 2008, from the holders of record as of February 14, 2014 and all such shares were redeemed and retired effective May 16, 2014. In accordance with the terms and conditions of Series HH Shares issued in 2008, the holders of Series HH Shares issued in 2008 as at February 14, 2014 are entitled to the payment of the redemption price in an amount equal to the par value of such shares, plus accrued and unpaid dividends thereon up to May 16, 2014, or the Redemption Price of Series HH Shares issued in 2008. PLDT has set aside Php2 thousand (the amount required to fund the redemption price of Series HH Shares issued in 2008) in addition to Php1 thousand for unclaimed dividends on Series HH Shares issued in 2008, or a total amount of Php3 thousand, to fund the redemption price of Series HH Shares issued in 2008, or the Redemption Trust Fund for Series HH Shares issued in 2008, which forms an integral part of the Redemption Trust Funds previously set aside in the trust account with RCBC, as Trustee, for the purpose of funding the payment of the Redemption Price of Series A to HH Shares issued in 2007. Pursuant to the terms of the Trust Account, the Trustee will continue to hold the Redemption Trust Fund for Series HH Shares issued in 2008 or any balance thereof, in trust, for the benefit of holders of Series HH Shares issued in 2008, for a period of ten years from May 16, 2014, or until May 16, 2024. After the said date, any and all remaining balance in the Redemption Trust Fund for Series HH Shares issued in 2008 shall be returned to PLDT and revert to its general funds. Any interests on the Redemption Trust Fund for Series HH Shares issued in 2008 shall accrue for the benefit of, and be paid from time to time, to PLDT.
F-88
On January 26, 2016, the Board of Directors approved the redemption of all outstanding shares of PLDT’s Series II 10% Cumulative Convertible Preferred Stock, or the Series II Shares, from the holder of record as of February 10, 2016, and all such shares were redeemed and retired effective on May 11, 2016. In accordance with the terms and conditions of Series II Shares, the holder of Series II Shares as at February 10, 2016 is entitled to the payment of the redemption price in an amount equal to the par value of such shares, plus accrued and unpaid dividends thereon up to May 11, 2016, or the Redemption Price of Series II Shares. PLDT has set aside Php4 thousand to fund the redemption price of Series II Shares, or the Redemption Trust Fund for Series II Shares, which forms an integral part of the Redemption Trust Funds previously set aside in the trust account with RCBC, as Trustee, for the purpose of funding the payment of the Redemption Price of Series A to HH Shares issued in 2008. Pursuant to the terms of the Trust Account, the Trustee will continue to hold the Redemption Trust Fund for Series II Shares or any balance thereof, in trust, for the benefit of holder of Series II Shares, for a period of ten years from May 11, 2016, or until May 11, 2026. After the said date, any and all remaining balance in the Redemption Trust Fund for Series II Shares shall be returned to PLDT and revert to its general funds. Any interests on the Redemption Trust Fund for Series II Shares shall accrue for the benefit of, and be paid from time to time, to PLDT. As at January 19, 2012, August 30, 2012, May 16, 2013, May 16, 2014 and May 11, 2016, notwithstanding that any stock certificate representing the Series A to FF Shares, Series GG Shares, Series HH Shares issued in 2007, Series HH Shares issued in 2008 and Series II Shares, respectively, were not surrendered for cancellation, the Series AA to II Shares were no longer deemed outstanding and the right of the holders of such shares to receive dividends thereon ceased to accrue and all rights with respect to such shares ceased and terminated, except only the right to receive the Redemption Price of such shares, but without interest thereon. Total amounts of Php16 million and Php7 million were withdrawn from the Trust Account, representing total payments on redemption for the six months ended June 30, 2016 and 2015, respectively. The balances of the Trust Account of Php7,891 million and Php7,906 million were presented as part of the “Current portion of advances and other noncurrent assets” and the related redemption liability of the same amount were presented as part of “Accrued expenses and other current liabilities” in our consolidated statement of financial position as at June 30, 2016 and December 31, 2015, respectively. See Note 24 – Accrued Expenses and Other Current Liabilities and Note 28 – Financial Assets and Liabilities. PLDT expects to similarly redeem and retire the outstanding shares of Series JJ and KK 10% Cumulative Convertible Preferred Stock as and when they become eligible for redemption. Common Stock
The Board of Directors approved a share buyback program of up to five million shares of PLDT’s common stock, representing approximately 3% of PLDT’s then total outstanding shares of common stock in 2008. The share buyback program reflects PLDT’s commitment to capital management as an important element in enhancing shareholders value. This also reinforces initiatives that PLDT has already undertaken, such as the declaration of special dividends on common stock in addition to the regular dividend payout equivalent to 75% of our core EPS, after having determined that PLDT has the capacity to pay additional returns to shareholders. Under the share buyback program, PLDT reacquired shares on an opportunistic basis, directly from the open market through the trading facilities of the PSE and NYSE.
We had acquired a total of approximately 2.72 million shares of PLDT’s common stock at a weighted average price of Php2,388.00 per share for a total consideration of Php6,505 million in accordance with the share buyback program as at June 30, 2016 and December 31, 2015.
On November 9, 2011, the PSE approved the listing of an additional 27.7 million common shares of PLDT, which were issued on October 26, 2011 at the issue price of Php2,500.00 per share, as consideration for the acquisition by PLDT of certain assets of Digitel from JGSHI.
F-89
On January 27, 2012, a total of 1.61 million PLDT common shares were issued for settlement of the purchase price of 2,518 million common shares of Digitel tendered by the noncontrolling Digitel stockholders under the mandatory tender offer conducted by PLDT, and which opted to receive payment of the purchase price in the form of PLDT common shares.
Dividends Declared
Our dividends declared for the six months ended June 30, 2016 and 2015 are detailed as follows:
June 30, 2016 (Unaudited)
Date Amount
Class Approved Record Payable Per Share Total
(in million pesos, except per share amounts)
Cumulative Convertible Preferred Stock Series II (Final Dividends) April 12, 2016 February 10, 2016 May 11, 2016 0.0027/day – Series JJ May 3, 2016 June 2, 2016 June 30, 2016 1.00 –
–
Cumulative Non-Convertible Redeemable Preferred Stock Series IV* January 26, 2016 February 24, 2016 March 15, 2016 – 12
May 3, 2016 May 24, 2016 June 15, 2016 – 12
24
Voting Preferred Stock February 29, 2016 March 30, 2016 April 15, 2016 – 3
June 14, 2016 June 30, 2016 July 15, 2016 – 3
6
Common Stock Regular Dividend February 29, 2016 March 14, 2016 April 1, 2016 57.00 12,315
Charged to retained earnings 12,345
* Dividends were declared based on total amount paid up.
June 30, 2015 (Unaudited)
Date Amount
Class Approved Record Payable Per Share Total
(in million pesos, except per share amounts)
10% Cumulative Convertible Preferred Stock
Series II May 5, 2015 May 19, 2015 May 30, 2015 1.00 –
Cumulative Non-Convertible Redeemable Preferred Stock
Series IV* January 27, 2015 February 26, 2015 March 15, 2015 – 12
May 5, 2015 May 26, 2015 June 15, 2015 – 12
24
Voting Preferred Stock March 3, 2015 March 19, 2015 April 15, 2015 – 2
June 9, 2015 June 26, 2015 July 15, 2015 – 3
5
Common Stock
Regular Dividend March 3, 2015 March 17, 2015 April 16, 2015 61.00 13,179Special Dividend March 3, 2015 March 17, 2015 April 16, 2015 26.00 5,618
18,797
Charged to retained earnings 18,826
* Dividends were declared based on total amount paid up.
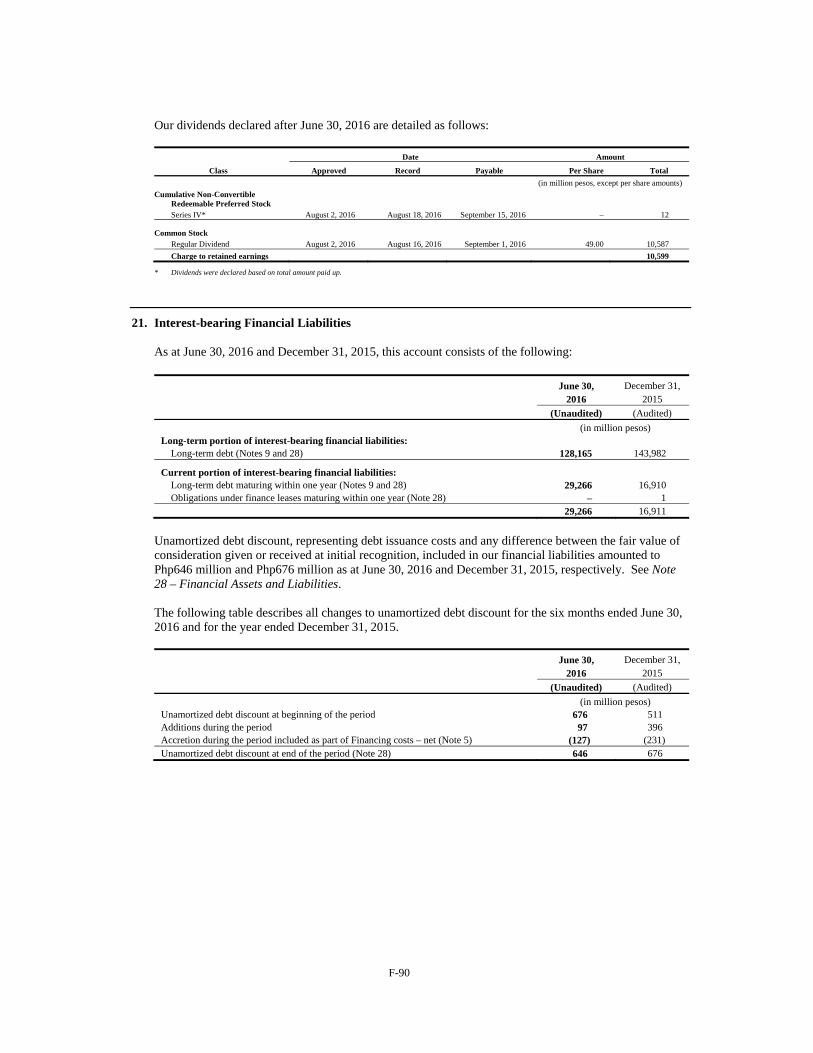
F-90
Our dividends declared after June 30, 2016 are detailed as follows: Date Amount
Class Approved Record Payable Per Share Total
(in million pesos, except per share amounts)
Cumulative Non-Convertible Redeemable Preferred Stock
Series IV* August 2, 2016 August 18, 2016 September 15, 2016 – 12
Common Stock
Regular Dividend August 2, 2016 August 16, 2016 September 1, 2016 49.00 10,587
Charge to retained earnings 10,599
* Dividends were declared based on total amount paid up.
21. Interest-bearing Financial Liabilities
As at June 30, 2016 and December 31, 2015, this account consists of the following:
June 30, December 31, 2016 2015
(Unaudited) (Audited)
(in million pesos) Long-term portion of interest-bearing financial liabilities:
Long-term debt (Notes 9 and 28) 128,165 143,982
Current portion of interest-bearing financial liabilities: Long-term debt maturing within one year (Notes 9 and 28) 29,266 16,910 Obligations under finance leases maturing within one year (Note 28) – 1
29,266 16,911
Unamortized debt discount, representing debt issuance costs and any difference between the fair value of consideration given or received at initial recognition, included in our financial liabilities amounted to Php646 million and Php676 million as at June 30, 2016 and December 31, 2015, respectively. See Note 28 – Financial Assets and Liabilities.
The following table describes all changes to unamortized debt discount for the six months ended June 30, 2016 and for the year ended December 31, 2015.
June 30, December 31, 2016 2015
(Unaudited) (Audited)
(in million pesos) Unamortized debt discount at beginning of the period 676 511 Additions during the period 97 396 Accretion during the period included as part of Financing costs – net (Note 5) (127) (231) Unamortized debt discount at end of the period (Note 28) 646 676
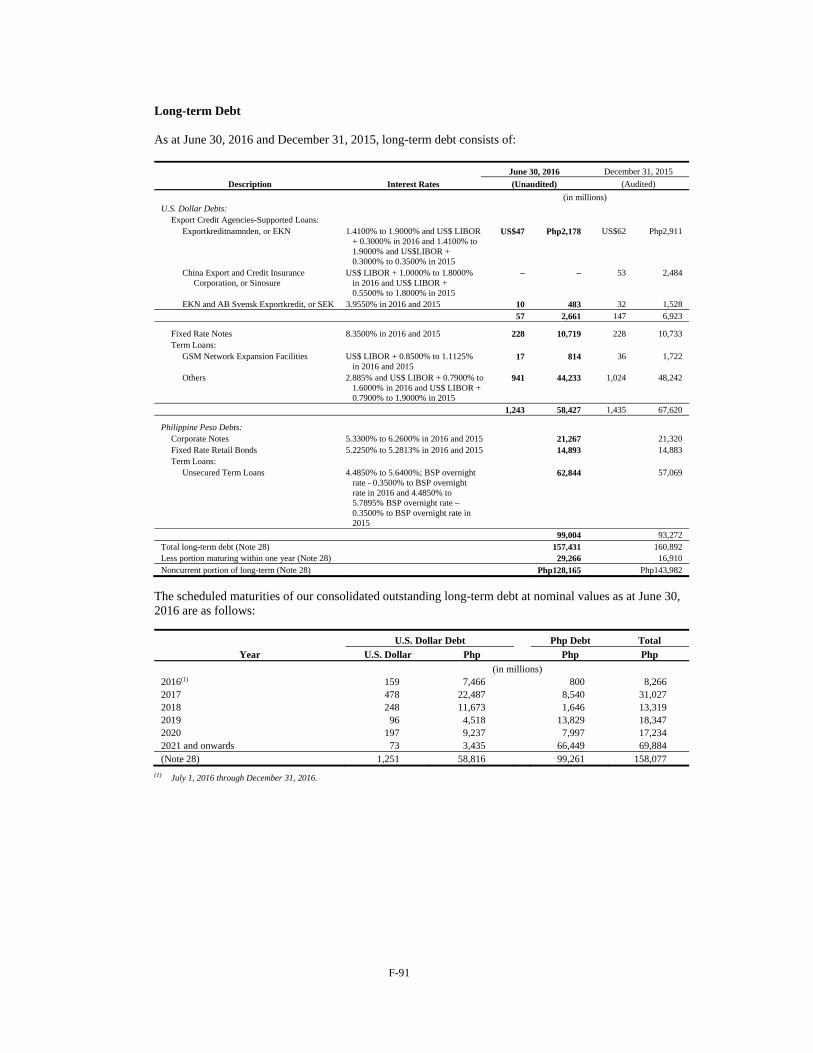
F-91
Long-term Debt As at June 30, 2016 and December 31, 2015, long-term debt consists of:
June 30, 2016 December 31, 2015
Description Interest Rates (Unaudited) (Audited)
(in millions) U.S. Dollar Debts:
Export Credit Agencies-Supported Loans: Exportkreditnamnden, or EKN 1.4100% to 1.9000% and US$ LIBOR
+ 0.3000% in 2016 and 1.4100% to 1.9000% and US$LIBOR + 0.3000% to 0.3500% in 2015
US$47 Php2,178 US$62 Php2,911
China Export and Credit Insurance Corporation, or Sinosure
US$ LIBOR + 1.0000% to 1.8000% in 2016 and US$ LIBOR + 0.5500% to 1.8000% in 2015
– – 53 2,484
EKN and AB Svensk Exportkredit, or SEK 3.9550% in 2016 and 2015 10 483 32 1,528 57 2,661 147 6,923
Fixed Rate Notes 8.3500% in 2016 and 2015 228 10,719 228 10,733 Term Loans:
GSM Network Expansion Facilities US$ LIBOR + 0.8500% to 1.1125% in 2016 and 2015
17 814 36 1,722
Others 2.885% and US$ LIBOR + 0.7900% to 1.6000% in 2016 and US$ LIBOR + 0.7900% to 1.9000% in 2015
941 44,233 1,024 48,242
1,243 58,427 1,435 67,620
Philippine Peso Debts: Corporate Notes 5.3300% to 6.2600% in 2016 and 2015 21,267 21,320 Fixed Rate Retail Bonds 5.2250% to 5.2813% in 2016 and 2015 14,893 14,883 Term Loans:
Unsecured Term Loans
4.4850% to 5.6400%; BSP overnight rate - 0.3500% to BSP overnight rate in 2016 and 4.4850% to 5.7895% BSP overnight rate – 0.3500% to BSP overnight rate in 2015
62,844 57,069
99,004 93,272 Total long-term debt (Note 28) 157,431 160,892 Less portion maturing within one year (Note 28) 29,266 16,910 Noncurrent portion of long-term (Note 28) Php128,165 Php143,982
The scheduled maturities of our consolidated outstanding long-term debt at nominal values as at June 30, 2016 are as follows:
U.S. Dollar Debt Php Debt Total
Year U.S. Dollar Php Php Php
(in millions) 2016(1) 159 7,466 800 8,266 2017 478 22,487 8,540 31,027 2018 248 11,673 1,646 13,319 2019 96 4,518 13,829 18,347 2020 197 9,237 7,997 17,234 2021 and onwards 73 3,435 66,449 69,884 (Note 28) 1,251 58,816 99,261 158,077
(1) July 1, 2016 through December 31, 2016.
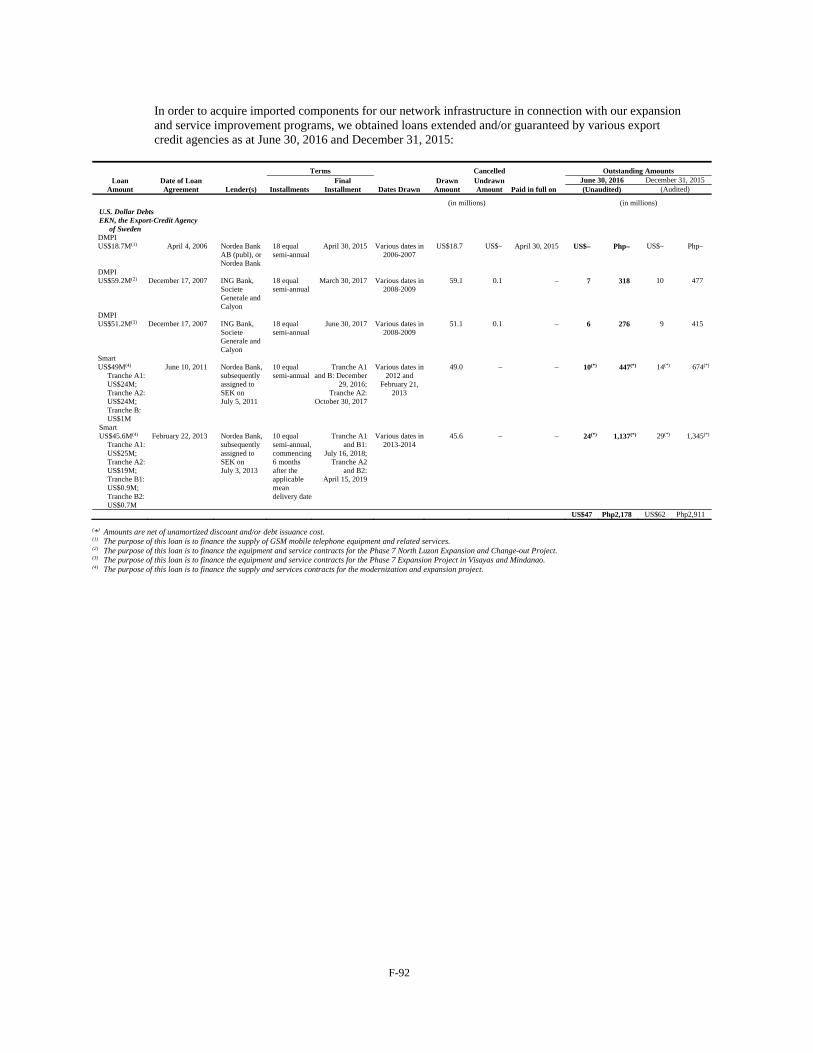
F-92
In order to acquire imported components for our network infrastructure in connection with our expansion and service improvement programs, we obtained loans extended and/or guaranteed by various export credit agencies as at June 30, 2016 and December 31, 2015:
Terms Cancelled Outstanding Amounts
Loan Amount
Date of Loan Agreement Lender(s) Installments
Final Installment Dates Drawn
Drawn Amount
Undrawn Amount Paid in full on
June 30, 2016 December 31, 2015(Unaudited) (Audited)
(in millions) (in millions) U.S. Dollar Debts EKN, the Export-Credit Agency
of Sweden
DMPI US$18.7M(1) April 4, 2006 Nordea Bank
AB (publ), or Nordea Bank
18 equal semi-annual
April 30, 2015 Various dates in 2006-2007
US$18.7 US$– April 30, 2015 US$– Php– US$– Php–
DMPI US$59.2M(2) December 17, 2007 ING Bank,
Societe Generale and Calyon
18 equal semi-annual
March 30, 2017 Various dates in 2008-2009
59.1 0.1 – 7 318 10 477
DMPI US$51.2M(3) December 17, 2007 ING Bank,
Societe Generale and Calyon
18 equal semi-annual
June 30, 2017 Various dates in 2008-2009
51.1 0.1 – 6 276 9 415
Smart US$49M(4)
Tranche A1: US$24M; Tranche A2: US$24M; Tranche B: US$1M
June 10, 2011 Nordea Bank, subsequently assigned to SEK on July 5, 2011
10 equal semi-annual
Tranche A1 and B: December
29, 2016; Tranche A2:
October 30, 2017
Various dates in 2012 and
February 21, 2013
49.0 – – 10(*) 447(*) 14(*) 674(*)
Smart US$45.6M(4)
Tranche A1: US$25M; Tranche A2: US$19M; Tranche B1: US$0.9M; Tranche B2: US$0.7M
February 22, 2013 Nordea Bank, subsequently assigned to SEK on July 3, 2013
10 equal semi-annual, commencing 6 months after the applicable mean delivery date
Tranche A1 and B1:
July 16, 2018; Tranche A2
and B2: April 15, 2019
Various dates in 2013-2014
45.6 – – 24(*) 1,137(*) 29(*) 1,345(*)
US$47 Php2,178 US$62 Php2,911 (*) Amounts are net of unamortized discount and/or debt issuance cost. (1) The purpose of this loan is to finance the supply of GSM mobile telephone equipment and related services. (2) The purpose of this loan is to finance the equipment and service contracts for the Phase 7 North Luzon Expansion and Change-out Project. (3) The purpose of this loan is to finance the equipment and service contracts for the Phase 7 Expansion Project in Visayas and Mindanao. (4) The purpose of this loan is to finance the supply and services contracts for the modernization and expansion project.
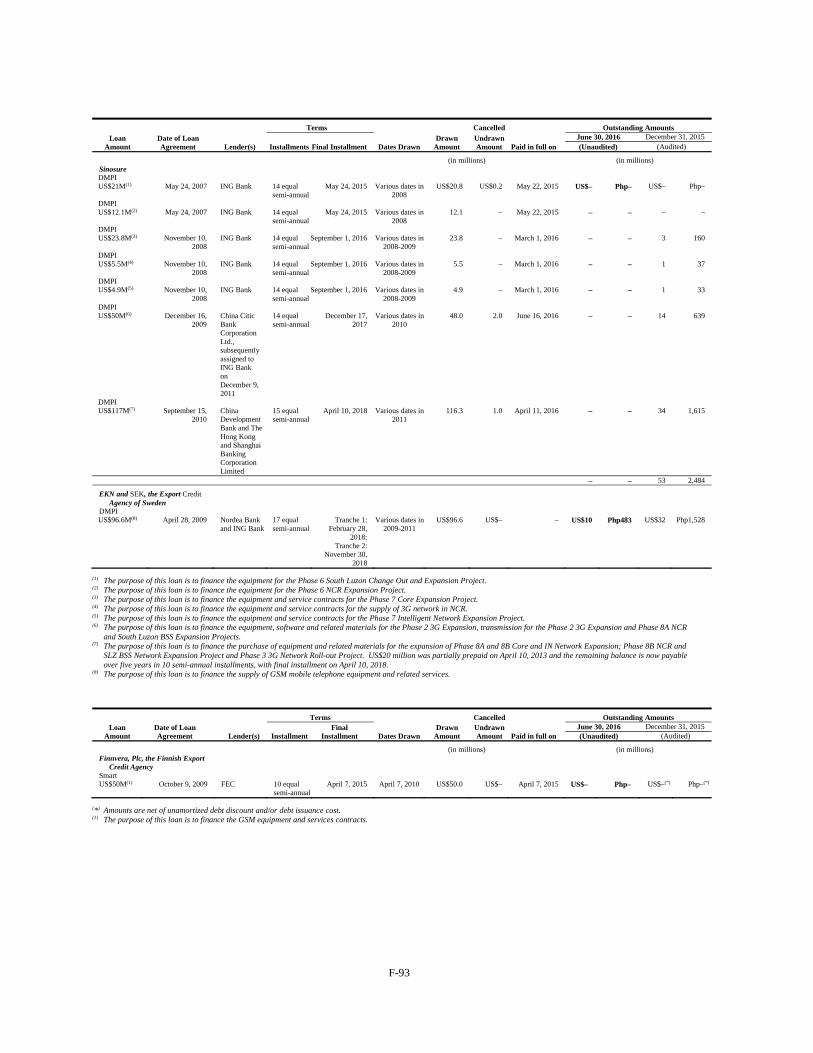
F-93
Terms Cancelled Outstanding Amounts
Loan Amount
Date of Loan Agreement Lender(s) Installments Final Installment Dates Drawn
Drawn Amount
Undrawn Amount Paid in full on
June 30, 2016 December 31, 2015 (Unaudited) (Audited)
(in millions) (in millions) Sinosure DMPI US$21M(1) May 24, 2007 ING Bank 14 equal
semi-annual May 24, 2015 Various dates in
2008 US$20.8 US$0.2 May 22, 2015 US$– Php– US$– Php–
DMPI US$12.1M(2) May 24, 2007 ING Bank 14 equal
semi-annual May 24, 2015 Various dates in
2008 12.1 – May 22, 2015 – – – –
DMPI US$23.8M(3) November 10,
2008 ING Bank 14 equal
semi-annual September 1, 2016 Various dates in
2008-2009 23.8 – March 1, 2016 – – 3 160
DMPI US$5.5M(4) November 10,
2008 ING Bank 14 equal
semi-annual September 1, 2016 Various dates in
2008-2009 5.5 – March 1, 2016 – – 1 37
DMPI US$4.9M(5) November 10,
2008 ING Bank 14 equal
semi-annual September 1, 2016 Various dates in
2008-2009 4.9 – March 1, 2016 – – 1 33
DMPI US$50M(6) December 16,
2009 China Citic Bank Corporation Ltd., subsequently assigned to ING Bank on December 9, 2011
14 equal semi-annual
December 17, 2017
Various dates in 2010
48.0 2.0 June 16, 2016 – – 14 639
DMPI US$117M(7) September 15,
2010 China Development Bank and The Hong Kong and Shanghai Banking Corporation Limited
15 equal semi-annual
April 10, 2018 Various dates in 2011
116.3 1.0 April 11, 2016 – – 34 1,615
– – 53 2,484
EKN and SEK, the Export Credit Agency of Sweden
DMPI US$96.6M(8) April 28, 2009 Nordea Bank
and ING Bank 17 equal semi-annual
Tranche 1: February 28,
2018; Tranche 2:
November 30, 2018
Various dates in 2009-2011
US$96.6 US$– – US$10 Php483 US$32 Php1,528
(1) The purpose of this loan is to finance the equipment for the Phase 6 South Luzon Change Out and Expansion Project. (2) The purpose of this loan is to finance the equipment for the Phase 6 NCR Expansion Project. (3) The purpose of this loan is to finance the equipment and service contracts for the Phase 7 Core Expansion Project. (4) The purpose of this loan is to finance the equipment and service contracts for the supply of 3G network in NCR. (5) The purpose of this loan is to finance the equipment and service contracts for the Phase 7 Intelligent Network Expansion Project. (6) The purpose of this loan is to finance the equipment, software and related materials for the Phase 2 3G Expansion, transmission for the Phase 2 3G Expansion and Phase 8A NCR
and South Luzon BSS Expansion Projects. (7) The purpose of this loan is to finance the purchase of equipment and related materials for the expansion of Phase 8A and 8B Core and IN Network Expansion; Phase 8B NCR and
SLZ BSS Network Expansion Project and Phase 3 3G Network Roll-out Project. US$20 million was partially prepaid on April 10, 2013 and the remaining balance is now payable over five years in 10 semi-annual installments, with final installment on April 10, 2018.
(8) The purpose of this loan is to finance the supply of GSM mobile telephone equipment and related services.
Terms Cancelled Outstanding Amounts Loan
Amount Date of Loan Agreement Lender(s) Installment
Final Installment Dates Drawn
Drawn Amount
Undrawn Amount Paid in full on
June 30, 2016 December 31, 2015(Unaudited) (Audited)
(in millions) (in millions) Finnvera, Plc, the Finnish Export
Credit Agency
Smart US$50M(1) October 9, 2009 FEC 10 equal
semi-annual April 7, 2015 April 7, 2010 US$50.0 US$– April 7, 2015 US$– Php– US$–(*) Php–(*)
(*) Amounts are net of unamortized debt discount and/or debt issuance cost. (1) The purpose of this loan is to finance the GSM equipment and services contracts.
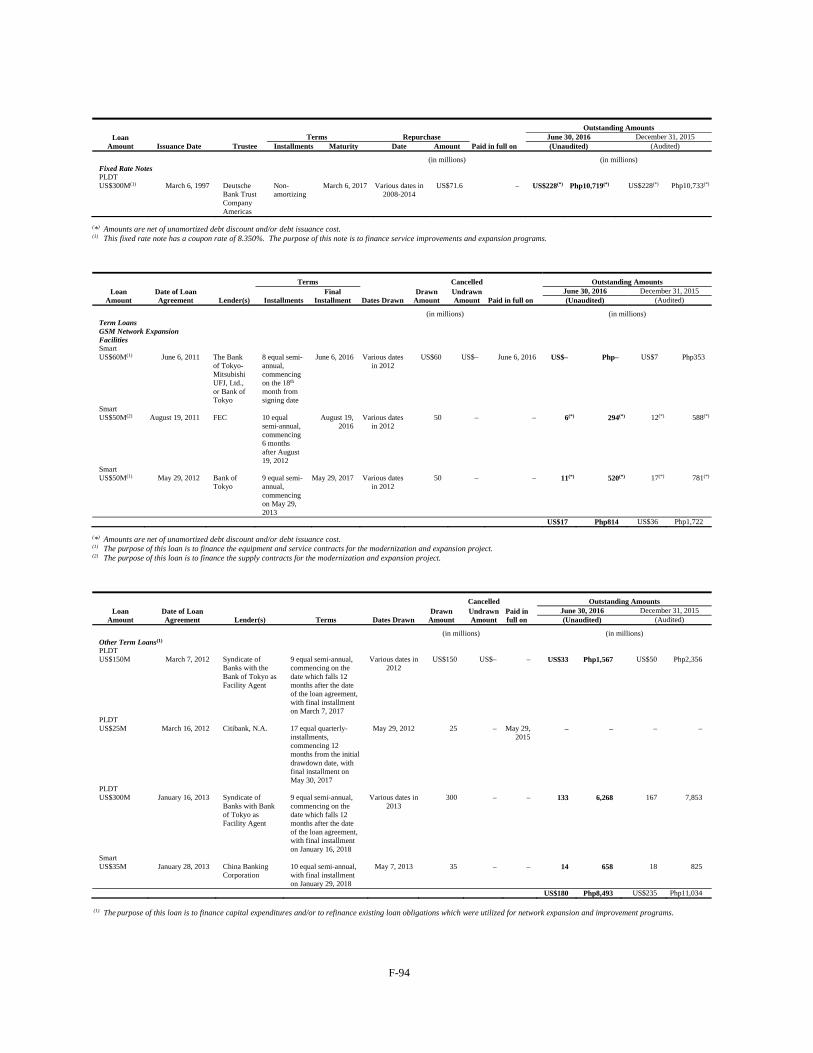
F-94
Loan Amount Issuance Date Trustee
Terms Repurchase Paid in full on
Outstanding Amounts June 30, 2016 December 31, 2015
Installments Maturity Date Amount (Unaudited) (Audited)
(in millions) (in millions) Fixed Rate Notes PLDT US$300M(1) March 6, 1997 Deutsche
Bank Trust Company Americas
Non-amortizing
March 6, 2017 Various dates in 2008-2014
US$71.6 – US$228(*) Php10,719(*) US$228(*) Php10,733(*)
(*) Amounts are net of unamortized debt discount and/or debt issuance cost. (1) This fixed rate note has a coupon rate of 8.350%. The purpose of this note is to finance service improvements and expansion programs.
Terms Cancelled Outstanding AmountsLoan
Amount Date of Loan Agreement Lender(s) Installments
Final Installment Dates Drawn
Drawn Amount
Undrawn Amount Paid in full on
June 30, 2016 December 31, 2015 (Unaudited) (Audited)
(in millions) (in millions) Term Loans GSM Network Expansion Facilities
Smart US$60M(1) June 6, 2011 The Bank
of Tokyo-Mitsubishi UFJ, Ltd., or Bank of Tokyo
8 equal semi-annual, commencing on the 18th month from signing date
June 6, 2016 Various dates in 2012
US$60 US$– June 6, 2016 US$– Php– US$7 Php353
Smart US$50M(2) August 19, 2011 FEC 10 equal
semi-annual, commencing 6 months after August 19, 2012
August 19, 2016
Various dates in 2012
50 – – 6(*) 294(*) 12(*) 588(*)
Smart US$50M(1) May 29, 2012 Bank of
Tokyo 9 equal semi-annual, commencing on May 29, 2013
May 29, 2017 Various dates in 2012
50 – – 11(*) 520(*) 17(*) 781(*)
US$17 Php814 US$36 Php1,722 (*) Amounts are net of unamortized debt discount and/or debt issuance cost. (1) The purpose of this loan is to finance the equipment and service contracts for the modernization and expansion project. (2) The purpose of this loan is to finance the supply contracts for the modernization and expansion project.
Cancelled Outstanding Amounts Loan
Amount Date of Loan Agreement Lender(s)
Terms Dates Drawn
Drawn Amount
Undrawn Amount
Paid in full on
June 30, 2016 December 31, 2015(Unaudited) (Audited)
(in millions) (in millions) Other Term Loans(1) PLDT US$150M March 7, 2012 Syndicate of
Banks with the Bank of Tokyo as Facility Agent
9 equal semi-annual, commencing on the date which falls 12 months after the date of the loan agreement, with final installment on March 7, 2017
Various dates in 2012
US$150 US$– – US$33 Php1,567 US$50 Php2,356
PLDT US$25M March 16, 2012 Citibank, N.A. 17 equal quarterly-
installments, commencing 12 months from the initial drawdown date, with final installment on May 30, 2017
May 29, 2012 25 – May 29, 2015
– – – –
PLDT US$300M January 16, 2013 Syndicate of
Banks with Bank of Tokyo as Facility Agent
9 equal semi-annual, commencing on the date which falls 12 months after the date of the loan agreement, with final installment on January 16, 2018
Various dates in 2013
300 – – 133 6,268 167 7,853
Smart US$35M January 28, 2013 China Banking
Corporation 10 equal semi-annual, with final installment on January 29, 2018
May 7, 2013 35 – – 14 658 18 825
US$180 Php8,493 US$235 Php11,034
(1) The purpose of this loan is to finance capital expenditures and/or to refinance existing loan obligations which were utilized for network expansion and improvement programs.
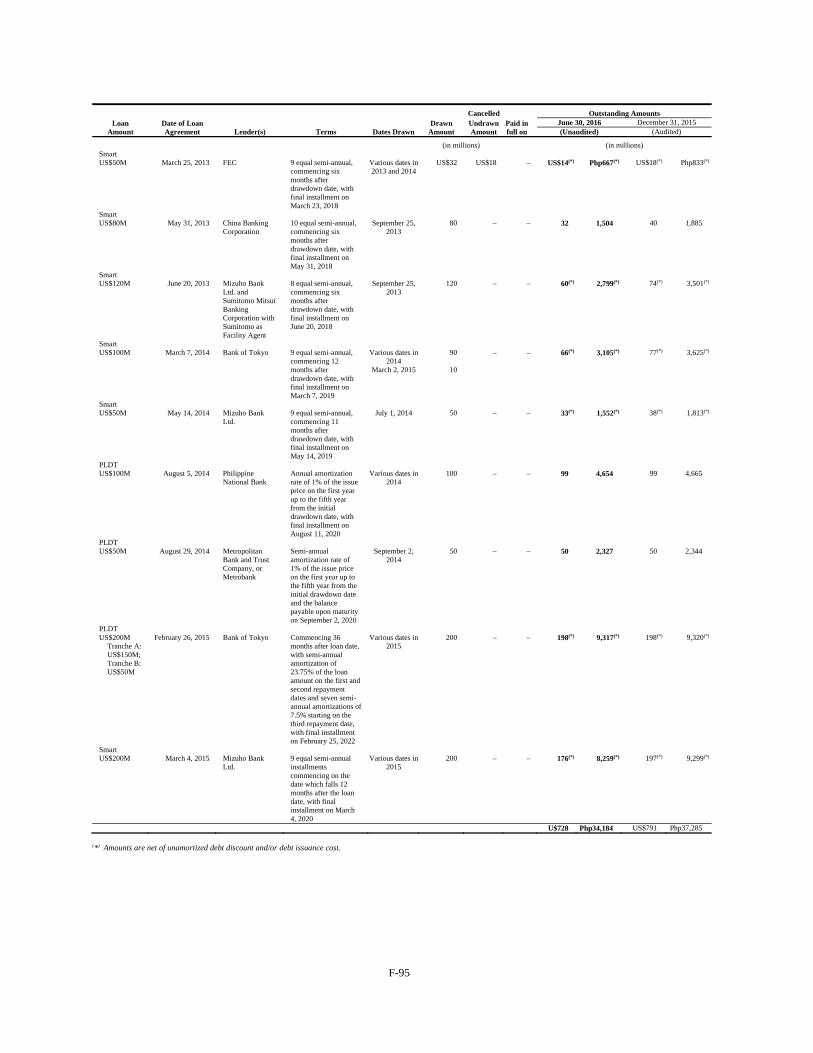
F-95
Cancelled Outstanding Amounts Loan
Amount Date of Loan Agreement Lender(s)
Terms Dates Drawn
Drawn Amount
Undrawn Amount
Paid in full on
June 30, 2016 December 31, 2015(Unaudited) (Audited)
(in millions) (in millions) Smart US$50M March 25, 2013 FEC 9 equal semi-annual,
commencing six months after drawdown date, with final installment on March 23, 2018
Various dates in 2013 and 2014
US$32 US$18 – US$14(*) Php667(*) US$18(*) Php833(*)
Smart US$80M May 31, 2013 China Banking
Corporation 10 equal semi-annual, commencing six months after drawdown date, with final installment on May 31, 2018
September 25, 2013
80 – – 32 1,504 40 1,885
Smart US$120M June 20, 2013 Mizuho Bank
Ltd. and Sumitomo Mitsui Banking Corporation with Sumitomo as Facility Agent
8 equal semi-annual, commencing six months after drawdown date, with final installment on June 20, 2018
September 25, 2013
120 – – 60(*) 2,799(*) 74(*) 3,501(*)
Smart US$100M March 7, 2014 Bank of Tokyo 9 equal semi-annual,
commencing 12 months after drawdown date, with final installment on March 7, 2019
Various dates in 2014
March 2, 2015
90
10
–
–
66(*)
3,105(*)
77(*) 3,625(*)
Smart US$50M May 14, 2014 Mizuho Bank
Ltd. 9 equal semi-annual, commencing 11 months after drawdown date, with final installment on May 14, 2019
July 1, 2014 50 – – 33(*) 1,552(*) 38(*) 1,813(*)
PLDT US$100M August 5, 2014 Philippine
National Bank Annual amortization rate of 1% of the issue price on the first year up to the fifth year from the initial drawdown date, with final installment on August 11, 2020
Various dates in 2014
100 – – 99 4,654 99 4,665
PLDT US$50M August 29, 2014 Metropolitan
Bank and Trust Company, or Metrobank
Semi-annual amortization rate of 1% of the issue price on the first year up to the fifth year from the initial drawdown date and the balance payable upon maturity on September 2, 2020
September 2, 2014
50 – – 50 2,327 50 2,344
PLDT US$200M
Tranche A: US$150M; Tranche B: US$50M
February 26, 2015 Bank of Tokyo Commencing 36 months after loan date, with semi-annual amortization of 23.75% of the loan amount on the first and second repayment dates and seven semi-annual amortizations of 7.5% starting on the third repayment date, with final installment on February 25, 2022
Various dates in 2015
200 – – 198(*) 9,317(*) 198(*) 9,320(*)
Smart US$200M March 4, 2015
Mizuho Bank Ltd.
9 equal semi-annual installments commencing on the date which falls 12 months after the loan date, with final installment on March 4, 2020
Various dates in 2015
200 – – 176(*) 8,259(*) 197(*) 9,299(*)
U$728 Php34,184 US$791 Php37,285
(*) Amounts are net of unamortized debt discount and/or debt issuance cost.
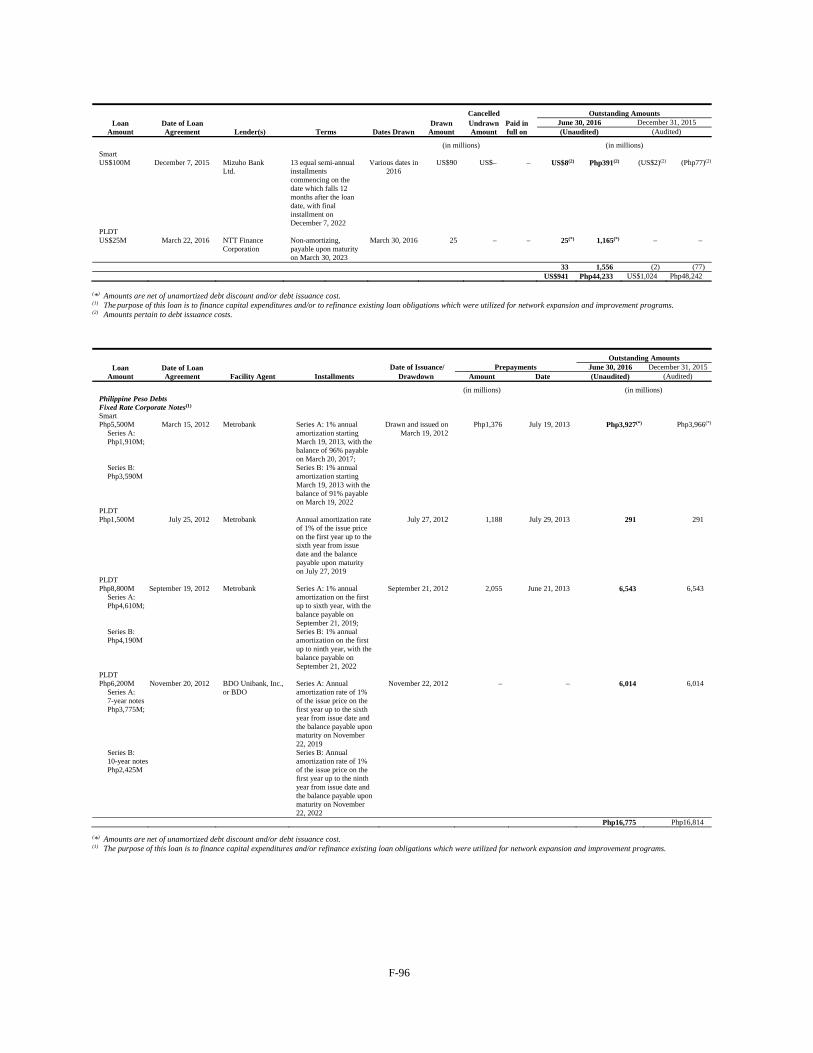
F-96
Cancelled Outstanding Amounts Loan
Amount Date of Loan Agreement Lender(s)
Terms Dates Drawn
Drawn Amount
Undrawn Amount
Paid in full on
June 30, 2016 December 31, 2015(Unaudited) (Audited)
(in millions) (in millions) Smart US$100M December 7, 2015 Mizuho Bank
Ltd. 13 equal semi-annual installments commencing on the date which falls 12 months after the loan date, with final installment on December 7, 2022
Various dates in 2016
US$90
US$– – US$8(2) Php391(2) (US$2)(2) (Php77)(2)
PLDT US$25M March 22, 2016 NTT Finance
Corporation Non-amortizing, payable upon maturity on March 30, 2023
March 30, 2016 25 – – 25(*) 1,165(*) – –
33 1,556 (2) (77) US$941 Php44,233 US$1,024 Php48,242
(*) Amounts are net of unamortized debt discount and/or debt issuance cost. (1) The purpose of this loan is to finance capital expenditures and/or to refinance existing loan obligations which were utilized for network expansion and improvement programs. (2) Amounts pertain to debt issuance costs.
Outstanding AmountsLoan
Amount Date of Loan Agreement Facility Agent Installments
Date of Issuance/ Prepayments June 30, 2016 December 31, 2015 Drawdown Amount Date (Unaudited) (Audited)
(in millions) (in millions) Philippine Peso Debts Fixed Rate Corporate Notes(1) Smart Php5,500M
Series A: Php1,910M;
March 15, 2012 Metrobank Series A: 1% annual amortization starting March 19, 2013, with the balance of 96% payable on March 20, 2017;
Drawn and issued on March 19, 2012
Php1,376 July 19, 2013 Php3,927(*) Php3,966(*)
Series B: Php3,590M
Series B: 1% annual amortization starting March 19, 2013 with the balance of 91% payable on March 19, 2022
PLDT Php1,500M July 25, 2012 Metrobank Annual amortization rate
of 1% of the issue price on the first year up to the sixth year from issue date and the balance payable upon maturity on July 27, 2019
July 27, 2012 1,188 July 29, 2013 291 291
PLDT Php8,800M
Series A: Php4,610M;
September 19, 2012 Metrobank Series A: 1% annual amortization on the first up to sixth year, with the balance payable on September 21, 2019;
September 21, 2012 2,055 June 21, 2013 6,543 6,543
Series B: Php4,190M
Series B: 1% annual amortization on the first up to ninth year, with the balance payable on September 21, 2022
PLDT Php6,200M
Series A: 7-year notes Php3,775M;
November 20, 2012 BDO Unibank, Inc., or BDO
Series A: Annual amortization rate of 1% of the issue price on the first year up to the sixth year from issue date and the balance payable upon maturity on November 22, 2019
November 22, 2012 – – 6,014 6,014
Series B: 10-year notes Php2,425M
Series B: Annual amortization rate of 1% of the issue price on the first year up to the ninth year from issue date and the balance payable upon maturity on November 22, 2022
Php16,775 Php16,814 (*) Amounts are net of unamortized debt discount and/or debt issuance cost. (1) The purpose of this loan is to finance capital expenditures and/or refinance existing loan obligations which were utilized for network expansion and improvement programs.
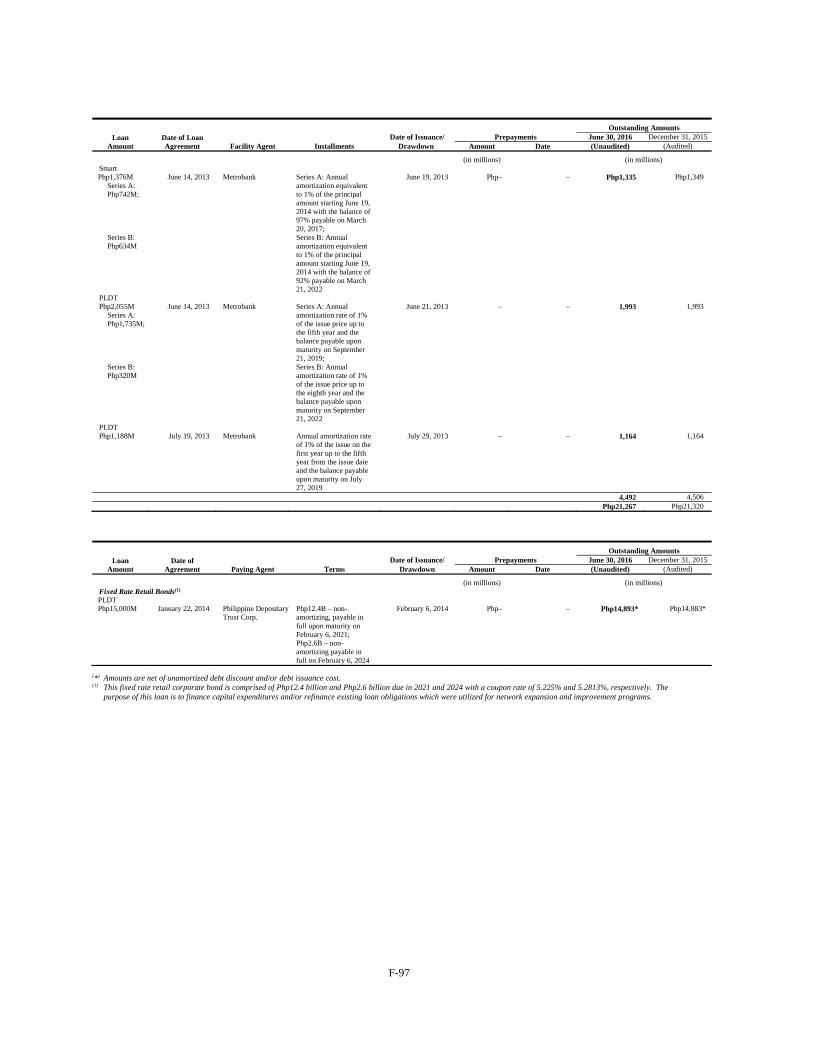
F-97
Outstanding Amounts
Loan Amount
Date of Loan Agreement Facility Agent Installments
Date of Issuance/ Prepayments June 30, 2016 December 31, 2015 Drawdown Amount Date (Unaudited) (Audited)
(in millions) (in millions) Smart Php1,376M Series A: Php742M;
June 14, 2013 Metrobank Series A: Annual amortization equivalent to 1% of the principal amount starting June 19, 2014 with the balance of 97% payable on March 20, 2017;
June 19, 2013 Php– – Php1,335 Php1,349
Series B: Php634M
Series B: Annual amortization equivalent to 1% of the principal amount starting June 19, 2014 with the balance of 92% payable on March 21, 2022
PLDT Php2,055M
Series A: Php1,735M;
June 14, 2013 Metrobank Series A: Annual amortization rate of 1% of the issue price up to the fifth year and the balance payable upon maturity on September 21, 2019;
June 21, 2013 – – 1,993 1,993
Series B: Php320M
Series B: Annual amortization rate of 1% of the issue price up to the eighth year and the balance payable upon maturity on September 21, 2022
PLDT Php1,188M July 19, 2013 Metrobank Annual amortization rate
of 1% of the issue on the first year up to the fifth year from the issue date and the balance payable upon maturity on July 27, 2019
July 29, 2013 – – 1,164 1,164
4,492 4,506 Php21,267 Php21,320
Outstanding AmountsLoan
Amount Date of
Agreement Paying Agent Terms Date of Issuance/ Prepayments June 30, 2016 December 31, 2015
Drawdown Amount Date (Unaudited) (Audited) (in millions) (in millions) Fixed Rate Retail Bonds(1) PLDT Php15,000M January 22, 2014 Philippine Depositary
Trust Corp. Php12.4B – non-amortizing, payable in full upon maturity on February 6, 2021; Php2.6B – non-amortizing payable in full on February 6, 2024
February 6, 2014 Php– – Php14,893* Php14,883*
(*) Amounts are net of unamortized debt discount and/or debt issuance cost. (1) This fixed rate retail corporate bond is comprised of Php12.4 billion and Php2.6 billion due in 2021 and 2024 with a coupon rate of 5.225% and 5.2813%, respectively. The
purpose of this loan is to finance capital expenditures and/or refinance existing loan obligations which were utilized for network expansion and improvement programs.
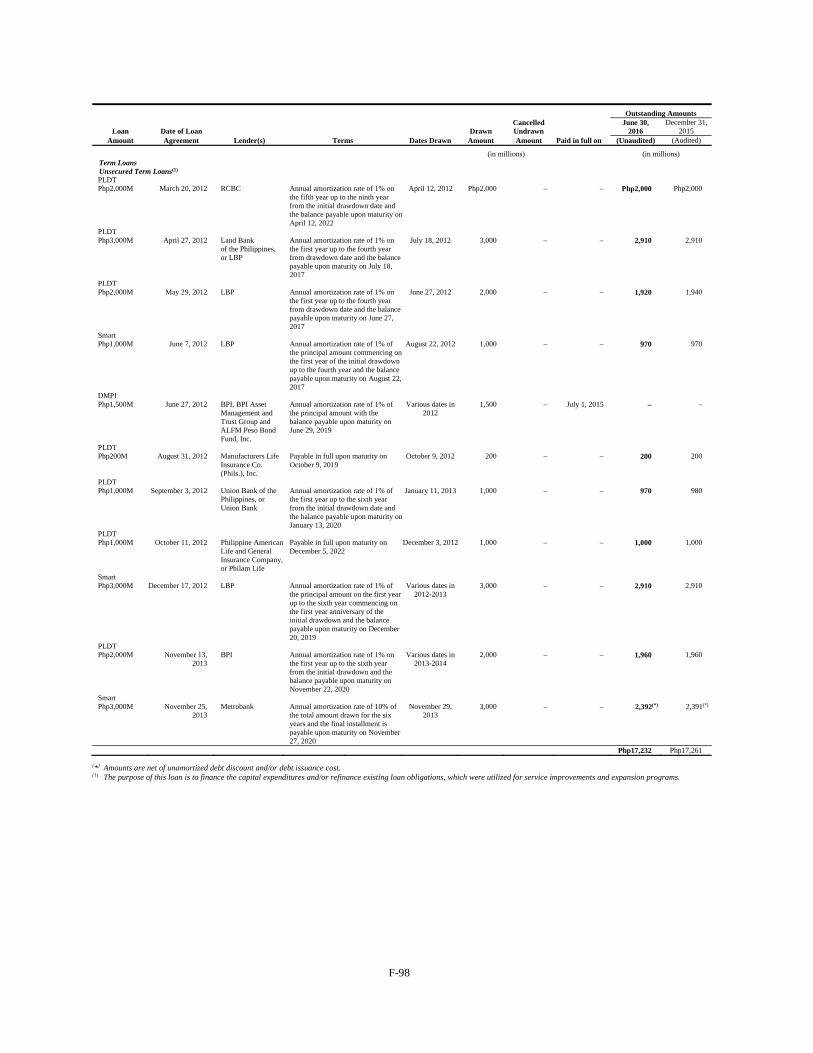
F-98
Loan Date of Loan Drawn Cancelled Undrawn
Outstanding Amounts June 30,
2016 December 31,
2015 Amount Agreement Lender(s) Terms Dates Drawn Amount Amount Paid in full on (Unaudited) (Audited)
(in millions) (in millions) Term Loans Unsecured Term Loans(1) PLDT Php2,000M March 20, 2012 RCBC Annual amortization rate of 1% on
the fifth year up to the ninth year from the initial drawdown date and the balance payable upon maturity onApril 12, 2022
April 12, 2012 Php2,000 – – Php2,000 Php2,000
PLDT Php3,000M April 27, 2012 Land Bank
of the Philippines, or LBP
Annual amortization rate of 1% on the first year up to the fourth year from drawdown date and the balance payable upon maturity on July 18, 2017
July 18, 2012 3,000 – – 2,910 2,910
PLDT Php2,000M May 29, 2012 LBP Annual amortization rate of 1% on
the first year up to the fourth year from drawdown date and the balance payable upon maturity on June 27, 2017
June 27, 2012 2,000 – – 1,920 1,940
Smart Php1,000M June 7, 2012 LBP Annual amortization rate of 1% of
the principal amount commencing on the first year of the initial drawdown up to the fourth year and the balance payable upon maturity on August 22, 2017
August 22, 2012 1,000 – – 970 970
DMPI Php1,500M June 27, 2012 BPI, BPI Asset
Management and Trust Group and ALFM Peso Bond Fund, Inc.
Annual amortization rate of 1% of the principal amount with the balance payable upon maturity on June 29, 2019
Various dates in 2012
1,500 – July 1, 2015 – –
PLDT Php200M August 31, 2012 Manufacturers Life
Insurance Co. (Phils.), Inc.
Payable in full upon maturity on October 9, 2019
October 9, 2012 200 – – 200 200
PLDT Php1,000M September 3, 2012 Union Bank of the
Philippines, or Union Bank
Annual amortization rate of 1% of the first year up to the sixth year from the initial drawdown date and the balance payable upon maturity onJanuary 13, 2020
January 11, 2013 1,000 – – 970 980
PLDT Php1,000M October 11, 2012 Philippine American
Life and General Insurance Company, or Philam Life
Payable in full upon maturity on December 5, 2022
December 3, 2012 1,000 – – 1,000 1,000
Smart Php3,000M December 17, 2012 LBP Annual amortization rate of 1% of
the principal amount on the first year up to the sixth year commencing on the first year anniversary of the initial drawdown and the balance payable upon maturity on December 20, 2019
Various dates in 2012-2013
3,000 – – 2,910 2,910
PLDT Php2,000M November 13,
2013 BPI Annual amortization rate of 1% on
the first year up to the sixth year from the initial drawdown and the balance payable upon maturity on November 22, 2020
Various dates in 2013-2014
2,000 – – 1,960 1,960
Smart Php3,000M November 25,
2013 Metrobank Annual amortization rate of 10% of
the total amount drawn for the six years and the final installment is payable upon maturity on November 27, 2020
November 29, 2013
3,000 – – 2,392(*) 2,391(*)
Php17,232 Php17,261 (*) Amounts are net of unamortized debt discount and/or debt issuance cost. (1) The purpose of this loan is to finance the capital expenditures and/or refinance existing loan obligations, which were utilized for service improvements and expansion programs.
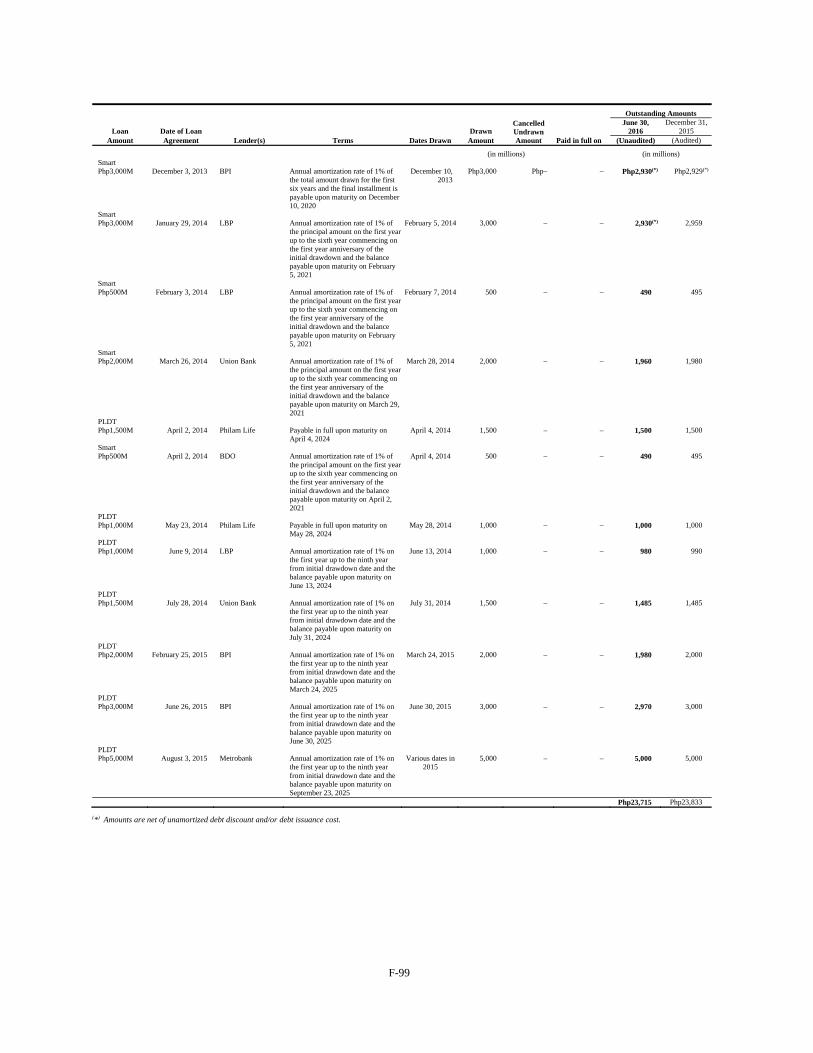
F-99
Cancelled Undrawn Amount
Outstanding Amounts
Loan Date of Loan Drawn June 30,
2016 December 31,
2015 Amount Agreement Lender(s) Terms Dates Drawn Amount Paid in full on (Unaudited) (Audited)
(in millions) (in millions) Smart Php3,000M December 3, 2013 BPI Annual amortization rate of 1% of
the total amount drawn for the first six years and the final installment is payable upon maturity on December 10, 2020
December 10, 2013
Php3,000 Php– – Php2,930(*) Php2,929(*)
Smart Php3,000M January 29, 2014 LBP Annual amortization rate of 1% of
the principal amount on the first year up to the sixth year commencing on the first year anniversary of the initial drawdown and the balance payable upon maturity on February 5, 2021
February 5, 2014 3,000 – – 2,930(*) 2,959
Smart Php500M February 3, 2014 LBP Annual amortization rate of 1% of
the principal amount on the first year up to the sixth year commencing on the first year anniversary of the initial drawdown and the balance payable upon maturity on February 5, 2021
February 7, 2014 500 – – 490 495
Smart Php2,000M March 26, 2014 Union Bank Annual amortization rate of 1% of
the principal amount on the first year up to the sixth year commencing on the first year anniversary of the initial drawdown and the balance payable upon maturity on March 29, 2021
March 28, 2014 2,000 – – 1,960 1,980
PLDT Php1,500M April 2, 2014 Philam Life Payable in full upon maturity on
April 4, 2024 April 4, 2014 1,500 – – 1,500 1,500
Smart Php500M April 2, 2014 BDO Annual amortization rate of 1% of
the principal amount on the first year up to the sixth year commencing on the first year anniversary of the initial drawdown and the balance payable upon maturity on April 2, 2021
April 4, 2014 500 – – 490 495
PLDT Php1,000M May 23, 2014 Philam Life Payable in full upon maturity on
May 28, 2024 May 28, 2014 1,000 – – 1,000 1,000
PLDT Php1,000M June 9, 2014 LBP Annual amortization rate of 1% on
the first year up to the ninth year from initial drawdown date and the balance payable upon maturity on June 13, 2024
June 13, 2014 1,000 – – 980 990
PLDT Php1,500M July 28, 2014 Union Bank Annual amortization rate of 1% on
the first year up to the ninth year from initial drawdown date and the balance payable upon maturity on July 31, 2024
July 31, 2014 1,500 – – 1,485 1,485
PLDT Php2,000M February 25, 2015 BPI Annual amortization rate of 1% on
the first year up to the ninth year from initial drawdown date and the balance payable upon maturity on March 24, 2025
March 24, 2015 2,000 – – 1,980 2,000
PLDT Php3,000M June 26, 2015 BPI Annual amortization rate of 1% on
the first year up to the ninth year from initial drawdown date and the balance payable upon maturity on June 30, 2025
June 30, 2015 3,000 – – 2,970 3,000
PLDT Php5,000M August 3, 2015 Metrobank Annual amortization rate of 1% on
the first year up to the ninth year from initial drawdown date and the balance payable upon maturity on September 23, 2025
Various dates in 2015
5,000 – – 5,000 5,000
Php23,715 Php23,833 (*) Amounts are net of unamortized debt discount and/or debt issuance cost.
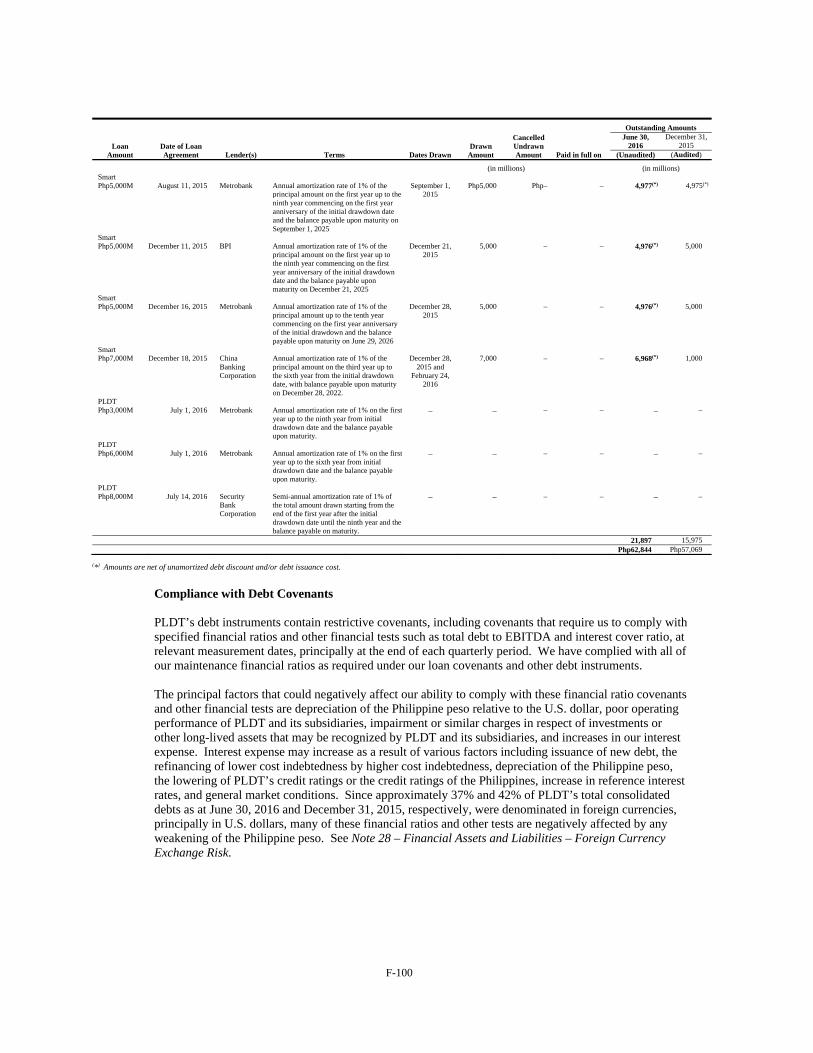
F-100
Cancelled Undrawn Amount
Outstanding Amounts
Loan Amount
Date of Loan Agreement
Drawn Amount
June 30,
2016 December 31,
2015 Lender(s) Terms Dates Drawn Paid in full on (Unaudited) (Audited)
(in millions) (in millions) Smart Php5,000M August 11, 2015 Metrobank Annual amortization rate of 1% of the
principal amount on the first year up to the ninth year commencing on the first year anniversary of the initial drawdown date and the balance payable upon maturity on September 1, 2025
September 1, 2015
Php5,000 Php– – 4,977(*) 4,975(*)
Smart Php5,000M December 11, 2015 BPI Annual amortization rate of 1% of the
principal amount on the first year up to the ninth year commencing on the first year anniversary of the initial drawdown date and the balance payable upon maturity on December 21, 2025
December 21, 2015
5,000 – – 4,976(*) 5,000
Smart Php5,000M December 16, 2015 Metrobank Annual amortization rate of 1% of the
principal amount up to the tenth year commencing on the first year anniversary of the initial drawdown and the balance payable upon maturity on June 29, 2026
December 28, 2015
5,000 – – 4,976(*) 5,000
Smart Php7,000M December 18, 2015 China
Banking Corporation
Annual amortization rate of 1% of the principal amount on the third year up to the sixth year from the initial drawdown date, with balance payable upon maturity on December 28, 2022.
December 28, 2015 and
February 24, 2016
7,000 –
–
6,968(*)
1,000
PLDT Php3,000M July 1, 2016 Metrobank Annual amortization rate of 1% on the first
year up to the ninth year from initial drawdown date and the balance payable upon maturity.
– – – – – –
PLDT Php6,000M July 1, 2016 Metrobank Annual amortization rate of 1% on the first
year up to the sixth year from initial drawdown date and the balance payable upon maturity.
– – – – – –
PLDT Php8,000M July 14, 2016 Security
Bank Corporation
Semi-annual amortization rate of 1% of the total amount drawn starting from the end of the first year after the initial drawdown date until the ninth year and the balance payable on maturity.
– – – – – –
21,897 15,975 Php62,844 Php57,069
(*) Amounts are net of unamortized debt discount and/or debt issuance cost.
Compliance with Debt Covenants PLDT’s debt instruments contain restrictive covenants, including covenants that require us to comply with specified financial ratios and other financial tests such as total debt to EBITDA and interest cover ratio, at relevant measurement dates, principally at the end of each quarterly period. We have complied with all of our maintenance financial ratios as required under our loan covenants and other debt instruments. The principal factors that could negatively affect our ability to comply with these financial ratio covenants and other financial tests are depreciation of the Philippine peso relative to the U.S. dollar, poor operating performance of PLDT and its subsidiaries, impairment or similar charges in respect of investments or other long-lived assets that may be recognized by PLDT and its subsidiaries, and increases in our interest expense. Interest expense may increase as a result of various factors including issuance of new debt, the refinancing of lower cost indebtedness by higher cost indebtedness, depreciation of the Philippine peso, the lowering of PLDT’s credit ratings or the credit ratings of the Philippines, increase in reference interest rates, and general market conditions. Since approximately 37% and 42% of PLDT’s total consolidated debts as at June 30, 2016 and December 31, 2015, respectively, were denominated in foreign currencies, principally in U.S. dollars, many of these financial ratios and other tests are negatively affected by any weakening of the Philippine peso. See Note 28 – Financial Assets and Liabilities – Foreign Currency Exchange Risk.
F-101
PLDT’s debt instruments contain a number of other negative covenants that, subject to certain exceptions and qualifications, restrict PLDT’s ability to take certain actions without lenders’ approval, including: (a) making or permitting any material change in the character of its business; (b) selling, leasing, transferring or disposing of all or substantially all of its assets or any significant portion thereof other than in the ordinary course of business; (c) creating any lien or security interest; (d) permitting set-off against amounts owed to PLDT; and (e) merging or consolidating with any other company. Furthermore, certain of DMPI’s debt instruments contain provisions wherein DMPI may be declared in default in case of a change in control in DMPI. PLDT’s debt instruments and guarantees for DMPI loans also contain customary and other default provisions that permit the lender to accelerate amounts due or terminate their commitments to extend additional funds under the debt instruments. These default provisions include: (a) cross-defaults that will be triggered only if the principal amount of the defaulted indebtedness exceeds a threshold amount specified in these debt instruments; (b) failure by PLDT to meet certain financial ratio covenants referred to above; (c) the occurrence of any material adverse change in circumstances that a lender reasonably believes materially impairs PLDT’s ability to perform its obligations under its debt instrument with the lender; (d) the revocation, termination or amendment of any of the permits or franchises of PLDT in any manner unacceptable to the lender; (e) the nationalization or sustained discontinuance of all or a substantial portion of PLDT’s business; and (f) other typical events of default, including the commencement of bankruptcy, insolvency, liquidation or winding up proceedings by PLDT. Smart’s debt instruments contain certain restrictive covenants that require Smart to comply with specified financial ratios and other financial tests at semi-annual measurement dates. Smart’s loan agreements include compliance with financial tests such as Smart consolidated debt to consolidated EBITDA and debt service coverage ratio. The agreements also contain customary and other default provisions that permit the lender to accelerate amounts due under the loans or terminate their commitments to extend additional funds under the loans. These default provisions include: (a) cross-defaults and cross-accelerations that permit a lender to declare a default if Smart is in default under another loan agreement. These cross-default provisions are triggered upon a payment or other default permitting the acceleration of Smart debt, whether or not the defaulted debt is accelerated; (b) failure by Smart to comply with certain financial ratio covenants; and (c) the occurrence of any material adverse change in circumstances that the lender reasonably believes materially impairs Smart’s ability to perform its obligations or impair the guarantors’ ability to perform their obligations under its loan agreements. DMPI’s liabilities are guaranteed up to a certain extent by Digitel and PLDT. In addition, the loan agreements contain covenants which, among others, restrict the incurrence of loans or debts not in the ordinary course of business, merger or disposition of any substantial portion of Digitel and DMPI’s assets, distribution of capital or profits, redemption of any of its issued shares, and reduction of Digitel and DMPI’s registered and paid-up capital. The loan agreements with suppliers, banks (foreign and local alike) and other financial institutions provide for certain restrictions and requirements with respect to, among others, maintenance of percentage of ownership of specific shareholders, incurrence of additional long-term indebtedness or guarantees and creation of property encumbrances. As at June 30, 2016 and December 31, 2015, we were in compliance with all of our debt covenants. See Note 28 – Financial Assets and Liabilities – Derivative Financial Instruments. Obligations Under Finance Leases The consolidated future minimum payments for finance leases and long-term portion of obligations under finance leases covering various office equipment and vehicles in the aggregate amounts of nil and Php1 million as at June 30, 2016 and December 31, 2015, respectively. See Note 2 – Summary of Significant Accounting Policies, Note 3 – Management’s Use of Accounting Estimates, Judgments and Assumptions – Leases, Note 9 – Property and Equipment, and Note 28 – Financial Assets and Liabilities.
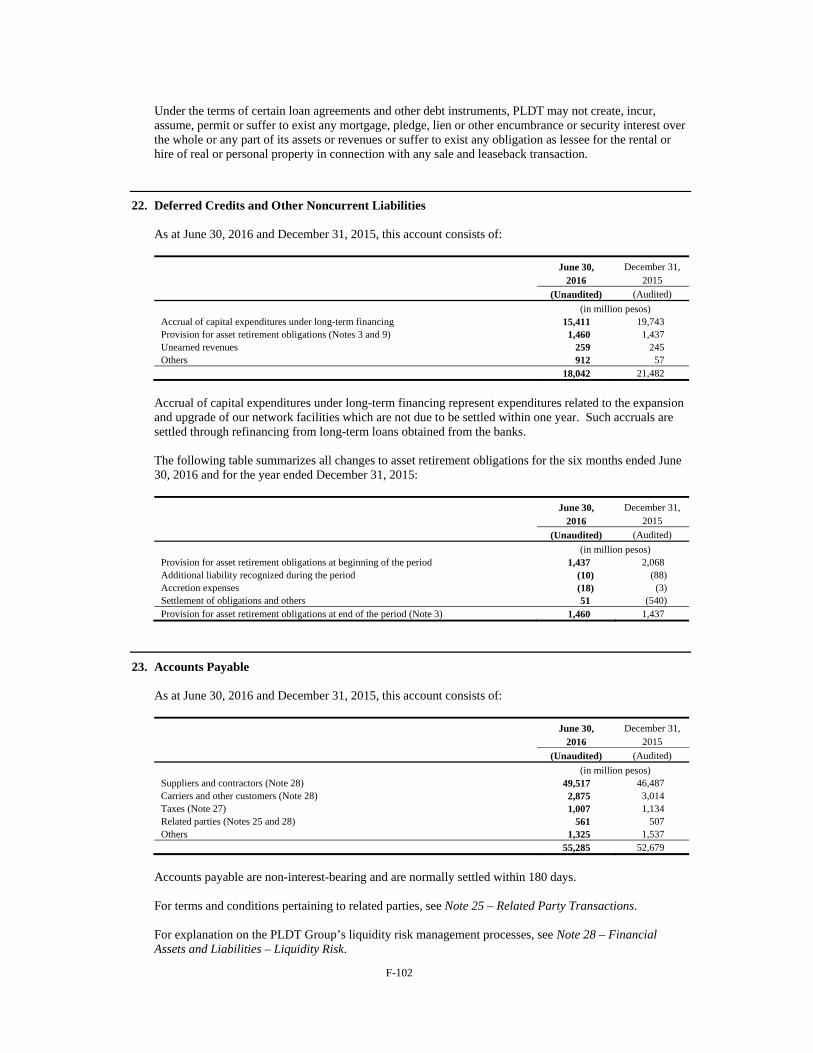
F-102
Under the terms of certain loan agreements and other debt instruments, PLDT may not create, incur, assume, permit or suffer to exist any mortgage, pledge, lien or other encumbrance or security interest over the whole or any part of its assets or revenues or suffer to exist any obligation as lessee for the rental or hire of real or personal property in connection with any sale and leaseback transaction.
22. Deferred Credits and Other Noncurrent Liabilities
As at June 30, 2016 and December 31, 2015, this account consists of:
June 30, December 31, 2016 2015
(Unaudited) (Audited)
(in million pesos) Accrual of capital expenditures under long-term financing 15,411 19,743 Provision for asset retirement obligations (Notes 3 and 9) 1,460 1,437 Unearned revenues 259 245 Others 912 57
18,042 21,482
Accrual of capital expenditures under long-term financing represent expenditures related to the expansion and upgrade of our network facilities which are not due to be settled within one year. Such accruals are settled through refinancing from long-term loans obtained from the banks.
The following table summarizes all changes to asset retirement obligations for the six months ended June 30, 2016 and for the year ended December 31, 2015:
June 30, December 31, 2016 2015
(Unaudited) (Audited)
(in million pesos) Provision for asset retirement obligations at beginning of the period 1,437 2,068 Additional liability recognized during the period (10) (88) Accretion expenses (18) (3) Settlement of obligations and others 51 (540) Provision for asset retirement obligations at end of the period (Note 3) 1,460 1,437
23. Accounts Payable
As at June 30, 2016 and December 31, 2015, this account consists of:
June 30, December 31, 2016 2015
(Unaudited) (Audited)
(in million pesos) Suppliers and contractors (Note 28) 49,517 46,487 Carriers and other customers (Note 28) 2,875 3,014 Taxes (Note 27) 1,007 1,134 Related parties (Notes 25 and 28) 561 507 Others 1,325 1,537
55,285 52,679
Accounts payable are non-interest-bearing and are normally settled within 180 days. For terms and conditions pertaining to related parties, see Note 25 – Related Party Transactions. For explanation on the PLDT Group’s liquidity risk management processes, see Note 28 – Financial Assets and Liabilities – Liquidity Risk.
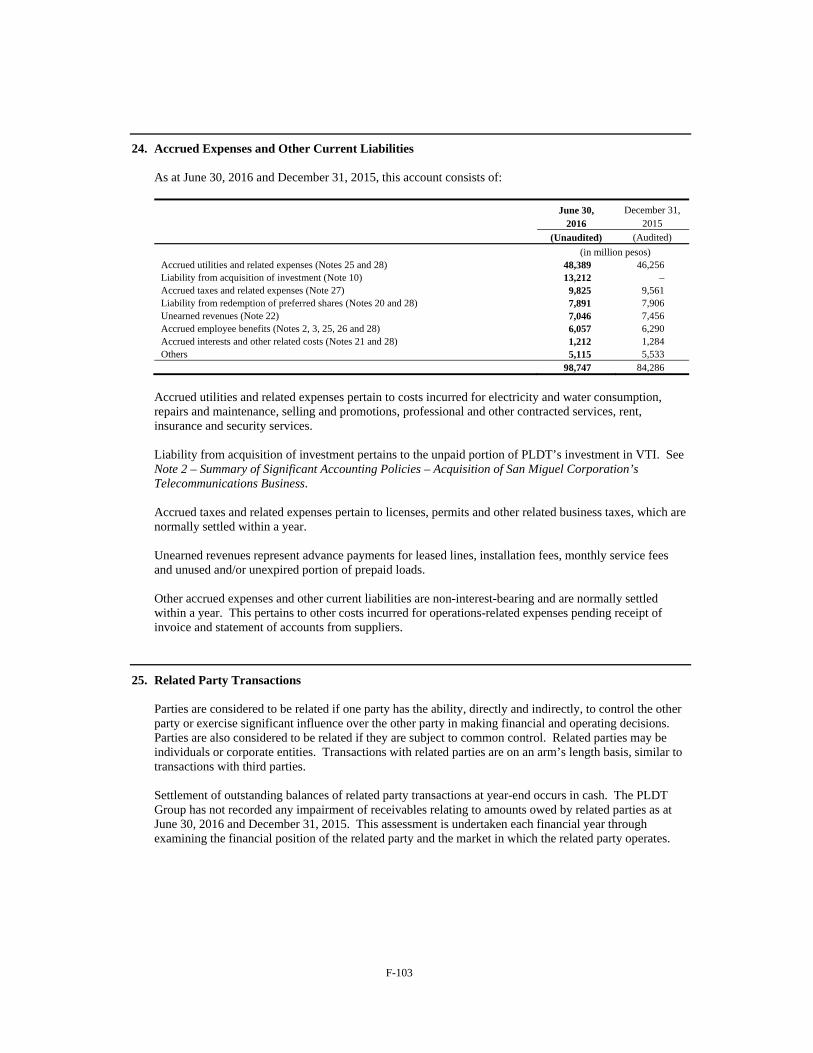
F-103
24. Accrued Expenses and Other Current Liabilities
As at June 30, 2016 and December 31, 2015, this account consists of:
June 30, December 31, 2016 2015
(Unaudited) (Audited)
(in million pesos) Accrued utilities and related expenses (Notes 25 and 28) 48,389 46,256 Liability from acquisition of investment (Note 10) 13,212 – Accrued taxes and related expenses (Note 27) 9,825 9,561 Liability from redemption of preferred shares (Notes 20 and 28) 7,891 7,906 Unearned revenues (Note 22) 7,046 7,456 Accrued employee benefits (Notes 2, 3, 25, 26 and 28) 6,057 6,290 Accrued interests and other related costs (Notes 21 and 28) 1,212 1,284 Others 5,115 5,533
98,747 84,286
Accrued utilities and related expenses pertain to costs incurred for electricity and water consumption, repairs and maintenance, selling and promotions, professional and other contracted services, rent, insurance and security services. Liability from acquisition of investment pertains to the unpaid portion of PLDT’s investment in VTI. See Note 2 – Summary of Significant Accounting Policies – Acquisition of San Miguel Corporation’s Telecommunications Business. Accrued taxes and related expenses pertain to licenses, permits and other related business taxes, which are normally settled within a year. Unearned revenues represent advance payments for leased lines, installation fees, monthly service fees and unused and/or unexpired portion of prepaid loads. Other accrued expenses and other current liabilities are non-interest-bearing and are normally settled within a year. This pertains to other costs incurred for operations-related expenses pending receipt of invoice and statement of accounts from suppliers.
25. Related Party Transactions
Parties are considered to be related if one party has the ability, directly and indirectly, to control the other party or exercise significant influence over the other party in making financial and operating decisions. Parties are also considered to be related if they are subject to common control. Related parties may be individuals or corporate entities. Transactions with related parties are on an arm’s length basis, similar to transactions with third parties. Settlement of outstanding balances of related party transactions at year-end occurs in cash. The PLDT Group has not recorded any impairment of receivables relating to amounts owed by related parties as at June 30, 2016 and December 31, 2015. This assessment is undertaken each financial year through examining the financial position of the related party and the market in which the related party operates.
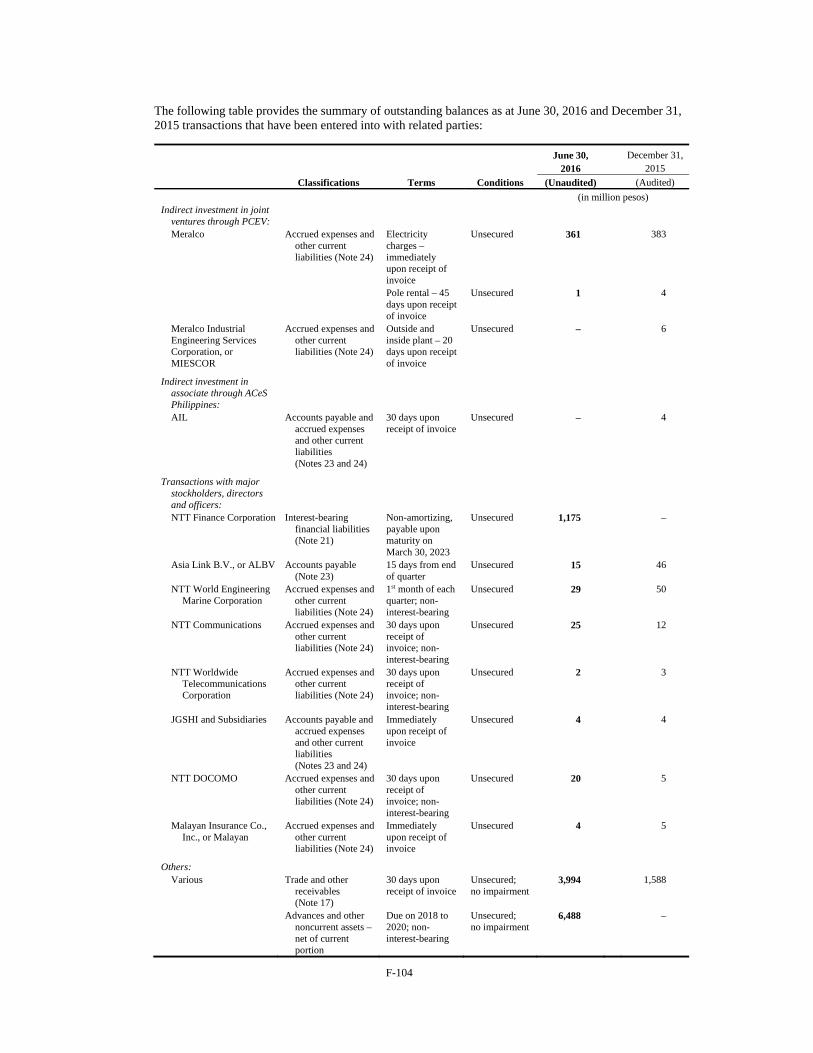
F-104
The following table provides the summary of outstanding balances as at June 30, 2016 and December 31, 2015 transactions that have been entered into with related parties:
June 30, December 31, 2016 2015
Classifications Terms Conditions (Unaudited) (Audited)
(in million pesos) Indirect investment in joint
ventures through PCEV:
Meralco Accrued expenses and
other current liabilities (Note 24)
Electricity charges – immediately upon receipt of invoice
Unsecured
361 383
Pole rental – 45 days upon receipt of invoice
Unsecured 1 4
Meralco Industrial Engineering Services Corporation, or MIESCOR
Accrued expenses and other current liabilities (Note 24)
Outside and inside plant – 20 days upon receipt of invoice
Unsecured – 6
Indirect investment in associate through ACeS Philippines: AIL Accounts payable and
accrued expenses and other current liabilities (Notes 23 and 24)
30 days upon receipt of invoice
Unsecured – 4
Transactions with major stockholders, directors and officers: NTT Finance Corporation Interest-bearing
financial liabilities (Note 21)
Non-amortizing, payable upon maturity on March 30, 2023
Unsecured 1,175 –
Asia Link B.V., or ALBV Accounts payable (Note 23)
15 days from end of quarter
Unsecured 15 46
NTT World Engineering Marine Corporation
Accrued expenses and other current liabilities (Note 24)
1st month of each quarter; non-interest-bearing
Unsecured 29 50
NTT Communications Accrued expenses and other current liabilities (Note 24)
30 days upon receipt of invoice; non-interest-bearing
Unsecured 25 12
NTT Worldwide Telecommunications Corporation
Accrued expenses and other current liabilities (Note 24)
30 days upon receipt of invoice; non-interest-bearing
Unsecured 2 3
JGSHI and Subsidiaries Accounts payable and accrued expenses and other current liabilities (Notes 23 and 24)
Immediately upon receipt of invoice
Unsecured 4 4
NTT DOCOMO Accrued expenses and other current liabilities (Note 24)
30 days upon receipt of invoice; non-interest-bearing
Unsecured 20 5
Malayan Insurance Co., Inc., or Malayan
Accrued expenses and other current liabilities (Note 24)
Immediately upon receipt of invoice
Unsecured 4 5
Others: Various Trade and other
receivables (Note 17)
30 days upon receipt of invoice
Unsecured; no impairment
3,994 1,588
Advances and other noncurrent assets – net of current portion
Due on 2018 to 2020; non-interest-bearing
Unsecured; no impairment
6,488 –
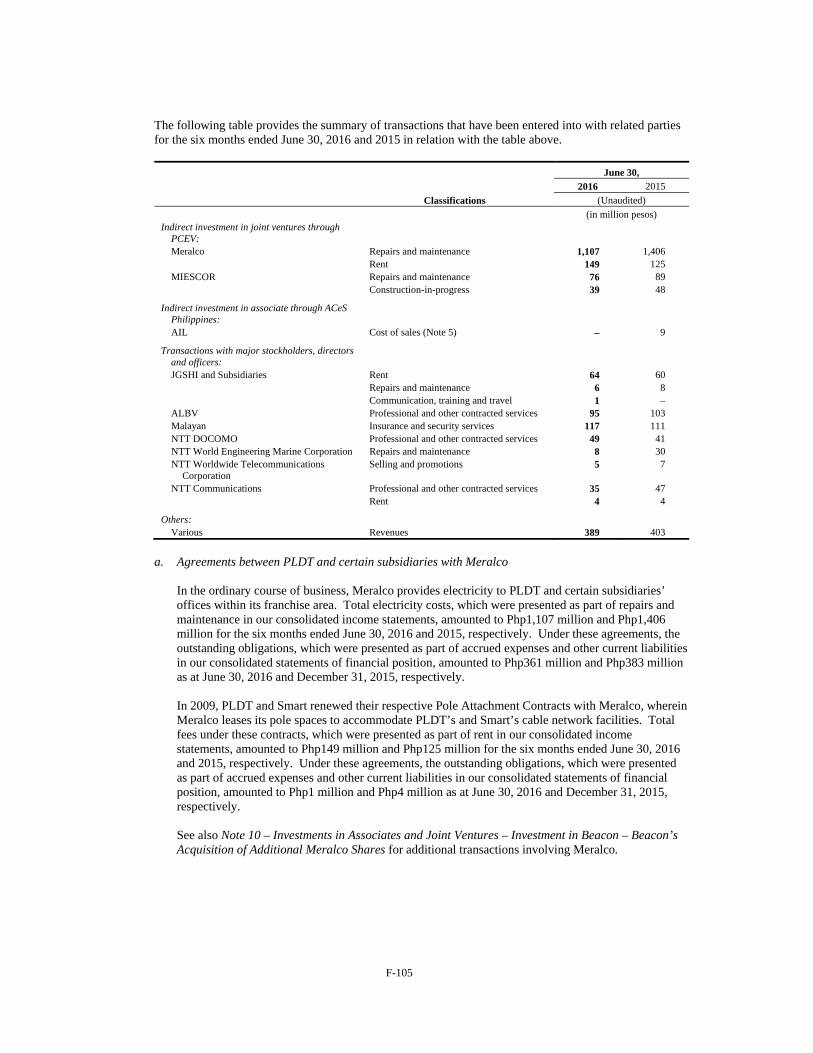
F-105
The following table provides the summary of transactions that have been entered into with related parties for the six months ended June 30, 2016 and 2015 in relation with the table above.
June 30,
2016 2015
Classifications (Unaudited)
(in million pesos) Indirect investment in joint ventures through
PCEV:
Meralco Repairs and maintenance 1,107 1,406
Rent 149 125 MIESCOR Repairs and maintenance 76 89
Construction-in-progress 39 48
Indirect investment in associate through ACeS Philippines:
AIL Cost of sales (Note 5) – 9
Transactions with major stockholders, directors and officers:
JGSHI and Subsidiaries Rent 64 60 Repairs and maintenance 6 8 Communication, training and travel 1 –
ALBV Professional and other contracted services 95 103 Malayan Insurance and security services 117 111 NTT DOCOMO Professional and other contracted services 49 41 NTT World Engineering Marine Corporation Repairs and maintenance 8 30 NTT Worldwide Telecommunications
Corporation Selling and promotions 5 7
NTT Communications Professional and other contracted services 35 47 Rent 4 4
Others: Various Revenues 389 403
a. Agreements between PLDT and certain subsidiaries with Meralco
In the ordinary course of business, Meralco provides electricity to PLDT and certain subsidiaries’ offices within its franchise area. Total electricity costs, which were presented as part of repairs and maintenance in our consolidated income statements, amounted to Php1,107 million and Php1,406 million for the six months ended June 30, 2016 and 2015, respectively. Under these agreements, the outstanding obligations, which were presented as part of accrued expenses and other current liabilities in our consolidated statements of financial position, amounted to Php361 million and Php383 million as at June 30, 2016 and December 31, 2015, respectively.
In 2009, PLDT and Smart renewed their respective Pole Attachment Contracts with Meralco, wherein Meralco leases its pole spaces to accommodate PLDT’s and Smart’s cable network facilities. Total fees under these contracts, which were presented as part of rent in our consolidated income statements, amounted to Php149 million and Php125 million for the six months ended June 30, 2016 and 2015, respectively. Under these agreements, the outstanding obligations, which were presented as part of accrued expenses and other current liabilities in our consolidated statements of financial position, amounted to Php1 million and Php4 million as at June 30, 2016 and December 31, 2015, respectively.
See also Note 10 – Investments in Associates and Joint Ventures – Investment in Beacon – Beacon’s Acquisition of Additional Meralco Shares for additional transactions involving Meralco.
F-106
b. Agreements between PLDT and MIESCOR
PLDT has an existing Outside and Inside Plant Contracted Services Agreement with MIESCOR, a subsidiary of Meralco, which will expire on February 28, 2018. Under the agreement, MIESCOR assumes full and overall responsibility for the implementation and completion of any assigned project such as cable and civil works that are required for the provisioning and restoration of lines and recovery of existing plant.
Total fees under this agreement, which were presented as part of repairs and maintenance in our consolidated income statements, amounted to Php14 million and Php27 million for the six months ended June 30, 2016 and 2015, respectively. Total amounts capitalized to property and equipment amounted to Php3 million and Php1 million for the six months ended June 30, 2016 and 2015, respectively. Under these agreements, the outstanding obligations, which were presented as part of accrued expenses and other current liabilities in our consolidated statements of financial position, amounted to nil and Php6 million as at June 30, 2016 and December 31, 2015, respectively. PLDT also has an existing One Area One Partner for Outside Plant Subscriber Line Rehabilitation, Repair, Installation and Related Activities agreement with MIESCOR, from January 1, 2011 and extended until March 31, 2017. Under the agreement, MIESCOR is responsible for the customer line installation, repair, rehabilitation and maintenance activities of cables and cabinets in the areas awarded to them. Total fees under this agreement, which were presented as part of repairs and maintenance in our consolidated income statements, amounted to Php62 million for each of the six months ended June 30, 2016 and 2015. Total amounts capitalized to property and equipment amounted to Php36 million and Php47 million for the six months ended June 30, 2016 and 2015, respectively. There were no outstanding obligations under this agreement as at June 30, 2016 and December 31, 2015.
c. Transactions with Republic Surety and Insurance Co., Inc., or RSIC
Since 2012, PLDT has insurance policies with RSIC, a wholly-owned subsidiary of Meralco, covering material damages for buildings, building improvements and equipment. Total fees under the related contracts, which were presented as part of insurance and security services in our consolidated income statements, amounted to nil for each of the six months ended June 30, 2016 and 2015. There were no outstanding obligations for these contracts as at June 30, 2016 and December 31, 2015.
d. Air Time Purchase Agreement between PLDT, AIL and Related Agreements
Under the Founder NSP Air Time Purchase Agreement, or ATPA, entered into with AIL in March 1997, which was amended in December 1998, or Original ATPA, PLDT was granted the exclusive right to sell AIL services, through ACeS Philippines, as national service provider, or NSP, in the Philippines. In exchange, the Original ATPA required PLDT to purchase from AIL a minimum of US$5 million worth of air time, or Minimum Air Time Purchase Obligation, annually for ten years commencing on January 1, 2002, or the Minimum Purchase Period, the expected date of commercial operations of the Garuda I Satellite. In the event that AIL’s aggregate billed revenue was less than US$45 million in any given year, the Original ATPA also required PLDT to make supplemental air time purchase payments of up to US$15 million per year during the Minimum Purchase Period, or the Supplemental Air Time Purchase Obligation.
F-107
On February 1, 2007, the parties to the Original ATPA entered into an amendment to the Original ATPA on substantially the terms attached to the term sheet negotiated with the relevant banks, or Amended ATPA. Under the Amended ATPA, the Minimum Air Time Purchase Obligation was amended and replaced in its entirety with the obligation of PLDT to purchase from AIL a minimum of US$500 thousand worth of air time annually over a period ending upon the earlier of: (i) the expiration of the Minimum Purchase Period; and (ii) the date on which all indebtedness incurred by AIL to finance the AIL System is repaid. Furthermore, the Amended ATPA unconditionally released PLDT from any obligations arising out of or in connection with the Original ATPA prior to the date of the Amended ATPA, except for obligations to pay for billable units used prior to such date. In December 2014, AIL suffered a failure of the propulsion system on board the Garuda I Satellite, thus, AIL decided to decommission the operation of Garuda I Satellite in January 2015. Subsequently, AIL and Inmarsat entered into a 12-month transitional period, wherein AIL shall continue to utilize Inmarsat system through I4F1 Satellite. On December 31, 2015, end of the transition period, AIL then terminated all satellite phone service subscriptions with Inmarsat. Total fees under the Amended ATPA, which were presented as part of cost of sales in our consolidated income statements, amounted to nil and Php9 million for the six months ended June 30, 2016 and 2015, respectively. See Note 5 – Income and Expenses – Cost of Sales. Under the Amended ATPA, the outstanding obligations of PLDT, which were presented as part of accounts payable and accrued expenses and other current liabilities in our consolidated statements of financial position, amounted to nil and Php4 million as at June 30, 2016 and December 31, 2015, respectively.
e. Transactions with Major Stockholders, Directors and Officers
Material transactions to which PLDT or any of its subsidiaries is a party, in which a director, key officer or owner of more than 10% of the outstanding common stock of PLDT, or any member of the immediate family of a director, key officer or owner of more than 10% of the outstanding common stock of PLDT, had a direct or indirect material interest as at June 30, 2016 and December 31, 2015 and for the six months ended June 30, 2016 and 2015 are as follows:
1. Agreement between Smart and ALBV
Smart has an existing Technical Assistance Agreement with ALBV, a subsidiary of the First Pacific Group and its Philippine affiliates. ALBV provides technical support services and assistance in the operations and maintenance of Smart’s cellular business which provides for payment of technical service fees equivalent to a rate of 0.5% of the consolidated net revenues of Smart. Effective February 1, 2014, the parties agreed to reduce the technical service fee rate from 0.5% to 0.4% of the consolidated net revenues of Smart. The agreement, which expired on February 23, 2016 was renewed until February 23, 2018 and is subject to further renewal upon mutual agreement of the parties. Total service fees charged to operations under this agreement, which were presented as part of professional and other contracted services in our consolidated income statements, amounted to Php95 million and Php103 million for the six months ended June 30, 2016 and 2015, respectively. Under this agreement, the outstanding obligations, which were presented as part of accounts payable in our consolidated statements of financial position, amounted to Php15 million and Php46 million as at June 30, 2016 and December 31, 2015, respectively.
F-108
2. Various Agreements with NTT Communications and/or its Affiliates
PLDT is a party to the following agreements with NTT Communications and/or its affiliates:
Service Agreement. On February 1, 2008, PLDT entered into an agreement with NTT World
Engineering Marine Corporation wherein the latter provides offshore submarine cable repair and other allied services for the maintenance of PLDT’s domestic fiber optic network submerged plant. The fees under this agreement, which were presented as part of repairs and maintenance in our consolidated income statements, amounted to Php8 million and Php30 million for the six months ended June 30, 2016 and 2015, respectively. Under this agreement, the outstanding obligations of PLDT, which were presented as part of accrued expenses and other current liabilities in our consolidated statements of financial position, amounted to Php29 million and Php50 million as at June 30, 2016 and December 31, 2015, respectively;
Advisory Services Agreement. On March 24, 2000, PLDT entered into an agreement with
NTT Communications, as amended on March 31, 2003, March 31, 2005 and June 16, 2006, under which NTT Communications provides PLDT with technical, marketing and other consulting services for various business areas of PLDT starting April 1, 2000. The fees under this agreement, which were presented as part of professional and other contracted services in our consolidated income statements, amounted to Php35 million and Php47 million for the six months ended June 30, 2016 and 2015, respectively. Under this agreement, the outstanding obligations of PLDT, which were presented as part of accrued expenses and other current liabilities in our consolidated statements of financial position, amounted to Php23 million and Php10 million as at June 30, 2016 and December 31, 2015, respectively;
Conventional International Telecommunications Services Agreement. On March 24, 2000,
PLDT entered into an agreement with NTT Communications under which PLDT and NTT Communications agreed to cooperative arrangements for conventional international telecommunications services to enhance their respective international businesses. The fees under this agreement, which were presented as part of rent in our consolidated income statements, amounted to Php4 million for each of the six months ended June 30, 2016 and 2015. Under this agreement, the outstanding obligations of PLDT, which were presented as part of accrued expenses and other current liabilities in our consolidated statements of financial position, amounted to Php2 million each as at June 30, 2016 and December 31, 2015; and
Arcstar Licensing Agreement and Arcstar Service Provider Agreement. On March 24, 2000,
PLDT entered into an agreement with NTT Worldwide Telecommunications Corporation under which PLDT markets, and manages data and other services under NTT Communications’ “Arcstar” brand to its corporate customers in the Philippines. PLDT also entered into a Trade Name and Trademark Agreement with NTT Communications under which PLDT has been given the right to use the trade name “Arcstar” and its related trademark, logo and symbols, solely for the purpose of PLDT’s marketing, promotional and sales activities for the Arcstar services within the Philippines. The fees under this agreement, which were presented as part of selling and promotions in our consolidated income statements, amounted to Php5 million and Php7 million for the six months ended June 30, 2016 and 2015, respectively. Under this agreement, the outstanding obligations of PLDT, which were presented as part of accrued expenses and other current liabilities in our consolidated statements of financial position, amounted to Php2 million and Php3 million as at June 30, 2016 and December 31, 2015, respectively.
F-109
3. Transactions with JGSHI and Subsidiaries
PLDT and certain of its subsidiaries have existing agreements with Universal Robina Corporation and Robinsons Land Corporation for office and business office rental. Total fees under these contracts, which were presented as part of rent in our consolidated income statements, amounted to Php64 million and Php60 million for the six months ended June 30, 2016 and 2015, respectively. Under these agreements, the outstanding obligations, which were presented as part of accounts payable and accrued expenses and other current liabilities in our consolidated statements of financial position, amounted to Php2 million each as at June 30, 2016 and December 31, 2015.
There were also other transactions such as airfare, electricity, marketing expenses and bank fees, which were presented as part of selling and promotions, communication, training and travel, repairs and maintenance and professional and other contracted services, in our consolidated income statements, amounted to Php7 million and Php8 million for the six months ended June 30, 2016 and 2015, respectively. Under these agreements, the outstanding obligations for these transactions, which were presented as part of accounts payable and accrued expenses and other current liabilities in our consolidated statements of financial position, amounted to Php2 million each as at June 30, 2016 and December 31, 2015.
4. Advisory Services Agreement between NTT DOCOMO and PLDT
An Advisory Services Agreement was entered into by NTT DOCOMO and PLDT on June 5, 2006, in accordance with the Cooperation Agreement dated January 31, 2006. Pursuant to the Advisory Services Agreement, NTT DOCOMO will provide the services of certain key personnel in connection with certain aspects of the business of PLDT and Smart. Also, this agreement governs the terms and conditions of the appointments of such key personnel and the corresponding fees related thereto. Total fees under this agreement, which were presented as part of professional and other contracted services in our consolidated income statements, amounted to Php49 million and Php41 million for the six months ended June 30, 2016 and 2015, respectively. Under this agreement, the outstanding obligations of PLDT, which were presented as part of accrued expenses and other current liabilities in our consolidated statements of financial position, amounted to Php20 million and Php5 million as at June 30, 2016 and December 31, 2015, respectively.
5. Transactions with Malayan
PLDT and certain of its subsidiaries have insurance policies with Malayan covering directors, officers, liability to employees and material damages for buildings, building improvements, equipment and motor vehicles. The premiums are directly paid to Malayan. Total fees under these contracts, which were presented as part of insurance and security services in our consolidated income statements, amounted to Php117 million and Php111 million for the six months ended June 30, 2016 and 2015, respectively. Under this agreement, the outstanding obligations, which were presented as part of accrued expenses and other current liabilities in our consolidated statements of financial position, amounted to Php4 million and Php5 million as at June 30, 2016 and December 31, 2015, respectively. A director of PLDT has direct/indirect interests in or serves as a director/officer of Malayan as at June 30, 2016 and December 31, 2015.
6. Cooperation Agreement with First Pacific and certain affiliates, or the FP Parties, NTT
Communications and NTT DOCOMO
In connection with the transfer by NTT Communications of approximately 12.6 million shares of PLDT’s common stock to NTT DOCOMO pursuant to a Stock SPA dated January 31, 2006 between NTT Communications and NTT DOCOMO, the FP Parties, NTT Communications and NTT DOCOMO entered into a Cooperation Agreement, dated January 31, 2006. Under the Cooperation Agreement, the relevant parties extended certain rights of NTT Communications under the Stock Purchase and Strategic Investment Agreement dated September 28, 1999, as amended, and the Shareholders Agreement dated March 24, 2000, to NTT DOCOMO, including:
F-110
certain contractual veto rights over a number of major decisions or transactions; and
rights relating to the representation on the Board of Directors of PLDT and Smart, respectively, and any committees thereof.
Moreover, key provisions of the Cooperation Agreement pertain to, among other things:
Restriction on Ownership of Shares of PLDT by NTT Communications and NTT DOCOMO.
Each of NTT Communications and NTT DOCOMO has agreed not to beneficially own, directly or indirectly, in the aggregate with their respective subsidiaries and affiliates, more than 21% of the issued and outstanding shares of PLDT’s common stock. If such event does occur, the FP Parties, as long as they own in the aggregate not less than 21% of the issued and outstanding shares of PLDT’s common stock, have the right to terminate their respective rights and obligations under the Cooperation Agreement, the Shareholders Agreement and the Stock Purchase and Strategic Investment Agreement.
Limitation on Competition. NTT Communications, NTT DOCOMO and their respective
subsidiaries are prohibited from investing in excess of certain thresholds in businesses competing with PLDT in respect of customers principally located in the Philippines and from using their assets in the Philippines in such businesses. Moreover, if PLDT, Smart or any of Smart’s subsidiaries intend to enter into any contractual arrangement relating to certain competing businesses, PLDT is required to provide, or to use reasonable efforts to procure that Smart or any of Smart’s subsidiaries provide, NTT Communications and NTT DOCOMO with the same opportunity to enter into such agreement with PLDT or Smart or any of Smart’s subsidiaries, as the case may be.
Business Cooperation. PLDT and NTT DOCOMO agreed in principle to collaborate with
each other on the business development, roll-out and use of a W-CDMA mobile communication network. In addition, PLDT agreed, to the extent of the power conferred by its direct or indirect shareholding in Smart, to procure that Smart will: (i) become a member of a strategic alliance group for international roaming and corporate sales and services; and (ii) enter into a business relationship concerning preferred roaming and inter-operator tariff discounts with NTT DOCOMO.
Additional Rights of NTT DOCOMO. Pursuant to amendments effected by the Cooperation
Agreement to the Stock Purchase and Strategic Investment Agreement and the Shareholders Agreement, upon NTT Communications and NTT DOCOMO and their respective subsidiaries owning in the aggregate 20% or more of PLDT’s shares of common stock and for as long as they continue to own in the aggregate at least 17.5% of PLDT’s shares of common stock then outstanding, NTT DOCOMO has additional rights under the Stock Purchase and Strategic Investment Agreement and Shareholders Agreement, including that:
1. NTT DOCOMO is entitled to nominate one additional NTT DOCOMO nominee to
the Board of Directors of each PLDT and Smart;
2. PLDT must consult NTT DOCOMO no later than 30 days prior to the first submission to the board of PLDT or certain of its committees of any proposal of investment in an entity that would primarily engage in a business that would be in direct competition or substantially the same business opportunities, customer base, products or services with business carried on by NTT DOCOMO, or which NTT DOCOMO has announced publicly an intention to carry on;
3. PLDT must procure that Smart does not cease to carry on its business, dispose of all
of its assets, issue common shares, merge or consolidate, or effect winding up or liquidation without PLDT first consulting with NTT DOCOMO no later than 30 days prior to the first submission to the board of PLDT or Smart, or certain of its committees; and
F-111
4. PLDT must first consult with NTT DOCOMO no later than 30 days prior to the first
submission to the board of PLDT or certain of its committees for the approval of any transfer by any member of the PLDT Group of Smart common capital stock to any person who is not a member of the PLDT Group.
NTT Communications and NTT DOCOMO together beneficially owned approximately 20% of PLDT’s outstanding common stock as at June 30, 2016 and December 31, 2015.
Change in Control. Each of NTT Communications, NTT DOCOMO and the FP Parties
agreed that to the extent permissible under applicable laws and regulations of the Philippines and other jurisdictions, subject to certain conditions, to cast its vote as a shareholder in support of any resolution proposed by the Board of Directors of PLDT for the purpose of safeguarding PLDT from any Hostile Transferee. A “Hostile Transferee” is defined under the Cooperation Agreement to mean any person (other than NTT Communications, NTT DOCOMO, First Pacific or any of their respective affiliates) determined to be so by the PLDT Board of Directors and includes, without limitation, a person who announces an intention to acquire, seeking to acquire or acquires 30% or more of PLDT common shares then issued and outstanding from time to time or having (by itself or together with itself) acquired 30% or more of the PLDT common shares who announces an intention to acquire, seeking to acquire or acquires a further 2% of such PLDT common shares: (a) at a price per share which is less than the fair market value as determined by the Board of Directors of PLDT, as advised by a professional financial advisor; (b) which is subject to conditions which are subjective or which could not be reasonably satisfied; (c) without making an offer for all PLDT common shares not held by it and/or its affiliates and/or persons who, pursuant to an agreement or understanding (whether formal or informal), actively cooperate to obtain or consolidate control over PLDT; (d) whose offer for the PLDT common shares is unlikely to succeed; or (e) whose intention is otherwise not bona fide; provided that, no person will be deemed a Hostile Transferee unless prior to making such determination, the Board of Directors of PLDT has used reasonable efforts to discuss with NTT Communications and NTT DOCOMO in good faith whether such person should be considered a Hostile Transferee.
Termination. If NTT Communications, NTT DOCOMO or their respective subsidiaries
cease to own, in the aggregate, full legal and beneficial title to at least 10% of the shares of PLDT’s common stock then issued and outstanding, their respective rights and obligations under the Cooperation Agreement and the Shareholders Agreement will terminate and the Strategic Arrangements (as defined in the Stock Purchase and Strategic Investment Agreement) will terminate. If the FP Parties and their respective subsidiaries cease to have, directly or indirectly, effective voting power in respect of shares of PLDT’s common stock representing at least 18.5% of the shares of PLDT’s common stock then issued and outstanding, their respective rights and obligations under the Cooperation Agreement, the Stock Purchase and Strategic Investment Agreement, and the Shareholders Agreement will terminate.
f. Others
1. Telecommunications services provided by PLDT and certain of its subsidiaries and other
transactions with various related parties
PLDT and certain of its subsidiaries provide telephone, data communication and other services to various related parties. The revenues under these services amounted to Php389 million and Php403 million for the six months ended June 30, 2016 and 2015, respectively. The outstanding receivables of PLDT and certain of its subsidiaries, which were presented as part of trade and other receivables, advances and other noncurrent assets – net of current portion in our consolidated statements of financial position, from these transactions amounted to Php10,482 million and Php1,588 million as at June 30, 2016 and December 31, 2015, respectively.
F-112
See Note 10 – Investments in Associates and Joint Ventures – Investment in MediaQuest PDRs and Sale of PCEV’s Beacon Shares to MPIC and Note 19 – Prepayments – Agreement of PLDT and Smart with TV5 for other related party transactions.
Compensation of Key Officers of the PLDT Group
The compensation of key officers of the PLDT Group by benefit type for the six months ended June 30, 2016 and for the year ended December 31, 2015 are as follows:
June 30,
2016 2015
(Unaudited)
(in million pesos) Short-term employee benefits 303 340 Post-employment benefits (Note 26) 28 22 Total compensation paid to key officers of the PLDT Group 331 362
Effective January 2014, each of the directors, including the members of the advisory board of PLDT, was entitled to a director’s fee in the amount of Php250 thousand for each board meeting attended. Each of the members or advisors of the audit, executive compensation, governance and nomination, and technology strategy committees was entitled to a fee in the amount of Php125 thousand for each committee meeting attended. Total fees paid for board meetings and board committee meetings amounted to Php44 million and Php39 million for the six months ended June 30, 2016 and 2015, respectively. Except for the fees mentioned above, the directors are not compensated, directly or indirectly, for their services as such.
There are no agreements between PLDT Group and any of its key management personnel providing for benefits upon termination of employment, except for such benefits to which they may be entitled under PLDT Group’s retirement and incentive plans.
The amounts disclosed in the table are the amounts recognized as expenses during the period related to key management personnel.
26. Employee Benefits
Pension
Defined Benefit Pension Plans
PLDT has defined benefit pension plans, operating under the legal name “The Board of Trustees for the account of the Beneficial Trust Fund created pursuant to the Benefit Plan of PLDT Company” and covering all of our permanent and regular employees. Certain subsidiaries of PLDT have not yet drawn up a specific retirement plan for its permanent or regular employees. For the purpose of complying with Revised PAS 19, pension benefit expense has been actuarially computed based on defined benefit plan.
F-113
PLDT’s actuarial valuation is performed every year-end. Based on the latest actuarial valuation, the actual present value of accrued (prepaid) benefit costs for the six months ended June 30, 2016 and for the year ended December 31, 2015 and the net periodic benefit costs and average assumptions used in developing the valuation for the six months ended June 30, 2016 and 2015 are as follows:
June 30, December 31, 2016 2015
(Unaudited) (Audited)
(in million pesos) Changes in the present value of defined benefit obligations:
Present value of defined benefit obligations at beginning of the period 21,602 23,072 Service costs 535 1,113 Interest costs on benefit obligation 524 1,050 Actual benefits paid/settlements (140) (2,112) Actuarial losses – experience – 3 Actuarial gains – economic assumptions – (1,414) Curtailments and others (Notes 2 and 5) (33) (110)
Present value of defined benefit obligations at end of the period 22,488 21,602
Changes in fair value of plan assets: Fair value of plan assets at beginning of the period 11,439 9,950 Actual contributions 3,126 7,086 Interest income on plan assets 285 519 Actual benefits paid/settlements (140) (2,112) Return on plan assets (excluding amount included in net interest) (3,149) (4,004)
Fair value of plan assets at end of the period 11,561 11,439
Unfunded status – net (10,927) (10,163) Accrued benefit costs (Note 3) 10,942 10,178 Prepaid benefit costs (Notes 3 and 19) 15 15
June 30,
2016 2015
(Unaudited)
(in million pesos) Components of net periodic benefit costs:
Service costs 535 586 Interest costs – net 239 277 Curtailment/settlement gain – (26)
Net periodic benefit costs (Notes 3 and 5) 774 837
Actual net losses on plan assets amounted to Php2,864 million and Php2,671 million for the six months ended June 30, 2016 and 2015, respectively. Based on the latest actuarial valuation, our expected contribution to the defined benefit plan in 2016 will amount to Php1,411 million. The following table sets forth the expected future settlements by the Plan of maturing defined benefit obligation as at June 30, 2016:
(in million pesos)
2016(1) 257
2017 287 2018 342 2019 468 2020 608 2021 to 2060 89,161
(1) July 1, 2016 through December 31, 2016.
The average duration of the defined benefit obligation at the end of the reporting period is 9 to 21 years.
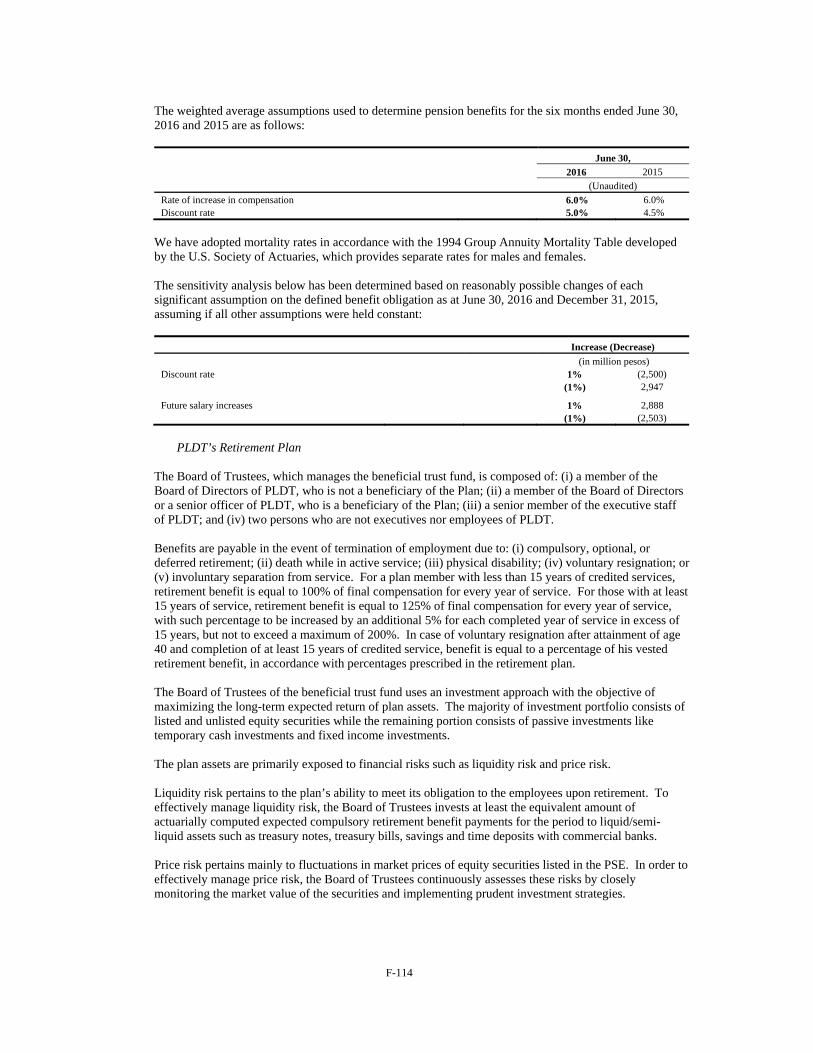
F-114
The weighted average assumptions used to determine pension benefits for the six months ended June 30, 2016 and 2015 are as follows:
June 30, 2016 2015
(Unaudited)
Rate of increase in compensation 6.0% 6.0% Discount rate 5.0% 4.5%
We have adopted mortality rates in accordance with the 1994 Group Annuity Mortality Table developed by the U.S. Society of Actuaries, which provides separate rates for males and females.
The sensitivity analysis below has been determined based on reasonably possible changes of each significant assumption on the defined benefit obligation as at June 30, 2016 and December 31, 2015, assuming if all other assumptions were held constant:
Increase (Decrease)
(in million pesos) Discount rate 1% (2,500)
(1%) 2,947
Future salary increases 1% 2,888 (1%) (2,503)
PLDT’s Retirement Plan
The Board of Trustees, which manages the beneficial trust fund, is composed of: (i) a member of the Board of Directors of PLDT, who is not a beneficiary of the Plan; (ii) a member of the Board of Directors or a senior officer of PLDT, who is a beneficiary of the Plan; (iii) a senior member of the executive staff of PLDT; and (iv) two persons who are not executives nor employees of PLDT.
Benefits are payable in the event of termination of employment due to: (i) compulsory, optional, or deferred retirement; (ii) death while in active service; (iii) physical disability; (iv) voluntary resignation; or (v) involuntary separation from service. For a plan member with less than 15 years of credited services, retirement benefit is equal to 100% of final compensation for every year of service. For those with at least 15 years of service, retirement benefit is equal to 125% of final compensation for every year of service, with such percentage to be increased by an additional 5% for each completed year of service in excess of 15 years, but not to exceed a maximum of 200%. In case of voluntary resignation after attainment of age 40 and completion of at least 15 years of credited service, benefit is equal to a percentage of his vested retirement benefit, in accordance with percentages prescribed in the retirement plan.
The Board of Trustees of the beneficial trust fund uses an investment approach with the objective of maximizing the long-term expected return of plan assets. The majority of investment portfolio consists of listed and unlisted equity securities while the remaining portion consists of passive investments like temporary cash investments and fixed income investments.
The plan assets are primarily exposed to financial risks such as liquidity risk and price risk.
Liquidity risk pertains to the plan’s ability to meet its obligation to the employees upon retirement. To effectively manage liquidity risk, the Board of Trustees invests at least the equivalent amount of actuarially computed expected compulsory retirement benefit payments for the period to liquid/semi-liquid assets such as treasury notes, treasury bills, savings and time deposits with commercial banks.
Price risk pertains mainly to fluctuations in market prices of equity securities listed in the PSE. In order to effectively manage price risk, the Board of Trustees continuously assesses these risks by closely monitoring the market value of the securities and implementing prudent investment strategies.
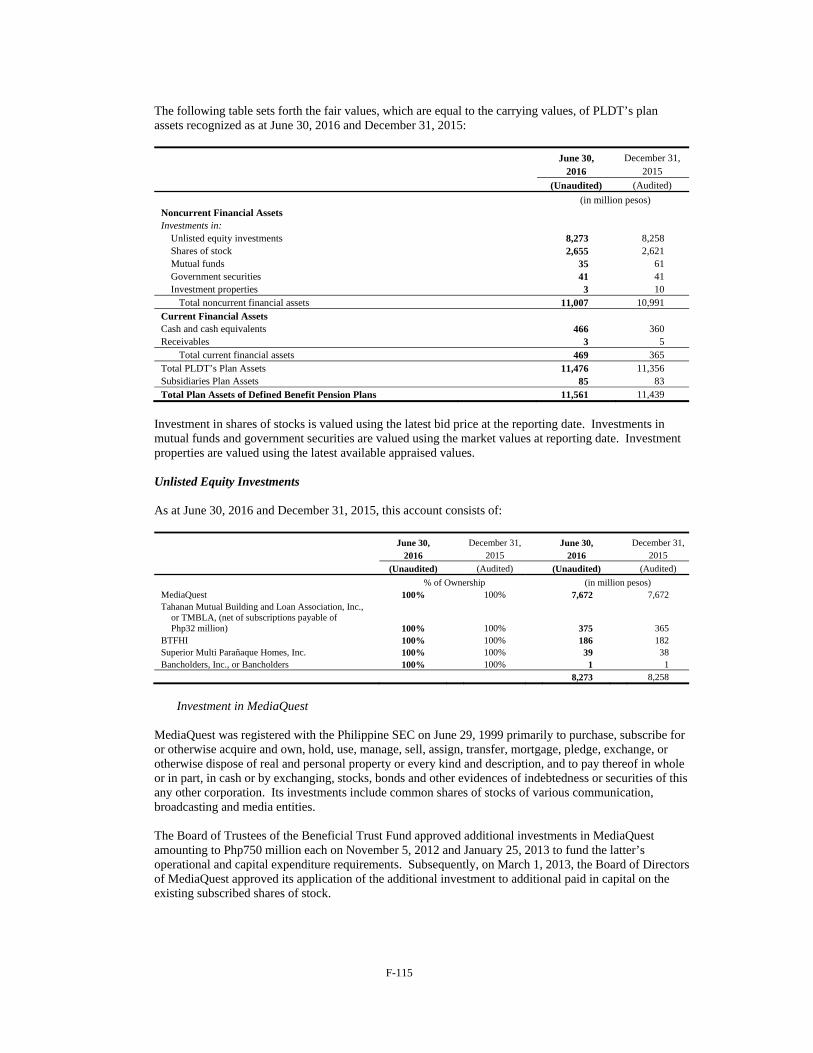
F-115
The following table sets forth the fair values, which are equal to the carrying values, of PLDT’s plan assets recognized as at June 30, 2016 and December 31, 2015:
June 30, December 31, 2016 2015
(Unaudited) (Audited)
(in million pesos) Noncurrent Financial Assets Investments in:
Unlisted equity investments 8,273 8,258 Shares of stock 2,655 2,621 Mutual funds 35 61 Government securities 41 41 Investment properties 3 10
Total noncurrent financial assets 11,007 10,991 Current Financial Assets Cash and cash equivalents 466 360 Receivables 3 5
Total current financial assets 469 365 Total PLDT’s Plan Assets 11,476 11,356 Subsidiaries Plan Assets 85 83 Total Plan Assets of Defined Benefit Pension Plans 11,561 11,439
Investment in shares of stocks is valued using the latest bid price at the reporting date. Investments in mutual funds and government securities are valued using the market values at reporting date. Investment properties are valued using the latest available appraised values.
Unlisted Equity Investments As at June 30, 2016 and December 31, 2015, this account consists of:
June 30, December 31, June 30, December 31,
2016 2015 2016 2015
(Unaudited) (Audited) (Unaudited) (Audited)
% of Ownership (in million pesos) MediaQuest 100% 100% 7,672 7,672Tahanan Mutual Building and Loan Association, Inc.,
or TMBLA, (net of subscriptions payable of Php32 million) 100% 100% 375 365
BTFHI 100% 100% 186 182Superior Multi Parañaque Homes, Inc. 100% 100% 39 38 Bancholders, Inc., or Bancholders 100% 100% 1 1
8,273 8,258
Investment in MediaQuest
MediaQuest was registered with the Philippine SEC on June 29, 1999 primarily to purchase, subscribe for or otherwise acquire and own, hold, use, manage, sell, assign, transfer, mortgage, pledge, exchange, or otherwise dispose of real and personal property or every kind and description, and to pay thereof in whole or in part, in cash or by exchanging, stocks, bonds and other evidences of indebtedness or securities of this any other corporation. Its investments include common shares of stocks of various communication, broadcasting and media entities. The Board of Trustees of the Beneficial Trust Fund approved additional investments in MediaQuest amounting to Php750 million each on November 5, 2012 and January 25, 2013 to fund the latter’s operational and capital expenditure requirements. Subsequently, on March 1, 2013, the Board of Directors of MediaQuest approved its application of the additional investment to additional paid in capital on the existing subscribed shares of stock.

F-116
On May 8, 2012, the Board of Trustees of the Beneficial Trust Fund approved the issuance by MediaQuest of PDRs amounting to Php6 billion. The underlying shares of these PDRs are the shares of stocks of Cignal TV held by MediaQuest through Satventures (Cignal TV PDRs). On the same date, MediaQuest Board of Directors approved the investment in Cignal TV PDRs by ePLDT, which give ePLDT a 40% economic interest in Cignal TV. In June 2012, MediaQuest received a deposit for future PDRs subscription of Php4 billion from ePLDT. Additional deposits of Php1 billion each were received on July 6, 2012 and August 9, 2012. On January 25, 2013, the Board of Trustees of the Beneficial Trust Fund and the MediaQuest Board of Directors approved the issuance of additional MediaQuest PDRs amounting to Php3.6 billion. The underlying shares of these additional PDRs are the shares of Satventures held by MediaQuest (Satventures PDRs), the holder of which will have a 40% economic interest in Satventures. Satventures is a wholly-owned subsidiary of MediaQuest and the investment vehicle for Cignal TV. From March to August 2013, MediaQuest received from ePLDT an amount aggregating to Php3.6 billion representing deposits for future PDRs subscription. The Satventures PDRs and Cignal TV PDRs were subsequently issued on September 27, 2013, providing ePLDT an effective 64% economic interest in Cignal TV. Also, on January 25, 2013, the Board of Trustees of the Beneficial Trust Fund and the MediaQuest Board of Directors approved the issuance of additional MediaQuest PDRs amounting to Php1.95 billion. The underlying shares of these additional PDRs are the shares of stocks of Hastings held by MediaQuest (Hastings PDRs). Hastings is a wholly-owned subsidiary of MediaQuest, which holds all the print-related investments of MediaQuest, including equity interests in the three leading newspapers: The Philippine Star, Philippine Daily Inquirer, and Business World. From June 2013 to October 2013, MediaQuest received from ePLDT an amount aggregating to Php1.95 billion representing deposits for future PDRs subscription. In November 2013, the Board of Trustees of the Beneficial Trust Fund and the Board of Directors of MediaQuest approved the additional investment of Hastings in The Philippine Star Group. See Note 10 – Investments in Associates and Joint Ventures – Investment in MediaQuest PDRs. In 2014, the Board of Trustees of the Beneficial Trust Fund approved additional investments in MediaQuest amounting to Php6,300 million to fund the latter’s investment requirements. Of the Php6,300 million, a total of Php5,500 million had already been drawn by MediaQuest as at December 31, 2014. On February 19, 2014, ePLDT’s Board of Directors approved an additional Php500 million investment in Hastings PDRs. On March 11, 2014, MediaQuest received from ePLDT an amount aggregating to Php300 million representing deposits for future PDRs subscription. As at December 31, 2014, total deposit for PDRs subscription amounted to Php2,250 million. On May 21, 2015, ePLDT’s Board of Directors approved an additional Php800 million investment in Hastings PDRs and settlement of the Php200 million balance of the Php500 million Hastings PDR investment in 2014. Subsequently, on May 30, 2015, the Board of Trustees of the Beneficial Trust Fund and the Board of Directors of MediaQuest approved the issuance of Php3,250 million Hastings PDRs. This provided ePLDT with 70% economic interest in Hastings. See Note 10 – Investments in Associates and Joint Ventures – Investment in MediaQuest PDRs. In 2015, the Board of Trustees of the Beneficial Trust Fund approved additional investments in MediaQuest amounting to Php5,090 million to fund MediaQuest’s investment requirements and such amount was fully drawn by MediaQuest as at December 31, 2015. In 2016, the Board of Trustees of the Beneficial Trust Fund approved additional investments in MediaQuest amounting to Php5,500 million to fund the latter’s investment requirements for the year 2016. Of the Php5,500 million, a total of Php3,500 million had already been drawn by MediaQuest to date. PAS 19 requires employee benefit plan assets to be measured at fair value. The fair values of the investments in MediaQuest were measured using an income approach valuation technique using cash flows projections based on financial budgets and forecasts approved by MediaQuest’s Board of Directors, covering a five-year period from 2016 to 2020.
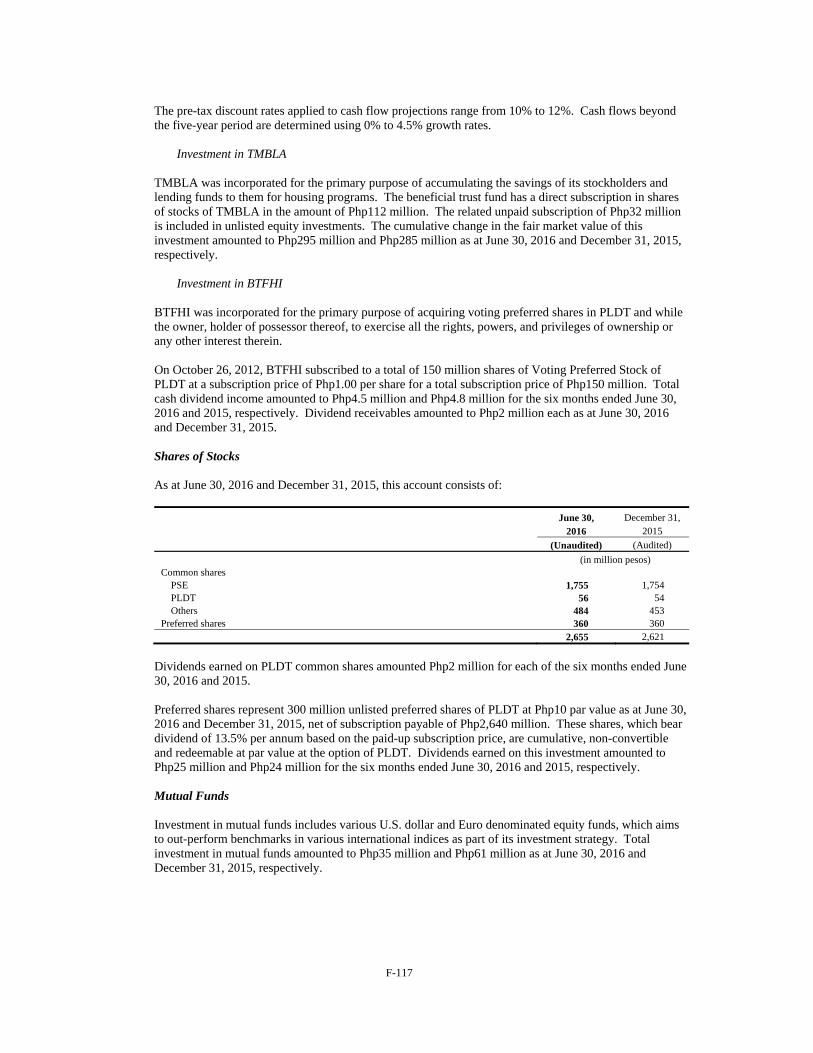
F-117
The pre-tax discount rates applied to cash flow projections range from 10% to 12%. Cash flows beyond the five-year period are determined using 0% to 4.5% growth rates.
Investment in TMBLA
TMBLA was incorporated for the primary purpose of accumulating the savings of its stockholders and lending funds to them for housing programs. The beneficial trust fund has a direct subscription in shares of stocks of TMBLA in the amount of Php112 million. The related unpaid subscription of Php32 million is included in unlisted equity investments. The cumulative change in the fair market value of this investment amounted to Php295 million and Php285 million as at June 30, 2016 and December 31, 2015, respectively.
Investment in BTFHI
BTFHI was incorporated for the primary purpose of acquiring voting preferred shares in PLDT and while the owner, holder of possessor thereof, to exercise all the rights, powers, and privileges of ownership or any other interest therein.
On October 26, 2012, BTFHI subscribed to a total of 150 million shares of Voting Preferred Stock of PLDT at a subscription price of Php1.00 per share for a total subscription price of Php150 million. Total cash dividend income amounted to Php4.5 million and Php4.8 million for the six months ended June 30, 2016 and 2015, respectively. Dividend receivables amounted to Php2 million each as at June 30, 2016 and December 31, 2015.
Shares of Stocks
As at June 30, 2016 and December 31, 2015, this account consists of:
June 30, December 31, 2016 2015
(Unaudited) (Audited)
(in million pesos) Common shares
PSE 1,755 1,754 PLDT 56 54 Others 484 453
Preferred shares 360 360 2,655 2,621
Dividends earned on PLDT common shares amounted Php2 million for each of the six months ended June 30, 2016 and 2015. Preferred shares represent 300 million unlisted preferred shares of PLDT at Php10 par value as at June 30, 2016 and December 31, 2015, net of subscription payable of Php2,640 million. These shares, which bear dividend of 13.5% per annum based on the paid-up subscription price, are cumulative, non-convertible and redeemable at par value at the option of PLDT. Dividends earned on this investment amounted to Php25 million and Php24 million for the six months ended June 30, 2016 and 2015, respectively. Mutual Funds Investment in mutual funds includes various U.S. dollar and Euro denominated equity funds, which aims to out-perform benchmarks in various international indices as part of its investment strategy. Total investment in mutual funds amounted to Php35 million and Php61 million as at June 30, 2016 and December 31, 2015, respectively.
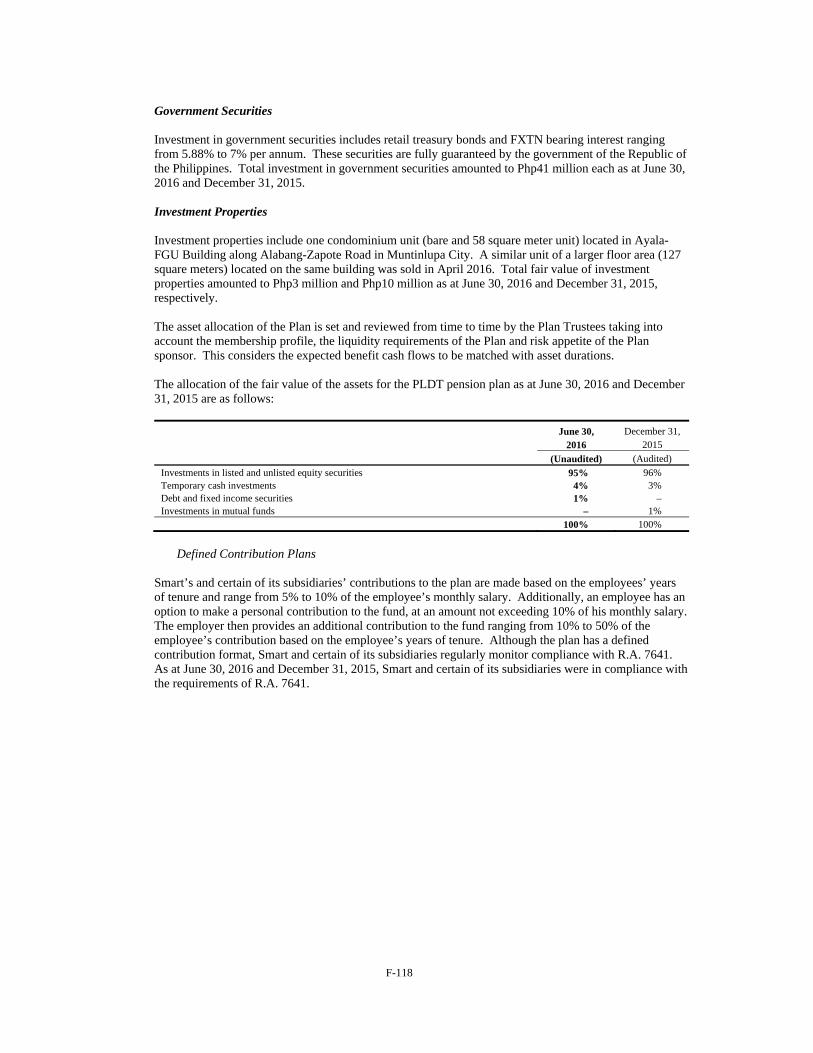
F-118
Government Securities Investment in government securities includes retail treasury bonds and FXTN bearing interest ranging from 5.88% to 7% per annum. These securities are fully guaranteed by the government of the Republic of the Philippines. Total investment in government securities amounted to Php41 million each as at June 30, 2016 and December 31, 2015. Investment Properties Investment properties include one condominium unit (bare and 58 square meter unit) located in Ayala-FGU Building along Alabang-Zapote Road in Muntinlupa City. A similar unit of a larger floor area (127 square meters) located on the same building was sold in April 2016. Total fair value of investment properties amounted to Php3 million and Php10 million as at June 30, 2016 and December 31, 2015, respectively. The asset allocation of the Plan is set and reviewed from time to time by the Plan Trustees taking into account the membership profile, the liquidity requirements of the Plan and risk appetite of the Plan sponsor. This considers the expected benefit cash flows to be matched with asset durations.
The allocation of the fair value of the assets for the PLDT pension plan as at June 30, 2016 and December 31, 2015 are as follows:
June 30, December 31, 2016 2015
(Unaudited) (Audited)
Investments in listed and unlisted equity securities 95% 96% Temporary cash investments 4% 3% Debt and fixed income securities 1% – Investments in mutual funds – 1%
100% 100%
Defined Contribution Plans
Smart’s and certain of its subsidiaries’ contributions to the plan are made based on the employees’ years of tenure and range from 5% to 10% of the employee’s monthly salary. Additionally, an employee has an option to make a personal contribution to the fund, at an amount not exceeding 10% of his monthly salary. The employer then provides an additional contribution to the fund ranging from 10% to 50% of the employee’s contribution based on the employee’s years of tenure. Although the plan has a defined contribution format, Smart and certain of its subsidiaries regularly monitor compliance with R.A. 7641. As at June 30, 2016 and December 31, 2015, Smart and certain of its subsidiaries were in compliance with the requirements of R.A. 7641.
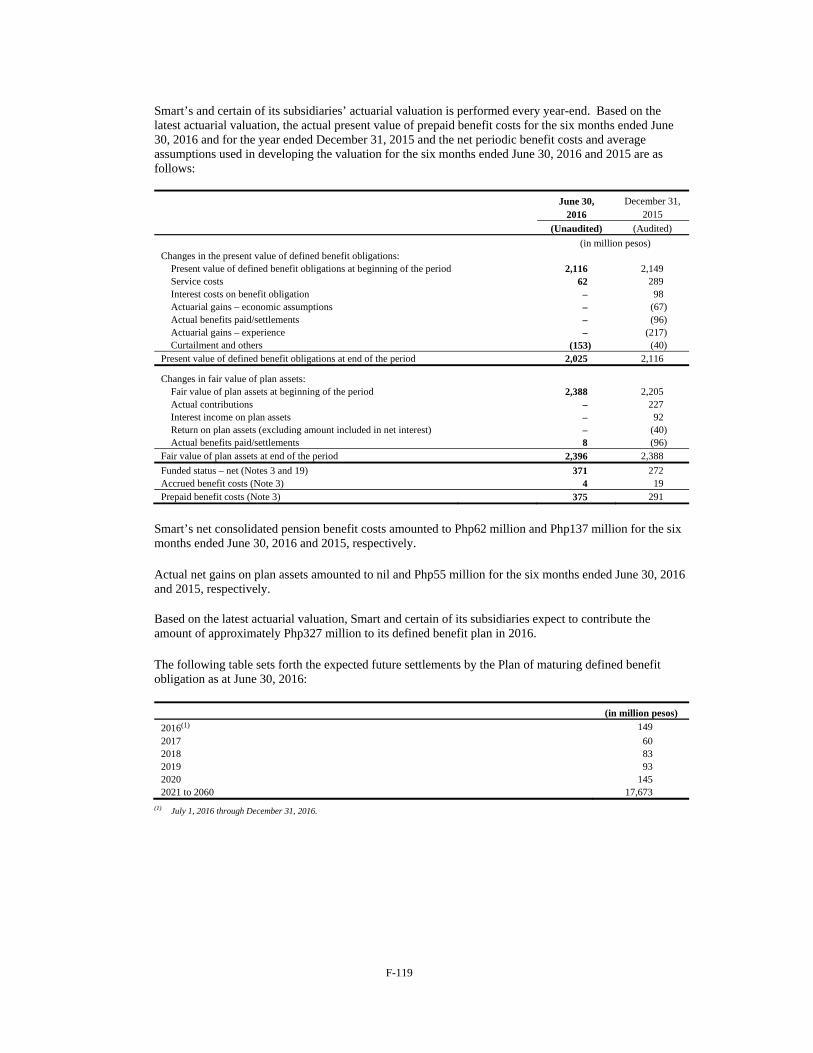
F-119
Smart’s and certain of its subsidiaries’ actuarial valuation is performed every year-end. Based on the latest actuarial valuation, the actual present value of prepaid benefit costs for the six months ended June 30, 2016 and for the year ended December 31, 2015 and the net periodic benefit costs and average assumptions used in developing the valuation for the six months ended June 30, 2016 and 2015 are as follows:
June 30, December 31, 2016 2015
(Unaudited) (Audited)
(in million pesos) Changes in the present value of defined benefit obligations:
Present value of defined benefit obligations at beginning of the period 2,116 2,149 Service costs 62 289 Interest costs on benefit obligation – 98 Actuarial gains – economic assumptions – (67) Actual benefits paid/settlements – (96) Actuarial gains – experience – (217) Curtailment and others (153) (40)
Present value of defined benefit obligations at end of the period 2,025 2,116
Changes in fair value of plan assets: Fair value of plan assets at beginning of the period 2,388 2,205 Actual contributions – 227 Interest income on plan assets – 92 Return on plan assets (excluding amount included in net interest) – (40) Actual benefits paid/settlements 8 (96)
Fair value of plan assets at end of the period 2,396 2,388
Funded status – net (Notes 3 and 19) 371 272 Accrued benefit costs (Note 3) 4 19 Prepaid benefit costs (Note 3) 375 291
Smart’s net consolidated pension benefit costs amounted to Php62 million and Php137 million for the six months ended June 30, 2016 and 2015, respectively. Actual net gains on plan assets amounted to nil and Php55 million for the six months ended June 30, 2016 and 2015, respectively. Based on the latest actuarial valuation, Smart and certain of its subsidiaries expect to contribute the amount of approximately Php327 million to its defined benefit plan in 2016. The following table sets forth the expected future settlements by the Plan of maturing defined benefit obligation as at June 30, 2016:
(in million pesos)
2016(1) 149
2017 60 2018 83 2019 93 2020 145 2021 to 2060 17,673
(1) July 1, 2016 through December 31, 2016.
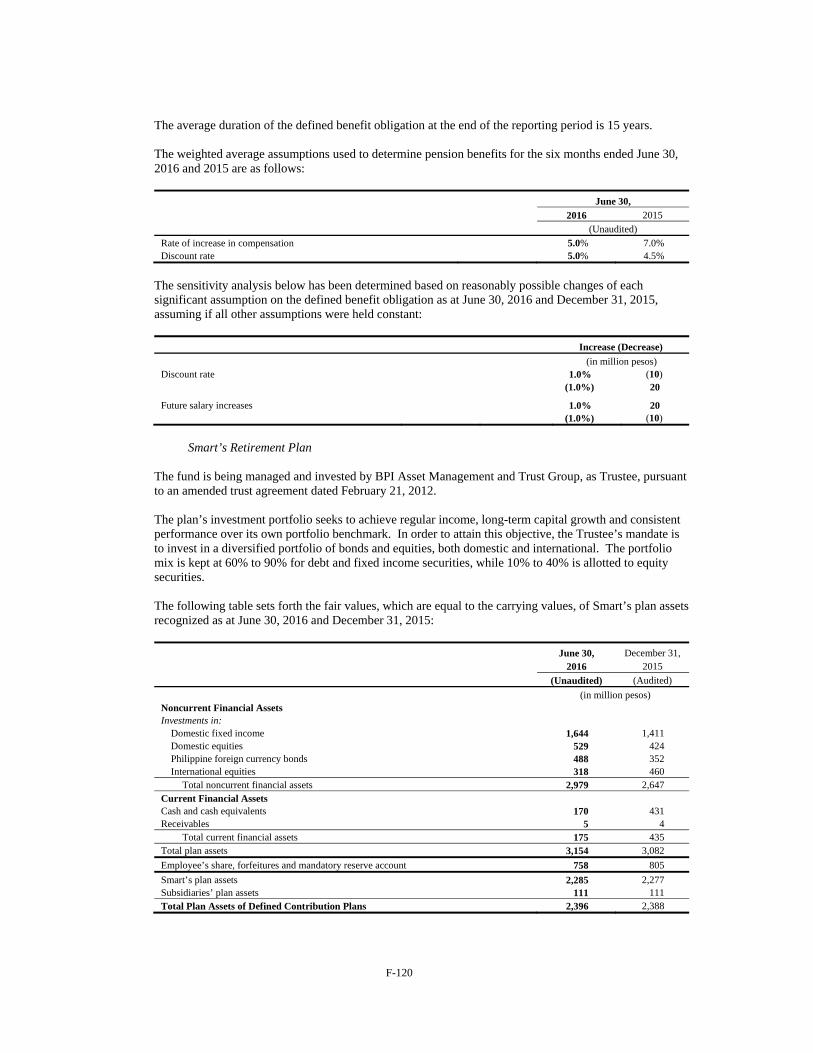
F-120
The average duration of the defined benefit obligation at the end of the reporting period is 15 years. The weighted average assumptions used to determine pension benefits for the six months ended June 30, 2016 and 2015 are as follows:
June 30, 2016 2015
(Unaudited)
Rate of increase in compensation 5.0% 7.0% Discount rate 5.0% 4.5%
The sensitivity analysis below has been determined based on reasonably possible changes of each significant assumption on the defined benefit obligation as at June 30, 2016 and December 31, 2015, assuming if all other assumptions were held constant:
Increase (Decrease)
(in million pesos) Discount rate 1.0% (10) (1.0%) 20
Future salary increases 1.0% 20 (1.0%) (10)
Smart’s Retirement Plan
The fund is being managed and invested by BPI Asset Management and Trust Group, as Trustee, pursuant to an amended trust agreement dated February 21, 2012.
The plan’s investment portfolio seeks to achieve regular income, long-term capital growth and consistent performance over its own portfolio benchmark. In order to attain this objective, the Trustee’s mandate is to invest in a diversified portfolio of bonds and equities, both domestic and international. The portfolio mix is kept at 60% to 90% for debt and fixed income securities, while 10% to 40% is allotted to equity securities.
The following table sets forth the fair values, which are equal to the carrying values, of Smart’s plan assets recognized as at June 30, 2016 and December 31, 2015:
June 30, December 31, 2016 2015
(Unaudited) (Audited)
(in million pesos) Noncurrent Financial Assets Investments in:
Domestic fixed income 1,644 1,411 Domestic equities 529 424 Philippine foreign currency bonds 488 352 International equities 318 460
Total noncurrent financial assets 2,979 2,647 Current Financial Assets Cash and cash equivalents 170 431 Receivables 5 4
Total current financial assets 175 435 Total plan assets 3,154 3,082
Employee’s share, forfeitures and mandatory reserve account 758 805
Smart’s plan assets 2,285 2,277 Subsidiaries’ plan assets 111 111 Total Plan Assets of Defined Contribution Plans 2,396 2,388
F-121
Domestic Fixed Income
Investments in domestic fixed income include Philippine peso denominated bonds, such as government securities, corporate debt securities and a fixed income fund managed by BPI Asset Management and Trust Group which is invested in a diversified portfolio of Philippine peso-denominated fixed income instruments. The investments under this category, exclusive of the mutual fund, earned between 2.90% and 4.19% interest for the six months ended June 30, 2016 and 2015, respectively. Total investments in domestic fixed income amounted to Php1,644 million and Php1,411 million as at June 30, 2016 and December 31, 2015, respectively. Domestic Equities
Investments in domestic equities include direct equity investments in common shares and convertible preferred shares listed in the PSE and a local equity fund managed by BPI Asset Management and Trust Group which is invested in a diversified portfolio of stocks listed in the PSE. These investments earn on stock price appreciation and dividend payments. Total investment in domestic equities amounted to Php529 million and Php424 million as at June 30, 2016 and December 31, 2015, respectively. This includes investment in PLDT shares with fair value of Php35 million and Php31 million as at June 30, 2016 and December 31, 2015, respectively. Philippine Foreign Currency Bonds Investments in Philippine foreign currency bonds include investments in U.S. dollar denominated fixed income instruments issued by the Philippine government, local corporations and financial institutions. The investments under this category earned between 3.70% and 3.95% interest for the six months ended June 30, 2016 and 2015, respectively. Total investment in Philippine foreign currency bonds amounted to Php488 million and Php352 million as at June 30, 2016 and December 31, 2015, respectively.
International Equities
Investments in international equities include mutual funds managed by ING International and an offshore investment in a global mutual fund managed by Franklin Templeton, which are all invested in diversified portfolios of global equities. Total investment in international equities amounted to Php318 million and Php460 million as at June 30, 2016 and December 31, 2015, respectively.
Cash and Cash Equivalents
This pertains to the fund’s excess liquidity in Philippine peso and U.S. dollars including investments in time deposits, money market funds and other deposit products of banks with duration or tenor less than a year.
The asset allocation of the Plan is set and reviewed from time to time by the Plan Trustees taking into account the membership profile, the liquidity requirements of the Plan and risk appetite of the Plan sponsor. This considers the expected benefit cash flows to be matched with asset durations.
The plan assets are primarily exposed to financial risks such as liquidity risk and price risk.
Liquidity risk pertains to the plan’s ability to meet its obligation to the employees upon retirement. To effectively manage liquidity risk, the Plan Trustees invests a portion of the fund in readily tradeable and liquid investments which can be sold at any given time to fund liquidity requirements.
Price risk pertains mainly to fluctuations in market prices of equity securities listed in the PSE. In order to effectively manage price risk, the Plan Trustees continuously assesses these risks by closely monitoring the market value of the securities and implementing prudent investment strategies.
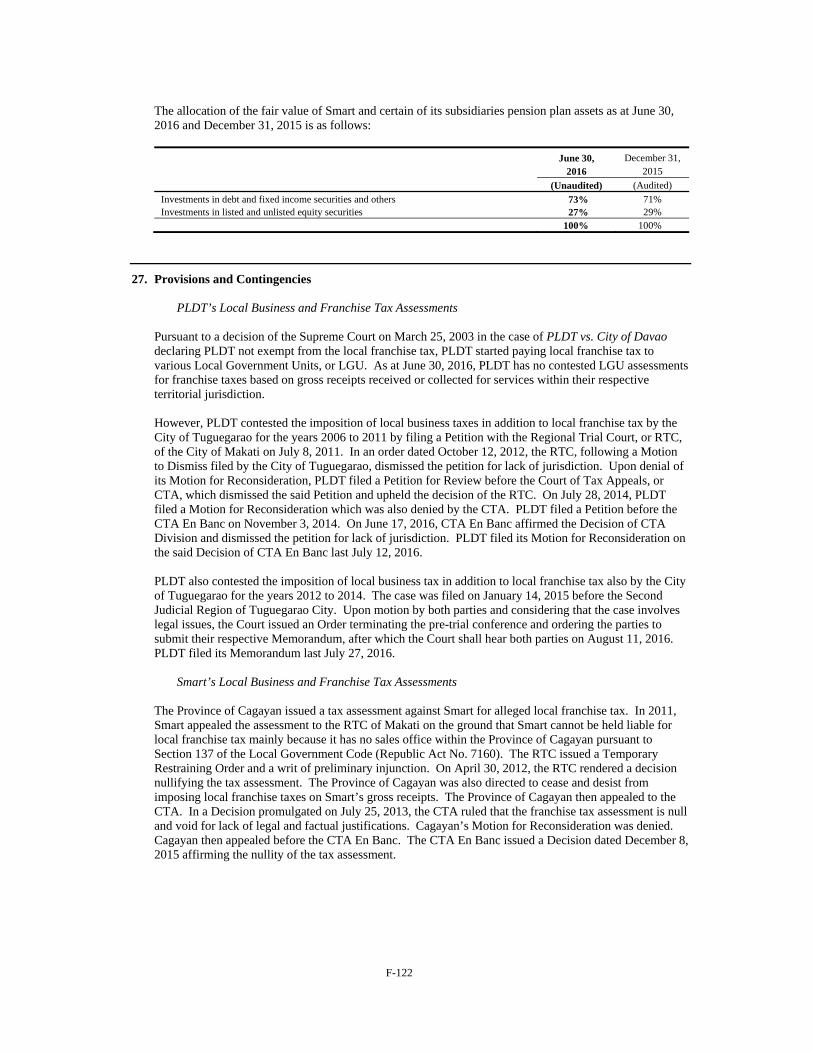
F-122
The allocation of the fair value of Smart and certain of its subsidiaries pension plan assets as at June 30, 2016 and December 31, 2015 is as follows:
June 30, December 31, 2016 2015
(Unaudited) (Audited)
Investments in debt and fixed income securities and others 73% 71% Investments in listed and unlisted equity securities 27% 29%
100% 100%
27. Provisions and Contingencies
PLDT’s Local Business and Franchise Tax Assessments
Pursuant to a decision of the Supreme Court on March 25, 2003 in the case of PLDT vs. City of Davao declaring PLDT not exempt from the local franchise tax, PLDT started paying local franchise tax to various Local Government Units, or LGU. As at June 30, 2016, PLDT has no contested LGU assessments for franchise taxes based on gross receipts received or collected for services within their respective territorial jurisdiction.
However, PLDT contested the imposition of local business taxes in addition to local franchise tax by the City of Tuguegarao for the years 2006 to 2011 by filing a Petition with the Regional Trial Court, or RTC, of the City of Makati on July 8, 2011. In an order dated October 12, 2012, the RTC, following a Motion to Dismiss filed by the City of Tuguegarao, dismissed the petition for lack of jurisdiction. Upon denial of its Motion for Reconsideration, PLDT filed a Petition for Review before the Court of Tax Appeals, or CTA, which dismissed the said Petition and upheld the decision of the RTC. On July 28, 2014, PLDT filed a Motion for Reconsideration which was also denied by the CTA. PLDT filed a Petition before the CTA En Banc on November 3, 2014. On June 17, 2016, CTA En Banc affirmed the Decision of CTA Division and dismissed the petition for lack of jurisdiction. PLDT filed its Motion for Reconsideration on the said Decision of CTA En Banc last July 12, 2016. PLDT also contested the imposition of local business tax in addition to local franchise tax also by the City of Tuguegarao for the years 2012 to 2014. The case was filed on January 14, 2015 before the Second Judicial Region of Tuguegarao City. Upon motion by both parties and considering that the case involves legal issues, the Court issued an Order terminating the pre-trial conference and ordering the parties to submit their respective Memorandum, after which the Court shall hear both parties on August 11, 2016. PLDT filed its Memorandum last July 27, 2016.
Smart’s Local Business and Franchise Tax Assessments
The Province of Cagayan issued a tax assessment against Smart for alleged local franchise tax. In 2011, Smart appealed the assessment to the RTC of Makati on the ground that Smart cannot be held liable for local franchise tax mainly because it has no sales office within the Province of Cagayan pursuant to Section 137 of the Local Government Code (Republic Act No. 7160). The RTC issued a Temporary Restraining Order and a writ of preliminary injunction. On April 30, 2012, the RTC rendered a decision nullifying the tax assessment. The Province of Cagayan was also directed to cease and desist from imposing local franchise taxes on Smart’s gross receipts. The Province of Cagayan then appealed to the CTA. In a Decision promulgated on July 25, 2013, the CTA ruled that the franchise tax assessment is null and void for lack of legal and factual justifications. Cagayan’s Motion for Reconsideration was denied. Cagayan then appealed before the CTA En Banc. The CTA En Banc issued a Decision dated December 8, 2015 affirming the nullity of the tax assessment.
F-123
In 2015, the City of Manila issued assessments for alleged business tax deficiencies and cell sites regulatory fees and charges. Smart protested the assessments. After Manila denied the protest, Smart appealed to the RTC of the City of Manila, arguing that it is not liable for local business taxes on income realized from its telecommunications operations and that the assessments were a clear circumvention of Manila City Ordinance No. 8299 exempting Smart from the payment of local franchise tax. The assessment for regulatory fees was contested for being void, as they were made without a valid and legal basis. In the Decision promulgated on March 9, 2016, the RTC declared the local business tax and cell site regulatory fee assessments as invalid and void.
Digitel’s Franchise Tax Assessment and Real Property Tax Assessment
In the case of Digitel vs. Province of Pangasinan (G.R. No. 152534, February 23, 2007), the Supreme Court held that Digitel is liable to the Province of Pangasinan for franchise tax from November 13, 1992 and real property tax only on real properties not actually, directly and exclusively used in the franchise operations from February 17, 1994. Digitel has fully settled its obligation with the Province of Pangasinan with respect to franchise tax and is currently in talks with the Province for the settlement of the real property tax.
DMPI’s Local Business and Real Property Taxes Assessments
In DMPI vs. City of Cotabato, DMPI filed a Petition in 2010 for Prohibition and Mandamus against the City of Cotabato due to their threats to close its cell sites due to alleged real property tax delinquencies. The RTC denied the petition. DMPI appealed with the CTA. The CTA ordered the City of Cotabato to file their Comment.
In the DMPI vs. City of Davao, DMPI filed in 2011 a Petition for Prohibition and Mandamus and sought the Court’s intervention due to the threats issued by the City of Davao to stop the operations of DMPI business centers in the locality due to lack of business permits. DMPI contended that the City of Davao’s act of refusing to process its applications due to failure to pay real property taxes and business taxes is unwarranted. Davao’s Legal Officer and City Assessor confirmed that DMPI’s machinery is exempt from real property tax. On March 20, 2015, the Court has approved DMPI’s Motion which prayed for the dismissal of the case.
In the DMPI vs. City Government of Malabon, DMPI filed in 2011 a Petition for Prohibition and Mandamus against the City of Malabon to prevent the auction sale of DMPI sites in its jurisdiction for alleged real property tax liabilities. DMPI was able to secure a TRO to defer the sale. As at August 2, 2016, there is an ongoing mediation and the parties are exploring the possibility of settling amicably.
DMPI’s Local Tower Fee Assessments
In DMPI vs. Municipality of San Mateo, DMPI filed in 2011 a petition for Prohibition and Mandamus with Preliminary Injunction and TRO against the Tower Fee Ordinance of the Municipality of San Mateo. In 2014, the RTC ruled in favor of DMPI and declared the ordinance void and without legal force and effect. The Municipality of San Mateo appealed with the CA. The case has been submitted for resolution.
Meanwhile, in DMPI vs. the City Government of Santiago City and the City Permits and License Inspection Office of Santiago City, Isabela (CA-G.R. SP No. 127253) (Special Civil Action Case No. 36-0360, February 2011), the City Government of Santiago City filed an appeal with the CA after the lower court granted DMPI’s petition and ruled as unconstitutional the provision of the ordinance imposing the Php200 thousand per cell site per annum. On May 5, 2015, the Appeal was dismissed and the ruling issued by the trial court was affirmed.
DMPI vs. City of Trece Martires – In 2010, DMPI petitioned to declare void the City of Trece Martires ordinance of imposing tower fee of Php150 thousand for each cell site annually. Application for the issuance of a preliminary injunction by DMPI is pending resolution.
F-124
Globe Telecoms, et al. vs. City of Lipa – In 2006, Globe filed a Protest of Assessment questioning the act of the City of Lipa in assessing tower fees for its sites amounting to Php105 thousand per year. Smart, Digitel and DMPI submitted a joint memorandum in June 2013 pertaining to the issue. However, the Sangguniang Panglungsod has since repealed the ordinance, and issued instead Tax Ordinance No. 177, which imposes a one-time regulatory fee of Php50 thousand for every tower to be constructed in the City of Lipa. The Joint Motion to Dismiss filed by Smart and DMPI on June 8, 2015 is pending resolution.
Arbitration with Eastern Telecommunications Philippines, Inc., or ETPI
Since 1990, PLDT and ETPI have been engaged in legal proceedings involving a number of issues in connection with their business relationship. While they have entered into compromise agreements in the past (one in February 1990, and another one in March 1999), these agreements have not put to rest their issues against each other. Accordingly, to avoid further protracted litigation and improve their business relationship, both PLDT and ETPI have agreed in April 2008 to submit their differences and issues to voluntary arbitration. For this arbitration (after collating various claims of one party against the other) ETPI, on one hand, initially submitted its claims of about Php2.9 billion against PLDT; while PLDT, on the other hand, submitted its claims of about Php2.8 billion against ETPI. Pursuant to an agreement between PLDT and ETPI, the arbitration proceedings have been suspended.
In the Matter of the Wilson Gamboa Case and Jose M. Roy III Petition
On June 29, 2011, the Supreme Court of the Philippines, or the Court, promulgated a Decision in the case of Wilson P. Gamboa vs. Finance Secretary Margarito B. Teves, et. al. (G.R. No. 176579) (the “Gamboa Case”), holding that “the term ‘capital’ in Section 11, Article XII of the 1987 Constitution refers only to shares of stock entitled to vote in the election of directors and thus only to voting common shares, and not to the total outstanding capital stock (common and non-voting preferred shares)”. This decision reversed earlier opinions issued by the Philippine SEC that non-voting preferred shares are included in the computation of the 60%-40% Filipino-alien equity requirement of certain economic activities, such as telecommunications (which is a public utility under Section 11, Article XII of the 1987 Constitution).
Although PLDT is not a party to the Gamboa Case, in its decision, the Court directed the Philippine SEC “to apply this definition of the term ‘capital’ in determining the extent of allowable foreign ownership in PLDT, and if there is a violation of Section 11, Article XII of the 1987 Constitution, to impose the appropriate sanctions under the law.” Although the parties to the Gamboa Case filed Motions for Reconsideration of the decision and argued their positions before the Court, the Court ultimately denied the motions on October 9, 2012. Meanwhile, on July 5, 2011, the Board of Directors of PLDT approved the amendments to the Seventh Article of Amended Articles of Incorporation of PLDT, or the Amendments to the Articles, which subclassified its authorized preferred capital into preferred shares with full voting rights, or Voting Preferred Shares, and serial preferred shares without voting rights. The Amendments to the Articles were subsequently approved by the stockholders of PLDT and the Philippine SEC. On October 15, 2012, PLDT and BTFHI, a Filipino corporation and a wholly-owned company of The Board of Trustees for the Account of the Beneficial Trust Fund created pursuant to the PLDT’s Benefit Plan, entered into a Subscription Agreement, pursuant to which PLDT issued 150 million Voting Preferred Shares to BTFHI at Php1.00 per share reducing the percentage of PLDT’s voting stock held by foreigners from 56.62% (based on Voting Common Stock) as at October 15, 2012 to 18.37% (based on Voting Common and Preferred Stock) as at April 15, 2013. On May 20, 2013, the Philippine SEC issued SEC Memorandum Circular No. 8, Series of 2013, or the Philippine SEC Guidelines, which we believe was intended to fulfill the Court’s directive to the Philippine SEC in the Gamboa Case. The Philippine SEC Guidelines provided that “the required percentage of Filipino ownership shall be applied to BOTH: (a) the total number of outstanding shares of stock entitled to vote in the election of directors; AND (b) the total number of outstanding shares of stock, whether or not entitled to vote in the election of directors.” PLDT believes it was, and continues to be, compliant with the Philippine SEC Guidelines. As at July 29, 2016, PLDT’s foreign ownership was 29.49% of its outstanding shares entitled to vote (Common and Voting Preferred Shares), and 16.21% of its total outstanding capital stock. Therefore, we believe that as at July 29, 2016, PLDT is in compliance with the requirement of Section 11, Article XII of the 1987 Constitution.
F-125
On June 10, 2013, Jose M. Roy III filed a petition for certiorari with the Supreme Court against the Philippine SEC, Philippine SEC Chairperson Teresita Herbosa and PLDT, claiming: (1) that the Philippine SEC Guidelines violates the Court’s decision in the Gamboa Case (on the basis that (a) the 60-40 ownership requirement be imposed on “each class of shares” and (b) Filipinos must have full beneficial ownership of 60% of the outstanding capital stock of corporations subject to the foreign ownership requirements); and (2) that the PLDT Beneficial Trust Fund is not a Filipino-owned entity and consequently, the corporations owned by PLDT Beneficial Trust Fund, including BTFHI, cannot be considered Filipino-owned corporations. PLDT raised several procedural and substantive arguments against the petition, including in particular, that (a) the Philippine SEC Guidelines merely implemented the dispositive portion of the decision in the Gamboa Case, and that the dispositive portion of the Gamboa Case that defines “capital” is properly reflected in the Philippine SEC Guidelines, and (b) the fundamental requirements which need to be satisfied in order for PLDT Beneficial Trust Fund and BTFHI to be considered Filipino (for PLDT Beneficial Trust Fund’s Trustees to be Filipinos and for 60% of the Fund to accrue to the benefit of Philippine nationals) are satisfied with respect to the PLDT Beneficial Trust Fund, and therefore, PLDT Beneficial Trust Fund and BTFHI are Filipino shareholders for purposes of classifying their 150 million Voting Preferred Shares in PLDT. As a result, more than 60% of PLDT’s total voting stock is Filipino-owned and PLDT is compliant with the Constitutional ownership requirements. In 2013, the Philippine SEC and Chairperson Teresita Herbosa also raised a number of arguments for dismissal of the petition for being procedurally flawed and for lack of merit. In May 2014, the petitioner filed a consolidated reply and a motion for the issuance of a temporary restraining order to prevent PLDT from holding its 2014 annual stockholders meeting. The temporary restraining order was denied and PLDT held its 2014 annual meeting on June 10, 2014 as scheduled. On February 10, 2015, PLDT filed a consolidated memorandum setting forth its arguments against the petition. As at August 2, 2016, the resolution of the petition remains pending with the Supreme Court.
Other disclosures required by PAS 37 were not provided as it may prejudice our position in on-going claims, litigations and assessments. See Note 3 – Management’s Use of Accounting Judgments, Estimates and Assumptions – Provision for legal contingencies and tax assessments.
28. Financial Assets and Liabilities
We have various financial assets such as trade and non-trade receivables, cash and short-term deposits, which arise directly from our operations. Our principal financial liabilities, other than derivatives, comprise of bank loans and overdrafts, finance leases, trade and non-trade payables. The main purpose of these financial liabilities is to finance our operations. We also enter into derivative transactions, primarily principal only-currency swap agreements, currency options, interest rate swaps and forward foreign exchange contracts to manage the currency and interest rate risks arising from our operations and sources of financing. Our accounting policies in relation to derivatives are set out in Note 2 – Summary of Significant Accounting Policies – Financial Instruments.
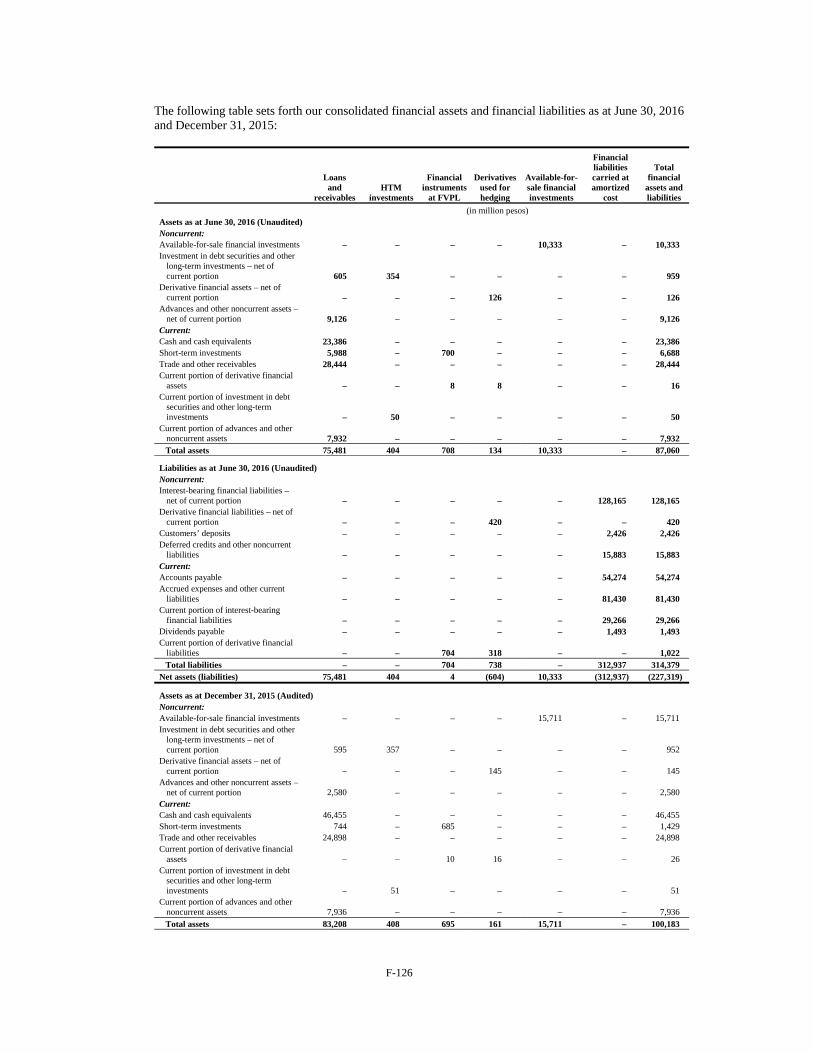
F-126
The following table sets forth our consolidated financial assets and financial liabilities as at June 30, 2016 and December 31, 2015:
Loans and
receivables HTM
investments
Financial instruments
at FVPL
Derivatives used for hedging
Available-for-sale financial investments
Financial liabilities carried at amortized
cost
Total financial
assets and liabilities
(in million pesos) Assets as at June 30, 2016 (Unaudited) Noncurrent: Available-for-sale financial investments – – – – 10,333 – 10,333 Investment in debt securities and other
long-term investments – net of current portion 605 354 – – – – 959
Derivative financial assets – net of current portion – – – 126 – –
126
Advances and other noncurrent assets – net of current portion 9,126 – – – – – 9,126
Current: Cash and cash equivalents 23,386 – – – – – 23,386 Short-term investments 5,988 – 700 – – – 6,688 Trade and other receivables 28,444 – – – – – 28,444 Current portion of derivative financial
assets – – 8 8 – – 16 Current portion of investment in debt
securities and other long-term investments – 50 – – – – 50
Current portion of advances and other noncurrent assets 7,932 – – – – – 7,932 Total assets 75,481 404 708 134 10,333 – 87,060
Liabilities as at June 30, 2016 (Unaudited) Noncurrent: Interest-bearing financial liabilities –
net of current portion – – – – – 128,165
128,165 Derivative financial liabilities – net of
current portion – – – 420 – – 420 Customers’ deposits – – – – – 2,426 2,426 Deferred credits and other noncurrent
liabilities – – – – – 15,883 15,883 Current: Accounts payable – – – – – 54,274 54,274 Accrued expenses and other current
liabilities – – – – – 81,430 81,430 Current portion of interest-bearing
financial liabilities – – – – – 29,266 29,266 Dividends payable – – – – – 1,493 1,493 Current portion of derivative financial
liabilities – – 704 318 – – 1,022 Total liabilities – – 704 738 – 312,937 314,379
Net assets (liabilities) 75,481 404 4 (604) 10,333 (312,937) (227,319)
Assets as at December 31, 2015 (Audited) Noncurrent: Available-for-sale financial investments – – – – 15,711 – 15,711 Investment in debt securities and other
long-term investments – net of current portion 595 357 – – – – 952
Derivative financial assets – net of current portion – – – 145 – – 145
Advances and other noncurrent assets – net of current portion 2,580 – – – – – 2,580
Current: Cash and cash equivalents 46,455 – – – – – 46,455 Short-term investments 744 – 685 – – – 1,429 Trade and other receivables 24,898 – – – – – 24,898 Current portion of derivative financial
assets – – 10 16 – – 26 Current portion of investment in debt
securities and other long-term investments – 51 – – – – 51
Current portion of advances and other noncurrent assets 7,936 – – – – – 7,936 Total assets 83,208 408 695 161 15,711 – 100,183
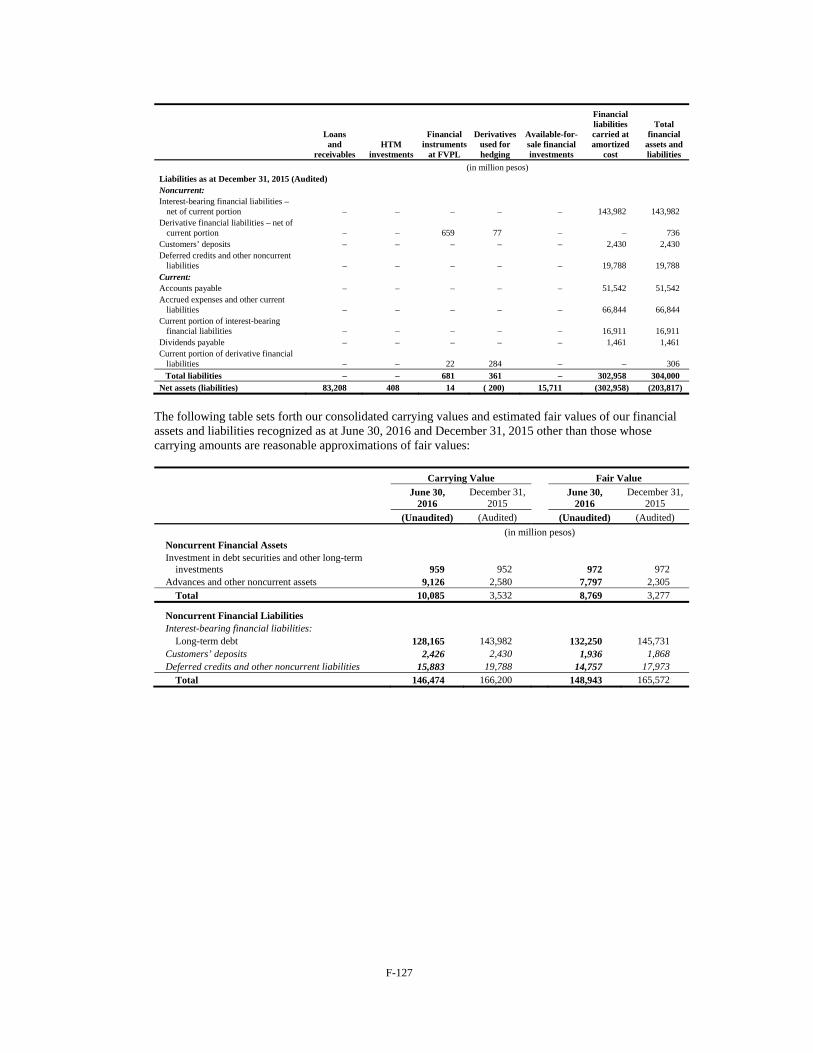
F-127
Loans and
receivables HTM
investments
Financial instruments
at FVPL
Derivatives used for hedging
Available-for-sale financial investments
Financial liabilities carried at amortized
cost
Total financial
assets and liabilities
(in million pesos) Liabilities as at December 31, 2015 (Audited) Noncurrent: Interest-bearing financial liabilities –
net of current portion – – – – – 143,982 143,982 Derivative financial liabilities – net of
current portion – – 659 77 – – 736 Customers’ deposits – – – – – 2,430 2,430 Deferred credits and other noncurrent
liabilities – – – – – 19,788 19,788 Current: Accounts payable – – – – – 51,542 51,542 Accrued expenses and other current
liabilities – – – – – 66,844 66,844 Current portion of interest-bearing
financial liabilities – – – – – 16,911 16,911 Dividends payable – – – – – 1,461 1,461 Current portion of derivative financial
liabilities – – 22 284 – – 306 Total liabilities – – 681 361 – 302,958 304,000
Net assets (liabilities) 83,208 408 14 ( 200) 15,711 (302,958) (203,817)
The following table sets forth our consolidated carrying values and estimated fair values of our financial assets and liabilities recognized as at June 30, 2016 and December 31, 2015 other than those whose carrying amounts are reasonable approximations of fair values:
Carrying Value Fair Value
June 30, 2016
December 31, 2015
June 30, 2016
December 31, 2015
(Unaudited) (Audited) (Unaudited) (Audited)
(in million pesos) Noncurrent Financial Assets Investment in debt securities and other long-term
investments 959 952 972 972 Advances and other noncurrent assets 9,126 2,580 7,797 2,305
Total 10,085 3,532 8,769 3,277
Noncurrent Financial Liabilities Interest-bearing financial liabilities:
Long-term debt 128,165 143,982 132,250 145,731 Customers’ deposits 2,426 2,430 1,936 1,868 Deferred credits and other noncurrent liabilities 15,883 19,788 14,757 17,973
Total 146,474 166,200 148,943 165,572
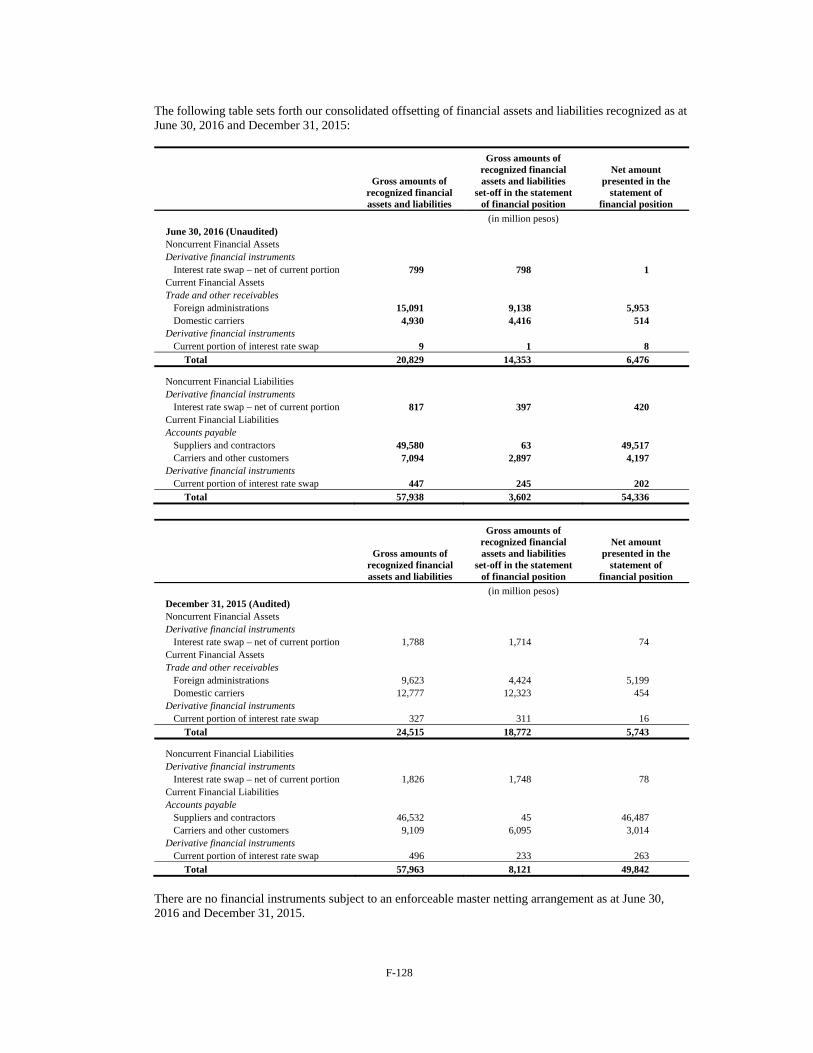
F-128
The following table sets forth our consolidated offsetting of financial assets and liabilities recognized as at June 30, 2016 and December 31, 2015:
Gross amounts of recognized financial assets and liabilities
Gross amounts of recognized financial assets and liabilities
set-off in the statement of financial position
Net amount presented in the
statement of financial position
(in million pesos) June 30, 2016 (Unaudited) Noncurrent Financial Assets Derivative financial instruments
Interest rate swap – net of current portion 799 798 1 Current Financial Assets Trade and other receivables
Foreign administrations 15,091 9,138 5,953 Domestic carriers 4,930 4,416 514
Derivative financial instruments Current portion of interest rate swap 9 1 8
Total 20,829 14,353 6,476
Noncurrent Financial Liabilities Derivative financial instruments
Interest rate swap – net of current portion 817 397 420 Current Financial Liabilities Accounts payable
Suppliers and contractors 49,580 63 49,517 Carriers and other customers 7,094 2,897 4,197
Derivative financial instruments Current portion of interest rate swap 447 245 202
Total 57,938 3,602 54,336
Gross amounts of recognized financial assets and liabilities
Gross amounts of recognized financial assets and liabilities
set-off in the statement of financial position
Net amount presented in the
statement of financial position
(in million pesos) December 31, 2015 (Audited) Noncurrent Financial Assets Derivative financial instruments
Interest rate swap – net of current portion 1,788 1,714 74 Current Financial Assets Trade and other receivables
Foreign administrations 9,623 4,424 5,199 Domestic carriers 12,777 12,323 454
Derivative financial instruments Current portion of interest rate swap 327 311 16
Total 24,515 18,772 5,743
Noncurrent Financial Liabilities Derivative financial instruments
Interest rate swap – net of current portion 1,826 1,748 78 Current Financial Liabilities Accounts payable
Suppliers and contractors 46,532 45 46,487 Carriers and other customers 9,109 6,095 3,014
Derivative financial instruments Current portion of interest rate swap 496 233 263
Total 57,963 8,121 49,842
There are no financial instruments subject to an enforceable master netting arrangement as at June 30, 2016 and December 31, 2015.
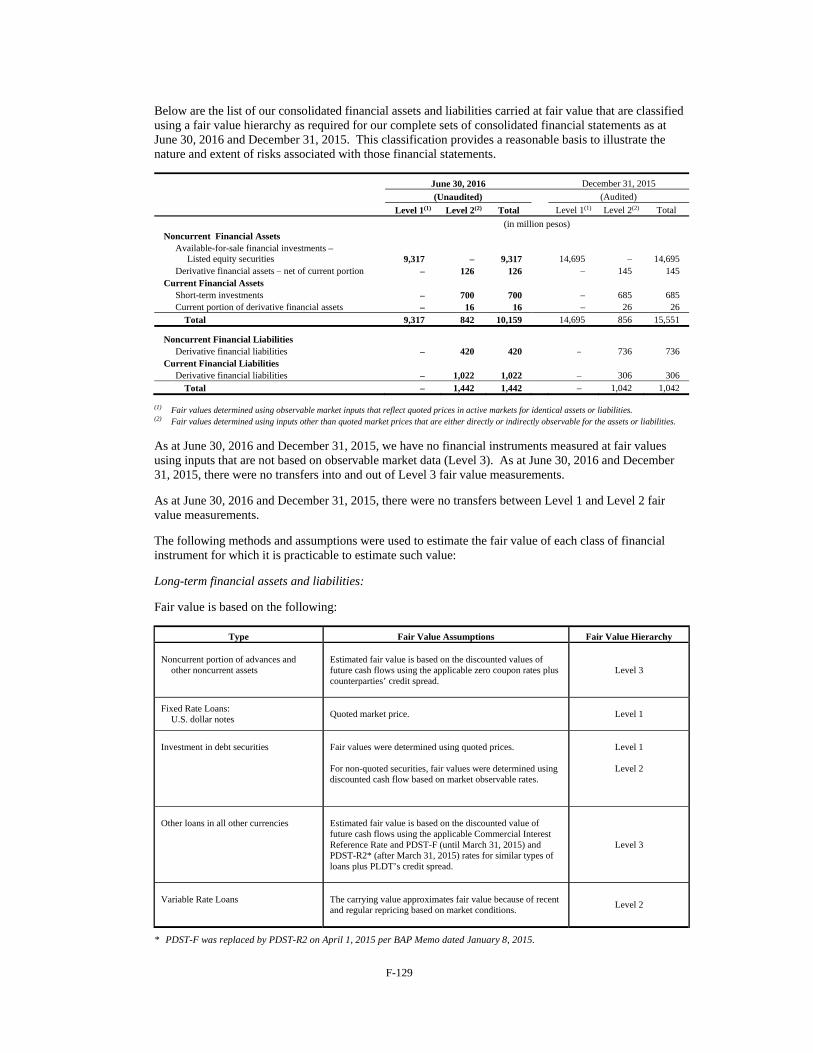
F-129
Below are the list of our consolidated financial assets and liabilities carried at fair value that are classified using a fair value hierarchy as required for our complete sets of consolidated financial statements as at June 30, 2016 and December 31, 2015. This classification provides a reasonable basis to illustrate the nature and extent of risks associated with those financial statements.
June 30, 2016 December 31, 2015
(Unaudited) (Audited)
Level 1(1) Level 2(2) Total Level 1(1) Level 2(2) Total
(in million pesos) Noncurrent Financial Assets
Available-for-sale financial investments – Listed equity securities 9,317 – 9,317 14,695 – 14,695
Derivative financial assets – net of current portion – 126 126 – 145 145Current Financial Assets
Short-term investments – 700 700 – 685 685Current portion of derivative financial assets – 16 16 – 26 26
Total 9,317 842 10,159 14,695 856 15,551
Noncurrent Financial Liabilities Derivative financial liabilities – 420 420 – 736 736
Current Financial Liabilities Derivative financial liabilities – 1,022 1,022 – 306 306
Total – 1,442 1,442 – 1,042 1,042
(1) Fair values determined using observable market inputs that reflect quoted prices in active markets for identical assets or liabilities. (2) Fair values determined using inputs other than quoted market prices that are either directly or indirectly observable for the assets or liabilities.
As at June 30, 2016 and December 31, 2015, we have no financial instruments measured at fair values using inputs that are not based on observable market data (Level 3). As at June 30, 2016 and December 31, 2015, there were no transfers into and out of Level 3 fair value measurements.
As at June 30, 2016 and December 31, 2015, there were no transfers between Level 1 and Level 2 fair value measurements.
The following methods and assumptions were used to estimate the fair value of each class of financial instrument for which it is practicable to estimate such value:
Long-term financial assets and liabilities:
Fair value is based on the following:
Type Fair Value Assumptions Fair Value Hierarchy Noncurrent portion of advances and
other noncurrent assets
Estimated fair value is based on the discounted values of future cash flows using the applicable zero coupon rates plus counterparties’ credit spread.
Level 3
Fixed Rate Loans: U.S. dollar notes
Quoted market price.
Level 1
Investment in debt securities
Fair values were determined using quoted prices. For non-quoted securities, fair values were determined using discounted cash flow based on market observable rates.
Level 1
Level 2
Other loans in all other currencies
Estimated fair value is based on the discounted value of future cash flows using the applicable Commercial Interest Reference Rate and PDST-F (until March 31, 2015) and PDST-R2* (after March 31, 2015) rates for similar types of loans plus PLDT’s credit spread.
Level 3
Variable Rate Loans
The carrying value approximates fair value because of recent and regular repricing based on market conditions.
Level 2
* PDST-F was replaced by PDST-R2 on April 1, 2015 per BAP Memo dated January 8, 2015.
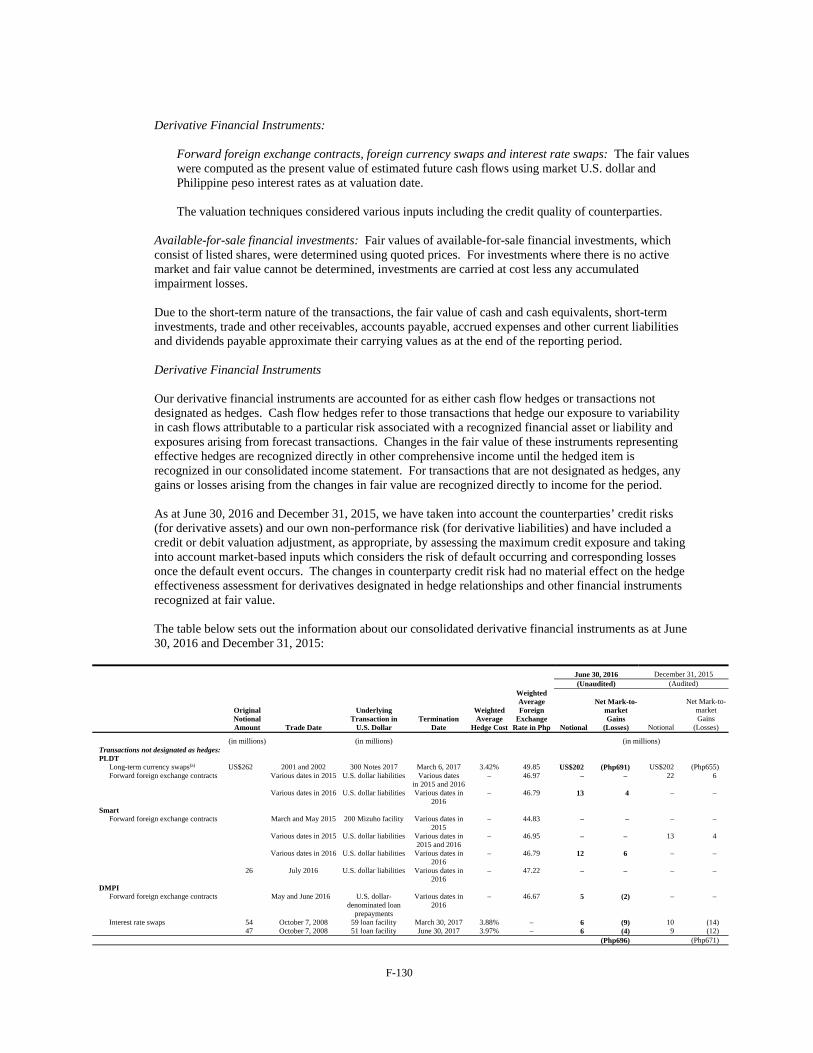
F-130
Derivative Financial Instruments:
Forward foreign exchange contracts, foreign currency swaps and interest rate swaps: The fair values were computed as the present value of estimated future cash flows using market U.S. dollar and Philippine peso interest rates as at valuation date.
The valuation techniques considered various inputs including the credit quality of counterparties.
Available-for-sale financial investments: Fair values of available-for-sale financial investments, which consist of listed shares, were determined using quoted prices. For investments where there is no active market and fair value cannot be determined, investments are carried at cost less any accumulated impairment losses.
Due to the short-term nature of the transactions, the fair value of cash and cash equivalents, short-term investments, trade and other receivables, accounts payable, accrued expenses and other current liabilities and dividends payable approximate their carrying values as at the end of the reporting period.
Derivative Financial Instruments
Our derivative financial instruments are accounted for as either cash flow hedges or transactions not designated as hedges. Cash flow hedges refer to those transactions that hedge our exposure to variability in cash flows attributable to a particular risk associated with a recognized financial asset or liability and exposures arising from forecast transactions. Changes in the fair value of these instruments representing effective hedges are recognized directly in other comprehensive income until the hedged item is recognized in our consolidated income statement. For transactions that are not designated as hedges, any gains or losses arising from the changes in fair value are recognized directly to income for the period. As at June 30, 2016 and December 31, 2015, we have taken into account the counterparties’ credit risks (for derivative assets) and our own non-performance risk (for derivative liabilities) and have included a credit or debit valuation adjustment, as appropriate, by assessing the maximum credit exposure and taking into account market-based inputs which considers the risk of default occurring and corresponding losses once the default event occurs. The changes in counterparty credit risk had no material effect on the hedge effectiveness assessment for derivatives designated in hedge relationships and other financial instruments recognized at fair value. The table below sets out the information about our consolidated derivative financial instruments as at June 30, 2016 and December 31, 2015:
June 30, 2016 December 31, 2015 (Unaudited) (Audited)
Original Notional Amount Trade Date
Underlying Transaction in
U.S. Dollar Termination
Date
Weighted Average
Hedge Cost
Weighted Average Foreign
Exchange Rate in Php Notional
Net Mark-to-
market Gains
(Losses) Notional
Net Mark-to-
market Gains
(Losses)
(in millions) (in millions) (in millions) Transactions not designated as hedges: PLDT
Long-term currency swaps(a) US$262 2001 and 2002 300 Notes 2017 March 6, 2017 3.42% 49.85 US$202 (Php691) US$202 (Php655)Forward foreign exchange contracts Various dates in 2015 U.S. dollar liabilities Various dates
in 2015 and 2016 – 46.97 – – 22 6
Various dates in 2016 U.S. dollar liabilities Various dates in 2016
– 46.79 13 4 – –
Smart Forward foreign exchange contracts March and May 2015 200 Mizuho facility Various dates in
2015 – 44.83 – – – –
Various dates in 2015 U.S. dollar liabilities Various dates in 2015 and 2016
– 46.95 – – 13 4
Various dates in 2016 U.S. dollar liabilities Various dates in 2016
– 46.79 12 6 – –
26 July 2016 U.S. dollar liabilities Various dates in 2016
– 47.22 – – – –
DMPI Forward foreign exchange contracts May and June 2016 U.S. dollar-
denominated loan prepayments
Various dates in 2016
– 46.67 5 (2) – –
Interest rate swaps 54 October 7, 2008 59 loan facility March 30, 2017 3.88% – 6 (9) 10 (14) 47 October 7, 2008 51 loan facility June 30, 2017 3.97% – 6 (4) 9 (12) (Php696) (Php671)
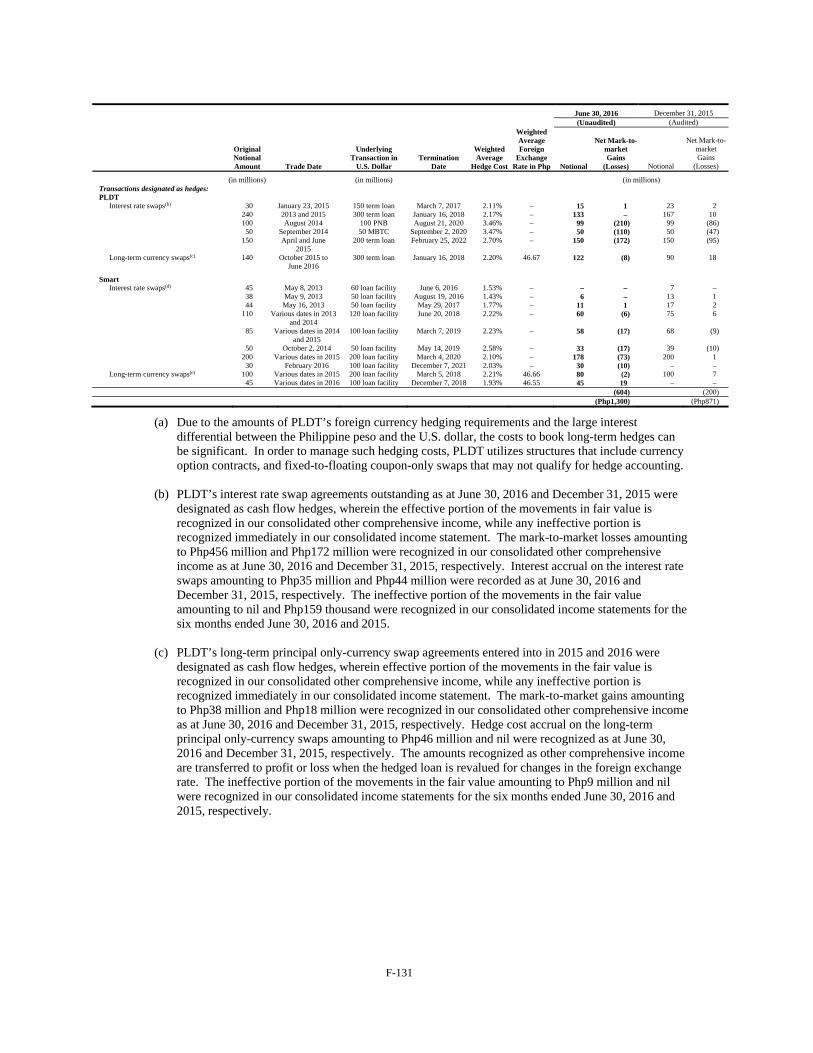
F-131
June 30, 2016 December 31, 2015 (Unaudited) (Audited)
Original Notional Amount Trade Date
Underlying Transaction in
U.S. Dollar Termination
Date
Weighted Average
Hedge Cost
Weighted Average Foreign
Exchange Rate in Php Notional
Net Mark-to-
market Gains
(Losses) Notional
Net Mark-to-
market Gains
(Losses)
(in millions) (in millions) (in millions) Transactions designated as hedges: PLDT
Interest rate swaps(b) 30 January 23, 2015 150 term loan March 7, 2017 2.11% – 15 1 23 2 240 2013 and 2015 300 term loan January 16, 2018 2.17% – 133 – 167 10 100 August 2014 100 PNB August 21, 2020 3.46% – 99 (210) 99 (86) 50 September 2014 50 MBTC September 2, 2020 3.47% – 50 (110) 50 (47) 150 April and June
2015 200 term loan February 25, 2022 2.70% – 150 (172) 150 (95)
Long-term currency swaps(c) 140 October 2015 to June 2016
300 term loan January 16, 2018 2.20% 46.67 122 (8) 90 18
Smart Interest rate swaps(d) 45 May 8, 2013 60 loan facility June 6, 2016 1.53% – – – 7 – 38 May 9, 2013 50 loan facility August 19, 2016 1.43% – 6 – 13 1 44 May 16, 2013 50 loan facility May 29, 2017 1.77% – 11 1 17 2 110 Various dates in 2013
and 2014 120 loan facility June 20, 2018 2.22% – 60 (6) 75 6
85 Various dates in 2014 and 2015
100 loan facility March 7, 2019 2.23% – 58 (17) 68 (9)
50 October 2, 2014 50 loan facility May 14, 2019 2.58% – 33 (17) 39 (10) 200 Various dates in 2015 200 loan facility March 4, 2020 2.10% – 178 (73) 200 1 30 February 2016 100 loan facility December 7, 2021 2.03% – 30 (10) – – Long-term currency swaps(e) 100 Various dates in 2015 200 loan facility March 5, 2018 2.21% 46.66 80 (2) 100 7 45 Various dates in 2016 100 loan facility December 7, 2018 1.93% 46.55 45 19 – – (604) (200) (Php1,300) (Php871)
(a) Due to the amounts of PLDT’s foreign currency hedging requirements and the large interest differential between the Philippine peso and the U.S. dollar, the costs to book long-term hedges can be significant. In order to manage such hedging costs, PLDT utilizes structures that include currency option contracts, and fixed-to-floating coupon-only swaps that may not qualify for hedge accounting.
(b) PLDT’s interest rate swap agreements outstanding as at June 30, 2016 and December 31, 2015 were
designated as cash flow hedges, wherein the effective portion of the movements in fair value is recognized in our consolidated other comprehensive income, while any ineffective portion is recognized immediately in our consolidated income statement. The mark-to-market losses amounting to Php456 million and Php172 million were recognized in our consolidated other comprehensive income as at June 30, 2016 and December 31, 2015, respectively. Interest accrual on the interest rate swaps amounting to Php35 million and Php44 million were recorded as at June 30, 2016 and December 31, 2015, respectively. The ineffective portion of the movements in the fair value amounting to nil and Php159 thousand were recognized in our consolidated income statements for the six months ended June 30, 2016 and 2015.
(c) PLDT’s long-term principal only-currency swap agreements entered into in 2015 and 2016 were
designated as cash flow hedges, wherein effective portion of the movements in the fair value is recognized in our consolidated other comprehensive income, while any ineffective portion is recognized immediately in our consolidated income statement. The mark-to-market gains amounting to Php38 million and Php18 million were recognized in our consolidated other comprehensive income as at June 30, 2016 and December 31, 2015, respectively. Hedge cost accrual on the long-term principal only-currency swaps amounting to Php46 million and nil were recognized as at June 30, 2016 and December 31, 2015, respectively. The amounts recognized as other comprehensive income are transferred to profit or loss when the hedged loan is revalued for changes in the foreign exchange rate. The ineffective portion of the movements in the fair value amounting to Php9 million and nil were recognized in our consolidated income statements for the six months ended June 30, 2016 and 2015, respectively.
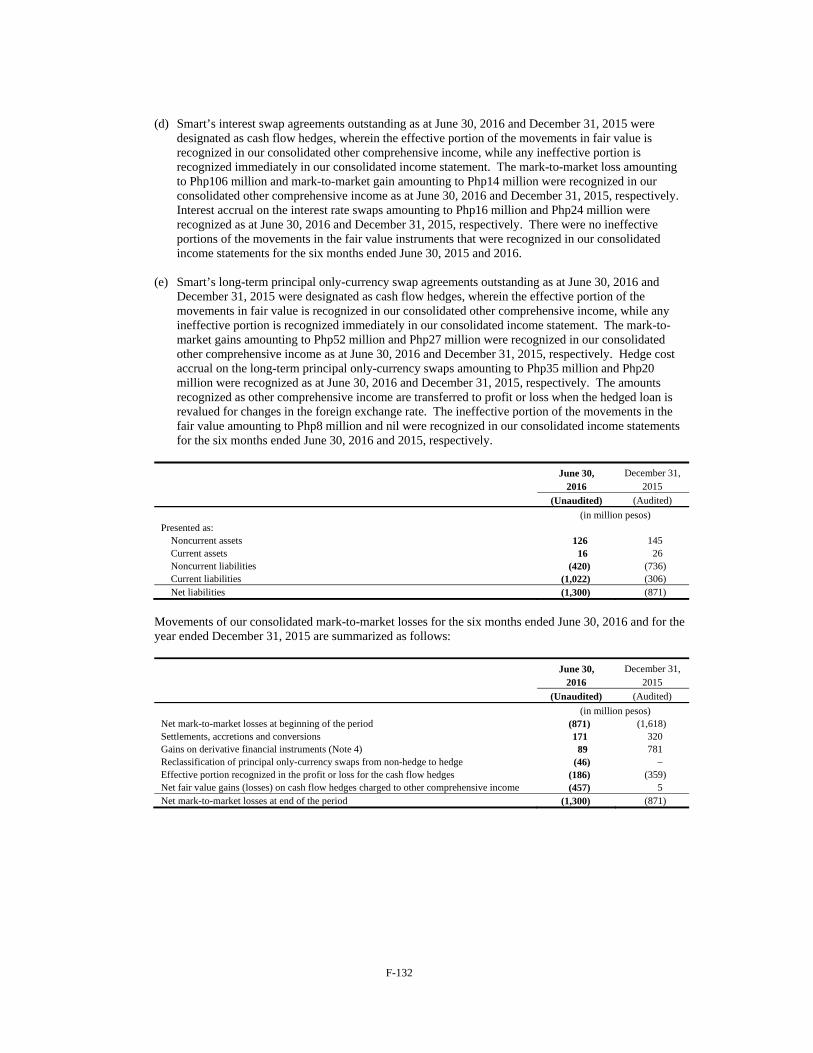
F-132
(d) Smart’s interest swap agreements outstanding as at June 30, 2016 and December 31, 2015 were
designated as cash flow hedges, wherein the effective portion of the movements in fair value is recognized in our consolidated other comprehensive income, while any ineffective portion is recognized immediately in our consolidated income statement. The mark-to-market loss amounting to Php106 million and mark-to-market gain amounting to Php14 million were recognized in our consolidated other comprehensive income as at June 30, 2016 and December 31, 2015, respectively. Interest accrual on the interest rate swaps amounting to Php16 million and Php24 million were recognized as at June 30, 2016 and December 31, 2015, respectively. There were no ineffective portions of the movements in the fair value instruments that were recognized in our consolidated income statements for the six months ended June 30, 2015 and 2016.
(e) Smart’s long-term principal only-currency swap agreements outstanding as at June 30, 2016 and
December 31, 2015 were designated as cash flow hedges, wherein the effective portion of the movements in fair value is recognized in our consolidated other comprehensive income, while any ineffective portion is recognized immediately in our consolidated income statement. The mark-to-market gains amounting to Php52 million and Php27 million were recognized in our consolidated other comprehensive income as at June 30, 2016 and December 31, 2015, respectively. Hedge cost accrual on the long-term principal only-currency swaps amounting to Php35 million and Php20 million were recognized as at June 30, 2016 and December 31, 2015, respectively. The amounts recognized as other comprehensive income are transferred to profit or loss when the hedged loan is revalued for changes in the foreign exchange rate. The ineffective portion of the movements in the fair value amounting to Php8 million and nil were recognized in our consolidated income statements for the six months ended June 30, 2016 and 2015, respectively.
June 30, December 31, 2016 2015
(Unaudited) (Audited)
(in million pesos) Presented as:
Noncurrent assets 126 145 Current assets 16 26 Noncurrent liabilities (420) (736) Current liabilities (1,022) (306) Net liabilities (1,300) (871)
Movements of our consolidated mark-to-market losses for the six months ended June 30, 2016 and for the year ended December 31, 2015 are summarized as follows:
June 30, December 31, 2016 2015
(Unaudited) (Audited)
(in million pesos) Net mark-to-market losses at beginning of the period (871) (1,618) Settlements, accretions and conversions 171 320 Gains on derivative financial instruments (Note 4) 89 781 Reclassification of principal only-currency swaps from non-hedge to hedge (46) – Effective portion recognized in the profit or loss for the cash flow hedges (186) (359) Net fair value gains (losses) on cash flow hedges charged to other comprehensive income (457) 5 Net mark-to-market losses at end of the period (1,300) (871)
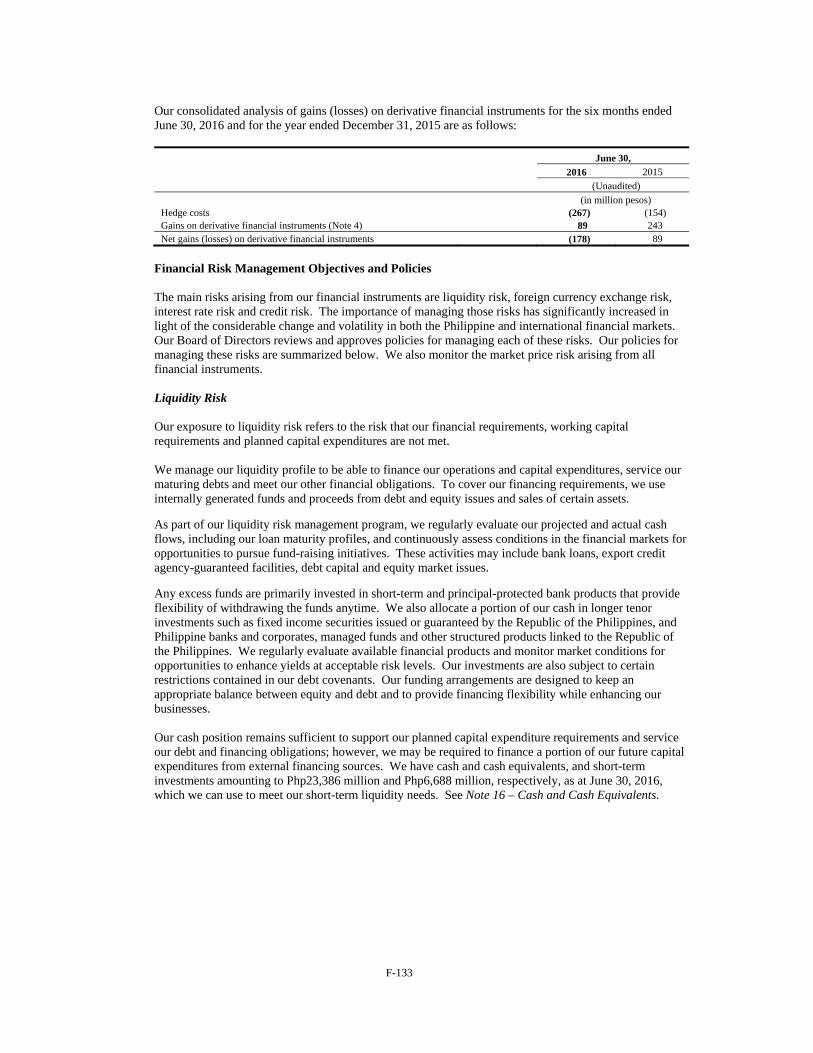
F-133
Our consolidated analysis of gains (losses) on derivative financial instruments for the six months ended June 30, 2016 and for the year ended December 31, 2015 are as follows:
June 30,
2016 2015
(Unaudited)
(in million pesos) Hedge costs (267) (154) Gains on derivative financial instruments (Note 4) 89 243 Net gains (losses) on derivative financial instruments (178) 89
Financial Risk Management Objectives and Policies
The main risks arising from our financial instruments are liquidity risk, foreign currency exchange risk, interest rate risk and credit risk. The importance of managing those risks has significantly increased in light of the considerable change and volatility in both the Philippine and international financial markets. Our Board of Directors reviews and approves policies for managing each of these risks. Our policies for managing these risks are summarized below. We also monitor the market price risk arising from all financial instruments.
Liquidity Risk
Our exposure to liquidity risk refers to the risk that our financial requirements, working capital requirements and planned capital expenditures are not met.
We manage our liquidity profile to be able to finance our operations and capital expenditures, service our maturing debts and meet our other financial obligations. To cover our financing requirements, we use internally generated funds and proceeds from debt and equity issues and sales of certain assets.
As part of our liquidity risk management program, we regularly evaluate our projected and actual cash flows, including our loan maturity profiles, and continuously assess conditions in the financial markets for opportunities to pursue fund-raising initiatives. These activities may include bank loans, export credit agency-guaranteed facilities, debt capital and equity market issues.
Any excess funds are primarily invested in short-term and principal-protected bank products that provide flexibility of withdrawing the funds anytime. We also allocate a portion of our cash in longer tenor investments such as fixed income securities issued or guaranteed by the Republic of the Philippines, and Philippine banks and corporates, managed funds and other structured products linked to the Republic of the Philippines. We regularly evaluate available financial products and monitor market conditions for opportunities to enhance yields at acceptable risk levels. Our investments are also subject to certain restrictions contained in our debt covenants. Our funding arrangements are designed to keep an appropriate balance between equity and debt and to provide financing flexibility while enhancing our businesses.
Our cash position remains sufficient to support our planned capital expenditure requirements and service our debt and financing obligations; however, we may be required to finance a portion of our future capital expenditures from external financing sources. We have cash and cash equivalents, and short-term investments amounting to Php23,386 million and Php6,688 million, respectively, as at June 30, 2016, which we can use to meet our short-term liquidity needs. See Note 16 – Cash and Cash Equivalents.
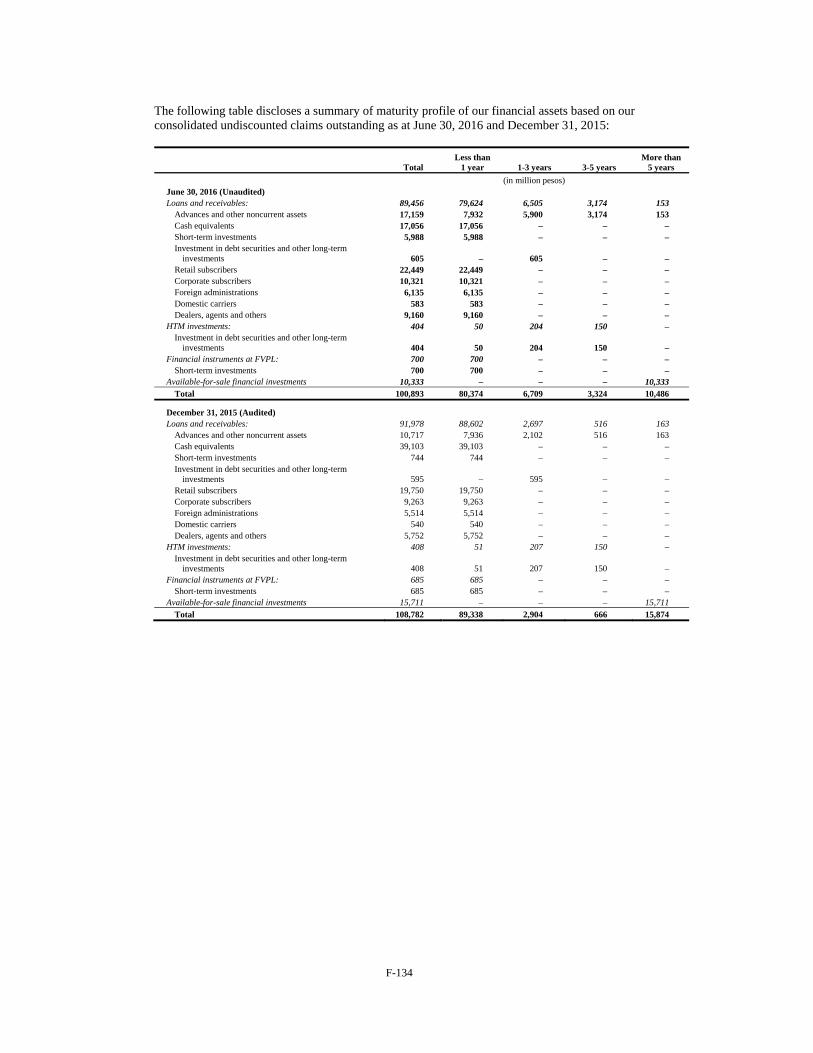
F-134
The following table discloses a summary of maturity profile of our financial assets based on our consolidated undiscounted claims outstanding as at June 30, 2016 and December 31, 2015:
Total Less than
1 year 1-3 years 3-5 years More than
5 years
(in million pesos) June 30, 2016 (Unaudited) Loans and receivables: 89,456 79,624 6,505 3,174 153
Advances and other noncurrent assets 17,159 7,932 5,900 3,174 153 Cash equivalents 17,056 17,056 – – – Short-term investments 5,988 5,988 – – – Investment in debt securities and other long-term
investments 605 – 605 – – Retail subscribers 22,449 22,449 – – – Corporate subscribers 10,321 10,321 – – – Foreign administrations 6,135 6,135 – – – Domestic carriers 583 583 – – – Dealers, agents and others 9,160 9,160 – – –
HTM investments: 404 50 204 150 – Investment in debt securities and other long-term
investments 404 50 204 150 – Financial instruments at FVPL: 700 700 – – –
Short-term investments 700 700 – – – Available-for-sale financial investments 10,333 – – – 10,333
Total 100,893 80,374 6,709 3,324 10,486
December 31, 2015 (Audited) Loans and receivables: 91,978 88,602 2,697 516 163
Advances and other noncurrent assets 10,717 7,936 2,102 516 163 Cash equivalents 39,103 39,103 – – – Short-term investments 744 744 – – – Investment in debt securities and other long-term
investments 595 – 595 – – Retail subscribers 19,750 19,750 – – – Corporate subscribers 9,263 9,263 – – – Foreign administrations 5,514 5,514 – – – Domestic carriers 540 540 – – – Dealers, agents and others 5,752 5,752 – – –
HTM investments: 408 51 207 150 – Investment in debt securities and other long-term
investments 408 51 207 150 – Financial instruments at FVPL: 685 685 – – –
Short-term investments 685 685 – – – Available-for-sale financial investments 15,711 – – – 15,711
Total 108,782 89,338 2,904 666 15,874
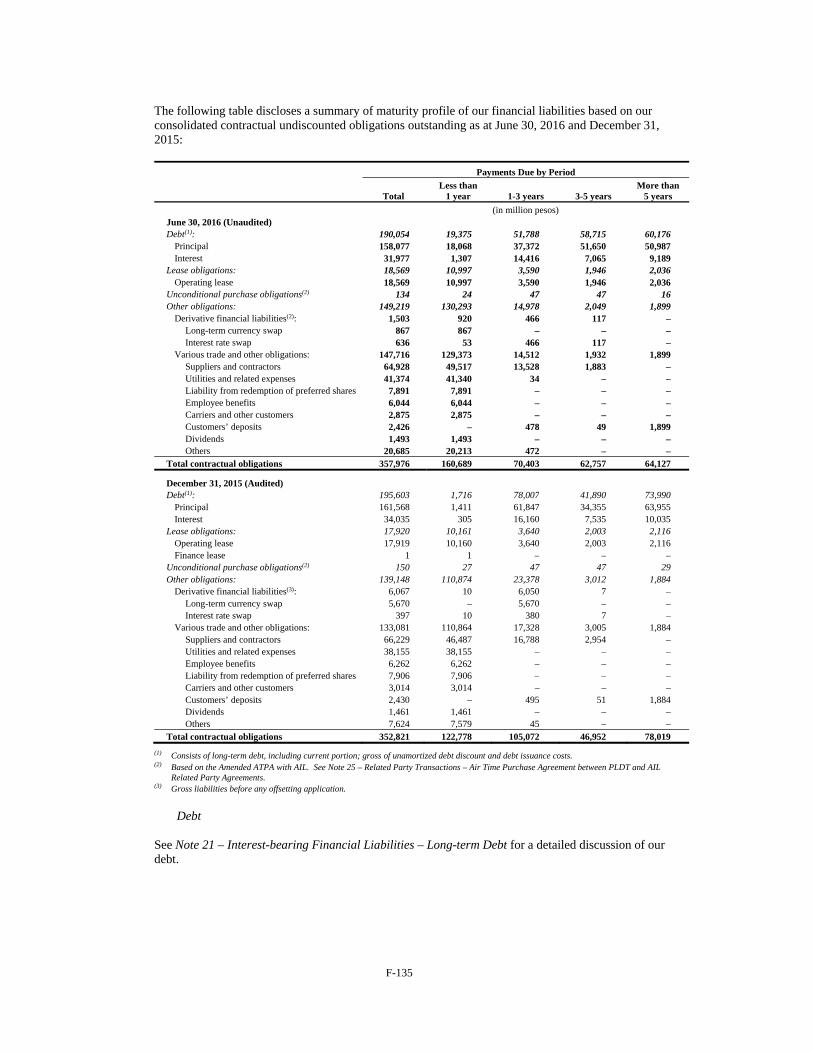
F-135
The following table discloses a summary of maturity profile of our financial liabilities based on our consolidated contractual undiscounted obligations outstanding as at June 30, 2016 and December 31, 2015:
Payments Due by Period
Total Less than
1 year 1-3 years 3-5 years More than
5 years
(in million pesos) June 30, 2016 (Unaudited) Debt(1): 190,054 19,375 51,788 58,715 60,176
Principal 158,077 18,068 37,372 51,650 50,987 Interest 31,977 1,307 14,416 7,065 9,189
Lease obligations: 18,569 10,997 3,590 1,946 2,036 Operating lease 18,569 10,997 3,590 1,946 2,036
Unconditional purchase obligations(2) 134 24 47 47 16 Other obligations: 149,219 130,293 14,978 2,049 1,899
Derivative financial liabilities(2): 1,503 920 466 117 – Long-term currency swap 867 867 – – – Interest rate swap 636 53 466 117 –
Various trade and other obligations: 147,716 129,373 14,512 1,932 1,899Suppliers and contractors 64,928 49,517 13,528 1,883 – Utilities and related expenses 41,374 41,340 34 – –Liability from redemption of preferred shares 7,891 7,891 – – – Employee benefits 6,044 6,044 – – –Carriers and other customers 2,875 2,875 – – – Customers’ deposits 2,426 – 478 49 1,899 Dividends 1,493 1,493 – – – Others 20,685 20,213 472 – –
Total contractual obligations 357,976 160,689 70,403 62,757 64,127
December 31, 2015 (Audited) Debt(1): 195,603 1,716 78,007 41,890 73,990
Principal 161,568 1,411 61,847 34,355 63,955 Interest 34,035 305 16,160 7,535 10,035
Lease obligations: 17,920 10,161 3,640 2,003 2,116 Operating lease 17,919 10,160 3,640 2,003 2,116Finance lease 1 1 – – –
Unconditional purchase obligations(2) 150 27 47 47 29 Other obligations: 139,148 110,874 23,378 3,012 1,884
Derivative financial liabilities(3): 6,067 10 6,050 7 – Long-term currency swap 5,670 – 5,670 – –Interest rate swap 397 10 380 7 –
Various trade and other obligations: 133,081 110,864 17,328 3,005 1,884 Suppliers and contractors 66,229 46,487 16,788 2,954 – Utilities and related expenses 38,155 38,155 – – – Employee benefits 6,262 6,262 – – – Liability from redemption of preferred shares 7,906 7,906 – – –Carriers and other customers 3,014 3,014 – – – Customers’ deposits 2,430 – 495 51 1,884Dividends 1,461 1,461 – – – Others 7,624 7,579 45 – –
Total contractual obligations 352,821 122,778 105,072 46,952 78,019
(1) Consists of long-term debt, including current portion; gross of unamortized debt discount and debt issuance costs. (2) Based on the Amended ATPA with AIL. See Note 25 – Related Party Transactions – Air Time Purchase Agreement between PLDT and AIL
Related Party Agreements. (3) Gross liabilities before any offsetting application.
Debt
See Note 21 – Interest-bearing Financial Liabilities – Long-term Debt for a detailed discussion of our debt.
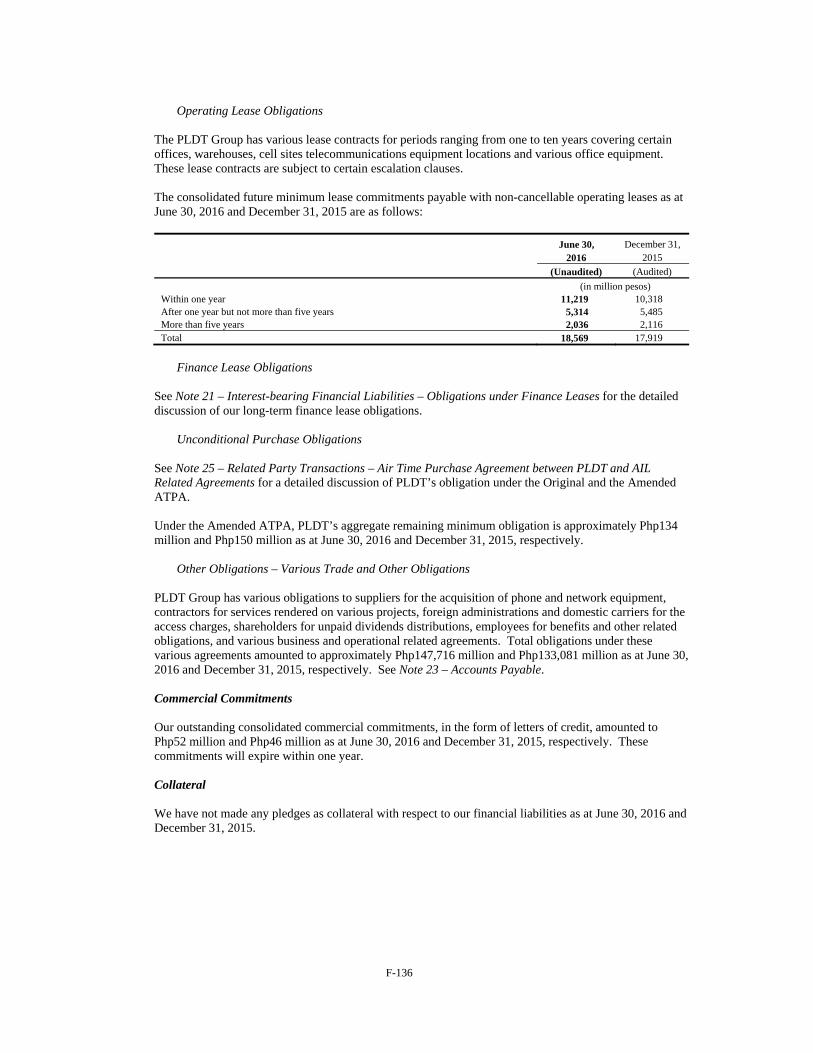
F-136
Operating Lease Obligations
The PLDT Group has various lease contracts for periods ranging from one to ten years covering certain offices, warehouses, cell sites telecommunications equipment locations and various office equipment. These lease contracts are subject to certain escalation clauses. The consolidated future minimum lease commitments payable with non-cancellable operating leases as at June 30, 2016 and December 31, 2015 are as follows:
June 30, December 31, 2016 2015
(Unaudited) (Audited)
(in million pesos) Within one year 11,219 10,318 After one year but not more than five years 5,314 5,485 More than five years 2,036 2,116 Total 18,569 17,919
Finance Lease Obligations
See Note 21 – Interest-bearing Financial Liabilities – Obligations under Finance Leases for the detailed discussion of our long-term finance lease obligations.
Unconditional Purchase Obligations
See Note 25 – Related Party Transactions – Air Time Purchase Agreement between PLDT and AIL Related Agreements for a detailed discussion of PLDT’s obligation under the Original and the Amended ATPA.
Under the Amended ATPA, PLDT’s aggregate remaining minimum obligation is approximately Php134 million and Php150 million as at June 30, 2016 and December 31, 2015, respectively.
Other Obligations – Various Trade and Other Obligations
PLDT Group has various obligations to suppliers for the acquisition of phone and network equipment, contractors for services rendered on various projects, foreign administrations and domestic carriers for the access charges, shareholders for unpaid dividends distributions, employees for benefits and other related obligations, and various business and operational related agreements. Total obligations under these various agreements amounted to approximately Php147,716 million and Php133,081 million as at June 30, 2016 and December 31, 2015, respectively. See Note 23 – Accounts Payable.
Commercial Commitments
Our outstanding consolidated commercial commitments, in the form of letters of credit, amounted to Php52 million and Php46 million as at June 30, 2016 and December 31, 2015, respectively. These commitments will expire within one year.
Collateral
We have not made any pledges as collateral with respect to our financial liabilities as at June 30, 2016 and December 31, 2015.
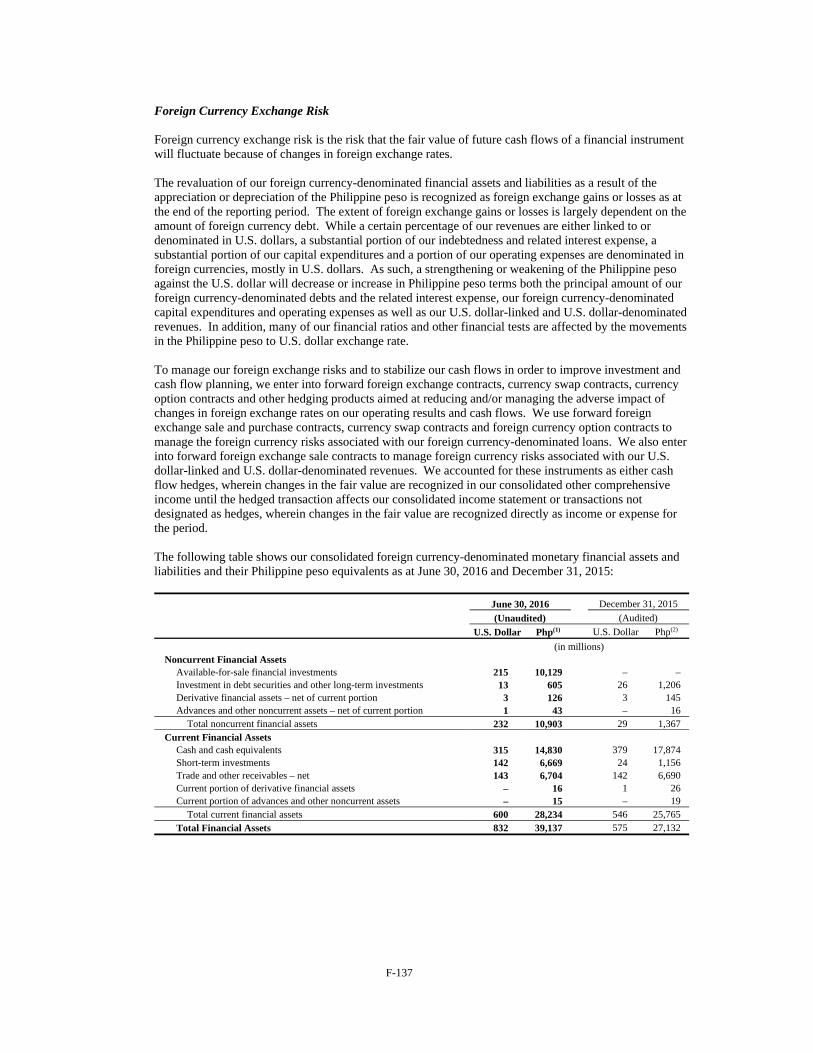
F-137
Foreign Currency Exchange Risk
Foreign currency exchange risk is the risk that the fair value of future cash flows of a financial instrument will fluctuate because of changes in foreign exchange rates.
The revaluation of our foreign currency-denominated financial assets and liabilities as a result of the appreciation or depreciation of the Philippine peso is recognized as foreign exchange gains or losses as at the end of the reporting period. The extent of foreign exchange gains or losses is largely dependent on the amount of foreign currency debt. While a certain percentage of our revenues are either linked to or denominated in U.S. dollars, a substantial portion of our indebtedness and related interest expense, a substantial portion of our capital expenditures and a portion of our operating expenses are denominated in foreign currencies, mostly in U.S. dollars. As such, a strengthening or weakening of the Philippine peso against the U.S. dollar will decrease or increase in Philippine peso terms both the principal amount of our foreign currency-denominated debts and the related interest expense, our foreign currency-denominated capital expenditures and operating expenses as well as our U.S. dollar-linked and U.S. dollar-denominated revenues. In addition, many of our financial ratios and other financial tests are affected by the movements in the Philippine peso to U.S. dollar exchange rate.
To manage our foreign exchange risks and to stabilize our cash flows in order to improve investment and cash flow planning, we enter into forward foreign exchange contracts, currency swap contracts, currency option contracts and other hedging products aimed at reducing and/or managing the adverse impact of changes in foreign exchange rates on our operating results and cash flows. We use forward foreign exchange sale and purchase contracts, currency swap contracts and foreign currency option contracts to manage the foreign currency risks associated with our foreign currency-denominated loans. We also enter into forward foreign exchange sale contracts to manage foreign currency risks associated with our U.S. dollar-linked and U.S. dollar-denominated revenues. We accounted for these instruments as either cash flow hedges, wherein changes in the fair value are recognized in our consolidated other comprehensive income until the hedged transaction affects our consolidated income statement or transactions not designated as hedges, wherein changes in the fair value are recognized directly as income or expense for the period.
The following table shows our consolidated foreign currency-denominated monetary financial assets and liabilities and their Philippine peso equivalents as at June 30, 2016 and December 31, 2015:
June 30, 2016 December 31, 2015
(Unaudited) (Audited)
U.S. Dollar Php(1) U.S. Dollar Php(2)
(in millions) Noncurrent Financial Assets
Available-for-sale financial investments 215 10,129 – – Investment in debt securities and other long-term investments 13 605 26 1,206 Derivative financial assets – net of current portion 3 126 3 145 Advances and other noncurrent assets – net of current portion 1 43 – 16
Total noncurrent financial assets 232 10,903 29 1,367 Current Financial Assets
Cash and cash equivalents 315 14,830 379 17,874 Short-term investments 142 6,669 24 1,156 Trade and other receivables – net 143 6,704 142 6,690 Current portion of derivative financial assets – 16 1 26 Current portion of advances and other noncurrent assets – 15 – 19
Total current financial assets 600 28,234 546 25,765 Total Financial Assets 832 39,137 575 27,132
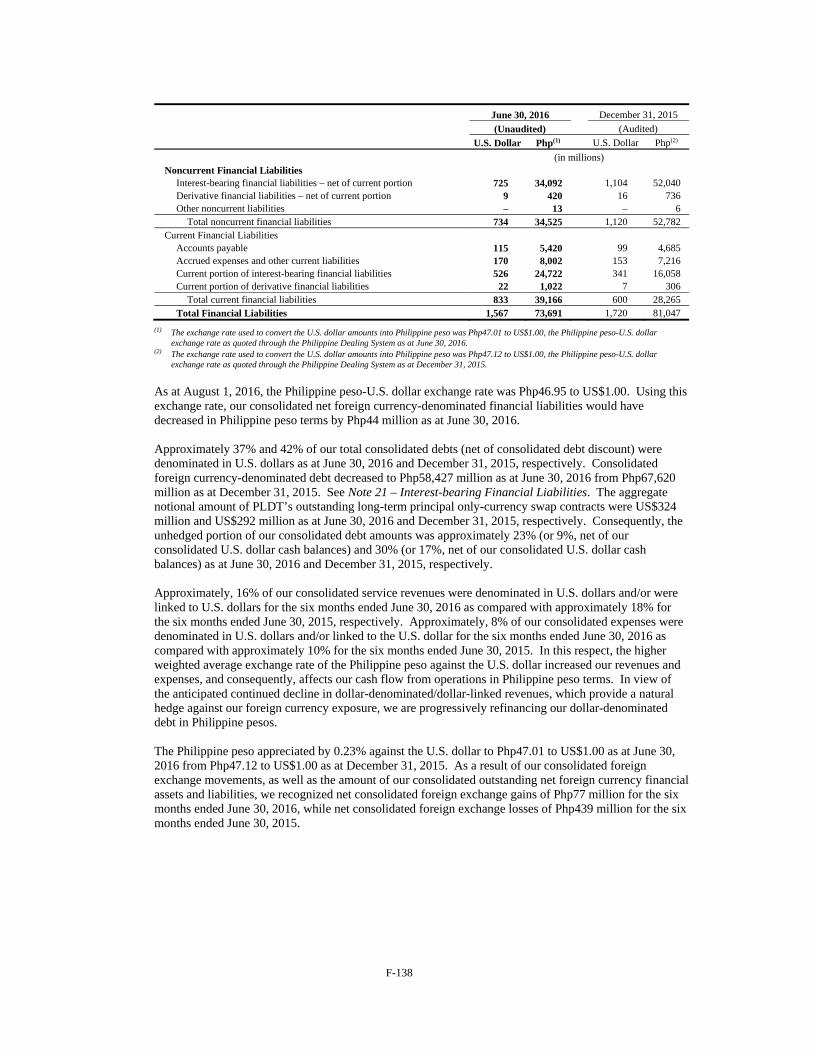
F-138
June 30, 2016 December 31, 2015
(Unaudited) (Audited)
U.S. Dollar Php(1) U.S. Dollar Php(2)
(in millions) Noncurrent Financial Liabilities
Interest-bearing financial liabilities – net of current portion 725 34,092 1,104 52,040 Derivative financial liabilities – net of current portion 9 420 16 736 Other noncurrent liabilities – 13 – 6
Total noncurrent financial liabilities 734 34,525 1,120 52,782 Current Financial Liabilities
Accounts payable 115 5,420 99 4,685 Accrued expenses and other current liabilities 170 8,002 153 7,216 Current portion of interest-bearing financial liabilities 526 24,722 341 16,058 Current portion of derivative financial liabilities 22 1,022 7 306
Total current financial liabilities 833 39,166 600 28,265 Total Financial Liabilities 1,567 73,691 1,720 81,047
(1) The exchange rate used to convert the U.S. dollar amounts into Philippine peso was Php47.01 to US$1.00, the Philippine peso-U.S. dollar
exchange rate as quoted through the Philippine Dealing System as at June 30, 2016. (2) The exchange rate used to convert the U.S. dollar amounts into Philippine peso was Php47.12 to US$1.00, the Philippine peso-U.S. dollar
exchange rate as quoted through the Philippine Dealing System as at December 31, 2015.
As at August 1, 2016, the Philippine peso-U.S. dollar exchange rate was Php46.95 to US$1.00. Using this exchange rate, our consolidated net foreign currency-denominated financial liabilities would have decreased in Philippine peso terms by Php44 million as at June 30, 2016. Approximately 37% and 42% of our total consolidated debts (net of consolidated debt discount) were denominated in U.S. dollars as at June 30, 2016 and December 31, 2015, respectively. Consolidated foreign currency-denominated debt decreased to Php58,427 million as at June 30, 2016 from Php67,620 million as at December 31, 2015. See Note 21 – Interest-bearing Financial Liabilities. The aggregate notional amount of PLDT’s outstanding long-term principal only-currency swap contracts were US$324 million and US$292 million as at June 30, 2016 and December 31, 2015, respectively. Consequently, the unhedged portion of our consolidated debt amounts was approximately 23% (or 9%, net of our consolidated U.S. dollar cash balances) and 30% (or 17%, net of our consolidated U.S. dollar cash balances) as at June 30, 2016 and December 31, 2015, respectively. Approximately, 16% of our consolidated service revenues were denominated in U.S. dollars and/or were linked to U.S. dollars for the six months ended June 30, 2016 as compared with approximately 18% for the six months ended June 30, 2015, respectively. Approximately, 8% of our consolidated expenses were denominated in U.S. dollars and/or linked to the U.S. dollar for the six months ended June 30, 2016 as compared with approximately 10% for the six months ended June 30, 2015. In this respect, the higher weighted average exchange rate of the Philippine peso against the U.S. dollar increased our revenues and expenses, and consequently, affects our cash flow from operations in Philippine peso terms. In view of the anticipated continued decline in dollar-denominated/dollar-linked revenues, which provide a natural hedge against our foreign currency exposure, we are progressively refinancing our dollar-denominated debt in Philippine pesos. The Philippine peso appreciated by 0.23% against the U.S. dollar to Php47.01 to US$1.00 as at June 30, 2016 from Php47.12 to US$1.00 as at December 31, 2015. As a result of our consolidated foreign exchange movements, as well as the amount of our consolidated outstanding net foreign currency financial assets and liabilities, we recognized net consolidated foreign exchange gains of Php77 million for the six months ended June 30, 2016, while net consolidated foreign exchange losses of Php439 million for the six months ended June 30, 2015.
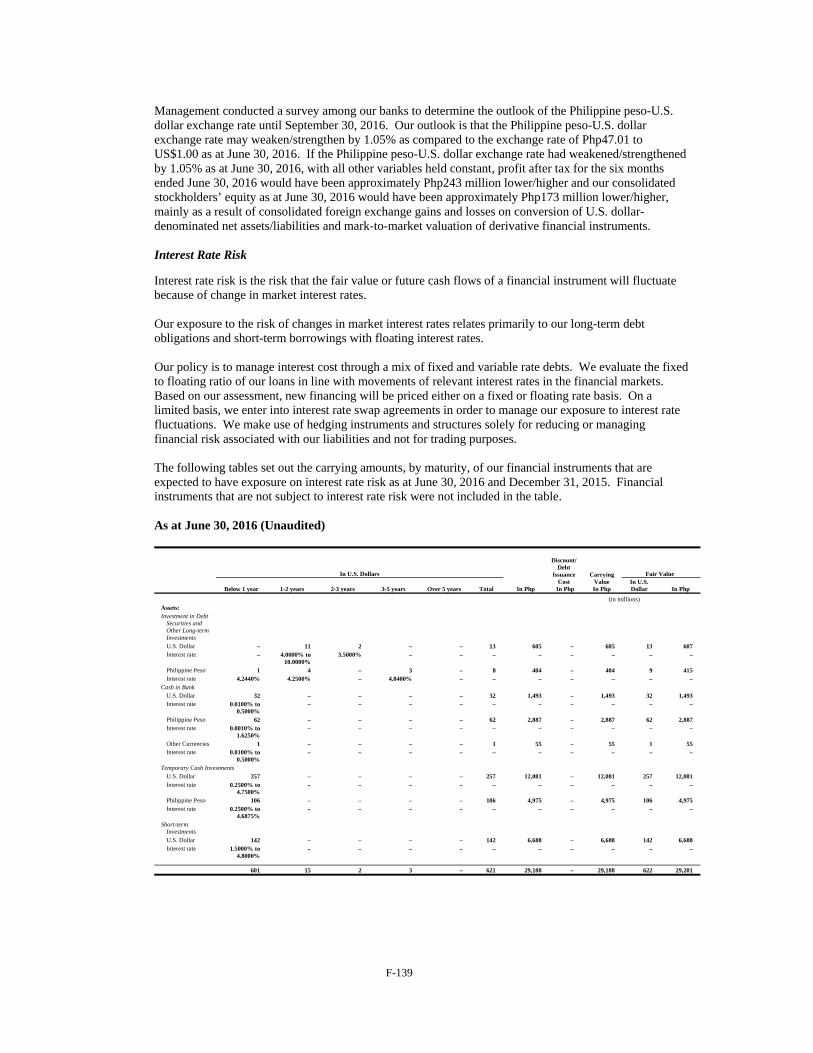
F-139
Management conducted a survey among our banks to determine the outlook of the Philippine peso-U.S. dollar exchange rate until September 30, 2016. Our outlook is that the Philippine peso-U.S. dollar exchange rate may weaken/strengthen by 1.05% as compared to the exchange rate of Php47.01 to US$1.00 as at June 30, 2016. If the Philippine peso-U.S. dollar exchange rate had weakened/strengthened by 1.05% as at June 30, 2016, with all other variables held constant, profit after tax for the six months ended June 30, 2016 would have been approximately Php243 million lower/higher and our consolidated stockholders’ equity as at June 30, 2016 would have been approximately Php173 million lower/higher, mainly as a result of consolidated foreign exchange gains and losses on conversion of U.S. dollar-denominated net assets/liabilities and mark-to-market valuation of derivative financial instruments. Interest Rate Risk
Interest rate risk is the risk that the fair value or future cash flows of a financial instrument will fluctuate because of change in market interest rates. Our exposure to the risk of changes in market interest rates relates primarily to our long-term debt obligations and short-term borrowings with floating interest rates. Our policy is to manage interest cost through a mix of fixed and variable rate debts. We evaluate the fixed to floating ratio of our loans in line with movements of relevant interest rates in the financial markets. Based on our assessment, new financing will be priced either on a fixed or floating rate basis. On a limited basis, we enter into interest rate swap agreements in order to manage our exposure to interest rate fluctuations. We make use of hedging instruments and structures solely for reducing or managing financial risk associated with our liabilities and not for trading purposes. The following tables set out the carrying amounts, by maturity, of our financial instruments that are expected to have exposure on interest rate risk as at June 30, 2016 and December 31, 2015. Financial instruments that are not subject to interest rate risk were not included in the table. As at June 30, 2016 (Unaudited)
In U.S. Dollars
Discount/ Debt
Issuance Cost
In Php
Carrying Value In Php
Fair Value
Below 1 year 1-2 years 2-3 years 3-5 years Over 5 years Total In Php In U.S. Dollar In Php
(in millions) Assets: Investment in Debt
Securities and Other Long-term Investments
U.S. Dollar – 11 2 – – 13 605 – 605 13 607 Interest rate – 4.0000% to
10.0000% 3.5000% – – – – – – – –
Philippine Peso 1 4 – 3 – 8 404 – 404 9 415 Interest rate 4.2440% 4.2500% – 4.8400% – – – – – – –
Cash in Bank U.S. Dollar 32 – – – – 32 1,493 – 1,493 32 1,493 Interest rate 0.0100% to
0.5000% – – – – – – – – – –
Philippine Peso 62 – – – – 62 2,887 – 2,887 62 2,887 Interest rate 0.0010% to
1.6250% – – – – – – – – – –
Other Currencies 1 – – – – 1 55 – 55 1 55 Interest rate 0.0100% to
0.5000% – – – – – – – – – –
Temporary Cash Investments U.S. Dollar 257 – – – – 257 12,081 – 12,081 257 12,081 Interest rate 0.2500% to
4.7500% – – – – – – – – – –
Philippine Peso 106 – – – – 106 4,975 – 4,975 106 4,975 Interest rate 0.2500% to
4.6875% – – – – – – – – – –
Short-term Investments U.S. Dollar 142 – – – – 142 6,688 – 6,688 142 6,688 Interest rate 1.5000% to
4.8000% – – – – – – – – – –
601 15 2 3 – 621 29,188 – 29,188 622 29,201
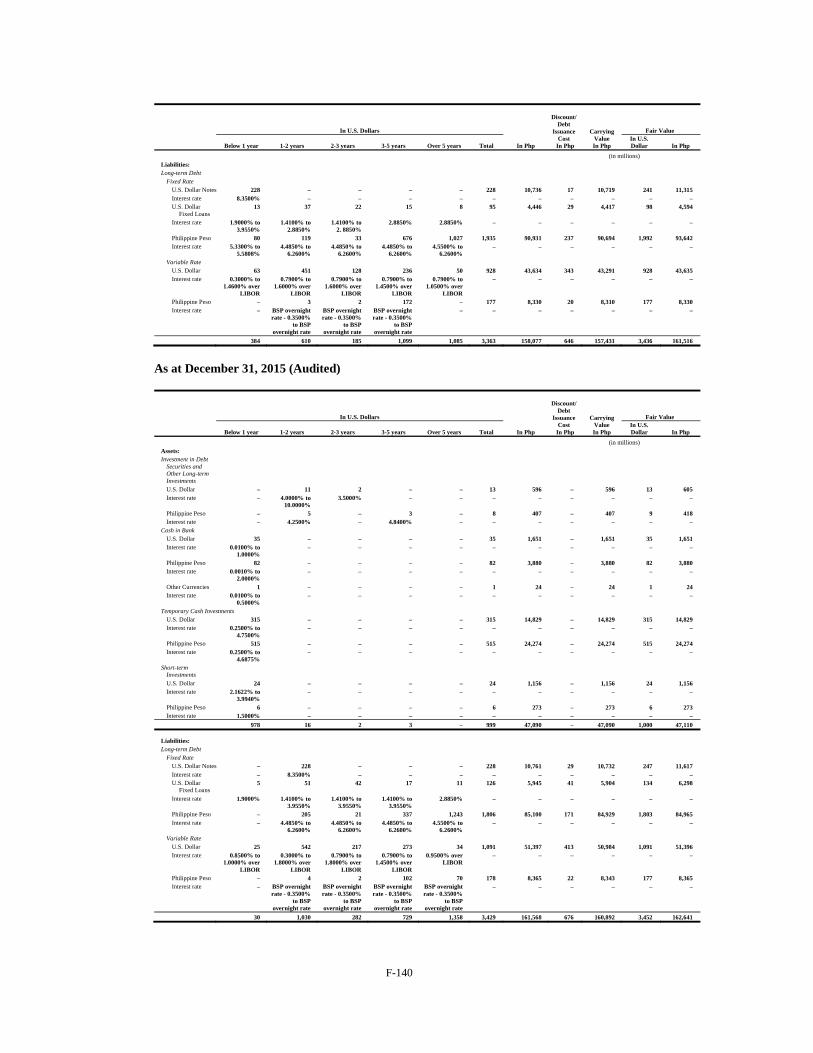
F-140
In U.S. Dollars
Discount/ Debt
Issuance Cost
In Php
Carrying Value In Php
Fair Value
Below 1 year 1-2 years 2-3 years 3-5 years Over 5 years Total In Php In U.S. Dollar In Php
(in millions) Liabilities: Long-term Debt
Fixed Rate U.S. Dollar Notes 228 – – – – 228 10,736 17 10,719 241 11,315 Interest rate 8.3500% – – – – – – – – – – U.S. Dollar
Fixed Loans 13 37 22 15 8 95 4,446 29 4,417 98 4,594
Interest rate 1.9000% to 3.9550%
1.4100% to 2.8850%
1.4100% to 2. 8850%
2.8850% 2.8850% – – – – – –
Philippine Peso 80 119 33 676 1,027 1,935 90,931 237 90,694 1,992 93,642 Interest rate 5.3300% to
5.5808% 4.4850% to
6.2600% 4.4850% to
6.2600% 4.4850% to
6.2600% 4.5500% to
6.2600% – – – – – –
Variable Rate U.S. Dollar 63 451 128 236 50 928 43,634 343 43,291 928 43,635 Interest rate 0.3000% to
1.4600% over LIBOR
0.7900% to 1.6000% over
LIBOR
0.7900% to 1.6000% over
LIBOR
0.7900% to 1.4500% over
LIBOR
0.7900% to 1.0500% over
LIBOR
– – – – – –
Philippine Peso – 3 2 172 – 177 8,330 20 8,310 177 8,330 Interest rate – BSP overnight
rate - 0.3500% to BSP
overnight rate
BSP overnight rate - 0.3500%
to BSP overnight rate
BSP overnight rate - 0.3500%
to BSP overnight rate
– – – – – – –
384 610 185 1,099 1,085 3,363 158,077 646 157,431 3,436 161,516
As at December 31, 2015 (Audited)
In U.S. Dollars
Discount/ Debt
Issuance Cost
In Php
Carrying Value In Php
Fair Value
Below 1 year 1-2 years 2-3 years 3-5 years Over 5 years Total In Php In U.S. Dollar In Php
(in millions) Assets: Investment in Debt
Securities and Other Long-term Investments
U.S. Dollar – 11 2 – – 13 596 – 596 13 605 Interest rate – 4.0000% to
10.0000% 3.5000% – – – – – – – –
Philippine Peso – 5 – 3 – 8 407 – 407 9 418 Interest rate – 4.2500% – 4.8400% – – – – – – –
Cash in Bank U.S. Dollar 35 – – – – 35 1,651 – 1,651 35 1,651 Interest rate 0.0100% to
1.0000% – – – – – – – – – –
Philippine Peso 82 – – – – 82 3,880 – 3,880 82 3,880 Interest rate 0.0010% to
2.0000% – – – – – – – – – –
Other Currencies 1 – – – – 1 24 – 24 1 24 Interest rate 0.0100% to
0.5000% – – – – – – – – – –
Temporary Cash Investments U.S. Dollar 315 – – – – 315 14,829 – 14,829 315 14,829 Interest rate 0.2500% to
4.7500% – – – – – – – – – –
Philippine Peso 515 – – – – 515 24,274 – 24,274 515 24,274 Interest rate 0.2500% to
4.6875% – – – – – – – – – –
Short-term Investments U.S. Dollar 24 – – – – 24 1,156 – 1,156 24 1,156 Interest rate 2.1622% to
3.9940% – – – – – – – – – –
Philippine Peso 6 – – – – 6 273 – 273 6 273 Interest rate 1.5000% – – – – – – – – – –
978 16 2 3 – 999 47,090 – 47,090 1,000 47,110
Liabilities: Long-term Debt
Fixed Rate U.S. Dollar Notes – 228 – – – 228 10,761 29 10,732 247 11,617 Interest rate – 8.3500% – – – – – – – – – U.S. Dollar
Fixed Loans 5 51 42 17 11 126 5,945 41 5,904 134 6,298
Interest rate 1.9000% 1.4100% to 3.9550%
1.4100% to 3.9550%
1.4100% to 3.9550%
2.8850% – – – – – –
Philippine Peso – 205 21 337 1,243 1,806 85,100 171 84,929 1,803 84,965 Interest rate – 4.4850% to
6.2600% 4.4850% to
6.2600% 4.4850% to
6.2600% 4.5500% to
6.2600% – – – – – –
Variable Rate U.S. Dollar 25 542 217 273 34 1,091 51,397 413 50,984 1,091 51,396 Interest rate 0.8500% to
1.0000% over LIBOR
0.3000% to 1.8000% over
LIBOR
0.7900% to 1.8000% over
LIBOR
0.7900% to 1.4500% over
LIBOR
0.9500% over LIBOR
– – – – – –
Philippine Peso – 4 2 102 70 178 8,365 22 8,343 177 8,365 Interest rate – BSP overnight
rate - 0.3500% to BSP
overnight rate
BSP overnight rate - 0.3500%
to BSP overnight rate
BSP overnight rate - 0.3500%
to BSP overnight rate
BSP overnight rate - 0.3500%
to BSP overnight rate
– – – – – –
30 1,030 282 729 1,358 3,429 161,568 676 160,892 3,452 162,641
F-141
Fixed rate financial instruments are subject to fair value interest rate risk while floating rate financial instruments are subject to cash flow interest rate risk. Repricing of floating rate financial instruments is mostly done on intervals of three months or six months. Interest on fixed rate financial instruments is fixed until maturity of the particular instrument. Management conducted a survey among our banks to determine the outlook of the U.S. dollar and Philippine peso interest rates until September 30, 2016. Our outlook is that the U.S. dollar and Philippine peso interest rates may move 5 basis points, or bps, and 50 bps higher/lower, respectively, as compared to levels as at June 30, 2016. If U.S. dollar interest rates had been 5 bps higher/lower as compared to market levels as at June 30, 2016, with all other variables held constant, profit after tax for the six months ended June 30, 2016 and our consolidated stockholders’ equity as at June 30, 2016 would have been approximately Php5 million and Php21 million, respectively, lower/higher, mainly as a result of higher/lower interest expense on floating rate borrowings and loss/gain on derivative transactions. If Philippine peso interest rates had been 50 bps higher/lower as compared to market levels as at June 30, 2016, with all other variables held constant, profit after tax for the six months ended June 30, 2016 and our consolidated stockholders’ equity as at June 30, 2016 would have been approximately Php23 million and Php38 million, respectively, lower/higher, mainly as a result of higher/lower interest expense on floating rate borrowings and loss/gain on derivative transactions. Credit Risk Credit risk is the risk that we will incur a loss arising from our customers, clients or counterparties that fail to discharge their contracted obligations. We manage and control credit risk by setting limits on the amount of risk we are willing to accept for individual counterparties and by monitoring exposures in relation to such limits. We trade only with recognized and creditworthy third parties. It is our policy that all customers who wish to trade on credit terms are subject to credit verification procedures. In addition, receivable balances are monitored on an on-going basis to reduce our exposure to bad debts. We established a credit quality review process to provide regular identification of changes in the creditworthiness of counterparties. Counterparty limits are established and reviewed periodically based on latest available financial data on our counterparties’ credit ratings, capitalization, asset quality and liquidity. Our credit quality review process allows us to assess the potential loss as a result of the risks to which we are exposed and allow us to take corrective actions.
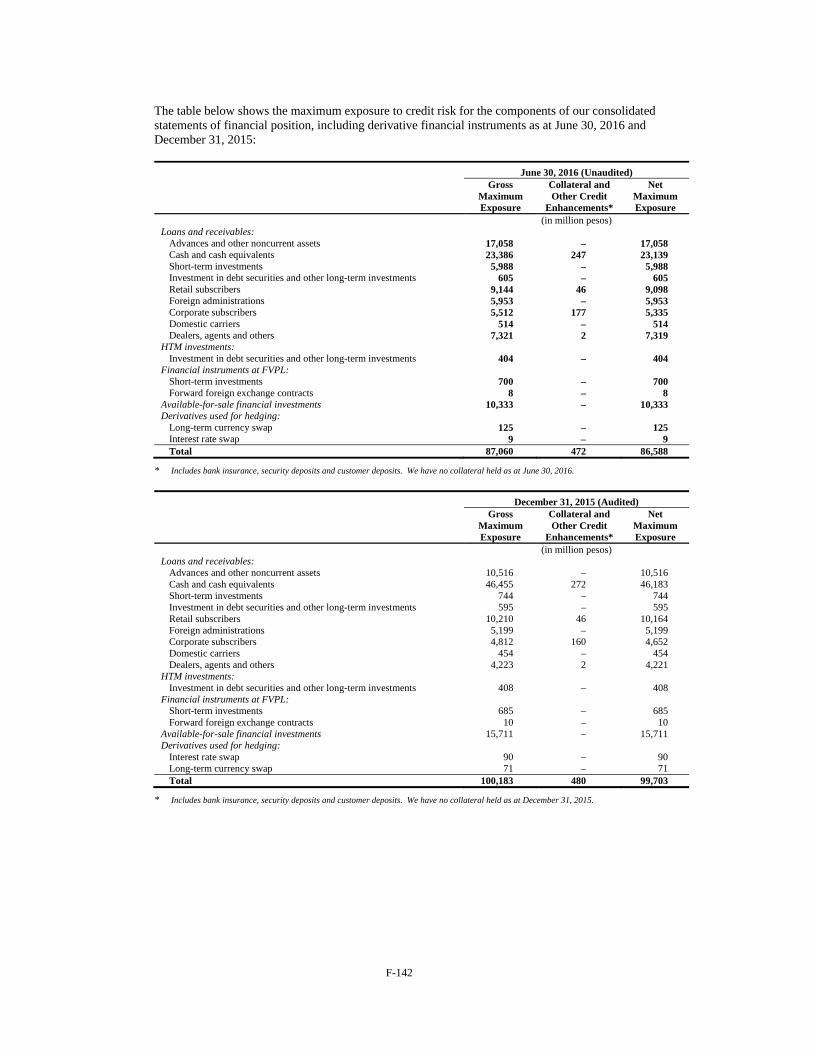
F-142
The table below shows the maximum exposure to credit risk for the components of our consolidated statements of financial position, including derivative financial instruments as at June 30, 2016 and December 31, 2015:
June 30, 2016 (Unaudited) Gross
Maximum Exposure
Collateral and Other Credit
Enhancements*
Net Maximum Exposure
(in million pesos) Loans and receivables:
Advances and other noncurrent assets 17,058 – 17,058 Cash and cash equivalents 23,386 247 23,139 Short-term investments 5,988 – 5,988 Investment in debt securities and other long-term investments 605 – 605 Retail subscribers 9,144 46 9,098 Foreign administrations 5,953 – 5,953 Corporate subscribers 5,512 177 5,335 Domestic carriers 514 – 514 Dealers, agents and others 7,321 2 7,319
HTM investments: Investment in debt securities and other long-term investments 404 – 404
Financial instruments at FVPL: Short-term investments 700 – 700 Forward foreign exchange contracts 8 – 8
Available-for-sale financial investments 10,333 – 10,333 Derivatives used for hedging:
Long-term currency swap 125 – 125 Interest rate swap 9 – 9 Total 87,060 472 86,588
* Includes bank insurance, security deposits and customer deposits. We have no collateral held as at June 30, 2016.
December 31, 2015 (Audited) Gross
Maximum Exposure
Collateral and Other Credit
Enhancements*
Net Maximum Exposure
(in million pesos) Loans and receivables:
Advances and other noncurrent assets 10,516 – 10,516 Cash and cash equivalents 46,455 272 46,183 Short-term investments 744 – 744 Investment in debt securities and other long-term investments 595 – 595 Retail subscribers 10,210 46 10,164 Foreign administrations 5,199 – 5,199 Corporate subscribers 4,812 160 4,652 Domestic carriers 454 – 454 Dealers, agents and others 4,223 2 4,221
HTM investments: Investment in debt securities and other long-term investments 408 – 408
Financial instruments at FVPL: Short-term investments 685 – 685 Forward foreign exchange contracts 10 – 10
Available-for-sale financial investments 15,711 – 15,711 Derivatives used for hedging:
Interest rate swap 90 – 90 Long-term currency swap 71 – 71 Total 100,183 480 99,703
* Includes bank insurance, security deposits and customer deposits. We have no collateral held as at December 31, 2015.
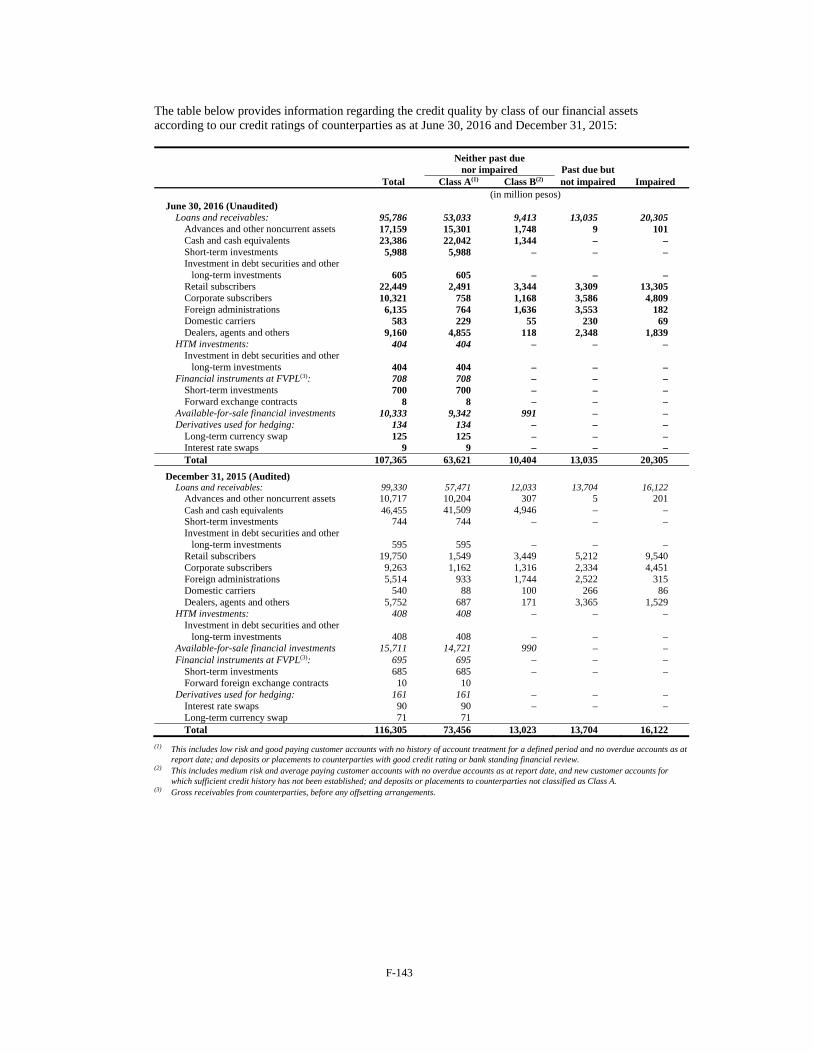
F-143
The table below provides information regarding the credit quality by class of our financial assets according to our credit ratings of counterparties as at June 30, 2016 and December 31, 2015:
Neither past due
nor impaired Past due but Total Class A(1) Class B(2) not impaired Impaired (in million pesos)
June 30, 2016 (Unaudited) Loans and receivables: 95,786 53,033 9,413 13,035 20,305
Advances and other noncurrent assets 17,159 15,301 1,748 9 101 Cash and cash equivalents 23,386 22,042 1,344 – – Short-term investments 5,988 5,988 – – – Investment in debt securities and other
long-term investments 605 605 – – – Retail subscribers 22,449 2,491 3,344 3,309 13,305 Corporate subscribers 10,321 758 1,168 3,586 4,809 Foreign administrations 6,135 764 1,636 3,553 182 Domestic carriers 583 229 55 230 69 Dealers, agents and others 9,160 4,855 118 2,348 1,839
HTM investments: 404 404 – – – Investment in debt securities and other
long-term investments 404 404 – – – Financial instruments at FVPL(3): 708 708 – – –
Short-term investments 700 700 – – – Forward exchange contracts 8 8 – – –
Available-for-sale financial investments 10,333 9,342 991 – – Derivatives used for hedging: 134 134 – – –
Long-term currency swap 125 125 – – – Interest rate swaps 9 9 – – – Total 107,365 63,621 10,404 13,035 20,305
December 31, 2015 (Audited) Loans and receivables: 99,330 57,471 12,033 13,704 16,122
Advances and other noncurrent assets 10,717 10,204 307 5 201 Cash and cash equivalents 46,455 41,509 4,946 – – Short-term investments 744 744 – – – Investment in debt securities and other
long-term investments 595 595 – – – Retail subscribers 19,750 1,549 3,449 5,212 9,540 Corporate subscribers 9,263 1,162 1,316 2,334 4,451 Foreign administrations 5,514 933 1,744 2,522 315 Domestic carriers 540 88 100 266 86 Dealers, agents and others 5,752 687 171 3,365 1,529
HTM investments: 408 408 – – – Investment in debt securities and other
long-term investments 408 408 – – – Available-for-sale financial investments 15,711 14,721 990 – – Financial instruments at FVPL(3): 695 695 – – –
Short-term investments 685 685 – – – Forward foreign exchange contracts 10 10
Derivatives used for hedging: 161 161 – – – Interest rate swaps 90 90 – – – Long-term currency swap 71 71 Total 116,305 73,456 13,023 13,704 16,122
(1) This includes low risk and good paying customer accounts with no history of account treatment for a defined period and no overdue accounts as at
report date; and deposits or placements to counterparties with good credit rating or bank standing financial review. (2) This includes medium risk and average paying customer accounts with no overdue accounts as at report date, and new customer accounts for
which sufficient credit history has not been established; and deposits or placements to counterparties not classified as Class A. (3) Gross receivables from counterparties, before any offsetting arrangements.
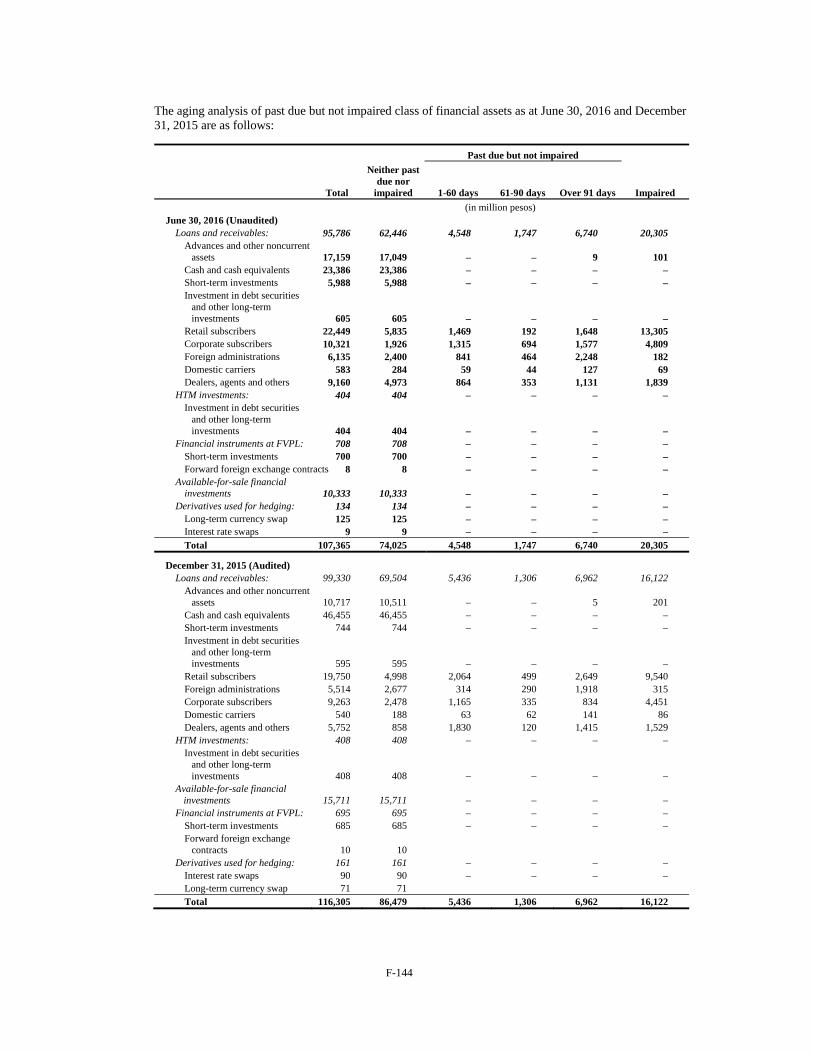
F-144
The aging analysis of past due but not impaired class of financial assets as at June 30, 2016 and December 31, 2015 are as follows:
Past due but not impaired
Total
Neither past due nor
impaired 1-60 days 61-90 days Over 91 days Impaired
(in million pesos) June 30, 2016 (Unaudited)
Loans and receivables: 95,786 62,446 4,548 1,747 6,740 20,305 Advances and other noncurrent
assets 17,159 17,049 – – 9 101 Cash and cash equivalents 23,386 23,386 – – – – Short-term investments 5,988 5,988 – – – – Investment in debt securities
and other long-term investments 605 605 – – – –
Retail subscribers 22,449 5,835 1,469 192 1,648 13,305 Corporate subscribers 10,321 1,926 1,315 694 1,577 4,809 Foreign administrations 6,135 2,400 841 464 2,248 182 Domestic carriers 583 284 59 44 127 69 Dealers, agents and others 9,160 4,973 864 353 1,131 1,839
HTM investments: 404 404 – – – – Investment in debt securities
and other long-term investments 404 404 – – – –
Financial instruments at FVPL: 708 708 – – – – Short-term investments 700 700 – – – – Forward foreign exchange contracts 8 8 – – – –
Available-for-sale financial investments 10,333 10,333 – – – –
Derivatives used for hedging: 134 134 – – – – Long-term currency swap 125 125 – – – – Interest rate swaps 9 9 – – – – Total 107,365 74,025 4,548 1,747 6,740 20,305
December 31, 2015 (Audited) Loans and receivables: 99,330 69,504 5,436 1,306 6,962 16,122
Advances and other noncurrent assets 10,717 10,511 – – 5 201
Cash and cash equivalents 46,455 46,455 – – – – Short-term investments 744 744 – – – – Investment in debt securities
and other long-term investments 595 595 – – – –
Retail subscribers 19,750 4,998 2,064 499 2,649 9,540 Foreign administrations 5,514 2,677 314 290 1,918 315 Corporate subscribers 9,263 2,478 1,165 335 834 4,451 Domestic carriers 540 188 63 62 141 86 Dealers, agents and others 5,752 858 1,830 120 1,415 1,529
HTM investments: 408 408 – – – – Investment in debt securities
and other long-term investments 408 408 – – – –
Available-for-sale financial investments 15,711 15,711 – – – –
Financial instruments at FVPL: 695 695 – – – – Short-term investments 685 685 – – – – Forward foreign exchange
contracts 10 10 Derivatives used for hedging: 161 161 – – – –
Interest rate swaps 90 90 – – – – Long-term currency swap 71 71 Total 116,305 86,479 5,436 1,306 6,962 16,122
F-145
Impairment Assessments The main consideration for the impairment assessment include whether any payments of principal or interest are overdue by more than 90 days or whether there are any known difficulties in the cash flows of counterparties, credit rating downgrades, or infringement of the original terms of the contract. Our impairment assessments are classified into two areas: individually assessed allowance and collectively assessed allowances.
Individually assessed allowance We determine the allowance appropriate for each individually significant loan or advance on an individual basis. Items considered when determining allowance amounts include the sustainability of the counterparty’s business plan, its ability to improve performance once a financial difficulty has arisen, projected receipts and the expected dividend payout should bankruptcy ensue, the availability of other financial support, the realizable value of collateral, if any, and the timing of the expected cash flows. We also recognize an impairment for accounts specifically identified to be doubtful of collection when there is information on financial incapacity after considering the other contractual obligations between us and the subscriber. The impairment losses are evaluated at each reporting date, unless unforeseen circumstances require more careful attention.
Collectively assessed allowances Allowances are assessed collectively for losses on loans and advances that are not individually significant and for individually significant loans and advances where there is no objective evidence of individual impairment. Allowances are evaluated on each reporting date with each portfolio receiving a separate review. The collective assessment takes account of impairment that is likely to be present in the portfolio even though there is no objective evidence of the impairment in an individual assessment. Impairment losses are estimated by taking into consideration the following information: historical losses on the portfolio, current economic conditions, the approximate delay between the time a loss is likely to have been incurred and the time it is identified as requiring an individually assessed impairment allowance, and expected receipts and recoveries once impaired. The impairment allowance is then reviewed by credit management to ensure alignment with our policy. Capital Management Risk We aim to achieve an optimal capital structure in pursuit of our business objectives which include maintaining healthy capital ratios and strong credit ratings, and maximizing shareholder value. In recent years, our cash flow from operations has allowed us to substantially reduce debts and, in 2005, resume payment of dividends on common shares. Since 2005, our strong cash flow has enabled us to make investments in new areas and pay higher dividends. Our approach to capital management focuses on balancing the allocation of cash and the incurrence of debt as we seek new investment opportunities for new businesses and growth areas. On August 5, 2014, the PLDT Board of Directors approved an amendment to our dividend policy, increasing the dividend payout rate to 75% from 70% of our core EPS as regular dividends. In declaring dividends, we take into consideration the interest of our shareholders, as well as our working capital, capital expenditures and debt servicing requirements. The retention of earnings may be necessary to meet the funding requirements of our business expansion and development programs.
F-146
However, in view of our current elevated capital expenditures to build-out a robust, superior network to support the continued growth of data traffic, plans to invest in new adjacent businesses that will complement the current business and provide future sources of profits and dividends, and management of our cash and gearing levels, the PLDT Board of Directors approved on August 2, 2016, the amendment of our dividend policy, reducing the regular dividend payout to 60% of core EPS. As part of the dividend policy, in the event no investment opportunities arise, we may consider the option of returning additional cash to our shareholders in the form of special dividends or share buybacks. Philippine corporate regulations prescribe, however, that we can only pay out dividends or make capital distribution up to the amount of our unrestricted retained earnings. Some of our debt instruments contain covenants that impose maximum leverage ratios. In addition, our credit ratings from the international credit ratings agencies are based on our ability to remain within certain leverage ratios. No changes were made in our objectives, policies or processes for managing capital during the six months ended June 30, 2016 and 2015.