Embed Size (px)
Citation preview
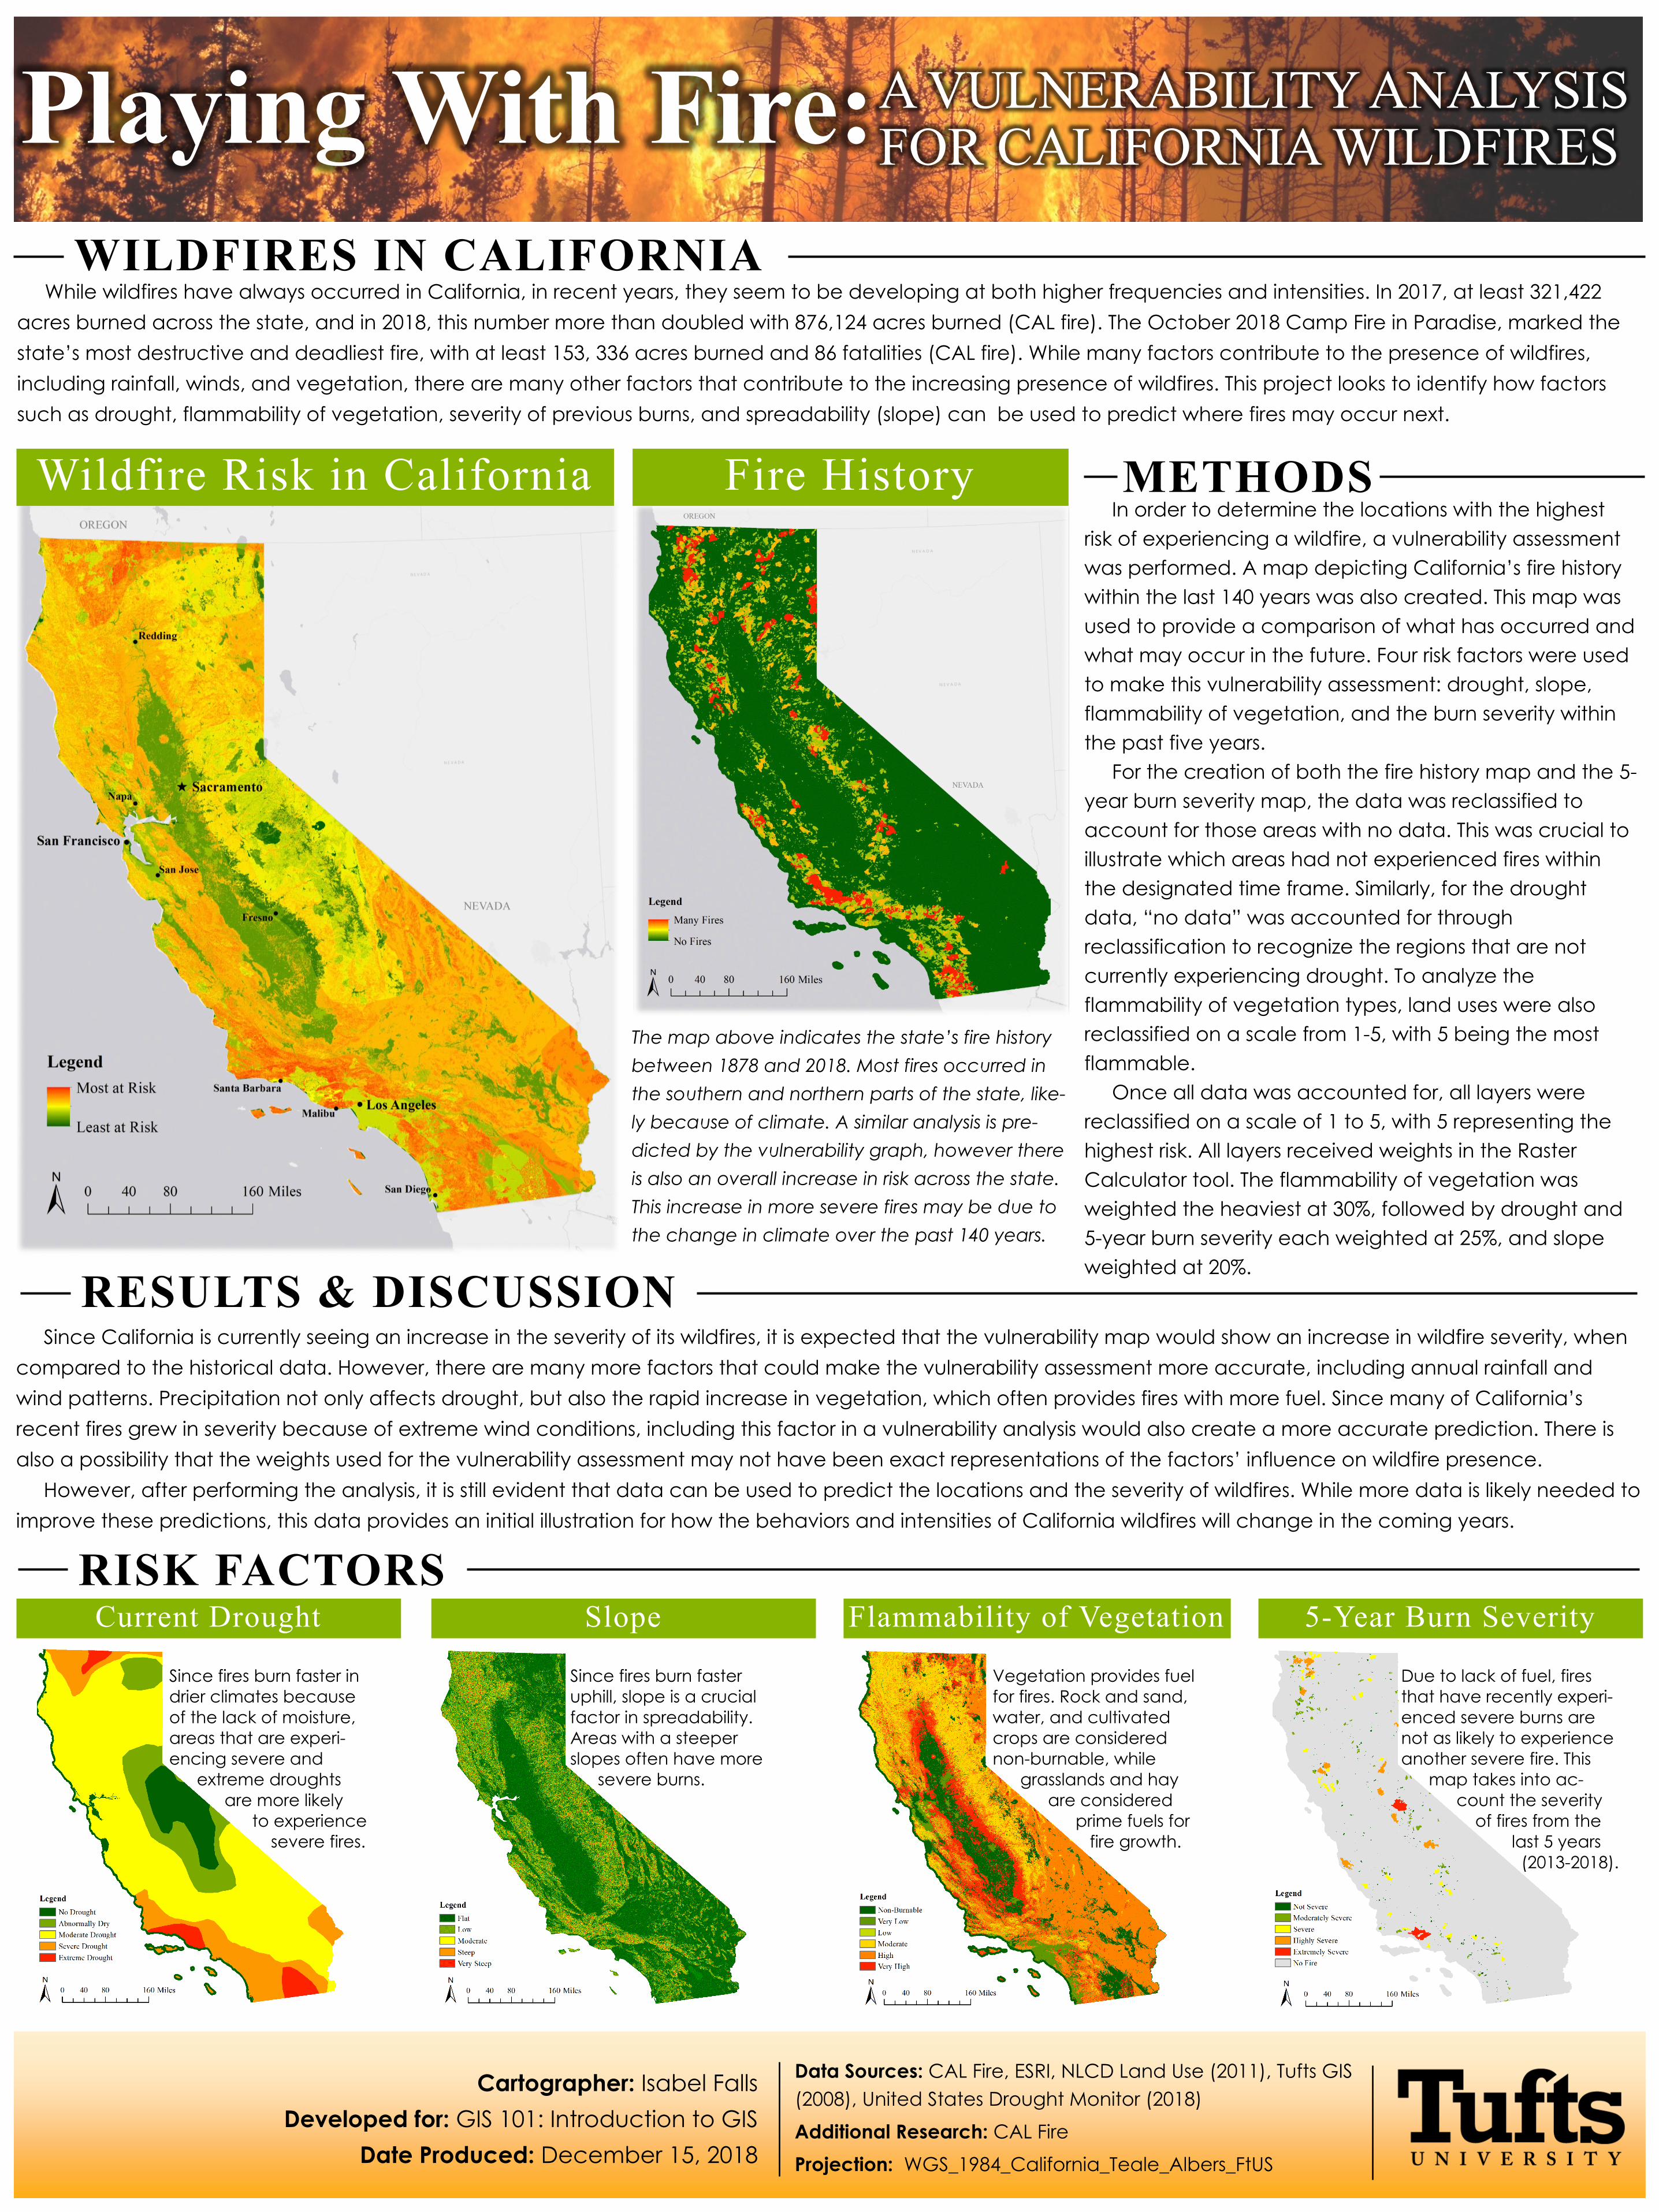
Wildfire Risk in California Fire History
Current Drought Slope Flammability of Vegetation 5-Year Burn Severity
Cartographer: Isabel Falls
Developed for: GIS 101: Introduction to GIS
Date Produced: December 15, 2018
Data Sources: CAL Fire, ESRI, NLCD Land Use (2011), Tufts GIS
(2008), United States Drought Monitor (2018)
Additional Research: CAL Fire
Projection: WGS_1984_California_Teale_Albers_FtUS
Vegetation provides fuel
for fires. Rock and sand,
water, and cultivated
crops are considered
non-burnable, while
grasslands and hay
are considered
prime fuels for
fire growth.
Due to lack of fuel, fires
that have recently experi-
enced severe burns are
not as likely to experience
another severe fire. This
map takes into ac-
count the severity
of fires from the
last 5 years
(2013-2018).
Since fires burn faster in
drier climates because
of the lack of moisture,
areas that are experi-
encing severe and
extreme droughts
are more likely
to experience
severe fires.
Since fires burn faster
uphill, slope is a crucial
factor in spreadability.
Areas with a steeper
slopes often have more
severe burns.
METHODS
Playing With Fire:
WILDFIRES IN CALIFORNIA While wildfires have always occurred in California, in recent years, they seem to be developing at both higher frequencies and intensities. In 2017, at least 321,422
acres burned across the state, and in 2018, this number more than doubled with 876,124 acres burned (CAL fire). The October 2018 Camp Fire in Paradise, marked the
state’s most destructive and deadliest fire, with at least 153, 336 acres burned and 86 fatalities (CAL fire). While many factors contribute to the presence of wildfires,
including rainfall, winds, and vegetation, there are many other factors that contribute to the increasing presence of wildfires. This project looks to identify how factors
such as drought, flammability of vegetation, severity of previous burns, and spreadability (slope) can be used to predict where fires may occur next.
RISK FACTORS
RESULTS & DISCUSSION
In order to determine the locations with the highest
risk of experiencing a wildfire, a vulnerability assessment
was performed. A map depicting California’s fire history
within the last 140 years was also created. This map was
used to provide a comparison of what has occurred and
what may occur in the future. Four risk factors were used
to make this vulnerability assessment: drought, slope,
flammability of vegetation, and the burn severity within
the past five years.
For the creation of both the fire history map and the 5-
year burn severity map, the data was reclassified to
account for those areas with no data. This was crucial to
illustrate which areas had not experienced fires within
the designated time frame. Similarly, for the drought
data, “no data” was accounted for through
reclassification to recognize the regions that are not
currently experiencing drought. To analyze the
flammability of vegetation types, land uses were also
reclassified on a scale from 1-5, with 5 being the most
flammable.
Once all data was accounted for, all layers were
reclassified on a scale of 1 to 5, with 5 representing the
highest risk. All layers received weights in the Raster
Calculator tool. The flammability of vegetation was
weighted the heaviest at 30%, followed by drought and
5-year burn severity each weighted at 25%, and slope
weighted at 20%.
A VULNERABILITY ANALYSIS FOR CALIFORNIA WILDFIRES
The map above indicates the state’s fire history
between 1878 and 2018. Most fires occurred in
the southern and northern parts of the state, like-
ly because of climate. A similar analysis is pre-
dicted by the vulnerability graph, however there
is also an overall increase in risk across the state.
This increase in more severe fires may be due to
the change in climate over the past 140 years.
Since California is currently seeing an increase in the severity of its wildfires, it is expected that the vulnerability map would show an increase in wildfire severity, when
compared to the historical data. However, there are many more factors that could make the vulnerability assessment more accurate, including annual rainfall and
wind patterns. Precipitation not only affects drought, but also the rapid increase in vegetation, which often provides fires with more fuel. Since many of California’s
recent fires grew in severity because of extreme wind conditions, including this factor in a vulnerability analysis would also create a more accurate prediction. There is
also a possibility that the weights used for the vulnerability assessment may not have been exact representations of the factors’ influence on wildfire presence.
However, after performing the analysis, it is still evident that data can be used to predict the locations and the severity of wildfires. While more data is likely needed to
improve these predictions, this data provides an initial illustration for how the behaviors and intensities of California wildfires will change in the coming years.


![Global land- cover change – wildfires · fire is an emotive topic. extreme wildfires can have massive economic, social and environmental impacts[1], and recent catastrophic fires,](https://img.pdfslide.us/doc/110x75/5e07c5a294bfac6f8032976f/global-land-cover-change-a-wildfires-fire-is-an-emotive-topic-extreme-wildfires.jpg)