Embed Size (px)
Citation preview
January 2019
The B2B Payments Automation Innovation Playbook, in partnership with Mastercard®, examines survey data collected from nearly 400 financial decision makers in more than 12 industries. Our findings provide a comprehensive overview of automation demand for automating payables in the B2B payments market, what’s motivating or inhibiting business usage and how inhibition is set to change.
Playbook
INNOVATION
B2B PAYMENTS AUTOMATION
01
KEY FINDINGS
17BREAKING TO THE TOP
07AUTOMATION ON THE RISE
29
CONCLUSION
03
INTRODUCTION
23AUTOMATION
AND INDUSTRY
31
METHODOLOGY
TABLE OF
CONTENTS
The B2B Playments Automation Innovation Playbook was done in collaboration with Mastercard, and PYMNTS is grateful for the company's support and insight. PYMNTS.com retains full editorial control over the findings presented, as well as the methodology and data analysis.
21
© 2019 PYMNTS.com All Rights Reserved
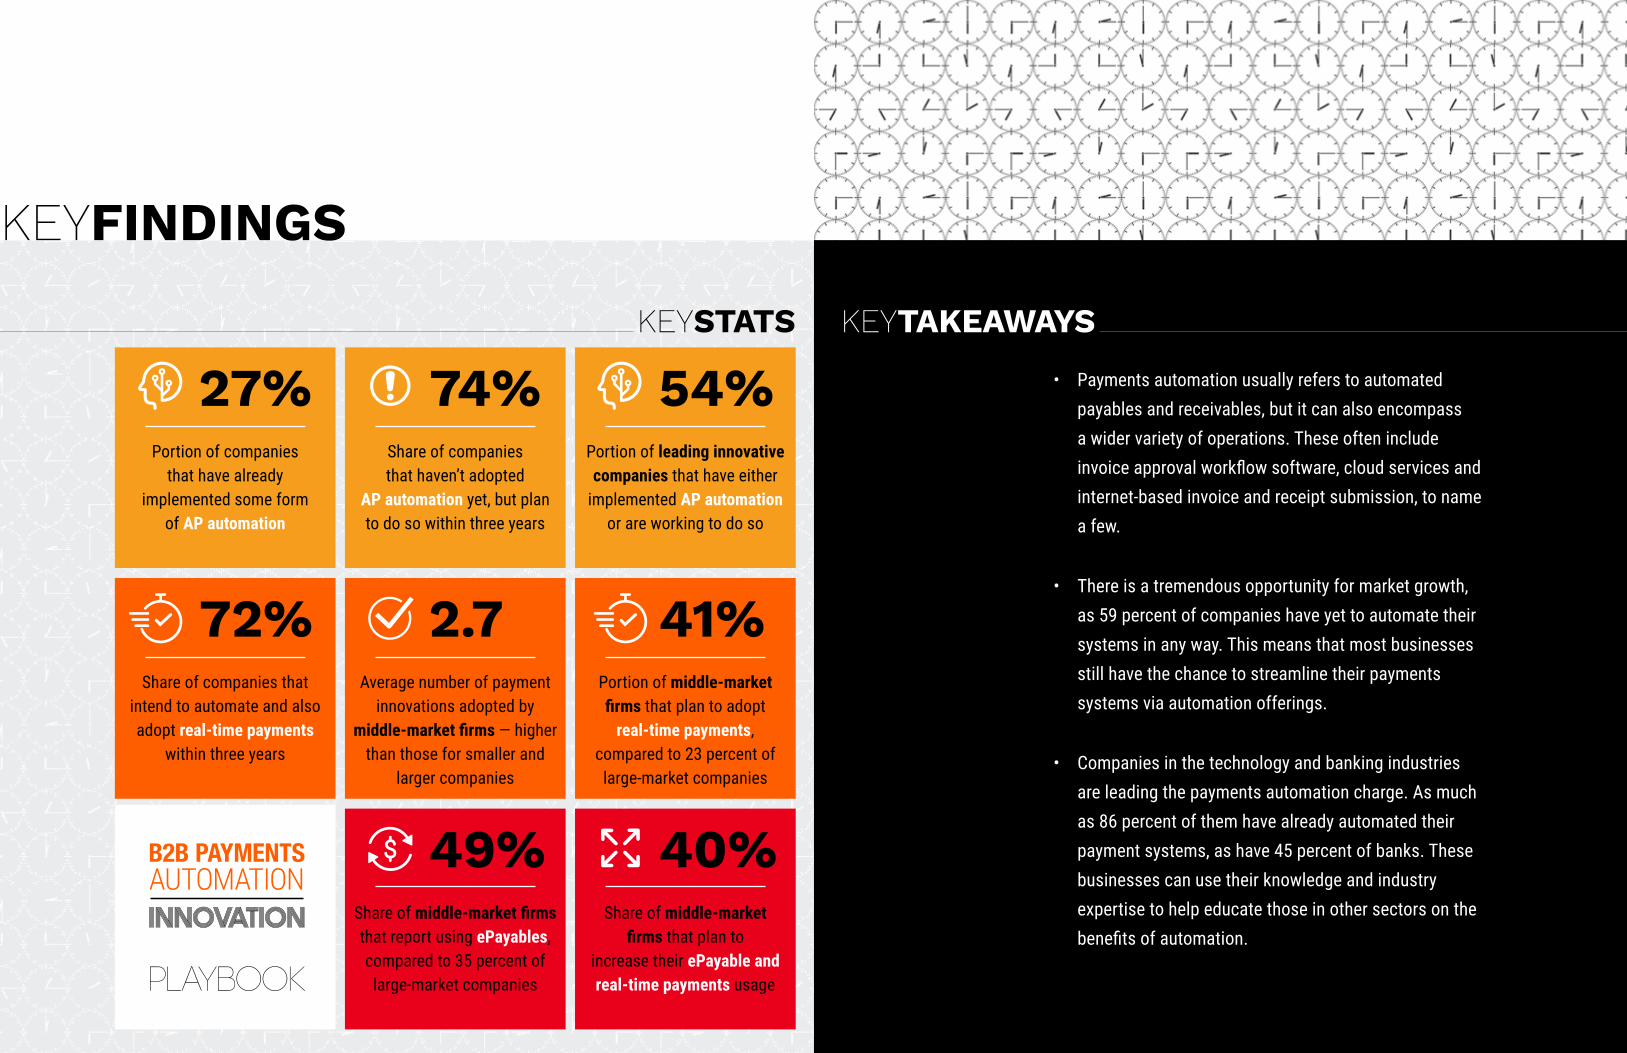
KEYFINDINGS
KEYSTATS KEYTAKEAWAYS
• Payments automation usually refers to automated payables and receivables, but it can also encompass a wider variety of operations. These often include invoice approval workflow software, cloud services and internet-based invoice and receipt submission, to name a few.
• There is a tremendous opportunity for market growth, as 59 percent of companies have yet to automate their systems in any way. This means that most businesses still have the chance to streamline their payments systems via automation offerings.
• Companies in the technology and banking industries are leading the payments automation charge. As much as 86 percent of them have already automated their payment systems, as have 45 percent of banks. These businesses can use their knowledge and industry expertise to help educate those in other sectors on the benefits of automation.
74%27%
2.772%
49%
54%
41%
40%
Share of companies that haven’t adopted
AP automation yet, but plan to do so within three years
Portion of companies that have already
implemented some form of AP automation
Share of middle-market firms that report using ePayables, compared to 35 percent of
large-market companies
Average number of payment innovations adopted by
middle-market firms — higher than those for smaller and
larger companies
Share of companies that intend to automate and also adopt real-time payments
within three years
Portion of leading innovative companies that have either
implemented AP automation or are working to do so
Share of middle-market firms that plan to
increase their ePayable and real-time payments usage
Portion of middle-market firms that plan to adopt
real-time payments, compared to 23 percent of
large-market companies
43
© 2019 PYMNTS.com All Rights Reserved
That finding means many companies have yet to invest in any form of payments automation. This is where the opportunity lies, however, and the market has enormous growth potential on the macro level.
With so many businesses committed to AP automation, and so much to gain from doing so, the stakes are high. Companies that have not adopted automation can incur higher operating costs than those that have, and those costs cut into their margins.
B2B payments automation may be especially fruitful for middle-market companies with annual revenues between $100 million and $1 billion. These companies face more than just strong competitive pressure, though. Many of them have not yet invested in B2B innovations, so they also face the high costs of outdated B2B payment systems. Modernized offerings can help these firms keep their AP expenses in check.
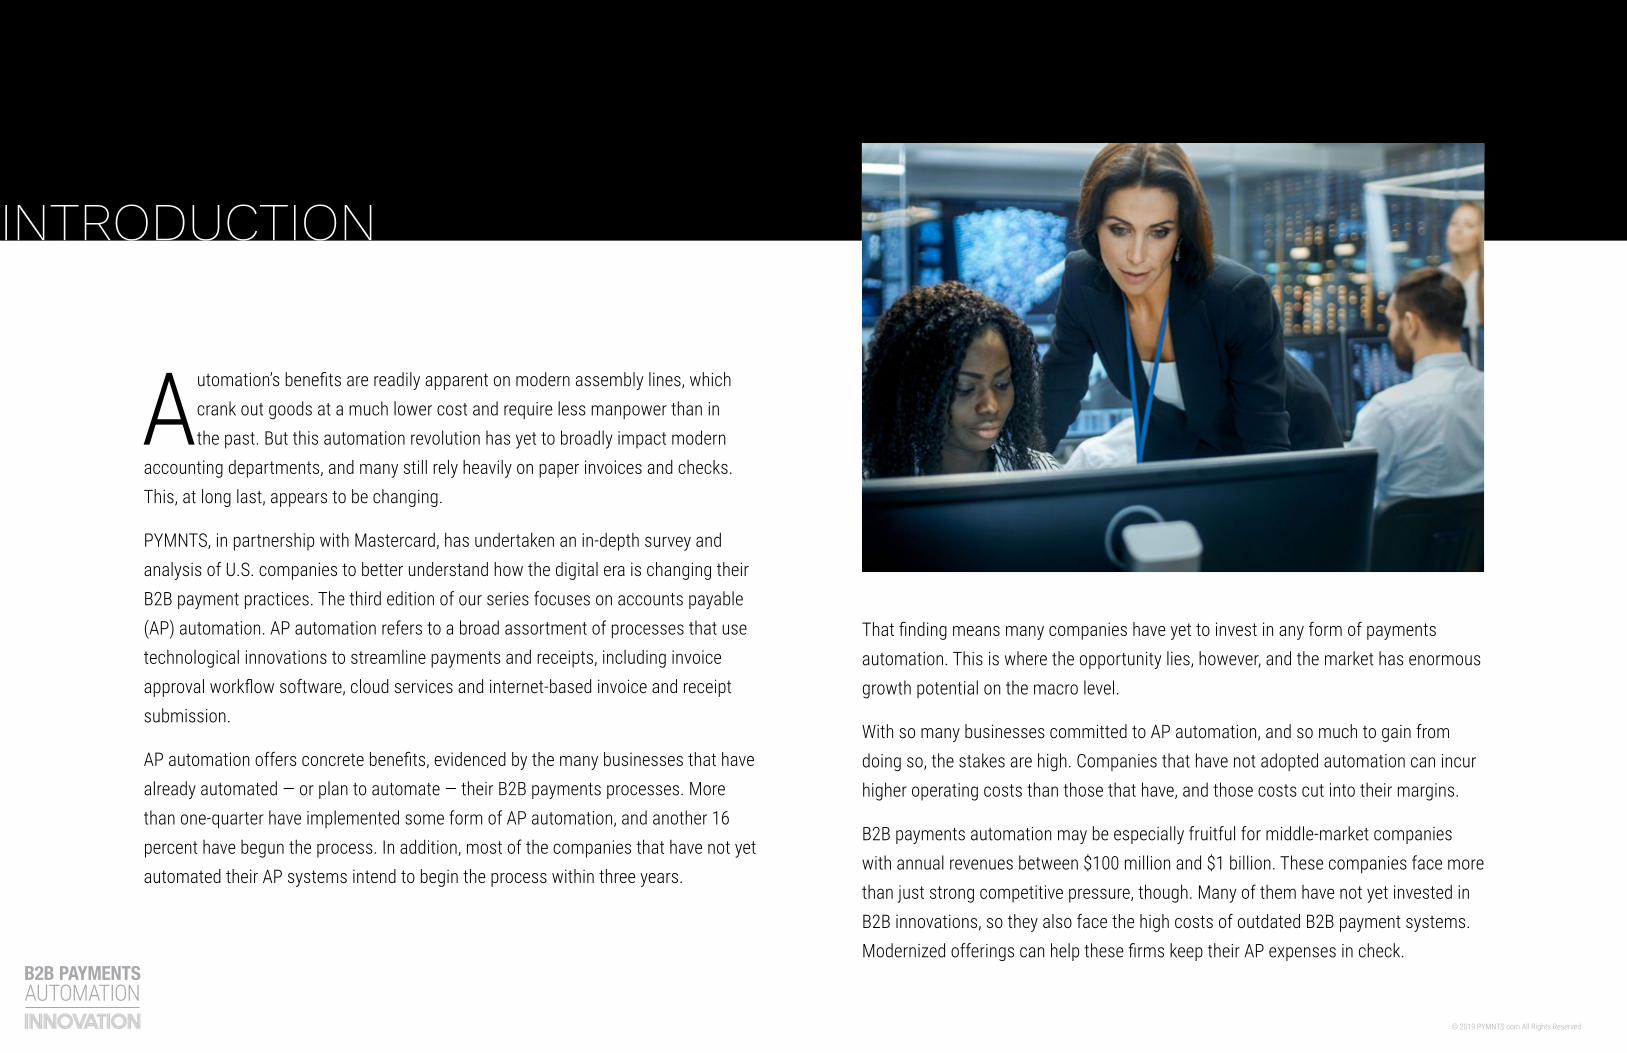
Automation’s benefits are readily apparent on modern assembly lines, which crank out goods at a much lower cost and require less manpower than in the past. But this automation revolution has yet to broadly impact modern
accounting departments, and many still rely heavily on paper invoices and checks. This, at long last, appears to be changing.
PYMNTS, in partnership with Mastercard, has undertaken an in-depth survey and analysis of U.S. companies to better understand how the digital era is changing their B2B payment practices. The third edition of our series focuses on accounts payable (AP) automation. AP automation refers to a broad assortment of processes that use technological innovations to streamline payments and receipts, including invoice approval workflow software, cloud services and internet-based invoice and receipt submission.
AP automation offers concrete benefits, evidenced by the many businesses that have already automated — or plan to automate — their B2B payments processes. More than one-quarter have implemented some form of AP automation, and another 16 percent have begun the process. In addition, most of the companies that have not yet automated their AP systems intend to begin the process within three years.
INTRODUCTION
65
© 2019 PYMNTS.com All Rights Reserved
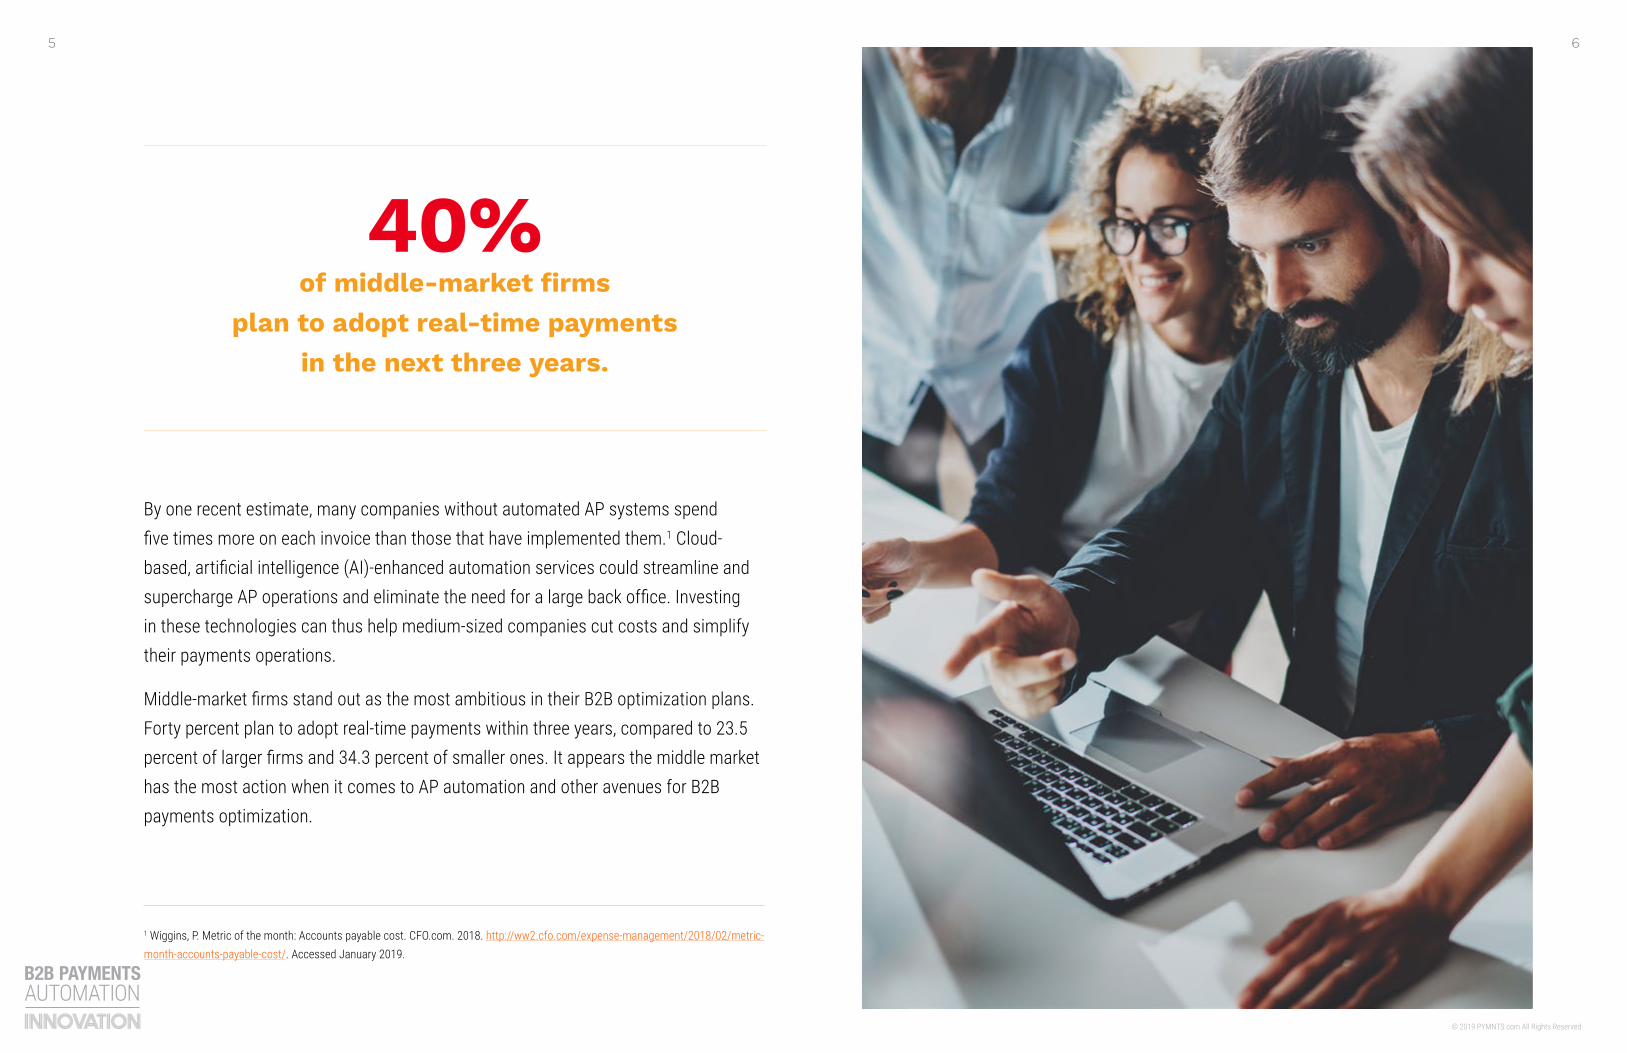
By one recent estimate, many companies without automated AP systems spend five times more on each invoice than those that have implemented them.1 Cloud-based, artificial intelligence (AI)-enhanced automation services could streamline and supercharge AP operations and eliminate the need for a large back office. Investing in these technologies can thus help medium-sized companies cut costs and simplify their payments operations.
Middle-market firms stand out as the most ambitious in their B2B optimization plans. Forty percent plan to adopt real-time payments within three years, compared to 23.5 percent of larger firms and 34.3 percent of smaller ones. It appears the middle market has the most action when it comes to AP automation and other avenues for B2B payments optimization.
40%of middle-market firms
plan to adopt real-time payments in the next three years.
1 Wiggins, P. Metric of the month: Accounts payable cost. CFO.com. 2018. http://ww2.cfo.com/expense-management/2018/02/metric-month-accounts-payable-cost/. Accessed January 2019.

87
© 2019 PYMNTS.com All Rights Reserved
Automation on the rise
109
© 2019 PYMNTS.com All Rights Reserved
Payments automation discussions typically focus on two specific features: AP and accounts
receivable (AR). But many other operations can be automated as well, through features like invoice approval workflow software, cloud services and internet-based invoice and receipt submission, among others.
It is important to contextualize payments optimization as a broad concept that includes a wide variety of technologies and possibilities. What’s more, it seems businesses are not letting the opportunity to leverage these technologies pass them by.
Automation stands out among recent B2B payments innovations because of the sheer volume of businesses that have invested in it. More than one-quarter of surveyed companies had already implemented some form of payments automation, and another 16 percent were working to do so.
MAIN TAKEAWAY
Leading innovative companies know that automation offers:
Error reduction: No more misplaced and misread invoices.
Savings: Employees’ time is not wasted on data entry or other manual invoice processing tasks.
Reduced fraud: Cybersecurity, enhanced with AI, can immediately flag problematic or unusual transactions.
Less reliance on checks: Card and real-time payments methods can be integrated into automation systems.
Compliance: Comprehensive financial records are automatically kept in compliance with current tax regulations.
The key benefits of AP automation
1211
© 2019 PYMNTS.com All Rights Reserved
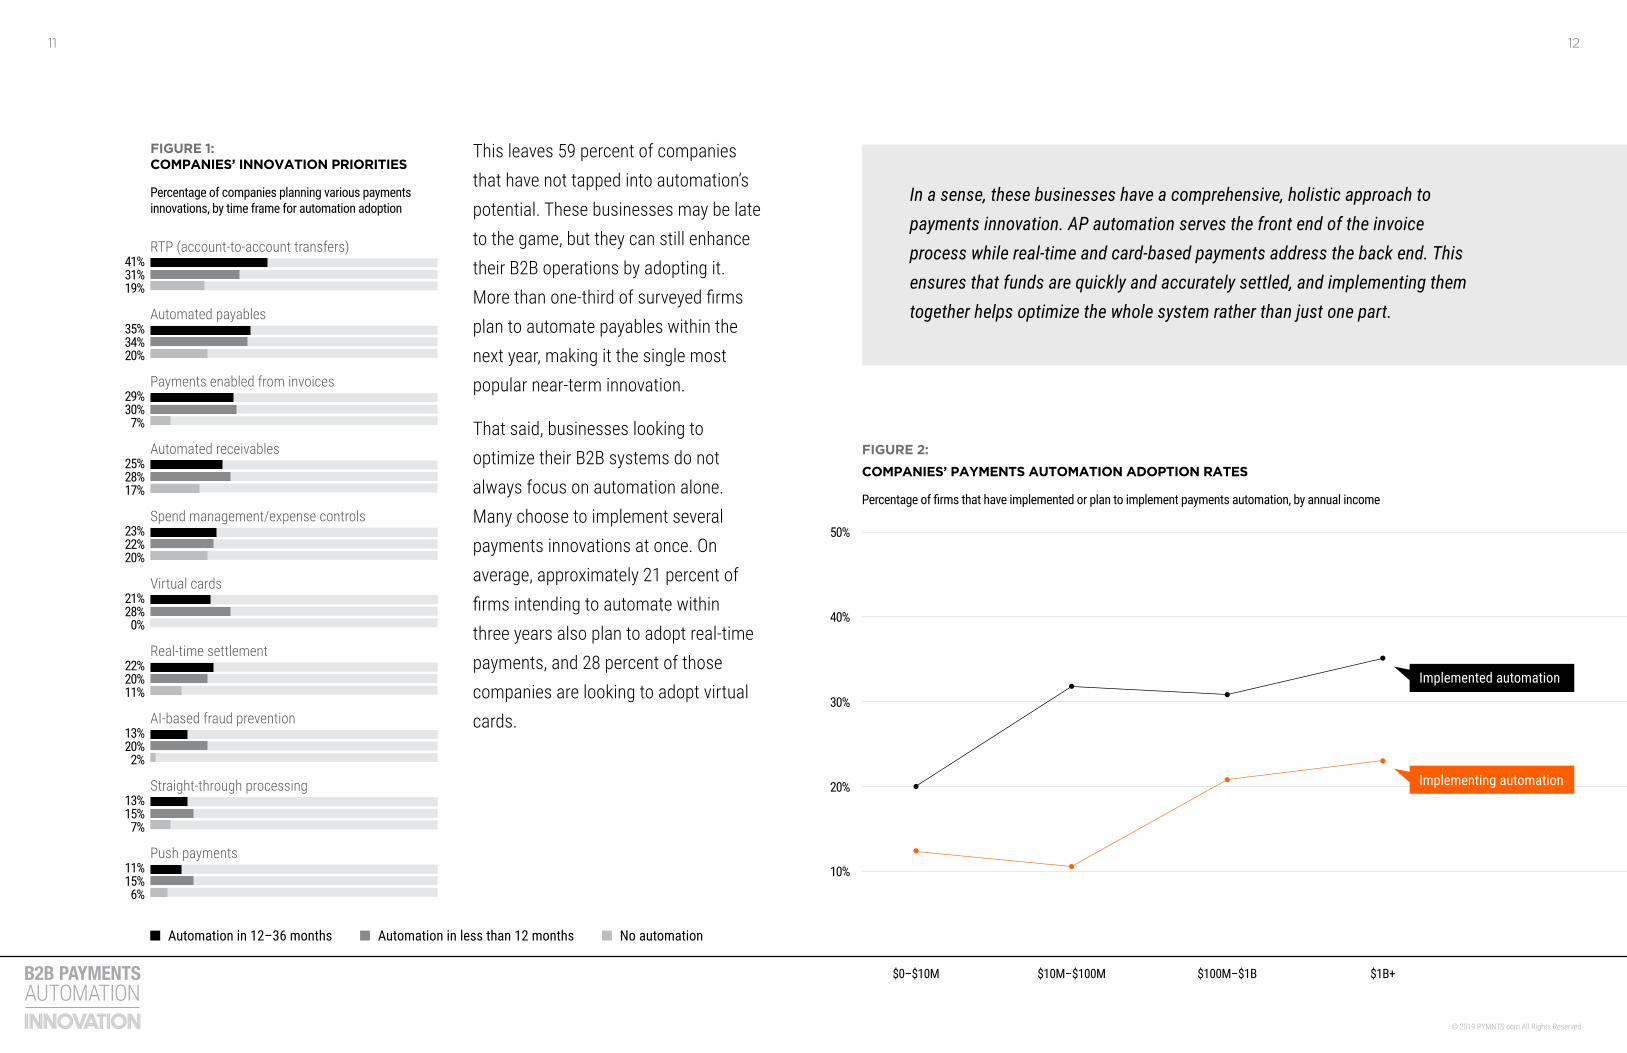
This leaves 59 percent of companies that have not tapped into automation’s potential. These businesses may be late to the game, but they can still enhance their B2B operations by adopting it. More than one-third of surveyed firms plan to automate payables within the next year, making it the single most popular near-term innovation.
That said, businesses looking to optimize their B2B systems do not always focus on automation alone. Many choose to implement several payments innovations at once. On average, approximately 21 percent of firms intending to automate within three years also plan to adopt real-time payments, and 28 percent of those companies are looking to adopt virtual cards.
Automation in less than 12 months No automationAutomation in 12–36 months
6000000000
4000000000
4000000000
5300000000
4500000000
5400000000
3600000000
3600000000
3600000000
3700000000
2800000000
2000000000
3300000000
2100000000
2100000000
1700000000
1900000000
1900000000
1900000000
1500000000
1700000000
1700000000
0800000000
0800000000
1500000000
1100000000
1200000000
1200000000
1200000000
1000000000
RTP (account-to-account transfers)
Automated payables
Virtual cards
AI-based fraud prevention
Payments enabled from invoices
Automated receivables
Spend management/expense controls
Real-time settlement
41%31%19%
35%34%20%
29%30%7%
25%28%17%
23%22%20%
22%20%11%
21%28%0%
13%20%2%
13%15%7%
11%15%6%
FIGURE 1: COMPANIES’ INNOVATION PRIORITIES
Percentage of companies planning various payments innovations, by time frame for automation adoption
Straight-through processing
Push payments
FIGURE 2:
COMPANIES’ PAYMENTS AUTOMATION ADOPTION RATES
Percentage of firms that have implemented or plan to implement payments automation, by annual income
$10M–$100M $1B+$100M–$1B$0–$10M
10%
20%
30%
40%
50%
Implementing automation
Implemented automation
In a sense, these businesses have a comprehensive, holistic approach to payments innovation. AP automation serves the front end of the invoice process while real-time and card-based payments address the back end. This ensures that funds are quickly and accurately settled, and implementing them together helps optimize the whole system rather than just one part.
1413
© 2019 PYMNTS.com All Rights Reserved
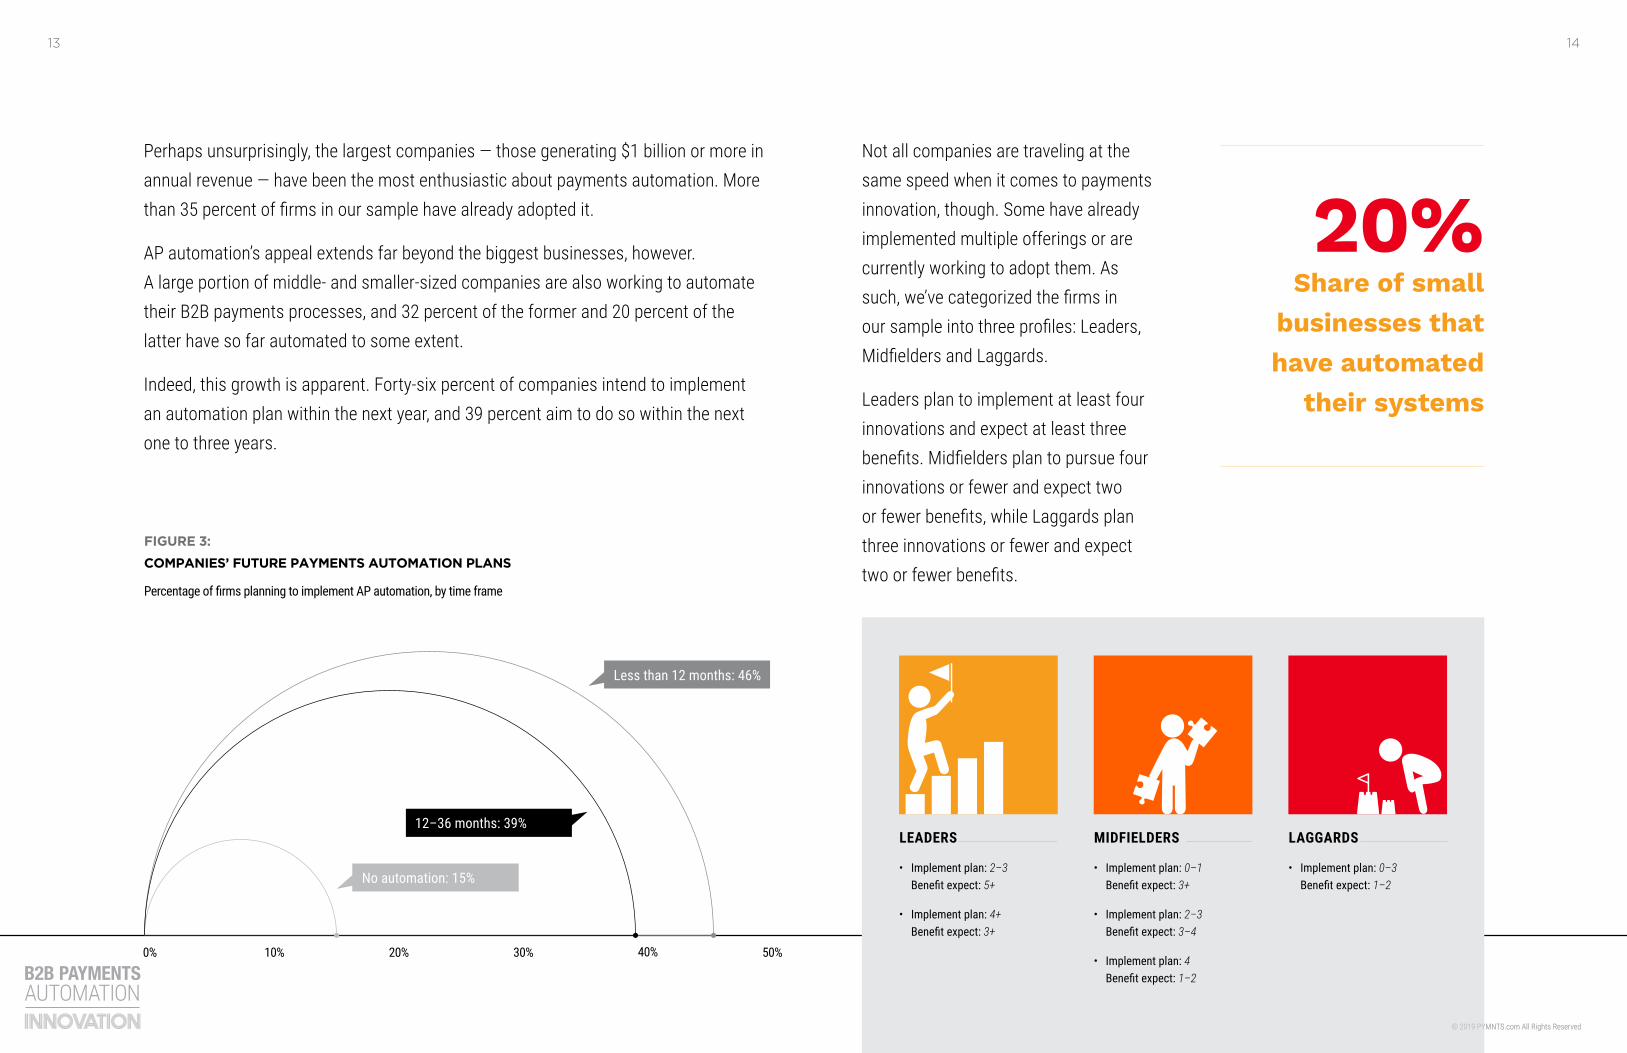
FIGURE 3:
COMPANIES’ FUTURE PAYMENTS AUTOMATION PLANS
Percentage of firms planning to implement AP automation, by time frame
10% 30% 40% 50%20%0%
Less than 12 months: 46%
No automation: 15%
12–36 months: 39%
Perhaps unsurprisingly, the largest companies — those generating $1 billion or more in annual revenue — have been the most enthusiastic about payments automation. More than 35 percent of firms in our sample have already adopted it.
AP automation’s appeal extends far beyond the biggest businesses, however. A large portion of middle- and smaller-sized companies are also working to automate their B2B payments processes, and 32 percent of the former and 20 percent of the latter have so far automated to some extent.
Indeed, this growth is apparent. Forty-six percent of companies intend to implement an automation plan within the next year, and 39 percent aim to do so within the next one to three years.
Not all companies are traveling at the same speed when it comes to payments innovation, though. Some have already implemented multiple offerings or are currently working to adopt them. As such, we’ve categorized the firms in our sample into three profiles: Leaders, Midfielders and Laggards.
Leaders plan to implement at least four innovations and expect at least three benefits. Midfielders plan to pursue four innovations or fewer and expect two or fewer benefits, while Laggards plan three innovations or fewer and expect two or fewer benefits.
LEADERS
• Implement plan: 2–3 Benefit expect: 5+
• Implement plan: 4+ Benefit expect: 3+
LAGGARDS
• Implement plan: 0–3 Benefit expect: 1–2
MIDFIELDERS
• Implement plan: 0–1 Benefit expect: 3+
• Implement plan: 2–3 Benefit expect: 3–4
• Implement plan: 4 Benefit expect: 1–2
20%Share of small
businesses that have automated
their systems
© 2019 PYMNTS.com All Rights Reserved
1615
© 2019 PYMNTS.com All Rights Reserved
Midfielders LeadersLaggards
6000000000
4000000000
4000000000
5300000000
4500000000
5400000000
3600000000
3600000000
3600000000
2800000000
2000000000
3300000000
2100000000
2100000000
1700000000
1900000000
1900000000
1900000000
1700000000
1700000000
0800000000
0800000000
1500000000
1100000000
1200000000
1200000000
1200000000
Reduced errors
Reduced costs
Increased payables and receivables efficiency
Reduced reliance on checks
Reduced employee resources
Reduced fraud
Improved cash management
Improved data visibility
84%60%53%
81%58%36%
70%44%25%
69%35%11%
63%32%17%
49%26%6%
53%35%3%
62%24%6%
37%16%0%
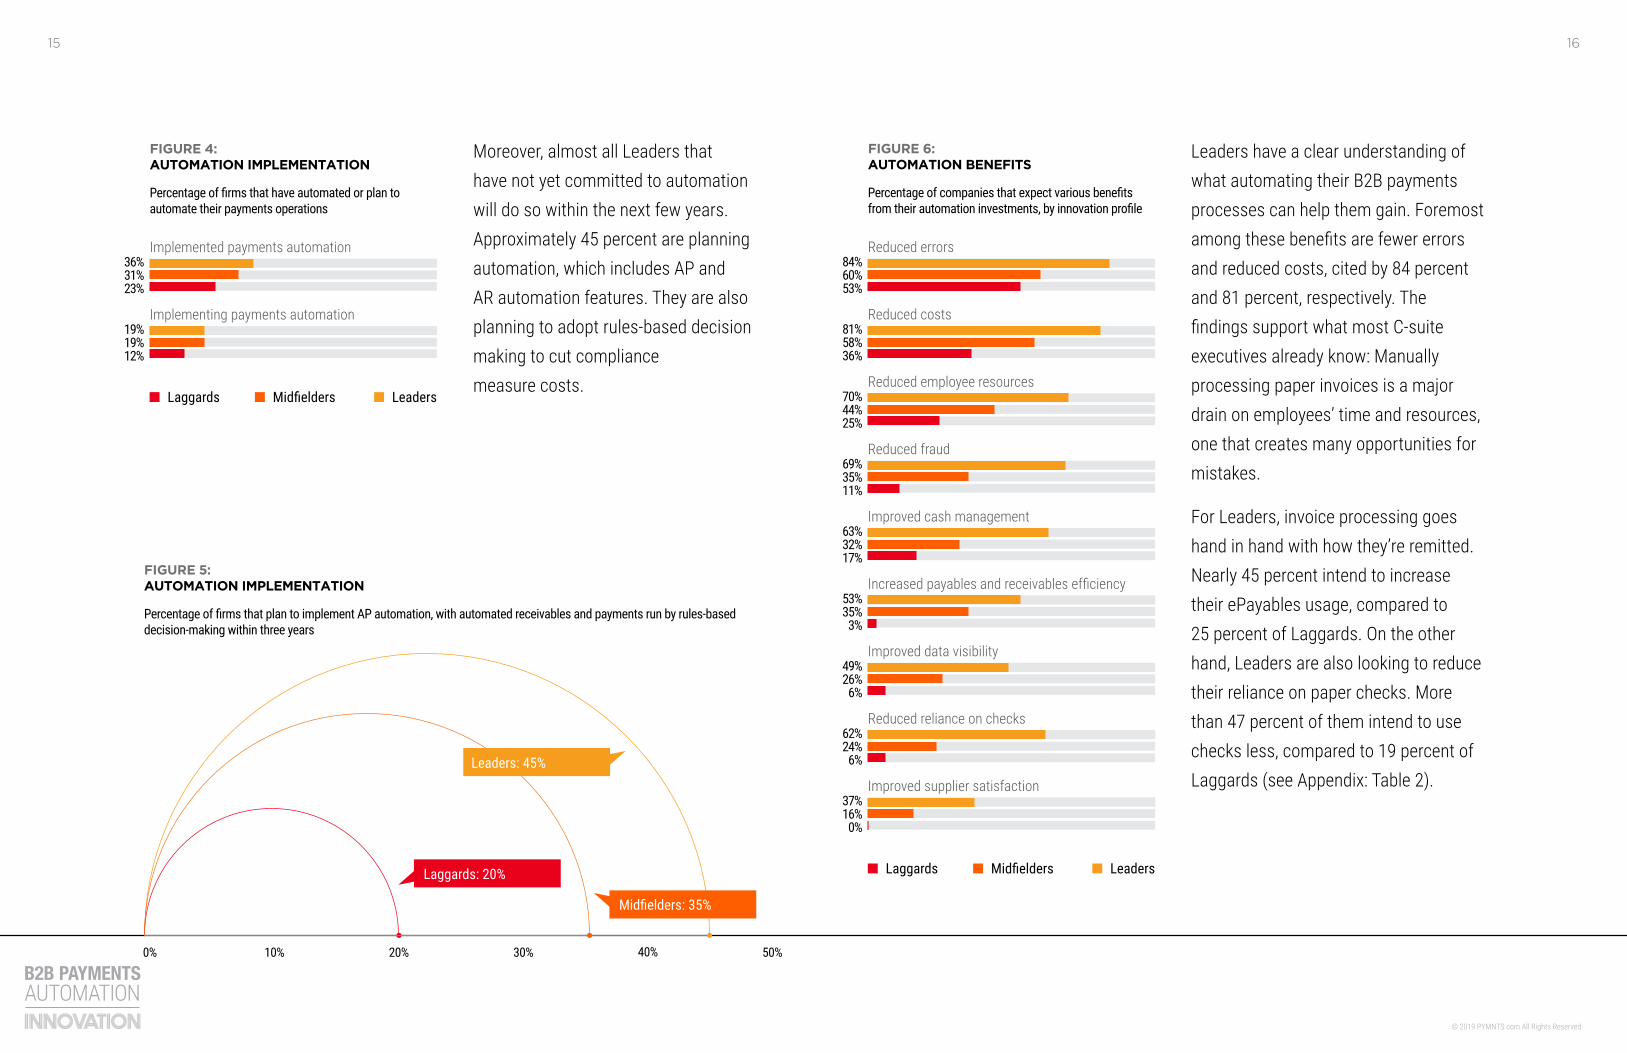
FIGURE 6: AUTOMATION BENEFITS
Percentage of companies that expect various benefits from their automation investments, by innovation profile
Improved supplier satisfaction
Moreover, almost all Leaders that have not yet committed to automation will do so within the next few years. Approximately 45 percent are planning automation, which includes AP and AR automation features. They are also planning to adopt rules-based decision making to cut compliance measure costs.
Midfielders LeadersLaggards
6000000000
5300000000
2800000000
3300000000
1700000000
1500000000
Implemented payments automation
Implementing payments automation
36%31%23%
19%19%12%
FIGURE 4: AUTOMATION IMPLEMENTATION
Percentage of firms that have automated or plan to automate their payments operations
FIGURE 5: AUTOMATION IMPLEMENTATION
Percentage of firms that plan to implement AP automation, with automated receivables and payments run by rules-based decision-making within three years
10% 30% 40% 50%20%0%
Laggards: 20%
Midfielders: 35%
Leaders: 45%
Leaders have a clear understanding of what automating their B2B payments processes can help them gain. Foremost among these benefits are fewer errors and reduced costs, cited by 84 percent and 81 percent, respectively. The findings support what most C-suite executives already know: Manually processing paper invoices is a major drain on employees’ time and resources, one that creates many opportunities for mistakes.
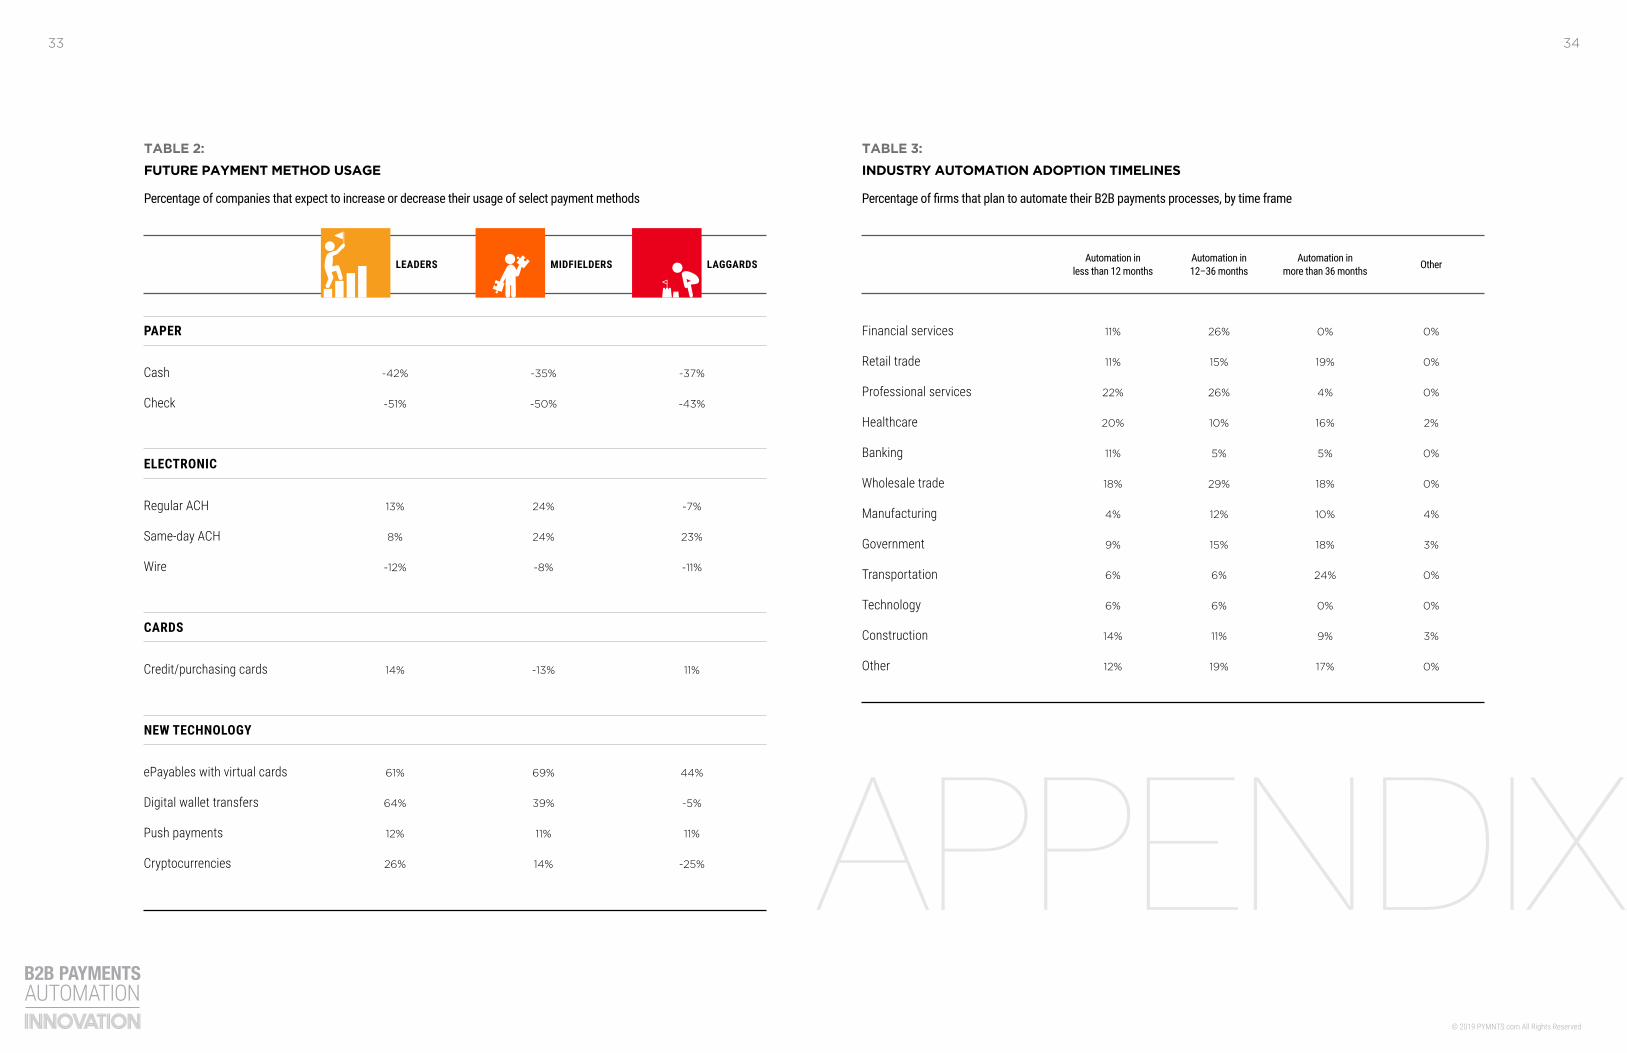
For Leaders, invoice processing goes hand in hand with how they’re remitted. Nearly 45 percent intend to increase their ePayables usage, compared to 25 percent of Laggards. On the other hand, Leaders are also looking to reduce their reliance on paper checks. More than 47 percent of them intend to use checks less, compared to 19 percent of Laggards (see Appendix: Table 2).

1817
© 2019 PYMNTS.com All Rights Reserved
Breaking to the top: the view from the middle market
2019
© 2019 PYMNTS.com All Rights Reserved
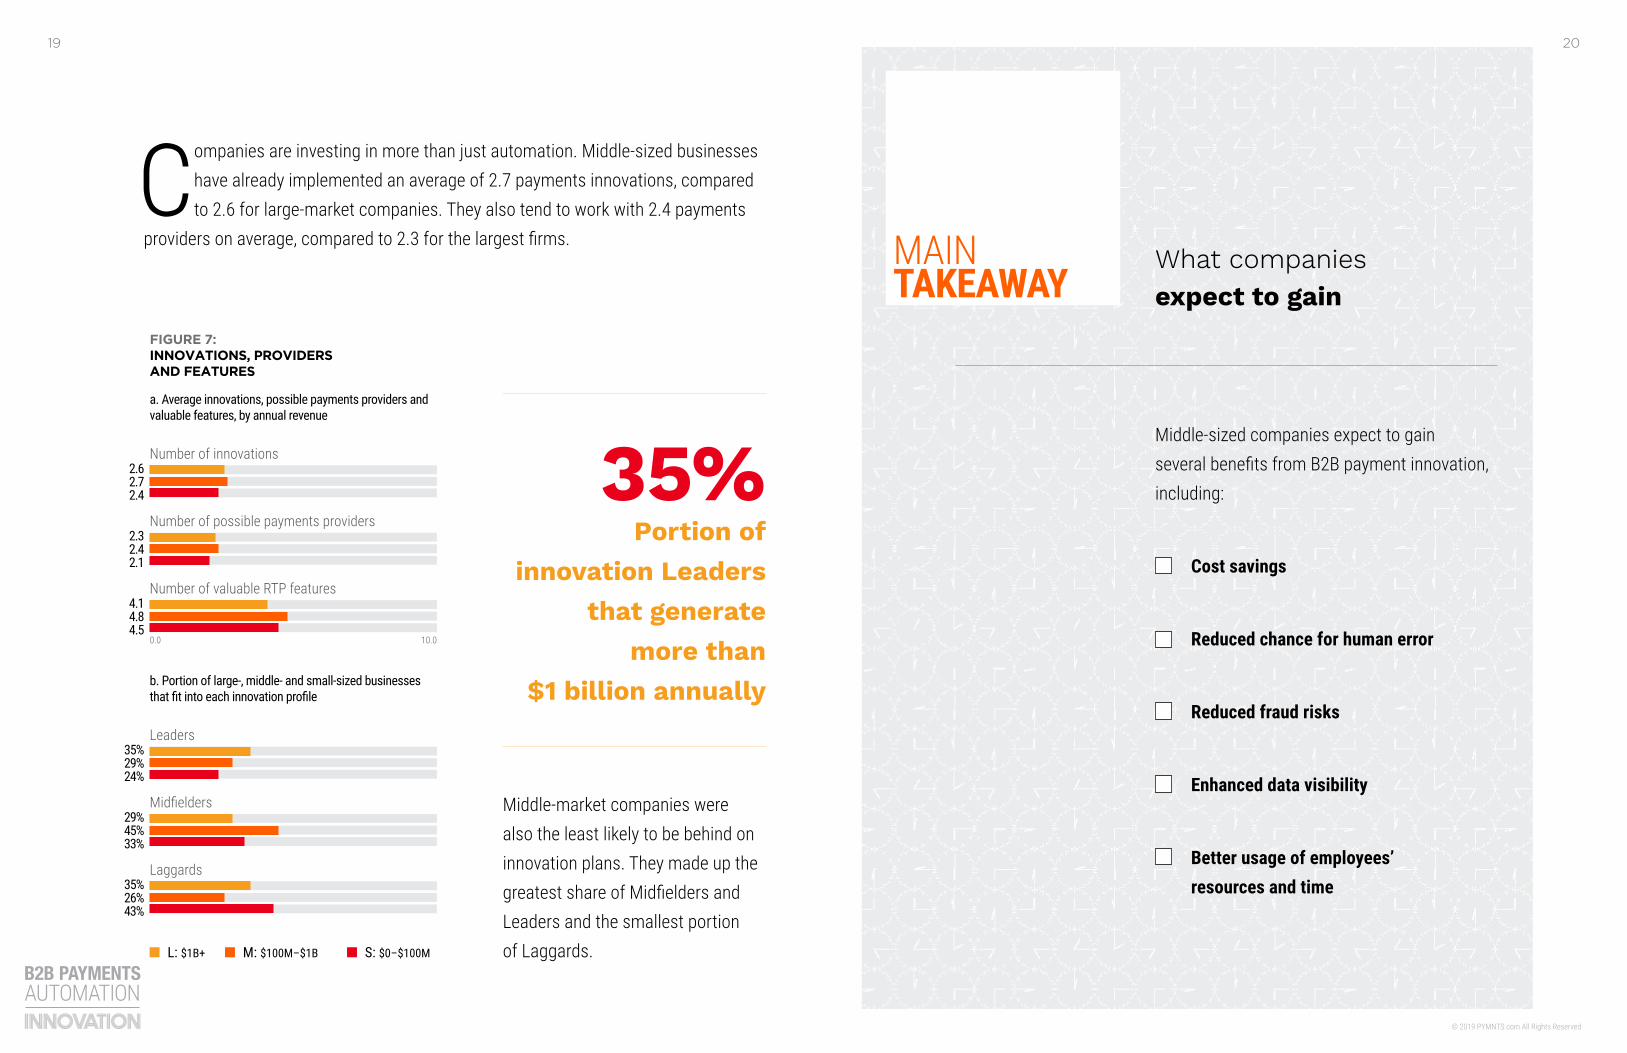
Companies are investing in more than just automation. Middle-sized businesses have already implemented an average of 2.7 payments innovations, compared to 2.6 for large-market companies. They also tend to work with 2.4 payments
providers on average, compared to 2.3 for the largest firms.
M: $100M–$1B S: $0–$100ML: $1B+
6000000000
6000000000
5300000000
5300000000
4500000000
4500000000
2800000000
2800000000
2000000000
2000000000
3300000000
3300000000
1700000000
1700000000
1700000000
1700000000
1500000000
1500000000
Number of innovations
Leaders
Number of possible payments providers
Midfielders
Number of valuable RTP features
0.0 10.0
Laggards
2.62.72.4
35%29%24%
2.32.42.1
29%45%33%
4.14.84.5
35%26%43%
FIGURE 7: INNOVATIONS, PROVIDERS AND FEATURES
a. Average innovations, possible payments providers and valuable features, by annual revenue
b. Portion of large-, middle- and small-sized businesses that fit into each innovation profile
MAIN TAKEAWAY
Middle-sized companies expect to gain several benefits from B2B payment innovation, including:
Cost savings
Reduced chance for human error
Reduced fraud risks
Enhanced data visibility
Better usage of employees’ resources and time
What companies expect to gain
35%Portion of
innovation Leaders that generate
more than $1 billion annually
Middle-market companies were also the least likely to be behind on innovation plans. They made up the greatest share of Midfielders and Leaders and the smallest portion of Laggards.
2221
© 2019 PYMNTS.com All Rights Reserved
6000000000
6000000000
5300000000
5300000000
4500000000
2800000000
2800000000
2000000000
3300000000
3300000000
1700000000
1700000000
1700000000
1500000000
1500000000
Implemented payments automation
Automation in 12–36 months
Implementing payments automation
Automation in less than 12 months
No automation
35%31%27%
29%40%43%
24%21%11%
60%52%38%
11%8%
19%
FIGURE 9: COMPANIES’ IMPLEMENTATION RATES
Percentage of companies that have automated or plan to automate their payments operations, by annual revenue
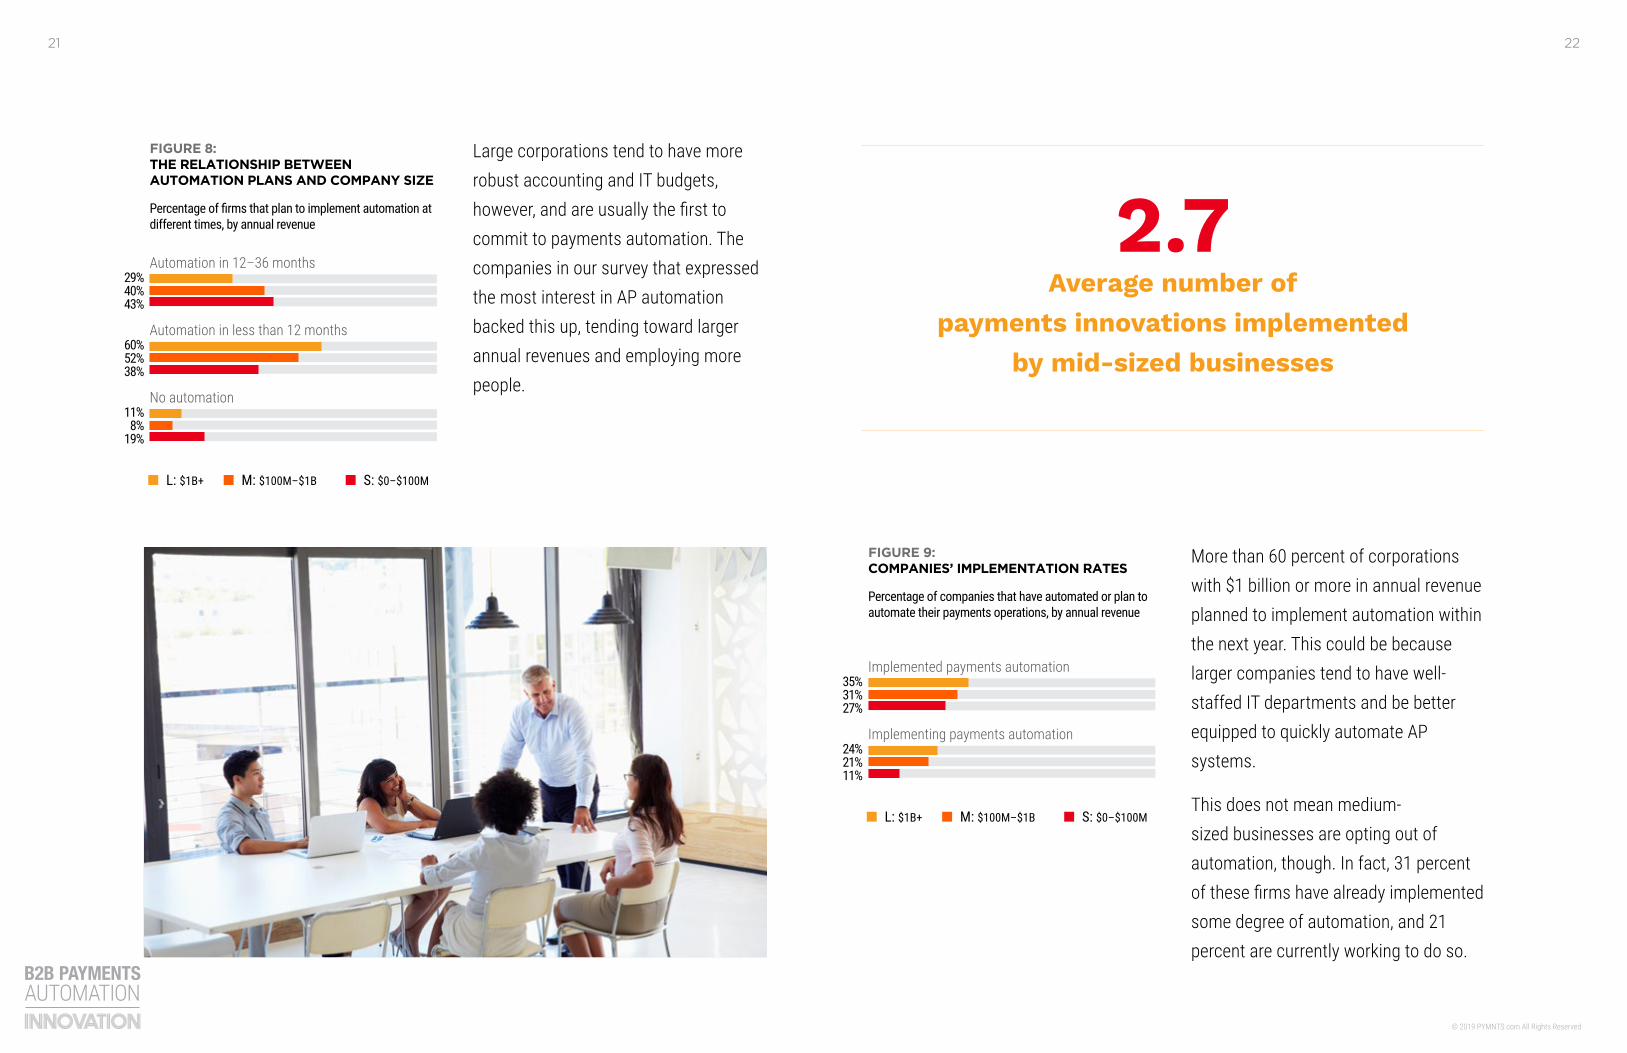
FIGURE 8: THE RELATIONSHIP BETWEEN AUTOMATION PLANS AND COMPANY SIZE
Percentage of firms that plan to implement automation at different times, by annual revenue
M: $100M–$1B S: $0–$100ML: $1B+
M: $100M–$1B S: $0–$100ML: $1B+
Large corporations tend to have more robust accounting and IT budgets, however, and are usually the first to commit to payments automation. The companies in our survey that expressed the most interest in AP automation backed this up, tending toward larger annual revenues and employing more people.
2.7Average number of
payments innovations implemented by mid-sized businesses
More than 60 percent of corporations with $1 billion or more in annual revenue planned to implement automation within the next year. This could be because larger companies tend to have well-staffed IT departments and be better equipped to quickly automate AP systems.
This does not mean medium-sized businesses are opting out of automation, though. In fact, 31 percent of these firms have already implemented some degree of automation, and 21 percent are currently working to do so.

2423
© 2019 PYMNTS.com All Rights Reserved
Automation and industry
2625
© 2019 PYMNTS.com All Rights Reserved
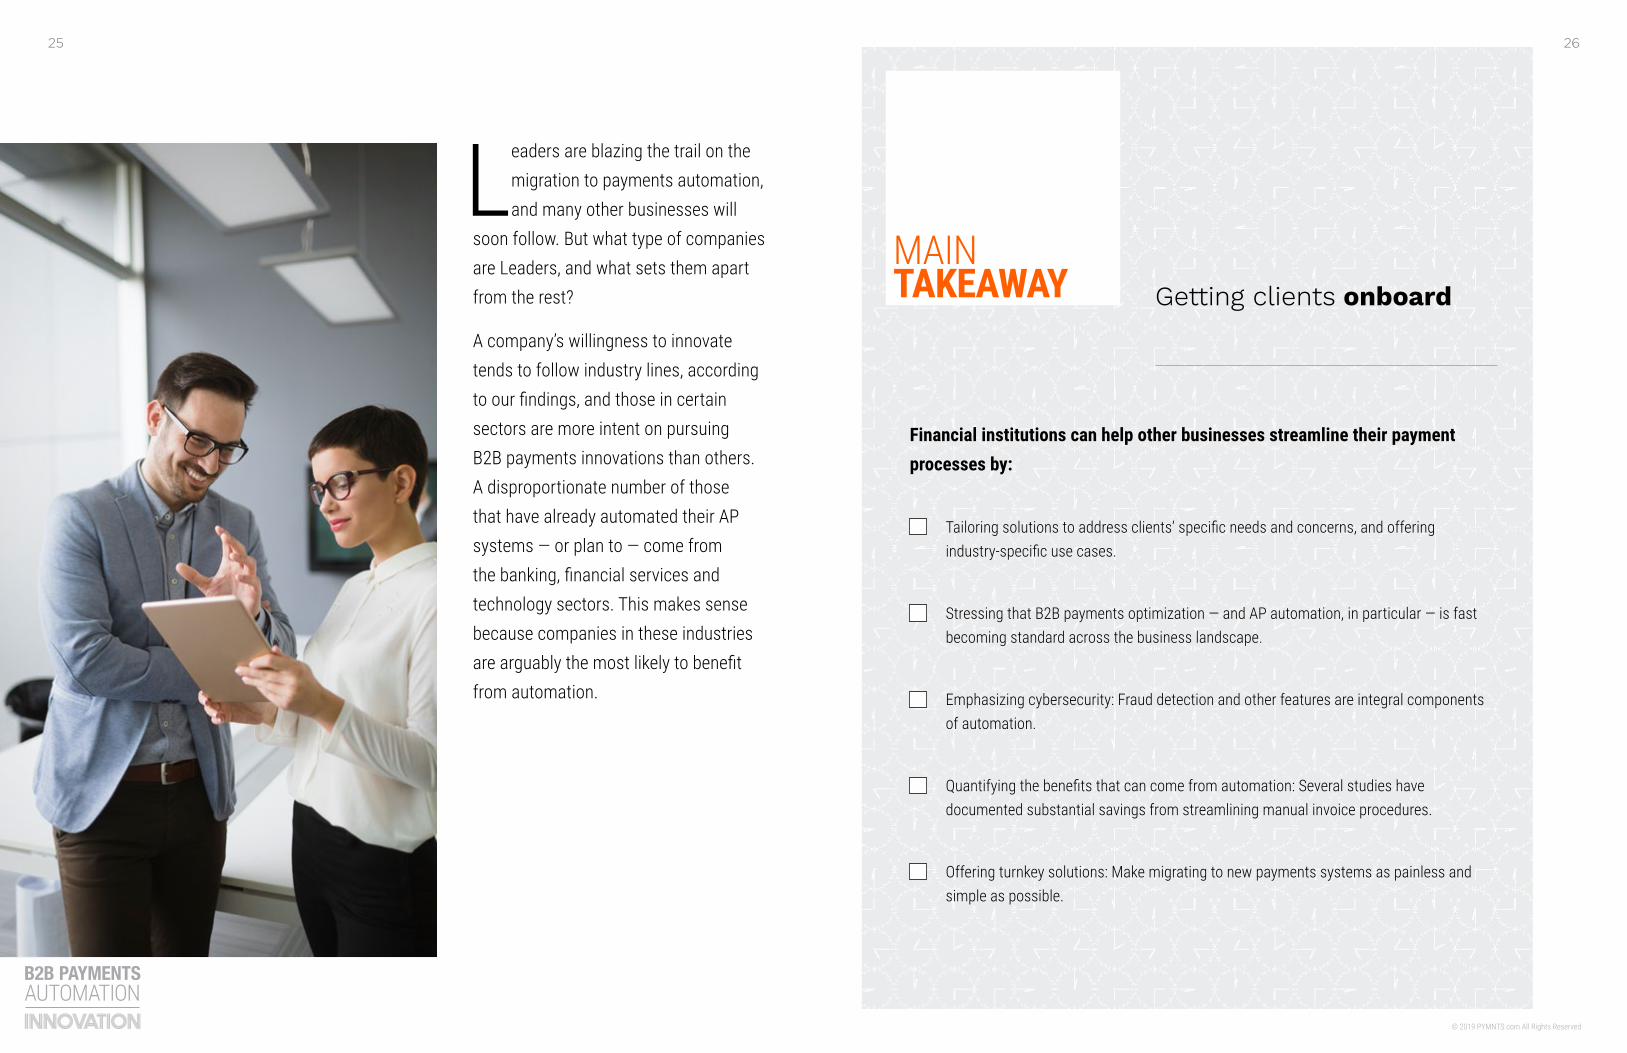
Leaders are blazing the trail on the migration to payments automation, and many other businesses will
soon follow. But what type of companies are Leaders, and what sets them apart from the rest?
A company’s willingness to innovate tends to follow industry lines, according to our findings, and those in certain sectors are more intent on pursuing B2B payments innovations than others. A disproportionate number of those that have already automated their AP systems — or plan to — come from the banking, financial services and technology sectors. This makes sense because companies in these industries are arguably the most likely to benefit from automation.
MAIN TAKEAWAY
Financial institutions can help other businesses streamline their payment processes by:
Tailoring solutions to address clients’ specific needs and concerns, and offering industry-specific use cases.
Stressing that B2B payments optimization — and AP automation, in particular — is fast becoming standard across the business landscape.
Emphasizing cybersecurity: Fraud detection and other features are integral components of automation.
Quantifying the benefits that can come from automation: Several studies have documented substantial savings from streamlining manual invoice procedures.
Offering turnkey solutions: Make migrating to new payments systems as painless and simple as possible.
Getting clients onboard
2827
© 2019 PYMNTS.com All Rights Reserved
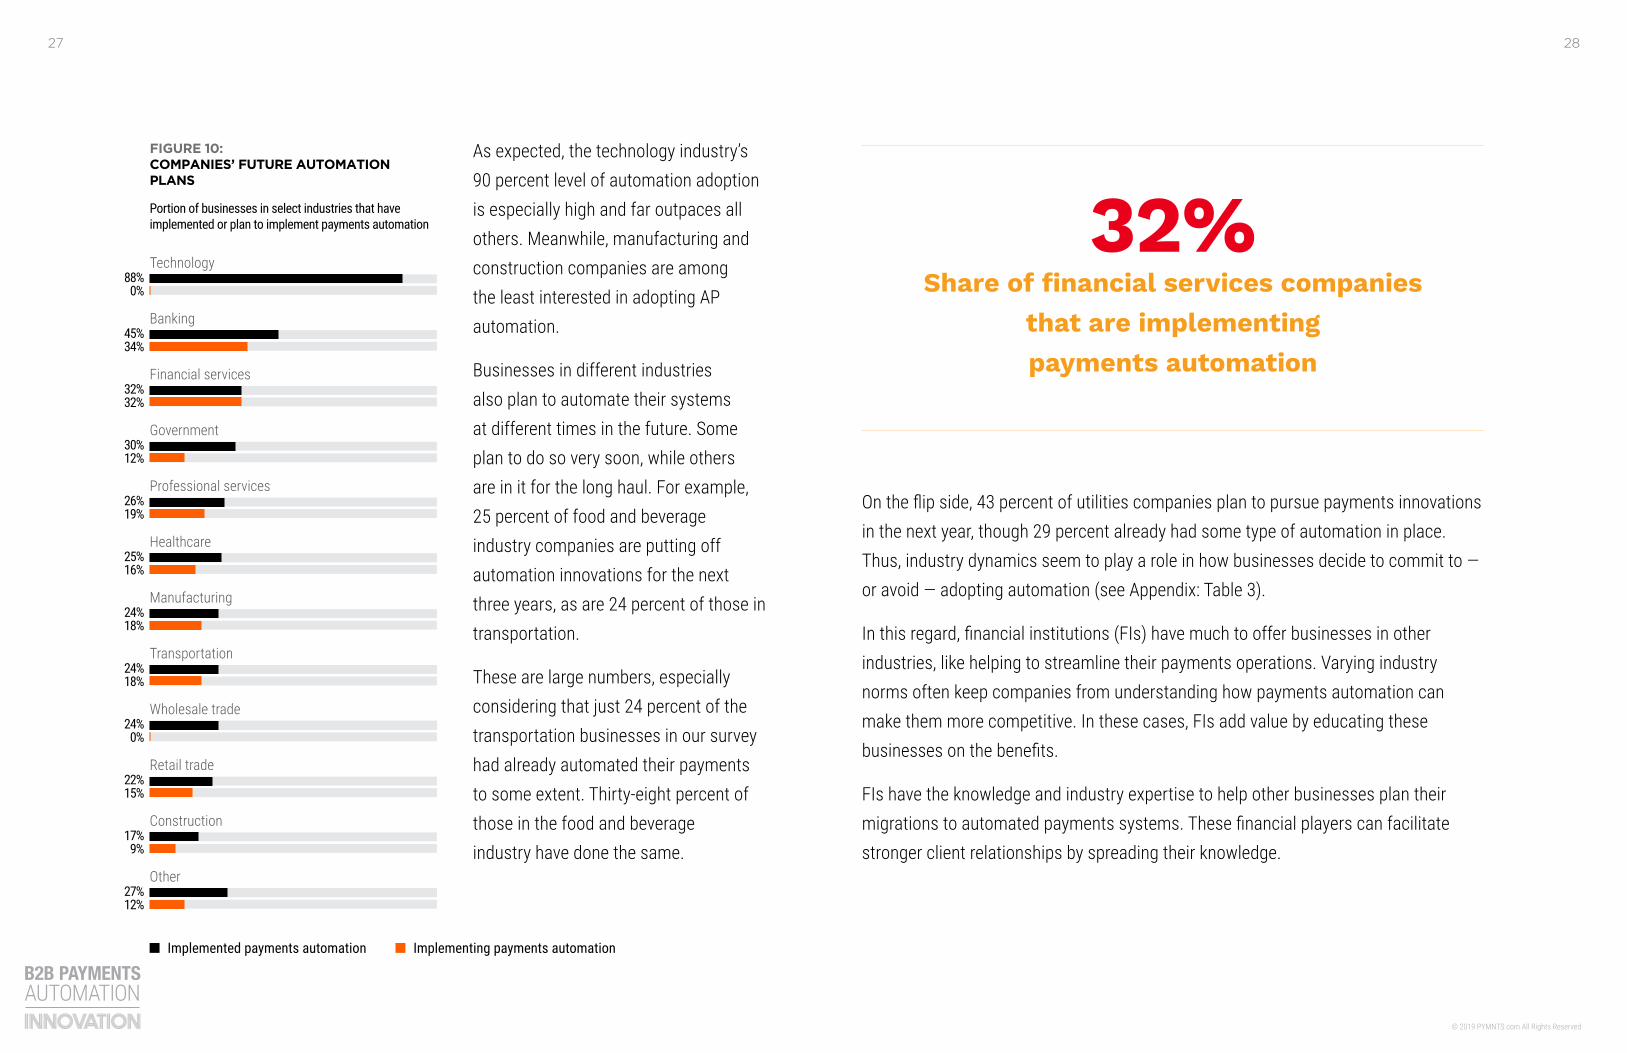
As expected, the technology industry’s 90 percent level of automation adoption is especially high and far outpaces all others. Meanwhile, manufacturing and construction companies are among the least interested in adopting AP automation.
Businesses in different industries also plan to automate their systems at different times in the future. Some plan to do so very soon, while others are in it for the long haul. For example, 25 percent of food and beverage industry companies are putting off automation innovations for the next three years, as are 24 percent of those in transportation.
These are large numbers, especially considering that just 24 percent of the transportation businesses in our survey had already automated their payments to some extent. Thirty-eight percent of those in the food and beverage industry have done the same.
6000000000
1700000000
Banking45%34%
6000000000
1700000000
Manufacturing24%18%
5300000000
1500000000
Construction17%9%
5300000000
1500000000
Professional services26%19%
4500000000
1700000000
Financial services32%32%
4500000000
1700000000
Retail trade22%15%
5400000000
1100000000
Government30%12%
5400000000
1100000000
Technology88%0%
4000000000
0800000000
Healthcare25%16%
4000000000
0800000000
Transportation24%18%
3600000000
1200000000
Wholesale trade24%0%
FIGURE 10: COMPANIES’ FUTURE AUTOMATION PLANS
Portion of businesses in select industries that have implemented or plan to implement payments automation
3600000000
1200000000
27%12%
Other
Implemented payments automation Implementing payments automation
On the flip side, 43 percent of utilities companies plan to pursue payments innovations in the next year, though 29 percent already had some type of automation in place. Thus, industry dynamics seem to play a role in how businesses decide to commit to — or avoid — adopting automation (see Appendix: Table 3).
In this regard, financial institutions (FIs) have much to offer businesses in other industries, like helping to streamline their payments operations. Varying industry norms often keep companies from understanding how payments automation can make them more competitive. In these cases, FIs add value by educating these businesses on the benefits.
FIs have the knowledge and industry expertise to help other businesses plan their migrations to automated payments systems. These financial players can facilitate stronger client relationships by spreading their knowledge.
32%Share of financial services companies
that are implementing payments automation
3029
© 2019 PYMNTS.com All Rights Reserved
CONCLUSION
Of all the recent innovations in B2B payments, none appears to be making real-world progress like
AP automation. More than one-quarter of companies have already implemented some form of it so far, and 85 percent plan to pursue additional or new features soon. This makes automation the most popular B2B payments innovation market.
More interesting is that middle-sized companies are taking an active role in pursuing payments innovation to maintain their competitive edge. These businesses remain at the forefront of B2B payments innovation, meaning others would do well to rethink their notions of innovation. By focusing on
leading practices and investments, other businesses can make informed decisions about whether payments innovations can benefit them.
Now, more than ever, financial services firms are being called to act as facilitators in this environment. They know better than most that money is being left on the table with so many businesses resisting payments innovation. It is up to them to help others come to terms with one reality: that adoption of AP automation and other B2B payment innovations is proceeding rapidly. All companies are left with a simple choice, then: Innovate or be left behind.
3231
© 2019 PYMNTS.com All Rights Reserved
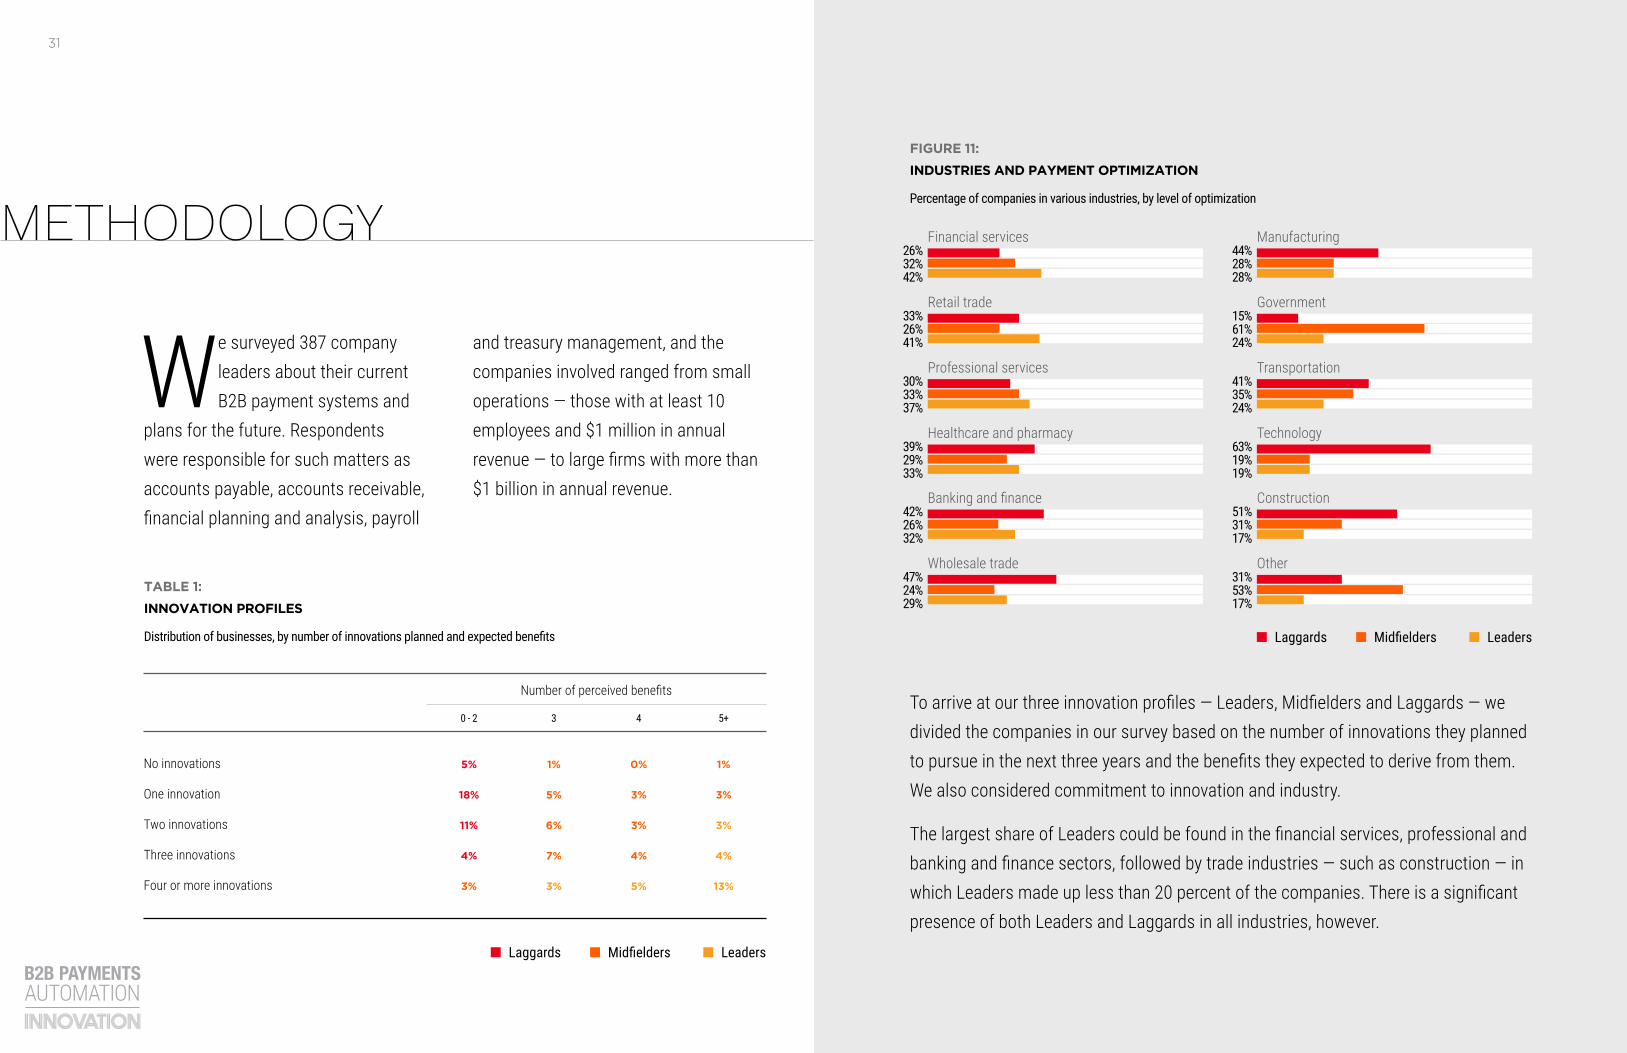
To arrive at our three innovation profiles — Leaders, Midfielders and Laggards — we divided the companies in our survey based on the number of innovations they planned to pursue in the next three years and the benefits they expected to derive from them. We also considered commitment to innovation and industry.
The largest share of Leaders could be found in the financial services, professional and banking and finance sectors, followed by trade industries — such as construction — in which Leaders made up less than 20 percent of the companies. There is a significant presence of both Leaders and Laggards in all industries, however.
We surveyed 387 company leaders about their current B2B payment systems and
plans for the future. Respondents were responsible for such matters as accounts payable, accounts receivable, financial planning and analysis, payroll
and treasury management, and the companies involved ranged from small operations — those with at least 10 employees and $1 million in annual revenue — to large firms with more than $1 billion in annual revenue.
METHODOLOGY
Midfielders LeadersLaggards
TechnologyHealthcare and pharmacy
OtherWholesale trade
ConstructionBanking and finance
63%19%19%
39%29%33%
31%53%17%
47%24%29%
51%31%17%
42%26%32%
ManufacturingFinancial services44%28%28%
26%32%42%
TransportationProfessional services41%35%24%
30%33%37%
GovernmentRetail trade15%61%24%
33%26%41%
FIGURE 11:
INDUSTRIES AND PAYMENT OPTIMIZATION
Percentage of companies in various industries, by level of optimization
TABLE 1:
INNOVATION PROFILES
Distribution of businesses, by number of innovations planned and expected benefits
3 5+4
Number of perceived benefits
0 - 2
No innovations
One innovation
Two innovations
Three innovations
Four or more innovations
1%
5%
6%
7%
3%
1%
3%
3%
4%
13%
0%
3%
3%
4%
5%
5%
18%
11%
4%
3%
Midfielders LeadersLaggards
3433
© 2019 PYMNTS.com All Rights Reserved
APPENDIX
TABLE 2:
FUTURE PAYMENT METHOD USAGE
Percentage of companies that expect to increase or decrease their usage of select payment methods
TABLE 3:
INDUSTRY AUTOMATION ADOPTION TIMELINES
Percentage of firms that plan to automate their B2B payments processes, by time frame
Automation in 12–36 months OtherAutomation in
more than 36 monthsAutomation in
less than 12 months
PAPER
Cash
Check
ELECTRONIC
Regular ACH
Same-day ACH
Wire
CARDS
Credit/purchasing cards
NEW TECHNOLOGY
ePayables with virtual cards
Digital wallet transfers
Push payments
Cryptocurrencies
Financial services
Retail trade
Professional services
Healthcare
Banking
Wholesale trade
Manufacturing
Government
Transportation
Technology
Construction
Other
-42%
-51%
13%
8%
-12%
14%
61%
64%
12%
26%
26%
15%
26%
10%
5%
29%
12%
15%
6%
6%
11%
19%
-37%
-43%
-7%
23%
-11%
11%
44%
-5%
11%
-25%
0%
0%
0%
2%
0%
0%
4%
3%
0%
0%
3%
0%
-35%
-50%
24%
24%
-8%
-13%
69%
39%
11%
14%
0%
19%
4%
16%
5%
18%
10%
18%
24%
0%
9%
17%
11%
11%
22%
20%
11%
18%
4%
9%
6%
6%
14%
12%
LEADERS MIDFIELDERS LAGGARDS
3635
© 2019 PYMNTS.com All Rights Reserved
The B2B Payments Automation Innovation Playbook, in collaboration with Mastercard, may be updated periodically. While reasonable efforts are made to keep the content accurate and up to date, PYMNTS.COM: MAKES NO REPRESENTATIONS OR WARRANTIES OF ANY KIND, EXPRESS OR IMPLIED, REGARDING THE CORRECTNESS, ACCURACY, COMPLETENESS, ADEQUACY, OR RELIABILITY OF OR THE USE OF OR RESULTS THAT MAY BE GENERATED FROM THE USE OF THE INFORMATION OR THAT THE CONTENT WILL SATISFY YOUR REQUIREMENTS OR EXPECTATIONS. THE CONTENT IS PROVIDED “AS IS” AND ON AN “AS AVAILABLE” BASIS. YOU EXPRESSLY AGREE THAT YOUR USE OF THE CONTENT IS AT YOUR SOLE RISK. PYMNTS.COM SHALL HAVE NO LIABILITY FOR ANY INTERRUPTIONS IN THE CONTENT THAT IS PROVIDED AND DISCLAIMS ALL WARRANTIES WITH REGARD TO THE CONTENT, INCLUDING THE IMPLIED WARRANTIES OF MERCHANTABILITY AND FITNESS FOR A PARTICULAR PURPOSE, AND NON-INFRINGEMENT AND TITLE. SOME JURISDICTIONS DO NOT ALLOW THE EXCLUSION OF CERTAIN WARRANTIES, AND, IN SUCH CASES, THE STATED EXCLUSIONS DO NOT APPLY. PYMNTS.COM RESERVES THE RIGHT AND SHOULD NOT BE LIABLE SHOULD IT EXERCISE ITS RIGHT TO MODIFY, INTERRUPT, OR DISCONTINUE THE AVAILABILITY OF THE CONTENT OR ANY COMPONENT OF IT WITH OR WITHOUT NOTICE.
PYMNTS.COM SHALL NOT BE LIABLE FOR ANY DAMAGES WHATSOEVER, AND, IN PARTICULAR, SHALL NOT BE LIABLE FOR ANY SPECIAL, INDIRECT, CONSEQUENTIAL, OR INCIDENTAL DAMAGES, OR DAMAGES FOR LOST PROFITS, LOSS OF REVENUE, OR LOSS OF USE, ARISING OUT OF OR RELATED TO THE CONTENT, WHETHER SUCH DAMAGES ARISE IN CONTRACT, NEGLIGENCE, TORT, UNDER STATUTE, IN EQUITY, AT LAW, OR OTHERWISE, EVEN IF PYMNTS.COM HAS BEEN ADVISED OF THE POSSIBILITY OF SUCH DAMAGES.
SOME JURISDICTIONS DO NOT ALLOW FOR THE LIMITATION OR EXCLUSION OF LIABILITY FOR INCIDENTAL OR CONSEQUENTIAL DAMAGES, AND IN SUCH CASES SOME OF THE ABOVE LIMITATIONS DO NOT APPLY. THE ABOVE DISCLAIMERS AND LIMITATIONS ARE PROVIDED BY PYMNTS.COM AND ITS PARENTS, AFFILIATED AND RELATED COMPANIES, CONTRACTORS, AND SPONSORS, AND EACH OF ITS RESPECTIVE DIRECTORS, OFFICERS, MEMBERS, EMPLOYEES, AGENTS, CONTENT COMPONENT PROVIDERS, LICENSORS, AND ADVISERS.
Components of the content original to and the compilation produced by PYMNTS.COM is the property of PYMNTS.COM and cannot be reproduced without its prior written permission.
DISCLAIMER
PYMNTS.com is where the best minds and the best content meet on the web to learn about “What’s Next” in payments and commerce. Our interactive platform is reinventing the way in which companies in payments share relevant information about the initiatives that shape the future of this dynamic sector and make news. Our data and analytics team includes economists, data scientists and industry analysts who work with companies to measure and quantify the innovation that is at the cutting edge of this new world.
Mastercard is a technology company in the global payments industry. Its global payments processing network connects consumers, financial institutions, merchants, governments and businesses in more than 210 countries and territories. The company’s products and solutions make everyday commerce activities — such as shopping, traveling, running a business and managing finances — easier, more secure and more efficient for everyone. Visit www.mastercard.com/businesspayments for more information.
Mastercard and its circle design are registered trademarks of Mastercard International Incorporated.
ABOUT