Embed Size (px)
Citation preview
1
Plausibility of Earth Once Having a Thick Atmosphere – Examining the Rate
of Impact Cratering
Raymond H.V. Gallucci, PhD, PE
8956 Amelung St., Frederick, MD 21704 ([email protected], [email protected])
Abstract
Theories abound as to how dinosaurs and other prehistoric creatures could have grown to such
immense sizes, inconsistent with the spectrum of sizes for today’s creatures and Earth’s living
conditions. Some focus directly on changes in the governing physics of the universe, such as a
different gravitational constant. Some postulate that, rather than this difference, the earlier Earth
experienced lower gravity due to differences in its size and mass. The majority focus on biological
and aerodynamical anomalies that may have prevailed to explain these gargantuan sizes. This paper
focuses on the latter group, offering an independent means by which to test the hypothesis that a
(much) thicker atmosphere provided the buoyancy needed by these creatures to exist on land. This
means is astronomical, an examination of possible differences in the rate of impact cratering on
Earth due to atmospheric differences. With the Earth’s atmosphere allegedly experiencing eras of
much greater thickness than current, and alternating between these “thick” and “thin” atmospheric
eras, it is postulated that, in addition to the biological and aerodynamical anomalies, a difference
in the cratering rate from meteor impacts on Earth should be evident. Thicker atmosphere would
“burn up” more meteors, reducing the cratering rate when compared to that during thinner
atmospheric eras. This paper explores this, using the cratering rate from meteor impacts on the
Moon as a “control” since it has no atmosphere to attenuate meteors but also is in Earth’s orbital
vicinity and should have experienced a nearly equivalent rate of meteor influx per unit surface area.
2
Key Words: Earth, Moon, Atmosphere, Volcanism, Carbon Dioxide, Dinosaurs, Meteors, Impact
Cratering
1. Introduction
Some dinosaurs (and other prehistoric “leviathans”) were inexplicably large, especially in light of
today’s spectrum of creature sizes. Various theories to “explain” how they could have functioned given
such sizes have been postulated. Some focus on postulates that the gravitational constant was lower, such
that Earth’s gravity would have been lower, or a varying size of the Earth may explain the paradox. Others
pursue biological arguments, with connections to aerodynamics, for an explanation. We will not consider
the first set, but rather focus on the second as being the more plausible. After reviewing the arguments for
the biological/aerodynamical postulates, we examine an independent means of ascertaining the plausibility
of these, both of which contend that Earth had a much thicker atmosphere in the past. For that independent
means, we select an astronomical approach, namely examination of possible differences in the cratering
rates due to meteor impacts on the Earth during “thicker” and “thinner” atmosphere eras, representing eras
of greater and lesser attenuation (“burn up”) of incoming meteors, thereby affecting the cratering rate per
unit surface area on Earth relative to what has been experienced on the geologically and climatologically
dead Moon. Since the Moon is in the same orbital neighborhood as the Earth, it should have experienced
the same meteor influx per unit surface area over the same eras.
Much of the material in Section 2, especially regarding dinosaur physiology, is provided only as
background to the thick atmosphere theories, i.e., this material is not necessarily used in the analysis for
cratering rates due to meteor impacts. The reader interested only in the latter may skip to the last paragraph
in Section 2.
2. Two Prominent Theories for Thick Earth Atmosphere
3
Two prominent theories supporting the proposition that Earth has previously experienced (much)
thicker atmospheric conditions are examined. Both focus on biological and aerodynamic arguments
regarding dinosaur and other prehistoric creatures having sizes incongruously large when viewed in terms
of how they could possibly exist today.
2.1. Levenspiel, Fitzgerald and Pettit
In “Earth’s Atmosphere before the Age of Dinosaurs,” Levenspiel, Fitzgerald and Pettit state: [1]
… [T]he giant flying creatures of the dinosaur age could only fly if the atmospheric pressure was much
higher than it is now: at least 3.7–5.0 bar. If this is so, it raises several interesting questions. For example,
how did the atmosphere get to that pressure 100–65 million years ago (Mya)? What was the pressure before
that? And how did it drop down to today’s 1 bar? Although we have no definite answers to these questions,
let us put forth reasonable possible explanations.
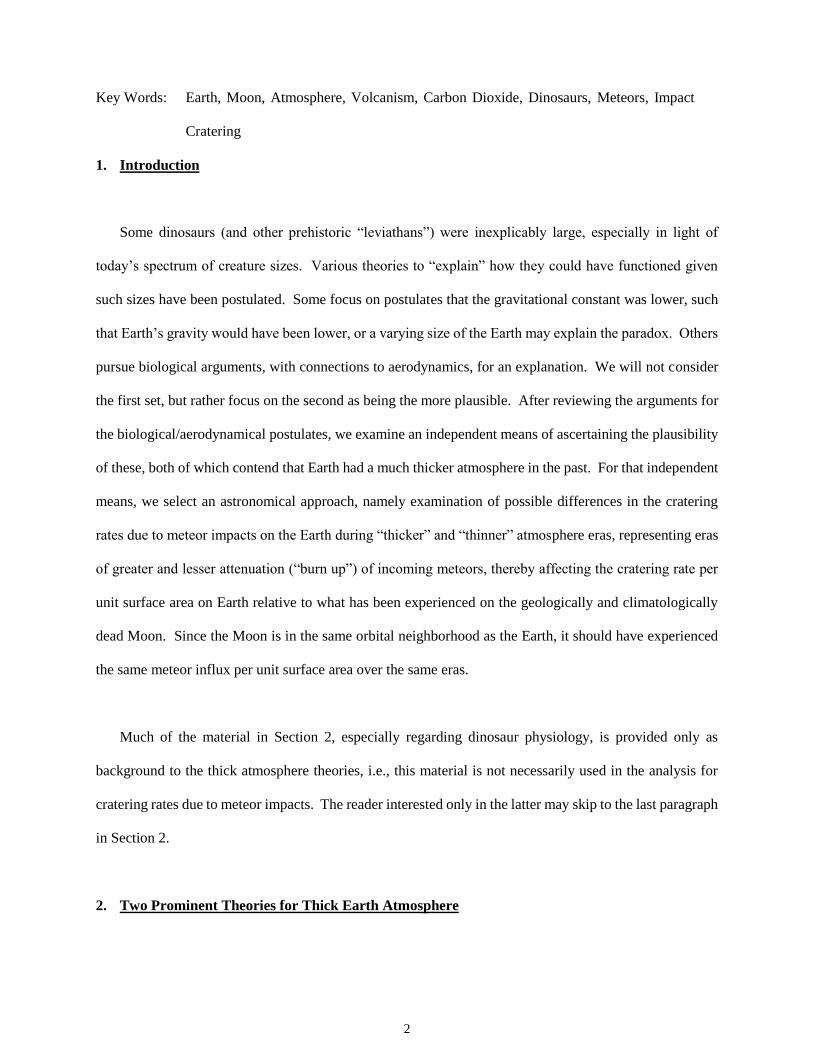
What was the air pressure for the
97% of Earth’s life before the age of
dinosaurs? We have three possible
alternatives, as shown in Figure 1.1
The pressure could have been at 1
bar throughout Earth’s earlier life,
risen to 4–5 bar ~100 Mya (just at
the time when the giant fliers needed
it), and then returned to 1 bar (curve
A).
1 Figure 1, and the review of the thicker atmosphere theory of Levenspiel, Fitzgerald and Pettit are presented only
to show that there are multiple analysts presenting theories of prehistorically thicker atmospheres. It is not used
in the subsequent analysis, which focuses solely on Esker’s thicker atmosphere theory.
Figure 1. Three possible alternatives for the
atmospheric pressure early in Earth’s lifetime, given that it
was at ~5 bar, ~100 Mya.
4
The pressure could have been ~4–5 bar from Earth’s beginning, 4600 Mya; and ~65 Mya, it could have
begun to come down to today’s 1 bar (curve B).
The atmosphere could have started at higher pressure and then decreased continuously through Earth’s
life to ~4–5 bar ~100 Mya and down to 1 bar today (curve C).
The third alternative seems to be the most reasonable …Geologists believe that most of the carbon on the
young, hot Earth, >4000 Mya, was in the form of gaseous carbon dioxide, carbon monoxide, and methane.
With time, the CO and CH4 reacted with oxide minerals and were transformed into CO2. These reactions did
not change the total amount of carbon in the atmosphere.
Our sister planet and nearest neighbor, Venus, has an atmosphere of 90 bar pressure, consisting of 96%
CO2 (5). Why should Earth be so different? … [W]hy did Venus’s atmosphere remain at 90 bar while Earth’s
decreased to a few bar during the age of dinosaurs and then declined to the 1 bar it is today? What happened
to Earth’s CO2 and by what mechanism did it virtually disappear? ... Being thinner, Earth’s crust was fragile
and broke up under the action of the mantle’s convective forces. In contrast, Venus’s thicker crust remained
rigid and did not permit the mechanisms that removed the CO2 from its bound state. In addition, because
Venus is closer to the Sun and hotter than Earth, free liquid water cannot exist on it, whereas Earth has giant
oceans that cover two-thirds of the planet. The oceans played an important secondary role in removing CO2
from the atmosphere …
Today, vast deposits of sedimentary carbonate rocks are found on land and on ocean bottoms,
>1,000,000 km3 throughout Earth’s crust. Above the continents, the CO2 was taken up by rainwater and by
groundwater. This CO2-rich water reacted with rocks to form bicarbonates, followed by transport to the
ocean and precipitation as calcium and magnesium carbonates. In the ocean, dissolved CO2 combined with
the calcium hydroxide to form deposits of chalk, or it was taken up by coral, mollusks, and other living
creatures to form giant reefs. A study of the distribution through time of these deposits gives us clues to the
history of CO2 in the atmosphere …
With time, the concentration of CO2 steadily decreased, primarily because of the formation and
deposition of limestone and other carbonaceous materials. CO2 was also lost by photosynthesis followed by
the deposition of carbonaceous substances such as coal, petroleum, peat, oil shale, and tar sands; however,
this loss was quite minor. Calculations show that the deposit of what are now considered fuel reserves
lowered the atmospheric CO2 by <<1 bar. At the same time, the concentration of oxygen slowly rose. These
two changes, the decrease in CO2 and the rise in oxygen, thinned the forests and the dead material began to
5
be oxidized more rapidly, so that dense layers of dead organics were no longer deposited. Evidence of this
change in atmospheric conditions is that we cannot find any massive coal deposits younger than 65 million
years. Animal life found this changed atmosphere to its liking, so mammals and dinosaurs flourished, first as
very small creatures but then increasing in size as a result of evolutionary competition. This led to the giant
flying creatures close to the end of the dinosaur age. It could be that these creatures died out as the total
pressure of the atmosphere dropped below their sustainable level …
If we assume that Earth’s early atmosphere was very different, both in composition (mainly CO2) and
total pressure, that would answer some puzzling questions from a variety of disciplines.
How did the flying creatures from the age of dinosaurs have enough energy to fly when physiology,
biology, and aeronautics say that this was impossible?
How could life have developed on Earth when astronomy says that Earth was too cold to sustain life?
If Earth’s atmosphere had stayed at ~1 bar throughout its history, where did the equivalent of 50–70
bar of CO2 in limestone and other carbonates on Earth’s surface come from?
This picture of high CO2 concentration and high pressure in the past also explains why most massive coal
seams are older than 65 million years and why most limestone caves are younger than 100 million years.
Although we do not know the values for the atmospheric pressure in those early times, and although each of
the arguments in this paper only leads to suggestions, when taken together, the evidence from these various
sources leads to the same conclusion: The atmospheric pressure was higher in the past than it is today and
consisted primarily of CO2. This hypothesis presents a picture of our evolving planet that should be examined
and that could have interesting consequences.
2.2. Esker
In a subsequent, more comprehensive look at this topic, “Scientific Theory Solving the Dinosaur Paradox and
Numerous Other Paradoxes Regarding Earth’s Evolution,” Esker states: [2]
… [T]he large dinosaurs and pterosaurs of the Mesozoic era present a scientific paradox. Four areas of
scientific incongruities regarding these animals’ large size are identified: 1) insufficient muscle strength, 2)
insufficient bone strength, 3) unacceptably high blood pressure within the tallest dinosaurs, and 4) the
6
paradox of pterosaurs having grossly insufficient power to fly in atmospheric conditions similar to the present
… [T]he development of airplanes has always been more of an art than a science. The absence of a theoretical
understanding of flight becomes most apparent when the paleontologists make their foolish attempts trying
to explain how the giant pterosaurs flew. Common sense tells everyone that a reptile the size of a horse
should not be capable of flight, but until now there has not been a theoretical understanding of flight enabling
us to scientifically clarify what is wrong with the paleontologists’ claim that there is nothing odd about
gigantic flying reptiles … The Thick Atmosphere Solution’s ability to solve the dinosaur paradox qualifies it
as being a strong hypothesis, but with additional evidence it can be shown that the Thick Atmosphere Solution
is actually a new scientific theory … [T]he Thick Atmosphere Theory solves the long-standing
paleoclimatologist puzzle of how the Mesozoic era Earth had the same pleasant climate over its entire surface
…
Just as the largest animals have the lowest relative bone strength, it is also true that the largest animals
have the lowest relative muscle strength. Absolute strength can be defined as how much weight an animal
can lift regardless of the animal’s own weight, and clearly the larger animals have greater absolute strength
than the smaller animals. But when we look at relative strength, the lifting ability of an animal relative to its
own weight, it is the smallest animals that have the greatest relative strength … For most physically fit human
beings we have more than enough relative strength so that getting out of bed in the morning is not outside
our physical capacity. But the larger animals that have lower relative strength lifting their body off the
ground can be a serious issue. Large farm animals such as cattle or horses exert all the strength that they
have when they pick themselves up off the ground. Likewise the large wild animals such as elephants and
giraffes need all their strength to perform this task that is not challenging for the smaller animals. As a
consequence of these difficulties, it is not surprising that many of these larger animals evolved the behavior
of sleeping while standing up. Yet numerous dinosaurs were much larger than these animals. Their greater
size would mean that their relative strength would be substantially less than that of the large animals of
today. It is not realistic to imagine that the large dinosaurs never fell or otherwise found themselves on the
ground throughout their entire lives. If a Jurassic Park was actually created, any sauropod or other large
dinosaur would be stuck lying on the ground much like a helpless whale stranded on a beach ...
The buoyancy force is best described by Archimedes' principle that states that when an object is partially
or fully submerged in a fluid, an upward buoyancy force lifts up on the submerged object that exactly equals
the weight of the fluid displaced. … [B]uoyancy … is what gives a lifting force to hot air balloons. The main
7
difference in the buoyancy effect provided by these two fluids [air vs. water] is the amount of fluid volume
that needs to be displaced to achieve flotation. For terrestrial vertebrates, it is the net force produced by
their weight that often limits their size. But this is not true for species that exist in the water. For the latter
species it is not their weight but rather other factors, such as the availability of food that might limit the size
of these species. Without the weight limitation some of these aquatic species grow to display gigantism. It is
the buoyancy of water that allows the whales, the largest animals of today, to grow so large … Without this
buoyancy to counteract gravity, the poor whale that finds itself stuck on a beach is soon having its bones
broken from its own weight. To produce an effective buoyancy force on dinosaurs the Earth's atmosphere
would have to be thick enough to have a density comparable to the density of water. By summing the forces
acting on a typical dinosaur such as a Brachiosaurus the density of the necessary atmosphere is calculated
… to be 670 kg/m3. This says that to produce the necessary buoyancy so that the dinosaurs could grow to
their exceptional size,2 the density of the Earth’s air near the Earth’s surface would need to be 2/3’s of the
density of water …
It may be hard to imagine that the Earth’s air could be so thick that its density would be comparable to
water. Nevertheless, there is no reason why a gas cannot be compressed so much that it has properties similar
to that of a liquid, and in fact compressing a gas into a liquid is a common industrial process … 150 million
years ago the Earth’s atmospheric pressure near the surface was about 370 atmospheres … 370 times thicker
than what it is today …[C]onsider the pressure that currently exist at the deepest depths of the oceans. The
average ocean depth is 3790 m and at this depth the pressure is 380 atmospheres. So for all practical
purposes, the present day pressure at the average depth of the ocean is the same as the pressure at the bottom
of the Mesozoic atmosphere. Yet there are numerous species that live at this depth and many more that live
much deeper. Extremely high absolute pressure has no ill effect on our present creatures of the deep that
have evolved in these environments; likewise, the extremely high pressure of the Mesozoic era had no ill
effect on the terrestrial species of the Mesozoic era … If both the inside and outside of an enclosed container
are at the same absolute pressure, no matter what the absolute pressure might be, there will be no net force
on the sides of the container …
2 Esker’s discussion makes it clear that the buoyancy provided by a thicker atmosphere benefitted not only flying
dinosaurs (pterosaurs) but also those that walked on land.
8
Within the Phanerozoic eon [current geologic eon … during which abundant animal and plant life has
existed – 541 million years to the present] we can identify two thick atmosphere eras and two thin atmosphere
eras … Twice during the Carboniferous and the Cretaceous/Paleogene periods, the atmosphere transitioned
from being extremely thick to being relatively thin … With a massive amount of CO2 being removed from the
atmosphere we would expect to see large carbon deposits during these times and indeed that is the case …
[T]he only time that the atmosphere transitioned from being relatively thin to being extremely thick was when
the earth was void of most life … around the time of the P-T [Permian-Triassic] mass extinctions and
continuing into the Triassic period …
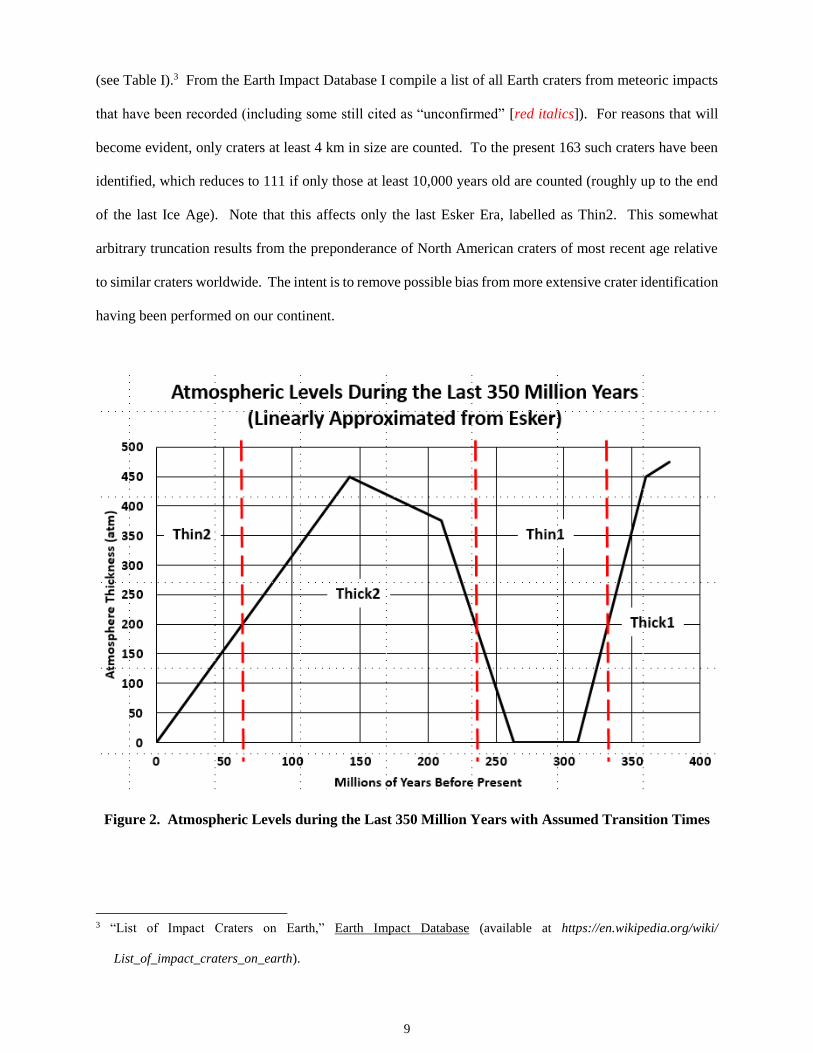
Figure 2 is a linearized approximation of Esker’s graph of “Atmospheric Levels during the Last 350
Million Years,” on which I have arbitrarily drawn transition times between the two Thick and Thin
Atmosphere Eras using an arbitrary transition atmosphere of 200 atm. Starting around 350 million years
ago with an atmospheric thickness of nearly 500 atm, he presents alternating periods of decreasing and
increasing atmospheric pressure up to today’s present “Thin” atmosphere, which I have assumed to be
“Thick” and “Thin” as shown in my approximation of Esker’s figure. This results in two Thin and Thick
Eras, as shown. They transition at approximately 340, 230 and 53 million years ago, with the Thick1 Era
assumed to begin 2.4 billion years ago, since this is the reported age of the oldest recorded Earth crater, the
16-km Suavjärvi crater in Asia (see Table I).
3. Thick Atmosphere Theory and Earth Cratering Rates
The previous discussions by Levenspiel, et al., and Esker supporting a Thick Atmosphere Theory focus
on mainly biological and aerodynamic arguments. After reading these discussions, I seek an independent
means by which to examine this theory at least for plausibility, as anything definitive is currently beyond
achieving. Reasoning that a thicker atmosphere should “burn up” more incoming meteors than a thinner
one, I examine the cratering rate for impacting meteors on the Earth, based on the Earth Impact Database
9
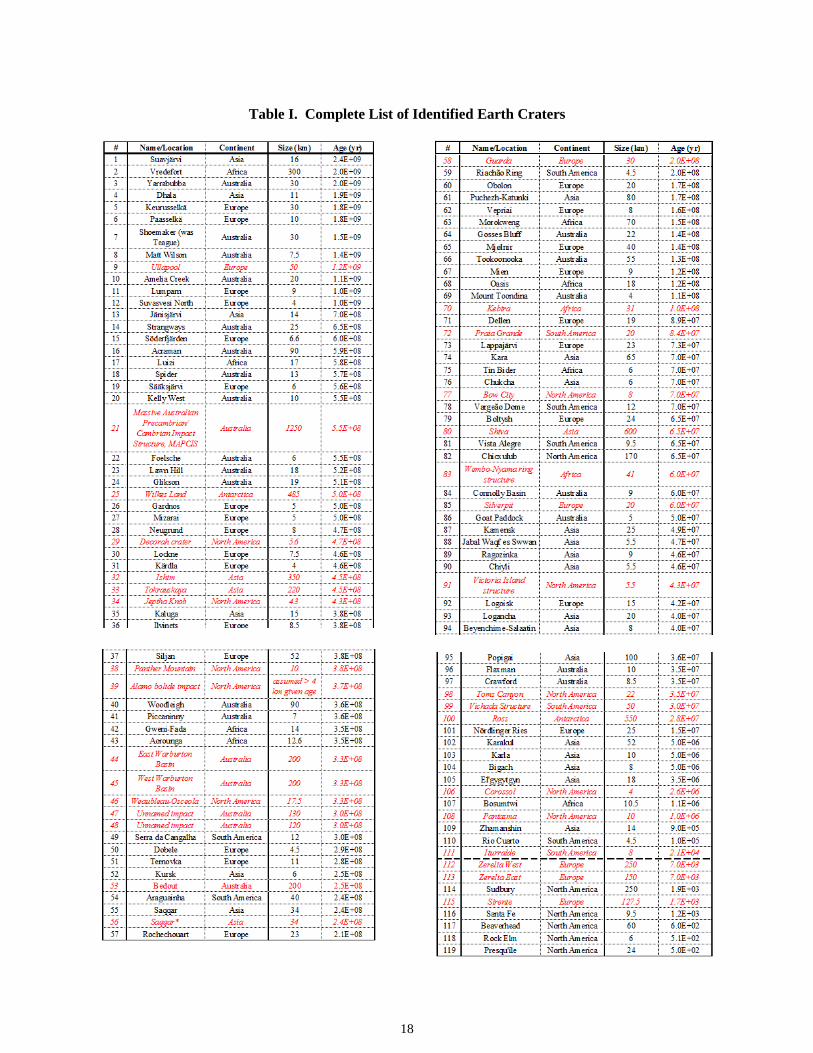
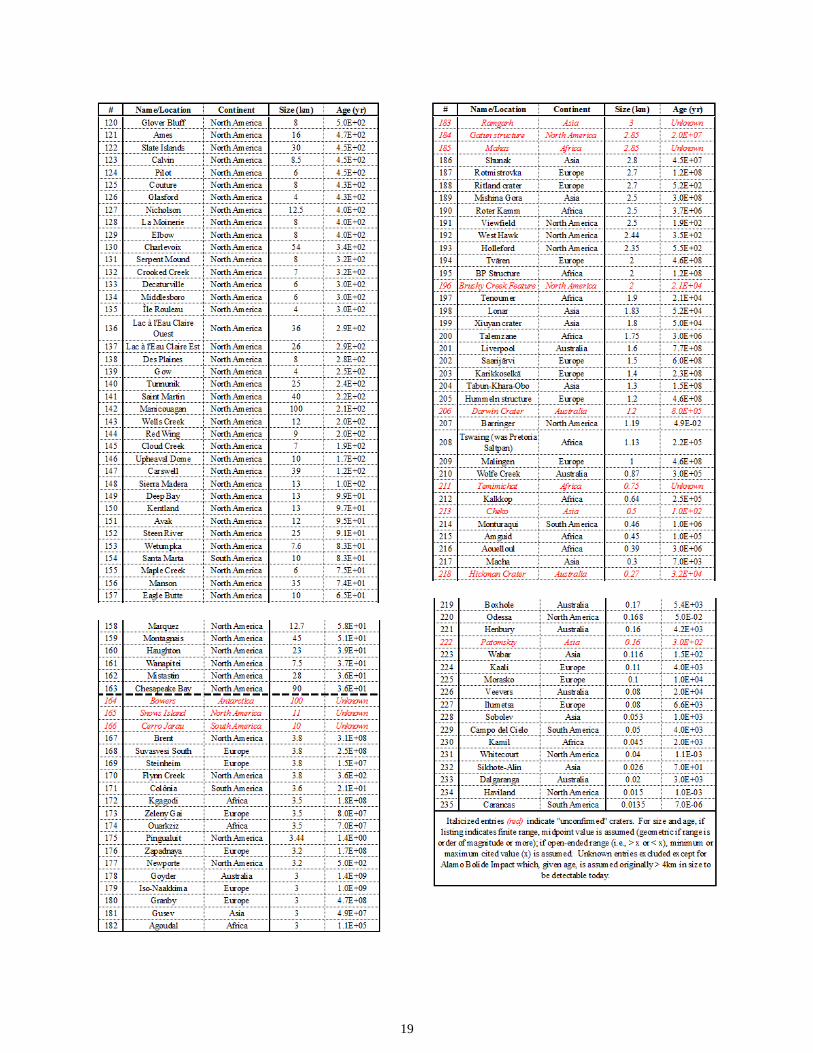
(see Table I).3 From the Earth Impact Database I compile a list of all Earth craters from meteoric impacts
that have been recorded (including some still cited as “unconfirmed” [red italics]). For reasons that will
become evident, only craters at least 4 km in size are counted. To the present 163 such craters have been
identified, which reduces to 111 if only those at least 10,000 years old are counted (roughly up to the end
of the last Ice Age). Note that this affects only the last Esker Era, labelled as Thin2. This somewhat
arbitrary truncation results from the preponderance of North American craters of most recent age relative
to similar craters worldwide. The intent is to remove possible bias from more extensive crater identification
having been performed on our continent.
Figure 2. Atmospheric Levels during the Last 350 Million Years with Assumed Transition Times
3 “List of Impact Craters on Earth,” Earth Impact Database (available at https://en.wikipedia.org/wiki/
List_of_impact_craters_on_earth).
10
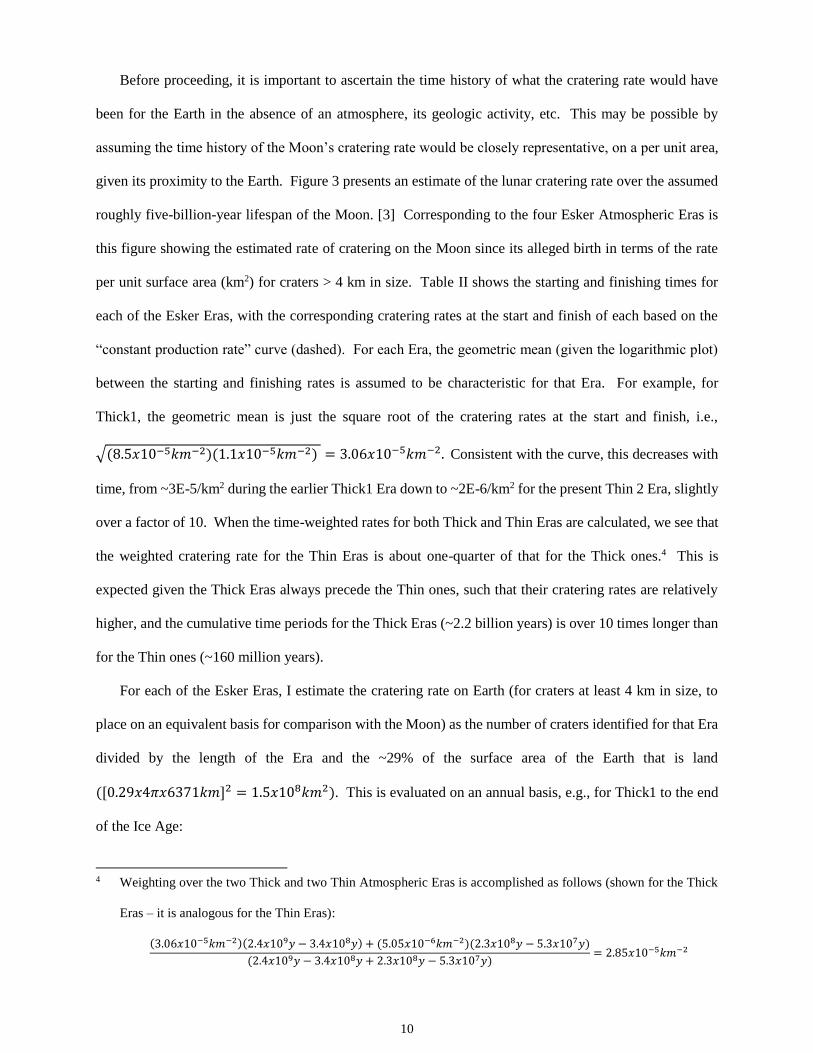
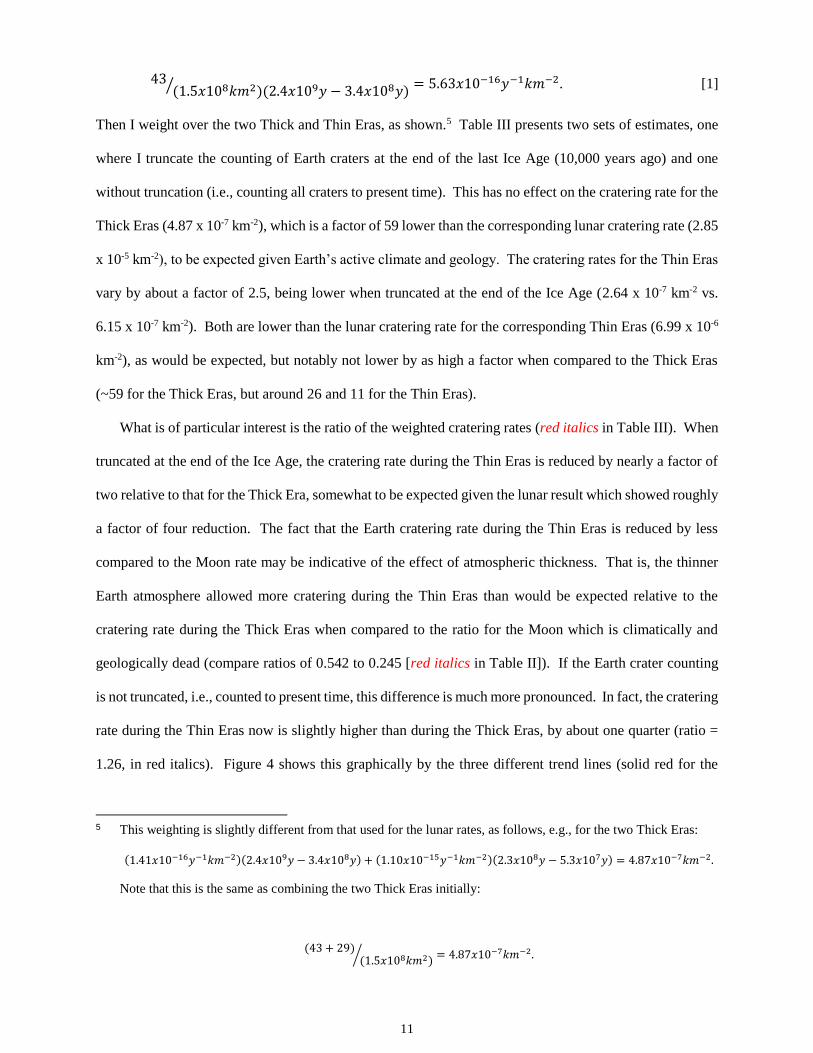
Before proceeding, it is important to ascertain the time history of what the cratering rate would have
been for the Earth in the absence of an atmosphere, its geologic activity, etc. This may be possible by
assuming the time history of the Moon’s cratering rate would be closely representative, on a per unit area,
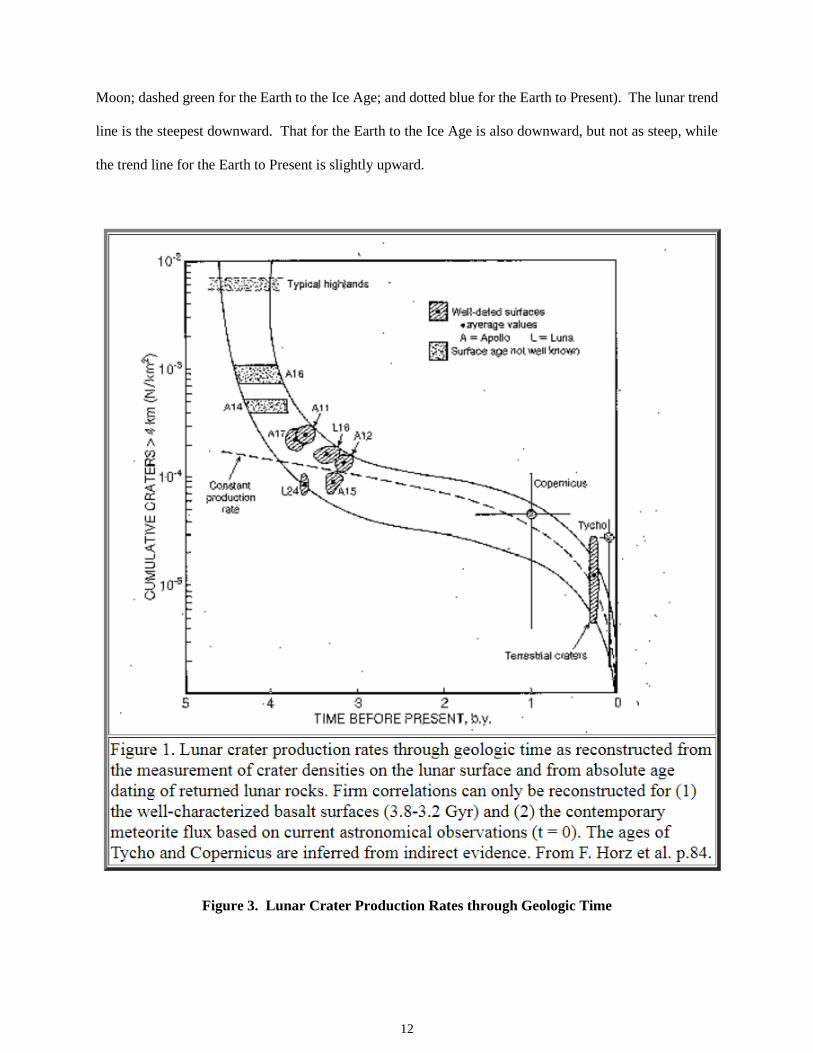
given its proximity to the Earth. Figure 3 presents an estimate of the lunar cratering rate over the assumed
roughly five-billion-year lifespan of the Moon. [3] Corresponding to the four Esker Atmospheric Eras is
this figure showing the estimated rate of cratering on the Moon since its alleged birth in terms of the rate
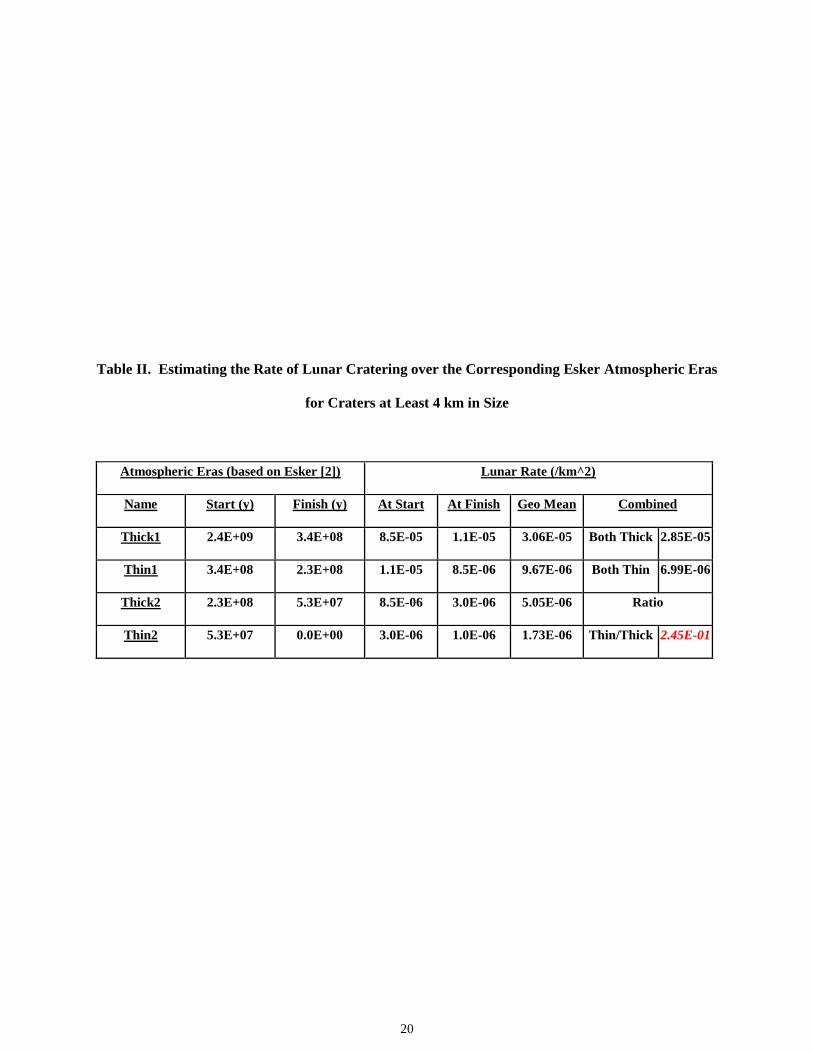
per unit surface area (km2) for craters > 4 km in size. Table II shows the starting and finishing times for
each of the Esker Eras, with the corresponding cratering rates at the start and finish of each based on the
“constant production rate” curve (dashed). For each Era, the geometric mean (given the logarithmic plot)
between the starting and finishing rates is assumed to be characteristic for that Era. For example, for
Thick1, the geometric mean is just the square root of the cratering rates at the start and finish, i.e.,
√(8.5𝑥10−5𝑘𝑚−2)(1.1𝑥10−5𝑘𝑚−2) = 3.06𝑥10−5𝑘𝑚−2. Consistent with the curve, this decreases with
time, from ~3E-5/km2 during the earlier Thick1 Era down to ~2E-6/km2 for the present Thin 2 Era, slightly
over a factor of 10. When the time-weighted rates for both Thick and Thin Eras are calculated, we see that
the weighted cratering rate for the Thin Eras is about one-quarter of that for the Thick ones.4 This is
expected given the Thick Eras always precede the Thin ones, such that their cratering rates are relatively
higher, and the cumulative time periods for the Thick Eras (~2.2 billion years) is over 10 times longer than
for the Thin ones (~160 million years).
For each of the Esker Eras, I estimate the cratering rate on Earth (for craters at least 4 km in size, to
place on an equivalent basis for comparison with the Moon) as the number of craters identified for that Era
divided by the length of the Era and the ~29% of the surface area of the Earth that is land
([0.29𝑥4𝜋𝑥6371𝑘𝑚]2 = 1.5𝑥108𝑘𝑚2). This is evaluated on an annual basis, e.g., for Thick1 to the end
of the Ice Age:
4 Weighting over the two Thick and two Thin Atmospheric Eras is accomplished as follows (shown for the Thick
Eras – it is analogous for the Thin Eras):
(3.06𝑥10−5𝑘𝑚−2)(2.4𝑥109𝑦 − 3.4𝑥108𝑦) + (5.05𝑥10−6𝑘𝑚−2)(2.3𝑥108𝑦 − 5.3𝑥107𝑦)
(2.4𝑥109𝑦 − 3.4𝑥108𝑦 + 2.3𝑥108𝑦 − 5.3𝑥107𝑦)= 2.85𝑥10−5𝑘𝑚−2
11
43(1.5𝑥108𝑘𝑚2)(2.4𝑥109𝑦 − 3.4𝑥108𝑦)⁄ = 5.63𝑥10−16𝑦−1𝑘𝑚−2. [1]
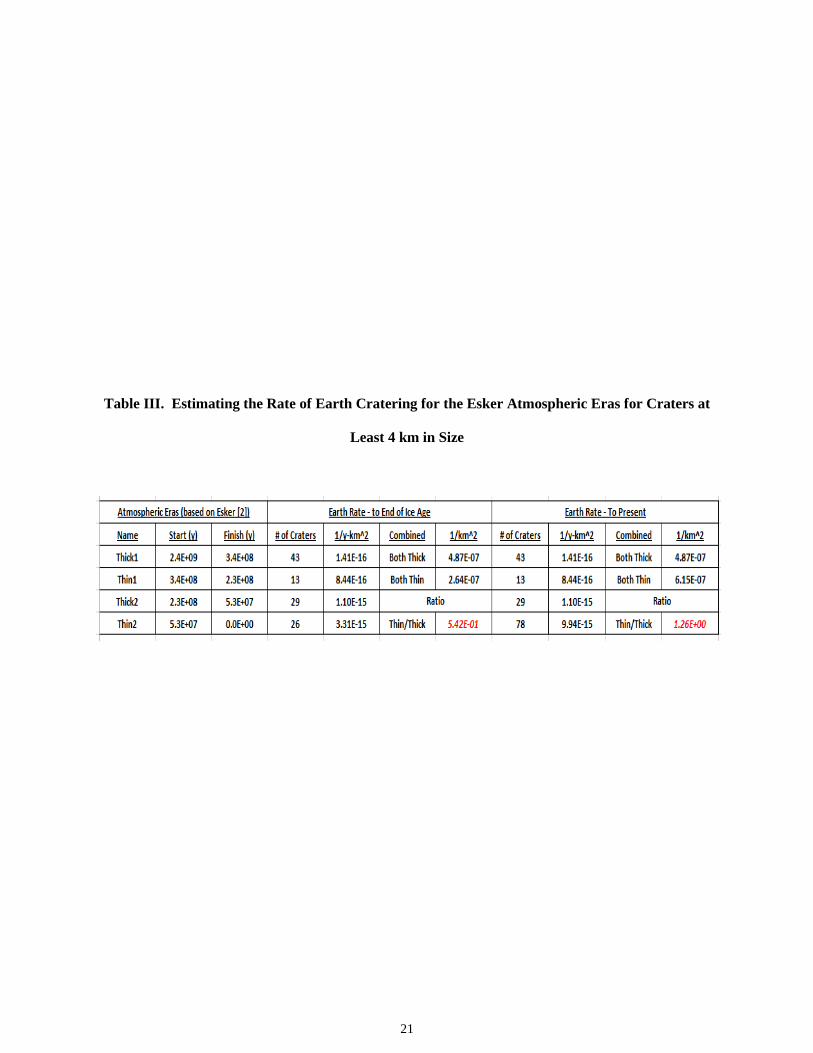
Then I weight over the two Thick and Thin Eras, as shown.5 Table III presents two sets of estimates, one
where I truncate the counting of Earth craters at the end of the last Ice Age (10,000 years ago) and one
without truncation (i.e., counting all craters to present time). This has no effect on the cratering rate for the
Thick Eras (4.87 x 10⁻⁷ km-2), which is a factor of 59 lower than the corresponding lunar cratering rate (2.85
x 10-5 km-2), to be expected given Earth’s active climate and geology. The cratering rates for the Thin Eras
vary by about a factor of 2.5, being lower when truncated at the end of the Ice Age (2.64 x 10⁻⁷ km-2 vs.
6.15 x 10⁻⁷ km-2). Both are lower than the lunar cratering rate for the corresponding Thin Eras (6.99 x 10⁻⁶
km-2), as would be expected, but notably not lower by as high a factor when compared to the Thick Eras
(~59 for the Thick Eras, but around 26 and 11 for the Thin Eras).
What is of particular interest is the ratio of the weighted cratering rates (red italics in Table III). When
truncated at the end of the Ice Age, the cratering rate during the Thin Eras is reduced by nearly a factor of
two relative to that for the Thick Era, somewhat to be expected given the lunar result which showed roughly
a factor of four reduction. The fact that the Earth cratering rate during the Thin Eras is reduced by less
compared to the Moon rate may be indicative of the effect of atmospheric thickness. That is, the thinner
Earth atmosphere allowed more cratering during the Thin Eras than would be expected relative to the
cratering rate during the Thick Eras when compared to the ratio for the Moon which is climatically and
geologically dead (compare ratios of 0.542 to 0.245 [red italics in Table II]). If the Earth crater counting
is not truncated, i.e., counted to present time, this difference is much more pronounced. In fact, the cratering
rate during the Thin Eras now is slightly higher than during the Thick Eras, by about one quarter (ratio =
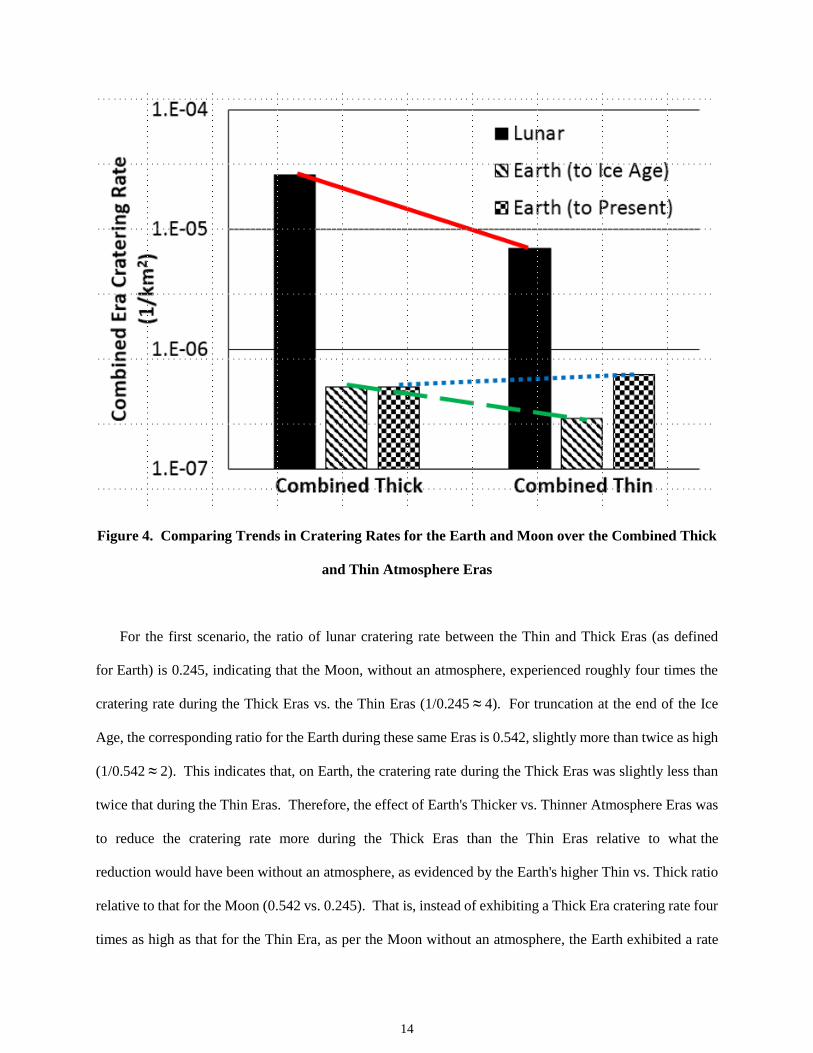
1.26, in red italics). Figure 4 shows this graphically by the three different trend lines (solid red for the
5 This weighting is slightly different from that used for the lunar rates, as follows, e.g., for the two Thick Eras:
(1.41𝑥10−16𝑦−1𝑘𝑚−2)(2.4𝑥109𝑦 − 3.4𝑥108𝑦) + (1.10𝑥10−15𝑦−1𝑘𝑚−2)(2.3𝑥108𝑦 − 5.3𝑥107𝑦) = 4.87𝑥10−7𝑘𝑚−2.
Note that this is the same as combining the two Thick Eras initially:
(43 + 29)(1.5𝑥108𝑘𝑚2)⁄ = 4.87𝑥10−7𝑘𝑚−2.
12
Moon; dashed green for the Earth to the Ice Age; and dotted blue for the Earth to Present). The lunar trend
line is the steepest downward. That for the Earth to the Ice Age is also downward, but not as steep, while
the trend line for the Earth to Present is slightly upward.
Figure 3. Lunar Crater Production Rates through Geologic Time
13
The Earth to Present trend is completely different from the lunar, which saw a reduction by about a
factor of four rather than this increase by one quarter. This may be indicative even more so of the
atmospheric thickness effect, although the caveat previously mentioned about the preponderance of the
most recent craters having been identified in North America somewhat tempers it. Nonetheless, even the
comparison for truncation at the end of the Ice Age shows a noticeable difference relative to what would
be expected for a body without an atmosphere subjected to the same meteor influx, represented by the
Moon. Another factor, though likely not as dominant as the potential atmospheric effect, could be a
decreasing geologic activity on Earth with time, since the Thick Eras each preceded the Thin Eras.
However, given Earth is still quite geologically active, likely not much less so than around two billion years
ago, this effect is expected to be dwarfed by the atmospheric thickness difference.
4. Summary
Given all the assumptions and approximations employed, and the fidelity of cratering data for both the
Earth and Moon, no definitive conclusion can be drawn. However, at least this cratering rate analysis does
not contradict the postulate that Earth’s atmosphere has varied substantially in thickness as per Esker and
offers an independent means to test the hypothesis to supplement the more biological and aerodynamic ones
that both he and Levenspiel, et al., provide. During the Thick Atmosphere Era, meteor impact on the Earth
would be decreased by a relatively greater degree vs. the Thin Atmosphere Era when compared to what
would be expected on a per unit surface area for the geologically and climatologically dead Moon. Given
two meteors of comparable size, speed and entry angle, the one hitting the thick atmosphere would be less
likely to survive to impact than the one hitting the thin atmosphere on Earth.
This has been demonstrated by the analysis presented here, which considers two scenarios, varying
with the truncation time for the cratering rates. The first truncates at the end of the Ice Age; the second
does not truncate, but extends to the present.
14
Figure 4. Comparing Trends in Cratering Rates for the Earth and Moon over the Combined Thick
and Thin Atmosphere Eras
For the first scenario, the ratio of lunar cratering rate between the Thin and Thick Eras (as defined
for Earth) is 0.245, indicating that the Moon, without an atmosphere, experienced roughly four times the
cratering rate during the Thick Eras vs. the Thin Eras (1/0.245 ≈ 4). For truncation at the end of the Ice
Age, the corresponding ratio for the Earth during these same Eras is 0.542, slightly more than twice as high
(1/0.542 ≈ 2). This indicates that, on Earth, the cratering rate during the Thick Eras was slightly less than
twice that during the Thin Eras. Therefore, the effect of Earth's Thicker vs. Thinner Atmosphere Eras was
to reduce the cratering rate more during the Thick Eras than the Thin Eras relative to what the
reduction would have been without an atmosphere, as evidenced by the Earth's higher Thin vs. Thick ratio
relative to that for the Moon (0.542 vs. 0.245). That is, instead of exhibiting a Thick Era cratering rate four
times as high as that for the Thin Era, as per the Moon without an atmosphere, the Earth exhibited a rate
15
only twice as high during the Thick vs. Thin Era. This ratio difference supports the conjecture that thicker
atmosphere reduces cratering rate.
For the second scenario, this tendency is even more pronounced for the second scenario when the
cratering rate is not truncated at the end of the Ice Age but extended to the present. Now the ratio between
the Thin and Thick Eras on Earth is 1.26, indicating a Thin Era cratering rate 26% higher than during the
Thick Era. Contrasting against the Moon's ratio of 0.245, one sees a pronounced decrease during the Thick
Era relative to the Thin Era on Earth vs. what would have been experienced without an atmosphere, as
evidenced by the Moon. Again, this ratio difference supports the conjecture that a thicker atmosphere
reduces cratering rate, aligning with Esker's conjecture, which is based on biological/aerodynamical
arguments.
16
References
1. O. Levenspiel, T. Fitzgerald and D. Pettit, “Earth’s Atmosphere Before the Age of Dinosaurs,”
Chemical Innovation, Vol. 30, No. 12, pp. 50-55, December 2000 (available at
http://pubs.acs.org/subscribe/archive/ci/30/i12/html/12learn.html).
2. D. Esker, “Scientific Theory Solving the Dinosaur Paradox and Numerous Other Paradoxes Regarding Earth’s
Evolution” (to be published; currently available at http://www.dinosaurtheory.com/index.html).
3. “Lunar Crater Production Rates through Geologic Time” (available at http://muller.lbl.gov/pages/
crateringrates.htm).
17
List of Figures
Figure 1. Three possible alternatives for the atmospheric pressure early in Earth’s lifetime, given that it
was at ~5 bar, ~100 Mya.
Figure 2. Atmospheric Levels during the Last 350 Million Years with Assumed Transition Times
Figure 3. Lunar Crater Production Rates through Geologic Time
18
Table I. Complete List of Identified Earth Craters
19
20
Table II. Estimating the Rate of Lunar Cratering over the Corresponding Esker Atmospheric Eras
for Craters at Least 4 km in Size
Atmospheric Eras (based on Esker [2]) Lunar Rate (/km^2)
Name Start (y) Finish (y) At Start At Finish Geo Mean Combined
Thick1 2.4E+09 3.4E+08 8.5E-05 1.1E-05 3.06E-05 Both Thick 2.85E-05
Thin1 3.4E+08 2.3E+08 1.1E-05 8.5E-06 9.67E-06 Both Thin 6.99E-06
Thick2 2.3E+08 5.3E+07 8.5E-06 3.0E-06 5.05E-06 Ratio
Thin2 5.3E+07 0.0E+00 3.0E-06 1.0E-06 1.73E-06 Thin/Thick 2.45E-01
21
Table III. Estimating the Rate of Earth Cratering for the Esker Atmospheric Eras for Craters at
Least 4 km in Size


![ARTICLES PLAUSIBILITY PLEADING REVISITED …ndlawreview.org/wp-content/uploads/2013/07/Bone.pdf2010] plausibility pleading revisited and revised 851 I discussed Twombly, plausibility](https://img.pdfslide.us/doc/110x75/5ab941e57f8b9aa6018d9e76/articles-plausibility-pleading-revisited-plausibility-pleading-revisited-and.jpg)