Embed Size (px)
Citation preview

PLATINIZED PLATINUM ELECTRODES
A. M. FELTHAM AND M. SPIRO
Department of Chemistry, Imperial College of Science and Technology, London S. W. 7, England
Received July 29, 1970 (Revised Manuscript Received October 23, 1970)
Contents I. Introduction
11. Historical Origins 111. Electrode Kinetics and Mechanism
A. In the Absence of Lead B. In the Presence of Lead C. Coulombic Efficiency D. Substrate Pretreatment
A. Deposit Appearance B. Deposit Growth C. Constitution of Lead-Containing Deposits D. The Effect of Alternating Current
A. Electrochemical Determination B. Dependence on Plating Conditions C. Reproducibility D. Decrease with Time Survey of Recommended Platinizing Procedures
1V. Electrodeposition
V. Surface Area
VI.
177 177 177 178 180 180 180 181 181 183 184 185 185 186 187 191 191 193
1. Introduction The platinized platinum electrode is the most widely used type of electrode. It makes a regular appearance in conduc- tance cells, forms the basis of the hydrogen reference electrode, and is unsurpassed as an electrocatalyst in fuel cells. Yet the mechanism of the formation of the platinum deposit has been investigated only recently, and information on the properties of the electrode (its appearance, structure, area, and repro- ducibility), and how these are affected by its method of prepa- ration, is widely scattered and not well known. The main factors are critically assessed in this review.
11. Historical Origins It is an accident of history that the original recipes for platinum black electrodeposition were devised, not for electro- chemical purposes, but in connection with the measurement of radiation. When radiation falls on a black metallic strip the temperature of the strip rises, and the resulting increase in resistance can be determined with a Wheatstone bridge ar- rangement. Early models of such devices, known as bolometers, made use ofi platinum strips blackened with soot by means of a petroleum flame. The irreproducibility of this method of blackening led Lummer and Kurlbaum2 to try instead the electrodeposition of platinum black, since composition of the plating solution, current, voltage, and time can be exactly defined and controlled. But there was one drawback: platinum black electrodeposited from pure chloroplatinic acid solutions did not adhere properly to the electrode. In attempting to
(1) 0. Lummer and F. Kurlbaum, Ann. Phys. Chem., 46,204 (1892). (2) 0. Lummer and F. Kurlbaum, Sitzungsber. Kgl. Preuss. Akud. Wiss., 229 (1894).
overcome this difficulty, Kurlbaum and Lummer3 recalled that platinum black can easily be precipitated from chloro- platinic acid solution by adding copper or lead, so that such chemically prepared platinum black always contains some copper or lead as well. Accordingly, they tried adding a small amount of copper sulfate, to the extent of about 1 of the chloroplatinic acid present, to the plating solution and found that this regularly produced very good platinum black de- posits. Even better results were achieved by adding a small quantity of lead acetate. Their final recipe3 was 1 part of chloroplatinic acid and 0.008 part of lead acetate to 30 parts of water, the electrolysis being carried out with a potential difference of 4 V between the (platinum) working electrodes which gave a current density of 30 mA cm-2 at the cathode. It is this recipe which was shortly afterwards adopted by Kohlrausch4 for making platinum black electrodes for elec- trochemical purposes. Kohlrausch, to whom this preparation has at times been incorrectly attributed,8 stated clearly, but without quoting any literature sources, that the method was that of Lummer and Kurlbaum. Only in a later book6 is ref 3 specifically referred to. That this historic recipe is quite sound is shown by the results of more modern research which is discussed in the following sections. The main modification desirable is a reduction of the lead acetate concentration by a factor of approximately 5.
In the original bolometric study the platinum compound was referred to21 * as “Platinchlorid,” but both Kohlrausch’ and more recent booksstg have pointed out that this term was commonly applied to chloroplatinic acid. This loose nomen- clature has caused some confusion in the later literature and in many present-day undergraduate laboratory manuals. Even PtC14 may mean1O*li chloroplatinic acid unless a special prep- aration’ of platinic chloride is given.
111. Electrode Kinetics and Mechanism The electrodeposition of platinum from chloroplatinic acid solution involves three couples.
PtIVCla?- + 2e- + PtTIClla- + 2C1- (1)
PtI1Cl4’+ + 2e- e Pt + 4C1- (2)
(3) F. Kurlbaum and 0. Lummer, Verh. Phys. Ges. Berlin, 14, 56 (1895). (4) F. Kohlrausch, Ann. Phys. Chem., 60,315 (1897). ( 5 ) G. Jones and D. M. Bollinger, J. Amer. Chem. Soc., 57,280 (1935). (6) F. Kohlrausch and .L. .Holborn, “Das Leitvermogen der Elektro- lyte,” B. G. Teubner, Leipzig, 1898, p 9. (7) F. Kohlrausch, Ann. Phys. Chem., 63,423 (1897). ( 8 ) A. 1: Vogel, ‘‘6 Textbook of Macro and Semimicro Qualitative Inorganic Analysis, 4th ed, Longmans, Green and Co., London, 1954, p 581. (9) “Platinum,” International Nickel Ltd., London, p 11. (10) G. Hevesy and T. Somiya, Z . Phys. Chem., 171.41 (1934). (11) A. Slygin and A. Frumkin, Acta Physicochim. URSS, 3, 791 (1935).
177

178 Chemical Reviews, 1971, Vol. 71, No. 2 A. M. Feltham and M. Spiro
PtIVCle* + 4e- =+= Pt + 6C1- (3) The electrode potentials have been measured under a variety of conditions, and the results are summarized in Table I. Those
Table I Electrode Potentials of the Three Pertinent
Platinum Couples (See Text) Temp, Supporting
Couple 'C electrolyte EO, V a Ref 1 25 None 0.77 & 0.05 12 1 25 None 0.68 13b 1 25 1 MHCl 0.72b 25 1 25 1 M NaC104 0. 72d 25 1 50 2.5 MHCl 0.74 21 1 60 None 0.745c 20 2 25 None 0.75 12 2 25 None 0.73 13b 2 25 1 M NaC104 0 .78 25 2 60 None 0.78jc 20 3 25 None 0.76" 12 3 25 None 0.705' 13b 3 25 1 M NaC104 0.74b 25 3 60 None 0.76y 20
a All potentials in this review are given on the NHE scale, unless stated otherwise. Values given on the SCE scale have been converted by using E(SCE) = 0.245 V at 25". Originally measured US. a 1 M NaCl calomel electrode (NaCE). The cell SCE/l M HClO4iNaCE had an emf of 65 mV; hence E(NaCE) = 0.310 V if the large liquid junction potential is ignored. c Measured us. SCE at 18" with a KCl salt bridge. dcalculated from the corresponding values for couples 2 and 3. *Calculated from the corresponding values for couples 1 and 2.
of Goldberg and Heplerl2 are the selected best standard values. In general, the emf's of these couples lack reproducibility.13a This is not unexpected; reactions 1-3 involve the breaking of several Pt-Cl bonds and must therefore be kinetically slow and possess low exchange current densities.
Reference is occasionally made to the extent to which PtCle2- hydrolyzes in solution. The hydrolysis kinetics have been investigated,14-17 and the reaction has been found to be catalyzed by a product of the hydrolysis,16 light,1e18 and platinum black.16 In fact, most plating solutions are acid (usually HCl is added), and the evidence strongly suggests that under these conditions the major species present is PtCls2-. Only in neutral aqueous solutions of KzPtCla or PtC14 should there be significant concentrations of hydrolyzed species and these, too, are reduced cathodically to platinum. le
A. IN THE ABSENCE OF LEAD
The earliest electrochemical studies of the plating of platinum from PtCl2- solutions appearedzo* 2 1 more than one-third of a
(12) R. N. Goldberg and L. G. Hepler, Chem. Reo., 68,229 (1968). (13) W. M . Latimer, "Oxidation Potentials," 2nd ed, Prentice-Hall, Englewood Cliffs, N. J., 1952: (a) p 204; (b) p 343; (c) p 341. (14) E. Sonstadt, Proc. Chem. SOC., London, 14,25 (1898). ( 1 5 ) E . H. Archibald, J. Chem. SOC., 1104 (1920). (16) A. D . Westland and L. Westland, Proc. Inr. Conf. Coord. Chem., 7rh, 1962, 251 (1962). (17) R. Dreyer, I . Dreyer, and D. Rettig, 2. Phys. Chem. (Leipzig), 224, 199 (1963). (18) E . Sonstadt, Proc. Chem. SOC. (London), 14,179 (1898), (19) A. T. Hubbard and F. C. Anson, Anal. Chem., 38,1887 (1966). (20) G. Grube and H. Reinhardt, 2. Elektrochem., 37,307 (1931). (21) 0. Stelling, ibid., 37, 321 (1931).
century after the process itself had been introduced.2-40e That PtC142- participated was shown by two main lines of evidence. First, the current-voltage curves, of which an example is given in Figure 1, exhibited not one but several waves, the last steep rise being caused by hydrogen evolution. The quan- titative concordance between the curves obtained by 21
and laterzz, 2 3 workers is relatively poor, partly because the compositions and temperatures of the plating solutions varied and also as a result of the different speeds with which the curves were drawn. The slower the experiment, the greater the area of the platinized platinum deposit, and so the lower the real current density. Grube and Reinhardt's resultsz0 are not atypical and encompass a wider range of conditions than most: their initial deposition potentials with 0.1 M HzPtCls at 18°C were 0.45 V in the absence of HC1 and 0.12 V in 5M HC1 and, at 60°, 0.54 and 0.36 V, respectively. Comparison with Table I shows that the initial electrode process (almost certainly reaction 1) is irreversible and this, as has already been pointed out, is not unexpected. The shift to more anodic deposition potentials as the temperature is raised demonstrates the anticipated increase in exchange current density.
The second reason for pointing to the participation of PtCL2- came from the analysis of the electrode products after various times. Initially there was preferential reduction to PtC142-, as shown also by the fact that the solution color turned from lemon yellow to dark red, to be followed by the deposition of platinum metal. This change with time was particularly pronounced at higher temperatures. 2o
Another third of a century passed before more quantitative information appeared with the advent of sophisticated elec- trochemical techniques. The most useful of these to date has been thin-layer voltammetry24 where the peak currents are a few microamperes only and the amount of platinum deposited during the course of each run is manageably small. 19 Lau and H ~ b b a r d ~ ~ applied slow voltage sweeps to a cell 26 pm thick containing either PtC16'- or PtC1d2- solutions, and fitted the resulting current-voltage curves to theoretical rate equations. The derived rate constants k are listed in Table 11. In agree-
Table II Rate Parameters" for the Reduction of PtClP to PtC1d2-
(kl, alnlo) and of PtC14Z- to Platinum (k2, CUZJZ~O)
at 25OC from Ref 25
Mb aln10 kl, cm sec-I c u z n ~ O kz, cm sec-I
8.1 X We 0 0.29 6.1 X 1W6 0.38 0.01 0.37 3.5 X 10⁻⁶ 0.32 3.4 x 10⁻⁶
1.6 x 1 0 - 7 0.10 0.37 1.5 X lodB 0.32 0.30 0.45 5.9 X lW7 < 2 x 1 0 - 0 1.00 0.44 5.7 X 10⁻⁷ <1 x 10-0
0 The parameters were derived from the basic equation i = nFkCo. exp[-an0F(E - Eo)/Rr] relating current density i to po- tential E. The EO terms were taken as standard and not as formal potentials, the values used being Elo = 0.40 (NaCE) and Ezo = 0.45 (NaCE) V at all chloride concentrations. b In addition to the NaCl concentration indicated, the solutions contained 1 mM PtClP or PtC142-, 0.01 M HClO,, and sufficient NaClO, to adjust the ionic strength to 1.01.
[NaCII,
(22) H. Yamamoto, Y . Kobaku, T. Nagai, and T. Takei, Denki Kagaku, 33, 804 (1965); Chem. Absfr., 64,1374731 (1966). (23) C. Bernard, Electrochim. Acfa, 15,271 (1970). (24) A. T. Hubbard, J. Elecrroanal. Chem., 22,165 (1969). (25) A. L. Y. Lau and A. T. Hubbard, ibid., 24,237 (1970).

Platinized Platinum Electrodes Chemical Reviews, 1971, Vol. 71, No. 2 179
ment with most emf and the early voltammetry evidence, both reactions 1 and 2 are seen to be electrochemically irreversible. The addition of chloride has an adverse effect, to such an extent that the reduction of ptC142- to platinum in 1 M chlo- ride solutions takes place at potentials so cathodic that sol- vent reduction occurs simultaneously. At low chloride con- centrations, on the other hand, conversion of PtCle2- to PtClra- is rapidly followed by the latter’s reduction to the metal, and the electrode process appears to be simply reaction 3. The reaction
PtC16“ + Pt + 2c1- 2Ptc14*i (4) i
should play a negligible role since it takes 500 hr at 60” to come to equilibrium.2o
The following discussion is based on the values of the rate constants as listed in Table 11 although, as one of the referees pointed out to us, their magnitudes and particularly the trends they display depend strongly on the Eo assignments (see foot- note a of Table 11). As the chloride concentration rises, kl decreases at first and then reaches a steady value, whereas kz decreases more and more rapidly. Their behavior is there- fore qualitatively different. The potentials of reduction of PtCI62- and PtC142- in low chloride media are similar and the charges of the ions are identical; their shapes, however, are not, PtCl6’- being octahedral and PtC142- planar. This fact has already been invoked to explain why, at mercury cathodes, the reduction of PtC16’- (and of many other large anions) is much more sensitive to the presence of cations than is that of PtCL2-. If, as Frumkin has suggested,26 the transi- tion states of the flat PtC142- ions are located close to the electrode surface, while the PtClS2- ions to be discharged are linked to it by cationic bridges, the behavior at mercury elec- trodes becomes comprehensible. A similar situation may ob- tain at platinum. A flat PtC1dZ- ion will then require a group of at least five adjoining surface atoms to be free of adsorbed chloride for discharge to be possible, and this becomes in- creasingly difficult as the chloride concentration rises,26 hence the sharp fall in the values of kz. Another test of the Frumkin hypothesis could be made by measuring kl and kz in the presence of supporting electrolytes containing different cations. Some information on this aspect is already available. According to Table 11, when Na+ is almost the sole counter- ion, kl is constant as the chloride ion concentration changes from 0.3 to 1 M , whereas, in the presence of 3 M H2S04, kl varies inversely2’ with sodium chloride concentration over the range 0.41 M. In the original paper2’ the authors deduced from the latter finding that the step determining the rate of the cathodic process involves the complex PtCls-, formed by the preceding reversible reaction
PtCl6* e PtCls- + c1- (5)
However,26 the rate of a reaction such as eq 5 or the equivalent reaction producing Pt(HzO)Cla- is too small to account for the observed rates of reduction.
Table I1 records also the values of ano, the product of the cathodic transfer coefficient and the number of faradays in- volved in the formation of 1 mol of activated complex. Al- though it did not prove possible25 to separate these two param- eters, the results suggest that both nI0 and nzO are unity. This
--
(26) A. N. Frumkin, Trans. Faraday Soc., 55, 156 (1959). (27) V. I. Kravtsov and B. V. Simakov, Electrochim. Acta, 9, 1211 (1 9 64).
1 .-’ I / . , / A
0.8 0.6 0.4 0.2 0.0
/.
0
E , V.
Figure 1. Current (Z) us. voltage ( E ) curves for the platinktion of platinum from a 0.05 M chloroplatinic acid solution with no added HCl: no lead acetate, -; 2.7 X M lead acetate, --I. The area of the electrode was not given (from ref 23).
implies that transient Pt(II1) and Pt(1) species, respectively, are produced in the electrode reaction. Lingane,z8a in an earlier chronopotentiometric study of PtC162- reduction kinetics in 1 M HCl on slightly platinized electrodes, found the curve to fit, very roughly, a diffusion-controlled one-electron process. He interpreted this as an initial reduction of Pt(1V) to Pt(III), followed by the latter’s disproportionation to Pt(1V) and pt- (11). Although the evidence is as yet far from convincing, it is worth noting that short-lived Pt(II1) and Pt(1) species have recently been formed zsb in aqueous solutions by electron pulse radiolysis.
There is considerable evidence in the literature that the platinizing process is a more complex one than the thin-layer voltammetry results in Table I1 lead one to suppose. In Lin- gane’s chronopotentiometric experiments, 28a no discrete re- duction wave for PtC16’- in 1 M HC1 occurred on “clean” platinum electrodes but only on those covered with a visible coating of platinum black. Lingane concluded that metallic platinum must participate in the reduction process in a much more specific way than merely serving as an inert electron source, and proposed an initial chemical reduction of the oxidant by platinkm metal. Another chronopotentiometric finding was an ageing effect. If the slightly platinized electrode was allowed to stand in the deoxygenated 1 M HC1 test solu- tion for 2 days (a medium in which the extent of hydrolysis should be slight), a four-electron reduction wave was recorded, corresponding to reaction 3. This is in marked contrast to the thin-layer results which showed the reduction steps Pt(1V) +
pt(I1) and Pt(I1) + Pt to be well separated in 1 M chloride solutions. Whether the pH difference of 2 between the solu- tions of Lingane (PH = 0) and those of Lau and Hubbard (pH = 2) is in part responsible for these considerable differ- ences is not known, but it does seem clear that the state of the surface plays a major role in the electrode kinetics.
Two other puzzling observations in the early literature bear this out. Certain curious behavior, such as strong potential fluctuations in one region of the current-voltage curve, was saidz0 to point to the formation at the electrode surface of a poorly conducting layer which changed as the electrolysis con- tinued. A peak at the beginning of a chronopotentiogram was
~~
(28) (a) J. J. Lingane, J. Electroanal. Chem., 7, 94 (1964); (b) G. E. Adams, R. B. Boszkiewicz, and B. D. Michael, Trans. Faruduy Soc., 64, 1256 (1968); A. S. Ghosh-Mazumdar and E. J. Hart, I n t . J. Radiat. Phys. Chem., 1,165 (1969).

180 Chemical Reviews, 1971, Vol. 71, No. 2 A. M. Feltham and M. Spiro
also interpreted in this way,21 although it is more likely to have been caused by slow nucleation. 29 A second unexpected phenomenon during platinization was the evolution of hy- drogen at potentials more positive by up to 0.14 V than that calculated for the reversible hydrogen electrode. 20* 21 Lin- ganeZss too observed this and attributed it to simultaneous re- duction of PtC16'- and H+, the latter forming hydrogen at a very low partial pressure. One is led to wonder if some elec- trochemical synergistic effect is involved here. It is interesting to recall that long ago Kohlrausch7 suggested that at high current densities, solutions of PtC14 (not HzPtCl6) produced platinum at the cathode by the formation of hydrogen which subsequently reduced the platinic chloride. Further study in this area should prove interesting.
B. IN THE PRESENCE OF LEAD
In the preceding section we have seen how little is uiiderstood of the electrode kinetics of platinum deposition from chloro- platinic acid solutions. Considerably less is known of platinum deposition from lead-containing solutions, an astonishing fact when we bear in mind that the process is now three-quarters of a century old and is in daily use around the world.
Virtually the first attempt at an electrochemical study wasz3 in 1970, and it produced some unexpected results. First, a so- lution containing no platinum but 0.01 M in lead acetate and 0.1 M in HCI showed a reduction wave on a platinized plat- inum electrode beginning at +0.74 V, although the standard potential of the Pb2+/Pb is -0.126 V. This is al- most certainly related to the fact that a lead-containing plati- nized platinum electrode in a lead ion solution exhibits30 a po- tential of ca. 0.83 V. This potential does not obey the Nernst equation, and the facts suggest a very low lead activity coeffi- cient in the deposit, indicative either of strong lead-platinum bonding or steric or diffusion-limited imprisonment of lead in the platinum lattice.
The presence of small amounts (10- e10- * M) of lead acetate in chloroplatinic acid plating solutions strongly affectsz3 the cathodic current-voltage curve (cf. Figure 1). The curve alters shape and shifts anodically by 100-200 mV, and the current at a given potential increases. Lead therefore decreases the over- potential, and increases the rate, of the reduction of P tC l8 . This, incidentally, contradicts a theory31* that states that, in cases of codeposition, the rate of reduction is lowered for the metal with the more positive value of the potential of zero charge. ,?&Eo is +0.15 V for platinum and -0.65 V for lead.31b Current-voltage curves in the presence of lead,3e as in its ab- sence,ZO can fluctuate strongly. The current increases with stirring.32
Bernard23 believes, on rather skimpy evidence, that the lead is not deposited concurrently on the platinum but is adsorbed on the electrode. In this way it inhibits the growth of crystals and favors the creation of new crystallites, but it is not clear how the lead comes to be incorporated into the deposit. Elec- trocrystallization studies coupled with structural probing would prove most enlightening. The other function of the lead
could bez3 inhibition of the evolution of hydrogen and so an increase in the coulombic efficiency of platinum deposition.
C. COULOMBIC EFFICIENCY
The coulombic efficiency will be unity if reaction 3 alone de- scribes the plating process or if both reactions l and 2 are in- volved with reaction 2 the fast step. The kinetic data of Lau and Hubbard25 suggest that the latter may be true in the ab- sence of any additives. At low chloride concentrations the pro- duction and accumulation of PtC1dZ- decreases the coulombic efficiency on the anodic side, and the evolution of hydrogen decreases it at the cathodic end. A maximum would therefore be expected in between. The drop at the cathodic end was recently confirmed a in plating experiments from solutions 0.041 M (273 in chloroplatinic acid and 1.5 M in sulfuric acid, where the coulombic efficiency was roughly constant at 90-95x for deposition potentials from +250 to +50 mV (RHE: Le., with respect to the reversible hydrogen electrode in the same solution) and then steadily decreased to 44x at a deposition potential of -50 mV (RHE). In the presence of much chloride, the coulombic efficiency should rise from a very low level as the potential decreases to the point where simultaneous PtC142- reduction and hydrogen evolution set in, and may reach a plateau level. A test of these predictions by means of literature data (Table 111) is difficult because in the literature it is usually not potentials of deposition but rather current densities that are cited. It is of course true that currents of reduction processes rise as the potential becomes more cathodic, but there is no simple correlation because, at a given current, the potential of deposition depends on the stirring conditions. The second difficulty is our ignorance about the effect of lead on the elec- trode kinetics, and virtually all workers in the literature have added lead in various amounts, and sometimes HCl, to the plating solution (cf. Table 111). For thetimebeing,therefore, the figures in Table I11 must act as an empirical guide, and it is in- teresting to notice that the coulombic efficiencies listed pass through a maximum as the current density of plating increases
D. SUBSTRATE PRETREATMENT
Platinized platinum deposits formed on untreated platinum substrate electrodes are more fragile34 than those formed on. annealed or sandblasted surfaces. Electron microscopy showeds' that a smooth platinum surface was roughened, to an increasing degree, by thermal etching, sandblasting, and etching with aqua regia. On a roughened surface the initial real current density will be lower than for a smooth one, at constant geometric current density. This is likely to produce more adherent deposits, as is well known in electrofinishing. The other effect of these treatments, particularly etching by heat or with aqua regia, is to remove impurities, such as grease, from the substrate surface.
Some interesting information is provided by a nucleation study36 of mercury on platinum single crystals. Here, platinum
(29) M. Fleischmann and H. R. Thirsk, Aduan. Elecfrochem. Elecfro- chem. Ena., 3.123 (1963). (30) A. M.-Feltham and M. Spiro, J. Elecfroanal. Chem., 28, 151 (1970). (31) (a) K. M. Gorbunova and Yu. M. Polukarov, Aduan. Elecfrochem. Electrochem: Eng., 5 . 249 (1967) (see p 263); (b) P. Delahay," Dou- ble Layer and Electrode Kinetics," Interscience, New York, N. Y., 1965, p 128. (32) A. M. Feltham and M. Spiro, unpublished work.
(33) V. I. Podlovchenko and R. P. Petukhova, Elekfrokhimiya, 6. 198 (1970); Sou. Elecfrochem., 6 , 185 (1970). (34) H. A. Roth and W. R. Lasko, Amer. Chem. SOC., Div. Fuel Chem., Prepr., 11,241 (1967). (35) S. Toschev and B. Mutaftschiew, Elecfrochfm. Acta, 9, 1203 (1964).

Platinized Platinum Electrodes Chemical Reviews, 1971, Vol. 71, No. 2 181
Table 111
Coulombic Elllciency Data for the Platinization of Platinum
Current density,“ [Chloroplafinic acid‘f ___[Lead acetatelb- Coulombic
mA cm-a % IO8 M % IO8 M [ H e & M efficiency, z Ref
lo” 2.5 51 0 .0-0.2 0.0-5.3 0 40 44 10 3.5 72 0 . 2 5 . 3 0 60 30 30 3 . 5 72 0.005 0.13 2 100 30 120 5 103 0.02 0.53 0 78 60 170 5 103 0.03 0.79 0 34 86 625 1 21 0.004.15 0.0-4.0 0.1 3 d 52
These and subsequent current densities are all given per geometric area of the substrate electrode. Most workers have given solute con- centrations in per cent (w/v). These have been converted to molarities on the basis that chloroplatinic acid is 40 mass z platinum,g and that the lead acetate has a stoichiometry of Pb(CHaC02)2. 3H20 (molecular mass 379.35). Subsequent concentrations will be given in both forms for convenience. With current reversal every 1.5 min. Cited in ref 44, although examination of ref 52 revealed no mention of coulombic efficiency.
was anodized to intense oxygen evolution in mercurous ni- trate solution and subsequently soaked in 0.09-1.3 M nitric acid for 5-60 sec. The electrolytic nucleation of mercury from mercurous nitrate solution was then observed. The critical overpotential for nucleus formation diminished substantially with increasing time of soaking and nitric acid concentration. Cathodic prepolarization in nitric acid after the anodization produced an even more active electrode, and it was concluded that the dilute nitric acid removed the surface oxide layer. At concentrations below about 2 M, nitric acid has36 virtually no oxidizing power and there is the possibility3Ia that the R-0 layer is unstable in acid solution in the absence of dissolved oxygen. However, in the nucleation no mention was made of deaeration.
The pretreatment that proved most effective for deposition of mercury on platinum, namely anodization followed by cathodization, is similar to that conventionally recom- mended3* for the platinization of platinum. This is, in brief, washing the platinum substrate in either warm concentrated nitric acid or in aqua regia, followed by nitric acid, and subse- quent cathodization in very dilute sulfuric acid. There is some foundation for this procedure. Concentrated nitric acid pro- duces an oxide film on the platinum and some workers believea7b that cathodization of a preanodized elec- trode (Le., oxide covered) produces an invisible film of plat- inum black. Lingane28a has shown (section 1II.A) that the for- mation of such a film is essential for rapid reduction of PtClez-. The electrode kinetics of RCleZ- reduction on platinum sub- strates subjected to various electrochemical pretreatments have not yet been studied. I t is known that the exchange cur- rent densities of a few couples are greater on preanodized platinum surfaces, while those of most couples are higher on precathodized surfaces. 39, 4O
I W . E/ecfrodeposifion No thorough electrocrystallization study has been carried out. In general, the work that has been done has been purely em-
(36) F. A. Cotton and G. Wilkinson, “Advanced Inorganic Chemistry,” 2nd ed, Interscience, New York, N. Y., 1966, p 350. (37) J. P. Hoare, “The Electrochemistry of Oxygen,” Interscience, New York, N. Y., 1968: (a) Chapter 11; (b) pp 171-175. (38) G. J. Hills and D. J. G. Ives in “Reference Electrodes,” D. J. G. Ives and G. J. Janz, Ed., Academic Press, New York, N. Y., 1961, pp 106-108. (39) F. C. Anson, Anal. Chem., 31,1451 (1959). (40) W. D. Cooper and R. Parsons, Trans. Faraday SOC., 66, 1698 (1970).
pirical in approach. Rather more attention has been paid to platinization from solutions containing a metal additive, us- ually lead acetate.
A. DEPOSIT APPEARANCE
Nearly all papers in which platinized platinum electrodes are employed describe their appearance. The presence of additives in the plating solution can have a startling effect and the range of textures obtainable is wide.
I. In the Absence of Lead Platinization with solutions containing no additive has always given gray deposits. In many c a ~ e ~ ~ ~ ~ ~ ~ ~ ~ ~ ~ ~ ~ ~ these were not ad- herent and tended to flake off. Adherent deposits have, how- ever, been prepared from solutions containing no lead acetate by one of the following procedures: platinizing only slightly6 (nonadherency occurred after intense platinization) ; em- ploying a low current d e n ~ i t y ~ ~ ~ ~ ~ (10 mA cm-2); or holding the platinum cathode46 at +50 mV, instead of the more usual galvanostatic conditions. It is interesting to note that a common factor in all but one4( of these procedures was the addition of HCI to the platinizing solutions. The first men- tionedb employed 0.025 M HC1 and obtained only moderately good deposits; the other two used 2 M HC14a and 1 M HCl4’ and completely satisfactory deposits resulted. This might be due to the kinetic inhibitory effect of chloride. Indeed, in chloroplatinic acid solutions 6.0-10.7 M in HCl smooth ductile platinum deposits can be obtained. 46
A similar inhibitory effect occurs47 with the additive cetyl- ammonium bromide and leads to highly uniform smooth de- posits. Bright platinum deposits can be obtained4* from solu- tions of chloroplatinous acid. The possibility of obtaining
(41) S. Popoff, A. H. Kunz, and R. D. Snow, J. Phys. Chem., 32, 1056 (1928). (42) M. J. Joncich and N. Hackerman, J. Electrochem. SOC., 111, 1286 (1 9 64). (43) G. J. Hills and D. J. G. Ives, J. Chem. SOC., 305 (1951). (44) R. Thacker in “Hydrocarbon Fuel Cell Technology,” B. S. Baker, Ed., Academic Press, New York, N. Y., 1965, p 525. (45) R. Woods, Electrochim. Acta, 13. 1967 (1968). (46) R. H. Atkinson, Trans. Znst. Metal Finish., 36,7 (1958-59). (47) K. S. Indira, S..Sampath, and K. S. G. Doss, Metal Finishi, 67, 44 (1969); abstracted inPbtinum Metals Reo., 13,156 (1969). (48) L. P. Hammett and A. E. Lorch, J. Amer. Chem. SOC., 55, 70 (1933).

182 Chemical Reviews, 1971, Vol. 71, No. 2 A. M. Feltham and M. Spiro
bright deposits4e from solutions of chloroplatinic acid, or better, alkaline chloroplatinate solutions, was later dis- claimed4* and attributed to the presence of chloroplatinous acid produced as a result of overheating the platinic compound during its preparation. This effect of chloroplatinous acid on chloroplatinic acid plating solutions was later noted again,*E but just why bright deposits should result under these cir- cumstances when PtC142- is an intermediate in platinum black plating is not at all clear, and should be looked into. The com- mercial systems for bright platinum plating onto noble and base metal substrates have been reviewed.5o
2. In the Presence of Lead and Other Additives
Adherent deposits, usually black, are best produced by adding lead acetate to the platinizing solution, as Kurlbaum and Lummer discovered3 long ago. Other additives have been studied, but none has been employed as extensively as lead acetate. Copper3~ 6 1 and mercury61 were found to be acceptable substitutes for lead, and gold and thallium gavel0 deposits of good quality. Cadmium, zinc, nickel, and iron have given"Je61 gray inferior deposits. The effects of a host of metal addi- tives on the appearance and on the X-ray diffraction patterns of platinized platinum deposits have been examinedS2 (see later).
The final appearance and texture of a platinized platinum electrode depends on the concentration of lead acetate in the plating solution and the current density of deposition. The minimum concentration of lead acetate required to give a good black deposit from a 0.062 M (3 %) chloroplatinic acid solution 0.5 M in HC1 at 13.5 mA cm+ was found4I to be 2.5 X M(0.01%). A black, velvety texture is usually asso- ciated with lead-containing platinized platinum electrodes, al- though at higher lead acetate concentrations they become gray and smooth (Table IV). K u r l b a ~ m , ~ ~ speculating as to why platinized platinum deposits were black, compared them to an end-on view of a collection of aligned shiny knitting needles. Internal reflection reduces net reflection. Experi- mental support for this picturesque illustration is apparent in Table IV, where the blackest deposits have the highest rough- ness factors, Le., the highest areas.
Comparison of Tables IV and V suggests that the appear- ance of the platinized platinum deposit also depends on the current density of platinization. Footnote b in Table V con- firms this. The powdery deposits obtained at high current densities, and therefore at rather cathodic potentials, are no doubt attributable in part to pitting by the simultaneous hy- drogen evolution (this could perhaps be reduced by strong stirring). However, this conclusion seems oddly at variance with the findings in Table IV, where a very low current density was employed and yet, at a lead acetate concentration of 5.3 X M (0.02 %) (the same as in footnote b of Table V), a black and powdery deposit was found. A possible explana- tion is that the current reversal used in Table IV was harmful and the chlorine evolved caused gas pitting, although it has been found41-43 that current reversal has no effect. Potter,64 on
(49) H. T. Beans and L. P. Hammett,J. Amer. Chem. Soc., 47,1215 (1925). (50) F. H. Reid, Metullurg. Reu. (London), 8 , 167 (1963). (51) W. M. MacNevin and M. Levitsky, Anal. Chem., 24,973 (1952). (52) G. Bianchi, Ann. Chim. (Rome), 40,222 (1950). (53) F. Kurlbaum, Ann. Phys. Chem., 67,846 (1899). (54) E. C. Potter, "Electrochemistry," Cleaver-Hume Press, London, 1956, p 102.
Table IV Data on Platiniition for Varying Lead Acetate Concentrationso
Coulom-
4 L e a d acetatel- Z w/u lo4 M
Appearance of deposit
0 0 0.003 0.8
0.01 2.6
0.05 13 0.075 20 0.1 26 0.15 40 0.2 53
Gray, compact Black, very
powdery Black, very
powdery Black, powdery Gray, compact Gray, compact Gray, compact Gray, compact
bic e$ ficienc y , x
40.6
35.9
37.2 41.6 41.6 39.8 38.4
PbIPt atomic ratio
0 0.0021
0.0041
0.0143 0.0208 0.0230 0.0247 0.0256
Rough- ness
factor
358 534
509
26 1 229 296
296
Using 0.051 M (2.5 %) chloroplatinic acid at 10 mA cm-2 for 1 hr with current reversal every 1.5 min; from ref 44.
Tuble V Variation of Appearance of Platinized Platinum Electrodes with Lead Acetate Concentrations"
-[Lead acetatel- ZI w/u 10'M Appearance of deposit
0 0.002 0.01 0.02 0.05 0.08 0.1 0.15
0 0.5 2.6 5.3
13 21 26 40
Dark gray, compact Black, compact Black, compact Black, compact* Black, very powdery Black, very powdery Black, very powdery Black, very powdery
Using 0.021 M ( 1 %) chloroplatinic acid in 0.1 M HCl at 625 mA cm-2 for 10 min; from ref 52. The deposits were black and com- pact up to 625 mA c m 2 but black and powdery with current densi- ties in the range 850-1250 mA cm-4.
the other hand, claims it is beneficial and decreases the amount of occluded gases. Current reversal is certainly convenient for the platinization of the two electrodes in a conductance cell. An alternative suggestion is that the formation of a black compact deposit at 5.3 X M(0.02x) lead acetate in Table V but not Table IV is a consequence of the higher lead acetate/chloroplatinic acid ratio in the plating solution. Yet this idea, too, is inadequate, for Table V shows that black compact deposits are produced at low rather than at high lead acetate/chloroplatinic acid ratios, at least at a very high current density.
The information on appearance in Tables IV and V is sup- plemented by isolated observations. Deposits obtained 3 4 from a 0.1 M (4.979 chloroplatinic acid plus 2 X lo-* M (0.076% lead acetate solution at 10 mA cm+ were smooth and gray (consistent with Table IV), but at 100 mA cmF2 they were coarser in appearance and characteristic of a dendritic struc- ture. Similar behavior was observeda2 for a 0.072 M (3.5% chloroplatinic acid plus 5.2 X M (0.273 lead acetate so- lution on changing the current density from IO to 30 mA cm-2. Yet with 0.072 M chloroplatinic acid, 2 M HCI, and 1.3 X 10⁻⁴ M (0.005%) lead acetate, 30 mA cm-2 gavea2 a velvety black deposit. Best results were obtained at the dif- fusion-limited current. Clearly, further systematic work linking appearance with current density, solution composition, and

Platinized Platinum Electrodes Chemical Reviews, 1971, Vol. 71, No. 2 183
other variables is required before any systematic relationship can be formulated.
Most appearance studies were carried out at constant cur- rent, but at least one reportsS refers to potentiostatic work. In this, using a solution 0.05 M (2.4%) in chloroplatinic acid plus 2.7 X M (0.01 %) in lead acetate, deposits obtained at potentials more anodic than +395 mV (very low current densities) were gray, while those obtained at still more anodic potentials were not adherent or reproducible. Deposits formed at potentials slightly more cathodic than +145 mV (high cur- rent densities) were finely divided and very black.
Appearance is the most obvious and direct way of character- izing the texture of a surface, but Kohlrausch4 also examined the wettability of black platinized platinum electrodes pre- pared according to Kurlbaum and Lummer’s recipe. a He found that generally they were easily and well wetted with water. However, a large lightly platinized electrode became deactivated when allowed to become dry and was then no longer wetted by water. Optical experiments indicated the pres- ence of an air layer between the platinum particles. The wet- tability was restored by adding a drop of alcohol to the elec- trode. In contrast, the smooth gray electrodes prepared from solutions high in lead were founda2 to shed water quite readily. The capillary nature of the black deposits is obviously respon- sible for their enhanced wettability.
B. DEPOSIT GROWTH A most important aspect of platinization that has yet to be properly investigated is the nucleation and growth of the de- posit. Electrocrystallization studies have been carried outS6 on the deposition of platinum on mercury (where it forms an amalgamated two-dimensional layer which changes to a three- dimensional structure as the Pt(1V) concentration exceeds 10-4 M) and on glassy carbon. Here thick platinum deposits grew, the nuclei being essentially hemispherical, but with small protruding dendrites, which points to mass transport control. Growth of platinum on platinum might well follow a similar path to that on a carbon s~bstrate,~’ but little direct work has been done.
1 . In the Absence of Lead
Electrocrystallization studies in general have shown29~68 that rates of nucleation are strongly dependent on overpotential. On a surface with a high density of dislocations ( ~ 1 0 ~ ~ cm-2), no nucleation is possible5s unless cathodic overpotentials ex- ceed 150 mV. At overpotentials below this value the growth occurs at the dislocations. Platinization on platinum requires high cathodic overpotentials (section III.A), and indeed nu- cleation has been favoreda4~6a~59 as the mode of deposit growth. Most experimental work, however, has been done galvanostatically.
Deposits on platinum obtained3* from a 0.041 M (2%) chloroplatinic acid solution at 100 mA cm-2 were found by replication electron microscopy to form as randomly distri-
(55) C. Bernard, Electrochim. Acta, 14,143 (1969). (56) R. R. Giles, J. A. Harrison, and H. R. Think, J . Electroanal. Chem., 20, 47 (1969). (57) J. A. Harrison, personal communication, 1970. (58) J. O’M. Bockris and A. Damjanovic, Mod. Aspects Electrochem., 3,224 (1964). (59) D. F. A. Koch, Extended Abstracts, 131st National Meeting of the Electrochemical Society, May 1967, p 32, No. 174.
buted particles which grew laterally to cover the electrode sur- face. The same general growth pattern occurred for various substrate topographies (untreated, metallographically pol- ished, sandblasted, and etched by heat, molten sodium car- bonate, and aqua regia), but with minor variations. On an un- treated platinum substrate the deposit thickness growth rate was not linear and obeyed the equation
d = Dta
where d is the thickness at time t, and D and 6 are constants whose values were not given. a 4 Optical microscopy revealed these surfaces to be rough and without any distinguishing fea- tures, and cross-sectional microscopy showed that they ap- peared as solid films with vertical cracks. The latter technique was also applied to similarly prepared deposits at 10 mA cm-* and the same features emerged. The deposit thickness growth rate on an untreated platinum substratewas 2 X sec-l.
The lattice constant of platinized platinumaa deposited from 0.041 M (2%) chloroplatinic acid solution 1.5 M in sulfuric acid was 3.915 =t 0.005 A, independent of the de- position potential from 0 to +250 mV (RHE). The accepted value for platinum metal is 3.924 A.
2. In the Presence of Lead It has been showna4 by electron and optical microscopy that more nuclei were formed from solutions containing lead than from those without. In the same work, cross-sectional studies revealed a transition from a closely packed deposit prepared from a solution of M (0.0038%) lead acetate to a den- dritic type deposit prepared from a solution of M (0.38 %) lead acetate (using 0.1 M (4.97J chloroplatinic acid and 100 mA cm-2). The visual texture changed correspondingly from fine grains to a coarse open structure.
At 100 mA cm+ a 0.1 M (4.9%) chloroplatinic acid plus 2 X M (0.076 %) lead acetate solution gave 3 4 a constant deposit thickness growth rate of 2.8 X loda mm sec-l. At 10 mA cm-2 this solution produced rapid initial growth followed by a linear one after approximately 200 sec. In another study,60 a 0.103 M (5 %) chloroplatinic acid plus 5.3 X 10⁻⁴ M (0.0273 lead acetate solution at 120 mA cm-* gave a deposition rate of 2.8 mg cm-2 min-’, which is equi- valent to 2 X mm sec-l if the density of platinum is taken as 21.45 g cm-a. This suggests that a small change in plating conditions causes a vast change either in coulombic efficiency or, less likely, in the density of the deposit. A repeti- tion of these growth experiments under potentiostatic condi- tions should clarify the situation.
3. Occlusion of Reagents Kohlrausch observed that after platinization several days of washing was required before the conductivity of the rinsing water stabilized. If a thoroughly washed platinized platinum electrode was immersed for a long time in platinizing solution the phenomenon was not repeated, so Kohlrausch suggested that the solute was occluded only during platinization. Sim- ilarly, there was an overwhelming tendency40 to occlude acid during platinization and subsequently, if in neutral solution, to emit such acids slowly but continuously. The trouble caused by solute adsorption on platinized platinum used for a hy- drogen electrode in unbuffered solutions has been discussed.8
(60) I. R. Jonasson, Ph.D. Thesis, University of Adelaide, 1967, p 148.

184 Chemical Reviews, 1971, Vol. 71, No. 2 A. M. Feltham and M. Spiro
h I
0 1 2 3 4 5 [Lead acetate], 103M.
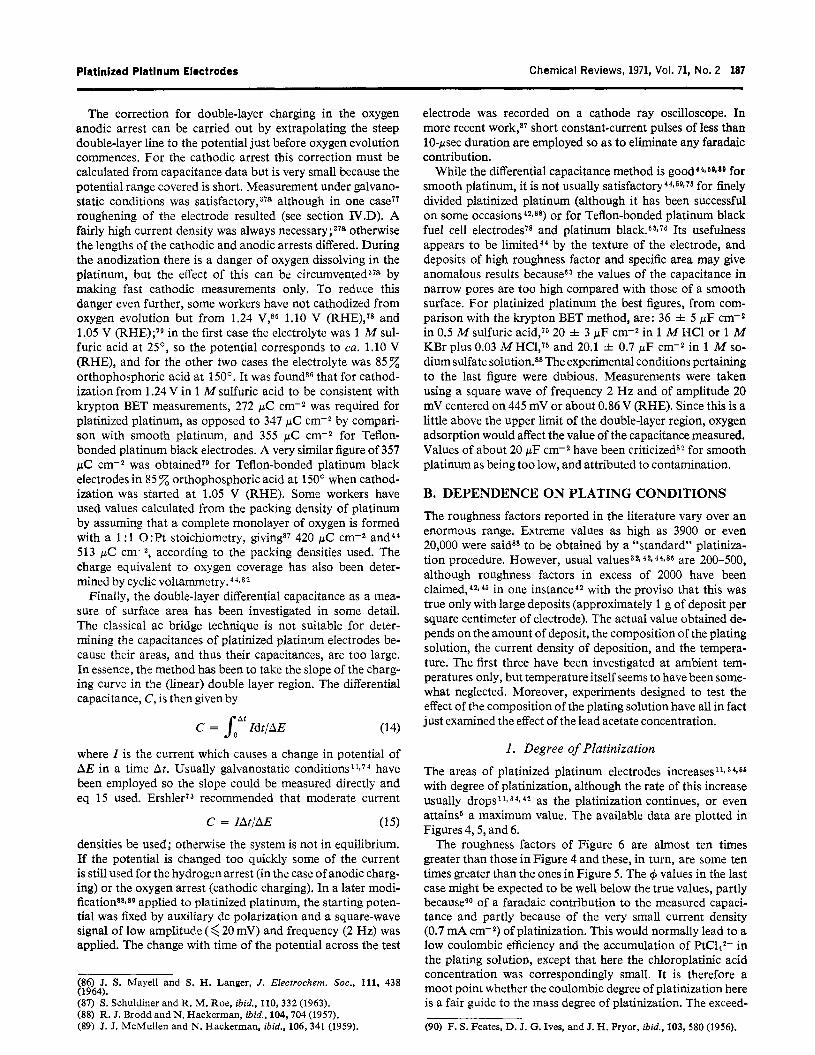
Figure 2. Dependence of the lead content of a platinized platinum deposit on the lead acetate concentration in the plating solution, at 10 mA cm-2: (0) ref 44, 0.051 M (2.5%) chloroplatinic acid, current passed for 1 hr with reversal every 1.5 min; (0) ref 10, 0.062 M ( 3 7 3 chloroplatinic acid in 0.2 M hydrochloric acid. Time of platinization was not given, and the current density was stated to be 10 cmt, probably a misprint for 10 mA cm-*.
C. CONSTITUTION OF LEAD-CONTAINING DEPOSITS
I . Composition
As the concentration of lead acetate in the plating solution in- creases, so does the amount of lead included in the platinized platinum deposit. The available data are plotted in Figure 2, from the radiotracer work of Hevesy and Somiya'O and the nondestructive X-ray fluorescence spectroscopy of Thacker. 4 4
The latter's figures are also incorporated in Table IV. The striking disagreement in the diagram is somewhat difficult to explain. The only apparent difference in preparation was that Thacker used current reversal, whereas Hevesy and Somiya did not. Since the anodization potential (on current reversal) is probably high enough to impedePo loss of lead in the acid so- lution, the reason almost certainly does not lie here. A very puzzling feature of Hevesy and Somiya's paper is that they claimed to have measured the lead content of deposits by the a-particle activity of a thorium B (21zPb) indicator, but thorium B does not emit a particles and is a g-particle emitter. The only lead a-particle emitter is radium D (21OPb). Values of lead content were estimated by comparison with lead dioxide containing the tracer, and multiplying by, among other quan- tities, the inverse of the ratio of the a-particle ranges in the two solids. Thus, change in this ratio can vastly affect the final re- sults. It would therefore seem that Thacker's results are the more trustworthy of the two.
In another investigation*' it was found that the lead con- tents of the deposits obtained from a 0.1 M (4.9%) chloro- platinic acid plus 2 x 10⁻⁸ M (0.076%) lead acetate solution passed through a maximum as the current density i increased from 0 to 100 mA cm-2, the total amount of electricity being kept constant by adjusting the time t . Equation 7 expresses the results. The magnitudes of the constants k and E were not
% Pb in deposit = kt(i/t)€ (7) stated, nor was the method of estimating the lead contents of the deposits.
Recent work80 throws some doubt on all these results and may explain the discrepancy in Figure 2. When a lead-con-
taining platinum deposit was immersed in 1 M perchloric acid solutions, much of the surface lead in the deposit dissolved within a few minutes. This lead appeared to be present as an oxide, probably PbO, and when reduced by hydrogen to lead, it did not dissolve in acid. Since plating solutions are always acidic, some lead will have dissolved if the electrodes were kept in the aerated solution after platinization and before the lead content of the deposit had been measured. It is evident that if reliable estimates of the lead contents of platinized deposits are to be obtained, they must not be allowed to come into contact with acid in the presence of oxygen before the analysis.
Indications as to the physicochemical state of the lead in platinized platinum deposits come from several directions. From X-ray diffraction work it has been deduced both that the lead i ~ 4 ~ ~ 6 2 in solid solution and that it is notlo in solid solu- tion. The equilibrium platinum-lead phase diagrama1 suggests that all the lead is present as P t P b dispersed in a matrix of Pt; while the emf us. composition curves62 of cast alloys indicate a compound of stoichiometry PbPt in Pt, and this has been veri- fiedO2 by microscopy. However, it is essential to point out that 31 the phase state of alloys produced by electrolysis often does not correspond to that of the equilibrium phase diagram.
Hevesy and Somiyalo examined the retention of lead by electrodes at high temperatures using the both the a( ?) par- ticle and y-ray activity of the thorium B tracer. According to the a-particle activity the lead started to sublime out of the deposit at about 600°C and 85 x of it had been removed after 16 hr at 720". However, the y-ray activity indicated that only 42 x of the lead had been lost after 16 hr at 690". Since y-rays are more penetrating than a particles it was concluded that lead had vaporized only from a surface region, as deep as the range of the CY particles in the deposit. This would be expected, as the rate of sublimation of lead from the bulk of the deposit would be limited by the slow rate of diffusion. A similar sit- uation appliesaO to the leaching of lead from platinized plat- inum electrodes by 1 M perchloric acid, as already mentioned. Only the lead in the first two or three atomic layers could be dissolved and then only when present as an oxide.
2. Structure It was noted in the previous section that platinized platinum deposits containing lead have been examined with X-rays. Debye-Scherrer diffraction patterns were obtained, indicating the deposits to be crystalline, for deposits formed from solu- tions of up to 2.9 X M (0.2z)"lead acetate, with 0.062 M (3x) and 0.051 M (2.5%) chloroplatinic acid, respectively, at 10 mA cm-2. Lead acetate concentrationss2 below 2.1 X lo-* M(0.08%), with 0.021 M (1 x) chloroplatinic acid at 625 mA cm-*, also gave deposits which exhibited Debye-Scherrer patterns, but when, at this high current density, higher lead acetate concentrations of 2.1 X lo-* M(0.08%) to 4.0 X M(0.15%) were used, no diffraction lines were observed. This was attributed to the de- posit being in a state of colloidal dispersion.
In these diffraction patterns 44162 an appreciable line broad- ening, which tended to increase with lead content, suggested that the crystallite sizes were smaller in the higher lead-con- taining deposits. One would suppose, therefore, that the latter
M (O.ll%)lo and 5.3 X
(61) M. Hansen, "Constitution of Binary Alloys," 2nd ed, McGraw- Hill, London. 1958, p 1096. (62) N. A. Puschm and P. N. Laschtschenko, Z. Anorg. Chem.. 62, 34 (1909).

Platinized Platinum Electrodes Chemical Reviews, 1971, Vol. 71, No. 2 185
possessed larger specific area^,^^^^* yet the reverse is true for the higher lead contents (see Figure 7). The situation is obviously more complicated than appears at first sight, and indeed, electron microscopyG4 indicated that there is not a continuous distribution of crystallite size about a mean value but rather two cubic types of crystallite, each with a distribution of size about its own mean value. The lattice constant of the lead- containing deposits4*t52 was greater than that of pure plat- inum, but whether it increases with an increase in the lead content is in dispute.449s2
Other metal additives that produced a widening of the plat- inum crystal lattices2 in the electrodeposit were Hg, Cd, and T1, while Cr, Mn, Fe, Co, Ni, Cu, Zn, and Pd caused a con- traction, and Sb, Sn, Bi, As, and Au, although they modified the nature of the deposit, did not alter the platinum lattice di- mensions. No correlation can be seen between the effect of these metals on the lattice dimensions and the appearances of the deposits discussed earlier, brought about by their inclu- sion in the plating solution.
D. THE EFFECT OF ALTERNATING CURRENT
Platinum black surfaces can be produced on smooth shiny platinum in an inert aqueous solution by several minutes of ac polarization. The conditions used have beene5 0.5 M sulfuric acid at 60 Hz and with an amplitude sufficient to reduce and oxidize the surface without substantial gas evolution ; after such polarization platinum has also been founde6 in solution. Others have used67 either 1 M perchloric acid or 3 M nitric acid with a 30-Hz square wave of 500 mV amplitude centered on 950 mV. Here the reflectance of the electrode began to de- crease before visible darkening, and the time of blackening shortened with increasing frequency. Strangely, it was only in alkaline solution that darkening of the electrode was first notedes on the application of a square-wave pulse. Moreover, under certain conditions, with the application of ac a rough- ened electrode can be smoothed.66,Gg
There is controversy over the mechanism of this darkening. On the one hand3vb it has been attributed to the repeated pene- tration and removal of hydrogen caused by the cathodic parts of the pulses, with the resultant expansion and contraction of the platinum lattice breaking up the metal surface. Other w ~ r k e r s ~ ~ * ~ g have focused attention on the anodic parts of the pulses, and it has been suggestede6 that the formation of strong Pt-0 chemisorption bonds weakens the platinum- platinum interactions. A relevant ob~erva t ion~~ is that the electrolytic formation and reduction of thick bulk oxide layers, repeated several times, increased the roughness factor of a platinum electrode by 100 times or more. Perhaps both mechanisms are admissible under appropriate conditions.
V. Surface Area The prime aim of platinization is to obtain a large area. The concept of true area on a microscopic scale is somewhat ar-
(63) A. A. Balandin, V. I. Spitsyn, L. I. Barsova, A. E. Agronomov, and N. P. Dobrosel'skaya, Zh. Fiz. Khim., 41, 2623 (1967); Russ. J. Phys. Chem., 41, 1420 (1967). (64) M. Bonnemay, 2. Elektrochent., 59,798 (1955). (65) F. C. Anson and D. M. King, Anal. Chem., 34,362 (1962). (66) T. Biegler,J. Electrochem. SOC., 116,1131 (1969). (67) A. Bewick and A. M. Tuxford, personal communication, 1969. (68) A. Hickling, Trans. Furuduj) Soc., 41,333 (1945). (69) S. Gilman, J. Electroanul. Chem., 9.276 (1965). (70) S. D. James, J. Electrochem. SOC., 116,1681 (1969).
bitrary, and especially so with electrochemical systems. Thus it has been argued" that the area determined in the dry state, e.g., by the BET method, may be much greater than that asso- ciated with electrochemical processes, because the inside sur- faces of many pores and cavities of a highly porous surface are not effective in, or contribute but slightly to, the transfer of charge in an electrochemical process. Since all investigations of the areas of platinized platinum electrodes have used elec- trochemical methods of estimation, the principles of these methods will be outlined first. As wil l be seen, the correlation between gas adsorption and electrochemical methods of area determination is reasonable for platinized platinum electrodes.
The results of area measurements have unfortunately been presented in the literature in a wide variety of ways, and we must begin by defining the many terms used. The simplest measure is the surface area itself, S. The area lacks significance on its own and is never used in this review. For electrodes, the most useful quantity is roughnessfactor 4. It is dimensionless and defined by
9 = S / A (8)
where A is the geometric area of the substrate electrode. The specific area is also used, although this is generally more useful for powders than electrodes. Two types of specific area have been employed and are described by different names in this review to avoid ambiguity. First, the mass specific area, um, is given by
um = S/m (9)
where m is the mass of the deposit. Note that this does not in- clude the mass of the underlying substrate. Second, coulombic specijc area, uc, is defined by
a0 = Slq
where q is the amount of electricity passed in deposition. It is necessary to use u. because some investigators have character- ized the amount of deposit only by recording the number of coulombs passed during platinization, and 100 coulombic efficiency cannot be assumed. For the deposition of platinum with complete coulombic efficiency, a mass specific area of 1978 cm2 g-l is equivalent to a coulombic specific area of 1 cm2 C-l. Division of the roughness factor by the amount of deposit, or of specific area by geometric area, gives the corre- sponding specific roughness factor, in reciprocal grams or recip- rocal coulombs. There is no advantage in using this quantity, and it will not be employed here.
Another useful quantity is the degree of platinization of electrodes. Like specific area, it is quoted in two forms. The mass degree ofplatinization, um, is defined as
Om = m / A (1 1)
and the coulombic degree of platinization, wo, is defined by
wo = 4 / A (12)
For 100% coulombic efficiency, a mass degree of platinization of 1 g is equivalent to a coulombic degree of platinization of 1978 C It follows from the above that
(13) 9 = S / A = umwm = uowo
~ ~ ~~
(71) J. P. Hoare, Electrochim. Acra, 9,599 (1964).
186 Chemical Reviews, 1971, Vol. 71, No. 2 A. M. Feltham and M. Spiro
A. ELECTROCHEMICAL DETERMINATION
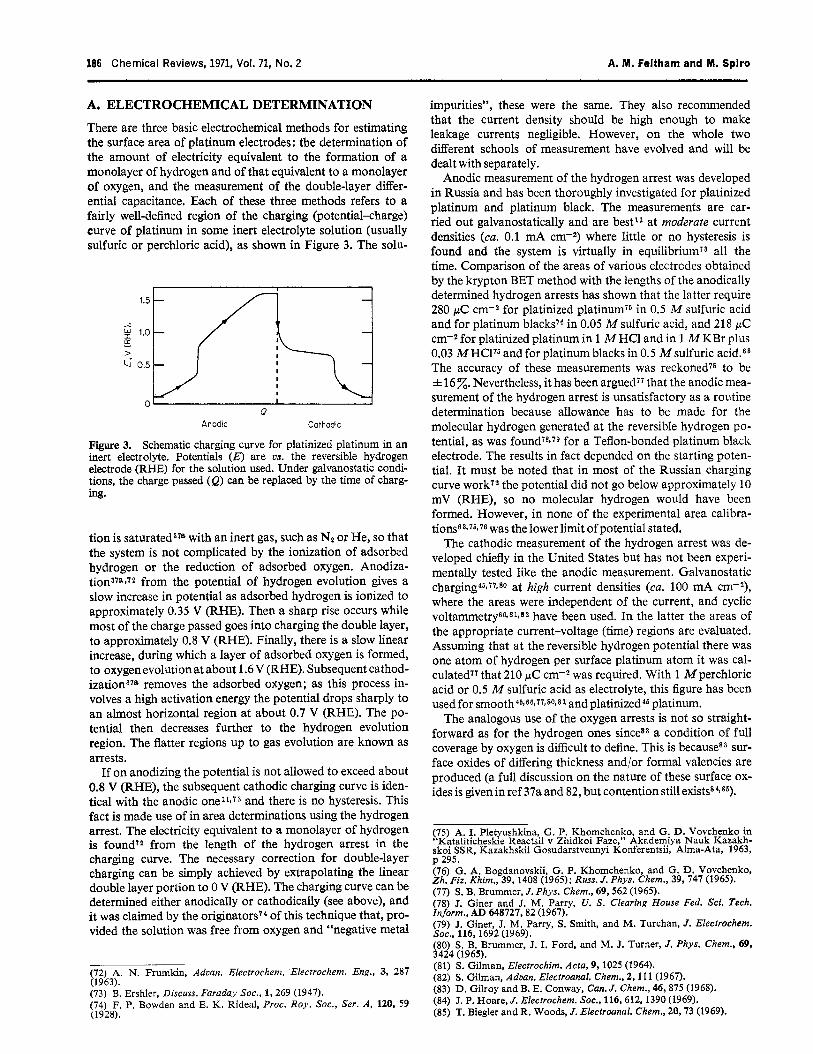
There are three basic electrochemical methods for estimating the surface area of platinum electrodes: the determination of the amount of electricity equivalent to the formation of a monolayer of hydrogen and of that equivalent to a monolayer of oxygen, and the measurement of the double-layer differ- ential capacitance. Each of these three methods refers to a fairly well-defined region of the charging (potential-charge) curve of platinum in some inert electrolyte solution (usually sulfuric or perchloric acid), as shown in Figure 3. The solu-
*-.
W I - ? lu
Figure 3.
0 ‘ I 0
Anodic Cathodic
Schematic charging curve for platinized platinum in an inert electrolyte. Potentials (E) are us. -the reversible hydrogen electrode (RHE) for the solution used. Under galvanostatic condi- tions, the charge passed (e) can be replaced by the time of charg- ing.
tion is saturated3” with an inert gas, such as NE or He, so that the system is not complicated by the ionization of adsorbed hydrogen or the reduction of adsorbed oxygen. Anodiza- tion378*72 from the potential of hydrogen evolution gives a slow increase in potential as adsorbed hydrogen is ionized to approximately 0.35 V (RHE). Then a sharp rise occurs while most of the charge passed goes into charging the double layer, to approximately 0.8 V (RHE). Finally, there is a slow linear increase, during which a layer of adsorbed oxygen is formed, to oxygen evolution at about 1.6 V @HE). Subsequent cathod- ization378 removes the adsorbed oxygen; as this process in- volves a high activation energy the potential drops sharply to an almost horizontal region at about 0.7 V (RHE). The po- tential then decreases further to the hydrogen evolution region. The flatter regions up to gas evolution are known as arrests.
If on anodizing the potential is not allowed to exceed about 0.8 V (RHE), the subsequent cathodic charging curve is iden- tical with the anodic one11’i3 and there is no hysteresis. This fact is made use of in area determinations using the hydrogen arrest. The electricity equivalent to a monolayer of hydrogen is foundT2 from the length of the hydrogen arrest in the charging curve. The necessary correction for double-layer charging can be simply achieved by extrapolating the linear double layer portion to 0 V (RHE). The charging curve can be determined either anodically or cathodically (see above), and it was claimed by the originator^'^ of this technique that, pro- vided the solution was free from oxygen and “negative metal
(72) A. N. Frumkin, Adoan. Electrochem. Electrochem. Eng., 3, 287 (1963). (73) B. Ershler, Discuss. Faraday SOC., 1,269 (1947). (74) F. P. Bowden and E. K. Rideal, Proc. Roy. SOC., Ser. A , 120, 59 (1928).
impurities”, these were the same. They also recommended that the current density should be high enough to make leakage currents negligible. However, on the whole two different schools of measurement have evolved and will be dealt with separately.
Anodic measurement of the hydrogen arrest was developed in Russia and has been thoroughly investigated for platinized platinum and platinum black. The measurements are car- ried out galvanostatically and are best” at moderate current densities (cu. 0.1 mA cm-z) where little or no hysteresis is found and the system is virtually in equilibriumi3 all the time. Comparison of the areas of various electrodes obtained by the krypton BET method with the lengths of the anodically determined hydrogen arrests has shown that the latter require 280 pC cm-2 for platinized platinum76 in 0.5 M sulfuric acid and for platinum blacksi6 in 0.05 M sulfuric acid, and 218 pC cm-2 for platinized platinum in 1 M HC1 and in 1 M KBr plus 0.03 MHCl75 and for platinum blacks in 0.5 M sulfuric acidUB3 The accuracy of these measurements was reckoned75 to be f 16 %. Nevertheless, it has been argued77 that the anodic mea- surement of the hydrogen arrest is unsatisfactory as a routine determination because allowance has to be made for the molecular hydrogen generated at the reversible hydrogen po- tential, as was f o ~ n d ~ ~ v ~ ~ for a Teflon-bonded platinum black electrode. The results in fact depended on the starting poten- tial. It must be noted that in most of the Russian charging curve workT2 the potential did not go below approximately 10 mV (RHE), so no molecular hydrogen would have been formed. However, in none of the experimental area calibra- t i o n ~ ~ ~ ~ ~ ~ ~ ~ ~ was the lower limit of potential stated.
The cathodic measurement of the hydrogen arrest was de- veloped chiefly in the United States but has not been experi- mentally tested like the anodic measurement. Galvanostatic ~ h a r g i n g ~ 5 ~ 7 7 ~ ~ ~ at high current densities (cu. 100 mA cm-*), where the areas were independent of the current, and cyclic voltammetry66*81t82 have been used. In the latter the areas of the appropriate current-voltage (time) regions are evaluated. Assuming that at the reversible hydrogen potential there was one atom of hydrogen per surface platinum atom it was cal- culated?’ that 210 pC cm+ was required. With l Mperchloric acid or 0.5 M sulfuric acid as electrolyte, this figure has been used for smooth46~B6,77~80~S1 and platinized46 platinum.
The analogous use of the oxygen arrests is not so straight- forward as for the hydrogen ones sinceE3 a condition of full coverage by oxygen is difficult to define. This is becauses3 sur- face oxides of differing thickness and/or formal valencies are produced (a full discussion on the nature of these surface ox- ides is given in ref 37a and 82, but contention still e x i ~ t s ~ ~ ~ ~ ~ ) .
(75) A. I. Pletyushkina, G. P. Khomchenko, and G: D. Vovchenko in “Kataliticheskie Reactsii v Zhidkoi Faze,” Akademlya Nauk Kazakh- skoi SSR, Kazakhskii Gosudarstvennyl Konferentsii, Alma-Ata, 1963, p 295. (76) G. A. Bogdanovskii, G. P. Khomchenko, and G. D. Vovchenko, Zh. Fir. Khim., 39, 1408 (1965); Russ. J . Phys. Chem., 39,747 (1965). (77) S. B. Brummer, J . Phys. Chem., 69,562 (1965). (78 J. Giner and J. M. Parry, U. S. Clearing House Fed. Sci. Tech. I n i r m . , AD 648727,82 (1967). (79) J. Giner, J. M. Parry, S. Smith, and M. Turchan, J. Elechochem. SOC., 116, 1692 (1969). (80) S. B. Brummer, J. I. Ford, and M. J. Turner, J. Phys. Chem., 69, 3424 (1965). (81) S. Gilman, Elecfrochim. Acta, 9,1025 (1964). (82) S. Gilman, Advan. Electroanal. Chem., 2 , 111 (1967). (83) D. Gilroy and B. E. Conway, Can. J. Chem., 46,875 (1968). (84) J. P. Hoare, J. Electrochem. SOC., 116,612,1390 (1969). (85) T. Biegler and R. Woods, J. Electrwnal. Chem., 20,73 (1969).
Platinized Platinum Electrodes Chemical Reviews, 1971, Vol. 71, No. 2 187
The correction for double-layer charging in the oxygen anodic arrest can be carried out by extrapolating the steep double-layer line to the potential just before oxygen evolution commences. For the cathodic arrest this correction must be calculated from capacitance data but is very small because the potential range covered is short. Measurement under galvano- static conditions was satisfactory, 37a although in one case7? roughening of the electrode resulted (see section 1V.D). A fairly high current density was always otherwise the lengths of the cathodic and anodic arrests differed. During the anodization there is a danger of oxygen dissolving in the platinum, but the effect of this can be circumvented37a by making fast cathodic measurements only. To reduce this danger even further, some workers have not cathodized from oxygen evolution but from 1.24 V,86 1.10 V (RHE),7E and 1.05 V (RHE);79 in the first case the electrolyte was 1 M sul- furic acid at 25O, so the potential corresponds to ca. 1.10 V (RHE), and for the other two cases the electrolyte was 85% orthophosphoric acid at 150". It was foundE6 that for cathod- ization from 1.24 V in 1 M sulfuric acid to be consistent with krypton BET measurements, 272 pC cm-2 was required for platinized platinum, as opposed to 347 pC cm-2 by compari- son with smooth platinum, and 355 pC cm-2 for Teflon- bonded platinum black electrodes. A very similar figure of 357 pC cm+ was obtained79 for Teflon-bonded platinum black electrodes in 85 Z orthophosphoric acid at 150' when cathod- ization was started at 1.05 V (RHE). Some workers have used values calculated from the packing density of platinum by assuming that a complete monolayer of oxygen is formed with a 1:l 0 : P t stoichiometry, giving87 420 pC cm-2 and4' 513 pC cm-2, according to the packing densities used. The charge equivalent to oxygen coverage has also been deter- mined by cyclic voltammetry. 4432
Finally, the double-layer differential capacitance as a mea- sure of surface area has been investigated in some detail. The classical ac bridge technique is not suitable for deter- mining the capacitances of platinized platinum electrodes be- cause their areas, and thus their capacitances, are too large. In essence, the method has been to take the slope of the charg- ing curve in the (linear) double layer region. The differential capacitance, C, is then given by
C = so"' Idt/AE
where I is the current which causes a change in potential of AE in a time At. Usually galvanostatic c o n d i t i o n ~ ~ ~ , ~ ~ have been employed so the slope could be measured directly and eq 15 used. Ershler73 recommended that moderate current
C = IAtfAE (15) densities be used; otherwise the system is not in equilibrium. If the potential is changed too quickly some of the current is still used for the hydrogen arrest (in the case of anodic charg- ing) or the oxygen arrest (cathodic charging). In a later modi- f i c a t i ~ n ~ ~ ~ * ~ applied to platinized platinum, the starting poten- tial was fixed by auxiliary dc polarization and a square-wave signal of low amplitude ( 6 20 mV) and frequency (2 Hz) was applied. The change with time of the potential across the test
(86) J. S. Mayell and S. H. Langer, J. Electrochem. SOC., 111, 438 (1964). (87) S. Schuldiner and R. M. Roe, ibid., 110,332 (1963). (88) R. J. Brodd and N. Hackerman, ibid., 104,704 (1957). (89) J. J. McMullen and N. Hackerman, ibid., 106,341 (1959).
electrode was recorded on a cathode ray oscilloscope. In more recent short constant-current pulses of less than 10-psec duration are employed so as to eliminate any faradaic contribution.
While the differential capacitance method is good44169J9 for smooth platinum, it is not usually ~ a t i s f a c t o r y ~ ~ ~ ~ ~ ~ ~ ~ for finely divided platinized platinum (although it has been successful on some occasions 4 2 1 E 8 ) or for Teflon-bonded platinum black fuel cell electrode^^^ and platinum b l a ~ k . ~ ~ ~ ~ ~ Its usefulness appears to be limited44 by the texture of the electrode, and deposits of high roughness factor and specific area may give anomalous results because63 the values of the capacitance in narrow pores are too high compared with those of a smooth surface. For platinized platinum the best figures, from com- parison with the krypton BET method, are: 36 f 5 pF cm+ in 0.5 M sulfuric acid,16 20 f 3 pF cm-2 in 1 M HC1 or 1 M KBr plus 0.03 M HCl,7s and 20.1 * 0.7 pF cm+ in 1 M so- dium sulfate solution.s8 The experimental conditions pertaining to the last figure were dubious. Measurements were taken using a square wave of frequency 2 Hz and of amplitude 20 mV centered on 445 mV or about 0.86 V (RHE). Since this is a little above the upper limit of the double-layer region, oxygen adsorption would affect the value of the capacitance measured. Values of about 20 pF cm-2 have been criticizeds2 for smooth platinum as being too low, and attributed to contamination.
B. DEPENDENCE O N PLATING CONDITIONS
The roughness factors reported in the literature vary over an enormous range. Extreme values as high as 3900 or even 20,000 were saidE8 to be obtained by a "standard" platiniza- tion procedure. However, usual values32~ 421 4 4 3 6 are 200-500, although roughness factors in excess of 2000 have been ~ l a i m e d , ' ~ * ~ ~ in one instance42 with the proviso that this was true only with large deposits (approximately 1 g of deposit per square centimeter of electrode). The actual value obtained de- pends on the amount of deposit, the composition of the plating solution, the current density of deposition, and the tempera- ture. The first three have been investigated at ambient tem- peratures only, but temperature itself seems to have been some- what neglected. Moreover, experiments designed to test the effect of the composition of the plating solution have all in fact just examined the effect of the lead acetate concentration.
1. Degree of Platinization The areas of platinized platinum electrodes increases'" 344 with degree of platinization, although the rate of this increase usually 3 4 , 4 2 as the platinization continues, or even attainss a maximum value. The available data are plotted in Figures 4,5, and 6.
The roughness factors of Figure 6 are almost ten times greater than those in Figure 4 and these, in turn, are some ten times greater than the ones in Figure 5. The C#J values in the last case might be expected to be well below the true values, partly becauseg0 of a faradaic contribution to the measured capaci- tance and partly because of the very small current density (0.7 mA cm-2) of platinization. This would normally lead to a low coulombic efficiency and the accumulation of PtC14*- in the plating solution, except that here the chloroplatinic acid concentration was correspondingly small. It is therefore a moot point whether the coulombic degree of platinization here is a fair guide to the mass degree of platinization. The exceed-
(90) F. S. Feates, D. J. G. Ives, and J. H. Pryor, ibid., 103,580 (1956).

188 Chemical Reviews, 1971, Vol. 71, No. 2 A. M. Feltham and M. Spiro
20 40 60 w,,mg cm+.
Figure 4. Variation of roughness factor + (0) and mass specific area um (0) of a platinized platinum deposit with mass degree of platinization um. Obtained from a 0.041 M (2%) chloroplatinic acid solution at 2.9 mA cm-* (from ref 11). Electrode surface areas were given in coulombs obtained from the anodically measured hydrogen arrest in 0.5 M sulfuric acid. They were converted to square centimeters by dividing by 280 p C cm-l (see section V.A). The geometric area was 34 cma.
ingly high roughness factors of Figure 6 may not be very reliable, as they are based on double-layer differential capaci- tance measurementss2 which, as already pointed out (section V.A), can be anomalously high.
Not only the magnitudes but also the shapes of the plots in the three diagrams differ markedly. The maximum in the roughness factor curve in Figure 5 is not encountered else- where, and the complete linearity shown in Figure 6 might be a consequence of the potentiostatic, as opposed to galvanostatic, plating conditions. A more likely explanation is proposed be- low. In a more recent and quantitative in which elec- trode area was measured by anodization in the hydrogen re- gion, eq 16 was found to relate roughness factor to deposition
4 = bt(1 - e+') (16) time, t , at 100 mA cm+ for the first 400 sec of plating from a 0.041 M (2%) chloroplatinic acid solution. The values of b and fl varied from about 0.3 to 1.3 sec-' and from about 0.0006 to 0.003 sec-I, respectively, depending on the pretreatment of the platinum substrate. For platinization from a 0.1 M (4.9 %) chloroplatinic acid plus 2 X 10⁻³ M (0.076%) lead acetate solution at 100 mA cm-2 the area increased linearly with time (as in Figure 6) or with mass of deposit. From the figures given we calculate that after t sec
4 = (3.8 X 10⁻⁹)t (17)
by dividing the rate of area increase, found by the hydrogen arrest method, by 280 pC cm+. The pretreatment of the sub- strate had no effect in this case.
At 10 mA cm-2, with the same lead-containing solution, the
(91) M. W. BreXerJ. Electroanal. Chem., 7,38 (1964). 92) C. Bernard and J. Clavilier, C. R. Acad. ScL, Ser. C, 263, 1340 I1966).
30
q
20 0
3, 0
l A
10
0 0 20 40 60
O,,C cm-2.
Figure 5. Variation of roughness factor + (0) and coulombic specific area uo (0) of a platinized platinum deposit with coulombic degree of platinization u0. Obtained from a 0.006 M (0.3 %) chloro- platinic acid plus 6.6 X M (0.025%;) lead acetate solution, 0.025 M in hydrochloric acid, at 0.7 mA cm-* for 10 min with current reversal every 10 sec (from ref 5). The experimental data were polarization capacitances, at 700-3070 Hz, in a conductance cell containing two circular platinum electrodes of 3-cm diameter and 0.85 cm apart, with the plating solution as electrolyte. The resulting parallel plate capacitance is negligible (ca. 60 pF) com- pared to the polarization capacitances (30-8000 pF) with which it is in parallel.@o Values obtained at91 1 kHz were doubled (two electrodes in series) and divided by 20 pF cm-* to give areas. Roughness factors were obtained by using A = 14.14 cmz. This gives + = 0.26 for the unplatinized electrode, and a better area measure might therefore be obtained by multiplying all values by 4.
relationship between area and time or mass of deposit was no longer linear. The deposition rate varied with electrode pre- treatment, and the rate of increase in surface area decreased with deposition time, as in Figures 4 and 5. The experimental data followed the equation
where i is the current density of 10 mA cm-*, and g varies from about 650 to 850 and y from about 0.3 to 0.4, depending on the nature of the substrate surface. Equations 17 and 18 taken together suggest that at high current densities specific area is approximately constant with time of plating (or degree of platinization), whereas at low current densities specific area decreases with time of plating. This is confirmed by Figures 4-6, for the potentials of deposition of Figure 6 are of a mag- nitudeSz to give current densities higher than those of Figures 4 and 5.
As expected, this general rise in area with degree of platiniza- tion (with the exception of Figure 5 ) is reflected in a continued enhancement of electrode activity as more platinum is depos- ited. An example is foundg3 in the electrooxidation of meth- anol.
(93) M. Prigent, Rev. Gen. Elec., 74, 69 (1965).

Platinized Platinum Electrodes Chemical Reviews, 1971, Voi. 71, No. 2 189
2. Lead Acetate Concentration The concentration of lead acetate used in the plating solution affects the roughness factor of the final deposit. The mass specific areas of deposits34 prepared at 100 mA cm+ from 0.1 M (4.9%) chloroplatinic acid solutions decreased as the lead acetate concentration was raised from M (0.0038 %) to 0.05 M (1.9%). The magnitude and type of decrease were not specified. On the other hand, T h a ~ k e r , ~ ~ who had used only 10 mA cm-2, found that the area, measured by the oxygen arrest technique, was a maximum at a PbjPt atomic ratio of 0.0021, which corresponds to a lead acetate concentration of 8 X M (0.003 %). This is shown in Table IV and Figure 7. Rather more indirect evidence on the area-lead content rela- tionship is provided by the measurements of Hevesy and Somiya. lo From their cathodic polarization data we have esti- mated a measure of the surface area as described under Figure 8. The diagram displays an area maximum at a PbjPt atomic ratio of approximately 0.0054.01 which corresponds to a lead acetate concentration of ca. 2.5 X M (0.01 %), but there is no minimum at higher lead acetate concentrations as there is in Figure 7. This worklo and T h a c k e r ' ~ ~ ~ taken together indicate that the area would be maximized by employing a lead acetate concentration of about 1.3 X M (0.005%). These two pieces of work are augmented by a studyg3 on the variation of electrode activity, to methanol oxidation in 2 M MeOH + 3 M H2S04 solution at 25"C, with the lead acetate concentration of the plating solution. For a 0.103 M ( 5 % ) plating solution of chloroplatinic acid and deposition at a con- stant potential of 250 mV (RHE), maximum activity of the electrode occurred for a lead acetate concentration of 5.3 X
M (0.02%); however, at deposition potentials of +50 or - 50 mV, monotonic increases in electrode activity with lead acetate concentration were found up to 4 X 10⁻³ M (0.15 %). Unfortunately this work is not strictly comparable with that discussed above, partly because a different property was mea- sured and partly because of the potentiostatic conditions of preparation. The potentials employed probably correspond32 to current densities rather larger than the 10 mA cm-2 used by T h a ~ k e r ~ ~ and by Hevesy and Somiya.lo
It should be added that both the area and the activity mea- surements were carried out in acid solution. Introduction of oxygen at any stage would have resultedao in some leaching of the lead from the surface layer and a possible concomitant change in area.
3. Current Density
When the solution composition as well as the mass of deposit are kept constant, the area can clearly be seen to depend upon the current density employed (Figure 9). The type of informa- tion conveyed in Figure 10, though superficially similar, differs because in the paper in question42 the masses of deposit ranged from 1 to 23 g, and the specific area varies with the mass of deposit (cJ Figures 4 and 5) . A third piece of information can be deduced from a set of current-voltage c ~ r v e s 6 ~ for plati- nized platinum electrodes carried out in 1 MHCl under 1 atm of hydrogen. The composition of the plating solution was not stated. According to the legend of Figure 8, the initial slopes of current us. voltage should be approximately proportional to area. Estimation of the slopes is made ditficult by the small size of the graph on which the results are plotted,O4 but the diagram does show that the area tended to increase with cur-
io r
w,.C cm-2.
Figure 6. Variation of roughness factor 6 of a platinized platinum deposit with coulombic degree of platinization coo. Obtained from a 0.05 M (2.4%) chloroplatinic acid plus 2.7 X lod4 M (0.01 %) lead acetate solution at a series of constant potentials; from ref 5 5 : 0, 195 mV; 0, 220 mV; 0, 245 mV; H, 295 mV; A, 345 mV. The experimental data, in farads per geometric square centimeter in 0.05 M KCI solution, were converted to roughness factors by dividing by 20 pF cm-*.
[Lead ocetote],103M.
200 0.01 0.02
Figure 7. Variation of roughness factor + of a platinized platinum deposit with lead content (0) and with the lead acetate concen- tration of the plating solution (0); obtained with a 0.051 M (2.5%) chloroplatinic acid solution at 10 mA cm-2 for 1 hr with current reversal every 1.5 min; from ref 44.
Pb/Pt atomic ratio in deposit.
rent density of platinization up to a value of 45 mA cm-3. There is no evidence of any maximum.
Roth and L a ~ k o , * ~ who used a solution 0.1 M (4.9%) in chloroplatinic acid plus 2 X lo-* M (0.076%) in lead acetate, presented their area results in two forms. For a constant quantity of electricity during platinization, 9 was plotted against i. The form of this plot was essentially the same for all platinum substrates in spite of various pretreatments

190 Chemical Reviews, 1971, Vol. 71, No. 2 A. M. Feltham and M. Spiro
CLead acefatey, IC‘M 0 I 2 3
0 0.02 0.04 0.06 Pb/Pt atomic ra t io in deposit.
Figure 8. Variation of the “area” of a platinized platinum deposit with lead content and with the lead acetate concentration of the plating solution. Obtained from a 0.062 M (3%) chloroplatinic acid solution 0.2 M in HCl. The current density was stated to be 10 cm2, probably a misprint for 10 mA cm+ (from ref 10). A measure of the area has been derived from cathodic overpotential measurements in 0.5 M sulfuric acid at a constant current density of 20 mA/cm2 of geometric area. Current (I) us. overpotential (7) curves are functions of the exchange current density (io) or the exchange current ( I , = ioS). At constant current, q increases as ZO decreases, and (if io is constant) the smaller Io, the smaller is the area S. In the special case when overpotentials are <ca. 20 mV, I/q = dI/dq = Io(nF/vRT) = io S(nF/rRT), where IZ = number of electrons, Y = stoichiometric number. Thus, at constant current and small overpotentials, S 0: 1/17. In this way measures of “area”, in A V-’ cm-2 of geometric area, have been deduced from the data in ref 10.
2o t OO k 5 IO 15
i , mA cm.‘.
Figure 9. Dependence of the mass specific area um of a platinized platinum deposit on the current density of platinization, i; obtained from a 0.041 M (2 %) chloroplatinic acid solution, giving a constant mass of deposit of 0.71 g (from ref 11).
(section IV.B.1) and showed a maximum roughness factor of about 200 at i = 20 mA cm+ (using the conversion factor em- ployed for eq 17). Since the coulombic efficiency varies with current density, the results cannot be directly related to those of Figures 9 and 10. However, the results were fitted3’ in terms of mass specific area to the equation
um = ht(i/t)’ (19) where it = constant, and from their logarithmic plot of um/t against i/t, E is close to 0.5. It follows that u, is almost inde- pendent of current density.
These four area-current density determinations seem united only by their diversity. In one case” the mass specific area de- creases monotonically as i increases, in another 42 it increases monotonically, in a third42 it passes through a maximum at 250 mA cm-2, and in yet another34 it is altogether independent of current density. Of the two studies of roughness factor, one04 shows 4 increasing continuously with i and the other34 records a maximum in I$ at 20 mA cm+. One’s scientific mo- rale is sustained only by the thought that these differences may have arisen as a result of the diversity of plating conditions, and by the hope that further, carefully planned, studies may disentangle the variables. It is strongly recommended that, in the future, workers always describe their surfaces in terms of roughness factors as well as specific areas.
Some complementary evidence is available from plating experiments carried out under potentiostatic conditions. The dependence of roughness factor on the (constant) potentials66 of platinization, shown in Figure 6, points to a maximum roughness factor at a potential of approximately 230 mV. This is illustrated more clearly in Figure 11, in which the slopes of the lines in Figure 6 (Le,, the coulombic specific areas) have been plotted against the potentials of platinization. Since lower (more cathodic) plating potentials correspond to higher current densities, it follows from Figure 11 that the roughness factor should pass through a maximum with increasing cur- rent density. The decrease in coulombic specific area shown at deposition potentials more anodic than 230 mV may be explained as being due to a decrease in coulombic efficiency as F’tC142- is produced and accumulates. The researches below confirm that, at potentials up to +230 mV, higher areas are obtained at more positive potentials. In one such s t ~ d y , ~ ~ , 9 4 i n which deposits were prepared from
0.041 M (2%) chloroplatinic acid solution 1.5 M in sulfuric acid, the mass specific area (measured by the hydrogen arrest technique) rose from 40-70 cm2 mg-l when deposited be- tween - 50 and +50 mV (RHE) to 170-200 cm2 mg-l when de- posited at potentials above + 150 mV (RHE). The activities of these electrodes to the electrooxidation of methanol increased by factors of 8-10 when the deposition potential was changed from -50 to +250 mV (RHE), and most of this change oc- curred for potentials between - 50 and + 50 mV (RHE). How- ever, the mass degree of platinization ranged from 5 to 15 mg cm-2, and this detracts from the usefulness of the above ob- servations. A similar trend was foundga for electrodes prepared from a 0.103 M (5%;) chloroplatinic acid plus 5.3 X lo-‘ M (0.02 %) lead acetate solution, but here most of the change in activity occurred between +50 and $250 mV. In a fourth paper,59 the electrodeposition from a 0.051 M (2.5%) chloro- platinic acid solution 1 Min HC1 was studied at the controlled potentials 0, 50, and 150 mV; both the areas determined by the hydrogen arrest technique and by differential capacitance at 0.6 V showed a very large increase for a given mass of deposit when the deposition potential was changed from 0 to 50 mV, and this was confirmed visually from electron micro- graphs. X-Ray diffraction line broadening indicatedK9 particle diameters of 24 and 15 nm, respectively, for these two de-
(94) B. I. Podlovchenko and R. P. Petukhova, Elektrokhimiya, 5, 380 (1969); SOD. Electrochem., 5,349 (1969).

Platinized Platinum Electrodes Chemical Reviews, 1971, Vol. 71, No. 2 191
position potentials, and it was concluded that at the lower potential a high coverage of hydrogen on the platinum surface inhibited the nucleation process, with a consequent increase in particle size and a smaller surface area. Furthermore, in deposition from 0.041 M (2 %) chloroplatinic acid solution 1.5 M in sulfuric acid, the platinized platinum crystallite diameters were foundaa by X-rays to be ca. 30 nm at a deposi- tion potential of 0 mV (RHE) (ca. -20 mV (NHE)) and ca. 20 nm at +250 mV (RHE). The platinum lattice constant did not change with deposition potential. a a
It is easier to explain the phenomena observed during electrodeposition if constant potential rather than constant current is employed, but, however the plating is carried out, whether potentiostatically or galvanostatically, both poten- tials and current densities should be reported. Although the value of the uncontrolled variable will change32 somewhat during the course of plating, an average value, with the range of variation if it is significantly large, would provide valuable information for subsequent workers.
4. Temperature
The effect of the temperature of deposition on the area of platinized platinum electrodes has received but little attention. Electrodes preparedaaqV4 from a 0.041 M (2 %) chloroplatinic acid solution 1.5 M in sulfuric acid at -20, +4, and +8OoC displayed the same type of dependence of activity (to the electrooxidation of methanol) on deposition potential as did that prepared at +20°C. Deposits obtained at 200-250 mV (RHE) (180-230 mV) in the temperature range -20 to +80°C had similar values of mass specific area and practically the Same activity despite a 30-fold variation in deposition currents. Since mass specific area depends on current density as well as on degree of platinization, these two factors appear to have compensated one another.
C. REPRODUCIBILITY
In the literature there are widely differing reports about the reproducibility of platinized platinum electrodes. The data in Figure 12, for example, show a reproducibility of 5-10%;. Electrodes prepared96 from 0.103 M (5 %) chloroplatinic acid plus 5.3 X M (0.02%) lead acetate solution at 120 mA cm-2 gave activities for the TP-TIITI electron exchange catal- ysis which were reproducible to 5 %. Even better consistency was obtained61 in work on the anodic polarography of dex- trose; rotating disk electrodes prepared from 0.062 M (3 %) chloroplatinic acid plus 1.6 X 10+ M (0.06%) lead acetate at 152 mA cmd2 and 1300 rpm gave polarographic currents re- producible to 2 %. In contradistinction, Joncich and Hacker- man42 found that platinization was only “reproducible” when no lead acetate was added. Using a solution 0.049 M (2.4Z) in chloroplatinic acid and 2.5 X 10⁻⁶ M (0.001~) in lead acetate, and 210 mA cm+, they obtained samples of specific areas 8.9 and 15 cm2 mg-l after 30 min of plating and samples of specific areas 2.9 and 6.8 cm2 mg-l after 120 min. A solution of 0.09 M (4.4 %) chloroplatinic acid containing no lead ace- tate, with a current density of 150 mA cm-*, gave samples of specific areas 1.5 and 2.0 cm2 mg-l (or with roughness factors of 350 and 620, respectively); the time of plating was not given. Thus, even these “reproducible” results are not very
i, mA cm-2.
Figure 10. Dependence of the mass specific area um of a platinized platinum deposit on the current density of platinization, i; ob- tainedyfrom 0.205 M (10.0%, 0) and 0.090 M (4.4%, 0) chloro- platinic acid solutions 0.86 M in HCI, giving deposits of masses from 1 to 23 g (from ref 42).
promising, although the reproducibility of two points in Figure 10 is good to 5 %.
D. DECREASE WITH TIME
It is highly desirable for the area not to change with time. This will be so for surfaces which are not far from thermody- namic equilibrium or which have a low surface self-diffusion coefficient, D,. Its value for platinum, over all orientations, was found86 from the interference microscopic observation of
(95) I. R. Jonasson and D. R. Stranks, Electrochim. Acta, 13, 1147 (1968). (96) J. M. Blakely and H. Mykura, Acta Met., 10,565 (1962).

192 Chemical Reviews, 1971, Vol. 71, No. 2 A. ffl. Feltham and M. Spiro
"0 10 20 30 Time, days.
Figure 12. The decrease in area with time of platinized platinum electrodes. They were immersed in 5 M orthophosphoric acid and maintained at 25°C for the first 12 days and at 80°C for 7 hr/day on 13 of the remaining 22 days. All three electrodes (0, 0, A) were prepared from a 0.051 M ( 2 . 5 x ) chloroplatinic acid plus 8 X lo-' M (0.003 %) lead acetate solution, at 10 mA cm+ for 1 hr with current reversal every 1.5 min (from ref 98).
the decay of sets of parallel scratches on platinum crystal surfaces, and obeyed eq 20 between 890 and 131OoC, where
D, = DO exp(- QJRT) (20)
DO = 4 X cm2 sec-1 and Q = 108 rt 10 kJ mol-'. The coefficients were strongly orientation dependent. The Arrhen- ius equation was also verifiedg7 by field-electron emission microscopy in the temperature range 823 to 1123'C, and the activation energy of 123 13 kJ mol-' is in quite good agree- ment with the previous value. If eq 20 applies down to room temperature, D. at 25" is 4.7 X cm2 sec-'; this corre- sponds to a mean diffusion distance for a single atom of 3 X
cmisec or 2.6 X 10⁻⁶ cm/day. Whether there is any net movement of material in a given direction will depend on the existence of a gradient of chemical potential on or up to the surface. Such a gradient might well be present on a freshly pre- pared platinized platinum deposit, and appreciable sintering would then be expected. For the evidence we must turn to the literature.
An electrode freshly prepared" from a 0.041 M (2 %) chlo- roplatinic acid solution decreased in area by about 30 % in 2-3 months, which averages out as 0.4% per day. The changes of area with timeQ8 of three identically prepared platinized plati- num electrodes in 5 M orthophosphoric acid at 25 and 80°C are shown in Figure 12. The decrease in area is only about 0.8% per day at 25' but becomes ten times as large when the temperature is kept at 80' for 7 hr a day. A Teflon-bonded platinum black electrode79 lost 4.4% of its area per day when stored in 85 % orthophosphoric acid at 150°C.
These long-term linear decay results stand in constrast with other observations which point to rapid initial decay which levels off. A platinized platinum electrode, prepared as de- scribed in Figure 6 but with the potential of deposition not mentioned, was periodically immer~ed'~ in 0.05 MKCl solution and the double-layer differential capacitance measured after IO min and again after 18 hr. Between each such pair of mea- surements the electrode was stored in air in an antidust con- tainer for many weeks. After only 1 day of ageing the differen- tial capacitance decreased by 20 during the 18 hr of immer- sion, but the subsequent rate of decrease was only 13% over the next 6 months, or an average of 0.07% per day. It is not
(97) A. J. Melmed, J. Appl. Phys., 38, 1885 (1967). (98) R. Thacker, Nature (London), 212, 182 (1966).
clear whether the initial drop was caused by a genuine contrac- tion in area or by a process of equilibration (perhaps involving adsorption) at the interface. Deactivation by contamination is also a distinct possibility, although Bernard65 discounted this on the grounds that the solutions were very pure. Evidence for incidental contamination comes from the observationaa that severe poisoning of a smooth platinum electrode occurred when it was left in "pure" 1 M sulfuric acid for long periods (hours) at open circuit or held at potentials below about 0.9 V. Also, the mass specific area of precipitated platinum black63 found from double-layer capacitance in 0.5 M sulfuric acid decreased sharply, while the (lower) value determined by ben- zene adsorption changed only slightly. The period of time in- volved and the storage environment were not stated. Further support for the initially rapid type of decay comes from catal- ysis studies. On a platinized platinum rotating disk electrode (of unspecified preparation) the cathodic hydrogen diffusion current Z was measuredg9 and found to vary with the rotation speed w according to
The existence of the intercept a was ascribed to the fact that the active site density p on the surface was not infinite and, from a, values of p were derived. They were found to decrease from >lo" cm-2 immediately after platinkition to 1.3 x 101o cm-2 6 days later and 0.6 X 10'0 cm-2 after 12 days. In fuel cell work,03 electrodes deposited from 0.103 M ( 5 7 3 chloroplatinic acid plus 5.3 X M (0.02%) lead acetate solution displayed activities to methanol oxidation which stabilized in approximately 3-6 weeks to values which were only 20-30% of the initial activities. Perhaps the essence of this type of decay lies in the interaction of the surface with gases. It was noted long ago"Jo that prolonged exposure of platinized platinum to air destroyed its activity for use as a hydrogen electrode and also reduced its wettability. The type of gas is important too: the area (as measured by the hydrogen arrest) of a platinized platinum electrode (of unspecified prep- aration) decreased101 in 2 hr by 8 % when maintained at 100°C in air and by 50% at 3OO0C, but sintering at 300' in hydrogen for 2 hr diminished the area by a factor of 30.
The decrease in area is more rapid if the electrodes are kept in a polarized state. Thus, the roughness factor of a platinum electrode, 45 platinized from 0.041 M (2 %) chloroplatinic acid solution 1 Min HC1 at 50 mV, dropped from 2380 to 97 in 100 hr when kept at 0.6 V in 0.5 M sulfuric acid plus 1 M acetic acid at 94°C. Similarly, an electrode3a that was being ano- dically polarized at 5 mA cm+ at 80°C, and which had been plated from 0.041 M (2%) chloroplatinic acid solution 1.5 M in sulfuric acid at 2OoC, lost 69% of its initial surface in 48 hr. However, the area lost was only 28 in 48 hr if the electrode had been prepared instead at 80°C. It was suggestedaa that more regular crystals had been formed at 80°C and that these recrystallized less on standing.
Bright-plated electrodes, obtained by using chloroplatinous acid, were initially active48 as hydrogen electrodes but lost their activity rather rapidly, especially when stored in hydro- gen.
(99) F. Nagy, Gy. Horanyi, and Gy. Vertes, Acta Chim. Acad. Sci. Hung., 34.35 (1962). (100) C. N. Myers and S. F. Acree, Amer. Chem. J., 50,396 (1913). (101) A. Frumkin and A. Slygin, Acfu Physicochim. URSS, 5, 819 (1936).
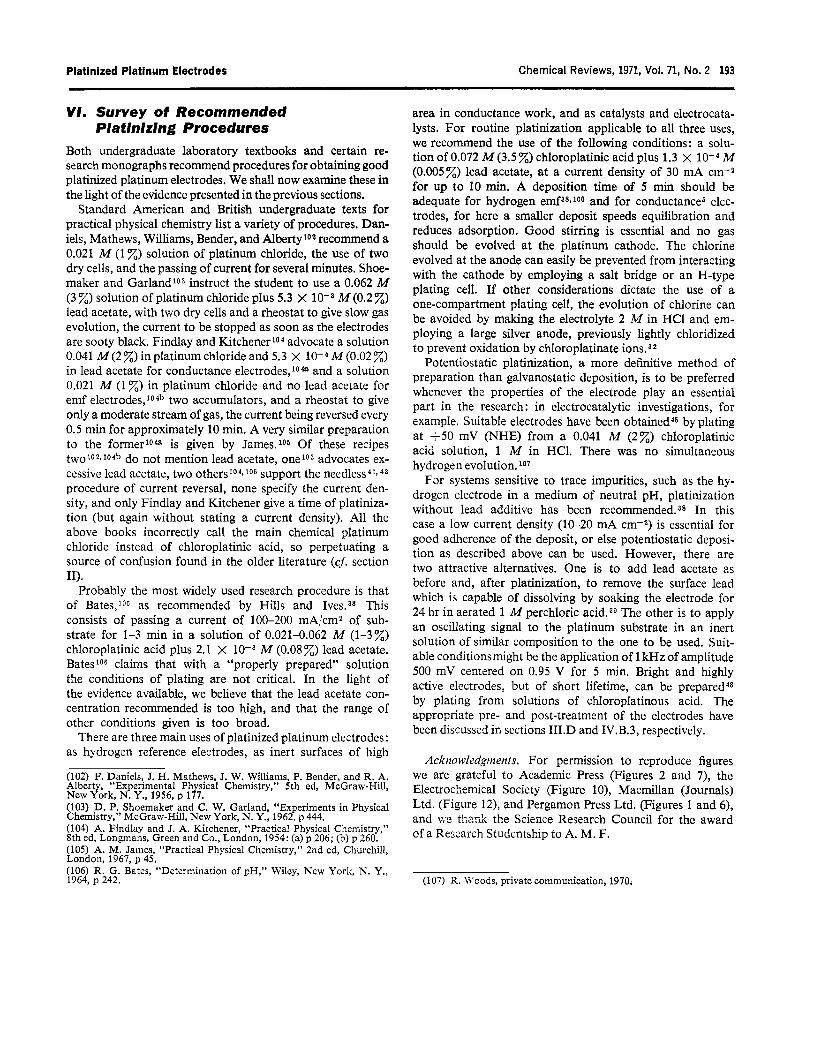
Platinized Platinum Electrodes Chemical Reviews, 1971, Vol. 71, No. 2 193
VI . Survey of Recommended Platinizing Procedures
Both undergraduate laboratory textbooks and certain re- search monographs recommend procedures for obtaining good platinized platinum electrodes. We shall now examine these in the light of the evidence presented in the previous sections.
Standard American and British undergraduate texts for practical physical chemistry list a variety of procedures. Dan- iels, Mathews, Williams, Bender, and Alberty102 recommend a 0.021 M (1 %) solution of platinum chloride, the use of two dry cells, and the passing of current for several minutes. Shoe- maker and Garland*03 instruct the student to use a 0.062 M (3 %) solution of platinum chloride plus 5.3 X M(0.273 lead acetate, with two dry cells and a rheostat to give slow gas evolution, the current to be stopped as soon as the electrodes are sooty black. Findlay and Kitchener’o4 advocate a solution 0.041 M (2 %) in platinum chloride and 5.3 X M (0.02 %) in lead acetate for conductance electrodes,”Ja and a solution 0.021 M (1 %) in platinum chloride and no lead acetate for emf e l e c t r ~ d e s , ~ o ~ ~ two accumulators, and a rheostat to give only a moderate stream of gas, the current being reversed every 0.5 min for approximately 10 min. A very similar preparation to the former104a is given by James.1°5 Of these recipes two1021104b do not mention lead acetate, one1O3 advocates ex- cessive lead acetate, two other^^^^^ lo5 support the needless4l$ 4 3
procedure of current reversal, none specify the current den- sity, and only Findlay and Kitchener give a time of platiniza- tion (but again without stating a current density). All the above books incorrectly call the main chemical platinum chloride instead of chloroplatinic acid, so perpetuating a source of confusion found in the older literature (cf. section 11).
Probably the most widely used research procedure is that of Bates,Io6 as recommended by Hills and Ivesa3* This consists of passing a current of 100-200 mA/cm2 of sub- strate for 1-3 min in a solution of 0.021-0.062 M (1-3Z) chloroplatinic acid plus 2.1 X M (0.08%) lead acetate. Bateslo6 claims that with a “properly prepared” solution the conditions of plating are not critical. In the light of the evidence available, we believe that the lead acetate con- centration recommended is too high, and that the range of other conditions given is too broad.
There are three main uses of platinized platinum electrodes: as hydrogen reference electrodes, as inert surfaces of high
(102) F. Daniels, J. H. Mathews, J. W. Williams, P. Bender, and R. A. Alberty, “Experimental Physical Chemistry,” 5th ed, McGraw-Hill, New York. N. Y.. 1956. u 177.
~ I _
(103) D. P. Shoemaker and C. W. Garland, “Experiments in Physical Chemistry,” McGraw-Hill, New York, N. Y., 1962, p 444. (104) A. Findlay and J. A. Kitchener, “Practical Physical Chemistry,” 8th ed, Longmans, Green and Co., London, 1954: (a) p 206; (b) p 260. (105) A. M. James, “Practical Physical Chemistry,” 2nd ed, Churchill, London. 1967. u 45.
I I .
(106) R. G. Bates, “Determination of pH,” Wiley, New York, N. Y., 1964, p 242.
area in conductance work, and as catalysts and electrocata- lysts. For routine platinization applicable to all three uses, we recommend the use of the following conditions: a solu- tion of 0.072 M (3.5 Z) chloroplatinic acid plus 1.3 X M (0.005%) lead acetate, at a current density of 30 mA cm-* for up to 10 min. A deposition time of 5 min should be adequate for hydrogen emfast loo and for conductance6 elec- trodes, for here a smaller deposit speeds equilibration and reduces adsorption. Good stirring is essential and no gas should be evolved at the platinum cathode. The chlorine evolved at the anode can easily be prevented from interacting with the cathode by employing a salt bridge or an H-type plating cell. If other considerations dictate the use of a one-compartment plating cell, the evolution of chlorine can be avoided by making the electrolyte 2 M in HC1 and em- ploying a large silver anode, previously lightly chloridized to prevent oxidation by chloroplatinate ions. 3 2
Potentiostatic platinization, a more definitive method of preparation than galvanostatic deposition, is to be preferred whenever the properties of the electrode play an essential part in the research: in electrocatalytic investigations, for example. Suitable electrodes have been obtained45 by plating at +50 mV (NHE) from a 0.041 M (2%) chloroplatinic acid solution, 1 M in HCI. There was no simultaneous hydrogen evolution. 107
For systems sensitive to trace impurities, such as the hy- drogen electrode in a medium of neutral pH, platinization without lead additive has been recommended. 38 In this case a low current density (10-20 mA cm-2) is essential for good adherence of the deposit, or else potentiostatic deposi- tion as described above can be used. However, there are two attractive alternatives. One is to add lead acetate BS before and, after platinization, to remove the surface lead which is capable of dissolving by soaking the electrode for 24 hr in aerated 1 M perchloric acid.30 The other is to apply an oscillating signal to the platinum substrate in an inert solution of similar composition to the one to be used. Suit- able conditionsmight be the application of 1 kHz of amplitude 500 mV centered on 0.95 V for 5 min. Bright and highly active electrodes, but of short lifetime, can be prepared48 by plating from solutions of chloroplatinous acid. The appropriate pre- and post-treatment of the electrodes have been discussed in sections 1II.D and IV.B.3, respectively.
Acknowledgments. For permission to reproduce figures we are grateful to Academic Press (Figures 2 and 7), the Electrochemical Society (Figure lo), Macmillan (Journals) Ltd. (Figure 12), and Pergamon Press Ltd. (Figures 1 and 6), and we thank the Science Research Council for the awzrd of a Research Studentship to A. M. F.
(107) R. WGods, private communication, 1970;