Embed Size (px)
Citation preview
Executive Summary
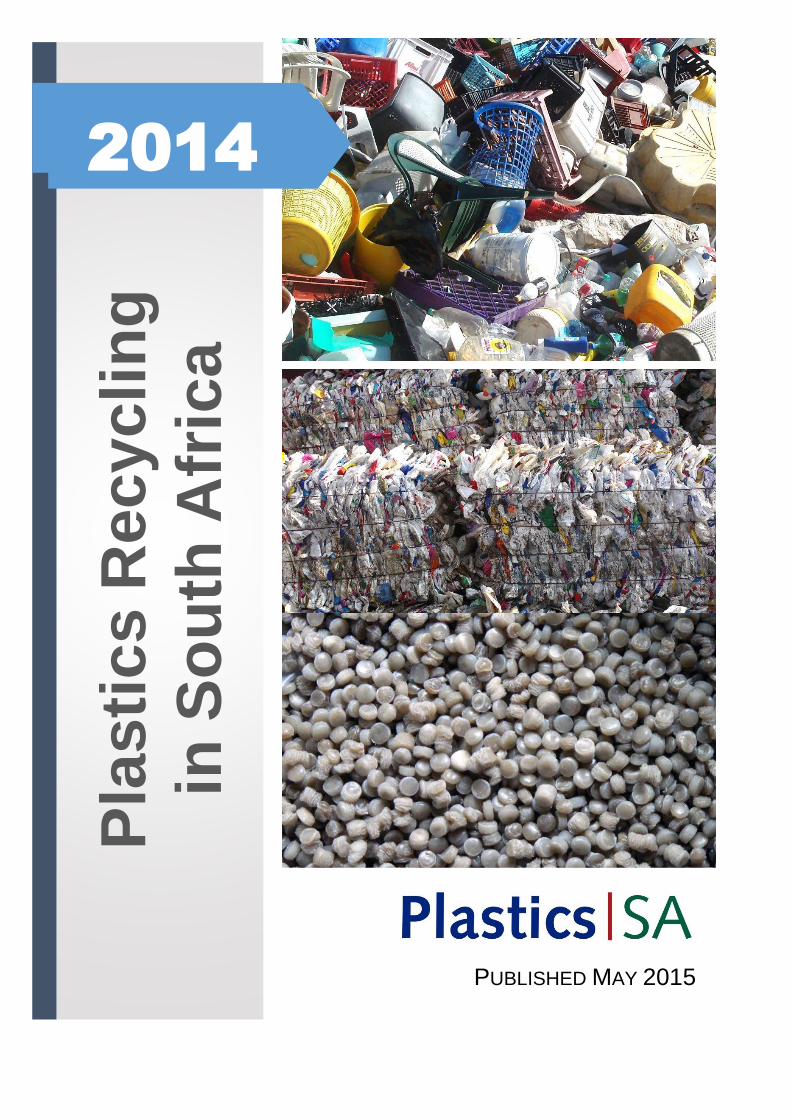
PUBLISHED MAY 2015
Pla
sti
cs R
ecyc
lin
g
in S
ou
th A
fric
a
2014 2014
Executive Summary
&
Survey of the South African Plastics Recycling Industry
in 2014, conducted by Plastix 911 for Plastics|SA
EXECUTIVE SUMMARY
COPYRIGHT: ALL RIGHTS RESERVED This survey is the property of Plastics|SA. No part of this publication may be reproduced, stored in a retrieval system or transmitted in any form or by any means, electronic, mechanical, recording or otherwise, without the prior permission of Plastics|SA.
May 2015
Executive Summary
Plastics Recycling in SA – 2014 Page c
PLASTICS RECYCLING IN SA - EXECUTIVE SUMMARY
Introduction
To provide information to its members, government and the wider community, Plastics|SA
collects data annually on plastics manufacturing, imports, local processing and exports for
reprocessing through the Plastics Recycling Survey. In 2015, Plastix 911 was commissioned by
Plastics|SA to conduct the survey for the 2014 calendar year.
The survey continues to give an excellent picture of the flow of plastics products in South Africa,
the state of the plastics recycling industry and the recyclate markets. The survey is seen as a
valuable tool for the promotion and knowledge of the industry, forward planning and informs
policy development. It also supports product stewardship commitments and assists in setting
targets for end-of-life solutions.
Key findings
The key findings of the 2014 Plastics|SA Plastics Recycling Survey are as follows:
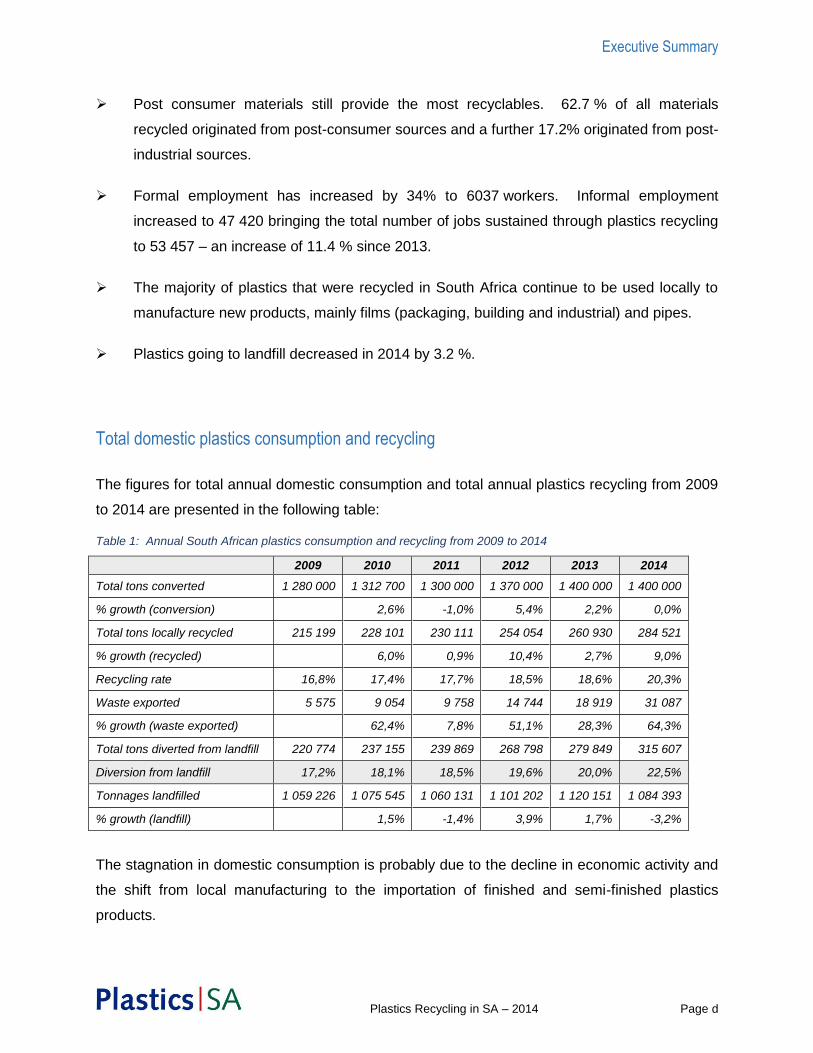
A total of 1 400 000 tons of plastics from domestic production and imported materials were
converted in South Africa in 2014. The total amount is the same as that of 2013 although
individual materials have increased and others decreased in tonnages.
A total of 315 600 tons of plastics were diverted from landfill in 2014. This is an increase
of 9 % from 2013.
The diversion from landfill rate was 22.5%, increasing from 20.0 % in 2013.
Of the 315 600 tons of plastics diverted from landfill, 284 520 tons (90.2 %) were
mechanically recycled in South Africa and 31 087 tons (9.8 %) were exported for recycling
elsewhere. The proportion of plastics recycled in South Africa has decreased from 97.6 %
in 2009 to 90.2 % in 2014. Domestic plastics recyclers are concerned about the tonnages
exported from South Africa.
Executive Summary
Plastics Recycling in SA – 2014 Page d
Post consumer materials still provide the most recyclables. 62.7 % of all materials
recycled originated from post-consumer sources and a further 17.2% originated from post-
industrial sources.
Formal employment has increased by 34% to 6037 workers. Informal employment
increased to 47 420 bringing the total number of jobs sustained through plastics recycling
to 53 457 – an increase of 11.4 % since 2013.
The majority of plastics that were recycled in South Africa continue to be used locally to
manufacture new products, mainly films (packaging, building and industrial) and pipes.
Plastics going to landfill decreased in 2014 by 3.2 %.
Total domestic plastics consumption and recycling
The figures for total annual domestic consumption and total annual plastics recycling from 2009
to 2014 are presented in the following table:
Table 1: Annual South African plastics consumption and recycling from 2009 to 2014
2009 2010 2011 2012 2013 2014
Total tons converted 1 280 000 1 312 700 1 300 000 1 370 000 1 400 000 1 400 000
% growth (conversion)
2,6% -1,0% 5,4% 2,2% 0,0%
Total tons locally recycled 215 199 228 101 230 111 254 054 260 930 284 521
% growth (recycled)
6,0% 0,9% 10,4% 2,7% 9,0%
Recycling rate 16,8% 17,4% 17,7% 18,5% 18,6% 20,3%
Waste exported 5 575 9 054 9 758 14 744 18 919 31 087
% growth (waste exported)
62,4% 7,8% 51,1% 28,3% 64,3%
Total tons diverted from landfill 220 774 237 155 239 869 268 798 279 849 315 607
Diversion from landfill 17,2% 18,1% 18,5% 19,6% 20,0% 22,5%
Tonnages landfilled 1 059 226 1 075 545 1 060 131 1 101 202 1 120 151 1 084 393
% growth (landfill)
1,5% -1,4% 3,9% 1,7% -3,2%
The stagnation in domestic consumption is probably due to the decline in economic activity and
the shift from local manufacturing to the importation of finished and semi-finished plastics
products.
Executive Summary
Plastics Recycling in SA – 2014 Page e
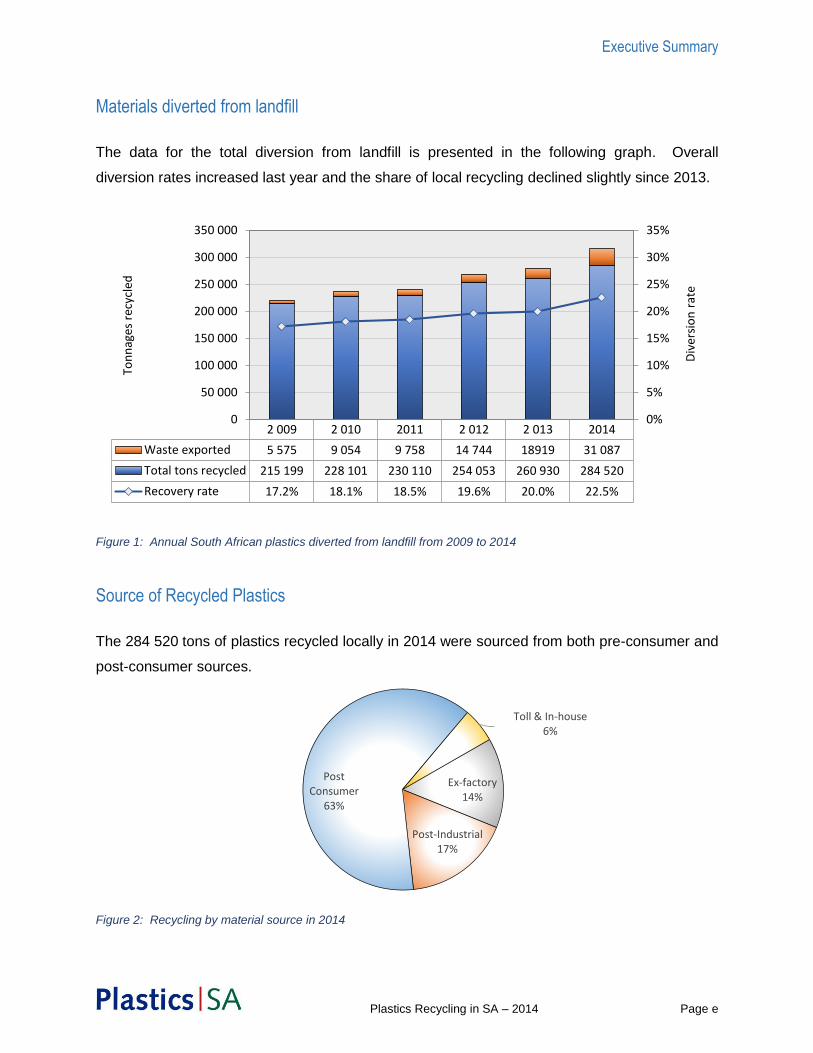
Materials diverted from landfill
The data for the total diversion from landfill is presented in the following graph. Overall
diversion rates increased last year and the share of local recycling declined slightly since 2013.
Figure 1: Annual South African plastics diverted from landfill from 2009 to 2014
Source of Recycled Plastics
The 284 520 tons of plastics recycled locally in 2014 were sourced from both pre-consumer and
post-consumer sources.
Figure 2: Recycling by material source in 2014
2 009 2 010 2011 2 012 2 013 2014
Waste exported 5 575 9 054 9 758 14 744 18919 31 087
Total tons recycled 215 199 228 101 230 110 254 053 260 930 284 520
Recovery rate 17.2% 18.1% 18.5% 19.6% 20.0% 22.5%
0%
5%
10%
15%
20%
25%
30%
35%
0
50 000
100 000
150 000
200 000
250 000
300 000
350 000
Div
ersi
on
rat
e
Ton
nag
es r
ecyc
led
Ex-factory14%
Post-Industrial17%
Post Consumer
63%
Toll & In-house6%
Executive Summary
Plastics Recycling in SA – 2014 Page f
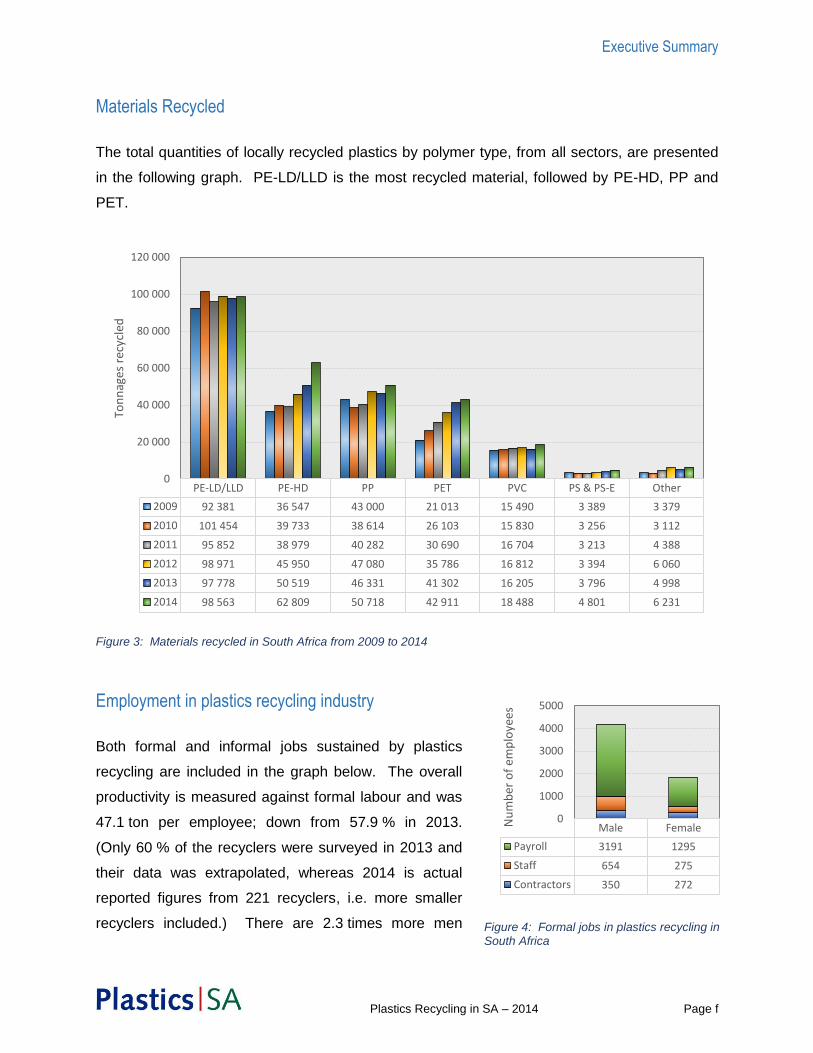
Materials Recycled
The total quantities of locally recycled plastics by polymer type, from all sectors, are presented
in the following graph. PE-LD/LLD is the most recycled material, followed by PE-HD, PP and
PET.
Figure 3: Materials recycled in South Africa from 2009 to 2014
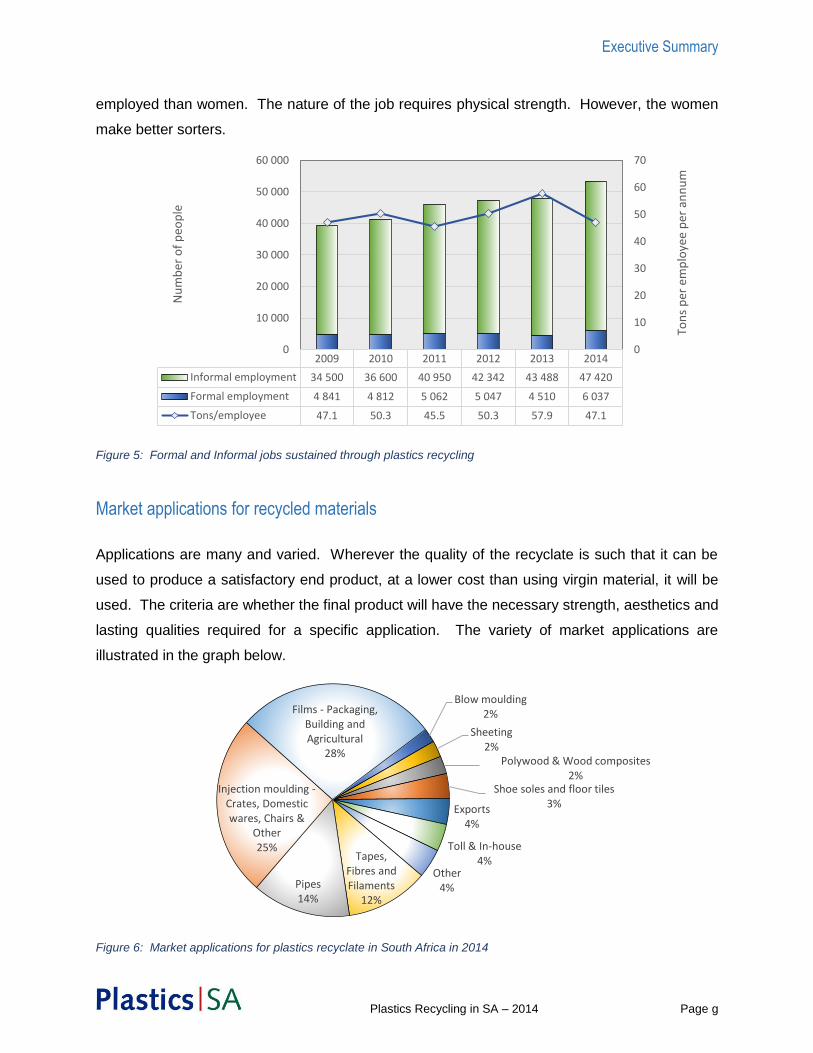
Employment in plastics recycling industry
Both formal and informal jobs sustained by plastics
recycling are included in the graph below. The overall
productivity is measured against formal labour and was
47.1 ton per employee; down from 57.9 % in 2013.
(Only 60 % of the recyclers were surveyed in 2013 and
their data was extrapolated, whereas 2014 is actual
reported figures from 221 recyclers, i.e. more smaller
recyclers included.) There are 2.3 times more men
PE-LD/LLD PE-HD PP PET PVC PS & PS-E Other
2009 92 381 36 547 43 000 21 013 15 490 3 389 3 379
2010 101 454 39 733 38 614 26 103 15 830 3 256 3 112
2011 95 852 38 979 40 282 30 690 16 704 3 213 4 388
2012 98 971 45 950 47 080 35 786 16 812 3 394 6 060
2013 97 778 50 519 46 331 41 302 16 205 3 796 4 998
2014 98 563 62 809 50 718 42 911 18 488 4 801 6 231
0
20 000
40 000
60 000
80 000
100 000
120 000
Ton
nag
es r
ecyc
led
Figure 4: Formal jobs in plastics recycling in South Africa
Male Female
Payroll 3191 1295
Staff 654 275
Contractors 350 272
0
1000
2000
3000
4000
5000
Nu
mb
er o
f em
plo
yees
Executive Summary
Plastics Recycling in SA – 2014 Page g
employed than women. The nature of the job requires physical strength. However, the women
make better sorters.
Figure 5: Formal and Informal jobs sustained through plastics recycling
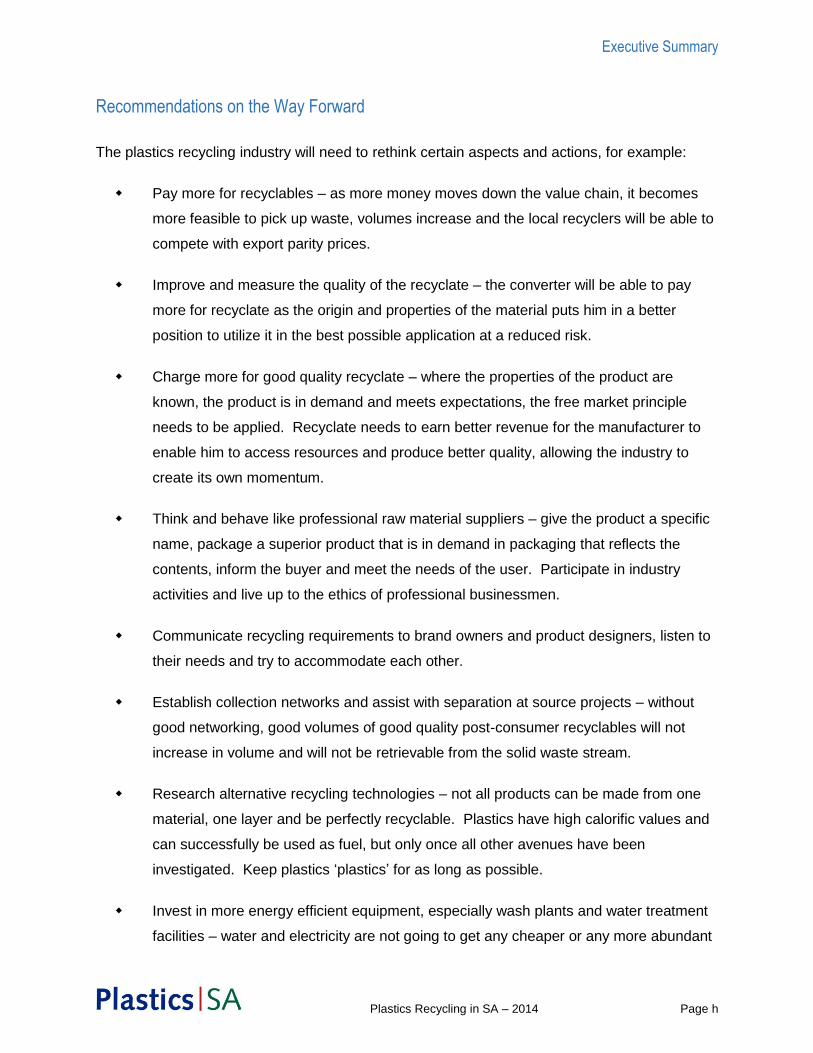
Market applications for recycled materials
Applications are many and varied. Wherever the quality of the recyclate is such that it can be
used to produce a satisfactory end product, at a lower cost than using virgin material, it will be
used. The criteria are whether the final product will have the necessary strength, aesthetics and
lasting qualities required for a specific application. The variety of market applications are
illustrated in the graph below.
Figure 6: Market applications for plastics recyclate in South Africa in 2014
2009 2010 2011 2012 2013 2014
Informal employment 34 500 36 600 40 950 42 342 43 488 47 420
Formal employment 4 841 4 812 5 062 5 047 4 510 6 037
Tons/employee 47.1 50.3 45.5 50.3 57.9 47.1
0
10
20
30
40
50
60
70
0
10 000
20 000
30 000
40 000
50 000
60 000
Ton
s p
er e
mp
loye
e p
er a
nn
um
Nu
mb
er o
f p
eop
le
Blow moulding2%
Sheeting2%
Polywood & Wood composites2%
Shoe soles and floor tiles3%Exports
4%
Toll & In-house4%
Other4%
Tapes, Fibres and Filaments
12%
Pipes14%
Injection moulding -Crates, Domestic wares, Chairs &
Other25%
Films - Packaging, Building and Agricultural
28%
Executive Summary
Plastics Recycling in SA – 2014 Page h
Recommendations on the Way Forward
The plastics recycling industry will need to rethink certain aspects and actions, for example:
Pay more for recyclables – as more money moves down the value chain, it becomes
more feasible to pick up waste, volumes increase and the local recyclers will be able to
compete with export parity prices.
Improve and measure the quality of the recyclate – the converter will be able to pay
more for recyclate as the origin and properties of the material puts him in a better
position to utilize it in the best possible application at a reduced risk.
Charge more for good quality recyclate – where the properties of the product are
known, the product is in demand and meets expectations, the free market principle
needs to be applied. Recyclate needs to earn better revenue for the manufacturer to
enable him to access resources and produce better quality, allowing the industry to
create its own momentum.
Think and behave like professional raw material suppliers – give the product a specific
name, package a superior product that is in demand in packaging that reflects the
contents, inform the buyer and meet the needs of the user. Participate in industry
activities and live up to the ethics of professional businessmen.
Communicate recycling requirements to brand owners and product designers, listen to
their needs and try to accommodate each other.
Establish collection networks and assist with separation at source projects – without
good networking, good volumes of good quality post-consumer recyclables will not
increase in volume and will not be retrievable from the solid waste stream.
Research alternative recycling technologies – not all products can be made from one
material, one layer and be perfectly recyclable. Plastics have high calorific values and
can successfully be used as fuel, but only once all other avenues have been
investigated. Keep plastics ‘plastics’ for as long as possible.
Invest in more energy efficient equipment, especially wash plants and water treatment
facilities – water and electricity are not going to get any cheaper or any more abundant
Executive Summary
Plastics Recycling in SA – 2014 Page i
and it is an essential component in the recycling process. Make the best of what is
available, measure the usage and act upon facts and figures.
Live the talk – BE the largest polymer supplier in Southern Africa.
The complete Plastics Recycling Survey report is available from Plastics|SA at
R500 per copy. Contact us on +27 11 314 4021 or via www.plasticsinfo.co.za