Embed Size (px)
Citation preview
75
Plasticity of myenteric neurons
N Saini and M Gupta
Department of Anatomy, Postgraduate Institute of Medical Education and Research, Chandigarh, India- 160012
Corresponding author: Madhur Gupta, Professor in anatomy, Gian sagar Medical college and hospital, Ramnagar, Banur 140401,Patiala, India, e-mail: [email protected]
ABSTRACTThe nervous system exerts a profound influence on all digestive processes. The wall of digestive system is
endowed with its own, local nervous system referred to as the enteric or intrinsic nervous system which is
responsible for the modulation of the rhythmic gastrointestinal peristaltic activities along with other functions.
The principal components of the enteric nervous system are two neuronal networks: myenteric and submucosal,
embedded in the wall of the digestive tract and extend from esophagus to anus. The musculature of different
parts of gastrointestinal tract is differently disposed to perform different functions. Thus the aim of present
study was to demonstrate the presence of neurons and to quantify the number of collections of neurons, number
of neurons in each collection and area of the neurons of the plexus. One cm piece from all the parts of GIT
containing entire wall was taken from the same region of 5 adult cadavers of postmortem cases which were
embalmed in the Department of Anatomy, Postgraduate Institute of Medical Sciences and Research, Chandigarh
and were processed for paraffin sectioning. 5 and 10µ thick serial sections were obtained and 6th and 7th slides
were stained with: Hematoxylin and Eosin and Marsland, Glees and Erikson’s silver stain. The slides were
photomicrographed using digital camera. The morphometrical analysis was done using Image Pro Express
software. Aggregations of 1-31 neurons present in myenteric network located between longitudinal and circular
muscle layers of the GIT whose size varied from 10.263-259.660µ m². They were oval or round; multipolar,
arranged in two rows and dispersed in groups in connective tissue of muscularis propria. The collections of
neurons were appeared to be more numerous in appendix and ileoceacal valve.
Keywords: autonomic ganglia, smooth muscle tunica, collection of neurons, size and number of neurons.
INTRODUCTIONThe enteric nervous system is a large and complex
neuronal network embedded in the wall of the gut.1 One
of the most developed ganglionated plexuses of the
gastrointestinal tract is the myenteric plexus (or
Auerbach’s plexus) located between the inner circular
layer and outer longitudinal layer of smooth muscle
tunica.2 The musculature of different regions of the
gastrointestinal tract is differently disposed and they
perform different functions.3 Hence morphometric and
quantitative assessment of neurons was carried out in
all the different parts of GIT by counting the number of
neurons, presence of neurons in each collection, area of
neuronal cell body to find out if the neuronal population
of these parts differ according to their functions.
MATERIAL AND METHODSOne cm piece from all the parts of GIT containing entire
wall was taken from the same region of 5 adult cadavers
of postmortem cases which were embalmed in the
Department of Anatomy, Postgraduate Institute of
Medical Sciences and Research, Chandigarh and were
processed for paraffin sectioning.4 Ten micrometer thick
serial sections were obtained and serial sections were
arranged in slides having three sections on each slide.
6th and 7th slides having three consecutive sections each
of 10µ thick were stained with: Hematoxylin and Eosin
and Marsland, Glees and Erikson’s silver stain. The 60
slides of each structure of GIT were photomicrographed
using digital camera. The morphometrical analysis was
done using Image Pro Express software. The number of
collections of neurons in entire circumference of each
section, presence of neurons in each collection and area
of neuronal cell bodies were tabulated and statistically
analyzed. The circumference of neuronal bodies was
marked with the help of curser and readings were
automatically stored in excel file by pro-image software.
The neurons were classified on the basis of their area
into small, medium and large. The neurons with areas
smaller than the mean minus its standard deviation were
considered small, those above the mean plus its standard
deviation were considered large, and those intermediate
to these values were considered medium neurons.2
RESULTSMyenteric plexus of gastrointestinal tract present
between inner circular and outer longitudinal layers of
muscular tunica contained 4.64±1.41 number of ganglia
ranging from 1-15 in entire circumference of 10 µ thick
section of GIT (Table-1). The neurons in ganglia were
Original Article Nepal Med Coll J 2008; 10(2): 75-80
76
multipolar and of various sizes and shapes with eccentric
nucleus scattered through out the organ.
In esophagus (Fig. 1), myenteric plexus contained small
ganglia with elongated or pear like neurons with an
eccentric nucleus and scattered throughout the organ.
2.72±1.75 collections were present in entire
circumference (Table-1) and each collection contained
1-15 numbers of neurons with an average of 7.71±3.41
(Table-2). Mean area was found to be 118.44±43.61 with
a range of 51.75-178.32 (Table-3).
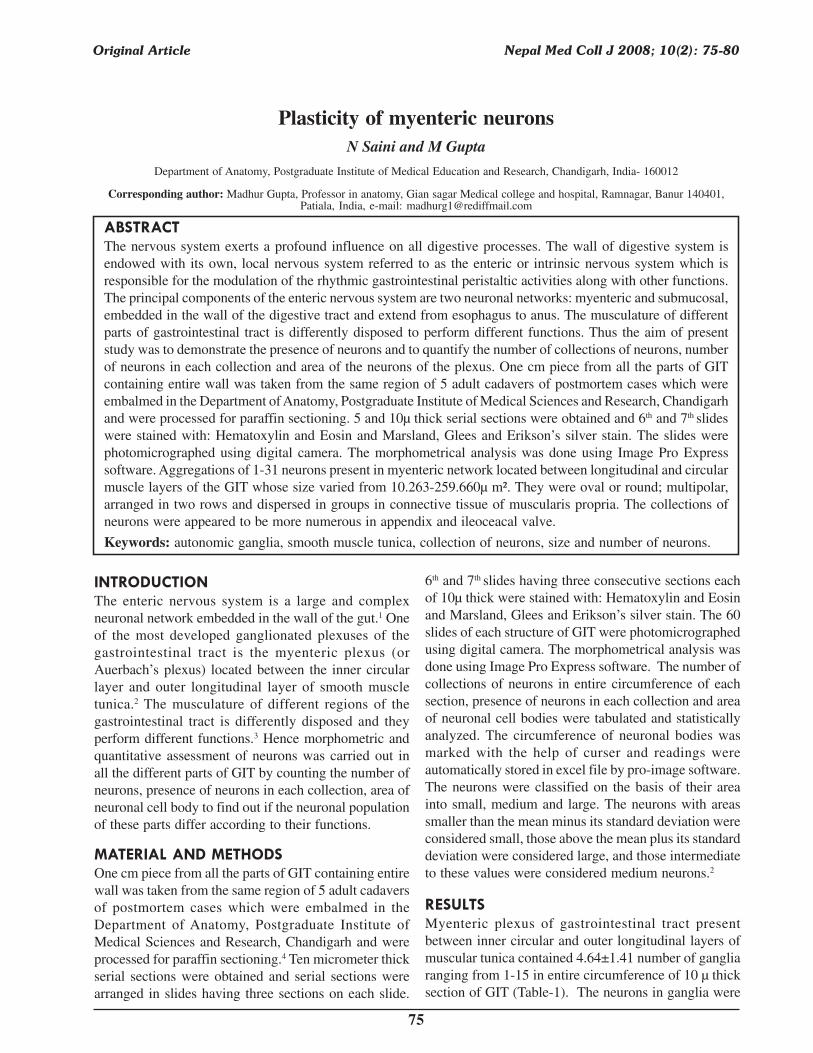
In fundus of stomach (Fig. 2), large elongated ganglia
having neurons packed in a characteristically tight
fashion in the connective tissue surrounded by satellite
cells were observed. 4.52±2.55 collections were present
in entire circumference (Table-1) and each collection
contained 1-31 numbers of neurons with an average of
5.270±5.684 (Table-2). Mean area was found to be
99.472±35.739 with a range of 10.263-254.994 (Table-3).
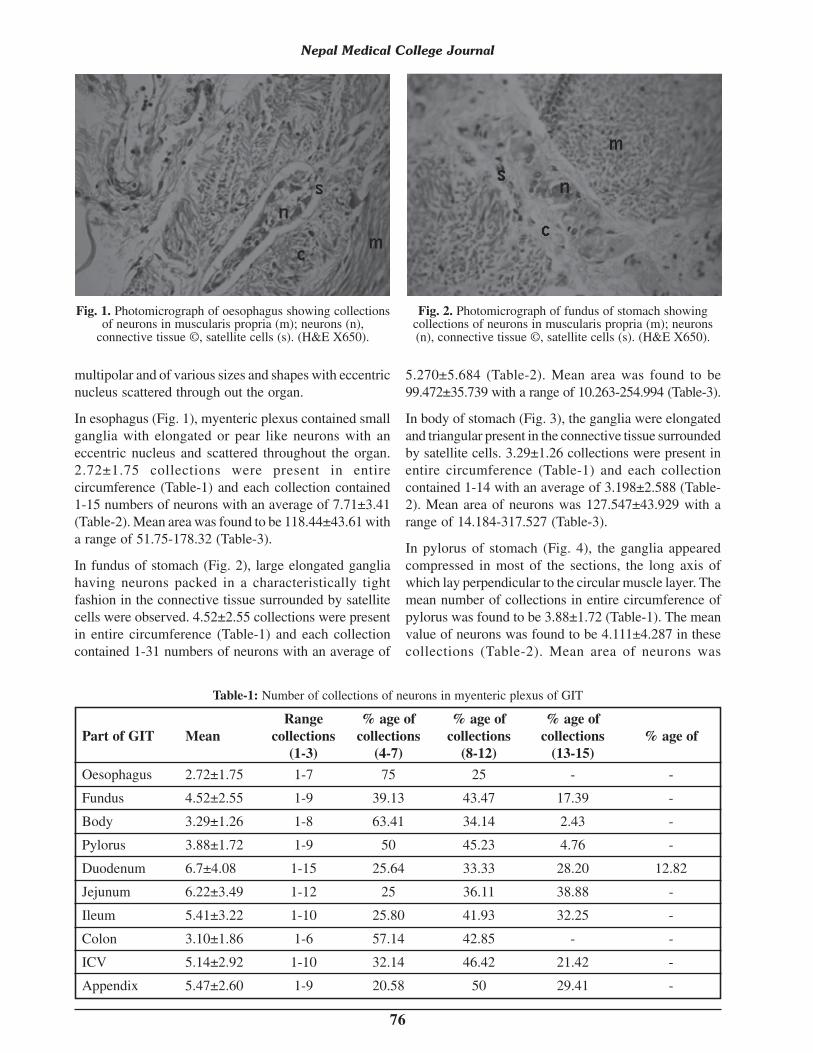
In body of stomach (Fig. 3), the ganglia were elongated
and triangular present in the connective tissue surrounded
by satellite cells. 3.29±1.26 collections were present in
entire circumference (Table-1) and each collection
contained 1-14 with an average of 3.198±2.588 (Table-
2). Mean area of neurons was 127.547±43.929 with a
range of 14.184-317.527 (Table-3).
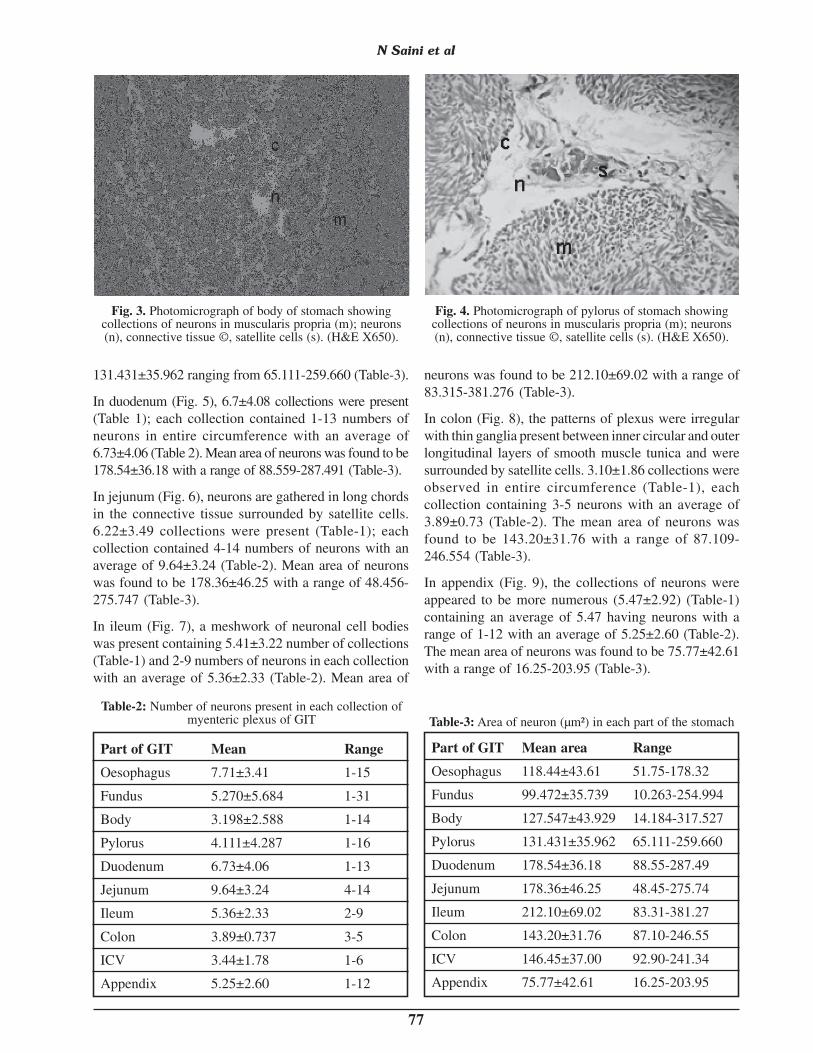
In pylorus of stomach (Fig. 4), the ganglia appeared
compressed in most of the sections, the long axis of
which lay perpendicular to the circular muscle layer. The
mean number of collections in entire circumference of
pylorus was found to be 3.88±1.72 (Table-1). The mean
value of neurons was found to be 4.111±4.287 in these
collections (Table-2). Mean area of neurons was
Nepal Medical College Journal
Fig. 1. Photomicrograph of oesophagus showing collectionsof neurons in muscularis propria (m); neurons (n),
connective tissue ©, satellite cells (s). (H&E X650).
Fig. 2. Photomicrograph of fundus of stomach showingcollections of neurons in muscularis propria (m); neurons(n), connective tissue ©, satellite cells (s). (H&E X650).
Range % age of % age of % age of
Part of GIT Mean collections collections collections collections % age of
(1-3) (4-7) (8-12) (13-15)
Oesophagus 2.72±1.75 1-7 75 25 - -
Fundus 4.52±2.55 1-9 39.13 43.47 17.39 -
Body 3.29±1.26 1-8 63.41 34.14 2.43 -
Pylorus 3.88±1.72 1-9 50 45.23 4.76 -
Duodenum 6.7±4.08 1-15 25.64 33.33 28.20 12.82
Jejunum 6.22±3.49 1-12 25 36.11 38.88 -
Ileum 5.41±3.22 1-10 25.80 41.93 32.25 -
Colon 3.10±1.86 1-6 57.14 42.85 - -
ICV 5.14±2.92 1-10 32.14 46.42 21.42 -
Appendix 5.47±2.60 1-9 20.58 50 29.41 -
Table-1: Number of collections of neurons in myenteric plexus of GIT
77
131.431±35.962 ranging from 65.111-259.660 (Table-3).
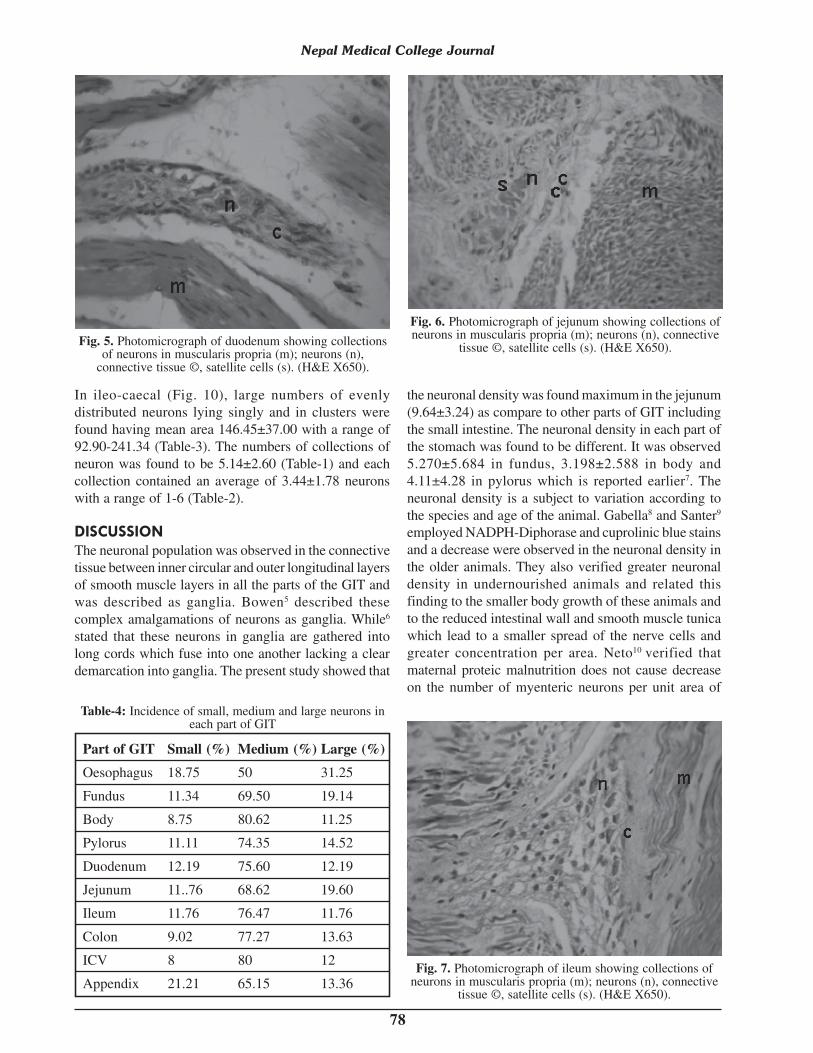
In duodenum (Fig. 5), 6.7±4.08 collections were present
(Table 1); each collection contained 1-13 numbers of
neurons in entire circumference with an average of
6.73±4.06 (Table 2). Mean area of neurons was found to be
178.54±36.18 with a range of 88.559-287.491 (Table-3).
In jejunum (Fig. 6), neurons are gathered in long chords
in the connective tissue surrounded by satellite cells.
6.22±3.49 collections were present (Table-1); each
collection contained 4-14 numbers of neurons with an
average of 9.64±3.24 (Table-2). Mean area of neurons
was found to be 178.36±46.25 with a range of 48.456-
275.747 (Table-3).
In ileum (Fig. 7), a meshwork of neuronal cell bodies
was present containing 5.41±3.22 number of collections
(Table-1) and 2-9 numbers of neurons in each collection
with an average of 5.36±2.33 (Table-2). Mean area of
neurons was found to be 212.10±69.02 with a range of
83.315-381.276 (Table-3).
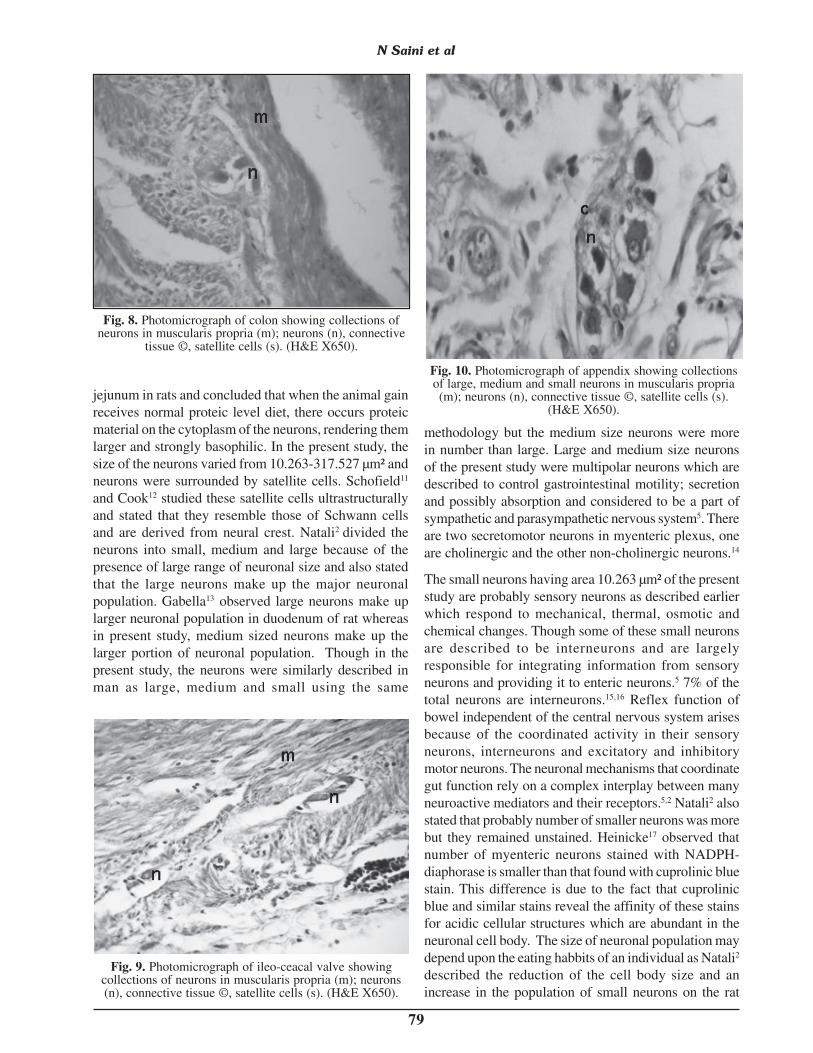
In colon (Fig. 8), the patterns of plexus were irregular
with thin ganglia present between inner circular and outer
longitudinal layers of smooth muscle tunica and were
surrounded by satellite cells. 3.10±1.86 collections were
observed in entire circumference (Table-1), each
collection containing 3-5 neurons with an average of
3.89±0.73 (Table-2). The mean area of neurons was
found to be 143.20±31.76 with a range of 87.109-
246.554 (Table-3).
In appendix (Fig. 9), the collections of neurons were
appeared to be more numerous (5.47±2.92) (Table-1)
containing an average of 5.47 having neurons with a
range of 1-12 with an average of 5.25±2.60 (Table-2).
The mean area of neurons was found to be 75.77±42.61
with a range of 16.25-203.95 (Table-3).
N Saini et al
Fig. 3. Photomicrograph of body of stomach showingcollections of neurons in muscularis propria (m); neurons(n), connective tissue ©, satellite cells (s). (H&E X650).
Fig. 4. Photomicrograph of pylorus of stomach showingcollections of neurons in muscularis propria (m); neurons(n), connective tissue ©, satellite cells (s). (H&E X650).
Part of GIT Mean Range
Oesophagus 7.71±3.41 1-15
Fundus 5.270±5.684 1-31
Body 3.198±2.588 1-14
Pylorus 4.111±4.287 1-16
Duodenum 6.73±4.06 1-13
Jejunum 9.64±3.24 4-14
Ileum 5.36±2.33 2-9
Colon 3.89±0.737 3-5
ICV 3.44±1.78 1-6
Appendix 5.25±2.60 1-12
Table-2: Number of neurons present in each collection ofmyenteric plexus of GIT
Part of GIT Mean area Range
Oesophagus 118.44±43.61 51.75-178.32
Fundus 99.472±35.739 10.263-254.994
Body 127.547±43.929 14.184-317.527
Pylorus 131.431±35.962 65.111-259.660
Duodenum 178.54±36.18 88.55-287.49
Jejunum 178.36±46.25 48.45-275.74
Ileum 212.10±69.02 83.31-381.27
Colon 143.20±31.76 87.10-246.55
ICV 146.45±37.00 92.90-241.34
Appendix 75.77±42.61 16.25-203.95
Table-3: Area of neuron (µm²) in each part of the stomach
78
In ileo-caecal (Fig. 10), large numbers of evenly
distributed neurons lying singly and in clusters were
found having mean area 146.45±37.00 with a range of
92.90-241.34 (Table-3). The numbers of collections of
neuron was found to be 5.14±2.60 (Table-1) and each
collection contained an average of 3.44±1.78 neurons
with a range of 1-6 (Table-2).
DISCUSSIONThe neuronal population was observed in the connective
tissue between inner circular and outer longitudinal layers
of smooth muscle layers in all the parts of the GIT and
was described as ganglia. Bowen5 described these
complex amalgamations of neurons as ganglia. While6
stated that these neurons in ganglia are gathered into
long cords which fuse into one another lacking a clear
demarcation into ganglia. The present study showed that
Fig. 6. Photomicrograph of jejunum showing collections ofneurons in muscularis propria (m); neurons (n), connective
tissue ©, satellite cells (s). (H&E X650).
Fig. 7. Photomicrograph of ileum showing collections ofneurons in muscularis propria (m); neurons (n), connective
tissue ©, satellite cells (s). (H&E X650).
the neuronal density was found maximum in the jejunum
(9.64±3.24) as compare to other parts of GIT including
the small intestine. The neuronal density in each part of
the stomach was found to be different. It was observed
5.270±5.684 in fundus, 3.198±2.588 in body and
4.11±4.28 in pylorus which is reported earlier7. The
neuronal density is a subject to variation according to
the species and age of the animal. Gabella8 and Santer9
employed NADPH-Diphorase and cuprolinic blue stains
and a decrease were observed in the neuronal density in
the older animals. They also verified greater neuronal
density in undernourished animals and related this
finding to the smaller body growth of these animals and
to the reduced intestinal wall and smooth muscle tunica
which lead to a smaller spread of the nerve cells and
greater concentration per area. Neto10 verified that
maternal proteic malnutrition does not cause decrease
on the number of myenteric neurons per unit area of
Nepal Medical College Journal
Part of GIT Small (%) Medium (%) Large (%)
Oesophagus 18.75 50 31.25
Fundus 11.34 69.50 19.14
Body 8.75 80.62 11.25
Pylorus 11.11 74.35 14.52
Duodenum 12.19 75.60 12.19
Jejunum 11..76 68.62 19.60
Ileum 11.76 76.47 11.76
Colon 9.02 77.27 13.63
ICV 8 80 12
Appendix 21.21 65.15 13.36
Table-4: Incidence of small, medium and large neurons ineach part of GIT
Fig. 5. Photomicrograph of duodenum showing collectionsof neurons in muscularis propria (m); neurons (n),
connective tissue ©, satellite cells (s). (H&E X650).
79
jejunum in rats and concluded that when the animal gain
receives normal proteic level diet, there occurs proteic
material on the cytoplasm of the neurons, rendering them
larger and strongly basophilic. In the present study, the
size of the neurons varied from 10.263-317.527 µm² and
neurons were surrounded by satellite cells. Schofield11
and Cook12 studied these satellite cells ultrastructurally
and stated that they resemble those of Schwann cells
and are derived from neural crest. Natali2 divided the
neurons into small, medium and large because of the
presence of large range of neuronal size and also stated
that the large neurons make up the major neuronal
population. Gabella13 observed large neurons make up
larger neuronal population in duodenum of rat whereas
in present study, medium sized neurons make up the
larger portion of neuronal population. Though in the
present study, the neurons were similarly described in
man as large, medium and small using the same
methodology but the medium size neurons were more
in number than large. Large and medium size neurons
of the present study were multipolar neurons which are
described to control gastrointestinal motility; secretion
and possibly absorption and considered to be a part of
sympathetic and parasympathetic nervous system5. There
are two secretomotor neurons in myenteric plexus, one
are cholinergic and the other non-cholinergic neurons.14
The small neurons having area 10.263 µm² of the present
study are probably sensory neurons as described earlier
which respond to mechanical, thermal, osmotic and
chemical changes. Though some of these small neurons
are described to be interneurons and are largely
responsible for integrating information from sensory
neurons and providing it to enteric neurons.5 7% of the
total neurons are interneurons.15,16 Reflex function of
bowel independent of the central nervous system arises
because of the coordinated activity in their sensory
neurons, interneurons and excitatory and inhibitory
motor neurons. The neuronal mechanisms that coordinate
gut function rely on a complex interplay between many
neuroactive mediators and their receptors.5,2 Natali2 also
stated that probably number of smaller neurons was more
but they remained unstained. Heinicke17 observed that
number of myenteric neurons stained with NADPH-
diaphorase is smaller than that found with cuprolinic blue
stain. This difference is due to the fact that cuprolinic
blue and similar stains reveal the affinity of these stains
for acidic cellular structures which are abundant in the
neuronal cell body. The size of neuronal population may
depend upon the eating habbits of an individual as Natali2
described the reduction of the cell body size and an
increase in the population of small neurons on the rat
Fig. 9. Photomicrograph of ileo-ceacal valve showingcollections of neurons in muscularis propria (m); neurons(n), connective tissue ©, satellite cells (s). (H&E X650).
Fig. 10. Photomicrograph of appendix showing collectionsof large, medium and small neurons in muscularis propria(m); neurons (n), connective tissue ©, satellite cells (s).
(H&E X650).
N Saini et al
Fig. 8. Photomicrograph of colon showing collections ofneurons in muscularis propria (m); neurons (n), connective
tissue ©, satellite cells (s). (H&E X650).
80
subjected to hypoproteic chow. Cellular hypertrophy,
including in neurons, can be considered as a basic
response mechanism in instances where the cells are
under aggression, such as decrease of nutrient supply or
of necessary stimuli for their functioning. As a result the
cells get adapted, with decreased metabolism, leading
to a decrease in the turnover of their own structures and
then to a reduction in their volume.18 Kaur19 stated that
the lip of the ileocaecal valve has a well developed
muscularis propria and a proportionate complement of
nerve elements which are in accord with a predominantly
afferent function in the lip of the valve.
The variation in the neuronal population between
different parts of GIT may be probably due to different
functions of its each part. The data of the present study
elicited us to carry out an experimental study to
contribute to the knowledge concerning the effect caused
by any adverse condition on the myenteric plexus such
as malnutrition and poisonous conditions etc.
REFERENCES1. Karaosmanoglu T, Aygun B, Wade PR, Gershon MD. Regional
difference in the number of neurons in the myenteric plexus ofthe Guinea Pig small intestine and colon: An evaluation ofmarkers used to count neurons. Anat Record 1996; 244: 470-80.
2. Natali MMR, Neto M, Orsi M. Morphometry andquantification of the myenteric neurons of the duodenum ofadult rat fed with hypoproteic chow. Int’l J Morphol 2003;21: 273-7.
3. Bannister LH, Berry MM, Collins P, Dyson M, Dussek JE,Ferguson MWJ. Alimentary System. In: Gray’s Anatomy. 38th
Ed. Edinburg: Churchill Livingston 1995: 1775.
4. Machado EMM, Junior DJC, Pinheiro SW et al. Morphometryof submucous and myenteric esophagic plexus of dogsexperimentally reinfected with Trypanosoma Cruzi. Mem InstOswaldo Cruz, Rio de Janeiro 2001; 96: 545-8.
5. Bowen R. The Enteric Nervous System. In: Oesophagus
Anatomy and Development: GI Motility Online 2006.
6. Maifrino LBM, Prates JC, De-Souza RR, Liberti EA.Morphometry and acetylcholinesterase activity of themyenteric plexus of the wild mouse Calomys Callosus.Brazilian J Med Biol Res 1997; 30: 627-32.
7. Saini N, Gupta M. Morphometry of myenteric neurons instomach. Nepal Med Coll J 2007; 9: 96-9.
8. Gabella G. Fall in the number of myenteric neurons in agingguine a pig. Gastroenterol 1989; 96: 1487-93.
9. Santer, RM. Survival of the population of NADPH-Diphorasestained myenteric neurons in the small intestine of aged rats.J Auton Nerv Syst 1994; 49: 115-21.
10. Neto MHDM, Molinari SL, Stabille SR, Sant’ana DDMG, NataliMRM. Morphologic and quantitative study of the myentericneurons of the jejunum of malnourished rats (Rattus Norvegicus).Arq Neuropsiquiatr 1999; 57B: 387-91.
11. Schofield GC. Handbook of Physiology. 4th ed. (Code, GF);Williams and wilkins Baltimore 1968: 1579-627.
12. Cook RD, Burnstock G. J. Neurocytol 1976; 5: 195-206.Pubmed; ISI: ChemPort.
13. Gabella G. Neuron size and number in the myenteric plexusof the newborn and adult rat. J Anat 1971; 109: 81-94.
14. Costa M, Brookes SJH, Henning GW. Anatomy andphysiology of the enteric nervous system. Gut 2000; (Suppl4th) 47: IV 15-9.
15. Costa M, Brookes SJH, Steele PA et al. Neurochemicalclassification of myenteric neurons in the Guinea-Pig ileum.Neuroscience 1996; 75: 949-67.
16. Song ZM, Brookes SJH, Costa M. Projection of specificmorphological types of neurons within the myenteric plexusof the small intestine in the guinea-pig. Cell Tissue Res 1996;285: 149-56.
17. Heinicke EA, Kiernan JA, Wijsman J. Specific, selective andcomplete staining of the neurons of the myenteric plexus usingcuprolinic blue. J Neurosci Methods 1987; 21: 45-54.
18. Bogliolo, Patalogia L. 3rd ed. Rio de janeiro, GuanabaraKoogan 1981: 1236.
19. Kaur U, Goyal N, Gupta M. Disposition of muscularis propriaand nerve elements in the lip of the ileocaecal valve. NepalMed Coll J 2005; 7: 125-8.
Nepal Medical College Journal